Learning Tradeoffs In Organizations: Measuring Multiple ...
36
05-047 Copyright © 2006 by Francesca Gino, Richard M. J. Bohmer, Amy C. Edmondson, Gary P. Pisano, Ann B. Winslow Working papers are in draft form. This working paper is distributed for purposes of comment and discussion only. It may not be reproduced without permission of the copyright holder. Copies of working papers are available from the author. Learning Tradeoffs In Organizations: Measuring Multiple Dimensions Of Improvement To Investigate Learning-Curve Heterogeneity Francesca Gino, Richard M. J. Bohmer, Amy C. Edmondson, Gary P. Pisano, Ann B. Winslow
Transcript of Learning Tradeoffs In Organizations: Measuring Multiple ...

05-047
Copyright © 2006 by Francesca Gino, Richard M. J. Bohmer, Amy C. Edmondson, Gary P. Pisano, Ann B. Winslow
Working papers are in draft form. This working paper is distributed for purposes of comment and discussion only. It may not be reproduced without permission of the copyright holder. Copies of working papers are available from the author.
Learning Tradeoffs In Organizations: Measuring Multiple Dimensions Of Improvement To Investigate Learning-Curve Heterogeneity
Francesca Gino, Richard M. J. Bohmer, Amy C. Edmondson, Gary P. Pisano, Ann B. Winslow

1
LEARNING TRADEOFFS IN ORGANIZATIONS:
MEASURING MULTIPLE DIMENSIONS OF IMPROVEMENT TO INVESTIGATE
LEARNING-CURVE HETEROGENEITY
FRANCESCA GINO Morgan 412
Harvard Business School Boston MA 02163 Tel: 617-495-6788
e-mail: [email protected]
RICHARD M. J. BOHMER Morgan 493
Harvard Business School Boston MA 02163 Tel: 617-495-6660
e-mail: [email protected]
AMY C. EDMONDSON Morgan 439
Harvard Business School Boston MA 02163 Tel: 617-495-6732
e-mail: [email protected]
GARY P. PISANO Morgan 417
Harvard Business School Boston MA 02163 Tel: 617-495-6562
e-mail: [email protected]
ANN B. WINSLOW Sherman Hall
Harvard Business School Boston MA 02163 Tel: 617-496-6307
e-mail: [email protected]

2
LEARNING TRADEOFFS IN ORGANIZATIONS:
MEASURING MULTIPLE DIMENSIONS OF IMPROVEMENT TO INVESTIGATE
LEARNING-CURVE HETEROGENEITY
Learning-curve research has found that rates of learning can vary across similar settings, such that
cumulative experience is a necessary but insufficient predictor of learning-curve slope. One explanation
for this finding is that how the learning process is managed affects rates of learning. We investigate an
additional possibility. At any point in time, organizations can learn along multiple, potentially competing,
performance dimensions. In particular, we suggest that organizations adopting a new technology or
practice can “learn” on more than one dimension at the same time, such that more than one meaningful
learning curve may exist for the same learning challenge. Thus, by arguing that effort invested in
learning on one dimension may inhibit learning on another dimension, we propose a new explanation of
learning-curve heterogeneity across organizations. Using a sample of sixteen academic and community
hospitals adopting a new surgical technology, we demonstrate a tradeoff in organizational rates of
learning on two dimensions: improving proficiency in an existing application use of the technology
(efficiency) and applying the technology to novel and more challenging uses (application innovation).
Our results provide support for our proposed explanation of learning-curve heterogeneity and suggest the
salience of both rate and direction (i.e., dimension) in learning. We also find that the goal orientation of
the organization influences the direction of learning (efficiency vs. application innovation).
3
INTRODUCTION
Since the landmark finding of a relationship between experience and performance improvement
in aircraft manufacturing (Wright, 1936), a large body of literature has explored the concept of the
“learning curve.” Learning-curve research has demonstrated that performance improves as a result of
increased experience with a new technology, routine, and/or process. Remarkably robust, the experience
effect has been reproduced in multiple business contexts, including both manufacturing and service
settings. For example, learning curves have been found in nuclear power plants (Joskow & Rozanski,
1979), chemical processing (Lieberman, 1984), ship manufacturing (Rapping, 1965), truck production
(Argote & Epple, 1990), cardiac surgery (Kelsey et al., 1984), and semiconductor manufacturing(Hatch &
Mowery, 1998). Research in this area has found heterogeneity in learning curves across similar sites
(Darr et al., 1995; Hatch & Mowery, 1998; Pisano et al., 2001; Edmondson et al., 2003), leading
researchers to conclude that how experience is managed affects the rate of learning.
Several studies have investigated potential explanations for such variation in learning rates (Adler
& Clark, 1991; Argote, 1999; Haunschild & Sullivan, 2002; Ittner et al., 2001; Lapre & Van Wassenove,
2001; Lieberman, 1987). Researchers have identified various factors explaining learning-rate
heterogeneity, including properties of the knowledge being acquired, such as tacitness (Edmondson et al.,
2003), stickiness (von Hippel, 1994), causal ambiguity (Szulanski, 1996), and other aspects at the team
level, such as stability of team membership and quality of communication among team members
(Edmondson et al., 2001).
Typically, prior work on learning curves has emphasized the comparison of learning rates among
either organizational units or firms on a single dimension and a search for the underlying managerial
causes of observed differences. In particular, most previous learning-curve studies have focused on
improvements in efficiency, measured as a reduction over time in variables such as manufacturing costs
or production time.

4
This paper extends prior research by examining learning rates in technology adoption across
similar organizations on multiple, potentially competing, dimensions. In particular, we suggest that
organizations adopting a new technology or practice can “learn” on more than one dimension at the same
time, such that more than one meaningful learning curve may exist for the same challenge. For example, a
manufacturing plant could focus on reducing costs or on increasing flexibility. From this perspective, a
plant that focuses on reducing its manufacturing costs is not necessarily a better or worse learner than one
that focuses on increasing its flexibility. If we were to measure the impact of cumulative experience only
on costs, the first plant would appear to be a faster learner than the second, and vice versa.
In the case of new technology adoption, organizations often face two main learning hurdles:
improving proficiency in the technology for a given application—what we refer to as efficiency—and
trying out increasingly difficult or challenging applications for which the technology is appropriate—what
we call application innovation. The former, using a new technology better or performing a task more
efficiently with cumulative experience, is the common focus of the learning curve literature. An
alternative to this dimension of learning is using the technology differently, either by modifying it or
making use of it in a different way or in a different context from that which was originally intended by the
manufacturer (as in the case of, for example, user innovations [von Hippel, 1988; 2005]).
Our suggested multi-dimensional perspective on learning invites analysis of not only difference in
rates of learning across organizations, but also differences in the direction (i.e., dimension) of learning.1
The existence of multiple dimensions of learning introduces another potential explanation for the
observed heterogeneity in learning rates. If organizations can learn on more than one dimension, then
what looks like “slow learning” on one dimension may be caused by effort invested instead in learning on
another, unmeasured, dimension. Organizations may thus face a tradeoff in learning, as choosing to learn
on one dimension may make it harder to simultaneously learn on another. A cross-sectional comparison
of learning rates on a single dimension, which is the common approach used in learning curve studies,
1 In this paper, we use the terms direction and dimension of learning interchangeably.

5
would not detect such a tradeoff. Differences in the direction of learning may explain observed
differences in rates of learning.
We further explore the organizational attributes that may influence differences in the direction of
learning. Two bodies of literature bear on this question. One is the strategy literature suggesting that
product market positioning should influence investments in intangible assets, skills, and capabilities
(Dierickx & Cool, 1989; Teece et al., 1997; Porter, 1991). A second body of work, rooted in psychology,
argues that an individual’s goal orientation, or the nature of the goals that an individual implicitly pursues
(Dweck, 1986; Elliott & Dweck, 1988), is a robust predictor of behavior and performance in learning and
achievement tasks. Given that a goal orientation may be prompted by situational factors (Button et al.,
1996), an organization might implicitly or explicitly use situational cues to signal the goals and behaviors
that are desired or rewarded to its members (Ames, 1992) and thus influence members’ perceptions of the
organization’s learning climate and goal orientation (Ames & Archer, 1988; Button et al., 1996).
We empirically investigate learning tradeoffs with data on hospitals adopting a particular new
technology for cardiac surgery, referred to here as Minimally Invasive Cardiac Surgery, or MICS. Using
data on all 679 patients who underwent operations in 16 hospitals that were learning to use the technology
between 1996 and 1998, we analyzed whether hospitals exhibited learning on two distinct dimensions.
One dimension of improvement was to reduce the time required to complete the procedure, a vital
measure of efficiency in surgery. The second dimension for improvement was to use the procedure for
more difficult operative cases or patient conditions, an important form of application innovation in
healthcare delivery. We estimated learning curves for hospitals along both of these dimensions of
performance improvement. We then analyzed whether different improvement strategies had a different
impact on performance and whether these differences were associated with broader institutional goals.
This paper extends the current understanding of learning curves in two main ways. First, it
expands beyond the study of efficiency to include a new dimension, application innovation, and
investigates the potential tradeoff between the two dimensions on learning outcomes. Second, this study

6
explores what influences such a tradeoff to occur by examining the link between organization type and
learning orientation. Our findings suggest that organizations should explicitly determine which dimension
is of greatest strategic importance to them so as to enable initial focus and potential competitive
advantage.
THEORETICAL BACKGROUND AND HYPOTHESES
The tradeoff between two competing learning dimensions
Research on organizational learning has distinguished between learning processes that refine and
improve current capabilities and learning processes that discover and develop new capabilities because
they will likely have an impact on performance. Labeling the former “exploitation” and the latter
“exploration,” March (1991) suggested that sustained performance results from the ability of an
organization to balance the two. Although it is possible for a firm to be “ambidextrous” and excel at both
(Tushman & O'Reilly III, 1996), exploitation and exploration are often competing strategies, as the
resources of time and focus are limited and decisions about what to learn may impact each other. In fact,
exploitation strategies tend to limit the amount of firm exploration; similarly, exploration strategies tend
to limit the amount of firm exploitation (March, 1991). Also, the two strategies often compete for limited
resources within the firm and are associated with opposite organizational structures and cultures. As such,
companies that pursue both strategies are viewed as lacking focus and internal fit (Miller & Friesen,
1986).
In essence, organizational research has observed several tensions in firms trying to engage in high
levels of both exploitation and exploration. We propose that an analogous tension is faced by
organizations that learn in the wake of new technology adoption. Specifically, technology adoption poses
two learning challenges. The first is what we call “application innovation,” or the expansion of the use of
a technology beyond its initial applications. When a technology is new, it is often not clear ex ante to
which applications it is best suited. A key aspect of innovation is experimenting with and exploring

7
alternative and more challenging applications for the technology (e.g., von Hippel, 1988; 2005).
Application innovation plays a critical role in the diffusion of technology and it is one of the two learning
dimensions we refer to in our study.
A second learning challenge of technology adoption is to become proficient in the use of the
technology for a given application. This often means becoming more efficient (e.g., lower costs,
increased speed) or achieving more consistent outcomes. This second learning challenge has been the
focus of the extensive learning-curve literature cited earlier and it is the second dimension of learning we
investigate in this paper.
Both dimensions of learning—finding more difficult applications and improving efficiency—can
potentially benefit from cumulative experience. The empirical and causal link between efficiency or
proficiency and experience has been well documented (see, for instance, Adler & Clark, 1991). However,
the search for new applications for a technology can also benefit from experience, as this process also
consists of trial and error. Limited resources and pre-existing organizational cultures and routines are
likely to constrain multiple options for learning; thus, for any particular organization, the rate of learning
on one dimension is likely to differ from that on another dimension.
We can think of an organization as “consuming” its cumulative experience of a new technology
in one of two ways: it can deepen its proficiency in a given application of the technology, or it can expand
its ability to use the technology in different applications. Because limited resources and pre-existing
organizational cultures and routines are likely to constrain multiple options for learning, for any particular
organization, the rate of learning on one dimension is unlikely to be the same as the rate of learning on
another dimension.2 Drawing from the work cited above, we expect there to be a tradeoff between the
rates of learning along these two dimensions. Specifically:
2 The presence of multiple dimension of learning at the organizational level would extend the results on learning tradeoffs demonstrated at the individual level. Research in psychology has found that, in individual learning, people tend to trade speed for accuracy, or vice versa; the more rapidly an individual performs a skill, the less accurate it becomes (see, for example, MacKay, 1982). This well-established finding in the psychology literature is known as the speed–accuracy tradeoff (Fitts, 1954; Woodworth, 1899).

8
Hypothesis 1: The speed of learning on the efficiency dimension will be inversely related to the
speed of learning on the application innovation.
Several factors might determine the dimension on which an organization learns. First, the
observed direction of learning might be the result of a deliberate strategic choice when the capability
being learned is central to the firm’s competitive advantage (Argote & Ingram, 2000; Teece & Pisano,
1994). Hence, firms competing on the basis of differentiation would choose to learn along dimensions
that promote (application) innovation, whereas firms competing on price would choose dimensions of
efficiency. Second, resource constraints might determine the direction of learning. Attention to one
dimension of improvement may reduce the time and resources available to improve on another
dimension; because employee effort is finite, improvement in one area may come at the expense of
improvement in another area. Third, learning may be path dependent. An organization’s prior
experience, culture, and existing routines may predispose it to focus on one kind of performance
improvement, such as efficiency, rather than another, such as cost (Tripsas & Gavetti, 2000). Those
already competing on the basis of application innovation might be more likely to improve on this
dimension than would those competing on cost, and vice versa. Finally, the observed direction of learning
might depend on the organization’s goal orientation. We explore this possibility next.
The impact of learning orientation on learning outcomes
Research in psychology has identified two distinct behavior patterns that individuals use in
achievement situations, namely mastery (or learning) goal orientation and performance goal orientation
(Dweck & Leggett, 1988; Ames & Archer, 1988). Individuals who are learning goal oriented are willing
to work hard to “master” a skill or concept. They tend to persist in the face of difficulty, and they
generally take risks and try new things they don’t already know how to do. On the other hand, individuals
who are performance goal oriented work toward the goal of appearing competent or at least avoiding
appearing incompetent. As a result, they are less likely to persist if they make an error or have to put forth

9
a lot of effort. They prefer to perform tasks that they know they can do; they’re not willing to take risks,
and they want to do better than everyone else (Dweck & Leggett, 1988; Ames & Archer, 1988).
Prior studies have also found that the type of goal toward which a person is working greatly
influences how they pursue the goal, as well as how much they learn and how well they perform on the
learning task (see, for instance, Kaplan, Middleton, Urdan, & Midgley, 2002). Thus, at the individual
level, goal orientation influences learning processes and outcomes.
Although the research on goal orientation has been conducted mostly on individuals in
experimental settings, the results might be generalizable to organizational settings. An organization may
use situational cues to influence its members’ perception of the learning climate’s emphasis on learning
versus performance goals (Ames & Archer, 1988). As occurs at the individual level, an organization’s
different emphasis in goal orientation may result in different learning outcomes and, specifically, may
affect the speed of learning on various dimensions. In particular, because the emphasis of mastery goal
orientation is on development of skills, knowledge, and competence (Bunderson & Sutcliffe, 2003),
mastery-goal-oriented organizations might be more concerned with application innovation than with
efficiency. On the contrary, because the emphasis of performance goal orientation is on demonstrating
competence and avoiding failure (Bunderson & Sutcliffe, 2003), performance-goal-oriented organizations
might give priority to efficiency. This reasoning led to the following hypothesis:
Hypothesis 2: The speed of learning on the efficiency dimension versus the application-
innovation dimension will be related to the organization’s goal orientation.
RESEARCH DESIGN
Context: Medical technology
Since the first antibiotics were introduced more than a hundred years ago, the development and
dissemination of new technologies has been of central concern in the field of healthcare. Within an
overall context of steady improvement in treatment options for patients, healthcare managers confront a

10
tension between 1) focusing on streamlining existing technologies and practices to enable treatment of
increasing numbers of patients more efficiently (e.g., O'Connor et al., 1996) and 2) applying resources
toward developing innovative approaches to treat previously untreatable patients (e.g., Barnard, 1967;
Druker et al., 2001). Indeed, society expects the healthcare sector simultaneously to develop innovative
technologies and make them widely available (Wilensky, 1990).
Although some medical technologies, by design, can only be used in one way or for one task,
others may be used in many different ways to accomplish many different goals. The same drug may be
used to treat multiple conditions and the same device for several procedures. Moreover, the full range of
a medical technology’s use may not be fully specified at the time of its release to market. A medical
technology innovator may not have fully characterized all of the possible ways in which a technology can
be used before taking it to market,3 leaving it to expert clinicians not only to learn through experience
how to use the technology for its specified use (faster, better, cheaper), but also to learn the range of uses
to which the technology might be put—to explore the boundaries of its technological potential.
Minimally Invasive Cardiac Surgery. In this study, we used the adoption of Minimally Invasive
Cardiac Surgery (MICS) technology to investigate separate dimensions of learning among cardiac surgery
units. This technology was developed by a private company and received FDA approval in 1996.
Hospitals adopting MICS faced a substantial learning challenge. First, initial procedures took much
longer than the conventional approach. Longer operations not only put patients at greater risk, but also
are extremely costly for hospitals, as cardiac operating rooms are an expensive resource and are generally
capacity constrained. Second, initial procedures were limited to a small subset of cardiac patients:
relatively healthy patients and those requiring simple cardiac procedures on the front of the heart
(Galloway et al., 1999). Widening the population of patients for whom this procedure could be used
could affect the hospital’s ability to gain a competitive advantage from it. In essence, while the first form
3 In the pharmaceutical industry, the huge costs associated with clinical trials and FDA approval provide an incentive for firms to be highly selective in their choice of indications. Practicing physicians are not, however, restricted to only using a drug for those uses approved by the FDA.

11
of learning was measured by rates of efficiency improvement, the second was captured by the possibility
of expanding the range of patients to whom MICS techniques could be applied.
As a research context for investigating multiple dimensions of learning, MICS offered several
advantages. First, as noted above, the technique was a dramatic departure from conventional surgery and
required substantial learning. It required significant changes in the roles and tasks of individual operating
room team members and in their working relationships. Initially, these changes required longer procedure
times, as noted above. Whether and how to use the technology for very difficult patient cases represented
another substantial opportunity for learning. Second, MICS was a recent innovation, thereby allowing
data collection from the original adopting surgeons and operating room teams. Third, all cardiac surgery
operating room teams employ similar technology and surgical routines, minimizing a priori differences
that might affect ease of learning. Finally, the company that developed and marketed the equipment for
MICS established a database of detailed patient-level data—including measures of efficiency, patient
severity of illness, and complexity of the surgical procedure undertaken—for all MICS cases performed at
adopting hospitals.4 These data were conducive to analyzing hospital-specific learning curves.
The MICS procedure. A conventional cardiac surgical procedure comprises three phases: (1)
cutting open the chest and splitting the breastbone, then connecting the patient to a heart-lung bypass
machine, and clamping the aorta to prevent blood from flowing backwards into the heart while the
surgeon operates, (2) stitching to repair diseased components, and (3) restarting the heart and weaning the
patient from the bypass machine, then closing the chest. MICS changed this process in two important
ways. First, under MICS, the breastbone is not split. The surgeon instead gains access to the heart
through a small incision between the ribs, and therefore lacks the same level of access to the heart and the
same level of visual and tactile information about the state of the heart available in a conventional
procedure. Second, instead of an external clamp, a small catheter with a balloon at its tip is fed into the
aorta to stop the blood flow. Although the surgeon directs the positioning of the balloon clamp,
4 This patient registry was maintained by an independent contract research organization; details that could identify patients (name, date of birth, social security number) were removed.

12
monitoring its stability requires coordinated action from an anesthesiologist and a perfusionist (the
technician who runs the heart-lung bypass machine). When the technology was first being used, these
changes, physical constraints, and extra tasks led to very long MICS procedures, lasting four to twelve
hours, compared to the two to six hours characterizing a conventional procedure.
Dimensions of learning in MICS technology adoption
Hospitals and surgeons have powerful incentives, both medical and financial, to reduce cardiac
surgical procedure times. Long operations are associated with an increased risk of postoperative
complications, particularly strokes (Ricotta, Faggioli, Castilone, & Hassett, 1995). Furthermore, neither
hospitals nor surgeons receive additional compensation for longer time spent in the operating room, and,
in this setting, MICS operations reduced the number of cases that could be done in a single operating
room from three to two per day.
At the same time, there is a range of patient severity and operation types in cardiac surgery. The
MICS technology offered an innovation in its method of gaining access to the heart. It had the potential
to be used for the same range of cardiac operations as the conventional “open” method; however, with its
restricted access to the heart and chest cavity, certain operations were far more technically difficult using
MICS than using conventional technology.5 Being able to use MICS for a wider range of cardiac
operations of varying difficulty meant that a surgeon could treat more patients with the MICS approach,
which might allow both the hospital’s reputation and referral pool to expand if nearby hospitals were
unable to do the same. We therefore concluded that for cardiac surgery teams adopting the MICS
technology, two dimensions of potential learning were present: increasing efficiency, measured by
reductions in procedure time, and increasing application innovation, measured by increases in case
difficulty.
5 In particular, procedures in which the surgeon needs access to the back or sides of the heart, such as in multiple graft CABG (e.g., quadruple bypass) and those in which operating through a narrow opening in the chest poses particular limitations (e.g., multiple concurrent valve replacements), were far more challenging technically than standard CABG and valve replacement.
13
Academic and community hospitals. The data set comprised both academic and community
medical centers (AMCs and CMCs). These two types of hospital have differing resources, competencies,
primary missions, and goals, which may incline them to learn on different dimensions as they adopted
MICS. The primary role of a community center is to serve its local community’s medical needs.
Compared to academic medical centers, community hospitals rely more heavily on revenue from clinical
operations than from teaching and research. Thus, community hospitals might be labeled “performance
goal oriented.” The reduced surgical capacity resulting from initially long MICS procedure times (a proxy
for efficiency) would thus be particularly significant for community hospitals.
In contrast, AMCs undertake research and teaching in addition to providing clinical care and
derive additional revenue from these activities. Moreover, they benefit from publications in leading
journals and are often the developers of, and the testing grounds for, medical innovations. Lastly, AMCs
have a more heterogeneous pool of patients than community centers, one that includes both routine cases
and severe illness or esoteric conditions. Thus, academic hospitals might be labeled “mastery goal
oriented.” Given their patient diversity, AMCs are likely to derive competitive advantage from increasing
procedural difficulty with MICS (a proxy for application innovation), as it can increase the number of
potential patients on whom the new technology can be used. The ability to conduct difficult procedures
also can promote academic prestige and serve as a differentiator in attracting residents (surgeons in
training) who must choose which training program to attend.
Hence, because of strategic considerations related to their differing goals and resource constraints
related to their different income sources and referral pools, we expected academic and community
hospitals to learn on different dimensions. Specifically, for the specific context under study, Hypothesis 2
was formulated as follows:
Hypothesis 2a: Relative to community hospitals, academic hospitals will learn more rapidly
along the dimension of application innovation, captured by technical difficulty.
14
Hypothesis 2b: Relative to academic hospitals, community hospitals will learn more rapidly
along the dimension of efficiency, measured by procedure time.
Academic hospitals draw on a more diverse patient-referral population than community hospitals
and are more likely to be able to withstand a short-term revenue loss during MICS adoption. Both factors
allow academic hospitals to experiment with new uses for MICS in the absence of an imperative to
shorten operation time. Moreover, academic hospitals could benefit—by gaining prestige and by serving
patients others were unable to serve—from learning to offer the MICS procedure to more difficult patient
cases. This benefit may be realized in patient care revenue and/or future research funding. By way of
contrast, not only are community hospitals unlikely to realize benefits from becoming adept at difficult
cases, but they also do not have the diverse referral pool from which to draw patients requiring more
technically challenging operations. Instead, they are more likely to increase volume by increasing
efficiency; by getting faster, they would be able to serve more patients in the same amount of time.
METHODS
Sample
The study sample comprised sixteen cardiac surgical units across the United States, nine
academic medical centers and seven community hospitals. A geographically diverse sample of sites was
selected from the 108 hospitals that had purchased the MICS technology prior to August 1997 to include
both academic and community hospitals. The average hospital in the sample undertook a fairly high
volume of cardiac surgeries on an annual basis (approximately 1,400 cases/year, ranging from 400-3,500
cases/year). Most of the hospitals had extensive experience adopting new cardiac surgery innovations,
and all had at least some prior experience with innovation. The company introducing the technology had
targeted these institutions because they were considered to have “first-tier” cardiac surgery departments
(with moderate to high total case volumes, highly regarded surgeons, and a reputation for high-quality

15
care and excellent clinical outcomes). The company that developed the technology provided
introductions to these sites, all of which agreed to participate in this research.
Data sources
All hospitals provided data for every MICS operation performed, including data on the type of
cardiac operation performed, procedure time, and information about each patient’s clinical condition.
This was our primary data source. In cases where patient data was missing, we collected the missing data
directly from the hospital’s internal databases or original medical records. The final data set contained
every MICS operation performed at each of the sixteen sites from their first case (April 1997 or later)
until December 1998. During this time interval, each of the selected sixteen institutions contributed
between 9 and 92 cases, totaling 679 cases. Differences in number of cases performed across sites were
generally the result of two factors. Although all 16 hospitals in our sample were considered “early
adopters” because they adopted MICS within the first year of FDA approval, the exact time of adoption
differed, thus influencing the number of cases performed by November 1998. In addition, sites also
varied in the rate (number of cases per month) at which they were able to do the procedure (due to the
availability of appropriate patients and the interests of the adopting surgeon).
In addition to patient-level data, two or three of the authors conducted a site visit at each hospital.
We interviewed all those connected with the adoption of MICS, including surgeons, anesthesiologists,
scrub nurses, perfusionists, referring cardiologists, and administrators. Over a five-month period during
the time of adoption, we conducted 165 interviews, an average of 10.2 per site. We used the interviews to
obtain background about why the hospital adopted the new technology, informants’ descriptions of the
implementation process and its challenges, and insight into the learning goals that each site might hold.
Measures
For each patient, we collected two measures that allowed us to construct hospital-specific
learning curves for two dimensions of performance improvement: the technical difficulty of the surgical
procedure undertaken and the efficiency, in terms of time, with which it was executed.

16
Application innovation. To measure application innovation in this setting, we used expert ratings
of technical difficulty, a core aspect of application innovation in this context. We interviewed four
surgeons about this challenge and obtained their ratings of the relative difficulty of each of the twelve
types of cardiac procedure that occur in the data set. We asked them to asses the difficulty of performing
each procedure, creating four groups of procedures: those with 1) the least technical difficulty, 2) less
than average technical difficulty, 3) higher than average technical difficulty, and 4) the greatest technical
difficulty. The surgeons were asked to concentrate on the additional technical difficulty imposed when
performing these procedures via MICS, rather than the technical difficulty of the procedures themselves,
with which all of the surgeons were highly competent. Using the means of the surgeons’ standardized
scores for each procedure, we divided the procedures into four groups by placing group boundaries at
relatively large jumps in the scores. We then interviewed a fifth surgeon, highly expert in MICS, to get
feedback on our final ratings. He approved of the classifications, which are shown in Table 1.
Insert Table 1 about here
Although this classification was determined based on the opinions of only five surgeons, we
believe that it is robust for two reasons. First, there was a very high degree of agreement between the
surgeons’ opinions. The kappa statistics for inter-rater reliability among the first four surgeons of 0.75
(p < 0.0001) indicates “substantial” agreement (Cohen, 1960; Landis & Koch, 1977). Second, there is an
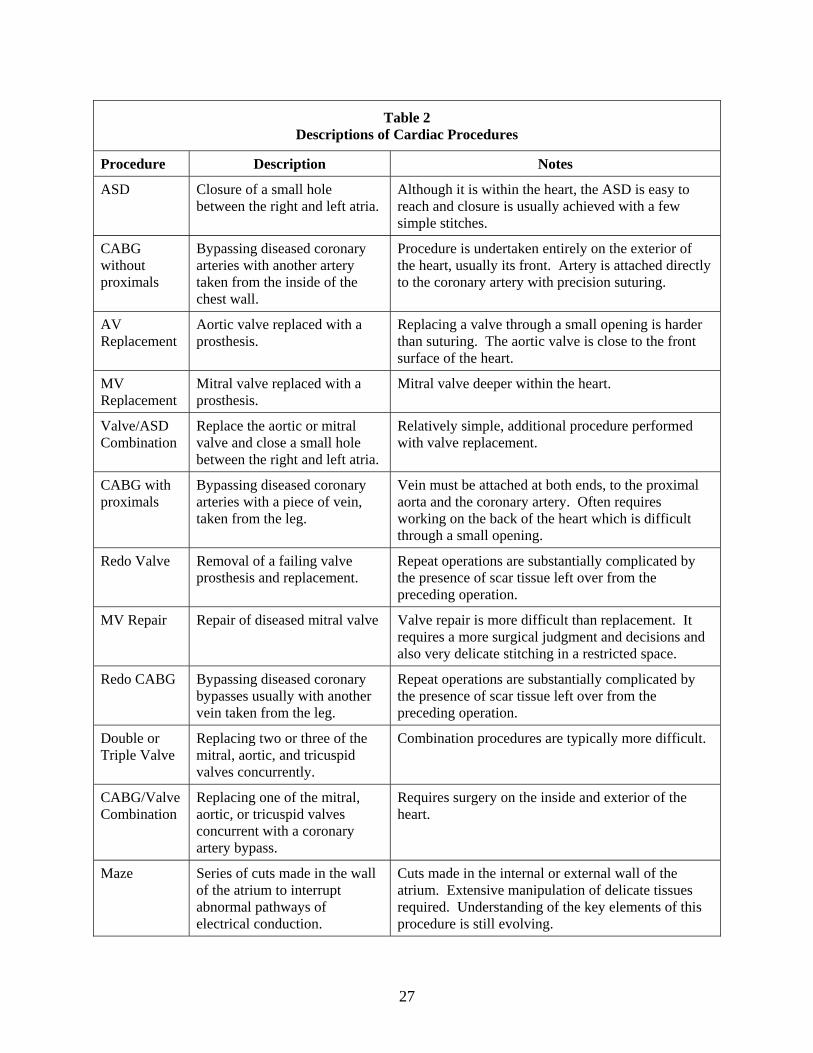
intuitive basis for this classification, which thus has face validity. Lay descriptions of the twelve
procedures, shown in Table 2, clarify the increase in difficulty from one group to the next.
Insert Table 2 about here
Efficiency. Our measure of efficiency, procedure time, is the time it took for a surgical team to
complete the operation. This time, known colloquially as “skin-to-skin time,” is the time between the
first surgical incision and the last stitch. Because it does not include the time spent preparing the
17
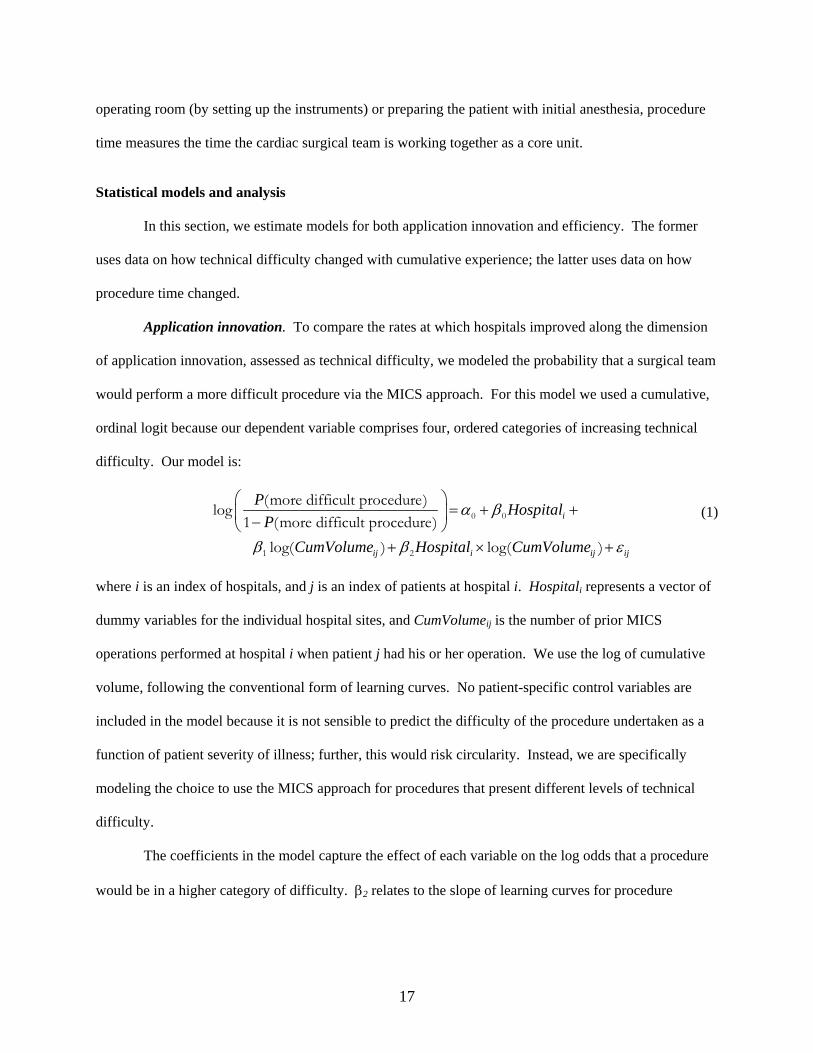
operating room (by setting up the instruments) or preparing the patient with initial anesthesia, procedure
time measures the time the cardiac surgical team is working together as a core unit.
Statistical models and analysis
In this section, we estimate models for both application innovation and efficiency. The former
uses data on how technical difficulty changed with cumulative experience; the latter uses data on how
procedure time changed.
Application innovation. To compare the rates at which hospitals improved along the dimension
of application innovation, assessed as technical difficulty, we modeled the probability that a surgical team
would perform a more difficult procedure via the MICS approach. For this model we used a cumulative,
ordinal logit because our dependent variable comprises four, ordered categories of increasing technical
difficulty. Our model is:
0 0
1 2
(more difficult procedure)log1 (more difficult procedure)
log( ) log( )
i
ij i ij ij
P HospitalP
CumVolume Hospital CumVolume
α β
β β ε
⎛ ⎞= + +⎜ ⎟−⎝ ⎠
+ × +
(1)
where i is an index of hospitals, and j is an index of patients at hospital i. Hospitali represents a vector of
dummy variables for the individual hospital sites, and CumVolumeij is the number of prior MICS
operations performed at hospital i when patient j had his or her operation. We use the log of cumulative
volume, following the conventional form of learning curves. No patient-specific control variables are
included in the model because it is not sensible to predict the difficulty of the procedure undertaken as a
function of patient severity of illness; further, this would risk circularity. Instead, we are specifically
modeling the choice to use the MICS approach for procedures that present different levels of technical
difficulty.
The coefficients in the model capture the effect of each variable on the log odds that a procedure
would be in a higher category of difficulty. β2 relates to the slope of learning curves for procedure

18
difficulty. It is a vector that captures how much the rate of learning at a given hospital differs from the
average rate for all hospitals.
Table 3 shows our results. The model provides a significant fit to the data, using the likelihood
ratio chi-square. Maximum likelihood estimators for all hospital-specific coefficients are not shown.
Here we indicate the statistical significance of the entire vector.
Insert Table 3 about here
As can be seen from the results for model 1 in Table 3, hospitals differ in the mean technical
difficulty of the procedures they chose for MICS. In model 3, by adding an interaction term,
Hospitalxlog(CumVolume), we tested for differences in the slope of hospital-specific learning curves. We
found that these slopes, corresponding to the rates at which hospitals increase or decrease technical
difficulty with cumulative experience, differ from the 16-hospital average. They also differ from each
other (Wald χ2 = 38.3, p < 0.001).
Efficiency. We compared the rates at which different hospitals reduced procedure time using the
following model:
0 0 1
2 3
log( ) log ( ) log ( )
k i
ij i ij ij
ProcTime Difficulty HospitalCumVolume Hospital CumVolume
α β ββ β ε
= + + ++ × +
(2)
where i is again an index of hospitals, j is an index of patients at hospital i, and k is an index of the four
categories of technical difficulty. Because of the possibility that more technically difficult procedures
take longer, we use the four-score procedure difficulty, Difficultyk, described above, as a control variable
for procedure type. We use the log of procedure time and of cumulative volume, following the
conventional form of learning curves. The first coefficient, β0, captures the mean effect of procedure
difficulty on procedure time; β1 is a vector of coefficients that capture how average procedure times differ
across hospitals; β2 captures the average effect of cumulative volume on procedure time; and β3 is a

19
vector of coefficients that capture how much the slope of the learning curve of a given hospital differs
from the average learning curve slope for all hospitals.
Results from the regression for procedure time are shown in Table 4. Individual coefficients for
hospital-specific estimates are not shown. Vectors for these parameters are significantly different from
zero.
Insert Table 4 about here
Model 1 in Table 4 shows that, controlling for technical difficulty, hospitals differed in their
mean procedure times. As expected, the statistical significance of the Difficulty coefficient confirms that
technical difficulty is indeed a significant predictor of procedure time. Model 2 incorporates cumulative
volume into the model. Here we find—again controlling for technical difficulty—that the effect of
cumulative volume varies significantly across hospitals (F = 11.04, p < 0.001). With the addition of an
interaction term, Hospitalxlog(CumVolume), model 3 tests the extent to which hospitals differ in the rates
at which they increase or decrease the efficiency of the MICS procedures with cumulative experience.
Results show that the vector of coefficients corresponding to the interaction term is statistically
significant. Further, by calculating an F statistic from the vector of coefficients for β3j, we find
significantly different learning curves across hospitals (F = 3.3, p < 0.001).
Trade-offs. To test our first hypothesis, that there is a tradeoff between the rates of learning in
these two dimensions, we calculated the correlation between the slope coefficients for every hospital,
derived from the models described above. The Spearman rank correlation coefficient was 0.55 (p < 0.05),
indicating a negative correlation between the rates of learning for procedure time and technical difficulty.6
The correlation is negative because faster learning in the dimension of procedure time is negative (time
6 We used Spearman’s rank order correlation coefficient because it does not require assumptions about the distribution of the population from which the samples were taken and is particularly well suited to small samples and data for which the distribution is not necessarily normal (Saslow, 1982). Although Pearson’s correlations can inflate the degree of association between two variables of this kind if there are a few extreme values, Spearman’s coefficient solves this problem by correlating the rank order between two variables.

20
decreases) while faster learning in the dimension of technical difficulty is positive (difficulty increases).
Therefore, as postulated in Hypothesis 1, those hospitals whose efficiency in performing MICS
procedures became faster (negative procedure-time learning-curve slope) tended not to take on more
technically difficult cases. Conversely, hospitals that increased the technical difficulty of their MICS
cases (positive technical-difficulty learning-curve slope) tended not to get faster, even controlling for
difficulty. This evidence is consistent with the proposition that there are tradeoffs in improvement
trajectories at the hospital level, confirming Hypothesis 1.
Learning dimension and hospital goal orientation. To explore whether these patterns of
learning might be related to hospital goal orientation, we divided the sample into two subgroups based on
hospital type (AMC or CMC). To compare the rates of learning between these two groups, we re-
estimated models (1) and (2), replacing the Hospital dummy variable with a new, binary dummy variable
Academic to indicate whether the hospital was an AMC. These two new models tested for the difference
between procedure-time learning-curve slopes and technical-difficulty learning-curve slopes at the
academic and community hospitals in the sample.
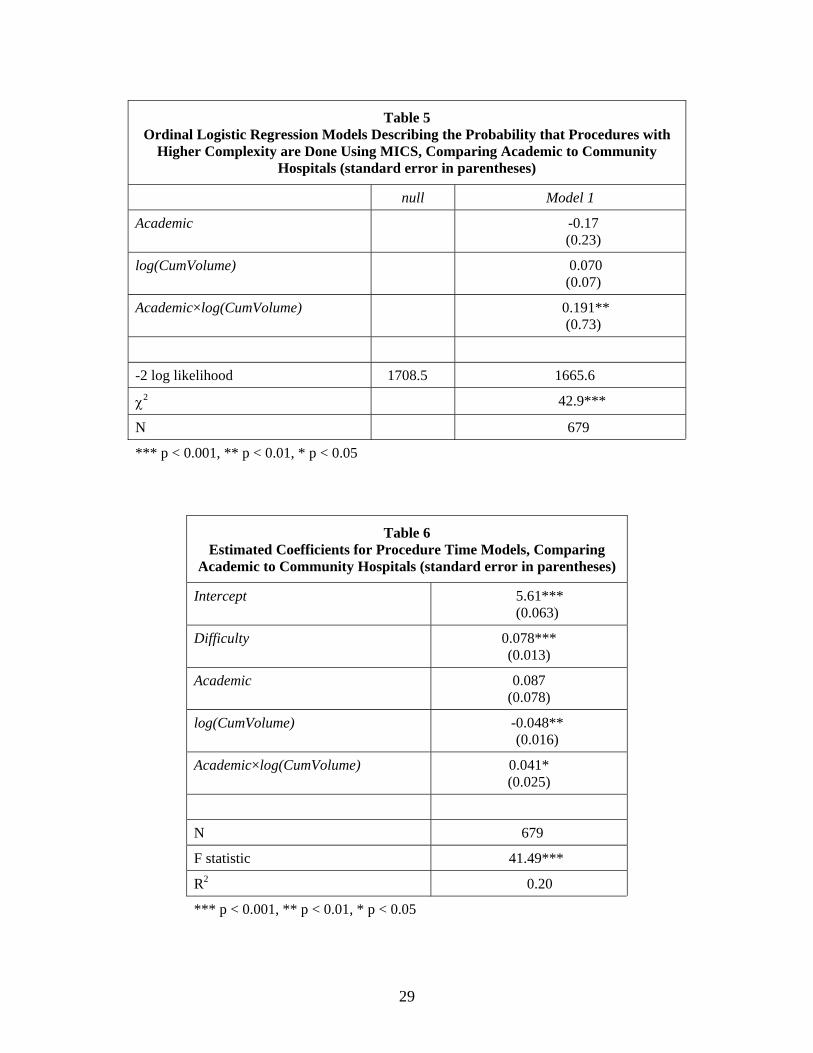
Results of the difficulty model are shown in Table 5. The mean difficulty of MICS procedures
performed at hospitals in the sample was higher at academic than at community hospitals. The mean
procedure difficulty score at academic hospitals was 2.2 versus 1.8 (p < 0.001) at community hospitals.
Further, the new model for technical difficulty indicated a significant difference between academic and
community hospitals in the rate at which they increased the difficulty score of their procedures. As
shown in model 1 in Table 5, the slope coefficient for the rate of increase in procedure difficulty was
higher (p < 0.01) at academic centers than at community hospitals. That is, academic centers increased
the difficulty of the procedures they performed using MICS at a greater rate than their community
counterparts. Results were not sensitive to the decreasing quantity of data at higher cumulative volumes.
Insert Table 5 about here
21
Results of the model for procedure time are reported in Table 6 and show that the community
hospitals in the sample were faster learners when it came to decreasing operative times, or efficiency. As
can be seen in Table 6, the slope of the learning curve for academic hospitals was higher than that of
community hospitals (p < 0.05). After controlling for technical difficulty, community hospitals were able
to reduce their MICS procedure times faster than the academic hospitals in the sample. Again, these
results were not sensitive to the decreasing data at higher cumulative volumes.
Insert Table 6 about here
The two models described above confirm Hypotheses 2a and 2b. They show that there were
significant differences in the rates of learning between the academic and community hospitals in the
sample. These groups of hospitals differed in the rates at which they improved efficiency and in the rates
at which they increased application innovation through procedure difficulty. Additionally, community
hospitals were faster learners on the dimension of efficiency; academic hospitals were faster learners on
the dimension of application innovation.
DISCUSSION
Previous learning-curve studies have examined the rate of learning on a single dimension without
attention to choices about the direction of learning. This paper analyzes longitudinal data from sixteen
hospitals implementing a new technology to show that these organizations could learn along two distinct,
potentially equally important, performance-improvement trajectories: efficiency (how to do a basic
procedure more quickly) and application innovation (how to do more technically difficult procedures).
The present study focuses on these two key dimensions of learning and examines their impact on
learning outcomes in surgery, where the tension between the two is particularly critical. Learning
tradeoffs also are fundamental to settings outside the realm of healthcare, and are of particular relevance

22
to the field of operations management and operations strategy. For example, most operations management
scholars define operations strategy according to the relative weighting of four basic manufacturing
capabilities: low cost, quality, flexibility, and delivery (Schmenner and Swink 1998; Ward, McCreery,
Ritzman and Sharma, 1998). These scholars suggest that firms must make tradeoffs between these
capabilities based on their relative importance to the organization (see, for instance, Boyer and Lewis,
2002). This well-established perspective in the operations strategy literature is known as the tradeoff
model (see Skinner, 1969; 1974). In essence, organizations must choose a manufacturing priority first and
then allocate their time and scarce resources accordingly (Hayes and Wheelwright, 1984; Garvin, 1993).
Overall, the group of hospitals studied became both more efficient and more adept at performing
difficult cases as they accumulated experience. However, some hospitals moved more quickly along the
efficiency improvement curve, while others moved more quickly along the application-innovation curve.
A negative relationship between the slopes of these curves for the full sample supported the notion that
learning on one dimension could inhibit learning on the other dimension, suggesting that it can be
difficult to learn on more that one dimension simultaneously, most likely because each dimension
requires an investment of effort and resources from a limited pool. We also found that academic and
community hospitals have significantly different tendencies in their learning dimensions that correspond
to differences in their organizational environments, strategies, and goal orientation. These findings
support the idea that goal orientation at the organizational level shapes learning investments and
outcomes.
This paper contributes to the learning-curve literature in two primary ways. First, it extends
previous research by including a new dimension of learning, application innovation, and examining
whether this dimension conflicts with learning on the efficiency dimension, the form of learning
commonly investigated in the literature. Prior work has emphasized that learning must be managed;
differences in managerial effectiveness might explain why some organizations learn faster than others.
Our findings suggest a second fundamental explanation for learning-curve heterogeneity across

23
organizations: some organizations may learn more slowly on a particular observed dimension of learning
because they are investing in a different, potentially contradictory dimension of learning. In our study’s
setting, hospitals that focused on increasing the technical difficulty and innovativeness of their use of a
new technology were less likely to increase efficiency as quickly as those that were focused on efficiency.
Had the study only assessed efficiency, as most prior studies of learning curves have done, this
explanation would have been overlooked.
Our second contribution is the identification of a factor that might contribute to the tradeoff
between the two learning dimensions, namely an organization’s goal orientation. Based on the
organization type and learning climate, we made inferences about the organization’s goal orientation and
examined its impact on learning outcomes.
Theoretical implications
Previous work has shown that deliberate management of the activities and roles related to
learning can improve an organization’s rate of learning (Baloff, 1970; Dutton & Thomas, 1984). This
paper suggests further that organizations working with a new technology or process may learn on more
than one meaningful dimension, each of which may contribute to improving firm performance. Thus, the
present study adds to the ongoing discussion of whether organizations can excel in all areas by providing
evidence of the difficulty of such agenda. When resources are limited, organizations face a tradeoff
between what should be learned; thus, managers may need first to select the most important dimension of
performance along which to manage learning. Even those organizations that are held up as models of
excellence in all areas (e.g., Toyota) might experience tensions during the adoption of new technologies
or practices. For example, a close examination of Toyota's production system reveals that the company
very carefully plans the sequence in which it implements improvements (Spear and Bowen, 1999). In a
new Toyota plant, the first emphasis is on quality—that is, “how to get it right” (Mishina, 1995). Once
both systems and employees excel on the dimension of quality, the plant works on improving efficiency.

24
Finally, when the plant reaches a certain efficiency threshold, it adds capability for producing application
innovation, for example by increasing complexity and technical difficulty (Spear and Bowen, 1999). Our
findings similarly suggest that organizations should explicitly identify the learning dimension of greatest
strategic relevance to them and focus initially on this dimension.
As noted above, our study suggests a possible omission in previous learning-curve studies. If
some users, when learning to use a new technology, use it “differently” rather than more efficiently, then
cross-sectional comparisons of learning-curve slopes for efficiency would be likely to show
heterogeneity, not due to less effective learning but due to the fact that learning occurred on another
dimension. We thus raise the possibility that organizations identified as having slower rates of learning
than others may be focusing on learning along a dimension other than that which was measured.
Limitations
The learning-curve analyses presented in this paper have some limitations. First, the analyses are
sensitive to a hospital’s initial starting point. Those hospitals that did not deliberately select less
challenging operations for their early experiences with MICS may have been more likely to reduce
procedure difficulty with experience. Second, although we found that academic hospitals were more
likely to improve in difficulty and community hospitals more likely to improve in efficiency, we cannot
tell if this was the result of the different capabilities, resources, or strategic choices of each group.
Finally, it is possible that our finding is specific to the healthcare context. Healthcare
technologies often enter use before their full range of applications has been determined. For patients
whose health problems have no well-agreed, single solution, healthcare is somewhat experimental.
Practitioners continually test out new solutions to such health problems, particularly at academic
hospitals. Thus, exploring the range of use of an innovation is a common practice in healthcare—hence,
the need to learn along this dimension—but may not be the case in other industries. Given the specialized
context of this study in cardiac surgery organizations, we believe that future research on learning

25
trajectories and possible tradeoffs in other contexts is needed to assess the generalizability of these
conclusions.
We suggest that additional research on the topics explored in this paper will provide valuable
insights for both scholars and practitioners interested in learning. We hope that this paper stimulates
further work that looks at learning during the acquisition of new technologic capabilities.
CONCLUSION
This paper argues that organizations face more than one way to improve when implementing a
new technology, manufacturing a new product, or facing some other significant trigger of process change.
We argued that learning on one dimension in such situations—efficiency or cost improvement being the
most frequently studied in prior research—comes at the cost of learning on another dimension, such as
innovation or difficulty. Data from sixteen hospitals implementing a new technology for cardiac surgery
supported this core proposition. We also found that these organizations tended to improve along learning
dimensions consistent with their goal orientation and strategic operational position.

26
Table 1 Technical Difficulty Scores for Cardiac Operations Using MICS
1 Least
Technical Difficulty
2 Less Than Average
Technical Difficulty
3 Greater
Than Average
Technical Difficulty
4 Greatest
Technical Difficulty
Mean
Standar-dized Score
Type of Procedure:
ASD • -1.75
CABG without proximals • -1.10
AV Replacement • -0.65
MV Replacement • -0.42
Valve/ASD Combination • -0.20
CABG with proximals • -0.01
Redo Valve • 0.21
MV Repair • 0.44
Redo CABG • 0.71
Double or Triple Valve • 0.89
CABG/Valve Combination
• 0.89
Maze • 1.30
CABG = coronary artery bypass graft; ASD = atrial septal defect repair; MV = mitral valve; AV = aortic valve; Redo = repeated operation; Maze = focal destruction of electrical impulse conducting cells within the heart.
27
Table 2 Descriptions of Cardiac Procedures
Procedure Description Notes
ASD Closure of a small hole between the right and left atria.
Although it is within the heart, the ASD is easy to reach and closure is usually achieved with a few simple stitches.
CABG without proximals
Bypassing diseased coronary arteries with another artery taken from the inside of the chest wall.
Procedure is undertaken entirely on the exterior of the heart, usually its front. Artery is attached directly to the coronary artery with precision suturing.
AV Replacement
Aortic valve replaced with a prosthesis.
Replacing a valve through a small opening is harder than suturing. The aortic valve is close to the front surface of the heart.
MV Replacement
Mitral valve replaced with a prosthesis.
Mitral valve deeper within the heart.
Valve/ASD Combination
Replace the aortic or mitral valve and close a small hole between the right and left atria.
Relatively simple, additional procedure performed with valve replacement.
CABG with proximals
Bypassing diseased coronary arteries with a piece of vein, taken from the leg.
Vein must be attached at both ends, to the proximal aorta and the coronary artery. Often requires working on the back of the heart which is difficult through a small opening.
Redo Valve Removal of a failing valve prosthesis and replacement.
Repeat operations are substantially complicated by the presence of scar tissue left over from the preceding operation.
MV Repair Repair of diseased mitral valve Valve repair is more difficult than replacement. It requires a more surgical judgment and decisions and also very delicate stitching in a restricted space.
Redo CABG Bypassing diseased coronary bypasses usually with another vein taken from the leg.
Repeat operations are substantially complicated by the presence of scar tissue left over from the preceding operation.
Double or Triple Valve
Replacing two or three of the mitral, aortic, and tricuspid valves concurrently.
Combination procedures are typically more difficult.
CABG/Valve Combination
Replacing one of the mitral, aortic, or tricuspid valves concurrent with a coronary artery bypass.
Requires surgery on the inside and exterior of the heart.
Maze Series of cuts made in the wall of the atrium to interrupt abnormal pathways of electrical conduction.
Cuts made in the internal or external wall of the atrium. Extensive manipulation of delicate tissues required. Understanding of the key elements of this procedure is still evolving.

28
Table 3 Ordinal Logistic Regression Models Describing the Probability that Procedures with Higher Complexity are Done Using MICS
null Model 1 Model 2 Model 3
Hospital *** *** *
log(CumVolume) 0.04 0.26
Hospital log(CumVolume) ***
-2 log likelihood 1708.5 1533.4 1533.1 1487.1
χ2 175.1*** 175.4*** 221.4***
N 679 679 679
*** p < 0.001 ** p < 0.01 * p < 0.05
Table 4 Estimated Coefficients for Procedure Time Models
(standard error in parentheses)
Model 1 Model 2 Model 3
Intercept 6.14***(0.074)
6.24***(0.079)
6.25*** (0.167)
Difficulty *** *** ***
Hospital *** *** ***
log(CumVolume) -0.041***(0.012)
-0.048 (0.062)
Hospital×log(CumVolume) ***
N 679 679 679
F statistic 19.14*** 18.99*** 12.6***
R2 0.34 0.35 0.40
*** p < 0.001 ** p < 0.01 * p < 0.05
29
Table 5 Ordinal Logistic Regression Models Describing the Probability that Procedures with
Higher Complexity are Done Using MICS, Comparing Academic to Community Hospitals (standard error in parentheses)
null Model 1
Academic -0.17 (0.23)
log(CumVolume) 0.070 (0.07)
Academic×log(CumVolume) 0.191** (0.73)
-2 log likelihood 1708.5 1665.6
χ2 42.9***
N 679
*** p < 0.001, ** p < 0.01, * p < 0.05
Table 6 Estimated Coefficients for Procedure Time Models, Comparing
Academic to Community Hospitals (standard error in parentheses)
Intercept 5.61*** (0.063)
Difficulty 0.078*** (0.013)
Academic 0.087 (0.078)
log(CumVolume) -0.048** (0.016)
Academic×log(CumVolume) 0.041* (0.025)
N 679
F statistic 41.49***
R2 0.20
*** p < 0.001, ** p < 0.01, * p < 0.05

30
REFERENCES
Adler, P. S., K.B. Clark. 1991. Behind the Learning Curve: a Sketch of the Learning Process.
Management Science 37(3) 267-281.
Argote, L. 1999. Organizational Learning: Creating, Retaining, and Transferring Knowledge. Kluwer,
Norwell, MA.
Argote, L., D. Epple. 1990. Learning curves in manufacturing. Science 247 920–924.
Argote, L., P. Ingram,. 2000. Knowledge Transfer: A Basis for Competitive Advantage in Firms.
Organizational Behavior and Human Decision Processes 82(1) 150-169.
Ames, C. 1992. Classrooms: Goals, structures, and student motivation. Journal of Educational
Psychology 84 261-271.
Ames, C., & J. Archer. 1988. Achievement goals in the classroom: Students’ learning strategies and
motivation processes. Journal of Educational Psychology 80 260–267.
Baloff, N. 1970. Startup Management. IEEE Transactions on Engineering Management 17(4) 132-141.
Barnard, C. N. 1967. The Operation. A Human Cardiac Transplant: an Interim Report of a Successful
Operation Performed at Groote Schuur Hospital, Cape Town. South African Medical Journal
41(48) 1271-1274.
Boyer, Kenneth K., M.W. Lewis. 2002. Competitive priorities: investigating the need for trade-offs in
operations strategy, Production and Operations Management 11(1), Spring 9-20.
Bunderson, J. Stuart, Kathleen M. Sutcliffe. 2003. Management Team Learning Orientation and Business
Unit Performance. Journal of Applied Psychology 88(3) 552-560.
Button, S. B., J. E. Mathieu, D.M. Zajac. 1996. Goal orientation in organizational research:

31
A conceptual and empirical foundation. Organizational Behavior and Human Decision
Processes 67 26-48.
Cohen, J. 1960. A Coefficient of Agreement for Nominal Scales. Educational and Psychological
Measurement 20 37-46.
Darr, E. D., L. Argote, D. Epple. 1995. The Acquisition, Transfer, and Depreciation of Knowledge in
Service Organizations: Productivity in Franchises. Management Science 41(11) 1750-1762.
Dierickx, I., K. Cool. 1989. Asset Stock Accumulation and Sustainability of Competitive Advantage,
Management Science 35(12), December 1504-1511.
Druker, B. J., M. Talpaz, D.J. Resta, B. Peng, E. Buchdunger, J.M. Ford, N.B. Lydon, H. Kantarjian, R.
Capdeville, S. Ohno-Jones, C.L. Sawyers. 2001. Efficacy and safety of a specific inhibitor of the
BCR-ABL tyrosine kinase in chronic myeloid leukemia. New England Journal of Medicine
344(14) 1031-1037.
Dweck, C. S. 1986. Motivational processes affecting learning. American Psychologist 41:
1040-1048.
Dweck, C., E.L. Leggett. 1988. A social-cognitive approach to motivation and personality. Psychological
Review 95 256–273.
Dutton, J. M., A. Thomas. 1984. Treating Progress Functions as a Managerial Opportunity. The Academy
of Management Review 9(2) 235-247.
Edmondson, A., R. Bohmer, G. Pisano. 2001. Disrupted routines: Team learning and new technology
implementation in hospitals. Administrative Science Quarterly 46 685–716.
Edmondson, A. C., A. B. Winslow, R. Bohmer, G. Pisano. 2003. Learning How and Learning What:
Effects of Tacit and Codified Knowledge on Performance Improvement Following Technology
Adoption. Decision Sciences 34(2) 197-224.
32
Elliott, E. S., L. S. Dweck, 1988. Goals: An approach to motivation and achievement,
Journal of Personality and Social Psychology 54(1) 5-12.
Fitts, PM. 1954. The information capacity of the human motor system in controlling the amplitude of
movement. Journal of Experimental Psychology 47 381-391.
Galloway, A. C., Shemin, R. J., Glower, D. D., Joseph H. Boyer, J., Groh, M. A., Kuntz, R. E., Burdon,
T. A., Ribakove, G. H., Reitz, B. A., Colvin, S. B. 1999. First report of the Port Access
International Registry. Annals of Thoracic Surgery 67(1) 51-56.
Garvin, D. A. 1993. Manufacturing Strategic Planning, California Management Review 35(4) 85-106.
Hayes H., S.C. Wheelwright. 1984. Restoring Our Competing Edge: Competing through Manufacturing,
John Wiley & Sons, New York, NY.
Hatch, N. W., D.C. Mowery. 1998. Process Innovation and Learning by Doing in Semiconductor
Manufacturing. Management Science 44(11) 1461-1477.
Haunschild, P. R., B. N. Sullivan. 2002. Learning from complexity: Effects of prior accidents and
incidents on airlines’ learning. Administrative Science Quarterly 47 609–643.
Ittner, C. D., V. Nagar, M. V. Rajan. 2001. An empirical examination of dynamic quality-based learning
models. Management Science 47 563–578.
Joskow, P. L., G.A. Rozanski. 1979. The Effects of Learning-by-Doing on Nuclear Plant Operating
Reliability. The Review of Economics and Statistics 61(2) 161-168.
Kaplan, A., Middleton, M., Urdan, T., C. Midgley. 2002. Achievement goals and goal structures. In C.
Midgley (Ed.), Goals, goal structures, and patterns of adaptive learning. Hillsdale, NJ: Erlbaum.
Kelsey, S. F., Mullin, S. M., Detre, K. M., Mitchell, H., Cowley, M. J., Gruentzig, A. R., Kent, K. M.
1984. Effect of investigator experience on percutaneous transluminal coronary angioplasty.
American Journal of Cardiology 53(12) 56C-64C.

33
Landis, J. R., G.G. Koch. 1977. The Measurement of Observer Agreement for Categorical Data.
Biometrics 33(1) 159-174.
Lapré, M. A., L. N. van Wassenhove. 2001. Creating and transferring knowledge for productivity
improvement in factories. Management Science 47 1311–1325.
Lieberman, M. B. 1984. The Learning Curve and Pricing in the Chemical Processing Industries. The
Rand Journal of Economics 15(2) 213-228.
Lieberman, M. B. 1987. The learning curve, diffusion, and competitive strategy. Strategic Management
Journal 8 441–452.
MacKay, DG. 1982. The problems of flexibility, fluency, and speed-accuracy trade-off in skilled
behavior. Psychological Review 89 483-506.
March, J.G., 1991. Exploration and Exploitation in Organizational Learning. Organization Science 2(1),\
71-87.
Miller, D., P.H. Friesen. 1986. Porter's (1980) generic strategies and performance: An empirical
examination with American data. Organization Studies 7(1) 37-55.
Mishina, Kazuhiro. 1995. Toyota Motor Manufacturing, USA, Inc. Harvard Business School
case # 9-693-. 019, September 5.
O'Connor, G. T., S. K. Plume, E.M. Olmstead, J.R. Morton, C.T. Maloney, W.C. Nugent, F. Jr.
Hernandez, R. Clough, B.J. Leavitt, L.H. Coffin, C.A. Marrin, D. Wennberg, J.D. Birkmeyer,
D.C. Charlesworth, D.J. Malenka, H.B. Quinton, J.F. Kasper. 1996. A regional intervention to
improve the hospital mortality associated with coronary artery bypass graft surgery. The Northern
New England Cardiovascular Disease Study Group. Journal of the American Medical Association
275(11) 841-846.
Porter, M. 1991. Towards a Dynamic Theory of Strategy. Strategic Management Journal 12 95-117.

34
Pisano, G. P., R. Bohmer, A. C. Edmondson. 2001. Organizational differences in rates of learning:
Evidence from the adoption of minimally invasive cardiac surgery. Management Science 47 752–
768.
Rapping, L. 1965. Learning and World War II production functions. Rev. Econom. Statist. 47 81–86.
Ricotta, J. J., Faggioli, G. L., Castilone, A., Hassett, J. M. 1995. Risk Factors for Stroke After Cardiac
Surgery: Buffalo Cardiac-Cerebral Study Group. Journal of Vascular Surgery 21(2) 359-363.
Saslow, C. A. 1982. Basic Research Methods. New York: Random House.
Schmenner, R. W., M. L. Swink. 1998. On Theory in Operations Management. Journal of Operations
Management 17(1) 97-113.
Skinner, W. 1969. Manufacturing: Missing Link in Corporate Strategy. Harvard Business Review 3 136-
145.
Skinner, W. 1974. The Focused Factory. Harvard Business Review 3: 113-119.
Spear, Steven, H. Kent Bowen. 1999. Decoding the DNA of the Toyota Production System. Harvard
Business Review (September-October) 96-106.
Szulanski, G. 1996. Exploring Internal Stickness: Impediments to the Transfer of Best Practice Within the
Firm. Strategic Management Journal 17 27-43.
Teece, D., G. P. Pisano. 1994. The Dynamic Capabilities of Firms: an Introduction. Industrial and
Corporate Change 3(3) 537-556.
Teece D J, G. Pisano, A. Shuen. 1997. Dynamic Capabilities and Strategic Management. Strategic
Management Journal 18 509-533.
Tripsas, M., G. Gavetti. 2000. Capabilities, Cognition, and Inertia: Evidence from Digital Imaging.
Strategic Management Journal 21(10/11) 1147-1161.

35
Tushman, M. L., O'Reilly III, C. A. 1996. Ambidextrous Organizations: Managing Evolutionary and
Revolutionary Change. California Management Review 38(4) 8-30.
von Hippel, E. A. 1988. The Sources of Innovation. New York: Oxford University Press.
von Hippel, E. A. 1994. 'Sticky Information' and the Locus of Problem Solving: Implications for
Innovation. Management Science 40(4) 429-439.
von Hippel, E. A. 2005. Open Source Software Projects as "User Innovation Networks" - No
Manufacturer Required. In J. Feller, B. Fitzgerald, S. Hissam, & K. Lakhani (Eds.), Perspectives
on Free and Open Source Software. Cambridge: MIT Press.
Ward, P. T., J. K. McCreery, L. P. Ritzman, D. Sharma. 1998. Competitive Priorities in Operations
Management. Decision Sciences 29(4) 1035-1046.
Wilensky, G. R. 1990. Technology as Culprit and Benefactor. The Quarterly Review of Economics and
Business 30(4) 45-53.
Woodworth, RS. 1899. The accuracy of voluntary movement. Psychological Review 3(13) 54-59.
Wright, T. P. 1936. Factors Affecting the Costs of Airplanes. Journal of Aeronautical Sciences 3 122-
128.