Learning to rank, a supervised approach for ranking of ...
72
Learning to rank, a supervised approach for ranking of documents Master Thesis in Computer Science - Algorithms, Languages and Logic KRISTOFER TAPPER Chalmers University of Technology University of Gothenburg Department of Computer Science and Engineering Göteborg, Sweden, June 2015
Transcript of Learning to rank, a supervised approach for ranking of ...
Learning to rank, a supervised approach for ranking of documents Master Thesis in Computer Science - Algorithms, Languages and Logic
KRISTOFER TAPPER
Chalmers University of TechnologyUniversity of GothenburgDepartment of Computer Science and EngineeringGöteborg, Sweden, June 2015
The Authors grants to Chalmers University of Technology and University of Gothenburg the non-exclusive right to publish the Work electronically and in a non-commercial purpose make it accessible on the Internet. The Authors warrants that they are the authors to the Work, and warrants that the Work does not contain text, pictures or other material that violates copyright law.
The Authors shall, when transferring the rights of the Work to a third party (for example a publisher or a company), acknowledge the third party about this agreement. If the Authors has signed a copyright agreement with a third party regarding the Work, the Authors warrants hereby that they have obtained any necessary permission from this third party to let Chalmers University of Technology and University of Gothenburg store the Work electronically and make it accessible on the Internet.
Learning to Rank, a supervised approach for ranking of documents.
KRISTOFER TAPPER
© KRISTOFER TAPPER, June 2015.
Examiner: DEVDATT DUBHASHISupervisor: FREDRIK JOHANSSON
Chalmers University of TechnologyUniversity of GothenburgDepartment of Computer Science and EngineeringSE-412 96 GöteborgSwedenTelephone + 46 (0)31-772 1000
Department of Computer Science and EngineeringGöteborg, Sweden June 2015
Abstract
As available information gets more accessible everywhere and as the rateof new information grows very fast, the systems and models which retrievethis information deserves more attention. The purpose of this thesis is toinvestigate state-of-the-art machine learning methods for ranking known aslearning to rank. The goal is to explore if learning to rank can be used inenterprise search, which means less data and less document features than webbased search. Comparisons between several state-of-the-art algorithms fromRankLib (Dang, 2011) was carried out on benchmark datasets. Further,Fidelity Loss Ranking (Tsai et al., 2007) was implemented and added toRankLib. The performance of the tests showed that the machine learningalgorithms in RankLib had similar performance and that the size of thetraining sets and the number of features were crucial. Learning to rank isa possible alternative to the standard ranking models in enterprise searchonly if there are enough features and enough training data. Advise for animplementation of learning to rank in Apache Solr is given, which can beuseful for future development. Such an implementation requires a lot ofunderstanding about how the Lucene core works on a low level. Keywords:ranking, learning to rank, information retrieval, machine learning


Acknowledgements
I want to express my gratitude for all the support and helpful discussionsfrom my advisor Per Ringqvist at Findwise and my supervisor Fredrik Jo-hansson at Chalmers. Further I want to thank all the people at FindwiseGothenburg for great inputs, encouragement and for letting me do my thesisat their office. My examiner Devdatt Dubhashi also deserves a mention forhis valuable insights.
Kristofer TapperGöteborg, Thursday 11th June, 2015

Contents
1 Introduction 11.1 Background . . . . . . . . . . . . . . . . . . . . . . . . . . . . 11.2 Purpose . . . . . . . . . . . . . . . . . . . . . . . . . . . . . . 21.3 Limitations . . . . . . . . . . . . . . . . . . . . . . . . . . . . 31.4 Problem Specification . . . . . . . . . . . . . . . . . . . . . . . 31.5 Methods . . . . . . . . . . . . . . . . . . . . . . . . . . . . . . 3
2 Theory 52.1 PageRank . . . . . . . . . . . . . . . . . . . . . . . . . . . . . 52.2 The ranking model . . . . . . . . . . . . . . . . . . . . . . . . 72.3 Conventional Ranking Models . . . . . . . . . . . . . . . . . . 8
2.3.1 Okapi BM25 . . . . . . . . . . . . . . . . . . . . . . . . 82.3.2 Language Model for Information Retrieval . . . . . . . 92.3.3 Vector Space Model . . . . . . . . . . . . . . . . . . . . 9
2.4 Learning to Rank . . . . . . . . . . . . . . . . . . . . . . . . . 102.4.1 Data Representation . . . . . . . . . . . . . . . . . . . 102.4.2 The Pointwise Approach . . . . . . . . . . . . . . . . . 112.4.3 The Pairwise Approach . . . . . . . . . . . . . . . . . . 122.4.4 The Listwise Approach . . . . . . . . . . . . . . . . . . 12
3 Related Work 133.1 RankLib . . . . . . . . . . . . . . . . . . . . . . . . . . . . . . 13
3.1.1 MART . . . . . . . . . . . . . . . . . . . . . . . . . . . 143.1.2 RankNet . . . . . . . . . . . . . . . . . . . . . . . . . . 143.1.3 RankBoost . . . . . . . . . . . . . . . . . . . . . . . . 143.1.4 AdaRank . . . . . . . . . . . . . . . . . . . . . . . . . 153.1.5 Coordinate Ascent . . . . . . . . . . . . . . . . . . . . 153.1.6 LambdaMART . . . . . . . . . . . . . . . . . . . . . . 153.1.7 ListNet . . . . . . . . . . . . . . . . . . . . . . . . . . 163.1.8 Random Forests . . . . . . . . . . . . . . . . . . . . . . 163.1.9 Linear Regression . . . . . . . . . . . . . . . . . . . . . 16
ii
4 Fidelity Loss Ranking 174.1 Fidelity Loss . . . . . . . . . . . . . . . . . . . . . . . . . . . . 184.2 Algorithm description . . . . . . . . . . . . . . . . . . . . . . . 19
5 Experiments 215.1 Experimental Setup . . . . . . . . . . . . . . . . . . . . . . . . 215.2 Definitions & Score Metrics . . . . . . . . . . . . . . . . . . . 22
5.2.1 Common Definitions in Information Retrieval . . . . . 225.2.2 Discounted Cumulative Gain . . . . . . . . . . . . . . . 23
5.3 Benchmark Datasets . . . . . . . . . . . . . . . . . . . . . . . 245.3.1 Preprocessing of data . . . . . . . . . . . . . . . . . . . 255.3.2 MQ2008 . . . . . . . . . . . . . . . . . . . . . . . . . . 255.3.3 HP2003 . . . . . . . . . . . . . . . . . . . . . . . . . . 26
5.4 Comparison between the algorithms inRankLib . . . . . . . . . . . . . . . . . . . . . . . . . . . . . . 265.4.1 MQ2008 test results . . . . . . . . . . . . . . . . . . . 265.4.2 HP2003 test results . . . . . . . . . . . . . . . . . . . . 305.4.3 A short summary of the results . . . . . . . . . . . . . 33
5.5 Learning to Rank in Apache Solr . . . . . . . . . . . . . . . . 345.5.1 Apache Solr . . . . . . . . . . . . . . . . . . . . . . . . 345.5.2 Learning to Rank in Apache Solr . . . . . . . . . . . . 35
6 Discussion 37
7 Conclusions & Future Work 397.1 Conclusions . . . . . . . . . . . . . . . . . . . . . . . . . . . . 397.2 Future Work . . . . . . . . . . . . . . . . . . . . . . . . . . . . 39
7.2.1 Click through analysis . . . . . . . . . . . . . . . . . . 40
A Feature description - MQ2008 41
B Feature description - HP2003 43
C FRank code implementation 46C.1 Frank.java . . . . . . . . . . . . . . . . . . . . . . . . . . . . . 47C.2 FrankWeakRanker.java . . . . . . . . . . . . . . . . . . . . . . 56
D Apache Solr code implementation 57D.1 LearningPlugin.java . . . . . . . . . . . . . . . . . . . . . . . . 57D.2 LearningQuery.java . . . . . . . . . . . . . . . . . . . . . . . . 58
iii
Chapter 1
Introduction
1.1 BackgroundAs available information increases everywhere in a very fast pace, the systemsand models which retrieves this information demands more attention. Thisconstant growing stream of new information has both positive and negativeaspects. A positive aspect is that the user can access information previ-ously not available, information that earlier would have taken long time toaccess. Compare for example searching for information in a traditional li-brary with searching for information in a digital online library, the lattertakes considerably shorter time. But there are also negative aspects with toomuch information, often referred to as information overload. The term wascoined in 1985 by Hiltz and Turoff (1985) and states that more informationnot necessarily is better. The increasing amount of information, not only onthe Internet but everywhere, requires an increased precision in the process ofretrieving this information. It puts more pressure on the actual algorithmsthat is retrieving the information to deliver relevant results. When there ismore information one can also assume that there is more data that is irrel-evant to the user. The term Information Retrieval is defined in Introductionto Information Retrieval by Manning et al. (2008) as:
"Information retrieval (IR) is finding material (usually documents) of anunstructured nature (usually text) that satisfies an information need fromwithin large collections (usually stored on computers)."
This large collection of information (often documents) should be orderedand ranked to satisfy the users demands. A search engine for example or-ders the search results based on the users input query. One complication is
1
that the generated search result may not agree with what the user wants.Two users asking the same query may not be equally happy with the samesearch results, this subjectivity makes the task of ranking the search resultsparticularly hard. The goal with a good ranking system is to improve theuser satisfaction by generating relevant information.
The aim of this thesis is to investigate machine learning methods for ranking,often referred to as learning to rank. Learning to rank has been a hot topicin recent years and a lot of progress has been made in the field of informationretrieval using different machine learning algorithms (Li, 2014).
This thesis is conducted in collaboration with Findwise Gothenburg and theirmotivation for this thesis is that their customers not always are fully satisfiedwith the implementation of search solutions. By researching learning to rank,Findwise wants to be on the front line together with the research communityin information retrieval. Usually when the search results not are satisfyinga number of parameters in the search software can be fine tuned to increasethe relevance, but this is a rather complex and time consuming task. Withlearning to rank this time could be used for more meaningful work.
1.2 PurposeCan machine learning improve standard ranking models by using learningto rank? The standard ranking models are: the BM25 algorithm (Robert-son and Zaragoza, 2009), the Language Model for Information Retrieval(LMIR)(Robertson and Zaragoza, 2009) and the Vector Space Model (VSM)(Melucci, 2009). The hypothesis is that standard ranking models can be im-proved with learning to rank. When this knowledge is established the projectadvances to an implementation part where one of the researched learning torank algorithms gets implemented. Further, an implementation of a learningto rank algorithm can expose possible weaknesses that can be eliminated froma standard ranking model. Advantages as well as disadvantages of learningto rank algorithms can be pointed out and guidelines on how to successfullyimplement a effective ranking model can hopefully be established.
There is a gap in the research as learning to rank is tested only in hugeweb based settings. By testing learning to rank with smaller datasets thisgap can be filled and a new possible area for learning to rank could be identi-fied: enterprise search. Enterprise search usually has smaller amount of datathan web based search. By investigating if learning to rank works good on
2
smaller datasets this thesis finds out if it is possible to get relevant searchresults in enterprise search using learning to rank. Furthermore, the numberof features that can be extracted from the search software is limited. Oftena large number of features is needed and this thesis will try to discover if theranking turns bad when the number of features is limited.
1.3 LimitationsThis thesis investigates already implemented methods with proven function-ality and is not trying to reinvent the wheel. The methods are the top per-formers from different benchmark tests published in various research journalsand books in the field of information retrieval.
1.4 Problem SpecificationThis master thesis project will give answers to the following questions:
• Is enterprise search a suitable area for learning to rank?
• Can learning to rank compete with standard search models in enterprisesearch?
• Is it possible to implement learning to rank in Apache Solr1?
1.5 MethodsThe early stage of the project consist of an information gathering phase toget deeper knowledge of different approaches. This stage of the project triesto localize advantages (and disadvantages) of several different learning torank algorithms. The information gathering focuses on recent research andalgorithms with a proven foundation based on machine learning. This over-all knowledge is valuable to be able to make correct decisions about whichalgorithms that are suitable for implementation. The implementation parthelps to find important things to keep in mind when implementing a customranking model. To make the gathering part of the project successful it isessential to get knowledge about which specific algorithms that works par-ticularly good combined with certain datasets. Potential datasets have beenlocalized such as the Microsoft Learning to Rank Datasets from Microsoft
1http://lucene.apache.org/solr/
3

Research2 and the Yahoo! Learning to Rank Challenge dataset (Chapelleet al., 2011). These datasets are rather big and by shrinking these sets step-wise and limit the numbers of features experiments tries to localize a suitablealgorithm to implement on a "real" dataset. The search server software whichis planned to be used in this project is Apache Solr. Solr is a open-sourcesearch server based on Apache Lucene3, a popular search engine built entirelyin Java.
2http://research.microsoft.com/en-us/projects/mslr/3http://lucene.apache.org/core/
4
Chapter 2
Theory
This chapter is meant to give the reader an in depth explanation of how anumber of common ranking models are implemented. This chapter will alsoget the reader familiar with learning to rank. More specifically, the three mostcommon learning to rank approaches will be explained and strengths andweaknesses in each approach will be pointed out. Two terms essential to knowas preliminaries when approaching literature about information retrieval areprecision and recall. Precision is defined as the number of relevant documentsretrieved out of the total number of documents retrieved for a query. Recallis the number of relevant documents retrieved out of the total number ofrelevant documents in a collection (for a specific query) (Carterette, 2009).Precision and recall are general performance measures of the informationretrieval system (i.e. the search engine) as they measure the number ofrelevant results. To introduce the reader to information retrieval the theorysection will begin with an example: the famous PageRank algorithm which isused in the worlds most common web search engine Google, to rank websitesbased on popularity (Langville and Meyer, 2006).
2.1 PageRankThe PageRank algorithm was developed by the founders of Google1 SergeyBrin and Larry Page, the purpose of the algorithm is to rank web pages basedon popularity. Brin and Page realised that web pages could be represented asgraphs, with nodes as pages and edges as links between the pages. Each webnode has two types of directed edges, in links and out links. If for examplepage A has a link to page B this is represented in the graph as a directededge from node A to node B. A site with many in links is a popular site and
1http://www.google.com/about/company/history/
5
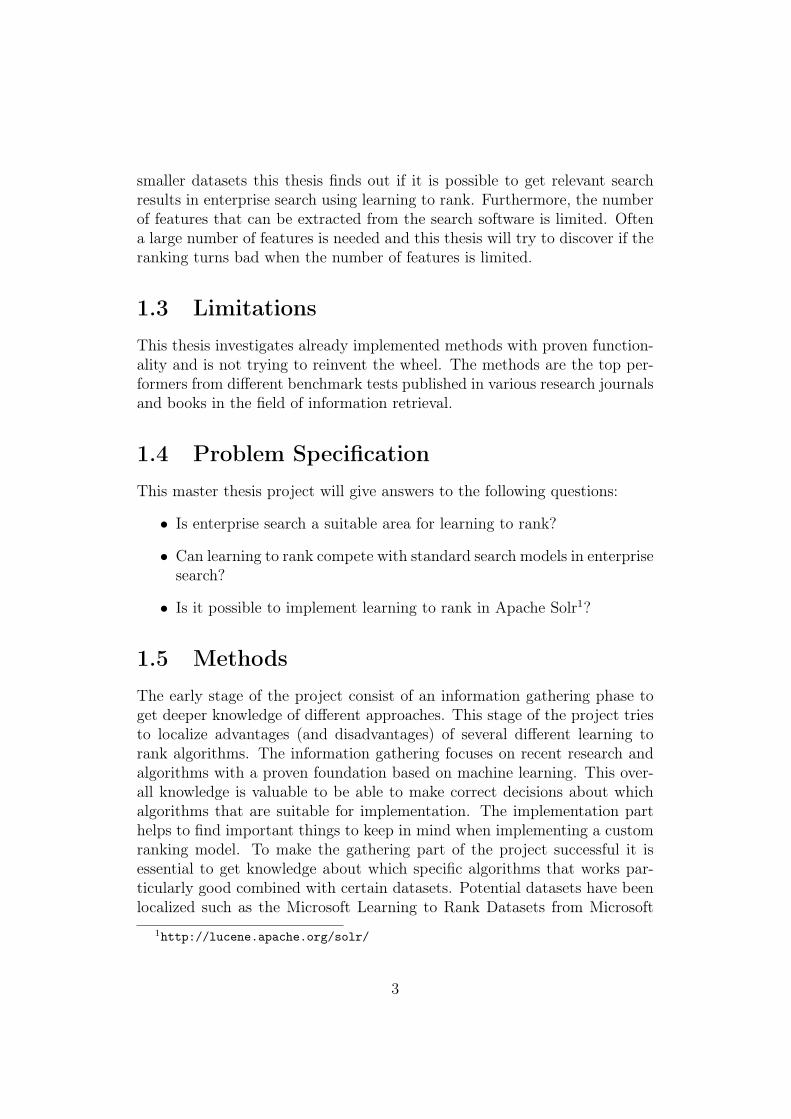
therefore the site should receive a high pagerank score. The score for eachsite in the graph is calculated iteratively and an in link from a popular sitewill contribute with a higher score than a site with only a few in links. Thepagerank score P (Si) for website Si is calculated with the following equation(where n is the current iteration):
Pn+1(Si) =∑
Sj∈M(Si)
Pn(Sj)
L(Sj)
where M(Si) is the set of nodes which have out links to Si and L(Sj) is thenumber of out links from node Sj. Initially all nodes gets the same rank scoreSi = 1/m where m is the total number of nodes. The algorithm iterates untila stable state has been reached and thereafter the web pages are ordered byrank score.
PageRank Example
1 2
34
5
Figure 2.1: Small PageRank example
All nodes gets initialized with rank score S0 = 1/5.
Node Iteration 0 Iteration 1 Iteration 2 Rank after Iteration 2
1 1/5 1/10 1/12 32 1/5 5/30 1/30 43 1/5 13/30 23/60 24 1/5 4/15 14/30 15 1/5 0 0 5
Table 2.1: PageRank score for five nodes after two iterations.
6
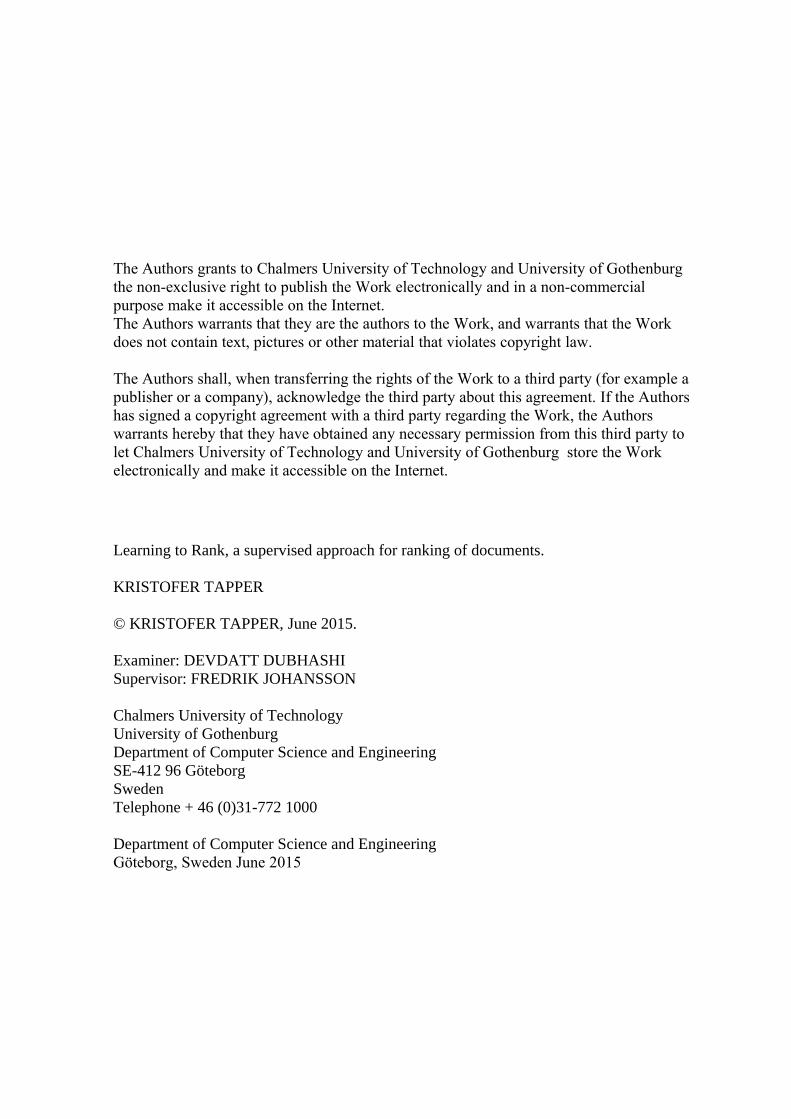
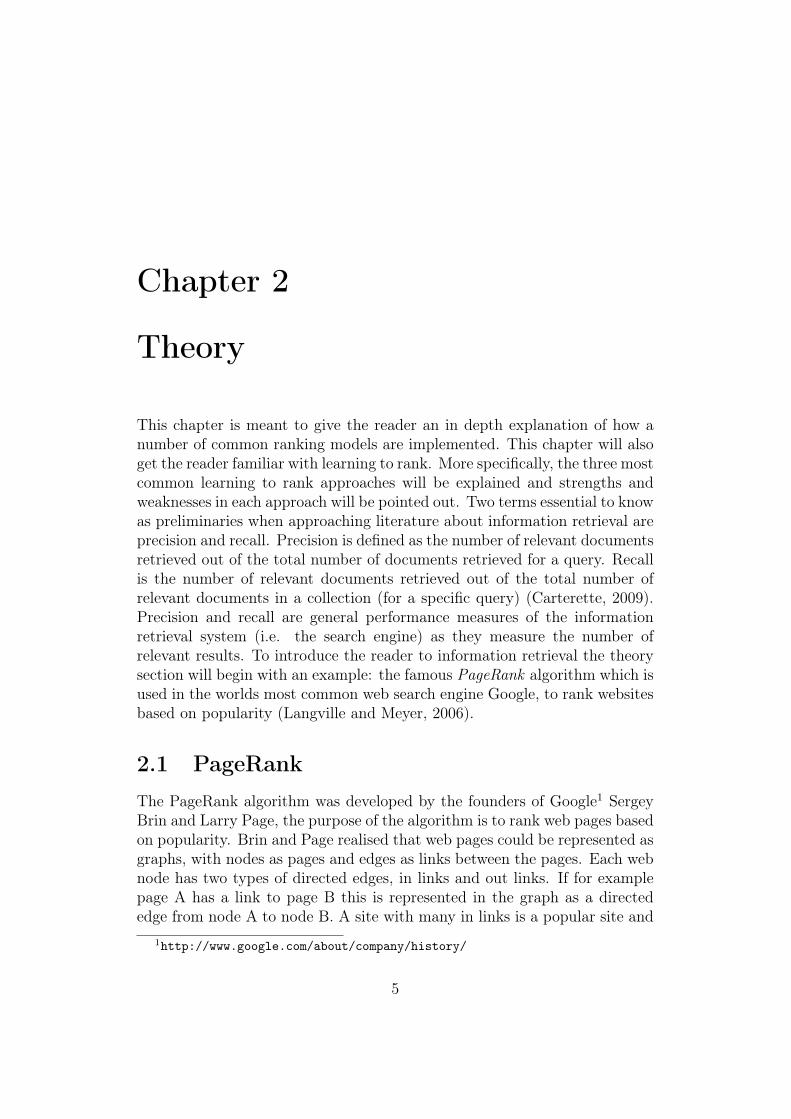
2.2 The ranking modelThe ranking problem is only explained for document retrieval but it stilloccurs in similar forms in several nearby areas such as collaborative filteringand multi-document summarization. The goal is to retrieve the most relevantdocuments ranked in order of relevance, based on the query q. The documentsare retrieved from the collection D. The ranking model is pictured in figure2.2.
Query Ranking System
Search result
search query
ordered documents
documents,D
Figure 2.2: The ranking model for information retrieval.
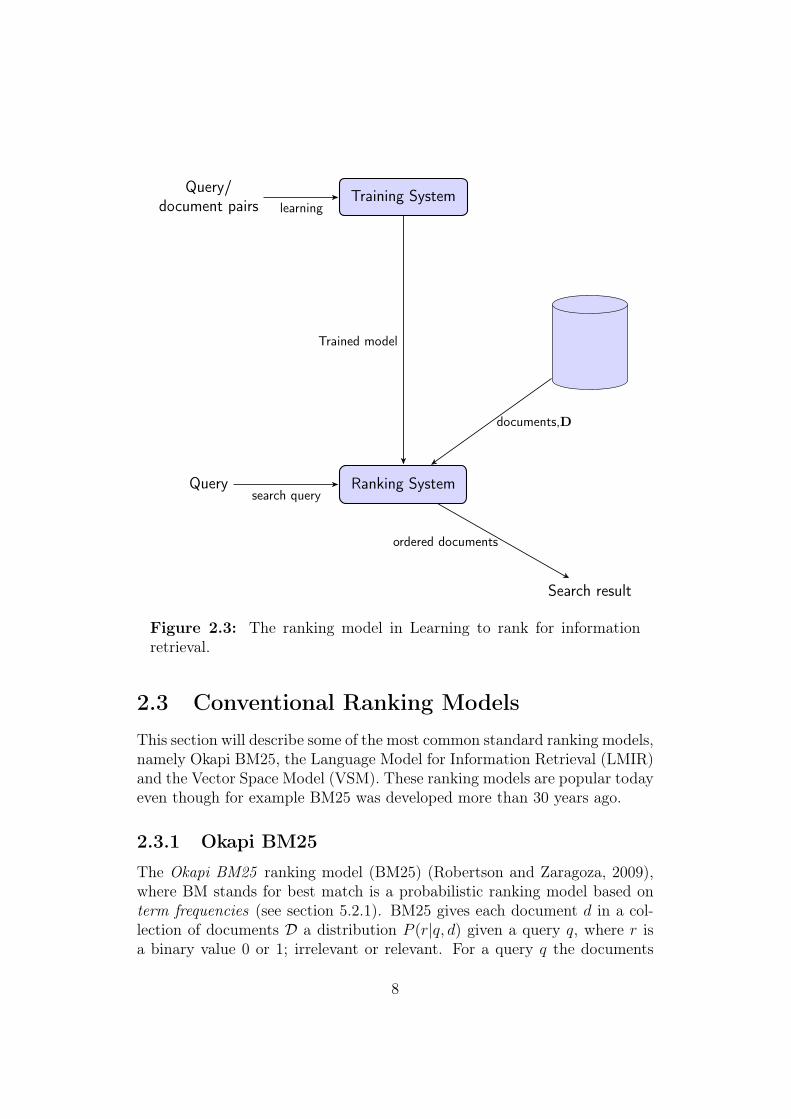
Consider a collection of documents D = d1, d2, ..., dn and a query q, the goalis to let the ranking model f(q,D) permute the order of the documents Dordered with the most relevant results ranked the highest. The top documentcan then be returned and shown as result to the user who executed the query.The ranking model f(q,D) which is responsible for the ordering, can becreated through many different approaches. The machine learning approachlearning to rank train a model and learn a ranking function f(q,D) (see figure2.3). The training data consist of a number of query/document pairs witha relevance label (see sub section 2.4.1). This makes it possible to recognizepatterns which can be utilized to create good ranking function.
7
Query/document pairs
Training System
Query Ranking System
Search result
learning
Trained model
search query
ordered documents
documents,D
Figure 2.3: The ranking model in Learning to rank for informationretrieval.
2.3 Conventional Ranking ModelsThis section will describe some of the most common standard ranking models,namely Okapi BM25, the Language Model for Information Retrieval (LMIR)and the Vector Space Model (VSM). These ranking models are popular todayeven though for example BM25 was developed more than 30 years ago.
2.3.1 Okapi BM25
The Okapi BM25 ranking model (BM25) (Robertson and Zaragoza, 2009),where BM stands for best match is a probabilistic ranking model based onterm frequencies (see section 5.2.1). BM25 gives each document d in a col-lection of documents D a distribution P (r|q, d) given a query q, where r isa binary value 0 or 1; irrelevant or relevant. For a query q the documents
8
with the highest probabilities to be relevant are returned and displayed tothe user. The probability of relevance for a document given a query is theProbability Ranking Principle stated in "The Probability Ranking Principlein IR" by Robertson (1977) as:
"If retrieved documents are ordered by decreasing probability of relevance onthe data available, then the system’s effectiveness is the best that can be ob-tained for the data."
2.3.2 Language Model for Information Retrieval
The Language model for Information Retrieval (LMIR) (Manning et al.,2008) and (Robertson and Zaragoza, 2009) is based on the probability rankingprinciple stated above. The simplest language model is the unigram languagemodel, it calculates a probability distribution over a corpus P (w1, ..., wn),for each document. Every query has its own language model M(d). Givena query, the language model M(d) with the highest probability P (q|M(d))is the language model of the most relevant document. LMIR returns themost relevant documents to the user by calculating the probabilities for alllanguage models for all documents.
2.3.3 Vector Space Model
The vector space model (VSM) described in Introduction to Information Re-trieval by Manning et al. (2008) and in "Vector-space model" by Melucci(2009) is a ranking model in which queries and documents are representedas weight vectors. The idea with VSM is to rank the documents term vec-tors (or more common tfidf vectors) (see sub section 5.2.1) proximity to thequery term vector. The documents proximity to the query is based on thecosine between the document and the query in the vector space. The cosinesimilarity of two vectors is computed by first calculating the norm (l2 norm)of the vectors and then the dot product. The euclidean norm makes thelength of all vectors equal and the cosine gives the similarity. A small anglemeans similar vectors, if for example two identical vectors are compared thecosine will be 0. The equation below shows how the similarity between aterm vector of a document D and a term vector of a query Q is calculated.
cosine(θ) =Q ·D|Q||D|
=
∑ni=1 qi × di√∑n
i=1(qi)2 ×
√∑ni=1(di)
2
9
2.4 Learning to RankIn the described models above the relevant documents could be retrieved bycalculating probabilities given the query, the collection of documents and acorpus. The goal is to now by using different machine learning approachesachieve better ranking models than earlier. Learning to rank has three mainbranches, all of which take a supervised approach to solve the ranking prob-lem. The meaning of a supervised approach is that the algorithms need to betrained and fed with sample data with relevance labels. This training must bedone before the algorithms actually can rank documents without any surveil-lance. In the unsupervised approach training occurs without relevance labels.The three branches, namely the pointwise approach, the pairwise approachand the listwise approach will be described in the next sections. The nextsections will also to point out strengths and weaknesses with each approach.Before the explanation of each approach a brief description of the learning-and test- data representation, used for learning to rank will be given.
2.4.1 Data Representation
Annotated data is needed to be able to train a learning to rank rankingmodel (see figure 2.3). Annotated data is search queries with retrieved doc-uments labeled in accordance to their relevance. These labels comes fromhuman judgement, how well each retrieved document matches what the useris searching for.
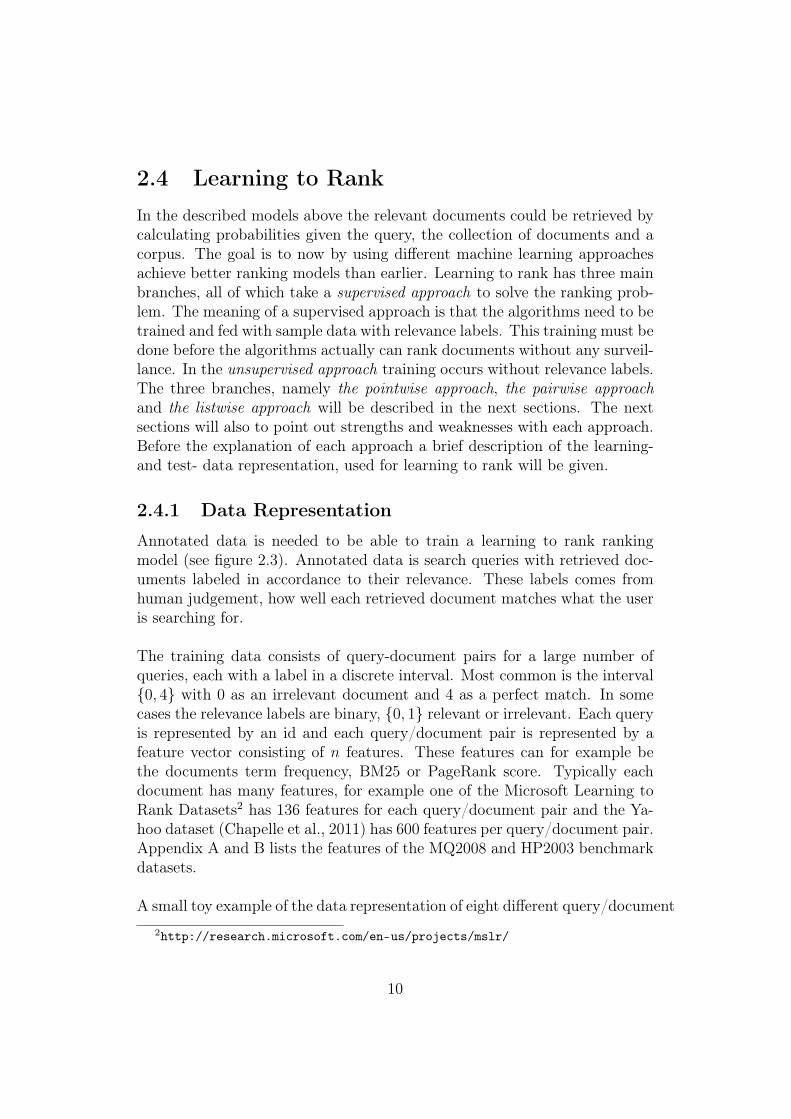
The training data consists of query-document pairs for a large number ofqueries, each with a label in a discrete interval. Most common is the interval{0, 4} with 0 as an irrelevant document and 4 as a perfect match. In somecases the relevance labels are binary, {0, 1} relevant or irrelevant. Each queryis represented by an id and each query/document pair is represented by afeature vector consisting of n features. These features can for example bethe documents term frequency, BM25 or PageRank score. Typically eachdocument has many features, for example one of the Microsoft Learning toRank Datasets2 has 136 features for each query/document pair and the Ya-hoo dataset (Chapelle et al., 2011) has 600 features per query/document pair.Appendix A and B lists the features of the MQ2008 and HP2003 benchmarkdatasets.
A small toy example of the data representation of eight different query/document2http://research.microsoft.com/en-us/projects/mslr/
10
pairs for two different queries with four dimensional feature vectors is shownin table 2.2. Typically the features are normalized.
label qid:id feature vector1 qid:1 1:0.1 2:0.9 3:0.9 4:0.60 qid:1 1:0.1 2:0.8 3:0.9 4:0.63 qid:1 1:0.8 2:0.2 3:0.3 4:0.44 qid:1 1:0.9 2:0.3 3:0.1 4:0.73 qid:2 1:0.7 2:0.4 3:0.2 4:0.12 qid:2 1:0.1 2:0.8 3:1.0 4:0.32 qid:2 1:0.2 2:0.7 3:0.3 4:0.10 qid:2 1:0.4 2:0.6 3:1.0 4:0.2
Table 2.2: Typical data representation of a learning to rank dataset.
2.4.2 The Pointwise Approach
The pointwise approach described by Liu (2011) in Learning to Rank for In-formation Retrieval is considered the most basic learning to rank approach.In the Yahoo! Learning to Rank Challenge (Chapelle et al., 2011) the point-wise approach was outperformed by the pairwise and by the listwise approach.The approach handles each query/document pair separately and tries to pre-dict the correct label for each pair. This is not beneficial, as the approachignores the group structure.
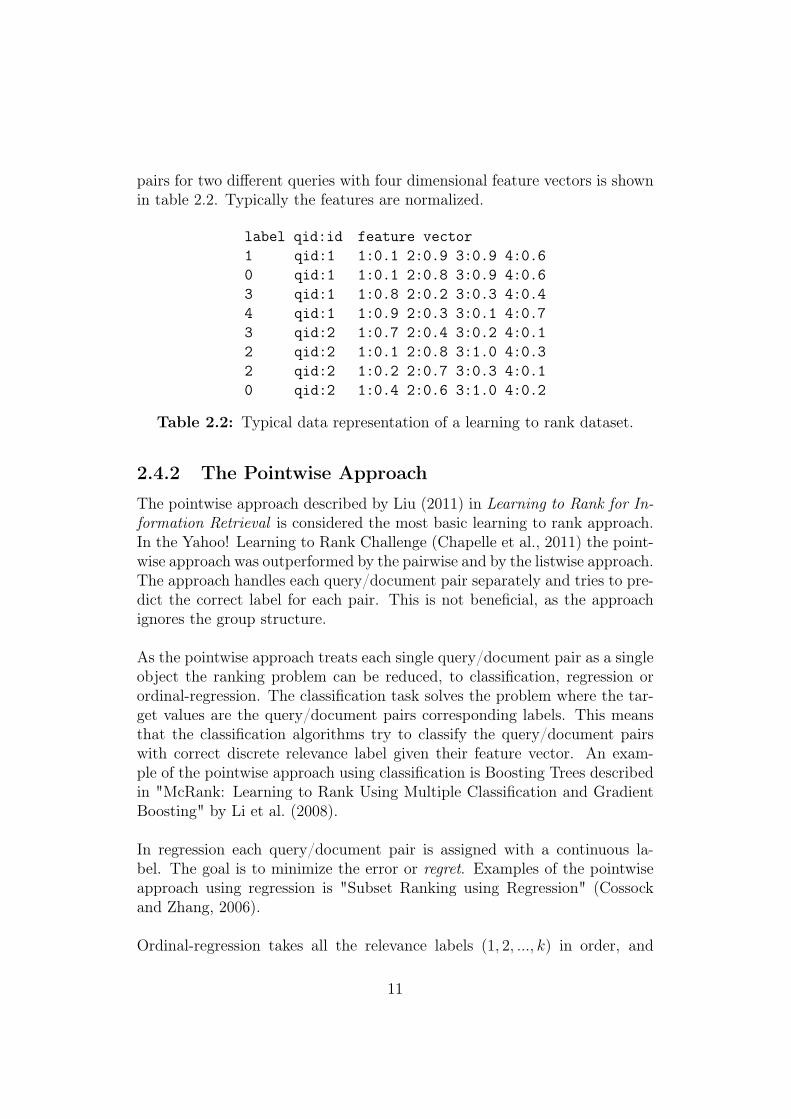
As the pointwise approach treats each single query/document pair as a singleobject the ranking problem can be reduced, to classification, regression orordinal-regression. The classification task solves the problem where the tar-get values are the query/document pairs corresponding labels. This meansthat the classification algorithms try to classify the query/document pairswith correct discrete relevance label given their feature vector. An exam-ple of the pointwise approach using classification is Boosting Trees describedin "McRank: Learning to Rank Using Multiple Classification and GradientBoosting" by Li et al. (2008).
In regression each query/document pair is assigned with a continuous la-bel. The goal is to minimize the error or regret. Examples of the pointwiseapproach using regression is "Subset Ranking using Regression" (Cossockand Zhang, 2006).
Ordinal-regression takes all the relevance labels (1, 2, ..., k) in order, and
11
tries to correctly classify the documents with a function f and thresholdsb1 ≤ b2... ≤ bk−1 where k is the number of labels. The output of the functiongives a label to each document/query pair in a multi classification fashion.An example of ordinal regression is the PRank algorithm (Crammer andSinger, 2001) which uses perceptrons.
2.4.3 The Pairwise Approach
In the pairwise approach (Liu, 2011) two document/query pairs are com-pared, given a query one of the document is more relevant than the other.By doing this reduction to pairwise classification the approach focuses on themaximization of the number of correct classified document pairs. To havea ranking model that correctly can classify all pairs means that the modelalso can rank all the documents correctly. Examples of implementationswith good performance using the pairwise approach for learning to rank isRankNet (Burges et al., 2005) which uses a neural network approach andRankBoost (Freund et al., 2003) which uses boosting.
2.4.4 The Listwise Approach
In the listwise approach (Liu, 2011) the input to the training system consistsof batches of all the documents associated with a certain query. The listwiseapproach utilize the group structure of the training data. The ranking prob-lem becomes an optimization task to generate a permutation of the inputdocuments such that the permutation maximize the score function of choice.This can be seen as equal to minimizing a loss function. The listwise learningto rank algorithms are divided into two categories, minimization of measure-specific loss (maximization of a score function measure such that NDCG,MAP etc.) and minimization of non-measure-specific loss (minimization ofa loss function). Adarank (Xu and Li, 2007) is a listwise approach in theminimization of non-measure-specific loss category.
12
Chapter 3
Related Work
3.1 RankLibRankLib (Dang, 2011) is a library with several learning to rank algorithmsimplemented. RankLib is part of an open source project called The LemurProject1 which contains different search software. The Indri search engineis probably the best known from the Lemur Project. The Lemur Projectis widely used in information retrieval research projects and in commercialproducts. RankLib is written in Java and the algorithms listed in table 3.1are implemented in the current version (2.4).
Algorithm Approach
MART (Gradient boosted regression tree) PointwiseRandom Forests PointwiseRankBoost PairwiseRankNet PairwiseLambdaMART PairwiseAdaRank ListwiseCoordinate Ascent ListwiseListNet Listwise
Table 3.1: Algorithms implemented in RankLib version 2.4
In addition to these learning to rank algorithms RankLib contains differentscore functions and evaluation tools to test and validate trained models. Themetrics for evaluation supported in the current version are: MAP, NDCG@k,
1http://www.lemurproject.org/
13
DCG@k, P@k, RR@k and ERR@k (see section 5.2 for a description of NDCGand DCG). K-fold cross-validation is available to predict the performance andfeatures can be selected to specify which features to include for training ofthe model. Both models and scores can be saved to file and saved models canbe loaded to re-rank new documents. The rest of this chapter will give briefexplanations of the algorithms in RankLib version 2.4. For the interestedreader further reading and implementation details of each algorithm can befound in the paper referred to in each section.
Figure 3.1: The Lemur Project logo
3.1.1 MART
The MART algorithm (Multiple Additive Regression Trees) is based on thetheory in "Greedy Function Approximation: A Gradient Boosting Machine"by Friedman (2000). MART is a pointwise approach and it is also knownas Gradient Boosting Regression Trees. MART is a boosting technique (itcombines weak rankers to form a strong ranker) combined with gradientdescent.
3.1.2 RankNet
RankNet is a pairwise approach described in "Learning to Rank Using Gra-dient Descent" by Burges et al. (2005). RankNet is using a neural networkcombined with gradient descent steps to control the learning rate in eachiteration step. The neural network has two hidden layers and uses backprop-agation to minimize a cost function to perform the pairwise ranking. Theprobabilistic framework in FRank (see chapter 4) is based on the probabilisticframework in RankNet.
3.1.3 RankBoost
RankBoost (Freund et al., 2003) is a pairwise technique based on boosting.RankBoost operates in rounds and choose the feature in each round thatminimizes a loss function. FRank (chapter 4) is to a large degree basedon RankBoost, as the additive model of weak rankers for learning to rank
14
in FRank is taken from RankBoost. Further the threshold values used inFRank is also adapted from RankBoost.
3.1.4 AdaRank
AdaRank is based on the paper "AdaRank: A Boosting Algorithm for In-formation Retrieval" by Xu and Li (2007). AdaRank is another boostingtechnique which combines weak rankers to create the ranking function. Thealgorithm is inspired by AdaBoost or "Adaptive Boosting" (Schapire, 1999),a well recognized machine learning algorithm. AdaRank takes the listwiseapproach to the learning to rank problem and tries to minimize the perfor-mance measures directly instead of indirect minimization of a loss functionas the similar algorithms above.
3.1.5 Coordinate Ascent
The Coordinate Ascent method is described as an optimization method inthe paper "Linear Feature-Based Models for Information Retrieval" by Met-zler and Bruce Croft (2007). The method optimize through minimization ofmeasure-specific loss, more specifically the mean average precision (MAP).The Coordinate Ascent suffer from getting stuck in local minimas, whensearching for the global minima of the MAP, but by doing a number ofrestarts (typically 10) this can be avoided.
3.1.6 LambdaMART
LambdaMART described in "Adapting Boosting for Information RetrievalMeasures" by Wu et al. (2010) is an ensemble method consisting of boostedregression trees (MART) (Friedman, 2000) in combination with LambdaRank(Burges et al., 2006). LambdaRank is a neural network algorithm for learn-ing to rank with the same basic idea as RankNet (backpropagation to mini-mize a loss function). LambdaRank’s loss function is meant as an upgradedversion of the loss function in RankNet with faster running time and bet-ter performance on measures. The authors of LambdaRank points out thattheir algorithm could be combined with boosted trees. The developers of theLambdaMART algorithm implemented an algorithm that does what Burgeset al. (2006) did advice.
15
3.1.7 ListNet
ListNet is an algorithm in RankLib from the paper "Learning to Rank: FromPairwise Approach to Listwise Approach" by Cao et al. (2007). ListNet isusing a neural network approach with gradient descent to minimize a lossfunction, similar to RankNet. ListNet differs from RankNet as the methoduses the listwise approach instead of the pairwise approach taken in RankNet.In this way ListNet tries to utilize the benefits of the group structure of thetraining data.
3.1.8 Random Forests
The Random Forests (Breiman, 2001) is an ensemble of decision trees. Ineach decision tree a random subset space of the data is selected to create thetree. The left out data is then tested on the tree and the out of bag dataerror (OOB error) is calculated (similar to cross validation). The tree withthe lowest error is then chosen as the ranking model. The left out data isusually around 1/3 of the data size and the subsets are chosen randomly foreach new tree.
3.1.9 Linear Regression
It is not mentioned in the RankLib wiki but there is an implementationof linear regression in the source code of RankLib. The implementation ispointwise and the goal is to find a regression line that separates and classifiesthe documents. The way the RankLib implementation does this is throughthe least-squares method (Lawson and Hanson, 1995).
16
Chapter 4
Fidelity Loss Ranking
As RankLib is the best known learning to rank library the decision wasmade to support RankLib by addition of a yet unimplemented algorithm.The choice of algorithm to implement was based on which algorithms thatare popular, have proven performance and yet is unimplemented in RankLib.The performance measures of the benchmark datasets in Learning to Rankfor Information Retrieval and Natural Language Processing by Li (2014) andthe Yahoo! Learning to Rank Challenge results (Chapelle et al., 2011) showedthat one of the top algorithms from the comparisons was missing in RankLib,Fidelity Loss ranking (FRank) (Tsai et al., 2007).
FRank is a pairwise approach developed by Tsai et al. at Microsoft Re-search who claims in "FRank: A Ranking Method with Fidelity Loss" (Tsaiet al., 2007) that "The FRank algorithm performs effectively in small train-ing datasets...". This was the main reason why this algorithm was chosen forimplementation as the size of the training data often is limited in enterprisesearch solutions.
The theoretical approach of FRank is to combine the probabilistic frame-work of RankNet (Burges et al., 2005) and the additive boosting approachin RankBoost (Freund et al., 2003). A bit simplified FRank is trying tocombine a number of weak rankers to get a good ranking function. A weakranker is a function that classifies a document by just looking at one feature.By looking at many different weak rankers and then choose the one in eachiteration giving rise to the minimal fidelity loss, the weak rankers is combinedto create a ranking function.
17
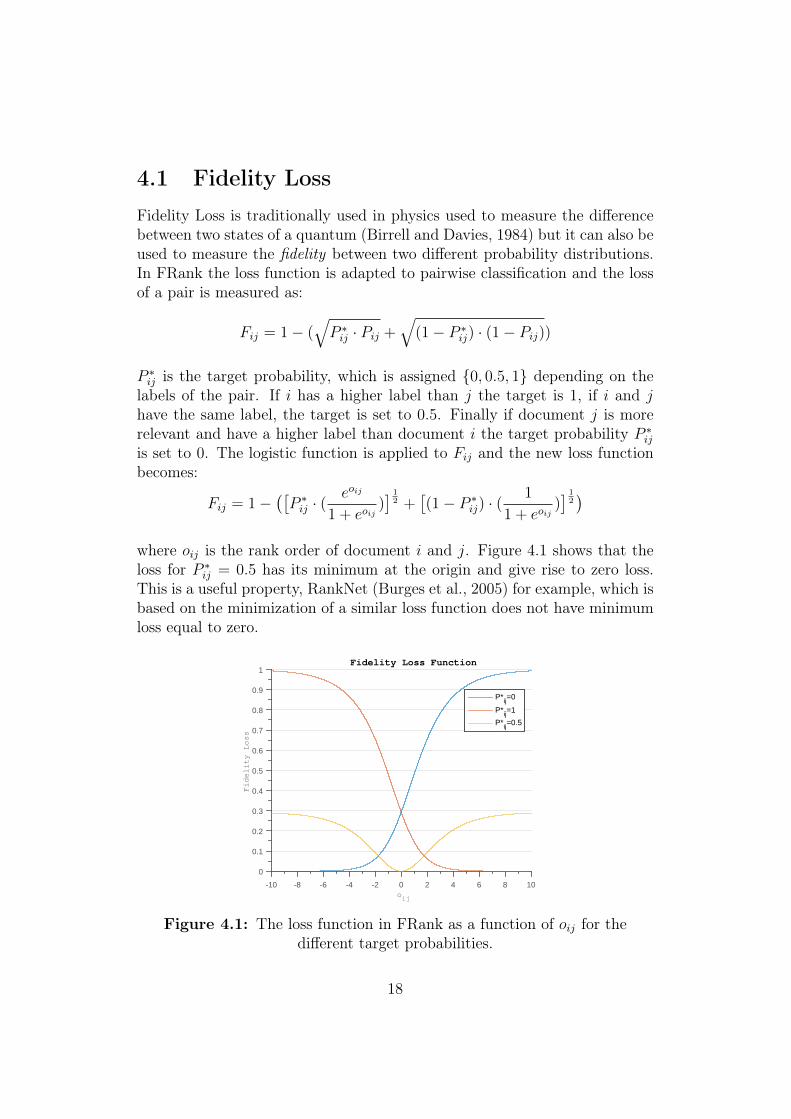
4.1 Fidelity LossFidelity Loss is traditionally used in physics used to measure the differencebetween two states of a quantum (Birrell and Davies, 1984) but it can also beused to measure the fidelity between two different probability distributions.In FRank the loss function is adapted to pairwise classification and the lossof a pair is measured as:
Fij = 1− (√P ∗ij · Pij +
√(1− P ∗ij) · (1− Pij))
P ∗ij is the target probability, which is assigned {0, 0.5, 1} depending on thelabels of the pair. If i has a higher label than j the target is 1, if i and jhave the same label, the target is set to 0.5. Finally if document j is morerelevant and have a higher label than document i the target probability P ∗ijis set to 0. The logistic function is applied to Fij and the new loss functionbecomes:
Fij = 1−([P ∗ij · (
eoij
1 + eoij)] 1
2 +[(1− P ∗ij) · (
1
1 + eoij)] 1
2)
where oij is the rank order of document i and j. Figure 4.1 shows that theloss for P ∗ij = 0.5 has its minimum at the origin and give rise to zero loss.This is a useful property, RankNet (Burges et al., 2005) for example, which isbased on the minimization of a similar loss function does not have minimumloss equal to zero.
oij
-10 -8 -6 -4 -2 0 2 4 6 8 10
Fidelity Loss
0
0.1
0.2
0.3
0.4
0.5
0.6
0.7
0.8
0.9
1Fidelity Loss Function
P*ij=0
P*ij=1
P*ij=0.5
Figure 4.1: The loss function in FRank as a function of oij for thedifferent target probabilities.
18
4.2 Algorithm descriptionThe goal is to construct the ranker function H(x) as a combination of weakrankers h(x) and corresponding weights α at each iteration t:
H(x) =∑t
αtht(x)
where ht and αt denotes the weak ranker and the corresponding weight foundat each iteration. In FRank the weak ranker ht(x) is binary, each feature ofeach document is compared to a threshold value, and are assigned either 0or 1. The threshold value can be chosen in different ways, for example manydifferent thresholds for each feature can be used and create several weakrankers and then pick the values with best performance. As the documentsoften have a large number of features to pick from (typically above 40 fea-tures) only one threshold is chosen for each feature in this implementationto keep down the running time. The idea of binary thresholds is adaptedfrom RankBoost (Freund et al., 2003) which also uses the same type of bi-nary classifiers as FRank. In this implementation each threshold is randomlychosen for each feature from a feature value.
The ranking function is constructed by in each iteration choosing the weightat which minimize the Fidelity Loss. The Fidelity Loss J over the rankingfunction Hk is defined as:
J(Hk) =∑q
1
|#q|∑ij
F(k)ij
The first sum is a weight for each document pair where q is the total numberof documents for a query. This will make all queries equally important andnot bias a query because it got a large number of document pairs. From nowon this weight is denoted D(i, j) for a document pair i, j.
D(i, j) =1
|#q|
With the formula for the fidelity loss in addition to D(i, j) we get the follow-ing equation for the loss:
J(Hk) =
=∑ij
D(i, j)·(1−[P ∗ij ·(
eHi,jk−1+αkh
i,jk
1 + eHi,jk−1+αkh
i,jk
)] 1
2 +[(1−P ∗ij)·(
1
1 + eHi,jk−1+αkh
i,jk
)] 1
2
)19
wherehi,jk , hk(xi)− hk(xj)
Because the weak rankers only can have the values 0 or 1, the pairwise rankerhi,jk can take the values {−1, 0, 1} this means that the derivation of the fi-delity loss can be simplified as described in Tsai et al. (2007), to obtain thefollowing expression for the weight αk:
αk =1
2ln
∑hi,jk =1W
i,j∑hi,jk =−1W
i,j
W i,j are the pairwise weights initially set to D(i, j) and updated as followingin each iteration k:
W i,jk = D(i, j) ·
((P ∗ije
Hi,jk−1)
12 − eH
i,jk−1(1− P ∗ij)
12
(1 + eHi,jk−1)
32
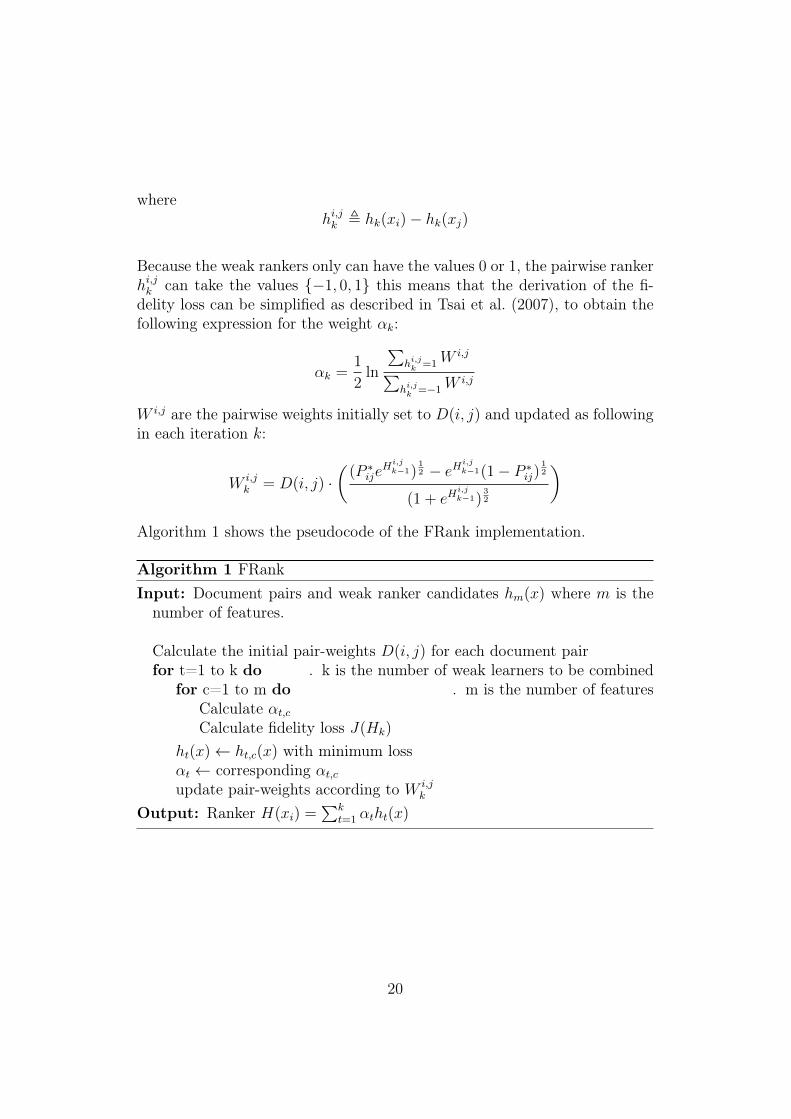
)Algorithm 1 shows the pseudocode of the FRank implementation.
Algorithm 1 FRankInput: Document pairs and weak ranker candidates hm(x) where m is thenumber of features.
Calculate the initial pair-weights D(i, j) for each document pairfor t=1 to k do . k is the number of weak learners to be combined
for c=1 to m do . m is the number of featuresCalculate αt,cCalculate fidelity loss J(Hk)
ht(x)← ht,c(x) with minimum lossαt ← corresponding αt,cupdate pair-weights according to W i,j
k
Output: Ranker H(xi) =∑k
t=1 αtht(x)
20
Chapter 5
Experiments
This section displays the results of the tests ran on the algorithms in RankLiband FRank. The test setup, the score metric and the benchmark datasetsare described. This section also describes the started work of implementinglearning to rank in Apache Solr.
5.1 Experimental SetupThe main goal with the comparisons was to see if one or several algorithmscould perform well when the training data was limited. This is interesting asthe algorithms in RankLib usually have very large training sets (the case inthe benchmark datasets) which not is easy to create in an enterprise searchsolution. As the number of extractable features from Solr is limited the com-parisons also include tests with the features that can be extracted from Solr.These tests are included to see if this ranking works as good as in a webbased setting with more features per document. The top 3 and top 5 resultswas identified as good numbers of hits to consider relevant.
To be able to draw sensible conclusions from the tests, two baseline algo-rithms were included in the test runs. Linear Regression was the first methodincluded as it is a simple and more straightforward approach compared tothe other algorithms in RankLib. It is valuable to see if and how much betterthe more advanced approaches perform on the benchmark tests. The secondbaseline algorithm is just random ordering of the documents. The motivationto include this is that the scores of the other algorithms will be more intuitivewhen they can be related to the score of the random ordering. As the testsets are scaled down the hypothesis is that the score of the RankLib algo-rithms eventually will decrease and converge with the score of the random
21
algorithm.
5.2 Definitions & Score MetricsThis sub section describes some common information retrieval definitions andthe score metric used in the experiments to measure the performance of thelearning to rank algorithms.
5.2.1 Common Definitions in Information Retrieval
In the introduction to the theory chapter two key terms in information re-trieval were introduced: precision and recall (Carterette, 2009). Just torecall, precision is a probability measure of how likely it is that a randomchosen document out of all of the documents in the search result is relevant.Recall is a probability measure of how likely it is that a random chosen rele-vant document is in the search result. Precision and recall are more preciselydefined with the following definitions:
Precision =RelevantDocuments ∩RetrievedDocuments
RetrievedDocuments
Recall =RelevantDocuments ∩RetrievedDocuments
RelevantDocuments
Often only the top n results are of concern, this is notated as Precision@nor P@n. @n notation is intuitive; for example in a web search engine oneprobably never is concerned with all the retrieved search hits. Seldom morethan the first page of search results is of interest.
Three other terms more related to the technical aspects of the search areterm frequency (tf), inverse document frequency (idf) and term frequency -inverse document frequency (tf-idf) (Manning et al., 2008). The tf is thenumber of times a specific word occurs in a document. This is usually calcu-lated for all words in the corpus, with stop words removed. A corpus is a setof words, for example all word in a specific language. Stop words are smallwords (’at’, ’in’, ’this’ etc.) that are removed because they do not reflectthe content and to make the statistical measures useful. In the tf model thedocuments marked as relevant will simply be the documents with the mostfrequent occurrences of the word/s in the search query. In the bag of words
22
model documents are represented by the terms they contain and the corre-sponding term frequencies.
The idf is as the name implies the inverse of the document frequency. Thedocument frequency for a term t is the number of documents in the collectionof documents D which contains the term. The purpose of the inverse doc-ument frequency is to weigh uncommon terms more heavily than commonterms. As an example, think of a collection of economics articles, a searchquery "car finance" will weight "car" much higher than "finance" if the term"finance" is in nearly every economics article and the term "car" is uncom-mon among the articles in the collection. The inverse document frequency iscalculated for each term in the query as:
idf =|D|
log(df)
The scale of the logarithm above can be tuned for the purpose depending onhow much one want to boost rare terms.
The tf-idf is meant as an improved version of the term frequency, as some-times the search results will not be very precise with all terms equally weighted.By combining the inverse document frequency with the term frequency a goodcomposition of two models is obtained. The tf-idf is calculated for each termin the query as:
tfidf = tf · idf
A high tf-idf score indicates that the term is frequent in a few documents andif the term gets less frequent or more distributed over documents the scorewill drop.
5.2.2 Discounted Cumulative Gain
One of the most common methods to measure the relevance of a search re-sult with is the Discounted Cumulative Gain (DCG) (Li, 2014). The notationDCG@n is used where n is the top number of results taken into considera-tion. The score is based on the intuition that in a good ranking system thedocuments with the highest labels will be ranked the highest. With DCGlower search results will contribute less and less to the total score. DCG iscalculated with the following equation:
23
DCG@n =n∑i=1
2reli − 1
log2(i+ 1)
where reli is the relevance label of document number i in the ordered resultlist. DCG is often normalized and becomes the score metric called Normal-ized Discounted Cumulative Gain (NDCG) (Manning et al., 2008). NDCGis measured as the DCG divided with the Ideal Discounted Cumulative Gain(IDGC). The IDGC is the maximum score a ranked search results possiblycan get, i.e. the optimal ordering of the results.
NDCG@n =DCG@n
IDCG@n
As an illustrating example we calculate the DCG, IDCG and NDCG (@4) forthe query with id 1 from Table 2.2. We assume that an imaginary rankingfunction has ranked the relevance of the documents for query 1 with the rel-evance in the following decreasing order: {4 � 1 � 3 � 2} with row numberas document number. The symbol � represent ordering, d1 � d2 means thatd1 is ranked higher than d2. This gives the DCG score:
DCG@4 =24 − 1
log2(1 + 1)+
21 − 1
log2(2 + 1)+
23 − 1
log2(3 + 1)+
20 − 1
log2(4 + 1)= 19.13
the IDCG score (for {4 � 3 � 1 � 2}):
IDCG@4 =24 − 1
log2(1 + 1)+
23 − 1
log2(2 + 1)+
21 − 1
log2(3 + 1)+
20 − 1
log2(4 + 1)= 19.92
and finally the NDCG score:
NDCG@4 =19.13
19.92= 0.97
5.3 Benchmark DatasetsThe idea behind using benchmark datasets is to let the developers focuson the development of algorithms instead of the gathering of and set up ofgood data. To find and pre-process data can be very time consuming if nodata is available and benchmark datasets can save a lot of time. Benchmarkdatasets also brings justice to comparisons of algorithms as the developers
24
can not construct a dataset designed specifically for their algorithm. A pos-sible drawback with benchmark datasets is that the developers design analgorithm exclusively for performance on a certain dataset with a poor gen-eral performance.
5.3.1 Preprocessing of data
As described in "LETOR: A Benchmark Collection for Research on Learningto Rank for Information Retrieval" by Qin et al. (2010) there are four mainpreprocessing steps to get useful training data; selecting corpora, samplingof documents, extracting features and extracting metadata. The Gov1 andGov22 datasets were the chosen corpora in the benchmark datasets. TheGov and Gov2 datasets are publicly available and they are common in dif-ferent measurements of information retrieval implementations. The datasetsare usually very large and as 25 million queries were not needed to createa training set a subset was chosen (the sampling of documents step). Thethird preprocessing step (the feature extraction part), must be seen as themost important step as the features to represent each query/document pairare chosen. The number of features varies a lot between different benchmarkdatasets and the decision must be made which of the features that are ofinterest to create a useful benchmark set. The features extracted into theLETOR datasets was selected with the main goals to include the "classicalinformation retrieval features" (such as tf, idf and tfidf) and choose featuresoften represented in SIGIR3 (Special Interest Group on Informaition Re-trieval) papers. The last step, extraction of metadata, is done to be ableto tune the dataset. A few examples of metadata (stored in XML) are thenumber of documents, the length of term vectors and the values of the pa-rameters for the features from the BM25 and the LMIR model. Furthermoresome of the features in the benchmark datasets are only document dependentsuch as document length, some are only query dependent such as idf but themost of the features are both query and document dependent.
5.3.2 MQ2008
The Million Query 2008 dataset (MQ2008) is a benchmark dataset from theLETOR 4.0 package (Qin and Liu, 2013). MQ2008 is created by MicrosoftResearch Asia and the data is coming from the Million Query track from
1http://ir.dcs.gla.ac.uk/test_collections/govinfo.html2http://ir.dcs.gla.ac.uk/test_collections/gov2-summary.htm3http://sigir.org/
25
TREC 20084. The dataset consists of 784 queries from the Gov2 web pagecollection, Gov2 is a huge collection of approximately 25 million web pagesdistributed by University of Glasgow. Each query/document pair is repre-sented by a 46 dimensional feature vector, see appendix A for a description ofthese features. In total there are 15211 query/document pairs in the MQ2008dataset.
5.3.3 HP2003
The second benchmark dataset used in this thesis is the Homepage finding2003 dataset (HP2003) from the Gov collection (the precursor to Gov2).HP2003 is bigger than MQ2008 in terms of document/query pairs, it con-tains 147606 query/document pairs but only 150 queries. The documents inthe Gov collection contains more features than the documents in Gov2, 64dimensional feature vectors instead of 46 dimensional. See Appendix B for adescription of the features in the HP2003 dataset. It is beneficial to see andanalyse how the results differs in this type of dataset compared to MQ2008.
5.4 Comparison between the algorithms inRankLib
5.4.1 MQ2008 test results
The first tests were carried out on the MQ2008 dataset. The testing consistedof 5-fold cross-validation and the tables with corresponding plots shows theaverage results of the testing (5-fold cross-validation) for all of the algorithmsin RankLib. The results from three different categories of tests are presented:NDCG@3 score, NDCG@5 score and NDCG@3 score with a limited numberof features.
Table 5.1 and figure 5.1 shows the results of the NDCG@3 measure. Theresults shows that the neural network approaches in ListNet and RankNethad the worst performance (except for Random). This can be due to that acouple of parameters needs to be fine tuned in these algorithms, but for thetests all of the methods ran out of the box with default parameter values. Byinspecting the plots in figure 5.1 the results of the top algorithms appears tohave very similar performance, with no clear winner.
4http://trec.nist.gov/tracks.html
26
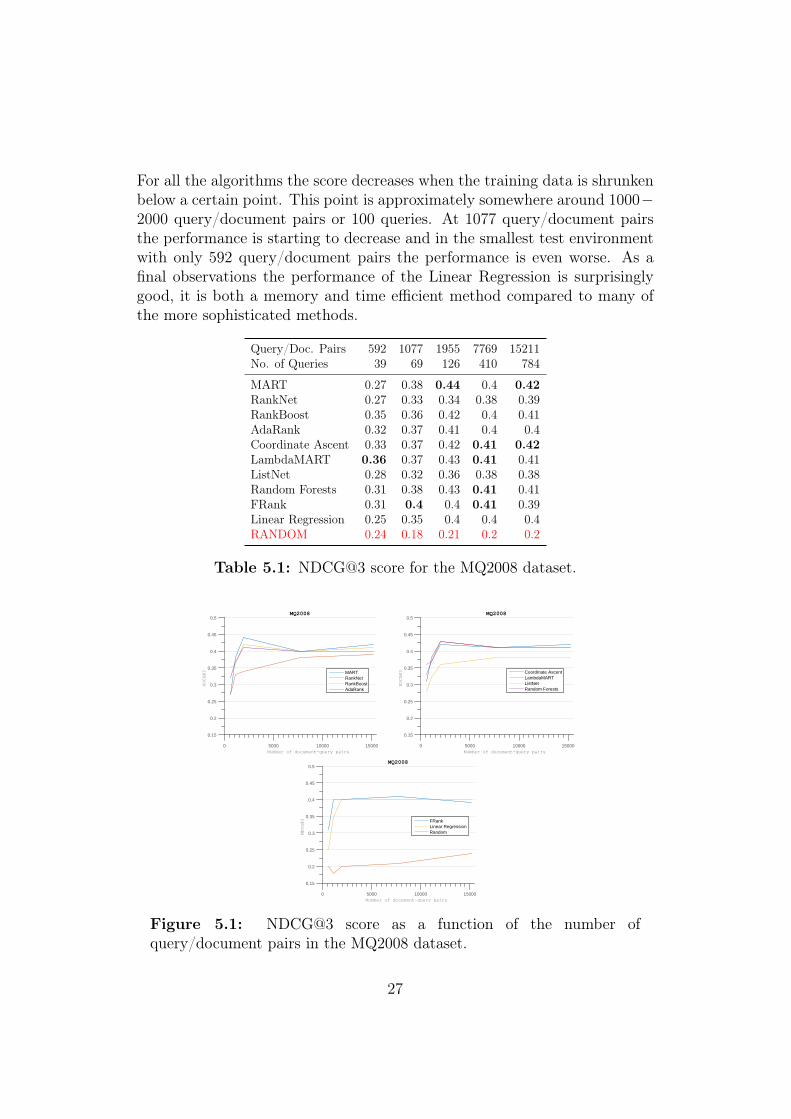
For all the algorithms the score decreases when the training data is shrunkenbelow a certain point. This point is approximately somewhere around 1000−2000 query/document pairs or 100 queries. At 1077 query/document pairsthe performance is starting to decrease and in the smallest test environmentwith only 592 query/document pairs the performance is even worse. As afinal observations the performance of the Linear Regression is surprisinglygood, it is both a memory and time efficient method compared to many ofthe more sophisticated methods.
Query/Doc. Pairs 592 1077 1955 7769 15211No. of Queries 39 69 126 410 784
MART 0.27 0.38 0.44 0.4 0.42RankNet 0.27 0.33 0.34 0.38 0.39RankBoost 0.35 0.36 0.42 0.4 0.41AdaRank 0.32 0.37 0.41 0.4 0.4Coordinate Ascent 0.33 0.37 0.42 0.41 0.42LambdaMART 0.36 0.37 0.43 0.41 0.41ListNet 0.28 0.32 0.36 0.38 0.38Random Forests 0.31 0.38 0.43 0.41 0.41FRank 0.31 0.4 0.4 0.41 0.39Linear Regression 0.25 0.35 0.4 0.4 0.4RANDOM 0.24 0.18 0.21 0.2 0.2
Table 5.1: NDCG@3 score for the MQ2008 dataset.
Number of document-query pairs0 5000 10000 15000
NDCG@3
0.15
0.2
0.25
0.3
0.35
0.4
0.45
0.5MQ2008
MARTRankNetRankBoostAdaRank
Number of document-query pairs0 5000 10000 15000
NDCG@3
0.15
0.2
0.25
0.3
0.35
0.4
0.45
0.5MQ2008
Coordinate AscentLambdaMARTListNetRandom Forests
Number of document-query pairs0 5000 10000 15000
NDCG@3
0.15
0.2
0.25
0.3
0.35
0.4
0.45
0.5MQ2008
FRankLinear RegressionRandom
Figure 5.1: NDCG@3 score as a function of the number ofquery/document pairs in the MQ2008 dataset.
27
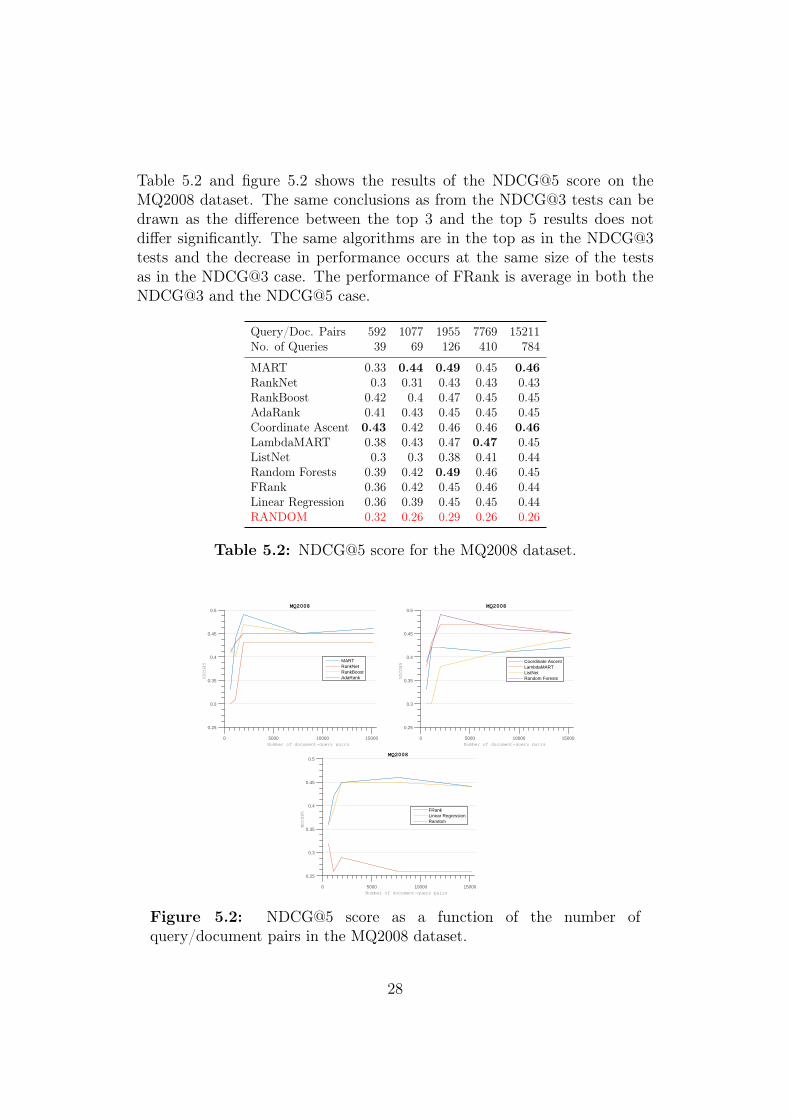
Table 5.2 and figure 5.2 shows the results of the NDCG@5 score on theMQ2008 dataset. The same conclusions as from the NDCG@3 tests can bedrawn as the difference between the top 3 and the top 5 results does notdiffer significantly. The same algorithms are in the top as in the NDCG@3tests and the decrease in performance occurs at the same size of the testsas in the NDCG@3 case. The performance of FRank is average in both theNDCG@3 and the NDCG@5 case.
Query/Doc. Pairs 592 1077 1955 7769 15211No. of Queries 39 69 126 410 784
MART 0.33 0.44 0.49 0.45 0.46RankNet 0.3 0.31 0.43 0.43 0.43RankBoost 0.42 0.4 0.47 0.45 0.45AdaRank 0.41 0.43 0.45 0.45 0.45Coordinate Ascent 0.43 0.42 0.46 0.46 0.46LambdaMART 0.38 0.43 0.47 0.47 0.45ListNet 0.3 0.3 0.38 0.41 0.44Random Forests 0.39 0.42 0.49 0.46 0.45FRank 0.36 0.42 0.45 0.46 0.44Linear Regression 0.36 0.39 0.45 0.45 0.44RANDOM 0.32 0.26 0.29 0.26 0.26
Table 5.2: NDCG@5 score for the MQ2008 dataset.
Number of document-query pairs0 5000 10000 15000
NDCG@5
0.25
0.3
0.35
0.4
0.45
0.5MQ2008
MARTRankNetRankBoostAdaRank
Number of document-query pairs0 5000 10000 15000
NDCG@5
0.25
0.3
0.35
0.4
0.45
0.5MQ2008
Coordinate AscentLambdaMARTListNetRandom Forests
Number of document-query pairs0 5000 10000 15000
NDCG@5
0.25
0.3
0.35
0.4
0.45
0.5MQ2008
FRankLinear RegressionRandom
Figure 5.2: NDCG@5 score as a function of the number ofquery/document pairs in the MQ2008 dataset.
28
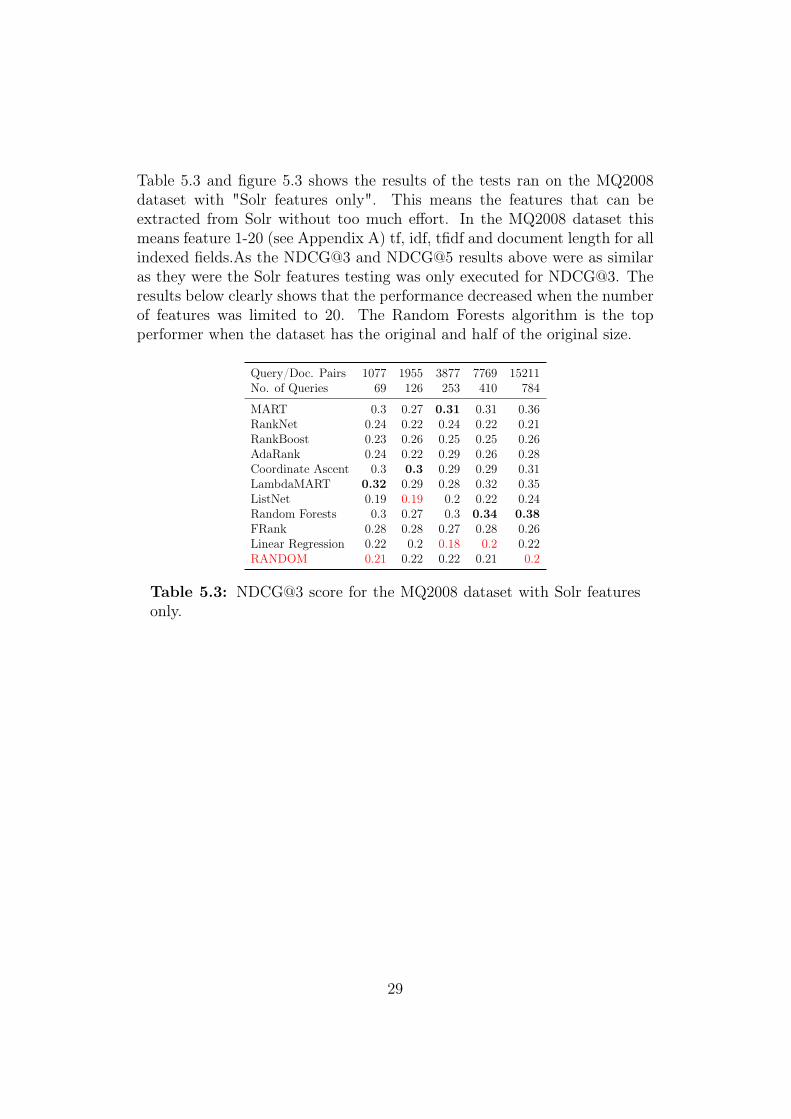
Table 5.3 and figure 5.3 shows the results of the tests ran on the MQ2008dataset with "Solr features only". This means the features that can beextracted from Solr without too much effort. In the MQ2008 dataset thismeans feature 1-20 (see Appendix A) tf, idf, tfidf and document length for allindexed fields.As the NDCG@3 and NDCG@5 results above were as similaras they were the Solr features testing was only executed for NDCG@3. Theresults below clearly shows that the performance decreased when the numberof features was limited to 20. The Random Forests algorithm is the topperformer when the dataset has the original and half of the original size.
Query/Doc. Pairs 1077 1955 3877 7769 15211No. of Queries 69 126 253 410 784
MART 0.3 0.27 0.31 0.31 0.36RankNet 0.24 0.22 0.24 0.22 0.21RankBoost 0.23 0.26 0.25 0.25 0.26AdaRank 0.24 0.22 0.29 0.26 0.28Coordinate Ascent 0.3 0.3 0.29 0.29 0.31LambdaMART 0.32 0.29 0.28 0.32 0.35ListNet 0.19 0.19 0.2 0.22 0.24Random Forests 0.3 0.27 0.3 0.34 0.38FRank 0.28 0.28 0.27 0.28 0.26Linear Regression 0.22 0.2 0.18 0.2 0.22RANDOM 0.21 0.22 0.22 0.21 0.2
Table 5.3: NDCG@3 score for the MQ2008 dataset with Solr featuresonly.
29
Number of document-query pairs0 5000 10000 15000
NDCG@3
0.15
0.2
0.25
0.3
0.35
0.4
0.45
0.5MQ2008; Solr features
MARTRankNetRankBoostAdaRank
Number of document-query pairs0 5000 10000 15000
NDCG@3
0.15
0.2
0.25
0.3
0.35
0.4
0.45
0.5MQ2008; Solr features
Coordinate AscentLambdaMARTListNetRandom Forests
Number of document-query pairs0 5000 10000 15000
NDCG@3
0.15
0.2
0.25
0.3
0.35
0.4
0.45
0.5MQ2008; Solr features
FRankLinear RegressionRandom
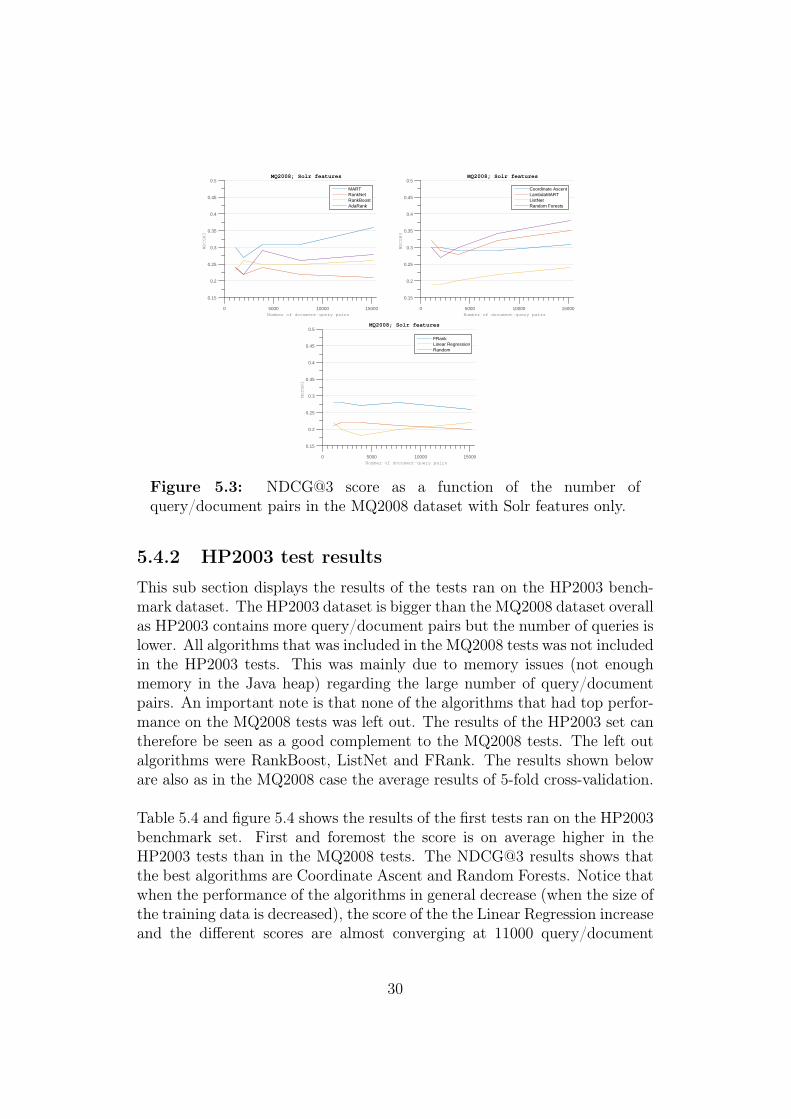
Figure 5.3: NDCG@3 score as a function of the number ofquery/document pairs in the MQ2008 dataset with Solr features only.
5.4.2 HP2003 test results
This sub section displays the results of the tests ran on the HP2003 bench-mark dataset. The HP2003 dataset is bigger than the MQ2008 dataset overallas HP2003 contains more query/document pairs but the number of queries islower. All algorithms that was included in the MQ2008 tests was not includedin the HP2003 tests. This was mainly due to memory issues (not enoughmemory in the Java heap) regarding the large number of query/documentpairs. An important note is that none of the algorithms that had top perfor-mance on the MQ2008 tests was left out. The results of the HP2003 set cantherefore be seen as a good complement to the MQ2008 tests. The left outalgorithms were RankBoost, ListNet and FRank. The results shown beloware also as in the MQ2008 case the average results of 5-fold cross-validation.
Table 5.4 and figure 5.4 shows the results of the first tests ran on the HP2003benchmark set. First and foremost the score is on average higher in theHP2003 tests than in the MQ2008 tests. The NDCG@3 results shows thatthe best algorithms are Coordinate Ascent and Random Forests. Notice thatwhen the performance of the algorithms in general decrease (when the size ofthe training data is decreased), the score of the the Linear Regression increaseand the different scores are almost converging at 11000 query/document
30
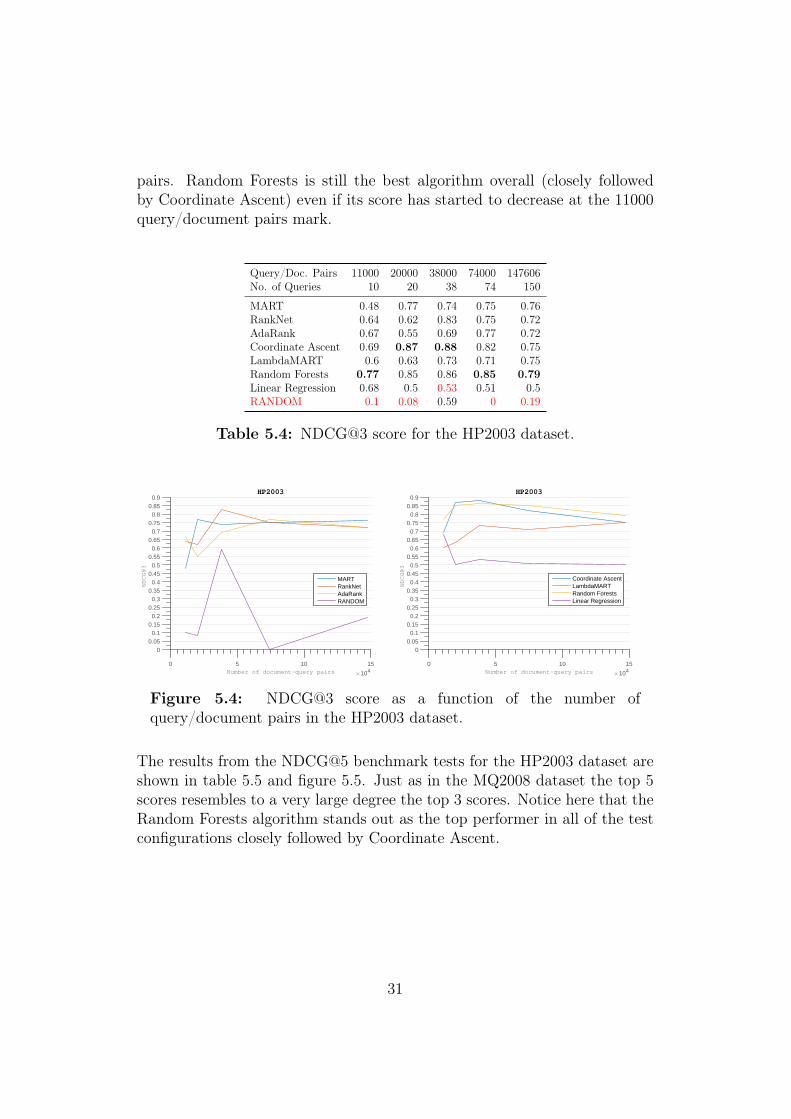
pairs. Random Forests is still the best algorithm overall (closely followedby Coordinate Ascent) even if its score has started to decrease at the 11000query/document pairs mark.
Query/Doc. Pairs 11000 20000 38000 74000 147606No. of Queries 10 20 38 74 150
MART 0.48 0.77 0.74 0.75 0.76RankNet 0.64 0.62 0.83 0.75 0.72AdaRank 0.67 0.55 0.69 0.77 0.72Coordinate Ascent 0.69 0.87 0.88 0.82 0.75LambdaMART 0.6 0.63 0.73 0.71 0.75Random Forests 0.77 0.85 0.86 0.85 0.79Linear Regression 0.68 0.5 0.53 0.51 0.5RANDOM 0.1 0.08 0.59 0 0.19
Table 5.4: NDCG@3 score for the HP2003 dataset.
Number of document-query pairs×104
0 5 10 15
NDCG@3
00.05
0.10.15
0.20.25
0.30.35
0.40.45
0.50.55
0.60.65
0.70.75
0.80.85
0.9HP2003
MARTRankNetAdaRankRANDOM
Number of document-query pairs×104
0 5 10 15
NDCG@3
00.05
0.10.15
0.20.25
0.30.35
0.40.45
0.50.55
0.60.65
0.70.75
0.80.85
0.9HP2003
Coordinate AscentLambdaMARTRandom ForestsLinear Regression
Figure 5.4: NDCG@3 score as a function of the number ofquery/document pairs in the HP2003 dataset.
The results from the NDCG@5 benchmark tests for the HP2003 dataset areshown in table 5.5 and figure 5.5. Just as in the MQ2008 dataset the top 5scores resembles to a very large degree the top 3 scores. Notice here that theRandom Forests algorithm stands out as the top performer in all of the testconfigurations closely followed by Coordinate Ascent.
31
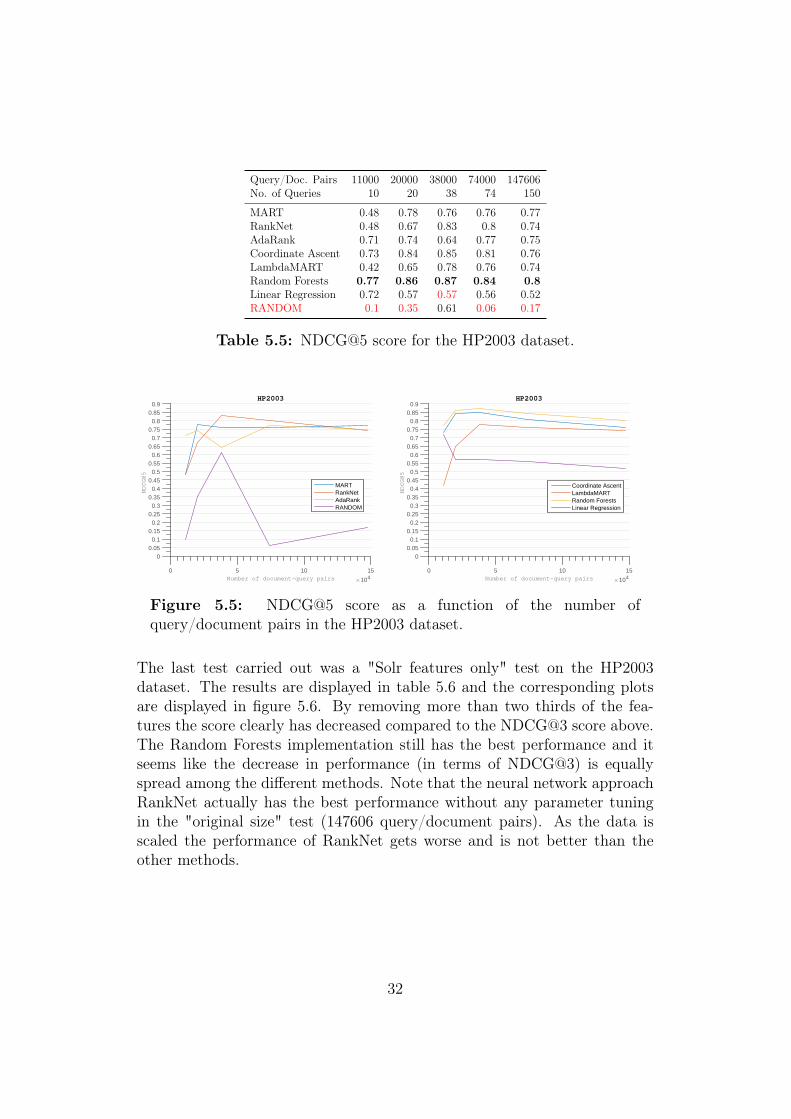
Query/Doc. Pairs 11000 20000 38000 74000 147606No. of Queries 10 20 38 74 150
MART 0.48 0.78 0.76 0.76 0.77RankNet 0.48 0.67 0.83 0.8 0.74AdaRank 0.71 0.74 0.64 0.77 0.75Coordinate Ascent 0.73 0.84 0.85 0.81 0.76LambdaMART 0.42 0.65 0.78 0.76 0.74Random Forests 0.77 0.86 0.87 0.84 0.8Linear Regression 0.72 0.57 0.57 0.56 0.52RANDOM 0.1 0.35 0.61 0.06 0.17
Table 5.5: NDCG@5 score for the HP2003 dataset.
Number of document-query pairs×104
0 5 10 15
NDCG@5
00.05
0.10.15
0.20.25
0.30.35
0.40.45
0.50.55
0.60.65
0.70.75
0.80.85
0.9HP2003
MARTRankNetAdaRankRANDOM
Number of document-query pairs×104
0 5 10 15
NDCG@5
00.05
0.10.15
0.20.25
0.30.35
0.40.45
0.50.55
0.60.65
0.70.75
0.80.85
0.9HP2003
Coordinate AscentLambdaMARTRandom ForestsLinear Regression
Figure 5.5: NDCG@5 score as a function of the number ofquery/document pairs in the HP2003 dataset.
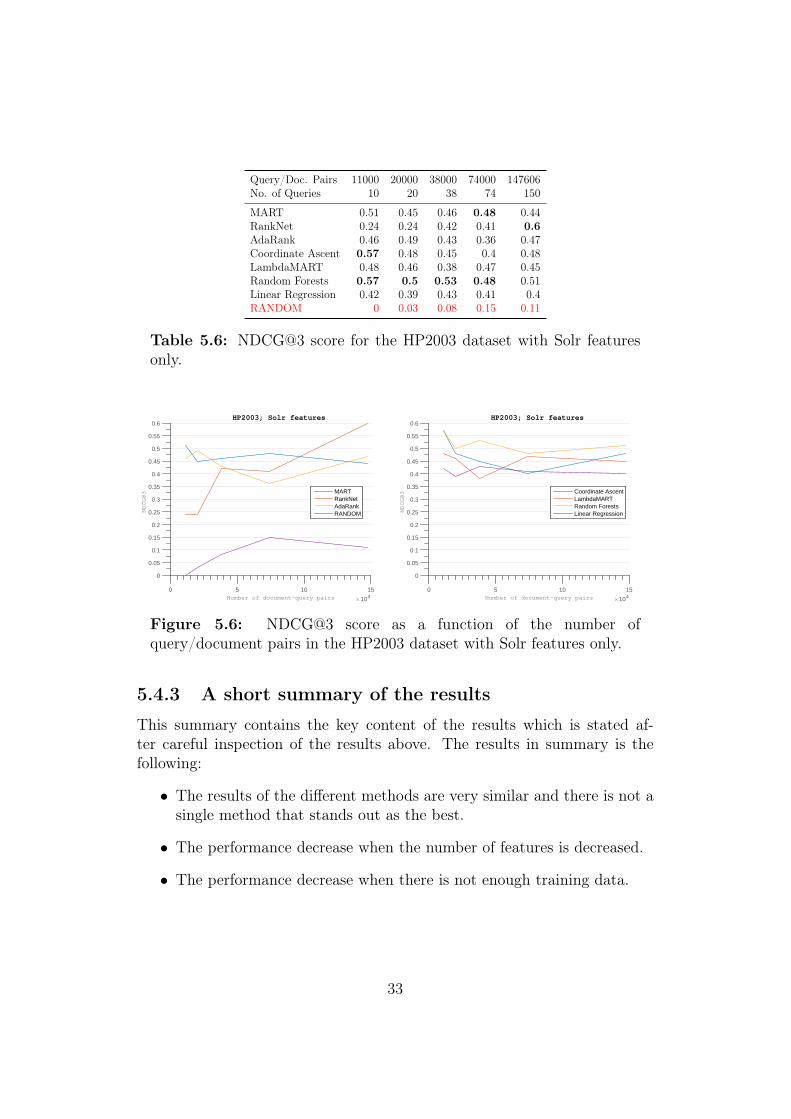
The last test carried out was a "Solr features only" test on the HP2003dataset. The results are displayed in table 5.6 and the corresponding plotsare displayed in figure 5.6. By removing more than two thirds of the fea-tures the score clearly has decreased compared to the NDCG@3 score above.The Random Forests implementation still has the best performance and itseems like the decrease in performance (in terms of NDCG@3) is equallyspread among the different methods. Note that the neural network approachRankNet actually has the best performance without any parameter tuningin the "original size" test (147606 query/document pairs). As the data isscaled the performance of RankNet gets worse and is not better than theother methods.
32
Query/Doc. Pairs 11000 20000 38000 74000 147606No. of Queries 10 20 38 74 150
MART 0.51 0.45 0.46 0.48 0.44RankNet 0.24 0.24 0.42 0.41 0.6AdaRank 0.46 0.49 0.43 0.36 0.47Coordinate Ascent 0.57 0.48 0.45 0.4 0.48LambdaMART 0.48 0.46 0.38 0.47 0.45Random Forests 0.57 0.5 0.53 0.48 0.51Linear Regression 0.42 0.39 0.43 0.41 0.4RANDOM 0 0.03 0.08 0.15 0.11
Table 5.6: NDCG@3 score for the HP2003 dataset with Solr featuresonly.
Number of document-query pairs×104
0 5 10 15
NDCG@3
0
0.05
0.1
0.15
0.2
0.25
0.3
0.35
0.4
0.45
0.5
0.55
0.6HP2003; Solr features
MARTRankNetAdaRankRANDOM
Number of document-query pairs×104
0 5 10 15
NDCG@3
0
0.05
0.1
0.15
0.2
0.25
0.3
0.35
0.4
0.45
0.5
0.55
0.6HP2003; Solr features
Coordinate AscentLambdaMARTRandom ForestsLinear Regression
Figure 5.6: NDCG@3 score as a function of the number ofquery/document pairs in the HP2003 dataset with Solr features only.
5.4.3 A short summary of the results
This summary contains the key content of the results which is stated af-ter careful inspection of the results above. The results in summary is thefollowing:
• The results of the different methods are very similar and there is not asingle method that stands out as the best.
• The performance decrease when the number of features is decreased.
• The performance decrease when there is not enough training data.
33
5.5 Learning to Rank in Apache SolrThis section describes the initiated work to implement learning to rank inApache Solr. In combination with the future work section it covers whathas been accomplished and what should be accomplished next. To be ableto follow the description of the initiated work a brief introduction to Solr isgiven.
5.5.1 Apache Solr
Apache Solr5 is an open source enterprise search server built on ApacheLucene6 which is the core that provides search features. Both Solr and Luceneare built entirely in Java and belongs to the Apache Software Foundation, anorganization that provides free software based on open source licenses. Thesoftware is distributed under the Apache Software Licence which lets anyonemodify the code, under the only premise that the modifications are noted.Solr is widely used in the information retrieval industry and the product isconsidered leading in the field along with Elastic7.
Solr lets users index documents or equivalent data to a search server (aweb application) and users can then issue search queries. Solr matches withdocuments and returns search results. This is the base functionality of Solrbut along comes a number of more advanced features. Some of the moreadvanced features in Solr are query completion, faceting and full text search.
The default scoring model in Solr is a tfidf model8 but other scoring modelssuch as BM25 and LMIR are also implemented. This means that the user canchoose a suitable scoring model based on the needs. There is a graphical userinterface in Solr which can be used for administration. To make the com-munication more simplified a package called Solrj9 can be used that allowscommunication with Solr through REST10 via Java. Another alternative isdirect communication with Solr through REST via the HTTP protocol.
5http://lucene.apache.org/solr/6http://lucene.apache.org/core/7https://www.elastic.co/8http://lucene.apache.org/core/5_0_0/core/org/apache/lucene/search/
similarities/TFIDFSimilarity.html9https://cwiki.apache.org/confluence/display/solr/Using+SolrJ
10http://rest.elkstein.org/
34
5.5.2 Learning to Rank in Apache Solr
The implementation communicate with the Lucene core on a quite low-levelwhich means that the code could be implemented theoretically in any Lucenebased software (for example Elastic) and not just only in Solr.
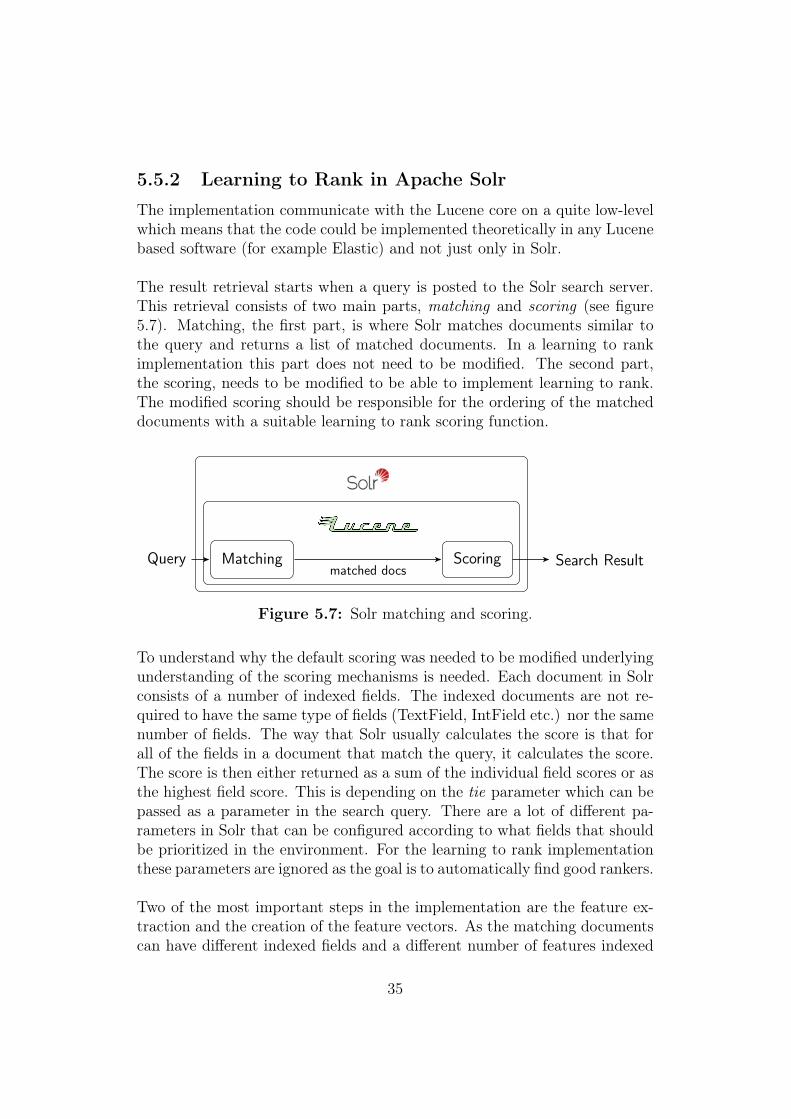
The result retrieval starts when a query is posted to the Solr search server.This retrieval consists of two main parts, matching and scoring (see figure5.7). Matching, the first part, is where Solr matches documents similar tothe query and returns a list of matched documents. In a learning to rankimplementation this part does not need to be modified. The second part,the scoring, needs to be modified to be able to implement learning to rank.The modified scoring should be responsible for the ordering of the matcheddocuments with a suitable learning to rank scoring function.
Query Matching Scoring Search Resultmatched docs
Figure 5.7: Solr matching and scoring.
To understand why the default scoring was needed to be modified underlyingunderstanding of the scoring mechanisms is needed. Each document in Solrconsists of a number of indexed fields. The indexed documents are not re-quired to have the same type of fields (TextField, IntField etc.) nor the samenumber of fields. The way that Solr usually calculates the score is that forall of the fields in a document that match the query, it calculates the score.The score is then either returned as a sum of the individual field scores or asthe highest field score. This is depending on the tie parameter which can bepassed as a parameter in the search query. There are a lot of different pa-rameters in Solr that can be configured according to what fields that shouldbe prioritized in the environment. For the learning to rank implementationthese parameters are ignored as the goal is to automatically find good rankers.
Two of the most important steps in the implementation are the feature ex-traction and the creation of the feature vectors. As the matching documentscan have different indexed fields and a different number of features indexed
35
this could result in construction of feature vectors with different features.To solve this problem each document must have the same fields or the Solrconfiguration must force the same fields to be indexed for all documents.Documents often have the same structure and in this implementation theassumption is made that the same fields are indexed. This means that thefeature vectors can be constructed with the same lengths. As uniform featurevectors are constructed, the focus is switched to the content of the featuresand to extract as many features as possible for each field. The feature extrac-tion is important, especially as the experiments showed that the performanceof the algorithms improved as the number of features was higher.
In the current implementation the following features are extracted for eachfield tf, idf and tf-idf. If for example each document has 10 fields, thiswould mean 30 features to rank on. Features like BM25 and LMIR valuesfor all fields are necessary supplements to get more features. The featureextraction is achieved by creation of a custom query parser plugin. SeeLearningPlugin.java in appendix D for code of how this plugin for Luceneis created. After the plugin is created the custom scoring should be imple-mented in LearningQuery.java (appendix D).
The method customExplain demonstrates how terms can be extracted foreach field in a document. The customScore method should be responsibleto do the ranking and return the score for each document. The methodscustomScore and customExplain are called for every matched document.The extracted features in the current implementation are extracted from thetfidf similarity model in Lucene, which also is the default similarity modelin Solr. Further Lucene contains other similarity models such as BM25 andLMIR. By extracting features for these two similarity models together withthe default similarity enough features for each field can be extracted to beable to do learning to rank with good performance. For further informationabout learning to rank in Solr and which direction that is recommended tocontinue in see the future work section.
36
Chapter 6
Discussion
This section reviews the results from the tables and the plots in the exper-iments section in a wider perspective. To begin with, no evaluated methodstands out as the best method. Random Forests had the best performanceoverall but most of the other algorithms were still very close to RandomForests even if they were a bit behind. The assumption is that the most orperhaps all of the algorithms could gain from parameter tuning, for examplethe neural networks approaches RankNet and ListNet. This assumption issupported by Li (2014) in Learning to Rank for Information Retrieval andNatural Language Processing who presents results from tuned algorithmswith better performance than the results in this thesis. There is no proof forwhich of the methods that could gain the most from tuning and the experi-mentsf proves that some of the methods are not suitable for out of the boxlearning to rank. The reason why parameter tuning was ignored was to seethe out of the box performance as this often is a sought property in enter-prise search. The goal was to find a solution that was time efficient out ofthe box and to fine tune parameters for all of the methods was not an option.
The NDCG scores decreased when the number of features were limited, thismeans that the number of features is an essential factor to be able to createa satisfying ranking function. The reason for why the score is decreasingis because when there are not enough features it is impossible to create agood ranker with the limited amount of information available. The differ-ence between the MQ2008 and HP2003 results (HP2003 had higher scores)was expected as the HP2003 set is considered easier to rank according toLearning to Rank for Information Retrieval and Natural Language Process-ing (Li, 2014). This should be partly due to the 64-dimensional featuresvectors in HP2003 compared to the 46-dimensional in MQ2008. Anotherlikely reason for the better results in HP2003 could be that there are a lot
37
more documents to choose from for each query in HP2003. It should be easierto find three or five relevant documents (labeled highly relevant i.e. labeled4 on a scale 0-4) when choosing from 1000 documents per query (HP2003)compared to choosing from 20 documents per query (MQ2008). There is stillno certainty that that is the case but it is likely as the results are better inthe HP2003 performance measures.
Further inspection of the experiments reveals that the training dataset mustbe big enough to be able to create a good ranking function. How large thetraining set exactly should be varies from case to case and obviously dependson the documents. A good measure discovered in this thesis is that whenthe training data is shrunken and the measure-specific loss on the validationdata starts to increase there is not enough data.
A final remark about the FRank implementation; the authors (Tsai et al.,2007) claims that the algorithm works better than its competitors on smallerdatasets but that clearly is not the case in the tests executed. This couldbe due to lack of parameter fitting in the experiments (too few iterationsetc.) or due to the research bias that seems to occur in many papers in theresearch field of information retrieval. Researchers develops methods whichhave the best performance compared to other methods in their test setting.The experiments in this thesis showed that there is not a single method thatalways is best in a general test setting. This fact is famously stated andknown as the "no free lunch" theorem.
38
Chapter 7
Conclusions & Future Work
7.1 ConclusionsThis thesis has evaluated a supervised machine learning approach for rank-ing of documents called learning to rank. Learning to rank traditionally isused in web based search and this thesis is evaluating learning to rank inenterprise search. The outcome of the thesis is that learning to rank is moresuitable for web based search than for enterprise search. There is more dataavailable in web based search and it is easier to train a model efficiently withenough training data. The number of extractable features is often limitedin an enterprise search solution. This makes it hard for learning to rank tocompete with standard search models in enterprise search as learning to rankis dependent on the number of features. An implementation of learning torank in Apache Solr does still have potential to be superior to standard mod-els but there must be enough extractable features, a large number indexedfields and enough annotated data. This thesis has begun the implementationof a potential solution, this implementation can be continued as future work.
7.2 Future WorkThis section gives advice on how this work can be continued (by anothermaster thesis or similar). As a recommendation four steps are given of howthe work can proceed.
1. Create feature vectors in Solr. This is already started in this thesis, andthe key is to extract as many features as possible. In Solr many similar-ity models can be used simultaneously by creating a QueryParserPluginand implement a CustomScoreQuery to extract features in different
39
ways. It is not necessary to implement a new query parser and it is notenough to only implement a custom similarity.
2. Save feature vectors for different queries, inspect and give retrievedsearch hits relevance labels.
3. Train a suitable learning to rank algorithm with the annotated datacreated.
4. Use this model as scorer in your CustomScoreQuery, to rank and givethe documents matched by Solr a custom score.
Finally, online learning have possibilities in learning to rank in combinationwith Solr. To automatically give relevance labels and create training databased on what the users are clicking (step 2 above). This can be achieved bysaving and extracting information from click logs and combine the informa-tion with the corresponding documents. The technique is called click throughanalysis (Joachims, 2002) and is described in the next section.
7.2.1 Click through analysis
By using click through analysis a trained learning to rank model can be fur-ther trained after it is launched. This type of continuous learning is oftenrefereed to as online learning. The opposite is called offline or batch learningwhich is the typical case for learning to rank. By monitoring the user be-haviour from logs, a model can learn from what the users are actually clickingon in the retrieved search result. In this way the users behaviour automat-ically creates training data. The notion is that a relevant document makesthe user click on the link to the document and stop the searching as the userfound relevant information. The time between the retrieved results and theclick can be monitored to see how long time the user needed to decide whichlink to click on. A fast click can mean that the user found the relevant infor-mation directly without hesitation. If the user continues to ask new similarqueries then the first links probably was not as relevant as desired.
40
Appendix A
Feature description - MQ2008
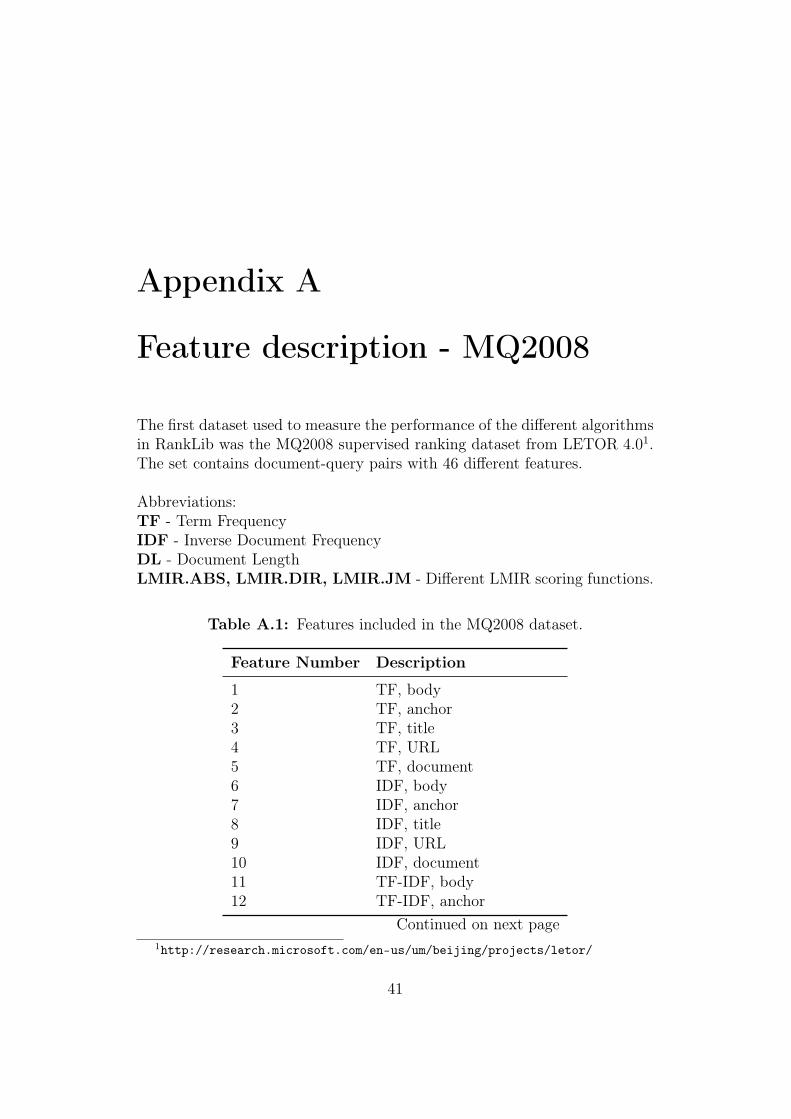
The first dataset used to measure the performance of the different algorithmsin RankLib was the MQ2008 supervised ranking dataset from LETOR 4.01.The set contains document-query pairs with 46 different features.
Abbreviations:TF - Term FrequencyIDF - Inverse Document FrequencyDL - Document LengthLMIR.ABS, LMIR.DIR, LMIR.JM - Different LMIR scoring functions.
Table A.1: Features included in the MQ2008 dataset.
Feature Number Description
1 TF, body2 TF, anchor3 TF, title4 TF, URL5 TF, document6 IDF, body7 IDF, anchor8 IDF, title9 IDF, URL10 IDF, document11 TF-IDF, body12 TF-IDF, anchor
Continued on next page1http://research.microsoft.com/en-us/um/beijing/projects/letor/
41
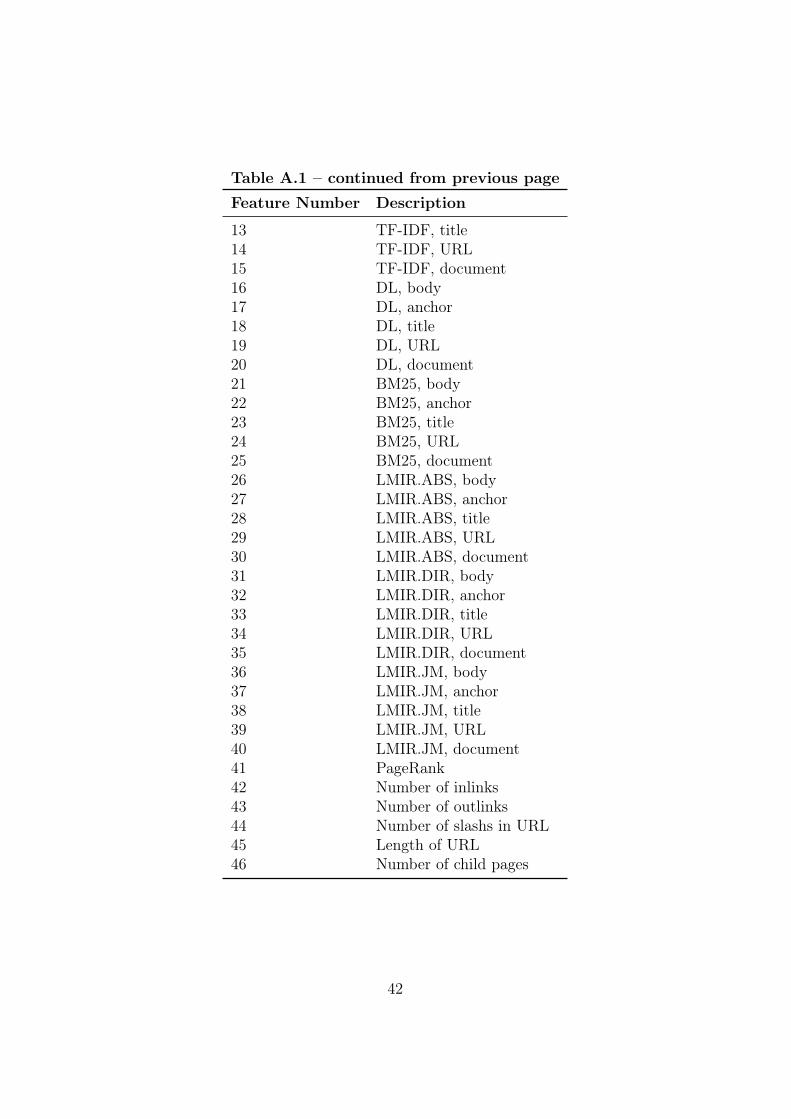
Table A.1 – continued from previous page
Feature Number Description
13 TF-IDF, title14 TF-IDF, URL15 TF-IDF, document16 DL, body17 DL, anchor18 DL, title19 DL, URL20 DL, document21 BM25, body22 BM25, anchor23 BM25, title24 BM25, URL25 BM25, document26 LMIR.ABS, body27 LMIR.ABS, anchor28 LMIR.ABS, title29 LMIR.ABS, URL30 LMIR.ABS, document31 LMIR.DIR, body32 LMIR.DIR, anchor33 LMIR.DIR, title34 LMIR.DIR, URL35 LMIR.DIR, document36 LMIR.JM, body37 LMIR.JM, anchor38 LMIR.JM, title39 LMIR.JM, URL40 LMIR.JM, document41 PageRank42 Number of inlinks43 Number of outlinks44 Number of slashs in URL45 Length of URL46 Number of child pages
42
Appendix B
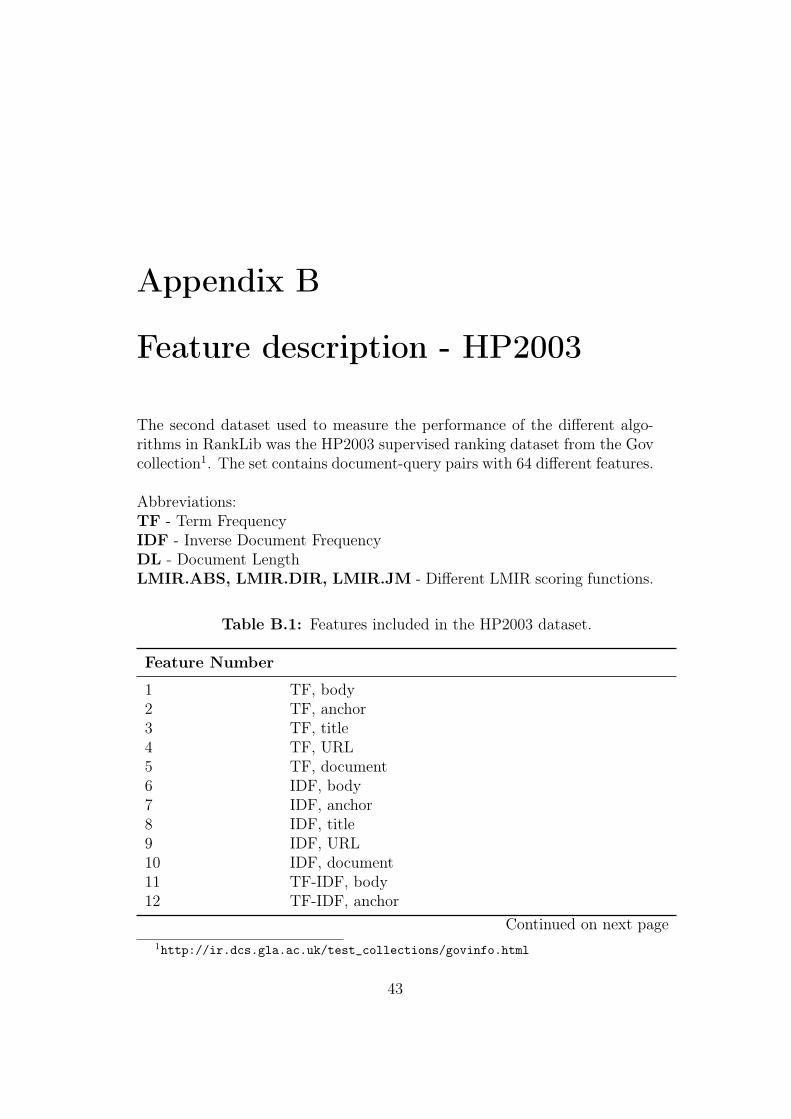
Feature description - HP2003
The second dataset used to measure the performance of the different algo-rithms in RankLib was the HP2003 supervised ranking dataset from the Govcollection1. The set contains document-query pairs with 64 different features.
Abbreviations:TF - Term FrequencyIDF - Inverse Document FrequencyDL - Document LengthLMIR.ABS, LMIR.DIR, LMIR.JM - Different LMIR scoring functions.
Table B.1: Features included in the HP2003 dataset.
Feature Number
1 TF, body2 TF, anchor3 TF, title4 TF, URL5 TF, document6 IDF, body7 IDF, anchor8 IDF, title9 IDF, URL10 IDF, document11 TF-IDF, body12 TF-IDF, anchor
Continued on next page1http://ir.dcs.gla.ac.uk/test_collections/govinfo.html
43
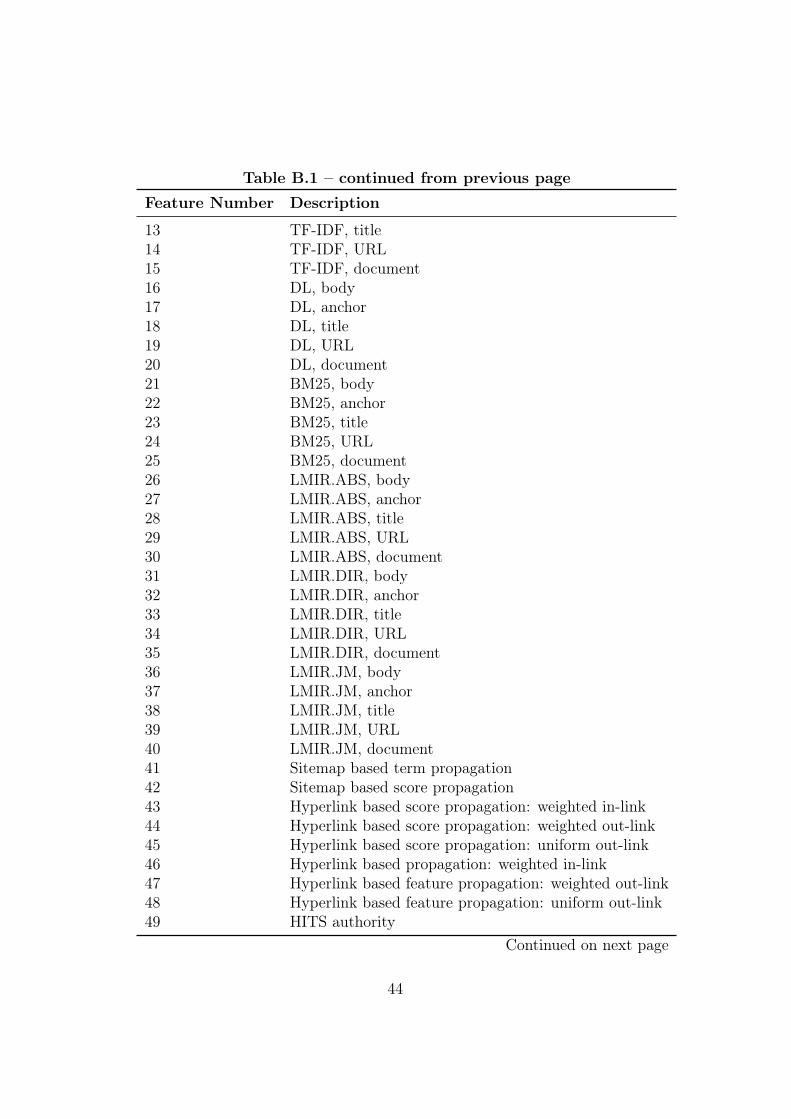
Table B.1 – continued from previous page
Feature Number Description
13 TF-IDF, title14 TF-IDF, URL15 TF-IDF, document16 DL, body17 DL, anchor18 DL, title19 DL, URL20 DL, document21 BM25, body22 BM25, anchor23 BM25, title24 BM25, URL25 BM25, document26 LMIR.ABS, body27 LMIR.ABS, anchor28 LMIR.ABS, title29 LMIR.ABS, URL30 LMIR.ABS, document31 LMIR.DIR, body32 LMIR.DIR, anchor33 LMIR.DIR, title34 LMIR.DIR, URL35 LMIR.DIR, document36 LMIR.JM, body37 LMIR.JM, anchor38 LMIR.JM, title39 LMIR.JM, URL40 LMIR.JM, document41 Sitemap based term propagation42 Sitemap based score propagation43 Hyperlink based score propagation: weighted in-link44 Hyperlink based score propagation: weighted out-link45 Hyperlink based score propagation: uniform out-link46 Hyperlink based propagation: weighted in-link47 Hyperlink based feature propagation: weighted out-link48 Hyperlink based feature propagation: uniform out-link49 HITS authority
Continued on next page
44
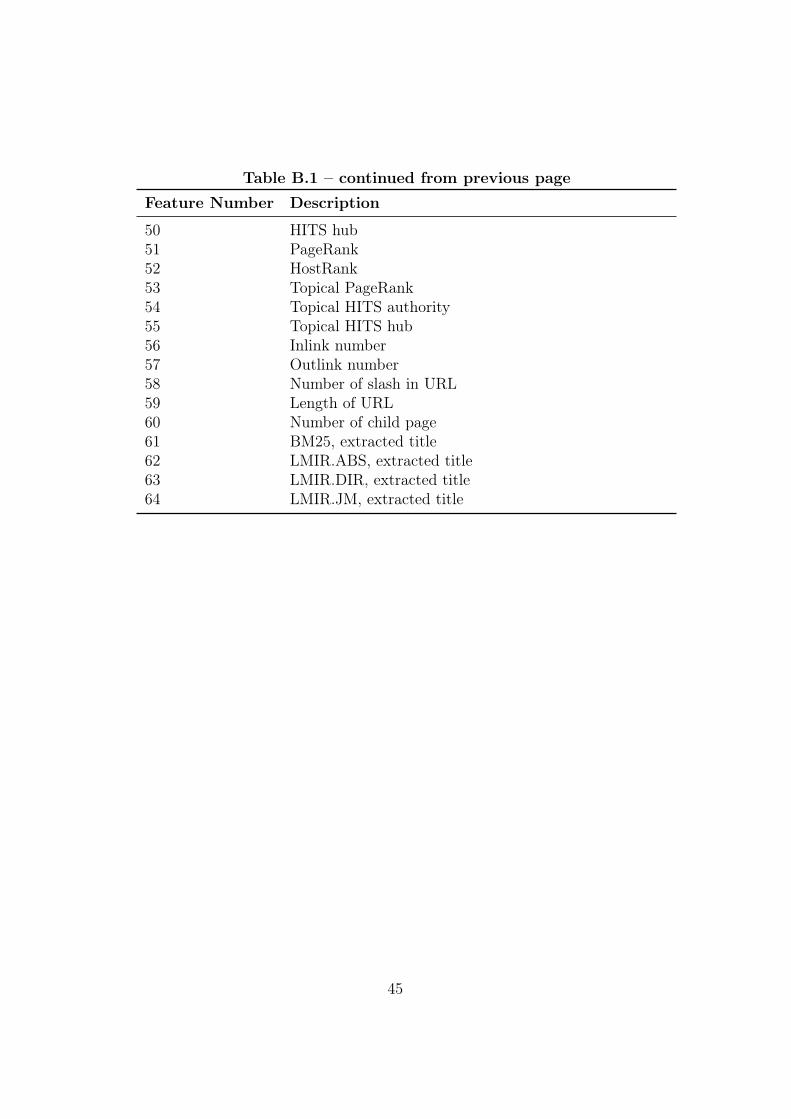
Table B.1 – continued from previous page
Feature Number Description
50 HITS hub51 PageRank52 HostRank53 Topical PageRank54 Topical HITS authority55 Topical HITS hub56 Inlink number57 Outlink number58 Number of slash in URL59 Length of URL60 Number of child page61 BM25, extracted title62 LMIR.ABS, extracted title63 LMIR.DIR, extracted title64 LMIR.JM, extracted title
45
Appendix C
FRank code implementation
This appendix contains the source code for the FRank implementation. FRankis written in Java and the main reason for that is because RankLib also isimplemented in Java. A number of helper functions from RankLib are usedby the algorithm to parse and iterate through the training and validationdata. The performance measures (MAP, NDCG, ERR etc.) are calculatedby functionality already implemented in RankLib. A large part of the FRankimplementation is based on the RankBoost implementation as the two meth-ods have similar approaches and their implementation details resembles eachother. Frank.java is the main class and FrankWeakRanker.java is a helperclass that’s representing the weak rankers that are created in each iterationof the FRank algorithm.
The code has two methods of special interest, init() and learn() (learncalls the learnWeakRanker() helper method). The init() is just as thename implies a method for initialization of all data structures. In the init()the threshold values are assigned, chosen from an already existing featurevalue. If every feature value is 0 or 1, a random value between 0 and 1is selected as threshold value. The target probabilities (see section 4) arealso calculated in init() by doing pairwise comparisons between all thequery/documents pairs relevance labels.
The learn() method is following the implementation details of the FRankalgorithm. The method runs for a specific number of iterations (the numberof weak rankers to combine) which can be specified by the input parameter-round n. The default number of iterations is currently set to 100. After theranker function is calculated a number of performance measures are printedout depending on what the user has specified. As a final mention a numberof methods are overridden from the Ranker superclass to fill the criteria for
46
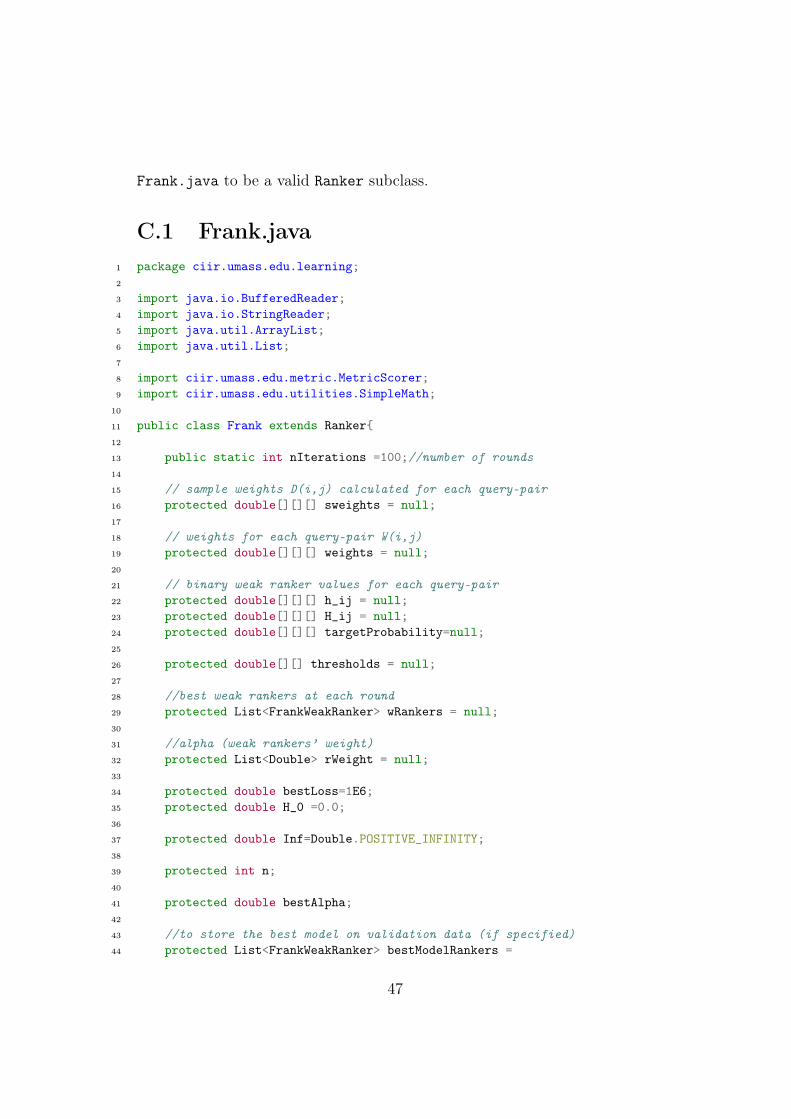
Frank.java to be a valid Ranker subclass.
C.1 Frank.java1 package ciir.umass.edu.learning;2
3 import java.io.BufferedReader;4 import java.io.StringReader;5 import java.util.ArrayList;6 import java.util.List;7
8 import ciir.umass.edu.metric.MetricScorer;9 import ciir.umass.edu.utilities.SimpleMath;
10
11 public class Frank extends Ranker{12
13 public static int nIterations =100;//number of rounds14
15 // sample weights D(i,j) calculated for each query-pair16 protected double[][][] sweights = null;17
18 // weights for each query-pair W(i,j)19 protected double[][][] weights = null;20
21 // binary weak ranker values for each query-pair22 protected double[][][] h_ij = null;23 protected double[][][] H_ij = null;24 protected double[][][] targetProbability=null;25
26 protected double[][] thresholds = null;27
28 //best weak rankers at each round29 protected List<FrankWeakRanker> wRankers = null;30
31 //alpha (weak rankers’ weight)32 protected List<Double> rWeight = null;33
34 protected double bestLoss=1E6;35 protected double H_0 =0.0;36
37 protected double Inf=Double.POSITIVE_INFINITY;38
39 protected int n;40
41 protected double bestAlpha;42
43 //to store the best model on validation data (if specified)44 protected List<FrankWeakRanker> bestModelRankers =
47
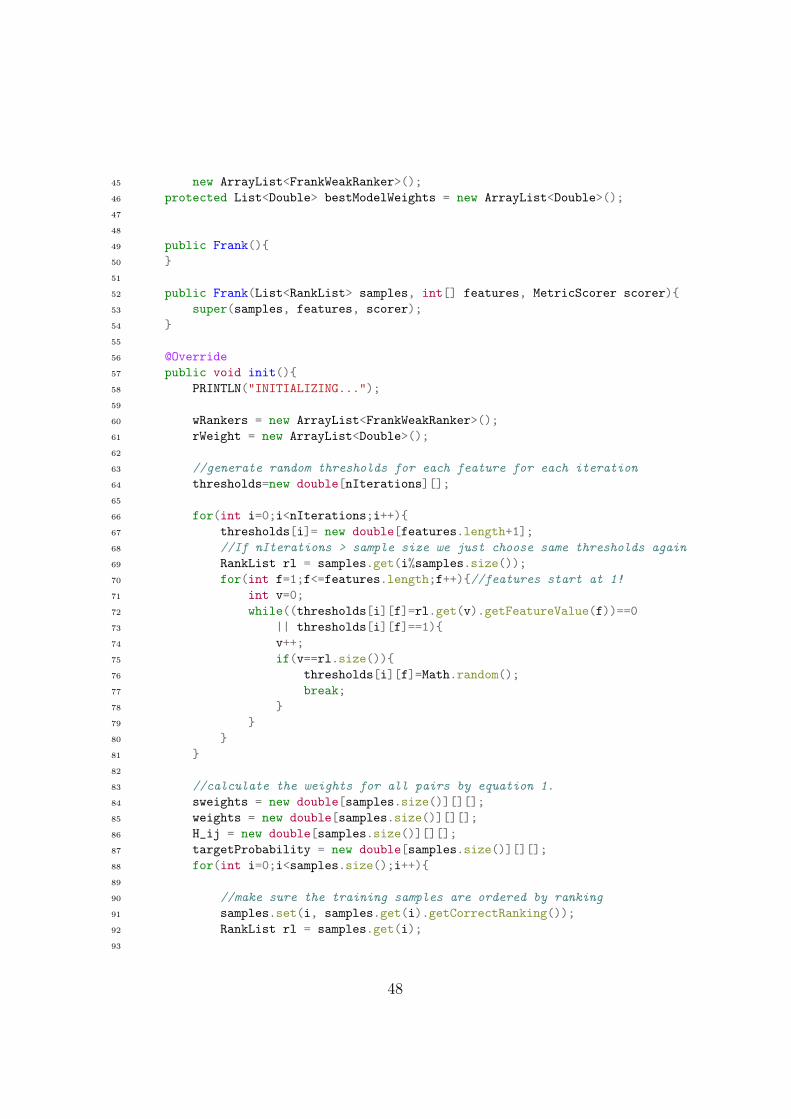
45 new ArrayList<FrankWeakRanker>();46 protected List<Double> bestModelWeights = new ArrayList<Double>();47
48
49 public Frank(){50 }51
52 public Frank(List<RankList> samples, int[] features, MetricScorer scorer){53 super(samples, features, scorer);54 }55
56 @Override57 public void init(){58 PRINTLN("INITIALIZING...");59
60 wRankers = new ArrayList<FrankWeakRanker>();61 rWeight = new ArrayList<Double>();62
63 //generate random thresholds for each feature for each iteration64 thresholds=new double[nIterations][];65
66 for(int i=0;i<nIterations;i++){67 thresholds[i]= new double[features.length+1];68 //If nIterations > sample size we just choose same thresholds again69 RankList rl = samples.get(i%samples.size());70 for(int f=1;f<=features.length;f++){//features start at 1!71 int v=0;72 while((thresholds[i][f]=rl.get(v).getFeatureValue(f))==073 || thresholds[i][f]==1){74 v++;75 if(v==rl.size()){76 thresholds[i][f]=Math.random();77 break;78 }79 }80 }81 }82
83 //calculate the weights for all pairs by equation 1.84 sweights = new double[samples.size()][][];85 weights = new double[samples.size()][][];86 H_ij = new double[samples.size()][][];87 targetProbability = new double[samples.size()][][];88 for(int i=0;i<samples.size();i++){89
90 //make sure the training samples are ordered by ranking91 samples.set(i, samples.get(i).getCorrectRanking());92 RankList rl = samples.get(i);93
48
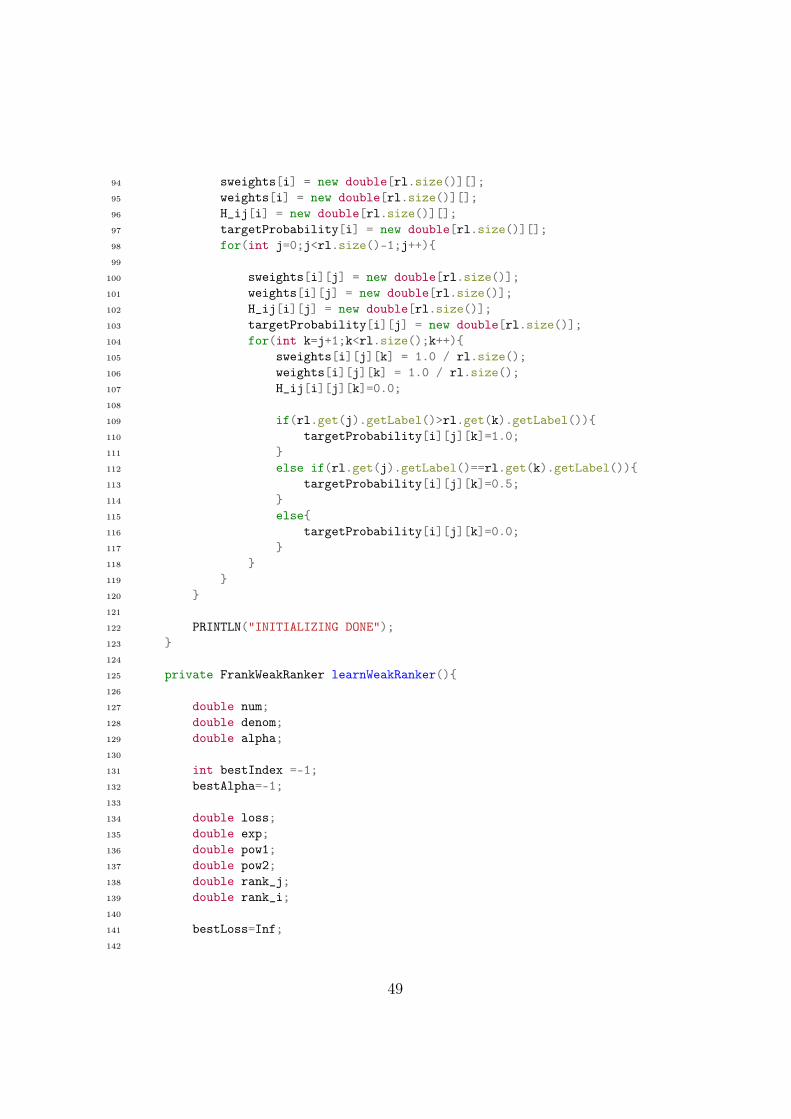
94 sweights[i] = new double[rl.size()][];95 weights[i] = new double[rl.size()][];96 H_ij[i] = new double[rl.size()][];97 targetProbability[i] = new double[rl.size()][];98 for(int j=0;j<rl.size()-1;j++){99
100 sweights[i][j] = new double[rl.size()];101 weights[i][j] = new double[rl.size()];102 H_ij[i][j] = new double[rl.size()];103 targetProbability[i][j] = new double[rl.size()];104 for(int k=j+1;k<rl.size();k++){105 sweights[i][j][k] = 1.0 / rl.size();106 weights[i][j][k] = 1.0 / rl.size();107 H_ij[i][j][k]=0.0;108
109 if(rl.get(j).getLabel()>rl.get(k).getLabel()){110 targetProbability[i][j][k]=1.0;111 }112 else if(rl.get(j).getLabel()==rl.get(k).getLabel()){113 targetProbability[i][j][k]=0.5;114 }115 else{116 targetProbability[i][j][k]=0.0;117 }118 }119 }120 }121
122 PRINTLN("INITIALIZING DONE");123 }124
125 private FrankWeakRanker learnWeakRanker(){126
127 double num;128 double denom;129 double alpha;130
131 int bestIndex =-1;132 bestAlpha=-1;133
134 double loss;135 double exp;136 double pow1;137 double pow2;138 double rank_j;139 double rank_i;140
141 bestLoss=Inf;142
49
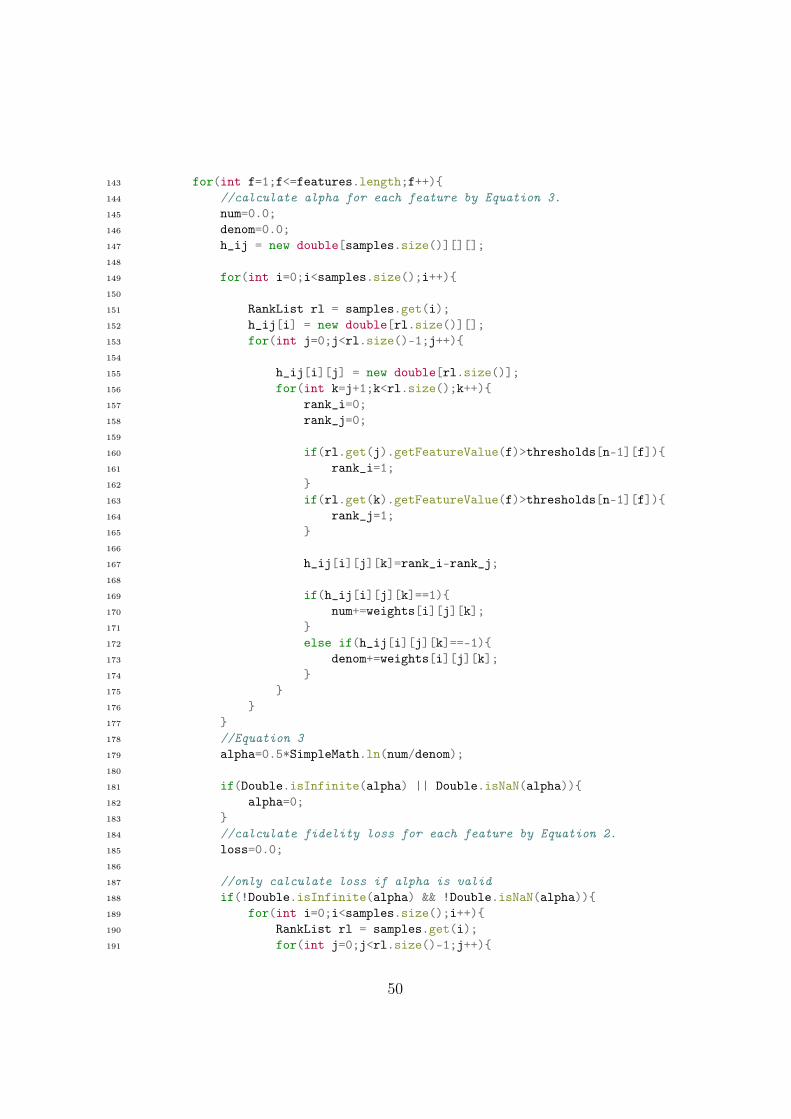
143 for(int f=1;f<=features.length;f++){144 //calculate alpha for each feature by Equation 3.145 num=0.0;146 denom=0.0;147 h_ij = new double[samples.size()][][];148
149 for(int i=0;i<samples.size();i++){150
151 RankList rl = samples.get(i);152 h_ij[i] = new double[rl.size()][];153 for(int j=0;j<rl.size()-1;j++){154
155 h_ij[i][j] = new double[rl.size()];156 for(int k=j+1;k<rl.size();k++){157 rank_i=0;158 rank_j=0;159
160 if(rl.get(j).getFeatureValue(f)>thresholds[n-1][f]){161 rank_i=1;162 }163 if(rl.get(k).getFeatureValue(f)>thresholds[n-1][f]){164 rank_j=1;165 }166
167 h_ij[i][j][k]=rank_i-rank_j;168
169 if(h_ij[i][j][k]==1){170 num+=weights[i][j][k];171 }172 else if(h_ij[i][j][k]==-1){173 denom+=weights[i][j][k];174 }175 }176 }177 }178 //Equation 3179 alpha=0.5*SimpleMath.ln(num/denom);180
181 if(Double.isInfinite(alpha) || Double.isNaN(alpha)){182 alpha=0;183 }184 //calculate fidelity loss for each feature by Equation 2.185 loss=0.0;186
187 //only calculate loss if alpha is valid188 if(!Double.isInfinite(alpha) && !Double.isNaN(alpha)){189 for(int i=0;i<samples.size();i++){190 RankList rl = samples.get(i);191 for(int j=0;j<rl.size()-1;j++){
50
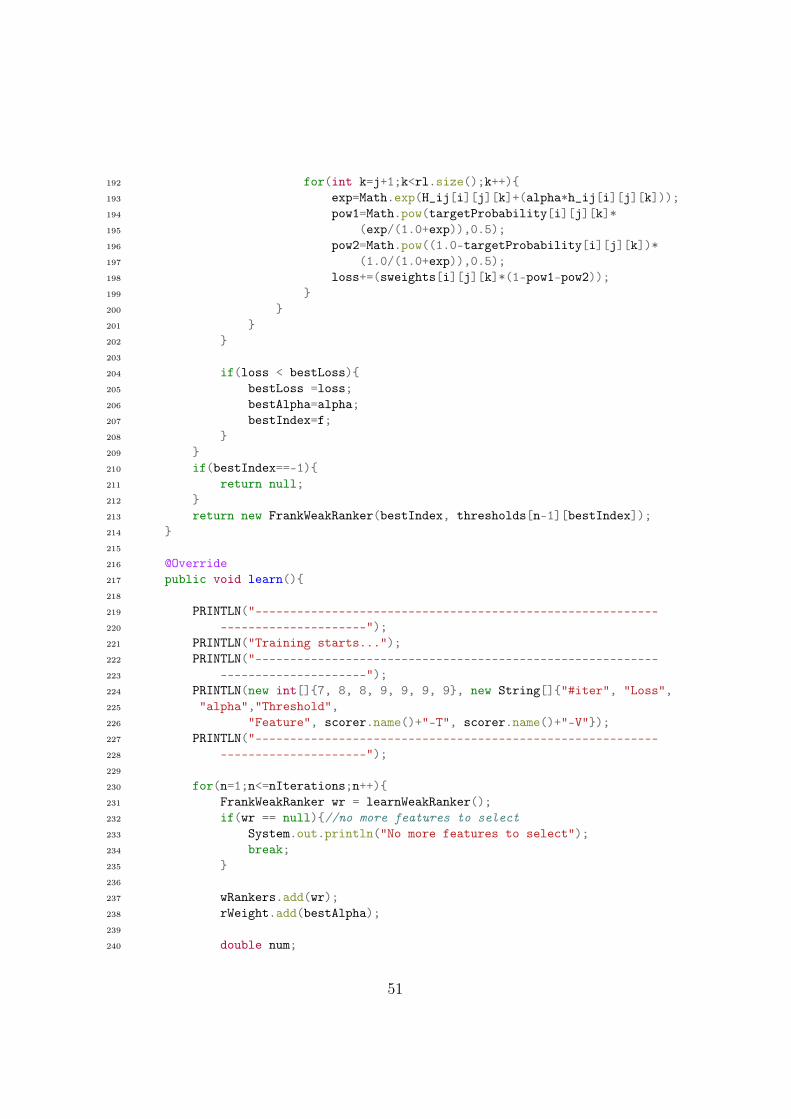
192 for(int k=j+1;k<rl.size();k++){193 exp=Math.exp(H_ij[i][j][k]+(alpha*h_ij[i][j][k]));194 pow1=Math.pow(targetProbability[i][j][k]*195 (exp/(1.0+exp)),0.5);196 pow2=Math.pow((1.0-targetProbability[i][j][k])*197 (1.0/(1.0+exp)),0.5);198 loss+=(sweights[i][j][k]*(1-pow1-pow2));199 }200 }201 }202 }203
204 if(loss < bestLoss){205 bestLoss =loss;206 bestAlpha=alpha;207 bestIndex=f;208 }209 }210 if(bestIndex==-1){211 return null;212 }213 return new FrankWeakRanker(bestIndex, thresholds[n-1][bestIndex]);214 }215
216 @Override217 public void learn(){218
219 PRINTLN("----------------------------------------------------------220 ---------------------");221 PRINTLN("Training starts...");222 PRINTLN("----------------------------------------------------------223 ---------------------");224 PRINTLN(new int[]{7, 8, 8, 9, 9, 9, 9}, new String[]{"#iter", "Loss",225 "alpha","Threshold",226 "Feature", scorer.name()+"-T", scorer.name()+"-V"});227 PRINTLN("----------------------------------------------------------228 ---------------------");229
230 for(n=1;n<=nIterations;n++){231 FrankWeakRanker wr = learnWeakRanker();232 if(wr == null){//no more features to select233 System.out.println("No more features to select");234 break;235 }236
237 wRankers.add(wr);238 rWeight.add(bestAlpha);239
240 double num;
51
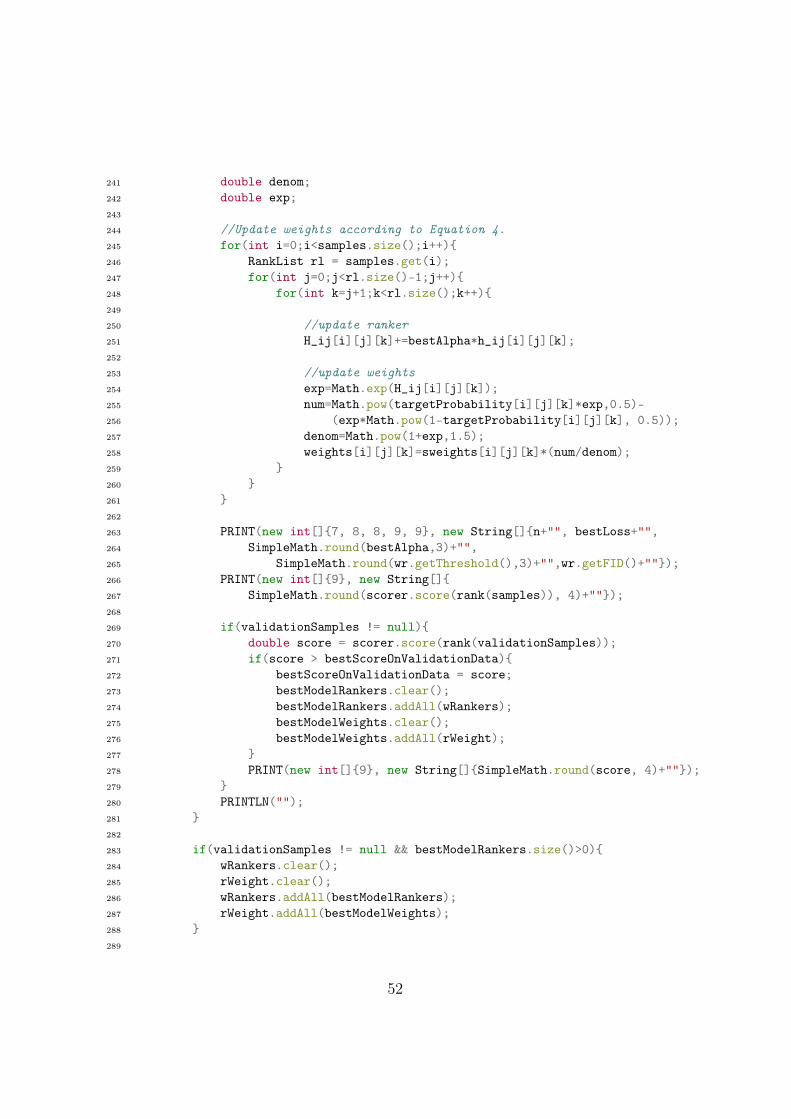
241 double denom;242 double exp;243
244 //Update weights according to Equation 4.245 for(int i=0;i<samples.size();i++){246 RankList rl = samples.get(i);247 for(int j=0;j<rl.size()-1;j++){248 for(int k=j+1;k<rl.size();k++){249
250 //update ranker251 H_ij[i][j][k]+=bestAlpha*h_ij[i][j][k];252
253 //update weights254 exp=Math.exp(H_ij[i][j][k]);255 num=Math.pow(targetProbability[i][j][k]*exp,0.5)-256 (exp*Math.pow(1-targetProbability[i][j][k], 0.5));257 denom=Math.pow(1+exp,1.5);258 weights[i][j][k]=sweights[i][j][k]*(num/denom);259 }260 }261 }262
263 PRINT(new int[]{7, 8, 8, 9, 9}, new String[]{n+"", bestLoss+"",264 SimpleMath.round(bestAlpha,3)+"",265 SimpleMath.round(wr.getThreshold(),3)+"",wr.getFID()+""});266 PRINT(new int[]{9}, new String[]{267 SimpleMath.round(scorer.score(rank(samples)), 4)+""});268
269 if(validationSamples != null){270 double score = scorer.score(rank(validationSamples));271 if(score > bestScoreOnValidationData){272 bestScoreOnValidationData = score;273 bestModelRankers.clear();274 bestModelRankers.addAll(wRankers);275 bestModelWeights.clear();276 bestModelWeights.addAll(rWeight);277 }278 PRINT(new int[]{9}, new String[]{SimpleMath.round(score, 4)+""});279 }280 PRINTLN("");281 }282
283 if(validationSamples != null && bestModelRankers.size()>0){284 wRankers.clear();285 rWeight.clear();286 wRankers.addAll(bestModelRankers);287 rWeight.addAll(bestModelWeights);288 }289
52
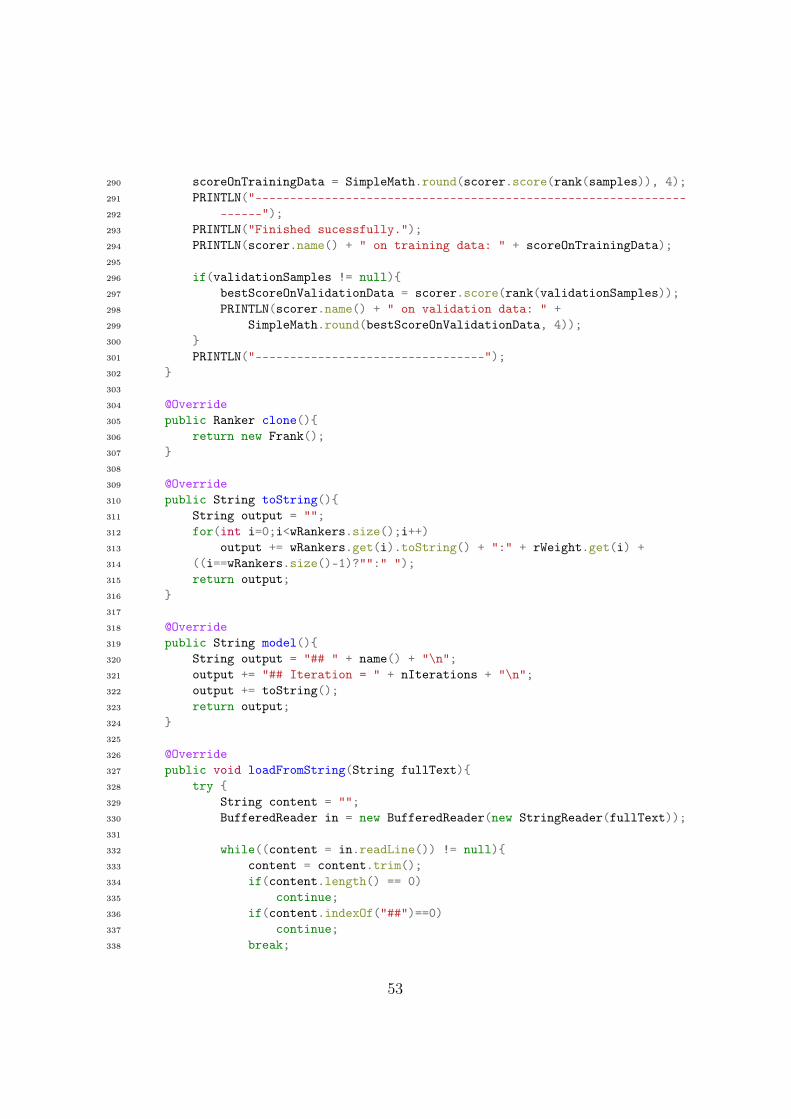
290 scoreOnTrainingData = SimpleMath.round(scorer.score(rank(samples)), 4);291 PRINTLN("--------------------------------------------------------------292 ------");293 PRINTLN("Finished sucessfully.");294 PRINTLN(scorer.name() + " on training data: " + scoreOnTrainingData);295
296 if(validationSamples != null){297 bestScoreOnValidationData = scorer.score(rank(validationSamples));298 PRINTLN(scorer.name() + " on validation data: " +299 SimpleMath.round(bestScoreOnValidationData, 4));300 }301 PRINTLN("---------------------------------");302 }303
304 @Override305 public Ranker clone(){306 return new Frank();307 }308
309 @Override310 public String toString(){311 String output = "";312 for(int i=0;i<wRankers.size();i++)313 output += wRankers.get(i).toString() + ":" + rWeight.get(i) +314 ((i==wRankers.size()-1)?"":" ");315 return output;316 }317
318 @Override319 public String model(){320 String output = "## " + name() + "\n";321 output += "## Iteration = " + nIterations + "\n";322 output += toString();323 return output;324 }325
326 @Override327 public void loadFromString(String fullText){328 try {329 String content = "";330 BufferedReader in = new BufferedReader(new StringReader(fullText));331
332 while((content = in.readLine()) != null){333 content = content.trim();334 if(content.length() == 0)335 continue;336 if(content.indexOf("##")==0)337 continue;338 break;
53
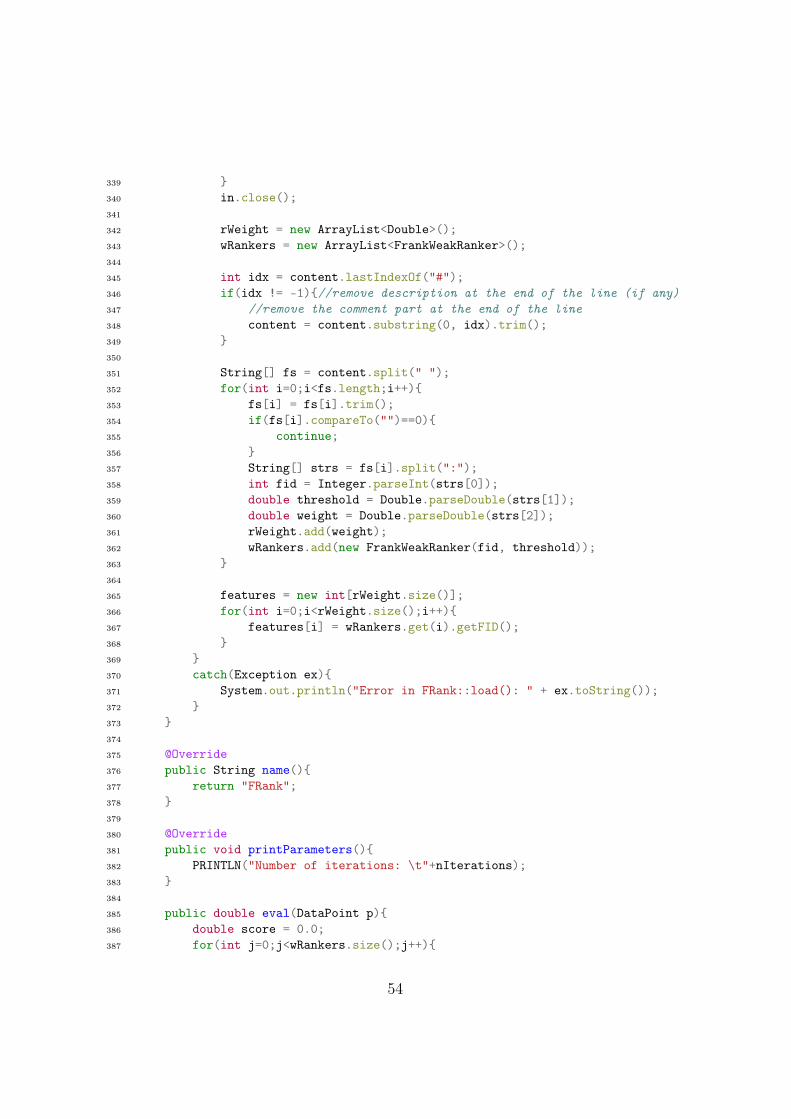
339 }340 in.close();341
342 rWeight = new ArrayList<Double>();343 wRankers = new ArrayList<FrankWeakRanker>();344
345 int idx = content.lastIndexOf("#");346 if(idx != -1){//remove description at the end of the line (if any)347 //remove the comment part at the end of the line348 content = content.substring(0, idx).trim();349 }350
351 String[] fs = content.split(" ");352 for(int i=0;i<fs.length;i++){353 fs[i] = fs[i].trim();354 if(fs[i].compareTo("")==0){355 continue;356 }357 String[] strs = fs[i].split(":");358 int fid = Integer.parseInt(strs[0]);359 double threshold = Double.parseDouble(strs[1]);360 double weight = Double.parseDouble(strs[2]);361 rWeight.add(weight);362 wRankers.add(new FrankWeakRanker(fid, threshold));363 }364
365 features = new int[rWeight.size()];366 for(int i=0;i<rWeight.size();i++){367 features[i] = wRankers.get(i).getFID();368 }369 }370 catch(Exception ex){371 System.out.println("Error in FRank::load(): " + ex.toString());372 }373 }374
375 @Override376 public String name(){377 return "FRank";378 }379
380 @Override381 public void printParameters(){382 PRINTLN("Number of iterations: \t"+nIterations);383 }384
385 public double eval(DataPoint p){386 double score = 0.0;387 for(int j=0;j<wRankers.size();j++){
54
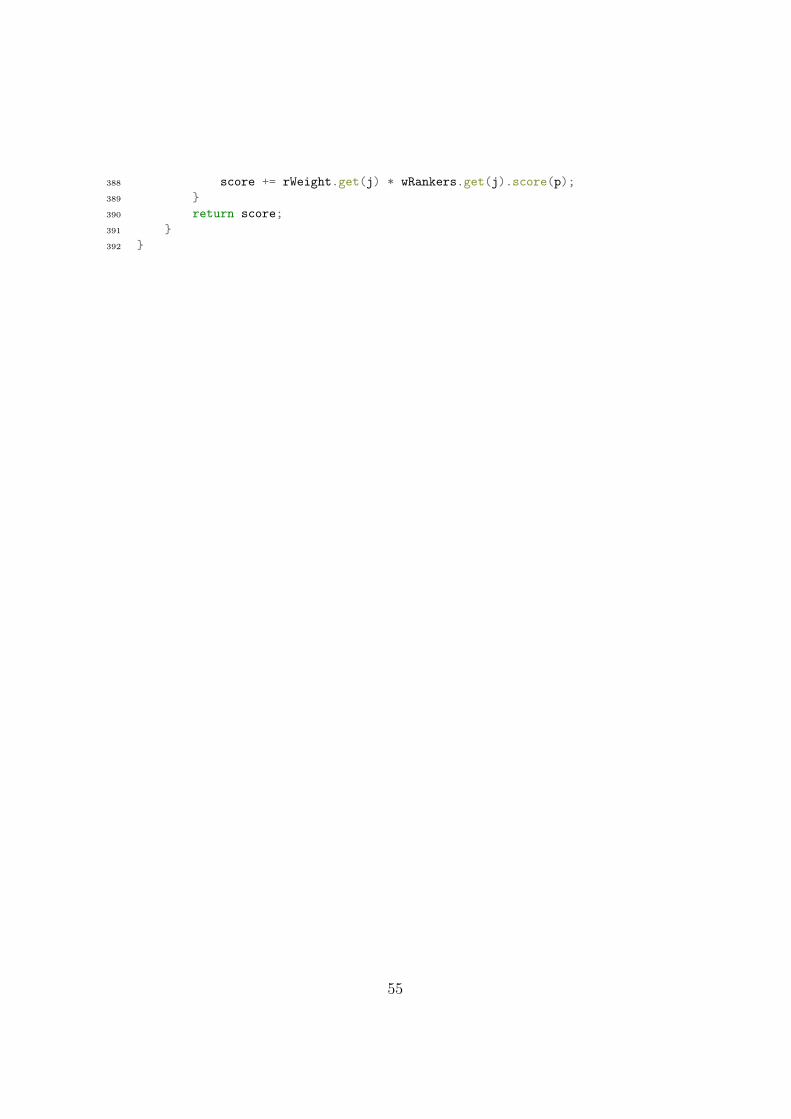
388 score += rWeight.get(j) * wRankers.get(j).score(p);389 }390 return score;391 }392 }
55
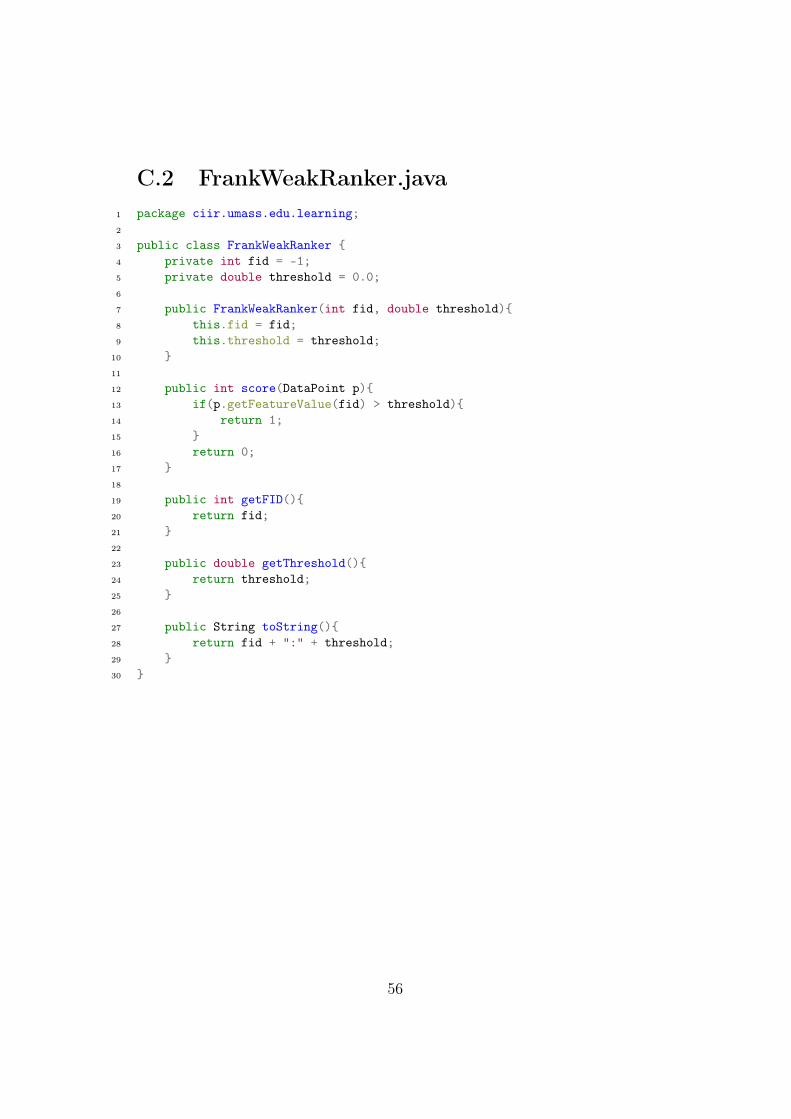
C.2 FrankWeakRanker.java1 package ciir.umass.edu.learning;2
3 public class FrankWeakRanker {4 private int fid = -1;5 private double threshold = 0.0;6
7 public FrankWeakRanker(int fid, double threshold){8 this.fid = fid;9 this.threshold = threshold;
10 }11
12 public int score(DataPoint p){13 if(p.getFeatureValue(fid) > threshold){14 return 1;15 }16 return 0;17 }18
19 public int getFID(){20 return fid;21 }22
23 public double getThreshold(){24 return threshold;25 }26
27 public String toString(){28 return fid + ":" + threshold;29 }30 }
56
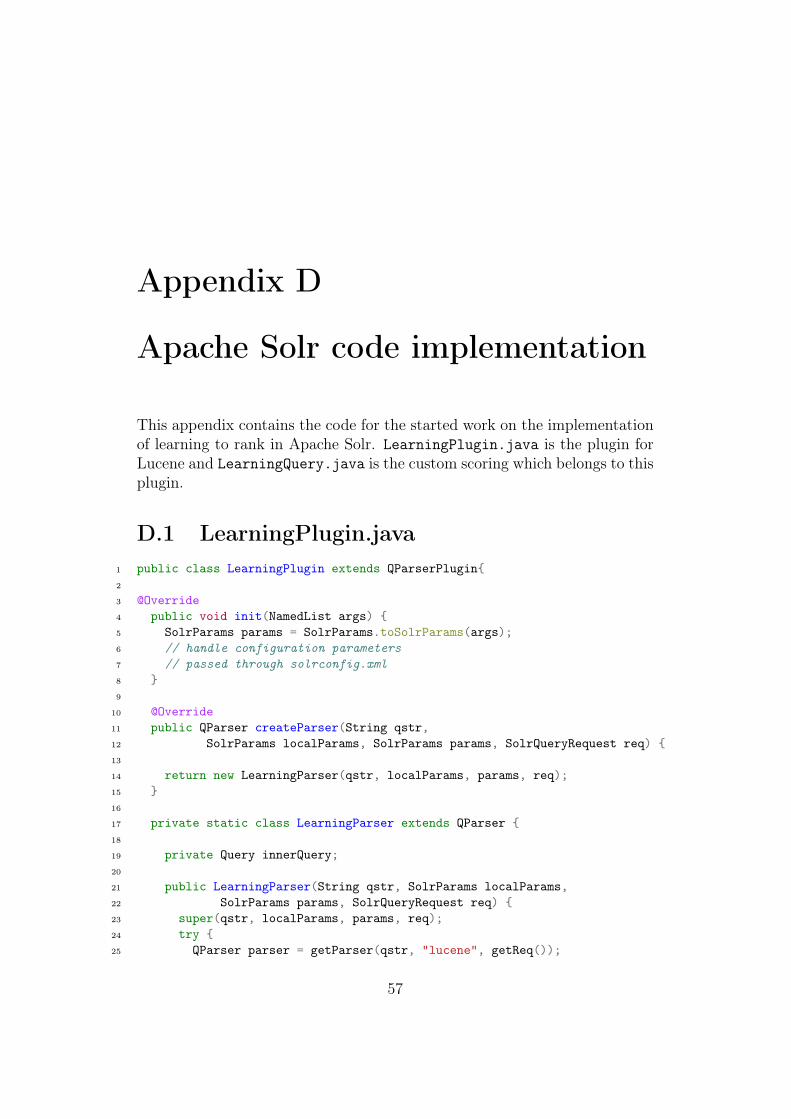
Appendix D
Apache Solr code implementation
This appendix contains the code for the started work on the implementationof learning to rank in Apache Solr. LearningPlugin.java is the plugin forLucene and LearningQuery.java is the custom scoring which belongs to thisplugin.
D.1 LearningPlugin.java1 public class LearningPlugin extends QParserPlugin{2
3 @Override4 public void init(NamedList args) {5 SolrParams params = SolrParams.toSolrParams(args);6 // handle configuration parameters7 // passed through solrconfig.xml8 }9
10 @Override11 public QParser createParser(String qstr,12 SolrParams localParams, SolrParams params, SolrQueryRequest req) {13
14 return new LearningParser(qstr, localParams, params, req);15 }16
17 private static class LearningParser extends QParser {18
19 private Query innerQuery;20
21 public LearningParser(String qstr, SolrParams localParams,22 SolrParams params, SolrQueryRequest req) {23 super(qstr, localParams, params, req);24 try {25 QParser parser = getParser(qstr, "lucene", getReq());
57
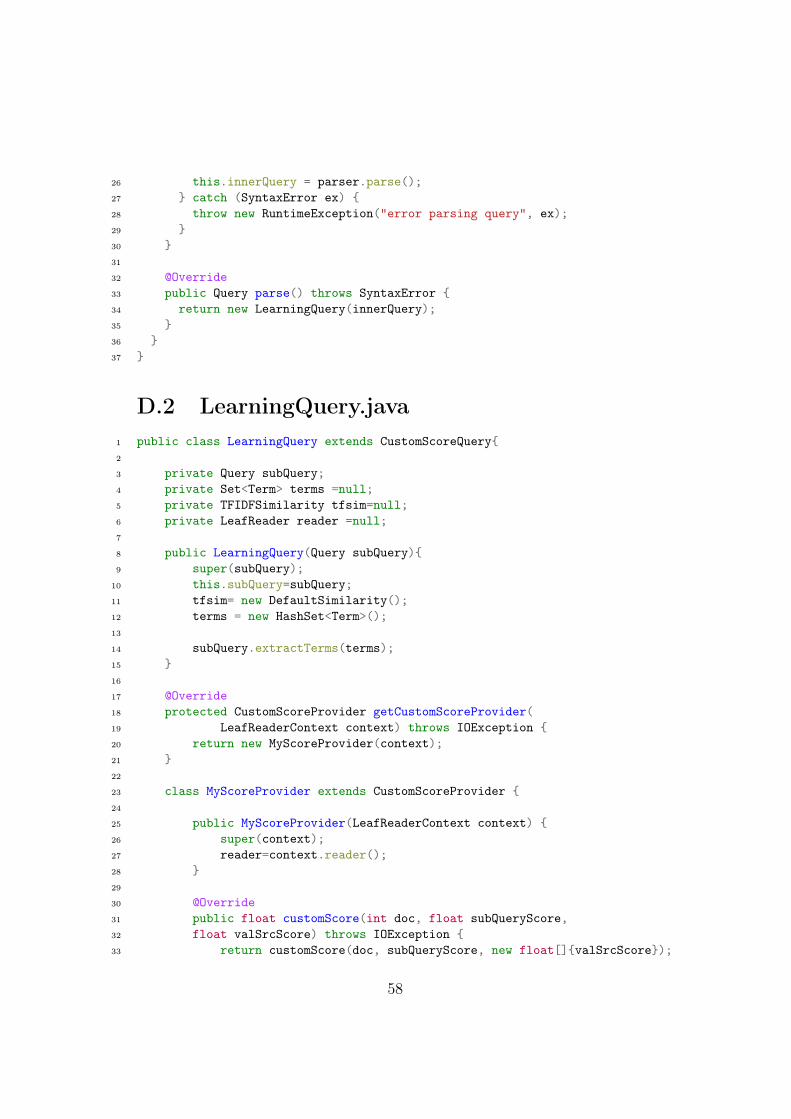
26 this.innerQuery = parser.parse();27 } catch (SyntaxError ex) {28 throw new RuntimeException("error parsing query", ex);29 }30 }31
32 @Override33 public Query parse() throws SyntaxError {34 return new LearningQuery(innerQuery);35 }36 }37 }
D.2 LearningQuery.java1 public class LearningQuery extends CustomScoreQuery{2
3 private Query subQuery;4 private Set<Term> terms =null;5 private TFIDFSimilarity tfsim=null;6 private LeafReader reader =null;7
8 public LearningQuery(Query subQuery){9 super(subQuery);
10 this.subQuery=subQuery;11 tfsim= new DefaultSimilarity();12 terms = new HashSet<Term>();13
14 subQuery.extractTerms(terms);15 }16
17 @Override18 protected CustomScoreProvider getCustomScoreProvider(19 LeafReaderContext context) throws IOException {20 return new MyScoreProvider(context);21 }22
23 class MyScoreProvider extends CustomScoreProvider {24
25 public MyScoreProvider(LeafReaderContext context) {26 super(context);27 reader=context.reader();28 }29
30 @Override31 public float customScore(int doc, float subQueryScore,32 float valSrcScore) throws IOException {33 return customScore(doc, subQueryScore, new float[]{valSrcScore});
58
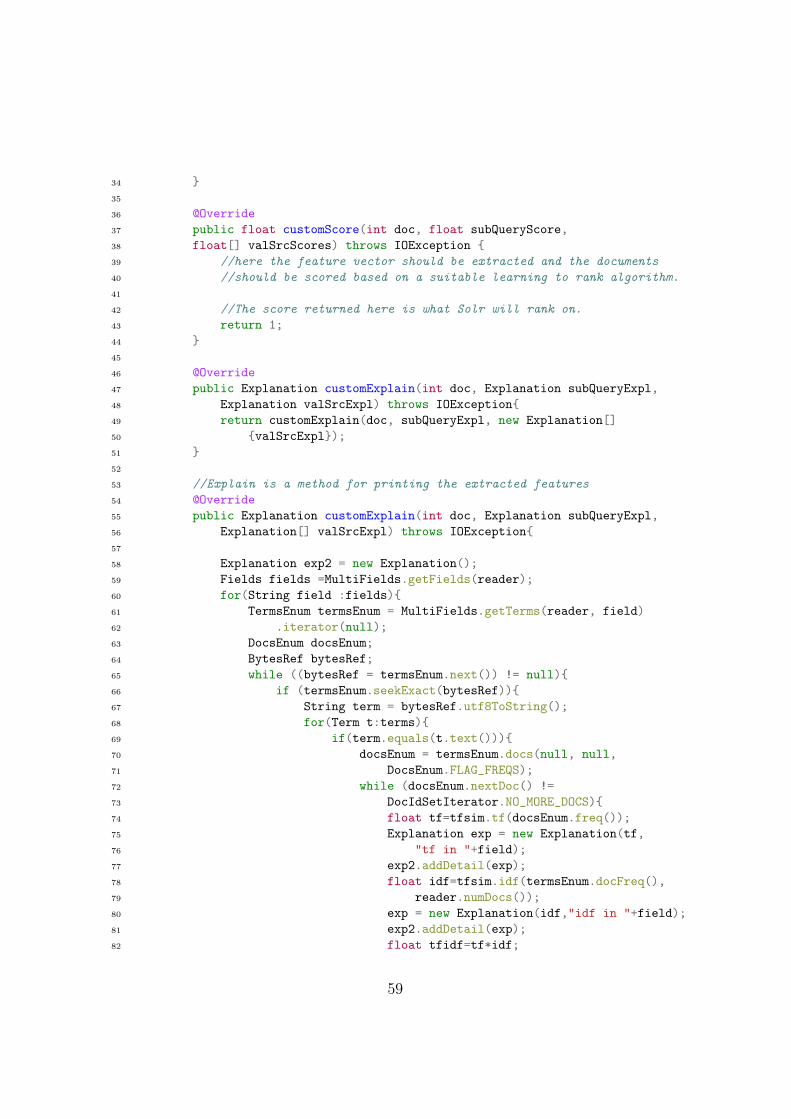
34 }35
36 @Override37 public float customScore(int doc, float subQueryScore,38 float[] valSrcScores) throws IOException {39 //here the feature vector should be extracted and the documents40 //should be scored based on a suitable learning to rank algorithm.41
42 //The score returned here is what Solr will rank on.43 return 1;44 }45
46 @Override47 public Explanation customExplain(int doc, Explanation subQueryExpl,48 Explanation valSrcExpl) throws IOException{49 return customExplain(doc, subQueryExpl, new Explanation[]50 {valSrcExpl});51 }52
53 //Explain is a method for printing the extracted features54 @Override55 public Explanation customExplain(int doc, Explanation subQueryExpl,56 Explanation[] valSrcExpl) throws IOException{57
58 Explanation exp2 = new Explanation();59 Fields fields =MultiFields.getFields(reader);60 for(String field :fields){61 TermsEnum termsEnum = MultiFields.getTerms(reader, field)62 .iterator(null);63 DocsEnum docsEnum;64 BytesRef bytesRef;65 while ((bytesRef = termsEnum.next()) != null){66 if (termsEnum.seekExact(bytesRef)){67 String term = bytesRef.utf8ToString();68 for(Term t:terms){69 if(term.equals(t.text())){70 docsEnum = termsEnum.docs(null, null,71 DocsEnum.FLAG_FREQS);72 while (docsEnum.nextDoc() !=73 DocIdSetIterator.NO_MORE_DOCS){74 float tf=tfsim.tf(docsEnum.freq());75 Explanation exp = new Explanation(tf,76 "tf in "+field);77 exp2.addDetail(exp);78 float idf=tfsim.idf(termsEnum.docFreq(),79 reader.numDocs());80 exp = new Explanation(idf,"idf in "+field);81 exp2.addDetail(exp);82 float tfidf=tf*idf;
59
83 exp = new Explanation(tfidf,"tf-idf in "+84 field);85 exp2.addDetail(exp);86
87 }88 }89 else{90 //if no field match all fields are 091 Explanation exp = new Explanation(0,"tf in "+92 field);93 exp2.addDetail(exp);94 exp = new Explanation(0,"idf in "+field);95 exp2.addDetail(exp);96 exp = new Explanation(0,"tf-idf in "+field);97 exp2.addDetail(exp);98 }99 }
100 }101 }102 }103 return exp2;104 }105 }106 }
60
Bibliography
N.D. Birrell and P.C.W. Davies. Quantum Fields in Curved Space. Cam-bridge Monographs on Mathematical Physics. Cambridge University Press,1984. ISBN 9780521278584. URL http://books.google.se/books?id=SEnaUnrqzrUC.
Leo Breiman. Random forests. Mach. Learn., 45(1):5–32, October 2001.ISSN 0885-6125. doi: 10.1023/A:1010933404324. URL http://dx.doi.org/10.1023/A:1010933404324.
Chris Burges, Tal Shaked, Erin Renshaw, Ari Lazier, Matt Deeds, NicoleHamilton, and Greg Hullender. Learning to rank using gradient descent.In Proceedings of the 22Nd International Conference on Machine Learning,ICML ’05, pages 89–96, New York, NY, USA, 2005. ACM. ISBN 1-59593-180-5. doi: 10.1145/1102351.1102363. URL http://doi.acm.org/10.1145/1102351.1102363.
Christopher J. C. Burges, Robert Ragno, and Quoc V. Le. Learning toRank with Nonsmooth Cost Functions. In Bernhard Schölkopf, John C.Platt, Thomas Hoffman, Bernhard Schölkopf, John C. Platt, and ThomasHoffman, editors, NIPS, pages 193–200. MIT Press, 2006. ISBN 0-262-19568-2.
Zhe Cao, Tao Qin, Tie-Yan Liu, Ming-Feng Tsai, and Hang Li. Learningto rank: From pairwise approach to listwise approach. In Proceedingsof the 24th International Conference on Machine Learning, ICML ’07,pages 129–136, New York, NY, USA, 2007. ACM. ISBN 978-1-59593-793-3. doi: 10.1145/1273496.1273513. URL http://doi.acm.org/10.1145/1273496.1273513.
Ben Carterette. Precision and recall. In LING LIU and M.TAMER ÖZSU,editors, Encyclopedia of Database Systems, pages 2126–2127. Springer US,2009. ISBN 978-0-387-35544-3. doi: 10.1007/978-0-387-39940-9_5050.URL http://dx.doi.org/10.1007/978-0-387-39940-9_5050.
61
Olivier Chapelle, Yi Chang, and Tie-Yan Liu, editors. Proceedings of theYahoo! Learning to Rank Challenge, held at ICML 2010, Haifa, Israel,June 25, 2010, volume 14 of JMLR Proceedings, 2011. JMLR.org. URLhttp://jmlr.org/proceedings/papers/v14/.
David Cossock and Tong Zhang. Subset ranking using regression. In Pro-ceedings of the 19th Annual Conference on Learning Theory, COLT’06,pages 605–619, Berlin, Heidelberg, 2006. Springer-Verlag. ISBN 3-540-35294-5, 978-3-540-35294-5. doi: 10.1007/11776420_44. URL http://dx.doi.org/10.1007/11776420_44.
Koby Crammer and Yoram Singer. Pranking with ranking. In Advancesin Neural Information Processing Systems 14, pages 641–647. MIT Press,2001.
Van Dang. RankLib. Online, 2011. URL http://www.cs.umass.edu/~vdang/ranklib.html. [Online; accessed 14-April-2015].
Yoav Freund, Raj Iyer, Robert E. Schapire, and Yoram Singer. An efficientboosting algorithm for combining preferences. J. Mach. Learn. Res., 4:933–969, December 2003. ISSN 1532-4435. URL http://dl.acm.org/citation.cfm?id=945365.964285.
Jerome H. Friedman. Greedy function approximation: A gradient boostingmachine. Annals of Statistics, 29:1189–1232, 2000.
Starr R. Hiltz and Murray Turoff. Structuring computer-mediated com-munication systems to avoid information overload. Commun. ACM, 28(7):680–689, July 1985. ISSN 0001-0782. doi: 10.1145/3894.3895. URLhttp://doi.acm.org.proxy.lib.chalmers.se/10.1145/3894.3895.
Thorsten Joachims. Optimizing search engines using clickthrough data. InProceedings of the Eighth ACM SIGKDD International Conference onKnowledge Discovery and Data Mining, KDD ’02, pages 133–142, NewYork, NY, USA, 2002. ACM. ISBN 1-58113-567-X. doi: 10.1145/775047.775067. URL http://doi.acm.org/10.1145/775047.775067.
Amy N. Langville and Carl D. Meyer. Google’s PageRank and Beyond: TheScience of Search Engine Rankings. Princeton University Press, Princeton,NJ, USA, 2006. ISBN 0691122024.
Charles L. Lawson and Richard J. Hanson. Solving least squares problems.Classics in applied mathematics. SIAM, Philadelphia (Pa.), 1995. ISBN
62
0-89871-356-0. URL http://opac.inria.fr/record=b1080804. SIAM :Society of industrial and applied mathematics.
H. Li. Learning to Rank for Information Retrieval and Natural LanguageProcessing: Second Edition. Synthesis Lectures on Human Language Tech-nologies. Morgan & Claypool Publishers, 2014. ISBN 9781627055857. URLhttp://books.google.se/books?id=lModBQAAQBAJ.
Ping Li, Qiang Wu, and Christopher J. Burges. Mcrank: Learning to rankusing multiple classification and gradient boosting. In J.C. Platt, D. Koller,Y. Singer, and S.T. Roweis, editors, Advances in Neural InformationProcessing Systems 20, pages 897–904. Curran Associates, Inc., 2008.URL http://papers.nips.cc/paper/3270-mcrank-learning-to-rank-using-multiple-classification-and-gradient-boosting.pdf.
Tie-Yan Liu. Learning to Rank for Information Retrieval. Springer, 2011.ISBN 978-3-642-14266-6. doi: 10.1007/978-3-642-14267-3. URL http://dx.doi.org/10.1007/978-3-642-14267-3.
Christopher D. Manning, Prabhakar Raghavan, and Hinrich Schütze. Intro-duction to Information Retrieval. Cambridge University Press, New York,NY, USA, 2008. ISBN 0521865719, 9780521865715.
Massimo Melucci. Vector-space model. In LING LIU and M.TAMER ÖZSU,editors, Encyclopedia of Database Systems, pages 3259–3263. Springer US,2009. ISBN 978-0-387-35544-3. doi: 10.1007/978-0-387-39940-9_918.URL http://dx.doi.org/10.1007/978-0-387-39940-9_918.
Donald Metzler and W. Bruce Croft. Linear feature-based models for in-formation retrieval. Inf. Retr., 10(3):257–274, June 2007. ISSN 1386-4564. doi: 10.1007/s10791-006-9019-z. URL http://dx.doi.org/10.1007/s10791-006-9019-z.
Tao Qin and Tie-Yan Liu. Introducing letor 4.0 datasets. CoRR,abs/1306.2597, 2013. URL http://dblp.uni-trier.de/db/journals/corr/corr1306.html#QinL13.
Tao Qin, Tie-Yan Liu, Jun Xu, and Hang Li. Letor: A benchmark collectionfor research on learning to rank for information retrieval. Inf. Retr., 13(4):346–374, August 2010. ISSN 1386-4564. doi: 10.1007/s10791-009-9123-y.URL http://dx.doi.org/10.1007/s10791-009-9123-y.
63
S. E. Robertson. The Probability Ranking Principle in IR. Journal of Doc-umentation, 33(4):294–304, 1977. doi: 10.1108/eb026647. URL http://dx.doi.org/10.1108/eb026647.
Stephen Robertson and Hugo Zaragoza. The probabilistic relevance frame-work: Bm25 and beyond. Found. Trends Inf. Retr., 3(4):333–389, April2009. ISSN 1554-0669. doi: 10.1561/1500000019. URL http://dx.doi.org/10.1561/1500000019.
Robert E. Schapire. A brief introduction to boosting. In Proceedings ofthe 16th International Joint Conference on Artificial Intelligence - Volume2, IJCAI’99, pages 1401–1406, San Francisco, CA, USA, 1999. MorganKaufmann Publishers Inc. URL http://dl.acm.org/citation.cfm?id=1624312.1624417.
Ming-Feng Tsai, Tie-Yan Liu, Tao Qin, Hsin-Hsi Chen, and Wei-Ying Ma.Frank: a ranking method with fidelity loss. In SIGIR 2007: Proceedings ofthe 30th Annual International ACM SIGIR Conference on Research andDevelopment in Information Retrieval, Amsterdam, The Netherlands, July23-27, 2007, pages 383–390, 2007. doi: 10.1145/1277741.1277808. URLhttp://doi.acm.org/10.1145/1277741.1277808.
Qiang Wu, Christopher J. Burges, Krysta M. Svore, and Jianfeng Gao.Adapting boosting for information retrieval measures. Inf. Retr., 13(3):254–270, June 2010. ISSN 1386-4564. doi: 10.1007/s10791-009-9112-1.URL http://dx.doi.org/10.1007/s10791-009-9112-1.
Jun Xu and Hang Li. Adarank: A boosting algorithm for information re-trieval. In Proceedings of the 30th Annual International ACM SIGIR Con-ference on Research and Development in Information Retrieval, SIGIR ’07,pages 391–398, New York, NY, USA, 2007. ACM. ISBN 978-1-59593-597-7. doi: 10.1145/1277741.1277809. URL http://doi.acm.org/10.1145/1277741.1277809.
64