Learning to Grasp Objects: A Novel Approach for Localizing ...
7
Learning to Grasp Objects: A Novel Approach for Localizing Objects Using Depth Based Segmentation Deepak Rao, Arda Kara, Serena Yeung (Under the guidance of Quoc V. Le) Stanford University Abstract We consider the problem of grasping novel objects with a robotic arm. A recent successful technique applies machine learning to identify a point in an image corresponding to the most likely location at which to grasp an object. An- other approach extends their method to accomodate grasps with multiple contact points. This paper proposes a novel approach that tries to find graspable points in an object af- ter localizing it. We present a depth based segmentation scheme for object localization and discuss how depth infor- mation can be combined with visual imagery to improve the performance of both segmentation and object localization. 1. Introduction The problems of image segmentation and object local- ization remain great challanges for computer vision, hav- ing received continous attention since the birth of the field. The last few years have seen considerable progress in eigen- vector based methods of image segmentation. These meth- ods are too slow to be practical for many applications. The state of the art approach for segmenting an im- age into regions uses graph based representation of the image[2]. Although, the method works better than its coun- terparts, it has some limitations. Since the algorithm is based entirely on pixel intensities it works poorly in scenes having shadows or more than one light source. The task of object localization involves drawing a tight bounding box around all instances of an object class within the image. This paper aims to highlight some of the draw- backs of using color based segmentation for localizing an object. Figure 1 shows an example of an object composed of multiple colors. Performing color based segmentation on the object results in different segments all belonging to the same object. Taking into account these limitations and drawbacks we propose a segmentation framework for ob- ject localization that combines depth information with vi- sual imagery (color/intensity). The next section gives a de- Figure 1: Example of an object composed of muliple colors tailed comparison between the two approaches. The intuition behind using the depth data for segmenta- tion came from [4] in which Quigley et al used high resolu- tion 3D data for improving object detection. We conducted experiments to prove that localizing objects after perform- ing our proposed model of segmentation works better than localization performed after segmentation using [2]. A de- tailed explanation of our approach along with the experi- mental results have been given in the following sections. 2. Segmentation Our system makes use of both depth and colored image data. To capture depth, we used an active triangulation sen- sor [4]. An important feature of this sensor is that it gives a very detailed depth data (also called depth map or point cloud). Since color is an important attribute for segmenta- tion, we added a functionality in ROS [6] that enabled us to capture 3 channel colored images. Figure 2 gives an idea of tha data captured by our robot. Graph based image segmentation [2] tries to create a graph based representataion of an image and finds the ev- idence of a boundary between regions based on L 2 -Norm between the intensity of pixels. ||I (p i ) - I (p j )|| 2 >τ (1) where I (p i ) ∈ R 3 is the intensity of the pixel p i and τ is the threshold function. If the L 2 Norm between the intensities is greater than
Transcript of Learning to Grasp Objects: A Novel Approach for Localizing ...

Learning to Grasp Objects: A Novel Approach for Localizing Objects UsingDepth Based Segmentation
Deepak Rao, Arda Kara, Serena Yeung(Under the guidance of Quoc V. Le)
Stanford University
Abstract
We consider the problem of grasping novel objects with arobotic arm. A recent successful technique applies machinelearning to identify a point in an image corresponding tothe most likely location at which to grasp an object. An-other approach extends their method to accomodate graspswith multiple contact points. This paper proposes a novelapproach that tries to find graspable points in an object af-ter localizing it. We present a depth based segmentationscheme for object localization and discuss how depth infor-mation can be combined with visual imagery to improve theperformance of both segmentation and object localization.
1. Introduction
The problems of image segmentation and object local-ization remain great challanges for computer vision, hav-ing received continous attention since the birth of the field.The last few years have seen considerable progress in eigen-vector based methods of image segmentation. These meth-ods are too slow to be practical for many applications.
The state of the art approach for segmenting an im-age into regions uses graph based representation of theimage[2]. Although, the method works better than its coun-terparts, it has some limitations. Since the algorithm isbased entirely on pixel intensities it works poorly in sceneshaving shadows or more than one light source.
The task of object localization involves drawing a tightbounding box around all instances of an object class withinthe image. This paper aims to highlight some of the draw-backs of using color based segmentation for localizing anobject. Figure 1 shows an example of an object composedof multiple colors. Performing color based segmentationon the object results in different segments all belonging tothe same object. Taking into account these limitations anddrawbacks we propose a segmentation framework for ob-ject localization that combines depth information with vi-sual imagery (color/intensity). The next section gives a de-
Figure 1: Example of an object composed of muliple colors
tailed comparison between the two approaches.The intuition behind using the depth data for segmenta-
tion came from [4] in which Quigley et al used high resolu-tion 3D data for improving object detection. We conductedexperiments to prove that localizing objects after perform-ing our proposed model of segmentation works better thanlocalization performed after segmentation using [2]. A de-tailed explanation of our approach along with the experi-mental results have been given in the following sections.
2. SegmentationOur system makes use of both depth and colored image
data. To capture depth, we used an active triangulation sen-sor [4]. An important feature of this sensor is that it givesa very detailed depth data (also called depth map or pointcloud). Since color is an important attribute for segmenta-tion, we added a functionality in ROS [6] that enabled us tocapture 3 channel colored images. Figure 2 gives an idea oftha data captured by our robot.
Graph based image segmentation [2] tries to create agraph based representataion of an image and finds the ev-idence of a boundary between regions based on L2-Normbetween the intensity of pixels.
||I(pi) − I(pj)||2 > τ (1)
where I(pi) ∈ R3 is the intensity of the pixel pi and τ isthe threshold function.
If the L2 Norm between the intensities is greater than

Figure 2: Image and depth data captured by our robot.
the threshold function then the pixels are considered to bein different regions.
As discussed earlier, segmentating an image truly on thebasis of color is not the correct approach. The advantage ofdepth data allowed us to extend the approach in [2]. Westick with the same scheme of representing an image asa graph but updated the metric for finding boundaries be-tween regions to include the depth data.
||WT ∗ (F (pi) − F (pj))||2 > τ (2)
where F (pi) ∈ R4 is the intensity of the pixel pi hav-ing an extra dimension of depth value corresponding to thatlocation in 3D space, W ∈ R4 is the weight vector assign-ing weights to different elements of F and τ is the thresholdfunction.
The intuition behind including weights in the equationwas to rank the elements in order of their importance. Thisapproach allowed us to give greater weight to the depthvalue and smaller but equal weights to the intensities. An-other approach could have been to learn the weights thatgive the best segmentation but due the comparitively smallsize of features, we decided to hand tune the weights to pro-duce good results.
2.1. Comparison
Figure 3 shows the comparison between the two segmen-tation approaches. It can be seen in Figure 3a that athoughthe method proposed in [2] works well to segment the scene,it is not robust to small color changes. This results in a largenumber of artefacts on the table and the wall which ide-ally should have been a part of the single parent segment.The limitations of segmenting an image only on the basis ofcolor can be cleary seen in this example. Another observa-tion that made us to use a combination of depth and colorfor segmentation was the inability of the base algorithm tohandle shadows. All these factors contributed to our hy-pothesis that segmentation based purely on color would notbe ideal for object localization.
In order to prove our hypothesis we decided to localizeobjects using both the approaches and compare their scores.Object localization involves drawing a tight bounding box
(a) Regular Segmentation
(b) Proposed Segmentation
Figure 3: Comparison between the two approaches.
around an object. Over the years, the complexity of theproblem has led to various approaches and different algo-rithms to solve the same. This made it difficult to choosea standard recognized scoring system to compare our ap-proaches. All these constraints led us to make our ownintuitive scoring scheme that was able to compare the ap-proaches pretty well.
We took 200 images from the robot having different ob-jects at varied positions to compare our approaches. Thiswas followed by manually labelling the objects using theImage Sequence Labeler in Stair Vision Library [5]. Thehuman label for the object was considered to be the groundtruth upon which our scoring scheme is based. Once the la-belling was done we ran both the segmentation algorithmson the dataset and made bounding boxes around all the ob-tained segments. Figure 4 gives an illustration of the same.The green bounding box drawn around the object was theground truth label.
The approach while designing the scoring frameworkwas based on finding the individual scores for every imageand then use those scores to determine the final score of thealgorithm.

Figure 4: Image obtained after drawing bounding boxesaround all the segments.
The scoring scheme can be broken into the followingparts:
Ai,j = F (Si,j , Gi)
where Ai,j is the area of overlap between obtained seg-ments Si,j and ground truth Gi.
Ri,j = min(Ai,j
Asi,j,Ai,j
Agi)
where Asi,j is the area of segment Si,j and Agi is theground truth area of Gi.
Θi =Ni∑j
Ri,jexp(ζ ∗ Ri,j)
ωi =Ni∑j
exp(ζ ∗ Ri,j)
where Ni is the number of segments in image i and ζ issome constant.
Score =
∑Mi
Θi
ωi
M(3)
where M is the number of images in the dataset.The scoring scheme to some extent can be consid-
ered as a weighted average of individual scores where theweights are exponential. The intuition behind exponentialweights came from the idea that the segments similar tothe groundtruth would have a higher value of R and henceshould be given more weight.
After designing the scoring scheme we plotted a graphshowing the comparison of scores between the two ap-proaches at various thresholds. As portrayed in Figure 5our algorithm outperforms the base algorithm at almost ev-ery threshold. The scores are relatively smaller at low and
Figure 5: Performance of the two methods.
high thresholds because of over and under segmenation re-spectively. This proved our hypothesis that segmentationbased only on color is not ideal for object localization.
After observing the graph we decided to change Equa-tion 2 to include the threshold that gives the optimal perfor-mance.
τo = arg maxτεT Φ(Score, τ)
||WT ∗ (F (pi) − F (pj))||2 > τo (4)
3. Classifier Design and Feature SelectionIn this section we briefly touch upon the features that
were used by our classifier to localize objects. Before de-signing the classifier for object localization we needed tolabel segments of all the images as positive or negative.The bounding boxes of all the segments were assigned pos-itive or negative labels based on their overlap ratio with thegroundtruth.
In our proposed framework, we consider features fromvisual and depth data. A brief description of all the featuresand the intuition behind choosing them is elucidated in thefollowing sections
3.1. Bag of features
The features were chosen such that they give a true repre-sentation of the bounding box. The width, height, area andaspect ratio are a measure of the geometry of the boundingbox while distance from left and right edge gives an ideaabout its position. Historically, researchers have avoided theuse of color based features due to computational and philo-sophical reasons. The computational trade-off is obvious,and the philosophical reason being that humans can performthese task of localization without color information as well.Since, the proposed segmentation framework already usescolor data we decided to use some color features as well.

(a) Area (b) Height
(c) Width (d) Aspect ratio
(e) Distance from the left edge (f) Distance from the right edge
(g) Variance of L (Lightness) (h) Variance of a
(i) Variance of b (j) Variance of depth
Figure 6: Feature vector plots for all the features.

In order to make the classifer robust to lighting changes weconverted the color space from RGB to Lab. Instead of us-ing raw color values or mean as features we decided to gowith variance. Variance of L, a and b within the boundingbox were chosen to be the color features. To complete thefeature vector we needed a depth feature and hence decidedto go with variance of depth within the bounding box. Theintuition behind chosing variance came from the fact that itis a higher degree feature and probably a better indicator ofthe state of the object within the bounding box.
3.2. Feature selection
After selecting the features explained in previous sec-tion, we trained a SVM model to classify bounding boxesas positive or negative. Surprisingly, the SVM failed toconverge. To get a better understanding of the reason wecreated a feature vector plot for all the features (see Figure6 ). There were some interesting insights after studying thefeature plots which in turn served as a motivation for ournext step. We decided to perform forward search to find theoptimal subset of features. As expected, the best featuresubset returned by forward search was:
{width, height, area, variance of L, varianceof a, variance of b, variance of depth}
It can be seen from Figure 6 that the feature plots of dis-tance from both edges and aspect ratio are randomly dis-tributed and were the main reason for making the data in-separable. Hence, these features were omitted from the fea-ture vector and SVM model was trained using the remainingfeatures. Table 1 shows the rank of different features.
3.3. Grasping
The localization model we proposed takes a new testscene and finds all bounding boxes that have a high prob-ability of containing an object. This is followed by calcu-lating centroids of the bounding boxes in 3D space by map-ping them with the point cloud. To test our localization ap-proach we considered the centroid to be best grasping pointand tried to grasp the object at that point.
4. Experimental Results
We consider two sets of experiments. The first set ofexperiments is performed offline to the test the accuracy ofthe classifier for localizing objects. In the second set wecompare our method with [1] when grasping a novel object.We perform all experiments with the Barrett hand havingthree fingers.
Rank Features1 Variance of a2 Variance of b3 Variance of depth4 Area5 Variance of L6 Width7 Height
Table 1: Feature Ranks
Figure 8: Accuracy versus number of folds of the SVMmodel for object localization.
4.1. Offline test
Our dataset consists of 200 images and their corre-spondig depth data. The dataset consists of different objectsat varied positions. It is further divided into 353 positivesegments and 4216 negative segments. This test is totallyoffline, i.e. without robotic execution. The goal of the testis to determine the accuracy of the classifier for object local-ization. We tried to test the accuracy by performing k foldcross validation on the dataset. Figure 8 shows the resultsof the test. The accuracy increases as we increase the num-ber of folds (i.e. training data) and becomes constant aftersome time. This shows that the classifier needs only a cer-tain amount of data for training after which the improvemetin accuracy becomes negligible.
4.2. Grasping novel objects
Figure 9 shows the STAIR2 robot grasping a nerf gun. Inthis section we try to compare our grasping results with [1].The comparison is not a totally fair because our grasping ap-proach remains static and is independent of the size,shapeand orientation of the object. Still, there were some interest-ing insights for objects that dont necessarily have an idealgrasping point like nerf gun, football, foam and joystick.Surprisingly, our algorithm outperformed the algorithm in[1] for those objects that are non-uniform in their compos-
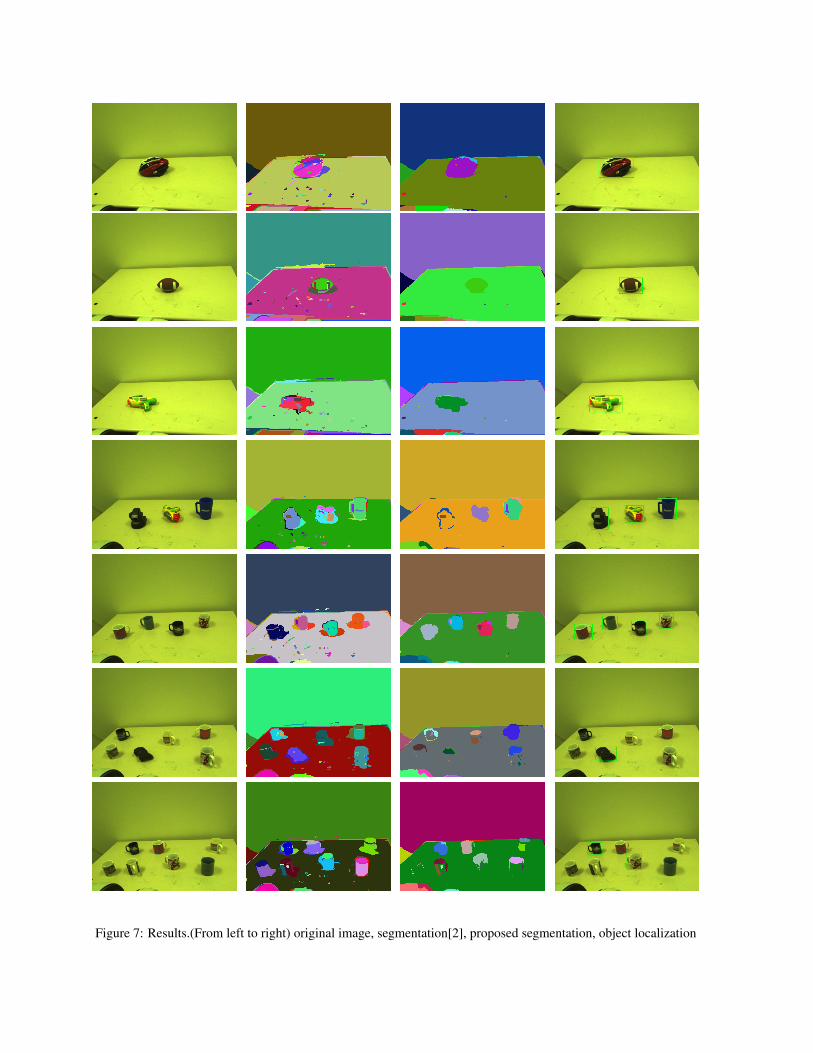
Figure 7: Results.(From left to right) original image, segmentation[2], proposed segmentation, object localization
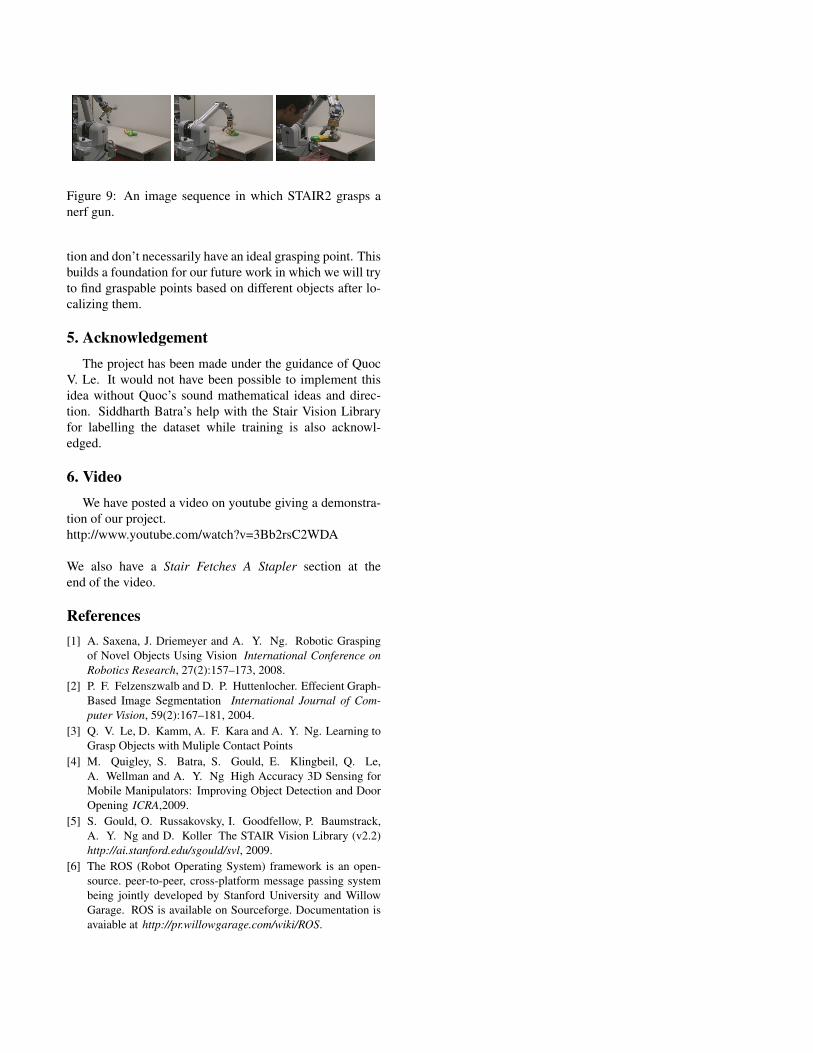
Figure 9: An image sequence in which STAIR2 grasps anerf gun.
tion and don’t necessarily have an ideal grasping point. Thisbuilds a foundation for our future work in which we will tryto find graspable points based on different objects after lo-calizing them.
5. AcknowledgementThe project has been made under the guidance of Quoc
V. Le. It would not have been possible to implement thisidea without Quoc’s sound mathematical ideas and direc-tion. Siddharth Batra’s help with the Stair Vision Libraryfor labelling the dataset while training is also acknowl-edged.
6. VideoWe have posted a video on youtube giving a demonstra-
tion of our project.http://www.youtube.com/watch?v=3Bb2rsC2WDA
We also have a Stair Fetches A Stapler section at theend of the video.
References[1] A. Saxena, J. Driemeyer and A. Y. Ng. Robotic Grasping
of Novel Objects Using Vision International Conference onRobotics Research, 27(2):157–173, 2008.
[2] P. F. Felzenszwalb and D. P. Huttenlocher. Effecient Graph-Based Image Segmentation International Journal of Com-puter Vision, 59(2):167–181, 2004.
[3] Q. V. Le, D. Kamm, A. F. Kara and A. Y. Ng. Learning toGrasp Objects with Muliple Contact Points
[4] M. Quigley, S. Batra, S. Gould, E. Klingbeil, Q. Le,A. Wellman and A. Y. Ng High Accuracy 3D Sensing forMobile Manipulators: Improving Object Detection and DoorOpening ICRA,2009.
[5] S. Gould, O. Russakovsky, I. Goodfellow, P. Baumstrack,A. Y. Ng and D. Koller The STAIR Vision Library (v2.2)http://ai.stanford.edu/sgould/svl, 2009.
[6] The ROS (Robot Operating System) framework is an open-source. peer-to-peer, cross-platform message passing systembeing jointly developed by Stanford University and WillowGarage. ROS is available on Sourceforge. Documentation isavaiable at http://pr.willowgarage.com/wiki/ROS.