LEARNING SEQUENCE 1 · • How much of the sky is covered with clouds? • What types of clouds are...
21
LEARNING SEQUENCE 1 THE GLOBE PROGRAM What causes storms to form? How does temperature relate to cloud formation? What is different about a sunny day and a stormy day? How does air move and change when a storm is forming? Can we identify the best conditions for storms?
Transcript of LEARNING SEQUENCE 1 · • How much of the sky is covered with clouds? • What types of clouds are...
LEARNING SEQUENCE 1
THE GLOBE PROGRAM
What causes storms to form?
How does temperature relate to cloud formation?
What is different about a sunny day and a stormy day?
How does air move and change when a storm is forming?
Can we identify the best conditions for storms?

GLOBE Weather | LS1: Lesson 2: Student Activity Sheet6
Watching cloud shapes and how they change over time can give you clues about what’s happening in the sky.
STEP 1: What can we learn about storms by watching clouds in the sky? Working in pairs or small groups, write your ideas below. (Use complete sentences.)
STEP 2: What do you notice about the sunny day compared to the stormy day? Observe the clouds in the time-lapse videos and record your observations below.
Why do you think that the storm formed on one day and not the other?Write your ideas below, using complete sentences.
What causes storms to form?
SUNNY DAY STORMY DAY
Name Period Date
© 2019 University Corporation for Atmospheric Research. All Rights Reserved.

GLOBE Weather | LS1: Lesson 2: Student Activity Sheet7
STEP 3: Draw how a storm forms throughout the day. Think about the time-lapse video of a stormy day. Draw what the weather is like at different times throughout the day, using each of the boxes below. Include what you know about how clouds, water, air, and sunshine move and change throughout the day.
MORNING 9:00AM MID-DAY 12:00PM
NIGHTTIME 9:00PMAFTERNOON 3:00PM
What causes storms to form?
© 2019 University Corporation for Atmospheric Research. All Rights Reserved.

GLOBE Weather | LS1: Lesson 2: Student Activity Sheet8
STOP AND THINK Answer the questions below.
Clouds and storms are typically high above the ground. If you could investigate the air up high compared to the air near the ground, what do you think you would notice?
What measurements about the air would you want to take from different altitudes?
How might those measurements help us figure out how clouds form?
STEP 4: Make observations of clouds in the sky!
Watch the sky for clues about what’s happening with weather in your community. Follow your teacher’s instructions for making observations and remember to never look directly at the Sun.
Remember to look for:
• How much of the sky is covered with clouds?
• What types of clouds are in the sky?
• Are the clouds opaque or can you see through them?
3 km
2 km
1 km
4 km
5 km
6 km
2017
Cloud Identification Chart
Cumulonimbus
Cumulus
Hig
hM
idLo
w
Cirrus
AltocumulusAltostratus
Stratus
Nimbostratus
Stratocumulus
Fog
Altit
ude
of C
loud
Bas
e
Cumulonimbus
Cumulus
Hig
hM
idLo
w
Cirrus CirrostratusCirrostratus
AltocumulusAltostratus
Stratus
CirrocumulusCirrocumulus
Persistent Non-Spreading Persistent SpreadingShort-lived Persistent Non-Spreading Persistent SpreadingShort-lived
Nimbostratus
Stratocumulus
Fog
Altit
ude
of C
loud
Bas
e
Con
trai
ls
THE GLOBE PROGRAM
CONVECTIVECLOUDS
Sponsored by: Supported by: Implemented by:
What causes storms to form?
Download the GLOBE Observer Clouds App (observer.globe.gov) to make cloud observations and take pictures that can be compared with NASA satellite images. This helps scientists understand the sky from above and below.
Identify clouds using the GLOBE Cloud Chart (globe.gov/globecloudchart).
© 2019 University Corporation for Atmospheric Research. All Rights Reserved.

GLOBE Weather | LS1: Lesson 3: Student Activity Sheet9
Weather balloons carry instruments into the atmosphere to collect temperature data at different altitudes – from near the ground to up where clouds form and even higher. In this lesson you’ll explore data collected by a weather balloon to learn about how air changes with altitude.
STEP 1: Use the temperature near the ground to predict the other temperatures. Fill in the blanks in the graphic at the right to make a prediction about how air temperature changes with altitude.
STEP 2: Collect temperature data. At a computer or tablet, open the Virtual Ballooning interactive (scied.ucar.edu/virtual-ballooning). With this simulation you can launch virtual weather balloons and record the temperature at different altitudes in the atmosphere.
1. Click “Explore the Troposphere” to get into the game.
2. Get to know the graph. Notice that altitude is on the vertical axis (the y-axis) and temperature is on the horizontal axis (the x-axis).
3. Choose settings for a balloon launch. Each balloon you launch will make three measurements of temperature. Set the altitude to start recording the temperature by dragging the “Collect Data” arrow up or down the y-axis.
4. Click the “Launch Balloon” button and watch as your balloon collects temperature data.
5. Record that temperature in the table on the next page. Read the points that the balloon made on the graph to find the temperature at different altitudes.
6. Click the “New Flight” button and choose new settings for another balloon launch to collect more data. Collect as much data as you can with four balloon launches.
How does temperature relate to cloud formation?
Name Period Date
© 2019 University Corporation for Atmospheric Research. All Rights Reserved.
21º C
º C
º C
º C

GLOBE Weather | LS1: Lesson 3: Student Activity Sheet10
STEP 2 CONTINUED: Collect temperature data.
STEP 3: Analyze and interpret the data.
1. Describe the pattern you see in the temperature data from the ground to where storm clouds form.
2. Is this the pattern you predicted? Why or why not?
3. What do you think is causing the temperature pattern?
4. How does the temperature pattern relate to storms forming? (Draw or write your ideas below.)
How does temperature relate to cloud formation?lo
w c
lou
ds
hig
h c
lou
ds
© 2019 University Corporation for Atmospheric Research. All Rights Reserved.
10 km
9 km
8 km
7 km
6 km
5 km
4 km
3 km
2 km
1 km
0 km
ALTITUDE TEMPERATURE (˚C)

GLOBE Weather | LS1: Lesson 3: Student Activity Sheet11
STEP 4: How do air and surface temperatures change during a day?To learn why air temperature changes with altitude, take a look at how the temperature of the ground (surface temperature) relates to the temperature of the air just above the ground (air temperature) in the graph below. Students at Westview Middle School in Longmont, Colorado, collected the data in this graph. Every hour during a day they measured surface temperature and air temperature outside their school.
Compare the two data trends in the graph by following these directions:
Write a caption for the graph that compares the two data trends.
1. Look at different parts of the graph. Do you notice patterns? Do you notice interesting differences? Write What I See statements on the graph to record your observations.
2. Share your statements when directed by your teacher.
1. Next to each What I See statement, write a What It Means statement to explain what you think is happening in each part of the graph.
2. Share your statements when directed by your teacher.
WHAT I SEE WHAT IT MEANS
How does temperature relate to cloud formation?
0
5
10
15
20
25
8:30 9:30 10:30 11:30 12:30 1:30 2:30 3:30
Tem
per
atu
re (º
C)
TEMPERATURE MEASUREMENTSWestview Middle School, Longmont, CO • March 20, 2018
air temperature
surface temperature
Time of Day
Sunrise: 7:04am, Sunny 7:04am - 11:00am Party cloudy 11:00am- 2:00pm Sunny 2:00pm- 3:30pm
© 2019 University Corporation for Atmospheric Research. All Rights Reserved.
GLOBE Weather | LS1: Lesson 3: Student Activity Sheet12
How does temperature relate to cloud formation?
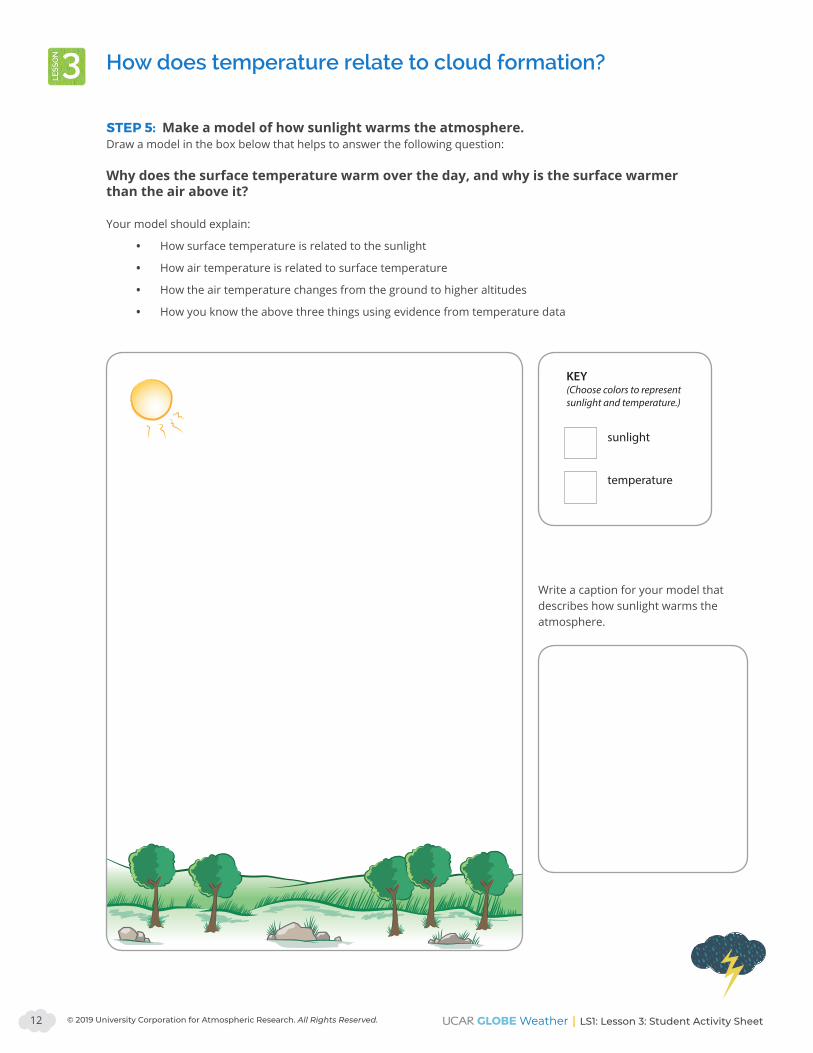
STEP 5: Make a model of how sunlight warms the atmosphere.Draw a model in the box below that helps to answer the following question:
Why does the surface temperature warm over the day, and why is the surface warmer than the air above it?
Your model should explain:
• How surface temperature is related to the sunlight
• How air temperature is related to surface temperature
• How the air temperature changes from the ground to higher altitudes
• How you know the above three things using evidence from temperature data
Write a caption for your model that describes how sunlight warms the atmosphere.
sunlight
KEY (Choose colors to represent sunlight and temperature.)
temperature
© 2019 University Corporation for Atmospheric Research. All Rights Reserved.

GLOBE Weather | LS1: Lesson 3: Student Activity Sheet13
How does temperature relate to cloud formation?
STEP 6: How does your model relate to storms?There wasn’t a storm on the day when the Westview Middle School students collected surface temperature and air temperature data, but it did get cloudy in the afternoon.
The time-lapse video showed that clouds started to build in the morning and by afternoon there was rain.
Write a sentence to answer the question: How do you think temperature relates to the clouds and storm forming?
List evidence from your model to support your answer above.
Describe the reason that the evidence you listed supports your answer.
© 2019 University Corporation for Atmospheric Research. All Rights Reserved.

GLOBE Weather | LS1: Lesson 4: Student Activity Sheet14
STEP 1: Compare air temperatures on a sunny day and a stormy day. Do stormy days have a different pattern than sunny days? Answer the questions using the graphs of temperature data below.
What is different about a sunny day and a stormy day?
Name Period Date
1. Describe the sunny day pattern.
2. Describe the stormy day pattern.
3. Looking only at the temperature data, when do you think the rain happened, and why? Circle where the rain begins on the stormy day graph.
© 2019 University Corporation for Atmospheric Research. All Rights Reserved.
GLOBE Weather | LS1: Lesson 4: Student Activity Sheet15
What is different about a sunny day and a stormy day?
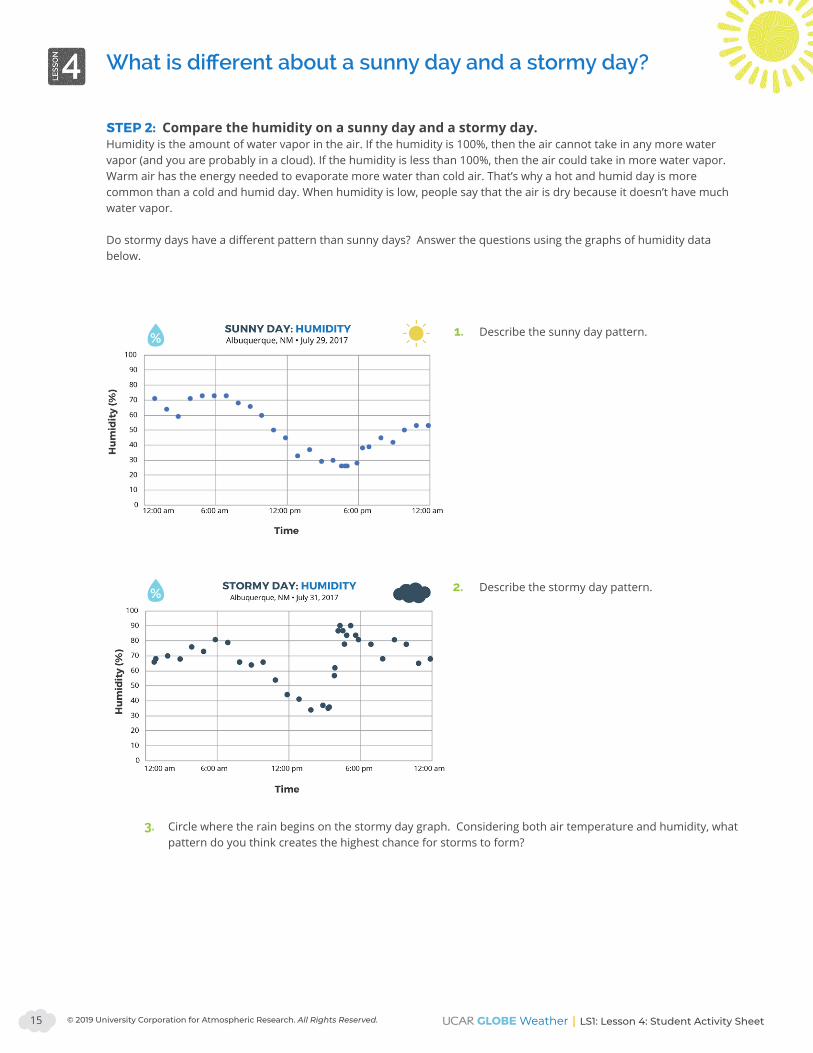
STEP 2: Compare the humidity on a sunny day and a stormy day.Humidity is the amount of water vapor in the air. If the humidity is 100%, then the air cannot take in any more water vapor (and you are probably in a cloud). If the humidity is less than 100%, then the air could take in more water vapor. Warm air has the energy needed to evaporate more water than cold air. That’s why a hot and humid day is more common than a cold and humid day. When humidity is low, people say that the air is dry because it doesn’t have much water vapor.
Do stormy days have a different pattern than sunny days? Answer the questions using the graphs of humidity data below.
1. Describe the sunny day pattern.
2. Describe the stormy day pattern.
3. Circle where the rain begins on the stormy day graph. Considering both air temperature and humidity, what pattern do you think creates the highest chance for storms to form?
© 2019 University Corporation for Atmospheric Research. All Rights Reserved.

GLOBE Weather | LS1: Lesson 4: Student Activity Sheet16
What is different about a sunny day and a stormy day?
STEP 3: Make a storm in a bottle.Using what you know about temperature and relative humidity, create a model of a sunny day and a stormy day using clear bottles with different contents.
1. Draw what you put inside each of your bottles. Label the materials that you added.
2. Turn on the lamp (to represent the Sun) and observe the bottles for 20 minutes. Add your observations about the temperature and humidity of each bottle to the pictures above. Use the data table on the next page to record temperature and humidity changes in your bottles.
SUNNY DAY STORMY DAY
© 2019 University Corporation for Atmospheric Research. All Rights Reserved.

GLOBE Weather | LS1: Lesson 4: Student Activity Sheet17
What is different about a sunny day and a stormy day?
3. Discuss the following questions with your peers:
• Did the sunny day bottle match what you expected? If not, what happened?
• Did the stormy day bottle match what you expected? If not, what happened?
• Using evidence from the bottles and the temperature and humidity data, what conditions are best for storms?
Measure the temperature with your thermometer and record. Look for evidence of humidity, such as condensation on the inside of the bottle, and make notes about it in the table below.
© 2019 University Corporation for Atmospheric Research. All Rights Reserved.
SUNNY DAY BOTTLE STORMY DAY BOTTLE
2
4
6
8
10
12
14
16
18
20
MINUTE TEMPERATURE (˚C)
TEMPERATURE (˚C)HUMIDITY HUMIDITY

GLOBE Weather | LS1: Lesson 5: Student Activity Sheet18
Your teacher will demonstrate how air changes as it is heated or cooled. This will help you figure out what happens to air that warms near the surface, and air that cools at higher altitudes.
STEP 1: Observe warmed and cooled air. Draw the lab set-up and what happens to the balloon during the demonstration. Add your observations to your drawing as you make them. Remember to label what is happening.
1. Why does the heated balloon go up? Think about what is happening inside the balloon.
2. What is happening inside the balloon when the balloon starts to sink?
How does air move and change when a storm is forming?
Name Period Date
© 2019 University Corporation for Atmospheric Research. All Rights Reserved.
LAB SET-UP MYLAR BALLOON BEING HEATED
MYLAR BALLOON AS IT COOLS

GLOBE Weather | LS1: Lesson 5: Student Activity Sheet19
How does air move and change when a storm is forming?
STEP 2: Air on the MoveThere is something different between warm and cool air that causes warm air to go up and cool air to go down. When the air inside the balloon was warmed, the balloon expanded and went up. When the air inside the balloon cooled, the balloon started to shrink and go down. Let’s think a little more about this air and what is happening when it is warmed and cooled. To understand this, we are going to need to zoom in and think about what’s happening to the air molecules.
Imagine you can see a pocket of air molecules heated up. When air is heated, the heat energy is absorbed by the individual molecules, causing them to move around more quickly. The molecules move faster and farther apart. When molecules release their energy, they start to slow down and cluster closer together. This happens when the molecules no longer have a heat source and are “cooling.”
Draw a diagram that shows what 20 warmed air molecules look like inside the mylar balloon compared to 20 cooler air molecules.
So, that’s how warm air and cool air are different. But why do they move in different directions? To understand that, we’re going to need to zoom out and think about the whole planet and gravity.
COLD AIR WARM AIR
© 2019 University Corporation for Atmospheric Research. All Rights Reserved.
BALLOON WITH WARM AIR BALLOON WITH COOL AIR

GLOBE Weather | LS1: Lesson 5: Student Activity Sheet20
How does air move and change when a storm is forming?
STEP 2 CONTINUED: Air on the Move
Gravity is the force that draws all objects towards the center of the planet. Even tiny things like air molecules are affected by gravity and pulled downward. The weight of the air molecules higher in the atmosphere pushes air molecules lower in the atmosphere closer together. High in the atmosphere, they are spaced father apart. Air molecules pushed close together are at high pressure. Air molecules spread apart are at low pressure.
Draw air molecules between the planet and the top of the atmosphere. Remember that they will be spaced differently depending on whether they are close to the ground or higher in the atmosphere.
TOP OF THE ATMOSPHERE
SPACE
TOP OF THE ATMOSPHERE
SPACE
© 2019 University Corporation for Atmospheric Research. All Rights Reserved.
air molecules
KEY

GLOBE Weather | LS1: Lesson 5: Student Activity Sheet21
How does air move and change when a storm is forming?
STEP 2 CONTINUED: Air on the Move
When sunlight warms the land, and then warms the air near it, the molecules spread out a bit, taking up more space, just like the air at high altitude. The warmed air has lower pressure than the air around it, so it rises in the atmosphere, like the warmed balloon in the previous activity.
As the warmed air rises in the atmosphere, it cools down, because air at higher altitudes is cooler. Remember that cool air doesn’t hold as much water vapor as warm air, so as warm air cools, some of the water vapor condenses into the tiny water droplets that make up clouds.
As air gets cooler, the molecules come closer together. The air has higher pressure than the air around it, so it sinks in the atmosphere, like the cooled balloon in the previous activity. Then, it can be warmed and rise again.
This cycle of rising and falling air is called convection.
EXPLAIN: Why does warm air go up and cool air go down?
Warm air
rises.
Warmed air molecules
spread apart.
Air cools higher in the atmosphere.
Cool air
sinks.
Cooled air molecules are closer together.
© 2019 University Corporation for Atmospheric Research. All Rights Reserved.

GLOBE Weather | LS1: Lesson 5: Student Activity Sheet22
How does air move and change when a storm is forming?
STEP 3: Create a model to describe how precipitation happens in an isolated storm.
To get started, draw and write in the illustration to explain how precipitation happens in an isolated storm.
Make sure your model explains:
• What happens to energy from the Sun that leads to an isolated storm?
• What happens to water at the surface and clouds that lead to the isolated storm?
• How does air temperature and humidity change as air moves from the ground to the cloud?
• How does air move between the ground and where the storm forms?
Write an explanation that goes with your model and answer the question below:
EXPLAIN: What has to happen for an isolated storm to form?
© 2019 University Corporation for Atmospheric Research. All Rights Reserved.

GLOBE Weather | LS1: Lesson 6: Student Activity Sheet23
STEP 1: Make predictions. Use your model for an isolated storm, and what you know about temperature and humidity, to predict the very best conditions that would lead to an isolated storm.
A strong storm would form if the temperature high in the atmosphere near the clouds was
much colder than much warmer than about the same as
the temperature near the ground because
A strong storm would form if humidity was high moderate low
because
Can we identify the best conditions for storms?
Name Period Date
© 2019 University Corporation for Atmospheric Research. All Rights Reserved.

GLOBE Weather | LS1: Lesson 6: Student Activity Sheet24
STEP 2: Record and explain your observations. Now you can test your predictions with the Make a Thunderstorm simulation (scied.ucar.edu/make-thunderstorm). Follow your teacher’s instructions for collecting data from the simulation. Record your observations of five trials in the table below. Then explain why a storm did or did not form.
Can we identify the best conditions for storms?
© 2019 University Corporation for Atmospheric Research. All Rights Reserved.
CONDITIONS OUTCOME WHY DID THIS HAPPEN?Explain what helped the storm or what was missing.
no stormsmall storm medium stormbig storm
no stormsmall storm medium stormbig storm
no stormsmall storm medium stormbig storm
no stormsmall storm medium stormbig storm
no stormsmall storm medium stormbig storm
high-level temp
humidity
low-level temp
high-level temp
humidity
low-level temp
high-level temp
humidity
low-level temp
high-level temp
humidity
low-level temp
high-level temp
humidity
low-level temp

GLOBE Weather | LS1: Lesson 6: Student Activity Sheet25
STEP 3: When did it rain? The air temperature and humidity data below is from two days in Pompano, Florida. It rained on one of these days. Identify the most likely day and time it rained.
1. Circle on the graph when the rain happened.
2. Explain what conditions were likely leading up to this rain event, and why you think the rain happened at this time. Use evidence from previous investigations and your model to develop your explanation.
Can we identify the best conditions for storms?
© 2019 University Corporation for Atmospheric Research. All Rights Reserved.