Learning Path Construction in e-Learning
205
• • •
-
Upload
dangnguyet -
Category
Documents
-
view
221 -
download
2
Transcript of Learning Path Construction in e-Learning

Durham E-Theses
Learning Path Construction in e-Learning � What to
Learn and How to Learn?
YANG, FAN
How to cite:
YANG, FAN (2013) Learning Path Construction in e-Learning � What to Learn and How to Learn?,Durham theses, Durham University. Available at Durham E-Theses Online: http://etheses.dur.ac.uk/3359/
Use policy
The full-text may be used and/or reproduced, and given to third parties in any format or medium, without prior permission orcharge, for personal research or study, educational, or not-for-pro�t purposes provided that:
• a full bibliographic reference is made to the original source
• a link is made to the metadata record in Durham E-Theses
• the full-text is not changed in any way
The full-text must not be sold in any format or medium without the formal permission of the copyright holders.
Please consult the full Durham E-Theses policy for further details.
Academic Support O�ce, Durham University, University O�ce, Old Elvet, Durham DH1 3HPe-mail: [email protected] Tel: +44 0191 334 6107
http://etheses.dur.ac.uk

Learning Path Construction in
e-Learning – What to Learn and
How to Learn?
Fan Yang
A Thesis presented for the degree of
Doctor of Philosophy
School of Engineering and Computing Sciences
University of Durham
United Kingdom
Supervisors: Frederick. Li, Rynson Lau
November 2012

i
Dedicated to
My Supervisors –Dr. Frederick Li and Prof. Rynson Lau
For their guidance and help
and
My Parents
For their care and support
i
Learning Path Construction in e-Learning –
What to Learn and How to Learn?
Fan Yang
Submitted for the degree of Doctor of Philosophy
2012
Abstract
Whether in traditional or e learning, it is important to consider: what to learn,
how to learn, and how well students have learned. Since there are various
types of students with different learning preferences, learning styles, and
learning abilities, it is not easy to provide the best learning approach for a
specific student. Designing learning contents for different students is very
time consuming and tedious for teachers. No matter how the learning process
is carried out, both teachers and students must be satisfied with students’
learning performance.
Therefore, it is important to provide helpful teaching and learning
guidance for teachers and students. In order to achieve this, we proposed a
fined-grained outcome-based learning path model, which allows teachers to
explicitly formulate learning activities as the learning units of a learning path.
This allows teachers to formulate the assessment criteria related to the
subject-specific knowledge and skills as well as generic skills, so that the
pedagogy could be defined and properly incorporated. Apart from defining the
pedagogical approaches, we also need to provide tailored learning contents of
the courses, so that different types of students can better learn the knowledge
according to their own learning abilities, knowledge backgrounds, etc. On the
other hand, those learning contents should be well-structured, so that
students can understand them. To achieve this, we have proposed a learning

Abstraction
path generation method based on Association Link Network to automatically
identify the relationships among different Web resources. This method makes
use of the Web resources that can be freely obtained from the Web to form
well-structured learning resources with proper sequences for delivery.
Although the learning path defines what to learn and how to learn, we still
needed to monitor student learning progress in order to determine proper
learning contents and learning activities in an e-Learning system. To address
the problem, we proposed the use of student progress indicators based on
Fuzzy Cognitive Map to analyze both performance and non-performance
attributes and their causal relationships. The aim is to help teachers improve
their teaching approaches and help students reflect their strengths and
weaknesses in learning. . This research focuses on the intelligent tutoring e-
Learning system, which provides an intelligent approach to design and
delivery learning activities in a learning path. Many experiments and
comparative studies on both teachers and students have been carried out in
order to evaluate the research of this PhD thesis. The results show that our
research can effectively help teachers generate high quality learning paths,
help students improve their learning performance, and offer both teachers
and students a better understanding on student learning progress.
Keywords: Learning path, learning activity, learning outcome, student
learning progress, learning resources.

iii
Declaration
The work in this thesis is based on research carried out in the School of
Engineering and Computing Sciences, University of Durham, England. No
part of this thesis has been submitted elsewhere for any other degree or
qualification and it is all my own work unless referenced to the contrary in
the text.
Copyright © 2012 by Fan Yang.
“The copyright of this thesis rests with the author. No quotations from it
should be published without the author’s prior written consent and
information derived from it should be acknowledged”.
iv
Acknowledgments
I would like to extend my appreciation and gratitude to the following
persons for their contributions to this research study.
First and foremost, I must thank my supervisor Dr. Frederick Li
and Prof. Rynson Lau for their invaluable academic guidance over the past
few years, for their patience to teach me to prepare papers and talks, and
also for their help and care for my personal life. Their constructive
criticism and comments are highly appreciated. Without their advices,
support and encouragements, this thesis would be impossible. They are
truly great mentors for me.
Especially, I would like to thank Prof. Rynson Lau again for
inviting me to visit his research lab in City University of Hong Kong for 3
times, 6 months in total. I am so appreciate these valuable opportunity to
work over international cooperation, and provide me a lot of chances to
participate in some international conferences where I learned a lot do
contribute to my research and future career.
I would like to thank Prof. Uden and Dr. Ivrissimtizis who are my
examiners, and they have helped me a lot to find out the problems of this
thesis. I cannot have this degree without their helps.
I also want to acknowledge Prof Xiangfeng Luo for advising me
many bright ideas to overcome the academic problems, and also guiding
me in programming in details. I greatly appreciate that he supported me
to visit his research lab in University of Shanghai for six months. I have
learned many things from his group and had an enjoyable time there.
I acknowledge University of Durham for its funding support over my PhD.
Many thanks also go to Qingzheng Zheng, Wei Lu, Yang Zhuang,

Abstraction
Steven Huang for their friendship.
Most of all, my wholehearted thanks go to my mother and father for
their unconditional love, support, companion, encouragement, concern,
understanding and inspiration.

vi
Table of Contents
Abstract ................................................................................................................. i
Declaration ......................................................................................................... iii
Acknowledgments .............................................................................................. iv
1. Introduction .................................................................................................. 1
1.1. Research Overview ............................................................................. 1
1.2. Definition .............................................................................................. 2
1.2.1. e-Learning .................................................................................... 3
1.2.2. Learning Outcomes ................................................................... 3
1.2.3. Learning Resources .................................................................. 4
1.2.4. Learning Activity ....................................................................... 5
1.2.5. Learning Path ............................................................................. 6
1.2.6. Student Learning Progress .................................................... 7
1.3. Motivation ............................................................................................. 8
1.4. Challenges ............................................................................................. 9
1.5. Research Objectives .......................................................................... 11
1.6. Contributions ..................................................................................... 12
1.7. Organization ....................................................................................... 13
2. Background ................................................................................................. 15
2.1. Learning Theory ................................................................................ 16
2.2. e-Learning ........................................................................................... 17
2.2.1. Types of Learning .................................................................... 17

Table of Contents vii
2.2.2. Types of e-Learning ................................................................ 19
2.3. Learning Taxonomy ......................................................................... 23
2.3.1. Bloom’s Taxonomy .................................................................. 23
2.3.2. Gagne’s Taxonomy .................................................................. 24
2.3.3. SOLO Taxonomy ...................................................................... 25
2.3.4. Finks Taxonomy ....................................................................... 25
2.3.5. Subsection Summary .............................................................. 26
2.4. Learning Styles .................................................................................. 26
2.5. Learning Modes ................................................................................. 27
2.6. Student Assessment .......................................................................... 28
2.7. Performance Inference Algorithms ............................................. 30
2.8. Association Link Network .............................................................. 34
2.9. System Development Tools of the Research ............................. 35
Jgraph ...................................................................................................... 36
Ext JS ....................................................................................................... 36
PHP ........................................................................................................... 36
MySQL ...................................................................................................... 36
Apache ...................................................................................................... 37
Tomcat ..................................................................................................... 37
Web Services .......................................................................................... 37
JSP ............................................................................................................ 38
Excel ......................................................................................................... 38
2.10. Summary ...................................................................................... 38
3. Research Methodology ............................................................................... 40

Table of Contents viii
3.1. Introduction ....................................................................................... 40
3.2. Research Design ................................................................................ 41
3.3. Instrument .......................................................................................... 42
3.3.1. A Fine-grained Outcome-based Learning Path Model . 43
3.3.2. Learning Path Construction based on Association Link
Network ................................................................................................... 44
3.3.3. Fuzzy Cognitive Map based Student Progress
Indicators ................................................................................................ 45
3.4. Participants ........................................................................................ 46
3.4.1. A Fine-grained Outcome-based Learning Path Model . 46
3.4.2. Learning Path Construction based on Association Link
Network ................................................................................................... 46
3.4.3. Fuzzy Cognitive Map based Student Progress
Indicators ................................................................................................ 47
3.5. Study Variables ................................................................................. 47
3.5.1. A Fine-grained Outcome-based Learning Path Model . 47
3.5.2. Learning Path Construction based on Association Link
Network ................................................................................................... 48
3.5.3. Fuzzy Cognitive Map based Student Progress
Indicators ................................................................................................ 49
3.6. Proposed Data Analysis .................................................................. 51
3.6.1. A Fine-grained Outcome-based Learning Path Model . 51
3.6.2. Learning Path Construction based on Association Link
Network ................................................................................................... 52
3.6.3. Fuzzy Cognitive Map based Student Progress
Indicators ................................................................................................ 53

Table of Contents ix
3.7. Research Ethics ................................................................................. 53
3.8. Summary .............................................................................................. 54
4. Method for constructing a Fine-Grained Outcome-based Learning Path
Model ................................................................................................................. 55
4.1. Introduction ....................................................................................... 56
4.2. Related Work ...................................................................................... 58
4.2.1. Conventional Classroom Teaching ..................................... 58
4.2.2. Learning Path Generation System ..................................... 59
4.2.3. Designing and Managing Learning Activities ................ 60
4.3. The Fine-grained Outcome-based Learning Path Model ...... 61
4.3.1. Overview of the Learning Path Model .............................. 61
4.3.2. Formal Definitions .................................................................. 63
4.3.3. Discussions ................................................................................ 72
4.4. Implementation ................................................................................. 73
4.5. User Study Results and Analysis ................................................. 80
4.6. Summary .............................................................................................. 85
5. Learning Path Construction based on Association Link Network ............ 86
5.1. Introduction ....................................................................................... 87
5.2. Related Work ...................................................................................... 89
5.2.1. Learning Resources Construction ...................................... 89
5.2.2. Learning Path Generation Algorithm ............................... 90
5.3. The Teacher Knowledge Model ..................................................... 90
5.4. Student Knowledge Model and Personalized Learning Path
95
Table of Contents x
5.5. Student Assessment against Learning Resources ................. 100
5.6. Evaluation Results and Analysis ................................................ 103
5.6.1. Compare the Importance of Manually Selected and
System Recommended Learning Paths ........................................ 104
5.6.2. Comparison of Performance on Two Groups of Students
106
5.7. Summary ............................................................................................ 109
6. Fuzzy Cognitive Map based Student Progress Indicators ........................ 111
6.1. Introduction ...................................................................................... 112
6.2. Related Work ..................................................................................... 113
6.2.1. Student Attributes .................................................................. 113
6.2.2. Student Assessment ............................................................... 114
6.2.3. Student Grouping ................................................................... 116
6.3. Mathematics Model ......................................................................... 117
6.3.1. Modeling of Student Attribute Descriptors .................... 117
6.3.2. Student Progress Indicators .............................................. 123
6.4. Experiment Results and Analysis .............................................. 126
6.4.1. Experiment Data Collection ............................................... 126
6.4.2. Progress and Development in Different Stages ........... 126
6.4.3. Progress and Development of Student Groups in
Different Subjects ................................................................................ 131
6.5. Evaluation ......................................................................................... 132
6.6. Summary ............................................................................................ 134
7. Conclusion and Future Work ................................................................... 136
7.1. Introduction ..................................................................................... 136

Table of Contents xi
7.2. Research Contribution .................................................................. 136
7.2.1. A Fine-grained Outcome-based learning path model . 136
7.2.2. Learning Path Construction based on Association Link
Network ................................................................................................. 138
7.2.3. Fuzzy Cognitive Map based Student Learning Progress
Indicators .............................................................................................. 139
7.3. Limitations and Future work ....................................................... 141
7.4. Conclusion ......................................................................................... 143
References ....................................................................................................... 144
Appendix A ...................................................................................................... 155
Appendix B ...................................................................................................... 168
Appendix C ...................................................................................................... 178
Appendix D– Vitae .......................................................................................... 187

xii
List of Figures
Fig. 4. 1 The learning path formulation in existing work and in our work.
............................................................................................................ 62
Fig. 4. 2 A screen shot of our prototype. ................................................... 74
Fig. 4. 3 Viewing the learning outcome setting at the learning stage level.
............................................................................................................ 76
Fig. 4. 4 Manipulating the learning outcome setting at the learning
activity level. ....................................................................................... 77
Fig. 4. 5 A screen shot showing the progress of a student. ....................... 78
Fig. 4. 6 Learning path for communication skill. ...................................... 79
Fig. 4. 7 Learning path for writing skill. ................................................... 80
Fig. 4. 8 Summary of scores from the questionnaire. ............................... 82
Fig.5.1 An illustration of a keyword-based ALN. ...................................... 94
Fig.5.2 Example of a recommended learning resource. ............................ 98
Fig.5.3 System recommended learning path in 3-ALN. ............................ 99
Fig.5. 4 State understanding & attention: Highlight the major attributes;
Build up associations among topics and keywords. ........................ 101
Fig.5. 5 An example of automatic generated test. ................................... 102
Fig.5.6 Comparison of manually selection and system recommendation
results of learning path in learning resources ALN in terms of
importance degree. ........................................................................... 106
Fig.5.7 Comparison results of two types of learning ............................... 107
Fig.5.8 Comparison of students’ stability of learning performance ....... 108

List of Figures xiii
Fig.6. 1 Early stage performance of S2. ................................................... 127
Fig.6. 2 Interim stage performance of S2. ............................................... 127
Fig.6. 3 Students’ development in NPAs during the interim stage ......... 128
Fig.6. 4 Mature stage performance of S2. ............................................... 129
Fig.6. 5 PPF scores of S2 .......................................................................... 129
Fig.6. 6 Attributes causal relationships ................................................... 130
Fig.6. 7 Continual progress made by S2. .................................................. 131
Fig.6. 8 Student grouping results ............................................................ 132
Fig.6. 9 Evaluation results ....................................................................... 134

ix
List of Tables
Table 4. 1 Definition of major elements .................................................... 64
Table 4. 2 A summary of the Bloom’s taxonomy. ..................................... 65
Table 4. 3 Examples of learning tasks. ...................................................... 67
Table 4. 4 Results of one-way ANOVA analysis. ....................................... 84
Table 4. 5 Comparison between our model and existing methods. .......... 84
Table 5. 1 Topics in the selected learning path in Middle resolution ..... 105
Table 6. 1 Attributes from Bloom’s Taxonomy ......................................... 118
Table 6. 2 Attributes regarding learning styles and learning modes. ...... 118

1
Chapter 1
1. Introduction
1.1. Research Overview
e-Learning can provide various technological support to assist teaching and
learning. This technological support mainly includes developing learning
contents to instruct learning, setting up learning environments to engage
learning, designing platforms and tools to enhance learning, organizing and
standardizing learning resources to make the learning contents reusable and
more formal. Constructing learning path is to organize a set of Units of
Learning (UOL) in sequence and to plan how student learning will happen,
which is actually a critical topic in designing platforms and tools. Because a
learning path contains the information about what to learn and how to learn,
it can help teachers manage student learning and help students improve their
learning efficiency. There are different types of e-Learning systems, including
the traditional e-learning system, adaptive e-Learning system, instructional
design system, intelligent tutoring system, and service-oriented e-learning
system. They are used to focus on long-distance e-Learning system, but now
they focus on different aspects of the e-Learning systems by providing
adaptive teaching approaches and feedbacks, consistent and reliable learning
materials, curriculum sequencing mechanisms, and Web services,
respectively. More details about these e-Learning systems are given in section
2.2.2. Our research provides an intelligent service to design the learning
activities and to arrange the learning path, so that it can be applied to
intelligent tutoring system. Learning path construction (or curriculum
sequencing) organizes a series of learning activities that are disseminated with

Introduction 2
proper teaching approaches to build up student knowledge. As defined in the
work of [Brus92], Intelligent Tutoring System relies on curriculum sequencing
mechanisms to provide students with a learning path through learning
materials, this research on learning path construction is one of the major work
in Intelligent Tutoring System. Existing methods [Farr04, Yang05, Chen08,
Limo09] formulate learning paths based on knowledge elements. While this
allows the e-Learning systems to work out and organize suitable instructional
contents based on the knowledge elements, such as the difficulty levels and
the topic categories of the knowledge elements. However, such a formulation
is not comprehensive enough.
The main concerns of various studies on learning path construction
include how to generate the learning contents for each UOL, how to design the
UOL to support different forms of learning activities, and how to identify the
relationships among UOLs and delivery them in sequence. Our research focus
on providing an intelligent tutoring system to construct learning path which
can pedagogically design teaching strategies based on learning outcomes,
generate learning resources adaptive to different students, and analyse
student learning progress in terms of their performance related attributes as
well as non-performance related attributes. During the learning process of
each UOL, we need to monitor student learning progress and evaluate student
learning performance, so that we will be able to construct the best learning
paths for different types of students according to their learning abilities and
preferences, etc.
1.2. Definition
Before clarifying the motivation of this research, I would like to introduce
some terminologies, which are all very important concepts of this research.
This research improves the e-Learning systems and aims to help students
achieve their learning outcomes. We generate learning resources and
construct learning paths based on learning activities to provide them
what to learn and how to learn. We also measure their learning progress to

Introduction 3
provide more details about student learning to guarantee their learning
qualities.
1.2.1. e-Learning
e-Learning aims to support learning and teaching, transfer knowledge and
skills through web and electronic machines . e-Learning techniques provide
various forms of electronic tools and platforms, teaching and learning
approaches, learning environments, etc. Current research in e-Learning
mainly focuses on several broad aspects, such as technology enhanced
learning, learning resource organization and standardization, and e-
Learning platforms and tools. Technology enhanced learning [Wang05] is
technology-based learning and instructional systems, where students acquire
skills or knowledge with the help of teachers, learning support tools, and
technological resources. Technology enhanced learning investigates the use of
information and communication technologies to help students learn
effectively through a course of study by pedagogically making learning
contents more accessible and providing students with better learning
environments. Learning resource organization and standardization
[Totk04] design models for organizing learning contents, so that the contents
can be easily adopted by different e-Learning systems and reused in various
instructional contexts. On the other hand, e-Learning platforms and tools
[Dagg07], also known as Virtual Learning Environments (VLE), use a mix of
communication technologies and focus on the design and development of the
hardware and software components of e-Learning systems over Web 2.0 for
two-way interaction. Adaptive e-Learning methods [Jere10] tend to find out
an effective way to guide students to learn according to students’ interests, so
that the learning process could be adjusted for different students.
1.2.2. Learning Outcomes
Learning outcomes explain what students are expected to achieve at the end of
a period of learning, which are expressed by the level of competence to be
obtained by the students [Wage08]. Learning outcomes are measurable, so
that they could be used to measure student learning performance, which could
Introduction 4
be cognitive, skill-based, and affective learning outcomes. Learning outcomes
are always being defined by descriptive verbs [Nash]. For example, to define
the terms, to compare the two ideas, to compute the possibility, etc. Learning
outcomes are set to be the criteria of assessing student learning performance.
Subject-specific knowledge and skills, and generic skills could be used to
measure learning outcomes by assessing formative or summative assignments
or examinations. For example, students are expected to describe/explain
knowledge concepts and reach some knowledge levels [Chen05, Guzm07], to
apply research skills [Mitr01, Feng09], or to develop some learning behaviors
[Gres10]. However, learning outcomes in this work can only apply to limited
aspects of learning, which cannot support different designs of learning
activities and cannot be applied to different knowledge disciplines.
1.2.3. Learning Resources
Learning resources [Kara05, Meli09] refer to the structured learning
materials or learning contents that can help students understand some
knowledge concepts and achieve their learning outcomes. Learning resources
could be represented by different types of media [Leac07], such as text, audio,
or video, and are associated with attributes including knowledge domains,
complexities, importance degrees, as well as the relationships among each
other. These attributes of learning resources can facilitate course design that is
adaptive to students [Kara05] who have different knowledge backgrounds,
knowledge levels, etc. In fact, it is not easy to automatically obtain these
attributes from complex and loosely connected learning contents and to use
them to form well-structured learning resources. It is not enough to only
identify suitable learning resources for a student. It is also necessary to
provide students with the relationships among learning resources, because
these relationships explain how knowledge concepts are related each other,
helping students gain a better understanding and improve their learning
performance.

Introduction 5
1.2.4. Learning Activity
A learning activity is a UOL guided by certain teaching approaches based on
some learning outcomes, which is used to construct teaching and learning
approaches. It can be formulated in different forms to facilitate different
learning environments in which different kinds of learning activities require
different learning styles and different learning outcomes. During a learning
activity (LA), a student will follow a particular teaching approach that applies
to the student’s own characteristics, and achieve some learning outcomes in
the learning process. A learning activity is independent of learning contents,
which makes the pedagogies being reused in different knowledge disciplines.
The way to deliver the learning activities indicates a sequence of learning.
Existing works [Farr04, Liu05, Chen06, Hern06, Limo09] generally
adopt lecturing and Q&A as learning activities. However, the situation can be
complicated in practice. First, each learning activity may be very different in
nature from the others, so it requires to be delivered through a different form,
such as lecture, presentation, practical, etc. Also, each learning activity can be
carried out through different learning modes, such as individual learning, and
collaborative learning. A specific or even multiple assessment methods may be
required to determine the student’s learning performance. Second, in different
subject disciplines, even the same type of learning activity may need a very
different kind of assessment method. For example, a “practical” activity for a
programming course may focus on training up the students’ problem-solving
and application skills, while the same activity for a piano course may focus on
fingering and sight-reading. Such practical requirements are so complex that
it becomes difficult to implement a learning path construction system that
generically addresses all of them. This explains why most existing methods
allow only lecturing and Q&A as learning activities, even though this
significantly restricts their usefulness.
During a learning activity, a student can achieve some learning outcomes
by learning the content of it. SCORM [Su06] and IMS Learning Design (IMS-
LD) [Hern06, Amor06] are the major existing standards for designing

Introduction 6
learning path on the basis of Unit of Learning. The sequencing of SCORM
controls the order, selection and delivery of a course, and organizes the UOLs
into a hierarchical structure. The UOLs are actually designed based on given
learning materials and only model a single student’s need. However, SCORM
only concerns learning contents and the sequence of UOL delivery, but not
considers teaching approaches and different types of learning outcomes
evolved in a UOL. IMS-LD is a data structure holding information about the
UOLs and their learning outcomes. It comprises UOLs modeling what to learn,
and supports UOLs modeling how to learn, based on the learning outcomes of
UOLs. A UOL and its contents are separated, so that the designed UOL can be
reused. However, IMS-LD needs teachers to define the pedagogical structure
without given clear guidance.
1.2.5. Learning Path
Learning path (or curriculum sequencing) construction [Brus92] is
fundamental to the education process, which comprises a series of learning
activities for the student to build up certain knowledge and skills. It refers to
the organization of learning activities in a proper sequence, so that students
can effectively study a subject area. Different forms of learning activities can
support the implementation of different teaching approaches in a learning
path. Obviously, if we can adaptively produce a learning path according to a
student’s learning performance and preferences, it will help the student
master knowledge and skills more efficiently.
There are different methods proposed for designing learning paths.
Melia and Pahl [Meli09] directly generate the best learning path for different
students within their Courseware Model (CM). However, the CM only allows
UOLs to be organized one after another according to the student model, such
that students cannot follow UOLs in parallel for learning. In practice, some
UOLs are complementary to each other, where students can learn more
efficiently if students can study those UOLs in parallel. In addition, the
student model only considers students’ initial knowledge and learning
outcome. Many other critical factors, e.g., learning style, that affect students’

Introduction 7
learning preferences are not considered. Liu and Yang [Liu05] adopt an
incremental approach. They first identify the key elements of a learning path
(the initial, the target and the essential UOLs) and then incrementally work
out the successive UOLs connecting these key elements. This method also
considers asking a student to retake a UOL or to follow a re-designed learning
path if necessary. Hernandez-Leo et al. [Hern06] propose a semi-automatic
method that allows teachers to design the learning path based on pre-defined
Collaborative Learning Flow Patterns (CLFPs), where a CLFP involves a flow
of tasks. However, CLFPs do not support flexible combination of these tasks.
So, if a teacher chooses a template pattern, a student has to use all the tasks
included in the pattern.
1.2.6. Student Learning Progress
Student learning progress reflects the changes of student learning
performance in different aspects over time, which is the process of
determining the learning performance of the student according to learning
outcomes [Good09]. Student learning progress not only shows how much
knowledge and how well a student has learned, but also provides with the
changes of the student’s learning performance, which has become a popular
topic over time [Mart07]. During the learning process, student learning
performance is changing after a period of learning. Their learning abilities and
knowledge levels may be improved or may stay as the same. It would take
different efforts for different students to make the same learning progress. We
need to monitor student learning progress and analyze the contributions of
different factors on their learning performance.
With the help of student learning progress, teachers can design learning
path [Kwas08], adjust course settings (e.g. difficulty level, updating learning
contents), update student profiles, group students who have the same learning
style, (e.g. it may deduce that if there are a group of students who perform
better on ‘Analyze’ knowledge level, they are more likely to be reflective
students who prefer to process information through introspection.), and also
provide better instructions to students. Teaching and learning can be

Introduction 8
improved according to student learning progress which is reflected from
student or course attributes.
1.3. Motivation
This section discusses about why the research of learning path construction is
worth studying. The advance in the Internet and mobile technologies
significantly improves the accessibility of the Web to nearly anytime and
anywhere. Together with the emerging Web standards, such as HTML5, CSS3
and WebGL, the Web has become a popular platform for developing
applications. Particularly, e-Learning is considered as one of the potentiality
killer-applications, and comprehensive learning platforms can be easily
developed by exploiting learning resources available on the Web.
The Web provides a shared workspace for students to interact and learn
through cooperation, while different forms of Web-based communication
technologies allow individual students to learn at their own pace [Li08].
Normally, it is not easy for a student to manage the student’s study on the
student’s own because of lacking self-control, limited individual learning
experience, especially when the student knows nothing about the course. Even
if students would like to learn, they are still confused with what to learn at first
and then next and not sure what they can achieve. We need a method to make
students know clearly not only what to learn, but also how to learn and how to
improve.
Internet also provides a lot of useful Web resources that can be freely
obtained from authenticated Websites, such as Wikipedia, BBC, Reuters, etc.,
where the contents, quality and presentation styles can be guaranteed and
suitable for learning. If these Web resources can be converted to well-
structured learning resources which have relationships in between and
contain attributes as the criteria to select suitable learning resources, then we
can automatically generate the knowledge structure on the basis of the
learning resources. The knowledge structure builds up the relationships of the
knowledge concepts as well as the relationships of learning resources.

Introduction 9
During the learning process guided by the learning path, students are
making progress to obtain more knowledge as well as improving their learning
abilities. It is necessary to monitor what they have achieved and analyze which
factors would affect their learning progress, so that they can provide the
information to further manage their learning. However, it is not easy for a
teacher to design learning activities for different students, especially there are
too many factors that may affect their learning qualities. Monitoring student
learning progress help us analyze how an attribute affects a student’s learning
performance on another attribute. Students can understand their own
learning performance and how to improve. On the other hand, teachers can
adjust their teaching approaches. Both parties can identify main parameters
that affect student learning progress and their developments in different
attributes.
1.4. Challenges
The discussion in the last section motivated us to do the research of learning
path construction, but there are some challenges need to be solved. This
section discusses about the technical problems that we need to address.
Though a lot of novel ideas in this area have been proposed in recent years,
learning path construction and student progress measurement are still having
some problems.
(1) Appropriate learning resources. In order to help students achieve
their learning outcomes, they are required to study corresponding learning
resources. Although it will be straightaway to acquire suitable learning
resources from authentic institute, or to create them by designers, it is either
expensive or very time consuming. These ways can only acquire limited
resources, and sometimes, the learning resources are out of date. In order to
save teachers’ efforts, it is necessary to automatically generate learning
resources. There are plenty of Web resources that can be obtained from
authenticated Web sites and also can help students achieve their learning
outcomes. We can directly use them rather than manually create learning
contents. However, these Web resources are lack of correlations in between.

Introduction 10
In order to find out their relationships and to generate a well-structured
knowledge model with these Web resources, we still need to identify the
attributes of each piece of learning resource including its knowledge domain,
importance degree, correlation with a topic, and complexity.
(2) Appropriate learning approaches. The way to deliver knowledge
elements indicates the way of how to learn by organizing learning activities
into a learning path. Existing learning path generation methods [Chen06,
Farr04, Kara05, Liu05, Limo09] mainly focus on the mechanism to produce
the entire structure of a learning path. They use students’ mastery of the prior
knowledge and certain UOL selection constraints, such as mandatory UOLs,
duration of study, or student learning preference, as the criteria to select
suitable UOLs. Pedagogically, existing learning path generation methods only
cope with part of learning needs. They do not properly consider teaching
approaches, which are related to the way that a UOL is delivered and the type
of activity that may help a student learn a UOL effectively, and types of
assessments, which are related to the skills that the student needs to acquire.
These deficiencies affect the quality of the constructed learning paths in terms
of the effectiveness of knowledge dissemination and the precision in assessing
the student’s learning performance.
Because students are assessed depending on different learning outcomes
required by courses, the designing, managing, delivering, and organizing
learning activities should be carried out based on the learning outcomes.
Constructing learning path involves three issues: (1) setting up the learning
outcomes of the learning activities in the learning path; (2) designing and
managing learning activities; and (3) how to deliver or organize learning
activities. In order to design and manage learning activities, existing works,
such as, SCORM [Su06], IMS Learning Design (IMS-LD) [Hern06, Amor06],
and Learning Object Meta-data (LOM) [Neve02, Chan04], generate the whole
structure of learning activities which are designed in terms of specific different
learning contents or teaching approaches, rather than being designed in terms
of the learning outcomes that are independent of subjects. And also, these
specifications fail to involve a feasible assessment that can apply to different

Introduction 11
subjects and different forms of learning activities. In order to deliver learning
activities, technologies like [Kazi04, Su06] come with a hierarchical structure,
and require teachers to pre-define rules to control the sequence, selection, or
prerequisite of learning activities. Technologies acting like containers to
define how different types of information, such as learning outcome, activities,
resources, can be put together and control the workflow of their delivery.
However, they do not provide facilities helping teachers work out how the
students can be assessed in terms of learning outcomes, and how a teacher
delivers a course in terms of teaching approaches.
(3) Guarantee student learning quality. In order to measure student
learning progress, other existing work usually identifies student learning
progress by scoring subject specific attributes or by determining status about
task completion, which are too simple to suggest how teaching and learning
approaches can be adjusted for improving student learning performance. As
there are too many student attributes, it is impossible to consider all of them,
and it is not practical to integrate all attributes to fit any kind of progress
analysis. Designers can set some learning outcomes in each learning activity
for students to achieve and gain knowledge and skills. However, it is not easy
to automatically generate the test to evaluate students’ understanding
according to their tailored learning resources, which can make sure students
master the knowledge or skills during the process.
1.5. Research Objectives
In order to address the challenges discussed above, we need to achieve the
following research objectives. In this thesis, we focus on constructing the
representation of learning path as well as its generation to assess, guide, and
analyze students learning progress, which shows them what to learn and how
to learn. We show our research objectives as follows.
• To design the learning activities based on learning outcomes as the UOLs
of a learning path, to evaluate student learning performance by both
subject-specific and generic skills, in this way we can provide more
comprehensive guidance of student progress. Also, to explicitly formulate

Introduction 12
the setting of pedagogy and learning outcomes, so that the learning
activities are adjustable, fine-grained, and can adapt to different teaching
approaches, and also offer a formal definition of the way to deliver
learning activities.
• To select the most appropriate learning resources for personalized
learning path, and show the way of how to learn these learning resources
in a proper sequence, so that we can meet the needs of different types of
students according to their learning preferences, learning abilities, and
knowledge backgrounds, etc. Especially, to adaptively update the learning
path, we also need a test generation scheme to automatically generate
tests according to the contents of learning resources, so that we can
evaluate students’ learning performance and deliver them with the best
learning resources that fit their learning abilities.
• To monitor student learning progress on various aspects including
performance and non-performance related aspects, analyze the causal
relationships of these aspects and how these attributes affect student
learning performance, so that we can easily manage student learning
progress, help teachers modify teaching approaches, and help students
improve their learning qualities. And also, we need to evaluate students’
achievements to see if they can have a balanced development on all
required student attributes.
1.6. Contributions
In brief, I have made three major contributions in this thesis in order to
achieve these research objectives.
• In order to find out the learning approaches and answer the research
question of how to learn, we have developed a fine-grained outcome-based
learning path model that allows learning activities and the assessment
criteria of their learning outcomes to be explicitly formulated by the
Bloom’s Taxonomy [Bloo56, Bloom]. Hence, provided with different forms
of learning activities, pedagogy can be explicitly defined and reused. Our
model can also support the assessment of learning outcomes related to
Introduction 13
both subject-specific and generic skills, providing more comprehensive
student learning progress guidance and evaluation.
• In order to find out the appropriate learning resources to construct the
learning path, loosely connected Web resources obtained from the Web
have been formed to well-structured learning resources based on
Association Links Network (ALN) to construct a teacher knowledge model
(TKM) [Mish06] for a course and generate the personalized learning path
to help students achieve higher master level of knowledge. Our model
automatically constructs the learning path in three different abstraction
levels of ALNs, i.e. topic, keyword, and learning resource ALNs, which
allows students to understand the relationships between learning
resources through the three abstraction levels, and helps students
minimize their cognitive workloads. On the basis of a learning resource
retrieved from the TKM, we automatically construct a test to assess
students’ understanding based on a test generation scheme which saves
teachers a lot of efforts.
• In order to answer the research question of how well students have learned,
we propose a set of Fuzzy Cognitive Map-based student progress indicators.
We can monitor student learning performance and analyze the factors that
affect student learning performance and comprehensively describe student
learning progress on various aspects together with their causal relationship.
Our model is based on student learning performance related attributes
(PAs) as well as non-performance related attributes (NPAs) to model
student learning performance and their potentialities to make progress.
1.7. Organization
The rest of the thesis is structured as follows: Chapter 2 introduces how the
existing works address current problems related to learning path construction
and student progress measurement. Chapter 3 introduces the methodologies
that we applied in the research. Chapter 4-6 describe the main approaches
carried out in this research study: Chapter 4 describes the method of how we
design the fine-grained learning outcome based learning path; Chapter 5

Introduction 14
describes the ALN-based Learning path generation method; Chapter 6
describes the method of how we measure student learning progress and how
teachers and students can apply it to aid the teaching and learning. And finally,
chapter 7 is the conclusion of this research study and states the future work.

15
Chapter 2
2. Background
This chapter presents the background of this research. Recently, various work
[Farr04, Liu05, Chen06, Hern06, Limo09] have been conducted to study
learning path construction. In their formulations, they generally use lecture
type of UOLs to form the knowledge elements of a learning path, where
student learning performance is assessed by Q&A. They also identify the
relationships of these UOLs, i.e. identify the learning sequence of these UOLs.
On the other hand, the learning resources decide what to learn in the learning
path. It is necessary to select appropriate learning resources as well as their
relationships to form the learning path. In order to update teaching
approaches including the learning contents and learning sequence according
to student learning performance, then we discuss how existing works monitor
and analyze student learning progress. We will discuss about more specific
literature research that relates to the three research challenges in section 4.2,
5.2, and 6.2, respectively.
Our research study is supported by some mathematical models and
theories in Education. We discuss them in the following subsections to
introduce the background of this research. Section 2.1 shows the learning
theory which is the foundation of our e-Learning research. Because this
research can apply to e-Learning systems, we introduce different types of
learning as well as different types of e-Learning in section 2.2. Besides, what
to learn is based on the learning outcomes, in section 2.3, we introduce the
learning taxonomy that is the foundation of learning outcomes. Different
students would have different learning preferences and learning behaviors, in
section 2.4, we discuss the learning styles that explain why the differences of

2. Knowledge Backgrounds 16
students are so important. Section 2.5 introduces the learning modes that
show the different participant methods during the learning process. We use
different assessment approaches to assess student learning performance, so
we explain how student assessment carried out in previous work in section 2.6.
We also measure student learning progress to control the learning process,
and section 2.7 discusses how to show student learning progress using
performance inference algorithm. As we apply Association Link Network to
construct learning resources, section 2.8 introduces the Association Link
Network which is used to semantically construct the knowledge structure.
Section 2.9 introduces all the platforms, libraries, and implementations that
are used to design the software in this research. And section 2.10 summarizes
the background of this research.
2.1. Learning Theory
Learning theory [Band77] is the foundation of this research, which supports
all the learning processes, and is used to guide the design of learning systems.
Learning theory describes how information is absorbed, processed, and
retained during the learning process. There are three main categories of
learning theory including behaviorism, cognitivism, and constructivism.
Behaviorism focuses on achieving the objectively observable behavior by
repetition of desired actions. Cognitivism looks beyond behavior to explain
how the learning happened in our brain. Constructivism views learning as a
process in which a student actively constructs or builds new ideas or concepts.
Our research is developed based on the constructivism learning theory.
Constructivism learning theory [Coop04, Fran06] requires students to
construct knowledge in their own meaning, to build up knowledge concepts
based on prior knowledge and their experience, to enhance their learning
through social interaction, and to develop learning through authentic tasks.
During Constructivism learning, students achieve learning outcomes by
attempting to address problems when they find their expectations are not met,
so they need to resolve the discrepancy between what they expected and what
they encountered [Lefo98].

2. Knowledge Backgrounds 17
In the learning theory of constructivism, each student is considered as an
unique individual with personalized needs, learning styles, learning
preferences, knowledge levels and knowledge backgrounds, which is
complexity and multi-dimensional. During a typical constructivist session
[Coop04], students work on problems, and teachers only intervenes them to
guide them in the right direction. Students could provide different responses
to learning, e.g. they are involved in an active learning process, they are using
critical thinking to challenge, judge knowledge, and learn from it. Under the
learning theory, teaching approaches are designed according to these learning
outcomes. With the help of techniques in e-Learning, the learning process,
which emphasizes that knowledge is shared between teachers and students,
does not focus on the teacher-centered learning environment, but put more
emphasizes on self-paced learning by providing access to education at any
time, any place and taking into account students’ differences.
2.2. e-Learning
This research of Learning path construction and the analysis of student
learning progress are concerned with learning using electronic devices and
Web. We discuss different types of learning and different types of e-Learning
systems in this section to help reader better understand how the learning is
carrying out, and more specifically, how the e-Learning is carrying out.
2.2.1. Types of Learning
Learning has gone through several stages where learning is traditionally
supported by face-to-face teaching, and now with the help of communication
and information technologies, new forms of learning, such as Web-based
learning, have been developed. However, traditional learning does not allow
students to learn at any time and at any place, and web-based learning lacks of
interaction between teachers and students. Blended learning is developed by
combining the traditional learning and web-based learning to provide a better
learning approach. Our research can be applied to both web-based learning

2. Knowledge Backgrounds 18
and blended learning by providing a user-friendly intelligent tutoring system
to construct learning path as well as to analyze student learning progress.
Traditional learning
Traditional learning is teacher-centered learning, where teachers interact with
students face-to-face in classroom. Traditional learning focuses on teaching,
not learning. The knowledge taught in traditional education can be used in
instructional design, but cannot be used in complex problem solving practices.
It simply assumes that what a student has learned is what a teacher has taught,
which is not correct in most cases.
Web-based learning
Web-based learning is self-paced learning, which requires students to access
Internet via devices like computers. The learning is beyond traditional
learning methodology. Instead of asking students to attending courses and
reading printed learning materials, students can acquire knowledge and skills
through an environment which makes learning more convenient without
spatial and temporal requirements. Web-based learning applications consider
the integration of user interface design with instructional design and also the
development of the evaluation to improve the overall quality of Web-based
learning environment [Chan07]. Web-based learning is different from the
term of Computer-based learning, which also uses devices like computers, but
does not have to require students to access to Internet during the learning
process.
Blended learning
Blended learning combines traditional learning with computer-based
learning, which creates a more integrated e-Learning approach for both
teachers and students. The aim of blending learning is to provide practical
opportunities for students and teachers to make learning independent as well
as sustainable. There are 3 parameters should be considered in a blended
learning course, which are the analysis of the competencies, the nature and
location of the students, and the learning resources. Also, blended learning

2. Knowledge Backgrounds 19
can be applied to the integration of e-Learning with a Learning Management
System using computers in a traditional classroom with face-to-face
instruction.
2.2.2. Types of e-Learning
With the help of technologies and electronic media, e-Learning makes
the teaching and learning more effectively. Teaching and learning could be
approached at any time and any place. e-Learning systems have actually been
well developed and have different types including traditional e-Learning
system, Adaptive e-Learning system, intelligent tutoring system, and service-
oriented e-Learning system. Traditional e-Learning [Dagg07] has simplex
design which fails to provide more flexible ways of learning, such as
personalized learning, active learning, and online interactions between
teachers and students. Adaptive e-Learning [Shut03] focuses on student
characteristics, such learning style, knowledge background, learning
preferences, etc., which makes the learning to be applied to different teaching
approaches for different types of students. Instructional design system
[Gust02] contains 5 phases of Analyze, Design, Develop, Implement, and
Evaluate, which aims to determine student learning states, define learning
outcomes, and provide teaching strategies. Intelligent tutoring system
[Murr03] does not only focus on the sequencing mechanisms of curriculum
delivery, so that students know how to learn rather than just what to learn, but
also applies AI to customize teaching approaches according to student’s needs
in order to optimize learning of domain concepts and problem solving skill.
Service oriented e-Learning [Jamu09, Su07] provides with different Web
services, so that both teachers and students can access the e-Learning system
and use different functionalities. We briefly introduce them as follows.
Traditional e-Learning System
Traditional e-Learning separates teachers from students and also separates
students from students, the teaching and learning carry out over the Internet
or through computer-based technologies [Stiu10]. Traditional e-Learning
cannot provide adaptive learning technologies, which needs a team that has

2. Knowledge Backgrounds 20
advanced skills, such as programming, graphic design, or instructional design
to improve the learning system, and requires course creator to create graphics,
simulations, and animations. Teacher also needs to design learning contents
for constructing courses. Learning management system (LMS) [Brus04] is an
integrated traditional e-Learning system that supports a number of learning
activities performed by teachers and students during the e-Learning process.
LMS aims to deliver online courses to students, and try to keep students’
learning progress on the right track, but LMS is not used to create learning
contents. Students can use it for learning, communication and collaboration.
Adaptive e-Learning System
Students have different knowledge backgrounds, knowledge levels, learning
styles, learning preferences, and also different misunderstandings and
learning outcomes, etc. It will become a very huge work for teachers to design
the learning contents and the learning activities, and to provide with different
teaching approaches and different feedbacks. The e-Learning system is
considered adaptive [Jere10] if it follows student behaviors as well as
interprets them, makes conclusions about students’ requirements and their
similarities, adequately represents them, and finally impacts students with the
available knowledge and dynamically manage the learning process. Adaptive
e-Learning system has the adaptability towards students’ needs, the
reusability of learning activities, and effective design of learning contents. Our
research can be applied to adaptive e-Learning system as our research also
constructs learning resources for different types of students, and designs
learning paths to support different teaching approaches.
Instructional Design System
Instructional design system is a system of determining student learning state,
defining the learning outcomes, and also providing teaching strategies for
knowledge transition, which aims to improve learning performance [Reis01].
Instructional design is learner-centered which focuses on current learning
states, needs, and learning outcomes of students. The learning outcomes of
instructional design reflect students’ expectations for the learning, which

2. Knowledge Backgrounds 21
expect students having the ability of applying knowledge or skill in some
learning environments.
The procedure of developing instructional materials provides us the
guidance and requirements of designing a qualified e-Learning system. The
typical instructional design system [Gust02] includes five phases including
Analyze, Design, Develop, Implement, and Evaluate. Analyze phase requires
teachers to collect information about students, learning tasks, and learning
outcomes, and then classify the information to make learning contents more
applicable. Design phase composes the expected learning outcomes and
corresponding tests through learning tasks. Develop phase generates learning
contents based on the learning outcomes. Implement phase refers to how to
deliver the instructions for students to learn. Evaluate phase ensures that the
learning contents can achieve the learning outcomes through both summative
and formative assessments.
Intelligent Tutoring System
Intelligent e-Learning system brings the artificial intelligence (AI) technology
to the current e-Learning system together and products a personalized,
adaptive, and intelligent service to both teachers and students. Intelligent
tutoring systems (ITS) use AI to customize teaching approaches according to
student’s needs, which is trying to optimize learning of domain concepts and
problem solving skill. Our research can also be applied to ITS, because the
proposed work provides adaptive teaching approaches, personalized learning
resources, and intelligent student progress indicators. ITS [Murr03] are
computer-based instructional systems, with instructional contents organized
in the form of learning activities that specify what to teach, and teaching
approaches that specify how to teach. They make inferences on student
learning progress and offer instructional contents and styles of instruction
adaptively. Instructional contents can be broadly categorized into two main
types [Bigg07]: declarative knowledge, i.e., facts or concepts, and functioning
(procedural) knowledge, i.e., how something works. Early ITSs, such as
SCHOLAR [Carb70a], focus only on the modeling of declarative knowledge,

2. Knowledge Backgrounds 22
and cannot properly support the training of procedural and problem solving
skills. Newer ITSs, such as DNA [Shut98], incorporate the modeling of
functioning knowledge to address this issue.
To identify a suitable teaching approach, an ITS should understand the
learning progress of a student and, more ideally, consider student learning
styles [Feld88, Li10] as well. In existing ITSs, such student information is
commonly maintained as a student model [Elso93, Brus07] and updated by
some inference algorithms [Cona02, Chen06]. Traditionally, the student
model is typically formulated in the form of a knowledge model [Carb70b,
Brow78] to maintain the set of learning activities that a student studies.
Student learning progress is then evaluated by checking the portion of expert
knowledge that a student has acquired. However, this model fails to formulate
errors or misunderstandings made by the student. To address this problem,
the bug-based model [Brow78] is proposed, which applies rules to determine
the difference between the expected and the actual ways to be used for
problem solving when studying a piece of knowledge. This model essentially
evaluates the problems in understanding made by a student. On top of the
student model, inference algorithms are applied to determine or predict the
student learning performance over a course of study based on some
probability information. Popular choices of inference algorithms are the
Bayesian networks [Cona02], which perform inferences based on some pre-
condition information, particularly the previous learning performance of
students, and the item response theory [Chen06], which performs inferences
based on the probability information of the responses made by students when
conducting certain assessments.
Service-oriented e-Learning System
Service-Oriented system for e-Learning describes a concept of e-Learning
framework which supports e-Learning applications, platforms, or other
service-oriented architectures. Service-oriented e-Learning system [Jamu09,
Su07] provides web services, such as assessment, grading, marking, course
management, metadata, registration, and reporting, etc., in order to produce

2. Knowledge Backgrounds 23
more functionalities for the e-Learning system. It aims to produce reliable
Web services that can be applied to different operation systems. Users can
access these services through the Web. While our research supports such an e-
Learning platform where teachers can design and manage adaptive learning
paths, personalized learning resources can be generated for each student, and
also student progress can be graphically presented.
2.3. Learning Taxonomy
Learning taxonomy provides the criteria of assessing student learning
performance to see if students can achieve their learning outcomes. Learning
outcomes are learning objectives that students are expected to achieve at the
end of learning, which could be cognitive, skill-based, and affective learning
outcomes. Learning taxonomy [Full07] includes three domains, cognitive,
affective, and psychomotor, where each domain evaluates learning outcomes
in several levels. Learning taxonomy guides teachers to design courses on the
basis of achieving these learning outcomes as well. The most common
learning taxonomy is Bloom’s Taxonomy which we have applied in this thesis.
Because it can assess knowledge, attitude, and skills, it can be applied to all
disciplines. There are also some other learning taxonomies slightly different
from it, such as Gagne’s taxonomy, SOLO taxonomy, and Finks taxonomy.
Gagen’s taxonomy does not only covers the 3 categories of Bloom’s taxonomy,
but also involve another 2 categories of verbal information, intellectual skills.
SOLO taxonomy divides learning outcomes by 5 learning stages rather than
independent categories. And Finks taxonomy considers learning as a cycle
consisted of 6 aspects. We introduce each of them as follows.
2.3.1. Bloom’s Taxonomy
Bloom’s Taxonomy [Benj56] provides the criteria for assessments of learning
outcomes which could be classified into three domains of knowledge, attitude,
and skills, in this way it could be applied to all kinds of subjects. A learning
activity should have its own learning outcomes, such as the knowledge level,
etc. Students can develop their knowledge and intellect in Cognitive Domain,

2. Knowledge Backgrounds 24
attitudes and beliefs in Affective Domain, and the abilities to put physical and
bodily skills to act in Psychomotor Domain.
The Cognitive domain refers to intellectual capability, such as knowledge,
or think, which has 6 levels from easy to difficulty including Recall data,
Understand, Apply, Analyze, Synthesize, and Evaluation. The Affective
domain refers to students’ feelings, emotions, and behavior, such as attitude
or feel, which has 5 levels from easy to difficulty including Receive,
Responding, Value, Organization, and Internalize. The Psychomotor domain
also has 5 levels from easy to difficulty including Imitation, Manipulation,
Develop Precision, Articulation, and Naturalization. The Psychomotor domain
refers to manual and physical skills, such as skills or do, which was ostensibly
established to address skills development relating to manual tasks and
physical movement. However, it also concerns and covers business and social
skills such as communications and operation IT equipment, for example,
public speaking. Thus, Psychomotor extends beyond the originally
traditionally imagined manual and physical skills.
2.3.2. Gagne’s Taxonomy
The learning outcomes of Gagne’s taxonomy [Gagn72] is similar to Bloom’s
taxonomy. However Gagne’s taxonomy divides learning outcomes into five
categories, which are verbal information, intellectual skills, cognitive
strategies, attitudes, and motor skill. Verbal information is the organized
knowledge including labels and facts and bodies of knowledge. Intellectual
skills refer to knowing how to do something including discrimination,
concrete concept, rule using, and problem solving. Cognitive strategy is the
approach where students control their own ways of thinking and learning.
Attitude is an internal state which affects an individual’s choice of action in
terms of a certain object, person, or event. Motor skills refer to bodily
movements involving muscular activity, including the learning outcome to
make precise, smooth, and accurately performances with muscle movements.
The learning outcomes are normally dependent on each other. There are
always combined learning outcomes selected for completing a task.

2. Knowledge Backgrounds 25
2.3.3. SOLO Taxonomy
The SOLO taxonomy [Bigg07] stands for Structure of Observed Learning
Outcomes, which describes the level of a student’s understanding of a subject
through five stages, and it is able to be used to any subject area. The first stage
is Pre-structure where students just acquire no structured information. The
second stage is Uni-structural where students capture simple and obvious
aspects of the subject, but they still have not understood significant aspects.
The third stage is Multi-structural where students make a number of relevant
independent aspects but cannot connect them. The fourth stage is Relational
where students are able to identify the most important parts of the whole
structure. The fifth stage is Extended Abstract where students can generalize
another new application based on the structure constructed in the Relational
stage. The SOLO taxonomy is similar to the cognitive domain in the Bloom’s
taxonomy, which can be used not only in the assessment, but also in designing
the curriculum in terms of the learning outcomes.
2.3.4. Finks Taxonomy
Finks Taxonomy [Fink03, Fink09] is different from Bloom’s Taxonomy and
SOLO Taxonomy, which taxonomy is not hierarchical. It covers broader cross-
domains, which emphasizes on learning how to learn and includes more
affective aspects. The learning process has 6 aspects in a cycle including
foundation knowledge, application, integration, human dimensions, caring,
and learning how to learn. In the aspect of foundational knowledge, students
understand and remember knowledge. In the aspect of application, students
train up skills of critical thinking, creative and practical thinking, and problem
solving skill. In the aspect of integration, students make connections among
ideas, subjects, and facts. In the aspect of human dimensions, students learn
and change themselves, understand and interact with others. In the aspect of
caring, students identify and change their feelings, interests, and values. In
the aspect of learning to learn, students learn how to ask and answer
questions, and become self-directed students.

2. Knowledge Backgrounds 26
2.3.5. Subsection Summary
We apply Bloom’s taxonomy as the learning outcomes in our research.
There are also a lot of works on Bloom’s taxonomy. [Naps02] applies Bloom’s
taxonomy [Benj56] as well as other factors: student learning progress, drop-
out rate, learning time and student satisfaction. [Limo09] only chooses three
out of the six levels: knowledge, application and evaluation, as the evaluation
criteria. However, these evaluation methods still could not instantly tell
students how to improve. Also, some works [Chen05, Dolo08, Yuen05,
Yuan05, and C0no05] consider student’s ability as performance evaluation.
[Chen05] evaluates student abilities based on the student’s response to the
recommended learning activity and modifies the difficulty levels of all learning
activities which are considered as index to rank learning activities in order to
update learning paths. However, a student’s ability is just given by a single
value. In [Dolo08], a student’s abilities just limits to programming in Java or
.NET, which cannot be applied to all situations. According to the research
[Yuen05] on learning abilities for evaluating student learning performance, it
classifies these learning abilities into eight aspects: leadership, critical
thinking, value-based decision making, logical reasoning, problem solving,
oral communication skills, written communication skills, and lifelong
learning. Each aspect contains several sub-aspects and making 74 sub-aspects
in total. However, according to the research of Psychology [Bart32], human
abilities are divided into three groups: language, action and thought with 22
sub-attributes in total. We found that there are some attributes that [Yuan05]
does not consider about, such as imagination, while there are some attributes
in Psychology are not suitable to apply to general e-Learning, such as speed,
strength of power in the action group. Besides, [Cono05] also distributes
different ability requirements to learning tasks including too many skills (38
skills) without classification, and some of them are overlapped.
2.4. Learning Styles
Our work has developed learning progress indicators which addressed the
needs of students with different learning styles. When we assess student

2. Knowledge Backgrounds 27
learning progress, we expect students to handle different learning
environments. If students can well perform different learning activities, they
have the ability to handle different learning environments and have a
balanced development. A learning style model classifies students according to
their behaviour patterns of receiving and processing information. Teaching
style model classifies instructional methods according to how well they
address the proposed learning style components.
According to the research of [Feld88], learning style contains five
aspects. From the viewpoint of which type of information students prefer to
perceive, there are sensors who prefer to solve problems using standard
methods rather than unconventional methods, and intuitors who prefer to use
innovated methods rather than repetition. From the viewpoint of through
which sensory channel external information most effectively perceived is,
there are visual students who are sensitive to diagrams and graphs, and
auditory students who are sensitive to words and sounds. From the viewpoint
of which information organization students are most comfortable with, there
are inductive students who are sensitive when given facts and observations,
and underlying principles are inferred. Deductive students are sensitive when
given principles and consequences and applications are deduced. From the
point of view that how students prefer to process information, there are active
students who prefer engagement in physical activity or discussion, or
reflective students who prefer introspection. From the point of view that how
students progress toward understanding, there are sequential students who
learn in continual steps, and global students who learn gradually from the
whole knowledge structure to more detailed concepts.
2.5. Learning Modes
In this thesis, we use different learning modes to design teaching approaches
for different aims of training students. The learning has various forms, which
does not only support individual learning but also support collaborative
learning. In our research, we also need to use different forms of learning to
construct different teaching approaches. Individual learning help students

2. Knowledge Backgrounds 28
train them to solve problems on their own, and collaborative learning help
students train them teamwork spirit. The most commonly way of learning is
work individually. Students have to work on their own to solve problems and
reach the learning outcomes. Collaborative learning is a type of learning in
which two or more people learn something together, where students can make
use of peer’s learning resources and skills. Collaborative learning includes
collaborative writing, group projects, joint problem solving, debates, study
teams, and other learning activities. Collaborative learning uses technology to
define rules and roles, construct learning tasks, control and monitor the
learning process, and support group interactions in a collaborative learning
environment.
2.6. Student Assessment
As the aim of learning is to achieve learning outcomes, the learning path is
constructed based on learning outcomes. In order to determine if students
have achieved their learning outcomes, we need to assess their learning
performance. Student assessment measures the level of student achievement
on knowledge and abilities. The form of student assessment can be summative
or formative [Osca11]. Information about student learning progress needs to
be collected before, during and after learning some learning activities
[Feng09, Osca11]. Student learning progress can be expressed as growth rate
[Stec08, Bete09] and overall improvement [Pets11]. In addition, prediction on
student’s future learning performance [Hanu05, Wiel10] can also be done. A
teacher may review and enhance teaching approaches based on student
learning progress [Stec05, Stec08].
By tracking student learning progress and evaluating student learning
performance, we can guide students to approach the most appropriate
learning activities as well as to help them improve their learning performance,
and reach the learning outcomes in the end. Based on previous work, learning
outcomes are given by ranks [Good09, Ma00], scores [Yang05, Liu05, and
Kwas08], or feedback [Leuon07, Guzm07], according to different criteria,
such as the levels of acquired knowledge [Good09, Leun07], the spending

2. Knowledge Backgrounds 29
time and efforts [Good09], the number of correct questions [Chen08] with
tests or questionnaires, or learning abilities of students [Dolo08, Leun07,
Chen05].
Although [Leuon07] can provide an instant feedback on student learning
performance, the feedback can only tell if we should provide students the
optional materials. In [Huan07], a student knows his/her misconceptions in
solving a problem and the student’s weak learning activities from a global test.
However, this information is not enough to know the student’s learning
progress and cannot help the student improve his/her learning performance.
In [Ma00], the evaluation results would always be divided to several fuzzy
grades from the “best” grade to the “worst” grade, and examples of fuzzy
grades include “good”, “pass”, “fail”, etc. Even if a student performs better
than the course expectation, the student would still fail as long as the student
is worse than the majority of students. In [Chen05], the evaluation tests
student’s satisfaction on the learning path. However, this work cannot
promise the student to reach the learning outcome. [Guzm07] provides a self-
assessment test which can rectify misconceptions and enhance acquired
knowledge. With a student’s knowledge distribution model, the selected
evaluation criteria determines questions and computes the expected variance
of the student’s posterior knowledge distribution. The test results provide an
estimation of the student’s knowledge level which is the minimum expected
posterior variance. As they need to calculate the correct possibility and the
incorrect possibility of a question, the answer has to be either true or false, but
these results are too limited for the most types of questions. In short, these
methods only consider if students can correctly understand knowledge in one
way or another, but they ignore the assessment of balanced developments of
students’ knowledge and learning abilities.
Existing works [Huan07, Chen08, and Cola10] have developed ways to
collectively model the students’ understanding on knowledge. [Huan07]
requires teachers to manually plan two formative assessments for each UOL,
and a summative assessment in the end of a learning path. The two formative
assessments cover the same knowledge using different questions. The 1st

2. Knowledge Backgrounds 30
formative assessment calculates students’ scores and analyzes their learning
situations. The 2nd formative assessment ensures students understanding the
concepts rather than memorizing the answers. In [Chen08], questions are
manually designed by teachers based on the course materials and stored in the
question database. Questions are randomly selected from the database to
generate a pre-test. The incorrect test results are used to select suitable
courseware to plan the learning path. However, these methods require
teachers to manually design the test, then [Cola10] provides an automatic
method to measure student learning performance by the Bayesian approach
which selects a set of questions associated with every network node to identify
if a student can correctly form the knowledge concepts. However, these
questions just focus on each single node, which cannot reflect if students can
correctly build up the relationships between them.
2.7. Performance Inference Algorithms
As we need to analyze student learning progress by inferring how the learning
progress is changing over particular aspect(s) of student attributes, we can
find out the reason how to help students improve efficiently. Previous works
[Chen05, Lynn09, Gres10, and Feng09] have qualified student learning
performance with different inference algorithms. Normally, people assess
students with a set of questions, then the performance is the evaluation results
on these questions. But the difference is that they focus on different aspects to
evaluate student learning performance. Item Response Theory (IRT)
[Chen05] is the function of student ability based on major fields and subjects,
which gives the probability that a student would have correct answers with a
given ability level. Goal Attainment Scale (GAS) [Lynn09] is the function of a
combination of attained goals and involves the expected correlation of the goal
scales to make it adjustable. Change-Sensitive Rating Scale (CSRS) [Gres10]
evaluates student learning progress with a rating scale on a set of social
behaviors including social skills (e.g. cooperate with peers) and competing
problem behaviors (e.g. disruptive classroom behaviors). It focuses on
computing the mean changes of student behaviors from the initial learning

2. Knowledge Backgrounds 31
performance to post-treatment. An item is change-sensitive when the
magnitude of change is larger than a threshold. [Feng09] presents that an
individual student learning progress on subject related skills changes over
time with a linear mixed-effect logistic regression model. This model is to
compute the probability that an individual student gives a correct answer at
an opportunity of answering a question. It is the linear function of the effects
caused by two learning parameters: one is how good the student’s initial
knowledge is, the other is the student’s change rate of his/her learning
progress.
Because the performance on some concepts/attributes may depend on
the performance of some other concepts/attributes, more intelligent
algorithms are required to represent the causal relationships among those
concepts/attributes and find out the main attributes that affect the learning
progress. Which concepts or attributes are chosen for evaluation depends on
the types of learning outcomes defined in the work. If the learning outcomes
are just to achieve more knowledge, they may need to infer the causal
relationships of concepts. If the learning outcomes are to achieve some
student attributes, such as some kinds of learning abilities, then they need to
infer the causal relationships of attributes. There are six popular algorithms
that can structure the concepts/attributes in a graph:
- The expert system [Stud98, Hatz10] represents relationships between
concepts in a tree structure where the top node of the tree indicates the goal
knowledge, and the nodes on leaves indicate the rules. Goal knowledge is then
inferred after several rule decisions.
- The Bayesian Network model [Dieg00, Garc07, Cola10] organizes the
knowledge representations in a directed acyclic graphical, and the nodes in
the model are conditional dependencies. They normally consider knowledge
nodes or questions as the network nodes, and then infer the causal
relationship among them. [Cola10] applies Bayesian network to infer student
learning performance, where questions are treated as the network nodes.
Bayesian analysis measures the percentage of correct answers as well as
incorrect answers in a subject, which supports for the measurement of cross-
2. Knowledge Backgrounds 32
entropy to quantify the dependency weight between the questions. Although
Bayesian network can infer the casual relationship among knowledge nodes,
the inferred knowledge node cannot reflect back to previous knowledge nodes.
They cannot be formed in a cyclic structure.
- The Markov random field [Zhu02] represents the structure of knowledge
nodes within an undirected graph which supports both cyclic and acyclic
graphs, but does not support induced dependencies. And also, Non-adjacent
nodes and neighbor nodes need to be conditionally independent.
- Neural network [Hayk99, Hatz10] infers causal relationships within a multi-
layer structure, but does not support induced independence among concept
nodes.
- The Concept Maps [Chen01, Zapa02] are connected with labeled arrows in a
downward-branching hierarchical structure, which is an acyclic structure. The
relationships between concepts show relationship like ‘results in’, “contributes
to”, or “is required by”, etc.
- Fuzzy Cognitive Map (FCM): As the structure is expected to reflect the
causal relationships among knowledge nodes, the structure should be directed
because one node is likely to affect other nodes or being affected by other
nodes. On the other hand, the structure should be cyclic because some nodes
may form a cycle. However, the above structures do not meet these
requirements, but Fuzzy Cognitive Map (FCM) [Liu99, Luo10] can represent
such causal connections among knowledge nodes in a directed cyclic
structure. FCM is a tool to represent social scientific knowledge. It computes
the impact of the nodes and describes the nodes and the relations between
these nodes, in order to analyze the mutual dependencies between nodes.
FCM method has been well developed and widely used to different areas
including social science, economics, robotics, computer assistant learning, etc.
Some works [Tzen10, Cai06, Geor04, and Geor08] applied FCM to e-Learning
in order to infer the casual relationship among a set of factors. One example is
to use the criteria for decision making as the concept nodes in FCM, such as
[Tzen10]. It can be used as the reasoning tool to select the goal of what to

2. Knowledge Backgrounds 33
achieve and the actions of how to achieve [Cai06]. Also, some works [Geor04,
Geor08] infer student learning styles through FCM, where the learning styles
reflect how students conceive information and also conceive which kind of
information. To connect one attribute to another, FCM needs to compute the
impact between two related attributes, which can be considered as the weights
of the FCM. Basically FCM methods have gone through three stages.
(1) The basic FCM [Tabe91, Geor08, Tzen10] pre-defines the weights with
consistent values before applying FCM matrix to analyze the relationships
among these knowledge nodes. [Geor08] asks experts to describe the causal
weights among the attributes every time. Also [Tzen10] always uses a pre-
defined weight matrix, while the attribute values update according to their last
statuses during iteration.
(2) Also, the weights could change under different concept models, as the
dependences among concepts are different. A better method that is proposed
to constrain the weights is the rule based FCM [Peña07]. It uses fuzzy “If-
then” rule to increase or decrease the causal weights by a fuzzy interval.
(3) Later, an automatic scheme [Luo10] has been proposed to calculate the
casual weights. [Luo10] applies FCM to build up a learning guidance model
for students. It combines unsupervised learning and supervised learning to
iteratively acquire new knowledge from data, but it still needs initial human
intervention.
Although these current works monitor student learning progress and
provide assessment results, they just focus on setting the evaluation criteria
and more accurate grading scheme. There is still no such a tool could analyze
student learning progress, find out the relations between different attributes,
and see how these attributes affect the learning progress. Actually, FCM
supports such an inference scheme that can infer student learning progress
about how an attribute affects the others. All possible attributes could be
considered as the nodes, and the effect of one attribute on one another would
be the inferred causal relationships. So that both teachers and students would
not only know whether the student makes progress, but also know what can

2. Knowledge Backgrounds 34
force the student to make progress. However, student attributes appear to
have various changes for different students, different learning activities, or
different subjects, etc. In order to come out the inner relationships among
these student attributes, it is not enough to infer them by only using FCM. It is
necessary to integrate some similarity and differences measurements to
measure related comparison targets.
2.8. Association Link Network
In our research, we need to find out the relationships of learning resources to
form the knowledge structure model which is used to support the construction
of learning path. However, the relationships of learning resources depend on
the semantic features of learning resources. Our work is based on Association
Link Network to identify these relationships. Association Link Network (ALN)
[Luo08A] is a kind of semantic link network, which is designed to establish
associated relations among various resources (e.g., Web pages or documents
in digital library) aiming at extending the loosely connected network (e.g., the
Web) to an association-rich network. Since the theory of cognitive science
considers that the associated relations can make one resource more
comprehensive to users, the motivation of ALN is to organize the associated
resources that are loosely distributed in the Web for effectively supporting the
Web intelligent activities such as browsing, knowledge discovery and
publishing, etc.
ALN using association rules between concepts to organize the resource
since the term association is used in a very particular sense in the
psycholinguistic literature. However, most subjects cannot distinguish the
exact semantic relations. The associated relations between resources in ALN
are implicit rather than explicit, which make ALN more appropriate for
incrementally building up. The challenge of building up ALN is about how to
efficiently and exactly perform the association weights of the new coming Web
resources.
ALN is composed of associated links between nodes. It can be denoted by
ALN = 𝑁, 𝐿 where N is a set of Web resources (e.g., keywords, Web pages,

2. Knowledge Backgrounds 35
and Web topics). L is a set of weighted semantic links. As a data model, ALN
has the following characteristics.
1) Associated relation-based link. Association relation-based link is used
in a very particular sense in the psycholinguistic literature. For example, the
subjects respond more quickly than usual to the word nurse if it follows a
highly associated word such as doctor. WWW uses hyperlink to interconnect
Web resources for users freely browsing rather than for effective associated
link. How to organize Web resources with associated relations to effectively
support the Web intelligence activities becomes a challenge. ALN uses
associated relations between Web resources to solve this problem.
2) Automatic construction. Given a huge number of resources in the Web,
it is unrealistic to manually build a network. Actually, ALN is automatically
built up, which makes it suitable to represent the huge number of resources.
3) Virtualness. ALN can be regarded as a virtual layer of Web resources,
which is invisible to users. The operation of Web intelligence activities is
implemented on this layer. Virtualness ensures the cross-media
implementation of intelligent browsing, which clears the difficulty brought by
different physical types of resources.
4) Rich Semantics. Each piece of Web resource is represented by E-FCM
with rich semantics. The links with weights between nodes represent the
associated relations between Web resources.
5) Structuring. By semantic computing, the disordered resources on
physical Web layer are mapped to the well-structured ALN.
2.9. System Development Tools of the Research
We implement the learning path system, automatic learning resource
generation system, and student performance evaluation system to
demonstrate the valid of our work. To implement them, we have applied a lot
of tools of programming languages, Web service, and database. For the
learning path system, we use Jgraph, Ext Js, PHP, MySQL, and Apache to
implement the prototype. For the automatic learning resources generation

2. Knowledge Backgrounds 36
system, we use Tomcat, Web Services, and JSP to implement the prototype.
And for the student performance evaluation system, we use Excel to analyze
data and generate graphs. We brief introduce how we apply each of them as
follows.
Jgraph
We use Jgraph to design the learning path graphs of the learning path system
including its learning activities and the links between the learning activities.
Jgraph (www.jgraph.com) is an open resource, Swing compatible graphics
component based on MVC architecture, and written in the Java programming
language. It is the component designed for graphs, which is mainly applied to
applications that need to express the graphs structure, such as flow chart,
network, traffic path, etc.
Ext JS
We use Ext JS (http://www.sencha.com/) to design the interface of the
learning path system. Ext JS is a AJAX application written in Javascript,
which is used to create interactive web applications rather than the AJAX
framework. It can be applied to any application written by Java, .Net, or PHP.
PHP
In this thesis, the editing functions of each learning activity are written by
PHP in the learning path system. PHP is a widely used server-side scripting
language that is normally used to Web development and can be embedded
into HTML. Generally, PHP run on the Web server, and generate user
browsed web pages through running the PHP program. PHP can be deployed
on many different servers (Apache, IIS, etc.), operation systems, and
platforms (Window, Linux, Unix, etc.), and also can support many database
systems, such as MySQL, Oracle, etc.
MySQL
We use MySQL to keep data of learning tasks, learning activities, learning
stages, and learning path, and their relationships in the database, so that we

2. Knowledge Backgrounds 37
can call them when create/change/delete them. MySQL is a database server,
which supports standard SQL and can compile on a number of platforms. It is
especially popularly used in web applications. Especially, phpMyAdmin is the
MySQL database system management program written by PHP, which allows
administrator manage MySQL database through Web port.
Apache
We use Apache as the local server to run the PHP programs in the learning
path system. Apache is a C implementation of HTTP web server. Apache is the
most widely used Web server software, which is an open source application
and can run on all kinds of computer platforms, because of its security and
cross platform. Apache also supports a lot of features, such as server-side
programming language support (such as Perl, PHP, Python, etc.) and
authentication schemes.
Tomcat
We use Tomcat to run the JSP program as the Web server for the learning
resource generation system. Tomcat is a free open source Web application
server, which provides software applications with services, such as security,
data services, transaction support, load balancing, etc. It is widely used to
small system where users is not too many, which is also the best selection for
developing and compiling JSP program.
Different from Apache, Tomcat is an extension of Apache, which is a
Java implementation of HTTP web server, and it is actually run JSP pages and
Servlet. Tomcat is popular used because it takes a little system resource when
running, has good augmentability, and supports the very common
development and application system functions, such as the load balancing and
email service, etc.
Web Services
We use Web services to connect our application program and the Web
application, so that we can create a web service from the application. Web
services are application components, which communicate using open

2. Knowledge Backgrounds 38
protocols. The basic Web service platform is XML plus HTTP. Web service use
XML to code and decode data, and use open protocols such as SOAP (Service
Object Access Protocol) to transport data. Web services can convert
applications to Web applications, so that we can publish, find, and use
services or provide some functions all over the world through the Web.
JSP
We program the learning resource generation system by JSP (Java Server
Pages) which is a kind of dynamic web page technique standard. The aim of
JSP is to separate presentation logic from Servlet. JSP embeds Java servlets
and JSP tag in the traditional Web page of HTML files, and forms the JSP
files. The web application developed by JSP is cross-platform, which can run
on different operation systems. JSP is normally executed on the server-side,
and returns a HTML file to the client-side, so that client-side can browse the
file with only a browser.
Excel
We use Microsoft Excel to generate all of these learning progress graphs to
evaluate student learning performance. Excel is a spreadsheet application
developed by Microsoft. There are plenty functions can be used to execute
computation, analyze information and manage electronic grid or the data
information in the web pages. It also has very powerful graphic feature. It can
display data as line graphs, histograms, charts, and also 3-D graphs, etc. Given
the statistic data, it can analyze them and dynamically generate intuitive
graphs.
2.10. Summary
This chapter describes the literature review that we used in this thesis.
Especially, because we use the learning theory to support the construction of
learning path in e-learning for different types of students using different types
of teaching approaches, and also the generation of the learning resources as
the learning contents. We assess student learning progress to determine their
learning qualities. The literature involves the introduction of learning theory

2. Knowledge Backgrounds 39
to support our research, e-Learning to introduce the research application in
this area, learning taxonomy as the criteria of learning outcomes, learning
styles for different types of students, learning modes for different types of
learning approaches, student assessments for different approaches to evaluate
student learning performance, Association Link Network to introduce how
learning resources relate to each other, and system development tools of the
research to introduce the used programming techniques. Given this
information, readers can have a better knowledge background before starting
to understand the main research of learning path construction in e-Learning
and the analysis of student learning progress.

40
Chapter 3
3. Research Methodology
3.1. Introduction
In this research, we firstly construct a fine-grained outcome-based learning
path model which can design and manage the components and learning
outcomes of a learning path. Secondly, we generate a learning path based on
Association Link Networks which can automatically construct personalized
learning path from Web resources. Thirdly, we design Fuzzy Cognitive Map
based student progress indicators to analyze student learning progress.
The research methodology we have applied includes both qualitative
method and quantitative method, which is used to verify if teachers and
students are satisfied with our research work as well as to verify if our
research work can provide with better teaching approaches. Research
methodology also explains the methods that we use to collect quantitative data
or/and qualitative data. The quantitative data is collected to measure variables
and verify existing theories or hypotheses. The collected data is used to
generate new hypotheses based on the results of different variables. Normally,
questionnaires are applied to gather these statistic data. On the other hand,
qualitative research is carried out to find out subjective assessment of
attitudes, opinions and behavior, such as to understand meanings,
experiences, ideas, and values, etc. Normally, interviews are applied to
describe and understand subjectively certain approaches. In this chapter, the
section of Research Design introduces how we design and arrange the
research study in general. The section of Instrument introduces the methods

3. Research Methodology 41
we are going to use to prove our proposed model is correct. The section of
Participates introduces how we chose participates in the research. The section
of Study variables introduces the variables used in the experiment, and the
possible effect that these variables have on the research. The section of
Proposed Data Analysis introduces the statistic methods that we use to
analyze the collected data. The section of Research ethics states that this
research obeys ethical principles during scientific research. The section of
Summary summarizes what we have found.
3.2. Research Design
This research work contains three major parts to answer the three
research questions, in which we use different research methods to verify our
research work. To answer the first research question of how to learn, which
requires finding out the teaching approaches and the sequence of learning, we
have proposed a fine-grained outcome-based learning path model. In order to
verify this method, we have implemented a prototype of this model. Next, we
conduct a user study, in which we have invited teachers to try out our
prototype and evaluate it as well as give us feedbacks in terms of their user
experiences. This user study is mainly carried out through 3 parts including an
introduction on the system, user interaction with the prototype, and
evaluation questionnaires. We then collected teachers’ feedback on the
questionnaires, and use one-way ANOVA to analyze the collected data. During
the one-way ANOVA analysis, we group teachers according to their teaching
experiences and knowledge backgrounds, respectively, so that we can
determine if teachers with different teaching experiences or different
knowledge backgrounds would have different evaluation results on our system.
To answer the second research question of what to learn, which
requires finding out the learning outcomes that students are going to achieve
and the learning resources that help students achieve the learning outcomes,
we have proposed a learning path construction method based on Association
Link Network. This method can construct personalized learning path from
well-structured learning resources. In order to verify this method, we have

3. Research Methodology 42
implemented a prototype system of this model as well. Next, we have
conducted two experiments to show the advantages of the system
recommended ones. One is to compare the quality of manually selected LPs
with system recommended LP, and the other is to compare student learning
performance after using manually selected LP and system recommended LP.
In the second experiment, as we have two groups of data, so we applied two
sample T-tests to analyze the differences between the learning performance of
the two groups of students.
To answer the third research question of how well students have learned,
which requires finding out student learning progress, learning qualities, and
student potential to maker further improvements, we have proposed Fuzzy
Cognitive Map based student progress indicators. In order to verify this
method, we have collected academic data of high school students and applied
our student progress indicators to the analysis of their learning progress. And
also, we designed questionnaires for both teachers and students by providing
them the learning progress analysis results and ask if they understand and
agree with the learning progress results.
3.3. Instrument
In this research, I have applied different methods to address different research
questions, including Implementation of prototypes, User study,
Questionnaires, and Comparison study. This research study uses both
qualitative and quantitative approaches for data collection and data analysis.
Qualitative approaches help us make general conclusion and research
propositions, and quantitative approaches verify the correctness of our
proposed. The following description introduces these research instruments
used for each research question respectively.

3. Research Methodology 43
3.3.1. A Fine-grained Outcome-based Learning Path
Model
In order to verify our work, I implemented the prototype of the fine-grained
outcome-based learning path model, so that we can ask teachers to evaluate
our method through a user study.
Implementation
This prototype provides teachers the basic functionality of designing learning
path, where teachers can create or delete learning activities, learning tasks, as
well as adjust their settings and teacher can create and manipulate learning
path components graphically. And also, this prototype provides the
corresponding learning path of student learning performance. The prototype
implementation help teachers better understand how they can manage and
design the learning path for different types of students. I have applied Jgraph,
Ext JS, PHP, MySQL, and Apache, etc. to implement the prototype. The
implementation details are explained in section 2.9.
User Study
We also conducted a user study for teachers to evaluate our work, which
includes three parts, an introduction on the system, user interaction with the
prototype, and evaluation questionnaires. Teachers are firstly invited to
experience this prototype. They can ask questions about it to help them
understand how to manage it. Afterwards, they are given a questionnaire to
collect their evaluations of this learning path model. The whole questionnaire
(Appendix A) contains 19 questions, where the first 6 questions collect
information about teachers’ personal teaching information, and the rest
questions can be divided into three major questions: (1) Can the new model
provide a more systematic and intuitive way for teachers to construct learning
paths? (2) Does it produce learning paths that address the diverse needs of
different courses? (3) Do teachers think that it is easier to set out criteria to
assess student learning outcomes through the new model? Teachers are
expected to scale each of these questions using 5-point likert scale to indicate

3. Research Methodology 44
their satisfaction on our work. With these statistic data, we can analyze if
teachers satisfy with our work.
3.3.2. Learning Path Construction based on Association
Link Network
In order to verify this work, we implemented a prototype of learning path
construction system, with which we can ask both teachers and students to
evaluate the system through a comparison study.
Implementation
To evaluate the performance of the learning path that is constructed based on
Association Link Network, the implemented prototype of the learning path
construction system graphically shows how learning resources are related to
each other as well as support the editing of teacher knowledge model.
Teachers can adjust the structure of teacher knowledge model. And students
can learn tailored learning resources through associations of these learning
resources in the keyword, concept, and learning resource ALNs, respectively. I
have applied Tomcat, Web Services, and JSP, etc. to implement the prototype.
The implementation details are explained in section 2.9.
Comparison Study
We then conduct a comparison study to evaluate the method in two aspects.
One is to compare the importance of system recommended learning path with
the manually selected learning paths, the other is to compare student
performance between students who use this system and the students who do
not use the system.
In the first experiment, importance of LP is evaluated by summing up
the importance of the nodes that constitute a LP. Teachers are asked to
manually construct LPs according to the topic ALN. Such a construction
should fulfill two requirements: 1) the selected topics should connect with
each other; 2) the selected topics should be important to students. Such
requirements also govern how the recommended LP generated by our system.

3. Research Methodology 45
To determine whether the comprehensiveness of the ALN structures will affect
the quality of LP generation, we conduct experiments using three different
abstraction levels of TKM by changing the number of association links
constituted the topic ALN. Particularly, we use topic ALNs that have 196 links,
271 links and 360 links, corresponding to 20%, 50%, and 80% of the total
association links, to form the low, middle and high resolutions of TKM,
respectively.
In the second experiment, we randomly divide students into two even
groups. The 1st group of students perform learning based on the teacher
constructed LPs, while the 2nd group of students learn by the system
recommended LP. All students are given 50 minutes for studying the learning
resources in the LPs, and take the same examination with 25 questions to
assess their understanding. Given their answers of these questions, we can
compare their performance, and also compare if their performance is stable.
3.3.3. Fuzzy Cognitive Map based Student Progress
Indicators
Questionnaires
To verify this research work, we evaluate if the proposed Fuzzy Cognitive Map
based student progress indicators can help both teachers and students to
better understand student progress and provide them more information to
manage the teaching and learning process. This research work collects
feedbacks from teachers and students using questionnaires and generates
graphs to visually describe student progress.
These graphs present student progress in different learning stages,
show how the performance on an attribute affects the performance of the
other attributes, compare the performance among different groups of
students, and also indicate the potential of students making progress in the
future.
We designed two kinds of questionnaires for teachers (Appendix B) and
students (Appendix C), respectively. Both of them contain six questions which

3. Research Methodology 46
evaluate the visualized learning progress in six aspects that covers different
stages of learning from Early stage, Interim stage, to Mature stage. These
questions aim to collect if teachers and students can better understand
student progress and make the learning process more efficient.
3.4. Participants
3.4.1. A Fine-grained Outcome-based Learning Path
Model
We evaluate the fine-grained outcome-based learning path model by testing if
teachers with different teaching experience or knowledge backgrounds would
have different evaluation results on our model. We invited 15 teachers who all
have different teaching experience and from different subject disciplines.
These teachers are from Durham University and some local high schools. And
they all have experience of using e-Learning systems, so that they can provide
more professional feedbacks.
3.4.2. Learning Path Construction based on Association
Link Network
To complete the evaluation of the learning path construction based on
Association Link Network, we have invited both teachers and students to help
us complete the comparison study. The 10 teachers are invited from Computer
Sciences Department to manually select learning paths which are used to
make comparison with system recommended learning path. We also invited
10 postgraduate students from Computer Science Department, but they have
different learning abilities, i.e. they perform differently when studying the
same LR. We randomly divide them into two even groups. The 1st group of
students learn by the manually selected LP, while the 2nd group of students
learn by the system recommended LP.

3. Research Methodology 47
3.4.3. Fuzzy Cognitive Map based Student Progress
Indicators
In order to analyze student learning progress with our Fuzzy Cognitive Map
based student progress indicator, we need teachers’ help to set the learning
outcomes for each subject, and also we need to collect student learning
performance according to their learning outcomes. We ask 6 teachers in 6
subjects to set learning outcomes in terms of the performance related
attributes and non-performance related attributes. And also, we have collected
academic data of 60 students from No. 83 High school of Xi’an, China. The
same teachers and students are required to evaluate our work by determine if
the student progress analysis results can help them better understand student
learning progress and make further improvements.
3.5. Study Variables
Variables are the values that change within a certain scope. Their changes may
cause changes on the experiment results. On the other hand, they also could
be changed because of the changes of some other variables. They also could
remain the same no matter how the experiment conditions change. We
applied some variables to control our experiments, and see if they would cause
changes to the experiment results. We also applied some variables, which can
be obtained from our experiments, as the criteria to evaluate our work. We
explain them as follows.
3.5.1. A Fine-grained Outcome-based Learning Path
Model
The experiment of evaluating the fine-grained outcome-based learning path
model has applied the following variables that would take effect on teachers’
evaluation results.
Teachers’ teaching experience
In this study, teaching experience refers to how long a teacher has been a
teacher. We consider it as a variable because teachers have different teaching

3. Research Methodology 48
experience may have different evaluation results about our prototype
according to their teaching experience.
Teachers’ knowledge discipline
Teachers’ knowledge discipline refers to teachers’ knowledge backgrounds, i.e.
which subjects they teach. Also, teachers from different knowledge disciplines
may use different teaching approaches. We consider it as a variable that may
cause changes to their evaluation results.
Teachers’ satisfaction score
In order to evaluate teachers’ feedbacks from the questionnaire (Appendix A),
we use teachers’ satisfaction score to indicate their overall satisfaction on our
outcome-based learning path model. Questions include if they are satisfied
with the functionalities of the model, if the model can be easily understood, if
it is easy to manage the model, etc. The answers of these questions are
quantified by the 5-point likert scale, then we can calculate the overall
teacher’s satisfaction score by the sum of all these questions.
3.5.2. Learning Path Construction based on Association
Link Network
The experiment of evaluating the work of learning path construction based on
Association Link Network has applied the following variables as the criteria to
evaluate if our work is good enough.
Importance of a learning path
The learning path construction method based on Association Link Network
can automatically construct personalized learning path. However, in order to
evaluate if the system recommended learning path is good enough, we
consider the importance of the learning path as a variable, which is calculated
by the sum of importance of each topic in the learning path. We can compare
the importance of system recommend learning path and that of manually
selected learning paths to see which one is better.

3. Research Methodology 49
Learning performance on a learning path
Learning performance indicates students learning quality, which we can use to
determine if the system recommended learning path could contribute to
student learning, and if the system recommended learning path is superior to
manually selected learning path. We ask students, who use our system and
who do not use our system, to do the same test. The learning performance is
the overall score in the test.
Stability of learning performance
Considering that these participated students have different learning abilities,
and also the learning resources have different complexities, the students may
have similar performance on simple learning resources, because in which case,
all students can provide correct answers. Or they may have similar
performance on very complex learning resources, because none of them can
provide correct answers. On the other hand, they may have quite different
performance on the medium difficulty level of learning resource, because only
students with higher learning abilities may provide correct answers. We use
stability of learning performance to indicate if different students can have
stable performance on the same learning resource. If we can improve the
stability of learning performance, then it means that we can better help low
learning ability students improve their learning performance, so that they can
have the similar learning ability with high learning ability students. The
variable is collected from all students’ learning performance on each piece of
learning resource, more details about the formulation of this variable can be
found in section 5.6.2.
3.5.3. Fuzzy Cognitive Map based Student Progress
Indicators
The experiment of evaluating the work of Fuzzy Cognitive Map based student
progress indicators has applied the following variables as the criteria to verify
our work from the aspects of student learning performance, student

3. Research Methodology 50
development balance degree, and the state value of a student attribute. We
explain each of each as follows.
Student learning performance
Student learning performance refers to the performance on performance
related attributes. We use it to monitor student learning performance
changing over different attributes in the same stage of learning. Given the
learning performance on different performance related attributes and which
attribute will cause the changes of the student learning performance, both
teachers and students can know students’ strength as well as weakness and
help them improve correspondingly.
Student development balance degree
We would like to find out if students have the potential to make further
improvements. Teacher can decide to go on providing them corresponding
learning resources if they have the potential. During the development of
student learning ability, there are many non-performance related attribute.
Student development balance degree indicates how well a student can handle
different learning environments which require the student to have different
non-performance related attributes. If a student has a balanced development
on all non-performance related attributes, for example, the student is good at
learning both concrete examples and abstract concepts, or the student has no
difficulty in learning knowledge presented in the form of either verbal, visual
information or context, then the student can perform better under different
learning environments. We consider the development balance degree as a
variable to indicate student progress potential to achieve more in the future.
State value of a student attribute
We have applied two types of attributes to describe the characteristics of
student learning, which include performance related attributes and non-
performance related attributes. However, the performance of an attribute may
cause effect on the performance of the other attributes. For example, if a
student has good performance on the ‘Responding’ attribute, then the student

3. Research Methodology 51
probably prefers the learning style of ‘Active’ (Ref. Section 2.4) when the
student processes information. In order to calculate the overall strength of
impact of an attribute on all the others, we use the ‘state value’ of the attribute
to measure the impact. Each state is actually the value of a node in the Fuzzy
Cognitive Map, which represents the causal relationships between these nodes
and how they affect each other.
3.6. Proposed Data Analysis
In this research study, we have applied different methods to analyze the data
that are collected from different research instruments, including a fine-
grained outcome-based learning path model, learning path construction based
on Association Link Network, and Fuzzy Cognitive Map based student
progress indicators. We introduce the proposed data analysis method for each
of these methods.
3.6.1. A Fine-grained Outcome-based Learning Path
Model
As we use questionnaires as the research instrument to collect teachers’
evaluation results on our work, where we have scaled these questions with 5-
point likert scale, so that we can quantify teachers’ evaluation results and
provide numerical analysis using statistic method like one-way ANOVA.
Likert Scale: In the questionnaire, each question for evaluating our model
has 5 options (Totally Agree=5, Agree=4, Neutral=3, Not Quite Agree=2 and
Disagree=1), teachers can select the options that best fits their decisions. The
quantified answers help us measure teachers’ overall satisfaction on our
model.
One-way ANOVA: In the study, we analyze if teachers’ teaching experience
and knowledge backgrounds will affect their evaluation results. We divide
teachers into several groups according to their teaching experience and
knowledge backgrounds to compare if their evaluation results are similar or
not. Because one-way ANOVA is used to compare the similarity between data
in two or more groups, but the size of these groups does not need to have

3. Research Methodology 52
exactly the same number, we can apply one-way ANOVA to compare the
results. After we obtain teachers’ evaluation results by the likert scale
measurement, we can use the ‘one-way ANOVA’ functionality of ‘Data
analysis’ provided by Microsoft Excel software to automatically calculate if the
evaluation results among different groups are similar or not.
3.6.2. Learning Path Construction based on Association
Link Network
We conducted two comparison studies to evaluate the work of learning path
construct. Firstly, we applied the ratio of system recommended learning path
and manually selected learning paths, in order to verify that our work can
provide a learning path with higher importance degree in terms of covered
knowledge concepts. Secondly, we used independent two-sample T-tests to
compare the learning performance of two groups students who used our
method and who did not use our method.
Ratio: Ratio is a type of measurement of scale. In the first comparison study,
the ratio is made of the importance degree between system recommended
learning path and manually selected learning paths. It measures the
differences between the two paths and shows how their differences change
over when the size of teacher knowledge model is different.
Independent Two-sample T-tests: When the number of groups for
comparison is two and the size of each group is the same, then ANOVA turns
to be the independent two-sample T-tests. In order to verify that students
using system recommended learning path have better learning performance,
we use the independent two-sample T-tests to compare the differences of
student learning performance variances between the group of students who
use our Association Link Network based learning path construction model and
the group of students who do not use our model.

3. Research Methodology 53
3.6.3. Fuzzy Cognitive Map based Student Progress
Indicators
When teachers and students try to understand student progress, it is greatly
straightforward to let them visualize the learning progress. If analysis results
can be presented in the form of graphs, we can design a visual questionnaire
and use quantitative answers to respectively collect evaluation results from
teachers and students.
Graph Comparison: We have collected a great number of data about
student learning progress, including the values of performance-related
attributes and non-performance related attributes at different learning stages,
the performance and development balance degree on a variety of subjects for
different groups of students, students’ potential for making progress, the
changes of students’ performance over different tests, and the impacts of
attributes on the performance of other attributes. It is not sufficient to use
only numeric analysis to present the comparison of learning progress that
changes with different attributes, different learning stages, different groups of
students, and different tests. We used graphs to present the comparisons of all
of them in order to help both teachers and students better understand
students’ learning progress.
Likert Scale: we also collected both teachers’ and students’ evaluation
results regarding the analyzed student progress via questionnaires. To
quantify their evaluation results, we applied 5-point likert scale to collect data.
Similarly, each question has 5 options (Totally Agree=5, Agree=4, Neutral=3,
Not Quite Agree=2 and Disagree=1).
3.7. Research Ethics
All questionnaires were collected anonymously. No age, sexuality or any other
private information was collected for research either. When participates used
with our prototype, they were not required to provide any private information
either. All data are promised to use for research only, and will not be open to
public. All participates are requested to attend to the experiment voluntarily,

3. Research Methodology 54
anyone who do not like to share their ideas or spend their time can refuse to
take part in the study.
3.8. Summary
This chapter describes the issues related to the research methodology. It
explains how we designed the research study, which methods we used to prove
our proposed method is correct, how participates took part in the research,
which kinds of variable we considered to measure our proposed model, which
statistic methods we used to analyze the collected data, and the ethic issue.
However, as the number of participates in each study was not plenty enough,
it may cause some errors to the analysis results. That is the limitation of this
study.

55
Chapter 4
4. Method for constructing a
Fine-Grained Outcome-based
Learning Path Model
Recently methods have been developed to design learning paths based on
attributes that describe learning contents and student characteristics, helping
students learn effectively. A learning path (or curriculum sequence) comprises
steps for guiding a student to effectively build up knowledge and skills.
Assessment is usually incorporated at each step for evaluating student
learning progress. Although existing standards, such as SCORM and IMS-LD,
provide data structures to support systematic learning path construction and
IMS-LD even includes the concept of learning activity, they do not provide any
facilities to help define the semantics in order for pedagogy to be formulated
properly. On the other hand, most existing work on learning path generation
is content-based. They only focus on what learning content is to be delivered
at each learning path step, and pedagogy is not incorporated. Such a modeling
approach limits student learning outcome to be assessed only by the mastery
level of learning content, without supporting other forms of assessments, such
as generic skills. In this chapter, we propose a fine-grained outcome-based
learning path model to allow learning activities and their assessment criteria
to be formulated by the Bloom’s Taxonomy. Therefore, pedagogy can be
explicitly defined and reused. Our model also supports the assessment of both
subject content and generic skills related learning outcomes, providing more
comprehensive student progress guidance and evaluation.

4.Method for A Fine-Grained Outcome-based Learning Path Model 56
4.1. Introduction
Learning path defines how a course of study is proceeded. It comprises steps
for a student to go through in order to conduct learning. At each step, the
student studies certain learning content (i.e., what to learn), which should be
disseminated through suitable pedagogy (i.e., learning and teaching
approaches). Student assessment should also be included for evaluating
student learning progress. Practically, a student is expected to achieve various
learning outcomes, which are broadly categorized into subject-specific
knowledge and skills, and generic skills. Specifically, subject-specific
knowledge refers to facts and concepts within a subject domain. Subject-
specific skill refers to the learning outcome of formulating, evaluating and
synthesizing matters within a subject. Such skill may share among subjects of
similar nature. Generic skill refers to the learning outcome that can be applied
to various subject domains and student future development.
Pedagogy formulation and student assessment are main challenges for
learning path construction. Consider practical situations, we use the teaching
unit COMP2161 Computer Systems II in our school as an example. We specify
“To gain detailed understanding of the difficulties encountered with setting up
large computer networks” as a subject-specific knowledge, “To be able to
implement and work with different types of computer systems” as a subject-
specific skill, and “To be able to communicate technical information in a
scientific fashion” as a generic skill, to evaluate part of the student learning
outcomes. Subject lecturers are required to design suitable learning activities
(i.e., how to learn) helping students achieve these outcomes, and proper
assessment methods to evaluate student learning progress.
In terms of pedagogy, we offer two main types of learning activities:
lecture and practical, where their pedagogies are “learn by perceiving oral
presentation” and “learn by experimenting”, respectively. Although lecturers
can implement more fine-grained pedagogies or even other types, such
pedagogies are hard to be formally formulated and reused. In terms of student
assessment, defining and assessing subject-specific knowledge is easy, as it is
4.Method for A Fine-Grained Outcome-based Learning Path Model 57
directly tied with the design of teaching subjects. However, subject-specific
and generic skills are usually left as written documentation rather than really
used for assessing student achievement, since they may require evaluating
student learning outcomes achieved from a set of relevant or even all subjects,
which is not trivial for implementation.
Existing work on learning path generation for e-learning [Chen08,
Kara05, Limo09] are generally content-based without modeling pedagogy or
learning activity. Students are usually only assessed by the mastery level of the
learning content in each learning path step. As subject-specific and generic
skills are learning activities dependent, therefore such skills cannot be
properly assessed.
SCORM [SCORM] and IMS-LD [IMSLD] are popular standards defining
data structures for learning paths. SCORM follows the content-based
approach without supporting the assessments of generic skills. Although IMS-
LD includes learning activity in their data structure, it only provides a
container to hold learning activities without offering any facility to help define
their semantics. As a result, teachers are responsible for manually specifying
such definitions, which may be hard to reuse.
In this research, we propose a fine-grained outcome-based learning path
model for teachers to formulate a course of study as a sequence of learning
activities. This allows pedagogy to be explicitly formulated. We also introduce
a two-level learning path modeling to facilitate the assessments of different
forms of student learning outcomes, including subject-specific knowledge and
skills, and generic skills. Our work does not deal with the problem of adaptive
learning. Our contributions are:
• Pedagogical support: We model a learning activity as a composition of
learning tasks enabling teachers to construct the learning and teaching
approaches in explicit forms. We also model learning tasks to tie with
learning outcomes based upon the Bloom’s Taxonomy [Bloo56, Krat73,
Simp72], such that teachers may be able to formulate comprehensive

4.Method for A Fine-Grained Outcome-based Learning Path Model 58
assessment criteria, as they do in a conventional classroom teaching
environments.
• Student assessment: We introduce a two-level learning path modeling,
allowing teachers to assess collective student learning outcomes generated
from individual learning activities or a specific type of learning outcome
generated dispersedly from a set of relevant learning activities.
• Reusability: Our model allows teachers to reuse their teaching and
assessment approaches. It is done by applying a designed learning activity
structure to govern the dissemination of another set of learning contents.
Given that we formulate pedagogy through a mathematical model, the
weight associated with each learning task becomes an intuitive
manipulator for teachers to adjust their teaching and assessment
approaches for the new learning activity.
The rest of this chapter is organized as follows. Section 4.2 summarizes
existing works. Section 4.3 presents our new learning path model. Section 4.4
discusses the implementation of the prototype system. Section 4.5 presents
and analyzes our experiment results. Finally, Section 4.6 concludes the work
presented in this chapter.
4.2. Related Work
A learning path is the implementation of a curriculum design. It comprises
elements forming steps for students to go through for acquiring knowledge
and skills. In existing work, learning outcome assessment is generally tied up
with these steps. In this section, we examine how existing approaches define
learning paths and assess learning outcomes. The discussion includes
conventional classroom teaching, learning path generation systems and de
facto standards that define learning paths.
4.2.1. Conventional Classroom Teaching
Under the conventional classroom setting, students usually share a common
learning path due to the one-size-fit-all teaching approaches. This learning

4.Method for A Fine-Grained Outcome-based Learning Path Model 59
path is typically pre-defined and mostly static, as teaching resources or
constraints, such as teaching staff, classrooms and the period of study, are
usually fixed. Although subject-specific knowledge and skills, and generic
skills are generally specified in the syllabus as learning outcomes, not all of
them can be assessed explicitly. In general, subject-specific knowledge can be
assessed by subject coursework or written examinations where assessment
criteria are usually well-defined. In contrast, subject-specific and generic skills
are acquired more broadly across closely related subjects and even subjects
without trivial relations. They require methods for evaluating how part of a
subject can help train up students with certain skills and linking up learning
outcomes from corresponding subjects. However, such methods are usually
not available in practice.
4.2.2. Learning Path Generation System
Learning path generation systems construct adaptive learning paths by
arranging selected learning contents in a proper sequence for students to
study, aiming at improving student learning effectiveness. [Kara05] initially
generates a set of learning paths by matching the educational characteristics
of learning contents (i.e., subject-specific knowledge / skills and generic skills)
with student characteristics and preferences (i.e., students’ learning styles,
working memory capacity, etc.). The suitability of each piece of learning
content, which constitutes a learning path, is then calculated as a weight by a
decision-making function. Based on a shortest path algorithm, the most
suitable learning path can be chosen. Student assessment results are not
involved in the method. Instead, [Chen08] involves a pre-test to assess
students and capture their incorrect responses, forming the inputs to a genetic
algorithm, which is driven by learning content difficulty level and concept
continuity, to generate an optimal learning path. LS-Plan [Limo09]
characterizes learning contents by learning styles [Feld88, Li10] and difficulty
levels (based on the Bloom’s Taxonomy). The system requires a student to
conduct a test (if existed) after finishing each learning path step in order to
examine the student’s mastery level of certain learning content and verify the
student’s learning style. The next learning path step can then be determined

4.Method for A Fine-Grained Outcome-based Learning Path Model 60
based on the test result. The above methods are content-based without
incorporating pedagogy (i.e., learning and teaching approaches). Also,
learning outcome assessment is confined to the mastery level of learning
content.
For implementing pedagogy, LAMS [Dalz03] provides an interactive
user interface allowing teachers to define a learning path based on a set of
predefined learning activities, such as read notice board, chatting, and small
group debate, for individuals or a group of students. It also models student
assessment as a learning activity. A designed learning path can be reused for
teaching different subjects by replacing the learning contents associated with
its learning activities. However, it cannot assess students based on a
composition of multiple learning outcomes or a learning outcome that is
dispersedly acquired from multiple learning activities. A comprehensive
learning activity model was proposed in [Cono05]. It defines a learning
activity as a composition of learning content, learning outcomes, teaching
approaches and tasks. However, the correspondences among the components
have not been modeled, i.e. it cannot formulate student learning outcome
assessment if a learning activity involves several tasks.
4.2.3. Designing and Managing Learning Activities
There are also standards for defining learning paths. SCORM [SCORM]
defines an interface between learning contents and a learning management
system (LMS) and supports exchanging learning contents among different
LMSs. It models learning contents with a hierarchical activity tree. A learning
objective is defined at each activity of the tree to form the criteria for assessing
student learning outcome. Some of these learning objectives are globally
shared among certain activities or some are formed by the weighted sum of
the learning objectives of the child activities. There are also rules for
controlling the sequence of learning content delivery. However, SCORM only
addresses the needs of a single student, and does not model pedagogy as it is
content-based. IMS-LD [LD] is a meta-language that is divided into 3 parts:
Level A defines activities and roles for delivering learning content, Level B

4.Method for A Fine-Grained Outcome-based Learning Path Model 61
adds properties and conditions to Level A to describe student learning
outcomes and govern learning content delivery, and Level C adds notification
to Level B to define events that trigger activities. Unlike SCORM, IMS-LD
supports the concept of learning activities where their workflow and
dependency are modeled. It also supports collaborative learning activities.
However, the learning activity modeling is still like a container, where
teachers need to manually define and interpret the semantics, making it
difficult for reuse. On the other hand, IMS-SS [SIMSEQ] offers a standard for
controlling the flow of learning activities through pre-defined rules, branching
definitions and learning outcomes of student interactions with learning
contents. This standard is also content-based without modeling pedagogy.
4.3. The Fine-grained Outcome-based Learning
Path Model
In this chapter, we propose a fine-grained outcome-based learning path
model. The model is defined mathematically such that the setting of pedagogy
and student learning outcome assessment can be explicitly formulated and
reused. Considering the fact that a learning path has two functionalities,
specifying a student learning process and connecting student learning
outcomes for evaluating student progress, this chapter defines learning paths
with two levels, namely learning activity (LA) and learning task (LT) levels
(Ref. Section 4.3.2), such that student achievement in both LA-specific and
different types of learning outcomes can be comprehensively revealed.
4.3.1. Overview of the Learning Path Model
Existing learning path generation methods are usually content-based. As
illustrated in Fig. 4. 1 (a) and Fig. 4. 1 (b), they construct learning paths based
on knowledge elements (KEs), which are delivered through lecturing and
assessed by question-answering (Q&A). However, pedagogy is generally not
included in their methods. Assessment of different forms of learning
outcomes, such as generic skills, is also not properly supported. Such
deficiencies impose significant restrictions on these methods for modeling

4.Method for A Fine-Grained Outcome-based Learning Path Model 62
how students are being trained or assessed, and rely on teachers to work out
these by themselves. Such burden partly explains why learning path
generation systems are not widely adopted for learning and teaching in
practice.
To model the student learning process, we propose using learning
activities (LAs) [Cono05] instead of KEs to form the building blocks of a
learning path as shown in Fig. 4. 1 (c), and model each KE as a set of LAs. As
shown in Fig. 4. 1 (d), this formulation allows a teacher to govern KE delivery
by setting up flow-controls to LAs, including sequential, parallel and
conditional. The introduction of LAs facilitates teachers to define their
teaching strategies, i.e., how they disseminate a KE. Learning contents
associated with each LA can be obtained from the Web or created by teachers.
To support modeling pedagogy of a LA, as illustrated in Fig. 4. 1 (e), we
define a LA to comprise a set of learning tasks (LTs), where a LT is designed
to train and assess a specific type of Learning outcome (LO). We associate a
weight, wi (ranging between [0,1] and ∑ wi = 1), to each LT indicating its
importance in a LA, which implicitly defines the amount of time spending on
the learning task and the weighting of its assessment. Pedagogy of a LA can be
adjusted by changing LTs and their weights.
To model LO requirement of a LA, each LT in the LA is required to
assign with a SA as the assessment criteria. Note that two different LTs are not
Fig. 4. 1 The learning path formulation in existing work and in our work.
Lecture Q&A
(a) KE in existing work
L QL Q
L Q
...
...
(b) Learning Path in existing work
(c) Learning Path in our work
LA
...LA
...LA
(d) Example KEs in our work
Learning Activity
Learning Activity
...
...
...
KE with Parallel / ConditionalLearning activities
KE with SequentialLearning activities
Learning Activity
Learning Activity
...
(e) Learning Activity in our work
Learning Task
StudentAbility
Learning Task
StudentAbility
W1 * + W2 * + ...

4.Method for A Fine-Grained Outcome-based Learning Path Model 63
restricted to be assessed by different types of LOs. The student learning
outcome from a LA is then defined as a weighted composition of the SAs. With
the two-level learning path modeling, student assessment can be conducted at
each LA or by a specific learning outcome. The LA level learning path helps
assess student learning progress made from a series of LAs, while a LT level
learning path connects corresponding LTs from relevant LAs to help evaluate
student learning outcomes or skill specific learning progress.
To support time management in the learning process, we also divide the
time span of a LA level learning path into a finite sequence of time slots, and
refer to each time slot as a learning stage (LS), where a LA may be taken place
in a designed LS or span over a number of LSs. Based on this definition of LS,
we define a student’s learning progress as the accumulated learning outcome
over some consecutive LSs.
In contrast to [Cono05], our model explicitly defines the relationship
among learning tasks; formulates their assessments by Bloom’s taxonomy and
defines how such assessments are combined to form the learning outcome of a
learning activity. We also uniquely support student learning outcomes specific
assessment across a series of learning activities. Table 4. 1 summarizes the
major elements of our learning path model. We will elaborate their details in
the following sub-sections.
4.3.2. Formal Definitions
Student Learning Outcome: Student learning outcome refers to a set of
attributes describing if a student has acquired them after studying something.
These attributes may indicate whether the student can only recall the subject
content or may apply subject knowledge to solve problems in unseen
situations, for instance. In practice, it is a popular approach to assess learning
outcomes as a composition of different levels of learning outcomes. For
example, a teacher may set different types of question in an examination
paper to assess different learning outcomes. Research on learning outcomes
was first conducted systemically by a group of educators led by Benjamin
Bloom

4.Method for A Fine-Grained Outcome-based Learning Path Model 64
[Bloo56]. They produced the Bloom’s Taxonomy to classify thinking behaviors
to six cognitive levels of complexity. This taxonomy has been extended to
cover three domains: cognitive (knowledge based), affective (attitudinal
based) [Krat73] and psychomotor (skills based) [Simp72]. It forms a
comprehensive checklist guiding a teacher to ensure that a course design can
help train up students with all necessary abilities. Table 4. 2 summarizes the
Bloom’s Taxonomy by listing the main characteristics of different learning
outcomes according to the Bloom’s domains (columns) and their
corresponding levels of complexity (rows).
To help formulate the assessment criteria of student learning, we
propose using student outcomes from the Bloom’s Taxonomy as the basis for
assessment since they can comprehensively quantify the levels and the types
of student achievement. To define the criteria, a teacher needs to identify a set
of Student Learning Outcomes used for assessment and puts them into a
Student Learning Outcomes Table (SLOT), which is defined as follows:
𝑆𝐿𝑂𝑇 = 𝐴!,⋯ ,𝐴!,⋯ ,𝐴 !"#$ for 1 ≤ 𝑖 ≤ 𝑆𝐿𝑂𝑇 (4.1)
Table 4. 1 Definition of major elements
Abbr. Key Element Definition
SA Student Ability Set of attributes indicates how a student makes
progress in learning.
LT Learning Task A fine-grained type of training helps a student
achieve a specific ability.
LA Learning Activity A training unit comprises a set of LTs to define its
teaching and learning approach.
LAC Collaborative Learning Activity
A specific type of LA designed for students to learn
under a group setting.
LP Learning Path Sequence of steps for a student to go through and
build up knowledge & skills.
LS Learning Stage Finite period of time defined within the time span of
a learning path.

4.Method for A Fine-Grained Outcome-based Learning Path Model 65
where Ai refers to a specific kind of student learning outcome and |SLOT| is
the cardinality of SLOT. To facilitate the learning outcome assessment, for
each learning outcome, two Bloom’s Taxonomy related functions Bc(Ai) and
Bd(Ai) are set up for retrieving the level of complexity and the Bloom’s
taxonomy domain, respectively. For example, the learning outcome of
‘Comprehension’ has the complexity level of 2 in the ‘Cognitive’ domain, i.e.,
Bc(Ai) = 2 and Bd(Ai) = Cognitive. To gain a better idea on how a suitable set of
learning outcomes can be defined in terms of Bc(Ai) and Bd(Ai), the reader may
refer to the Bloom’s taxonomy [Bloo56, Krat73] or some quick references
available on the Web, such as [Bloom].
Although Bloom’s Taxonomy covers a comprehensive list of learning
outcomes, which can maximize the benefits of our model, we expect that some
teachers may prefer using a simpler learning outcome model or even define
their own lists. This will not affect any functionality of our model. In this
sense, new versions of the Bloom’s Taxonomy are also applicable to our model.
Learning Task: To allow a fine-grained formulation of the learning
process of KEs, we introduce the idea of learning task, which is designed for
training up a student with an outcome-specific learning outcome. By putting
together a set of learning tasks, a learning activity is formed. Similar to the
selection of learning outcomes, a teacher also sets up a learning task table
Table 4. 2 A summary of the Bloom’s taxonomy.
Level of
Complexity
Cognitive
(Knowledge)
Affective (Attitude) Psychomotor
(Skill)
1 Knowledge Receiving Imitation
2 Comprehension Responding Manipulation
3 Application Valuing Precision
4 Analysis Organizing Articulation
5 Synthesis Characterizing by value or
value concept
Naturalization
6 Evaluation

4.Method for A Fine-Grained Outcome-based Learning Path Model 66
(LTT), which comprises a list of learning tasks for constructing learning
activities as follows:
for (4.2)
where Ti is a learning task and |LTT| is the cardinality of LTT. A function
Sa(Ti) is associated with each learning task Ti to return a student's level of
achievement. The mapping from LTT to SLOT is surjective, i.e., a teacher can
design different types of learning tasks to train up students with the same type
of learning outcome.
The design of learning tasks is typically course dependent. As we do not
expect teachers having comprehensive knowledge in the Bloom’s taxonomy
due to its complexity, to help teachers proceed with the design systematically
and in an easier way, we suggest that a teacher may optionally consider
whether a learning task is set up for teaching declarative or functioning
knowledge [Bigg07]. Declarative knowledge relates to the study of factual
information, while functioning knowledge relates to the study of how
something works. For example, to design learning tasks for teaching
declarative knowledge, reading can be included to help assess learning
outcome in memorization, while an in-class quiz can be set out to assess
student understanding. Table 4. 3 shows some sample learning tasks along
with the corresponding types of knowledge, learning outcomes for
assessment, and the Bloom’s domains and levels of complexity.
Learning Activity: When designing a course, a teacher typical
establishes a set of learning activities, such as lecture, tutorial or practical, for
students to learn KEs through different ways. In our formulation, a learning
activity (LA) is formed by a row vector of learning tasks, ,
such that:
for (4.3)
where is a transpose function, wi is a weight to indicate the importance of
},,,,{ 1 LTTi TTTLTT = LTTi ≤≤1
][ 1 LAi TTT
Τ= ][][ 11 LAiLAi TTTwwwLA LAi ≤≤1
Τ⋅][

4.Method for A Fine-Grained Outcome-based Learning Path Model 67
learning task Ti, ∑ wi = 1 and |LA| is the cardinality of LA. The weights
associated with these learning tasks will be added up to 1 or 100%, meaning
that if the weight of a learning outcome (which is associated with one of the
learning tasks) has been increased, the rest of the learning outcomes will be
decreased in its contribution to this 100%, and vice versa. Specifically, if the
weight of a learning outcome w has been adjusted to become w’, the
contribution of the rest of the learning outcomes will become (1 – w’) / (1 –
w). Therefore, the weight of any of the rest of the learning outcomes wr will
be adjusted to become wr · (1 – w’) / (1 – w). The learning outcome (LO) of
a learning activity (LA) can then be assessed by:
𝐿𝑂 = 𝑤!⋯𝑤!⋯𝑤 !" 𝑓! 𝑆! 𝑇! ⋯ 𝑓! 𝑆! 𝑇! ⋯ 𝑓!" 𝑆! 𝑇 !"!
(4.4)
where fi() is a function to evaluate the student’s level of achievement in a given
learning outcome. The weights used in both (4.3) and (4.4) are the same ones,
as the weight associated with a learning task also defines the importance of
the associated learning outcome of the learning task. Note that we refer Ti as a
symbol representing learning task rather than treating it as a mathematical
scalar for computation, although in implementation, Ti may be a scalar for
storing the ID of a learning task.
Table 4. 3 Examples of learning tasks.
Type of
Knowledge
Learning Task Student learning
outcomes for Assessment
Bloom’s Taxonomy
Correspondence
Declarative Reading Memorization Cognitive, Level 1
In-class Quiz Understanding Cognitive, Level 2
Peer-Teaching Understanding Cognitive, Level 2
Functioning Case
Presentation
Understanding Cognitive, Level 2
Performing a
Case
Application Cognitive, Level 3
Computer
Program Design
Synthesis Cognitive, Level 5

4.Method for A Fine-Grained Outcome-based Learning Path Model 68
Instead of asking teachers to create new evaluation functions, they may
reuse existing ones, such as simple marking (quantitative assessment),
grading (qualitative assessment) or performing evaluation through the item
response theory [Chen06], if they are applicable to the types of learning
outcome. As such, our learning path model can fit different types of
assessment methods and inference algorithms, which could be subject-specific
or a combination of methods for performance evaluation. Note that within a
learning activity, each learning task is typically designed for training students
up with a different type of student learning outcome.
In fact, modeling a LA is not straightforward. Given that different
teachers may adopt different teaching approaches, and different students may
have different learning styles, the actual tasks used even in the same type of
LA, e.g., a lecture, can be very different. Such a difference also appears in
certain type of LA at different subject disciplines. This suggests that we need a
more fine-grained model to formulate LAs to cope with practical needs.
Therefore, we propose to formulate a LA as a set of learning tasks. It offers
course designers or teachers a way to properly define teaching approaches for
delivering KEs. While a LT is an implementation of a low-level teaching
technique that focuses on training up and assessing students with certain
learning outcome, such as an informal in-class quiz and feedback, a LA is an
implementation of a high-level teaching strategy that course designers or
teachers use to approach a KE for training up students with a composition of
knowledge and skills.
Our model offers a more accurate modeling of learning activities in
terms of learning process and learning outcome requirements. Particularly, we
formulate a learning activity as a container of a suitable set of learning tasks,
such that it can be easily customized by altering its learning tasks to fit a
certain subject discipline or the student’s learning characteristics. This feature
helps accelerate the process of producing new learning activities from existing
ones. It is also critical to our previous work on adaptive course generation
[Li10], which applies filtering technique to arrange tailor-made learning

4.Method for A Fine-Grained Outcome-based Learning Path Model 69
content for different students at different learning stages, extending it to
further support teaching and learning approach adaptation.
Collaborative Learning Activity: A collaborative learning activity
(LAC) is a specific LA designed for students learn together in a group setting.
In a normal LA, its learning tasks and assessments are designed for an
individual student. In contrast, a collaborative learning activity comprises two
parts: one for an individual student in the group and the other one for the
whole group. They apply to both learning tasks and their assessments.
Specifically, this kind of learning activity comprises two types of learning
tasks, a single set of collaborative learning tasks ψ! and multiple sets of
individual learning tasks ψ! for 1 ≤ i ≪ S , where S is the number of
students participating in the group. Mathematically, ψ! and ψ! are one-
dimensional vectors of learning tasks (as Eq. 4.5.1) designed to be performed
by a group of students together and by an individual student Si within the
group, respectively. To facilitate the assessment of learning outcomes, Ξ! and
Ξ! are one-dimensional vectors of weights (as Eq. 4.5.2) used to indicate the
importance of learning tasks in ψ! and ψ!, respectively. Hence, a collaborative
learning activity, LA!!, designed for a student Si is defined as:
(4.5)
Ψ! = [𝑇!! ,⋯ ,𝑇! !] and Ψ! = [𝑇!! ,⋯ ,𝑇 ! !] (4.5.1)
Ξ! = 𝑤!! ,⋯ ,𝑤 !! and Ξ! = 𝑤!! ,⋯ ,𝑤 !
! (4.5.2)
where all elements in both ΞC and Ξi sum up to 1. 𝑇!! ,⋯ ,𝑇! ! are the set of
learning tasks needed to be completed collaboratively, and 𝑇!! ,⋯ ,𝑇 ! ! are the
set of learning tasks needed to be completed individually. 𝑤!! ,⋯ ,𝑤 !! and
𝑤!! ,⋯ ,𝑤 !! are the correspondent weights of importance for collaborative
learning tasks and individual learning tasks, respectively. Mathematically, the
definitions of both and are equivalent to Eq. 4.3, and therefore
the student learning outcome can thus be evaluated by Eq. 4.4 when proper
learning outcome evaluation functions are in place. We refer collaborative
⎥⎥⎦
⎤
⎢⎢⎣
⎡
ΨΞΨΞ= Τ
Τ
ii
CCCiLA
ΤΨΞ CCΤΨΞ ii

4.Method for A Fine-Grained Outcome-based Learning Path Model 70
learning tasks in Eq.4.5 as symbols rather than treating them as mathematical
scalars for computation. From the teacher’s perspective, the entire
collaborative learning activity in a group setting is represented as:
(4.6)
Note that the learning outcome of a student can be evaluated in the same
way regardless whether a collaborative learning activity exists, since
collaborative learning activity only introduces certain learning tasks having
their assessment results shared by some students, the assessment results
collected from such learning tasks can still be processed in the same way as
those collected from learning tasks conducted by individual students.
Learning Path: Learning path (LP) is for specifying a student learning
steps and linking student learning outcomes for progress evaluation. We
define a LA level and a LT level of learning paths. The LA level learning path
(LP) is made up of an organized set of learning activities. It is modeled as a
directed graph, LP = (V, E), defining the course of study for a student. It also
links the learning outcomes of LAs to facilitate student learning progress
evaluation. Specifically, E is the set of edges while V is defined as:
for (4.7)
where LAi is a learning activity and |V| is the cardinality of V. If two learning
activities have a prerequisite relation, they will be connected by an edge in E.
Our formulation is backward-compatible with KE based learning path models.
Specifically, as illustrated in Fig. 4. 1 (d), we can group relevant LAs together
with their flow-control structures to form a KE, turning our learning path
model to become KE based. Therefore, it is possible to integrate existing
learning path generation system [Chen08, Kara05, Limo09] with our learning
path model. Particularly, as we offer a fine-grained modeling on student
assessment, this makes more comprehensive student progress information
⎥⎥⎥⎥⎥
⎦
⎤
⎢⎢⎢⎢⎢
⎣
⎡
ΨΞ
ΨΞΨΞ
=
Τ
Τ
Τ
SS
CC
CLA11
},,,,{ 1 Vi LALALAV = Vi ≤≤1

4.Method for A Fine-Grained Outcome-based Learning Path Model 71
available and that learning path generation results can be enhanced when
student learning progress information is considered [Chen06, Limo09]. On
the other hand, a LT level learning path is designed to link certain learning
tasks defined in relevant learning activities, where those learning tasks are
designed to collectively train up and assess a specific type of learning
outcome. In terms of the structure, similar to the LA level of learning path, a
LT level learning path is also a directed graph, but its elements are LTs rather
than LAs. As an illustration, examples of a LA “Computer Organization (LT)”
and its LTs are shown in Fig. 4. 4 (a) and Fig. 4. 4 (b), respectively. An example of
a LA level of learning path is shown in Fig. 4. 2. Based on this learning path, two
sample LT level learning paths, which assess communication skill and writing
skill of a student, respectively, are shown in Fig. 4. 6 and Fig. 4. 7.
Learning Stage: To provide teachers a metric to control the number of
learning activities taking place at any period of time and to schedule learning
activities properly, we divide the time span of a learning path into a finite
sequence of time slots, and refer to each time slot as a learning stage (LS). A
learning activity may take place in a designated learning stage or may span
over a number of learning stages. The definition of learning stage well
matches the timetabling concept well in practice, where a teacher may divide
an entire course taking place with a finite sequence of time slots, such as
teaching weeks or semesters, and assign a proper number of learning activities
to each time slot. During each learning stage, a student only needs to study a
subset of KEs through designated learning activities. To indicate the starting
learning stage (sLS) and ending learning stage (eLS) of a LA, we set up two
functions, LSs() and LSe(), respectively, as follows:
𝑠𝐿𝑆 = 𝐿𝑆! 𝐿𝐴 (4.8)
𝑒𝐿𝑆 = 𝐿𝑆! 𝐿𝐴 (4.9)
To govern the student learning process, time constraints and
dependencies are often set up among the learning activities. The time
constraint is defined based on the concept of learning stages. If two learning

4.Method for A Fine-Grained Outcome-based Learning Path Model 72
activities, LAj and LAk, are specified to start at the same learning stage, then
they are satisfied with the following constraint:
𝐿𝑆! 𝐿𝐴! = 𝐿𝑆! 𝐿𝐴! (4.10)
We may also set up some rules using LSs() and LSe() to verify if LAj and
LAk overlap each other at some learning stages. These time constraints are
useful for verifying the coexistence dependency of LAj and LAk. We need these
rules particularly when we need to make sure that a set of chosen learning
activities are conducted in parallel at some point. On the other hand, if LAj is
designed to complete before LAk starts, then we have:
𝐿𝑆! 𝐿𝐴! < 𝐿𝑆! 𝐿𝐴! (4.11)
This time constraint can be applied as a rule to ensure the prerequisite
relation between LAj and LAk.
Student learning progress: Learning progress describes how much
knowledge or skill that a student has acquired from a course over certain
learning stages. With Eq.4.4, learning outcome can be evaluated as a weighted
composition of learning outcomes achieved from a learning activity.
Therefore, student learning progress can be computed as an accumulated
learning outcome over certain consecutive learning stages, by following the LA
level learning path based on a selected group of learning activities for
assessing subject-related outcomes. Alternatively, we may evaluate a student’s
learning progress on a specific learning outcome based on a LT level learning
path. This allows assessing the generic outcomes or transferable skills
[Dodr99], which are typically related to personal effectiveness, e.g.
communication and teamwork skills. This feature generally cannot be
achieved in existing methods as they use KEs to construct learning paths.
4.3.3. Discussions
The new model facilitates the implementation of generic and practical systems
for learning path generation. For KE delivery, we can model each KE to
comprise different types of learning activities. This matches very well with
practical needs, where some learning activities, such as lectures, practical

4.Method for A Fine-Grained Outcome-based Learning Path Model 73
sessions and tutorial classes, can be run concurrently within a learning stage
(e.g., a semester) to offer various types of training. In addition, as we allow the
construction of a flow-control structure to govern the delivery of the learning
activities that constitute a KE, our model potentially enables the construction
of adaptive KEs to support students with different learning styles. However,
adaptive learning path generation is out of the scope of this research. We
consider it as a future work.
For KE assessment, since we model each learning activity as a
composition of some learning tasks and assess each learning task based on
certain learning outcome, the new model is more generic. It supports different
types of learning activities and student learning styles. For example, to
encourage student participation and provide a fair/open environment for
assessment, [Ma00] proposes to allow both teachers and students to
collaboratively set up assessment criteria for assessing learning outcomes
across the domains of knowledge, attitude and skill, rather than simply using
a standard Q&A assessment. On the other hand, [Kore08] has found that
student performance in a virtual laboratory (a “practical” learning activity)
can be evaluated by assessing learning outcomes through different levels of
cognition, particularly those higher ones, including analysis, synthesis and
evaluation [Bloo56]. These two examples illustrate that traditional Q&A
assessment is insufficient to address some practical or advanced needs in
student learning, and that their proposed models can well address the needs.
4.4. Implementation
To evaluate our work, we have implemented a prototype system based on our
fine-grained outcome-based learning path model. We use PHP and Javascript
as the server-side scripting language, Apache as the Web server, MySQL as the
database, and Windows as the operation system to implement this prototype,
and use the graph visualization library JGraph to generate diagrams. The
prototype comes with a drag-and-drop graphical user interface assisting
teachers to create and manipulate learning path components graphically. The

4.Method for A Fine-Grained Outcome-based Learning Path Model 74
prototype is not currently a functioning learning management system, where
content management was not implemented. Fig. 4. 2 shows a screen shot of
our prototype where a teacher is working on a LA level learning path that
comprises learning activities for all students in a computer science program.
As shown at the upper part of Fig. 4. 2, there is a menu providing some
predefined learning activities for the teacher to construct learning paths.
Under the menu, there is an area for learning path construction. Each of the
test users was invited to attend a personal introductory session, which lasted
for about an hour. Each session started with a briefing on the proposed
learning path construction model. They can ask questions during the briefing
Fig. 4. 2 A screen shot of our prototype.
4.Method for A Fine-Grained Outcome-based Learning Path Model 75
if they have anything confused. The test user then had a chance to use the
prototype to construct learning paths and was required to answer a
questionnaire to comment on the prototype. The questionnaire contains
questions to collect teachers’ background information as well as to collect
teachers’ evaluation results on our prototype from both choice questions and
written form. More details about the research questions and collected results
of the questionnaire can be found in section 4.5. And the whole questionnaire
is listed in Appendix A.
Fig. 4. 2 shows a sample learning path constructed by a teacher. As an
example, a “Lecture” type of learning activity – “Computer Networks (LT)” is
constructed in Semester 2, which can be further customized by modifying its
learning tasks and their associated weights. For instance, LA “Final Year
Project” is selected to reveal its learning tasks, which are shown in the yellow
box located at its right hand side. Teacher can overview the learning tasks
contained in the learning activity before he/she decides to change the task
arrangement of the learning activity by opening another window. In addition
to “Computer Networks (LT)”, a “Practical” type of learning activity –
“Computer Networks (PC)” is constructed. These two learning activities come
together forming a KE, which is indicated by a dashed-line connection. This
KE formulation allows students to follow multiple approaches when learning a
subject and achieve more learning outcomes.
A student may conduct a learning activity if he/she has passed all pre-
requisite(s). Note that arrows indicate pre-requisites, while rhombuses
indicate multiple learning activities sharing the same pre-requisites or
learning activities having multiple pre-requisites, e.g., “Distributed Systems”
has both “Computer Networks (LT)” and “Computer Networks (PC)” as pre-
requisites. Optionally, a learning path can be turned into an adaptive one if
suitable types of learning activities can be set up for each student. Despite this
feature surpasses existing KE-based methods where they do not support the
modeling of pedagogy and certain forms of learning outcomes. However,
further techniques should be developed to avoid teachers manually producing
all settings.

4.Method for A Fine-Grained Outcome-based Learning Path Model 76
Teachers then proceed with more fine-grained settings. Our prototype
provides interfaces for teachers to define and review learning outcome
settings at both learning stage and learning activity levels. Fig. 4. 3 (a) shows a
learning stage – “Semester 1” is selected. Its learning outcome settings show in
Fig. 4. 3 (b), indicating Semester 1 assesses student learning outcomes based
on knowledge, comprehension and application levels under the cognitive
domain of Bloom’s Taxonomy. The chart also shows the total percentage of
(a)
(b)
Fig. 4. 3 Viewing the learning outcome setting at the learning stage level.

4.Method for A Fine-Grained Outcome-based Learning Path Model 77
each learning outcome collected from all learning activities within the learning
stage to indicate its importance. Such weights cannot be adjusted.
We also ask teachers to work on individual learning activity. Fig. 4. 4 (a)
shows that learning activity “Computer Organization (LT)” in Semester 1 is
selected for editing. The lower part of Fig. 4. 4 (b) shows its settings with
editable learning tasks, i.e., Reading, Discussion and Question. The prototype
can automatically normalize the weights of all learning tasks based on the
weight adjustment mechanism described in the sub-section of "Learning
(a)
(b)
Fig. 4. 4 Manipulating the learning outcome setting at the learning activity level.

4.Method for A Fine-Grained Outcome-based Learning Path Model 78
Activity" under section 4.3.2. This feature is handy, allowing a teacher to focus
on the relative importance of learning tasks rather than the actual values of
the weights. In addition, a teacher can change the learning outcome setting of
a learning task by dragging-and-dropping learning outcomes from the
learning outcome requirement menu, as shown in the upper part of Fig. 4. 4 (b).
For demonstration purpose, our prototype also supports basic learning
progress evaluation. We classify a student’s learning outcome of a learning
activity with a few grade levels, ranging from “Fail” to “Excellent”. As shown at
the top of Fig. 4. 5, they are represented by different colors. Fig. 4. 5 shows
that a student has just completed Semester 1, and has received a “Good”
learning grade in “Computer Organization (LT)” but failed in both the “LT”
and “Tu” learning activities of “Introduction to Computer Science”(in pink
color). Based on the setting of our prototype, this student needs to retake
these failed learning activities before starting Semester 2.
Our prototype also supports the construction of the LT level learning
paths to indicate how a student is being trained in terms of a specific type of
student learning outcome. This function can be activated by pressing the
“Show Outcome Path” button at the top-left side of the user interface shown
Fig. 4. 4 (a). Fig. 4. 6 shows the LT level learning path for communication skill
Fig. 4. 5 A screen shot showing the progress of a student.

4.Method for A Fine-Grained Outcome-based Learning Path Model 79
while Fig. 4. 7
shows the path for writing skill. To illustrate the assessment of learning
outcome, we use a percentage value to show the difficulty level of certain
learning outcome required at a LA. If the student can pass the assessment
associated with the corresponding LT, it means that the student has made the
prescribed level of achievement in that particular learning outcome. Using Fig.
4. 6 as an example, at the beginning, two LAs are involved in Semester 1 to
train up a student’s communication skill. The difficulty levels of both are set to
20%. As a student proceeds with the course of study, the student may gain a
higher level of achievement in communication skills. This is shown by the
increase in the difficulty level associated with the communication skill along
the learning path. Finally, after the student has gone through the entire course
of study, the student is expected to have gained very mature communication
skill with the 100% of difficulty level, if the student can pass the assessment of
Fig. 4. 6 Learning path for communication skill.

4.Method for A Fine-Grained Outcome-based Learning Path Model 80
the corresponding LT set in the “Final Year Project” learning activity in
Semester 5. In general, the LT level learning paths help students learn more
effectively by letting them understand how well they have achieved in certain
learning outcome. In case if a student fails in certain learning outcome, the
student can be supported by re-doing only the relevant learning tasks in order
to fix such a learning problem. This fine-grained arrangement can enhance the
learning effectiveness as it avoids the students re-doing the entire learning
activities or KEs.
4.5. User Study Results and Analysis
Following the case study as depicted in section 4.4, we have delivered a
questionnaire to collect teachers’ feedback on the proposed learning path
model. The evaluation model and the results are shown as follows:
Research question: We tested whether teachers of different 1) knowledge
Fig. 4. 7 Learning path for writing skill.

4.Method for A Fine-Grained Outcome-based Learning Path Model 81
background or 2) teaching experience will find our model providing a good
way for constructing learning paths and assessing student learning outcome.
Our prototype is designed to let teachers visualize and try out our model. We
do not evaluate the user interface design of the prototype, as it is out of the
scope of this research. We invited teachers from Durham University and some
local high schools to try out our prototype and give us feedback of their
satisfaction on our learning path model by using 13 questions to access the
following research questions:
• RQ1: Can the new model provide a more systematic and intuitive way for
teachers to construct learning paths?
• RQ2: Does it produce learning paths that address the diverse needs of
different courses?
• RQ3: Do teachers think that it is easier to set out criteria to assess student
learning outcomes through the new model?
The questions provide proper coverage for evaluating both the LA and LT
levels of learning path construction. Teachers were required to provide
feedback on the 13 questions based on a 5-point likert scale (Totally Agree=5,
Agree=4, Neutral=3, Not Quite Agree=2 and Disagree=1). As we use
continuous and ordered rating scales, where they are assumed to have equal
intervals and implicitly approximate interval data, they are quantitative and
allow us to use ANOVA [Kirk95] for analysis. We also have another 5
questions collecting personal information of a teacher, including teaching
experience, teaching discipline, e-learning tools experience, and teaching
approaches and styles.
Sample building: 15 teachers were involved in the experiment. The
independent variables are 1) knowledge background (KB) and 2) teaching
experience (TE), where each of them is classified into groups of samples as
follows for analysis.
• Groups under KB: Science (7 teachers), Engineering (6 teachers) and
Arts (7 teachers).
• Groups under TE: 0-1 year (6 teachers), 1-4 years (4 teachers), 5-9 years
(5 teachers), and 10 years or above (5 teachers).

4.Method for A Fine-Grained Outcome-based Learning Path Model 82
Note that we did not use a control group as all the teachers in our experiment
have experience in using e-learning tools, such as Wimba Create, Blackboard,
Learning Object Creator and Web tools. Some of them have even involved in
designing or modifying teaching activities. This indicates most of our test
users have a good understanding in difficulties and important factors of
learning path design. Therefore, besides the ANOVA analysis, we also collect
opinions from the teachers regarding their experience with our model.
Statistical model: We employ one-way ANOVA [11] to analyze each of the
independent variables because both variables comprise more than two groups.
Methods that can analyze only two groups, such as Wilcoxon test, are not
applicable.
Statistical results and conclusions: As shown in Fig. 4. 8, the teachers
have rated an overall average score of 3.95 out of 5 with the 13 questions,
meaning that they have a very good satisfaction of using our model across
different aspects of learning path construction. More specifically, the average
scores of individual group of questions are 3.81 (RQ1), 3.92 (RQ2) and 4.22
(RQ3). While teachers have a very good satisfaction on our model regarding
intuitiveness and meeting diverse needs, they rate much higher on our model
in terms of assessing student learning outcomes. Note that the scores of Q12
and Q17 are rated lower than the other questions. They asked feedback on
Fig. 4. 8 Summary of scores from the questionnaire.
0
1
2
3
4
5
Q11 Q12 Q16 Q17 Q18 Q7 Q8 Q9 Q10 Q6 Q13 Q14 Q15
RQ1 RQ2 RQ3
Score RQ Average Overall Average

4.Method for A Fine-Grained Outcome-based Learning Path Model 83
whether the prototype can clearly show the relationship among LAs and the
design of a LP, respectively. The lower scores are related to the user interface
design of the prototype. Although this issue is out of the scope of this research,
we believe this is an important issue to work on for our future work,
particularly it relates to how we can avoid putting burden on teachers to work
out mathematics for setting up learning paths and learning activities.
In general, the teachers agree that incorporating learning outcomes
from the Bloom’s Taxonomy is useful, and they feel that the introduction of
learning task is good as it allows a teacher to focus on designing simple tasks
to train up students with a specific learning outcome. They are in favor of the
idea of learning activity, which comprises learning tasks, as it is more
intuitive for teachers to create and organize learning activities. According to
the results of one-way ANOVA, no statistically significant differences in
teacher evaluations were found due to knowledge background or teaching
experience.
We set p-value to 0.05, meaning that our test is based on the
assumption that the probability of getting statistically significant results
simply by chance is less than 5%. As shown in Table 4. 4, when performing
AVONA test on teacher’s knowledge background, F-value is 0.8999 and p-
value is 0.4163 when df1 between the 3 groups is 2 and df2 within the groups is
33. As F-value is close to 1 and p-value is much greater than 0.05, there is not
a statistically significant difference between the means of all groups, and the
difference in teaching experience is not statistically significant to the teachers’
evaluation. Similarly, the same conclusion can be drawn when we perform
AVONA test on teacher’s teaching experience, as F-value is 1.1627 and p-value
is 0.3347 when df1 between the 4 groups is 3 and df2 within the groups is 44.
Analytical Comparison: To depict the differences between our
model and existing methods [Chen08, Cono05, Dalz03, Kara05, Limo09]. We
examine the nature of the constructed learning path (LP) and the nature, the
number and the sequence of the learning objects (LOs) used to build a
learning path from different methods. Table 4. 5 summarizes the comparison.
The most significant difference of our model is that it offers multiple learning

4.Method for A Fine-Grained Outcome-based Learning Path Model 84
paths to support various forms of student learning outcomes assessment on
top of the traditional functionality of a learning path, which models the steps
of a course of study. In contrast, existing methods only support the traditional
functionality and offer a single learning path. As a result, student learning
outcome assessment is only a consequence of such a modeling, and that
various types of student learning outcomes assessment are hard to be
supported. Regarding learning objects, existing work use a KE or a LA to form
a LO, and that they determine the number and the sequence of LOs. In
contrast, we model a LO with two levels: LA or LT based, which leads to two
Table 4. 4 Results of one-way ANOVA analysis.
ANOVA Single factor: Knowledge background
Source of Variation SS df MS F P-value F critical Between Groups 0.670139 2 0.335069 0.899926 0.416344 3.284918 Within Groups 12.28688 33 0.37233
Total 12.95702 35
ANOVA Single factor: Teaching Experience
Source of Variation SS df MS F P-value F critical Between Groups 1.353611 3 0.451204 1.162679 0.334742 2.816466 Within Groups 17.07519 44 0.388072
Total 18.4288 47
Table 4. 5 Comparison between our model and existing methods.
Comparison Criteria
Methods
Our Model Chen et al. [5],
Karampiperis et al. [10], LS-Plan [14]
LAMS [6, 7]
Constructed LP(s)
Multiple LPs with 2 Levels: LA & LT
based (Support fine-grained pedagogy)
Single LP: KE Based (Pedagogy is not
supported)
Single LP: LA Based (Support
coarse-grained pedagogy)
Nature of LOs
Formed by LAs or by LTs (Relevant LAs can
form a KE)
Formed by KE Formed by LA (No explicit LA and KE
mapping)
Number of LOs
Determined by number of LAs or by number of
LTs
Determined by number of KEs
Determined by number of LAs
Sequence of LOs
Ordered by LAs or by LTs
Ordered by KEs Ordered by LAs

4.Method for A Fine-Grained Outcome-based Learning Path Model 85
different types of LO sequences.
4.6. Summary
In this chapter, we have presented a novel learning path model based on
learning activities, which supports the assessment of various types of
knowledge and skills to describe the student learning progress. We have
mathematically defined the model, its components, and the relations and
constraints among the components, allowing course designers or teachers to
explicitly formulate and reuse the learning and teaching approaches. Our work
may also open up new research and development on more advanced adaptive
e-Learning systems that can incorporate precise teaching approaches to match
with different student learning styles. We have implemented a prototype and
conducted a user study to verify if the proposed model can match with the
teachers’ needs well. Results show that our model is favorable and most of the
teachers participated in the user study indicated that they would like to use it
in their course design.
Our work may open up new research and development on more
advanced adaptive e-Learning systems that incorporate precise teaching
approaches to match with different student learning styles. We believe that
while an automatic learning path generation method is desired, teachers may
still want to have the flexibility for manually customizing a learning path. In
our opinion, a sensible solution should aim at avoiding teachers to spend time
explicitly setting up a lot of mathematical parameters for students with
different learning styles. In this sense, we determine user interface design and
setting up templates for learning paths and their components could be two
possible directions for future work. For user interface design, similar to our
prototype, we should work out visual aids and manipulators for teachers to
adjust and visualize the importance of each learning path component. As a
complement, techniques should be developed for producing templates for
learning paths and their components. We may also extend existing work on
adaptive learning path generation, such as [Li10, Ullr09], to work with the
template based idea to produce adaptive fine-grained learning paths.

86
Chapter 5
5. Learning Path Construction
based on Association Link
Network
In the last chapter, we mainly formulate learning activities to construct the
learning path based on learning outcomes in terms of how to learn. We still
need to design learning resources forming the learning contents that are used
in a learning path to define what to learn. Manually designing the learning
resources is a huge work to teachers and quite time consuming. To solve this
problem, we can make use of the Web resources by turning them into well-
structured learning resources for students with different knowledge
backgrounds and knowledge levels. So the key problem of constructing
personalized learning path is to generate learning resources by identifying the
knowledge structure and attributes of these Web resources, and to correctly
deliver them to students. In this chapter, we show how we construct well-
structured learning resources from loosely connected Web resources by
constructing a set of three different networks to formulate topics, keywords
and the actual learning resources. Such formulation is used to generate
learning paths with different abstractions of knowledge, helping students
better understand the knowledge covered by the learning resources.
Nowadays the Internet virtually serves as a library for people to quickly
retrieve information (Web resources) on what they want to learn. Reusing
Web resources to form learning resources offers a way for rapid construction

5. Learning Path Construction based on Association Link Network 87
of self-paced or even formal courses. This requires identifying suitable Web
resources and organizing such resources into proper sequence for delivery.
However, getting these done is challenging, as they need to determine a set of
Web resources properties, including the relevance, importance and complexity
of Web resources to students as well as the relationships among Web
resources, which are not trivial to be done automatically. Particularly each
student has different needs. To address the above problems, we present a
learning path generation method based on the Association Link Network
(ALN), which works out Web resources properties by exploiting the
associations among Web resources. Our experiments show that the proposed
method can generate high quality learning paths and help improve student
learning.
5.1. Introduction
Learning resources (LRs) refer to materials that help students learn and
understand certain knowledge. Such LRs can be constructed by different types
of media, including text, audio, and video. Typically, producing LRs is very
time consuming. With the availability of the Internet, such situation may be
improved, as information covering a huge variety of ready-made knowledge,
namely Web resources, is made available. Examples of Web resources include
materials from Wikipedia, BBC, Reuters, etc. Reusing such resources may
help teachers significantly reduce their time on producing LRs and may also
facilitate the generation of self-paced courses. However, Web resources may
be loosely connected without any well-defined structure or relationship, and
may also be redundant. It is not trivial to transform Web resources into LRs,
as relationships among LRs are required to be well defined and LRs should be
arranged to deliver in a proper order for a particular student to study.
Identifying relevant LRs is essential to learning path generation. Existing
works determine such a relevancy by matching student specific requirements,
including topics to learn, learning preferences or constraints [Farr04, Dolo08]
against the characteristics of LRs, which can be maintained by a list of
attributes, such as related topic and difficulty level, or additionally by a

5. Learning Path Construction based on Association Link Network 88
structure that defines how LRs are related among each other [Meli09].
Learning path generation methods aim at arranging selected LRs into a
proper sequence for delivering to students, so that they can learn effectively in
terms of minimizing the cognitive workload. Basic work [Farr04] only
consider attributes associated with each LR, such as its related topic. More
advanced works [Kara05, Chen08] consider the structure among LRs which
facilitates them to model the cognitive relationships among LRs. Such
relationships are fundamental to learning effectiveness. However, structures
among LRs are not trivial to build. Existing work considers using pre-defined
structures [Kara05] or generating LR structures based on pre-test results
[Chen08], which involves significant human efforts.
We present a learning path (LP) generation method based on the
Association Link Network (ALN) [Luo08A, Luo11], which discovers
knowledge structure among Web resources based on association. This allows
teachers to reuse Web resources forming LRs, where relationships among LRs
are automatically constructed. The main contributions of our research study
in this chapter include:
• We apply ALN to transform Web resources into well-structured LRs,
where the pedagogical attributes of LRs, including their knowledge
domain, importance and complexity, can be automatically determined.
This allows us to construct a teacher knowledge model (TKM) for a course,
and generate adaptive learning path to each student. We also maintain a
student knowledge model (SKM) to monitor student learning progress.
• We model the TKM as well as the LP by 3 ALNs, namely LR, topic and
keyword based ALNs. This modeling allows students to perceive the
relationships among LRs through different abstraction levels, which can
help students minimize their cognitive workload during the learning
process.
• We construct a test generation scheme to automatically assess student
understanding against a LR within a UOL. We use the associations
between topics or keywords as the rules to test if students can build up the
correct association between major concepts. This automatic scheme saves

5. Learning Path Construction based on Association Link Network 89
a lot of efforts to manually design tests.
In this chapter, we organize the structure as follows. Section5.2 explains
the construction of the teacher knowledge model (TKM). Section 5.3 presents
the generation of adaptive learning paths. Section 5.4 shows some results and
Section 5.5 concludes this chapter.
5.2. Related Work
5.2.1. Learning Resources Construction
To support students learning effectively, relevant LRs should be identified and
delivered in a proper sequence based on student needs and knowledge
backgrounds. [Farr04] proposes using Web resources as LRs without
requiring teachers to create LRs. Suitable Web resources are selected based on
certain student specific criteria, including topics to study, learning preferences
and learning constraints, e.g. available study time. [Dolo08] also allows
students to search LRs for learning. However, the method in addition
performs a query rewriting based on student profiles, which describe student
learning preferences and learning performance (which indicates student
knowledge level), so that students only need to focus on what they want to
learn and the system will take care of the suitability of every LR, which
matches the student searching criteria. [Meli09] proposes a more
comprehensive modeling of LRs, where each of them is designed to associate
with a concept, a knowledge type (verbal information or intellectual skills),
and a knowledge level. LRs are connected based on concept relationships,
where teachers manually define prerequisite among concepts. However, such
relationships are not fine enough to support the arrangement of individual
LRs in a proper sequence for delivery. [Acam11] characterizes LRs based on
subjects and organizes LRs by ontology-based subject relations, including part
of, prerequisite, and weaker prerequisite relations. They form the basis for
both determining the delivery sequence of LRs and selecting suitable LRs
according to the student preferred subjects. However, subject information is

5. Learning Path Construction based on Association Link Network 90
too coarse that each subject is associated with many LRs, making precise
learning path hard to be generated.
5.2.2. Learning Path Generation Algorithm
Given that LRs are properly modeled, a learning path generation algorithm
can be used to deliver LRs for students to learn. [Farr04] allows students to
submit queries selecting suitable LRs. The selected LRs will then be ordered
by the topics and the instructional methods that they belong to, respectively.
As structures of LRs and relationships among LRs, which are critical to the
control of student cognitive workload in learning, are not considered, learning
effectiveness cannot be guaranteed. [Kara05] models the structure among LRs
based on a hierarchy of topics, which are defined by the ACM Computing
Curricula 2001 for Computer Science. The method initially generates all
possible learning paths that match the student goal. It then selects the most
suitable one for a student to follow by considering the student cognitive
characteristics and learning preferences. Although the relationship among
LRs is essentially constructed manually, learning effectiveness is better
addressed. [Chen08] models the relationships among LRs based on an
ontology-based concept map, which is generated by running a genetic
algorithm on a set of student pre-test results. The method successfully works
out the prior and posterior knowledge relationships of LRs, so that LRs can be
delivered based on their difficulty levels and concept relations to reduce
student cognitive workloads during the learning process. However, the
relations of LRs are provided by the concept relations. In this way, they can
only make sure the concepts in the learning path are continual, but the LRs
may be not continual. It is necessary to provide students continual LRs
through the learning path.
5.3. The Teacher Knowledge Model
The Association Link Network (ALN) [Luo08A, Luo11] is designed to
automatically establish relations among Web resources, which may be loosely
connected without well-defined relations. ALN defines relations among Web

5. Learning Path Construction based on Association Link Network 91
resources by analyzing the keywords contained in Web resources. Such
relations are referred as associations, which link up Web resources and ALN
to describe the semantic relationships of Web resources, and turn Web
resources into LRs. In our work, we further exploit such associations to
automatically formulate some key attributes of LRs, including their
importance and complexity, which are fundamental to LP generation. The LPs
comprise a set of sub-ALNs, which are parts of the whole set of ALNs
respectively, namely LR, topic and keyword, to help students perceive LRs
together with their multiple levels of relationships. By following such learning
paths, the cognitive workload of the student on learning can be greatly
reduced. To set up a measure for evaluating student learning progress, we
define the set of ALNs that link up all available LRs of a course as the teacher
knowledge model (TKM). We also maintain a student knowledge model
(SKM) (Ref. Section 5.3) to describe student learning progress. SKM
comprises the system recommended LP and the part of the LP that a student
has finished studying, together with all relevant LRs. SKM also comprises a
student profile, indicating the student’s knowledge levels and preferred topics.
Technically, the foundation of ALN is the association of keywords, where
there exists an association link between two keywords appear in the same
paragraph. To facilitate the formulation of LRs and the learning paths, we
extract the most important keywords identified from a set of LRs as topics,
where the association link between two topics are inherited from that between
the corresponding keywords. The topics are used as a means to determine
whether any two knowledge concepts are related. In contrast to a topic, a
keyword only indicates a certain aspect of a piece of knowledge concept. On
the other hand, there exists an association link between two LRs if some
keywords contained in the two LRs are associated with each other. As an ALN
represents the network of a set of nodes c!, c!,⋯ , c! by their association,
where n is the number of nodes. Mathematically, an ALN is represented by a
matrix of association weights 𝑎𝑤!", where each formulates the association
relation between a cause node 𝑐! and an effect node 𝑐!. It is defined as in Eq.
5.1:

5. Learning Path Construction based on Association Link Network 92
𝐴𝐿𝑁 =𝑎𝑤!! … 𝑎𝑤!!⋮ ⋱ ⋮
𝑎𝑤!! … 𝑎𝑤!" (5.1)
Particularly, LRs, topics and keywords are all modeled by ALNs. An ALN
can be automatically and incrementally constructed by adding or removing
nodes. When a new node is added to an ALN, we need to check such a node
against all existing nodes in the ALN, identifying whether the nodes are
relevant and computing the association weights between the newly added
node and each of the relevant existing nodes in the ALN. When removing a
node, all association links induced by the node will be removed. This
incremental property makes adding new Web resources to form new LRs or
removing LRs to from a course easily. We now depict the details of the
construction of the three different ALNs in our system.
To turn a set of Web resources into learning resources, we initially
extract their keywords and construct the association links among the
keywords by Eq. 5.2.
𝑎𝑤!" = 𝑃 𝑘!|𝑘! = 𝑏!"!!!! 𝑛 (5.2)
where 𝑎𝑤!" is the association weight from cause keyword ki to effect keyword
kj, ki is associated to kj when they exist in the same paragraph pm [Luo08A].
An association weight, which is also the 𝑃 𝑘!|𝑘! , indicates the probability that
the occurrence of cause keyword ki leads to effect keyword kj in the same
paragraph at the same time. bir is the probability that the occurrence of cause
keyword ki in the rth sentence leads to the occurrence of effect keyword kj in
the same sentence. n is the number of sentences in the paragraph pm. We
apply TFIDF Direct Document Frequency of Domain (TDDF) [Luo08B] to
extract domain keywords from a set of Web resources, where keywords are
texts that appear in a good number of Web resources, i.e. the document
frequency is higher than a threshold. The associated relation is determined by
A!
B, meaning that if node A is chosen from an ALN, node B will also be
chosen with the probability α.

5. Learning Path Construction based on Association Link Network 93
We then extract and link up topics from the LRs. Topics refer to the most
important keywords, which have the highest numbers of association links than
the other keywords, meaning that they can represent the most important
information of a set of LRs. In our experiments, we select the top 20% of
keywords forming the topics. Pedagogically, topics model the knowledge
concepts covered by the LRs, while keywords are associated to a topic as the
topic’s key attributes, which help explain why certain knowledge concepts are
related to some others. This modeling is much comprehensive than existing
work, as they only associate LRs based on topics.
To construct LRs for a course, we follow the knowledge domain (i.e. a set
of topics) of the course and select relevant Web resources that match the
knowledge domain, turning such resources into LRs. We have conducted
experiments on our method using 1085 Web resources about health
information from www.reuters.com/news/health. We do not create LRs for
similar Web resources in order to avoid students spending time on learning
similar contents repeatedly. We check Web resource similarity based on their
keywords and association links. In the implementation, we pick the first
selected item of such Web resources to create a LR and stop creating further
LRs for any Web resource that has a high similarity. Fig.5.1 shows part of the
keyword ALN that we have created, where each node represents a keyword,
and each edge, namely an association link, represents the existence of an
association between two nodes. Actually, in Fig.5.1, each edge has its value of
association weight in the matrix of ALN, indicating the association degree
between the two keywords that connected by the edge. The importance of a
node is directly proportional to the number of association links connecting to
it. Note that the edges showing in the figure do not imply any association
weight.
TKM formulates the overall knowledge structure of a course based on
topic, keyword and LR ALNs. Research [Shaw10] shows that formulating
concepts into a knowledge map, which is a graph having concepts as nodes
and they are connected by links that model the relationships between two
concepts, can significantly improve student understanding, particularly when

5. Learning Path Construction based on Association Link Network 94
comparing with studying through LRs collated by a simple Webpage browse-
based structure. Our ALN based knowledge structure is similar to a knowledge
map. Instead of having freestyle labeling to formulate the relationship (i.e. the
link) between two concepts, we use association weight to model quantifiable
relationships among concepts. In addition, we have three different types of
ALNs representing different abstraction levels of a set of concepts, i.e. topic,
keyword and LR ALNs, where the relationships among such ALNs are also
explicitly defined, i.e. given a node in an ALN, the corresponding nodes in the
other two ALNs are well-defined. This implies that it is easy to retrieve LRs
based on student-preferred topics and the knowledge structure for a set of
LRs.
The ALN structure also allows us to automatically compute the
complexity and the importance of each LR, avoiding instructors or course
designers to manually define such attributes, which is extremely time
consuming when there are a massive number of LRs to deal with. More
specifically:
We compute the complexity of a LR, which can be used to match student
knowledge level, based on the algebraic complexity of human cognition that
associates with the complexity of both keywords and association links of the
LR X as in Eq. 5.3.
𝜆!!= 𝑊! ∙ 𝜆!!!!!!!! (5.3)
Fig.5.1 An illustration of a keyword-based ALN.

5. Learning Path Construction based on Association Link Network 95
where 𝜆!! is the text complexity of LR X in terms of keywords, D is the number
of keywords in LR X. 𝜆!! is the number of degree-k association, i.e. the number
of keywords having k association links connected to LR X, which indicates the
complexity of association link. 𝑊! is the number of keywords having degree-k
association, which indicates the complexity of keywords. A LR is low in
complexity if it has low number of association links while such links are of low
degrees.
The number of association links indicates the number of relationships
existing between a node and its connected nodes. The association weight
indicates how strong a node is related to another one. We therefore use the
association weight and the number of association links to indicate the
importance of a node.
5.4. Student Knowledge Model and Personalized
Learning Path
Student knowledge model (SKM) formulates student learning progress. It
comprises a dynamical generated personalized LP and a set of student
characteristics. A personalized LP is technically a subset of the TKM. Student
characteristics that we have considered include knowledge background,
knowledge level, and preferred knowledge concepts, which are learned topics,
learning performance on such learned topics, and topics that a student is
interested or can effectively learn, respectively. The algorithm for personalized
LP generation is as follows,
(1) Initialization: Based on the topic ALN of TKM, we determine the
starting point of a personalized LP according to the initial knowledge of a
student, i.e. the topics learned. If such information does not exist, we consider
the topics, where their complexity matches the student’s knowledge level, and
select the most important one as the starting point. This ensures the most
suitable and fundamental knowledge is selected for a student to start learning.
We compute the complexity of a topic by considering the average complexity
of all LRs associated with the topic as follows:
5. Learning Path Construction based on Association Link Network 96
𝐷! 𝑥 = !!
𝜆! 𝐿𝑅!!!!! (5.4)
where 𝐷! 𝑥 represents the complexity of topic x, and 𝜆! 𝐿𝑅! is the
complexity of LR p (ref. Eq. 5.3).
(2) Incremental LP Generation: Based on the current node of a LP, we
incrementally generate the next node of the LP by identifying a suitable one
from the set of direct connected nodes according to the topic ALN of TKM.
The selection is based on two criteria: the complexity and the importance of
the topic. The complexity of the topic should match the student’s knowledge
level. If there are more than one node meeting the complexity criteria, we then
select the node with the highest importance 𝐼!! 𝑥 , which is formulated by the
summation of association weights where student preference on a topic is
considered as in Eq. 5.5:
𝐼!! 𝑥 = 𝑎𝑤!" 𝑥!!!! ∙ 𝑃!! 𝑥 (5.5)
where 𝐼!! represents the importance of topic x for student i, 𝑎𝑤!" 𝑥 represents
the association weight between topic x and topic j, and 𝑃!! 𝑥 represents
student i’s degree of preference on topic x, which could be any value from 0 to
1, and “0” indicates no preference and “1” indicates full preference.
(3) LR Selection: Based on the LR ALN of TKM, we select a set of LRs,
where their associated topics match with the selected topic by step 2. As
shown in Eq. 5.6 and 5.7, a student specific LR p will be identified by
matching the complexity 𝜆! 𝐿𝑅! of the LR with the knowledge level 𝐾𝐿!! of
the student. We use the coefficient 0.1 to constrain the error between the
complexity of LRs and the student’s knowledge level, where the error should
be smaller than a tenth of the students’ knowledge level. We can recommend
LRs that best fit the student’s knowledge level.
𝐿𝑅𝑠 = 𝑝| 𝜆! 𝐿𝑅! − 𝐾𝐿!! < 0.1𝐾𝐿!! (5.6)
𝐷!! 𝑥 =𝜆! 𝐿𝑅! /𝑃!! 𝑥 (5.7)
LP Progression and Alternative LP: After a student successfully studying
a LR, we update the SKM by indicating the student has finished such a LR and
the associated keywords. Our system will then go back to step 2 again for

5. Learning Path Construction based on Association Link Network 97
incremental LP generation. If a student fails the corresponding assessment, it
is likely that the student lacks the knowledge of some aspects of the topic
about the LR. To deal with such a learning problem, we adjust the LP by
redirecting the student to learn an alternative LR, which is the most important
unlearned prerequisite node of the failed LR as defined in the LR ALN of the
TKM, before coming back to learn the failed LR. Such an alternation may be
carried out repeatedly on the rest of the unlearned prerequisite node of the
failed LR if necessary. Fig.5.2 gives an example of a recommended learning
resources by the system.
(4) Learning Performance: A student i has finished learning a course when
there is no more LR to follow. Student learning performance 𝐷! can be
computed by the difference between the real performance 𝑆𝐾𝑀! (i.e. the
finished LP) and the expected performance 𝐿𝑃! defined by the recommended
LP as stored in the TKM:
𝐷! = 𝑆𝐾𝑀! − 𝐿𝑃! (5.8)
where 𝐷! evaluates whether the student has a good learning performance at
the end of the student’s learning. The student has a better learning
performance if 𝑆𝐾𝑀! is closer to 𝐿𝑃!. Fig.5.3 shows an example of a system
recommended LP formed by a set of the three abstraction levels of ALNs for a
student. Fig.5.3- a depicts the topic ALN that comprises 5 topics, forming the
topic level of the LP (i.e. project → president → lead →plastic → pharmacy),
where the edge thickness indicates the association weight. The path starts
from the most important topic “project”, and then the second important one
which has to connect with the first one is “president”, and end with the least
important one “pharmacy”. All keywords that have association with the five
topics are extracted from the teacher knowledge model of keyword abstraction
level, together with their association links in between to form the learning
path in keyword abstraction level, as shown in Fig.5.3- b. And all LRs that
contain the five topics are extracted from the teacher knowledge model of LR

5. Learning Path Construction based on Association Link Network 98
abstraction level as well, together with the association links in between to
form the learning path in the LR abstraction level, as shown in Fig.5.3- c.
However, students may not have enough time to learn all these LRs, so we just
recommend them the LRs that match with the student’s knowledge level. The
highlighted LRs as shown in Fig.5.3- c are the recommended LRs that match
the student’s knowledge level. Since there are associations among LRs
through sharing keywords, a student showing interest in a LR may also
Fig.5.2 Example of a recommended learning resource.

5. Learning Path Construction based on Association Link Network 99
interest in its associated LR. A student can also gain understanding in a LR
through its associated LRs. Our three different ALNs provide such
Fig.5.3- a The path automatically selected by system .
Fig.5.3- b The correspondence keyword ALN
Fig.5.3- c The correspondence learning resource ALN and selected learning path of learning
resources for students
Fig.5.3 System recommended learning path in 3-ALN.

5. Learning Path Construction based on Association Link Network
100
associations and therefore help improve student learning.
5.5. Student Assessment against Learning
Resources
In our method, student assessment is embedded into the learning process of
each learning resource, allowing us to determine whether a student has
completed learning a certain piece of knowledge with a proper level of
understanding. The assessment result provides a means for updating student
profiles regarding students’ knowledge levels and completed knowledge
concepts. In fact, learning process is a cognitive process of knowledge and
behavior acquisition, which is commonly perceived as a process of association
of a certain form of new concepts with existing knowledge in the memory of
the brain. So in our research, as a part of the learning process, the assessment
is also designed to follow the cognitive process. In cognitive science, learning
is deemed as a relatively permanent change in the behavior, thought, and
feelings as a consequence of prior learning experience. So we need to assess
students’ prior learning experience to see if they have made a relatively
permanent change. In our research, both learning process and assessment
construct the whole cognitive process. According to Learning Intelligent
Distributed Agent (LIDA) cognitive cycle [Fran06] which is designed based on
the theory of human cognitive cycle, students should go through the cognitive
cycle to complete the cognitive process of learning knowledge. In the cognitive
cycle, students carry out their learning in 3 states, namely understanding
state, attention (consciousness) state, and action selection and learning state.
We use a set of three different ALNs to help students complete the cognitive
process. By considering the example of a learning resource as shown in
Fig.5.2, we explain how the three states control the studying of a learning
resource within the cognitive cycle by Fig.5. 4 and Fig.5. 5. In the
understanding state, we highlight the major attributes (keyword ALN, Fig.5.
4-1) and knowledge concepts (topic ALN, Fig.5. 4-2) of the learning resource
to help students focus on the important aspects of the learning resource. In
the attention state, we present the associations among different topics and

5. Learning Path Construction based on Association Link Network 101
keywords by the links of keyword ALN and topic ALN to help students
understand the knowledge structure. The nodes in Fig.5. 4 represent the
major attributes and knowledge concepts, the links between nodes represent
the associations among them, and the colors are just randomly assigned to the
(a) Topic layer of ALN that exist in the learning resource
(b) Keyword layer of ALN that exist in the learning resource
Fig.5. 4 State understanding & attention: Highlight the major attributes; Build up
associations among topics and keywords.

5. Learning Path Construction based on Association Link Network 102
nodes to distinguish overlapped nodes in case the nodes are too many. In the
action state, we assess students if they can build up correct associations of the
major attributes or the knowledge concepts using the automatically generated
test as shown in Fig.5. 5 where we ask students to choose the correct
associations between keywords or topics from the choice questions. However,
there is no need to straightly carry out the three states one after another.
Students can jump to any state during the process. If they got failed in the test,
they can jump to the other state to learn again and then go back to a new test
until they understand the knowledge. To evaluate student learning
Fig.5. 5 An example of automatic generated test.

5. Learning Path Construction based on Association Link Network 103
performance, we automatically generate tests using a test generation schema
by the following steps,
• Step 1: Select an association link from the topic ALN (for example Fig.5. 4-
1 or the keyword ALN (for example Fig.5. 4-2);
• Step 2: Determine the complexity of the selected association link 𝜆!! which
has been introduced in section 5.2 as the difficulty of level of the question;
• Step 3: Add natural languages in between to bridge the associated two
keywords into a new sentence as the corrected option of the question;
• Step 4: Randomly select any two keywords which have no association in
between, and also add natural languages in between to bridge the
associated two keywords into a new sentence as the distracted options.
In this way, tests (for example Fig.5. 5) can be automatically generated
without any manual effort. We can save a lot of time for teachers. In the test,
all questions are presented in the way of choice-question with four options,
and each option describes if two keywords have associations in between. A
student selects the correct option from them. This test generation schema can
be applied to any learning resource, which can automatically generate
different levels of questions and help students strengthen their understanding.
So it is easy to control the difficulty levels of the tests for assessing different
students. In the end, each student’s errors have different distribution over the
TKM. If the errors concentrate on a small area, then the student has problems
on related topics, so the student just needs to pay a few efforts to get
improved. However, if the errors distribute over the network, then the student
has problems on many different topics, so the student needs to pay huge
efforts to get improved.
5.6. Evaluation Results and Analysis
In order to show the advantage of the system recommended learning path, we
have conducted a quantitative analysis showing the importance of LP for both
system recommended one and manually selected ones to make comparison of
the two LPs. We also conduct a qualitative analysis explaining the comparison

5. Learning Path Construction based on Association Link Network 104
results. And also, in order to compare student learning performance based on
the teacher generated learning paths and the system recommended one, we
show the performance for the two groups of students by graphs, quantitatively
analysis the improvement of their performance and their stability of their
performance, and qualitatively explain the results.
5.6.1. Compare the Importance of Manually Selected and
System Recommended Learning Paths
In this experiment, importance of LP is evaluated by summing up the
importance of the nodes that constitute a LP. Ten teachers from the School of
Computer Science, Shanghai University, are asked to manually construct LPs
that comprise 5 nodes (i.e. topics) from the topic ALN of teacher knowledge
model. They are asked to construct a LP that should fulfill two requirements:
1) the selected topics should connect with each other, and 2) should be
important to students. Such requirements also govern how the recommended
LP generated by our system. We can compare the learning paths selected by
teachers and the learning path recommended by our system. Because we want
to test if the complexity of TKM will cause any effect on teachers’ decision as
well as on our system recommendation results, we choose 3 topic ALNs which
have different number of links. Particularly, we use topic ALNs having 196
links, 271 links and 360 links, which correspond to 20%, 50%, and 80% of the
total association links, forming the low, middle and high resolutions of TKM,
respectively. So teachers actually need to select 3 learning paths from each of
these TKMs. Correspondingly, system recommends 3 learning paths according
to the 3 resolutions of TKM. Results show that the importance of system
recommended LP is higher than that of the manually selected LPs. To
determine whether the comprehensiveness of the ALN structures will affect
the quality of LP generation, we conduct experiments using three different
resolutions of the TKM by changing the number of association links
constituted the topic ALN. Table 5. 1 depicts the details of the LPs constructed
by both the teachers and our system based on the middle resolution of TKM.
As shown in the table, although some of the teacher selected topics are the

5. Learning Path Construction based on Association Link Network 105
same as the ones recommended by our system, indicating that teachers are
able to pick some important topics, the LP importance of their constructed
learning paths are lower than the system recommended one.
Fig.5.6 compares the LP importance of the learning paths generated by
the teachers and our system when different resolutions of the TKM are made
available. In the figure, the left y-axis shows the LP importance and is referred
by the histogram, while the right y-axis shows the LP importance ratio of the
manually selected LPs w.r.t. the system recommended one and is referred by
the polylines. We group the results by the resolutions of the TKM. It is found
that no matter which resolution of the TKM is made available, our system still
produces learning paths with a higher LP importance than the teacher
generated ones. The upper and the lower polylines respectively show the
maximum and the averages of LP importance ratios of the teacher generated
learning paths. They indicate the quality of the learning paths generated by
the teachers w.r.t. to the system recommended ones. On the other hand, when
the resolution of the TKM increases, the generated LPs both by the teachers
Table 5. 1 Topics in the selected learning path in Middle resolution
Topic 1 Topic 2 Topic 3 Topic 4 Topic 5 Importance
Degree
Teacher 1 FDA Roche Avastin Stent Patient 9.6
Teacher 2 Antidepressant Vaccine FDA Avastin Drug 15.2
Teacher 3 Cancer Risk Analyst Company Childhood 12.8
Teacher 4 Patient Staff Pneumonia Drug Analyst 17.0
Teacher 5 Researcher Implant Company Calcium Cancer 9.2
Teacher 6 Company Calcium HPY Supplement France 11.2
Teacher 7 FDA Pneumonia Dialysis Antidepressant treatment 12.2
Teacher 8 Cancer Implant Test Screening Prostate 7.2
Teacher 9 Analyst Pharmaceutical Medicine Company Premium 11.2
Teacher 10 Antidepressant Patent Pneumonia Analyst Staff 15.8
System Drug Company Avastin Pharmaceutical Shortage 27.2

5. Learning Path Construction based on Association Link Network 106
and our system also increase in the LP importance. It is because when richer
course domain information is made available, i.e. more association links
forming the TKM, a better decision can be made on the LP construction.
However, as teachers are generally overwhelmed by the massive number of
LRs and association links, they tend to construct learning paths based on
partial information from the TKM. As a result, their produced learning paths
are of lower LP importance.
5.6.2. Comparison of Performance on Two Groups of
Students
We conducted experiments on comparing student learning performance based
on the teacher generated learning paths and the system recommended one.
We have invited 10 postgraduate students from School of Computer Science,
Shanghai University, to participate the experiments. It is easier to invite
students from School of Computer Science rather than students from other
departments as we are in the same School, but this does not affect the
experiment results, as long as these students have different learning abilities,
who perform differently when studying the same LR. We randomly divide the
students into two even groups. The 1st group of students perform learning
based on the teacher constructed LPs, while the 2nd group of students learn
by the system recommended LP. All students are given 50 minutes for
studying the contents (contains 5 LRs) provided the LPs and take the same
Fig.5.6 Comparison of manually selection and system recommendation results of learning
path in learning resources ALN in terms of importance degree.
32.19% 44.63% 44.28%
57.03% 58.09% 71.03%
0
0.2
0.4
0.6
0.8
1
0
6
12
18
24
30
Low(Nl=196) Middle(Nl=271) High(Nl=360)
Information Detail Degree
Average Maximum System Ratio(Average/System) Ratio(Maximum/System)

5. Learning Path Construction based on Association Link Network 107
examination with 25 questions, which assess their understanding. Results
show that students using the system recommended LP perform better and
have more stable learning performance.
Better learning performance
We compare the learning performance of two groups of students on the
LRs using two-sample T-tests on the differences of their learning performance
as in Eq. (5.9).
𝑡 = 𝑥! − 𝑥! 𝑠!!!! ∙ 2/𝑛 (5.9)
where 𝑥! and 𝑥! are the means of their performance within the first group and
the second group respectively on n LRs, and 𝑠!!!! is the standard deviation of
the two samples. 𝑥! − 𝑥! is the standard error of the difference between the
two means. Assuming the null hypothesis is that the two groups of students
have the same learning performance on the same LRs. The two-sample T-tests
are used to determine if the two groups of data are significantly different from
each other. In practice, we can directly use the function of “T-test” in
Microsoft Excel software to automatically calculate the t value. Its value is
2.50411, so the corresponding p-value is 0.0367 which is smaller than the
threshold of Statistical significance (0.05). It means the null hypothesis is
rejected, i.e. the learning performance of the two student groups is
significantly different. We then compare the detailed learning performance of
Fig.5.7 Comparison results of two types of learning
2.56 3.04
0
1
2
3
4
P462 P1082 P281 P193 P437 Average
Not using our system Using our system

5. Learning Path Construction based on Association Link Network
108
the two student groups based on each LR. As shown in Fig.5.7, students
studying using the system recommended LP generally perform better. In
average, they got 60.8% in the examination, while the students studying
through manually selected LPs got 51.2% only. Note that y-axis shows the
scales of the learning performance, while x-axis shows the indices of
individual LRs. Although students using the system recommended LP perform
less well in LRs P462 and P193, learning performance of both student groups
in such LRs are still quite similar.
Stable learning performance
We test if the students in each group can have similar learning performance
𝜎!! on the same LR i by analyzing their performance variances (ref. Eq. 5.10).
The results are shown in Fig.5.8, where the y-axis indicates the performance
variances.
𝜎!! = 1 𝑚 ∙ 𝑥!" − 𝑥!!!
!!! (5.10)
where 𝜎!! is the performance variances of LR i, 𝑥! is the average performance
on LR i, 𝑥!" is the learning performance on LR j of student 𝑥!, and m is the
number of students If different students show similar learning performance
on the same LR, their learning performance variances will be low. We refer
this as stable learning performance. For instance, if all students have the same
learning performance on the same LR, the performance variance will be equal
Fig.5.8 Comparison of students’ stability of learning performance
0
1
2
3
4
P462 P1082 P281 P193 P437 Average
Not using our system Using our system

5. Learning Path Construction based on Association Link Network 109
to 0, and their learning performance is the most stable. In contrast, if half of
the students got very high marks and the other half got very low marks, their
learning performance is described as unstable, where the performance
variance can approach to 6 according to Eq. 5.10.
As shown in Fig.5.8, although students studying through manually
selected LPs (Group 1) perform slightly better on LRs P462 and P193 than
those studying by the system recommended LP (Group 2), the learning
performance of group 1 students is quite unstable, i.e. students perform quite
differently in the same LR. Overall, group 2 students generally have more
stable learning performance than group 1 students. However, for LR P437,
group 1 student has more stable learning performance as they have
consistently low performance in such a LR. Our experiments indicate that by
using the system recommended LP, even student coming with different
learning abilities can be trained to perform better in learning. In addition, the
entire cohort will have a more stable learning performance.
5.7. Summary
In this chapter, we have presented an ALN-based LP construction method. We
construct multi-level of abstractions of LRs through association, allowing a
knowledge map like learning path to be derived. Such a learning path
structure can help students learn more effectively. The ALN-based association
structure also allows important parameters of LRs, such as their complexity
and importance, to be derived. This offers sufficient information for automatic
construction of pedagogically meaningful LPs. This feature is particularly
critical when a massive amount of Web resources are considered to be
transformed as LRs for students to learn.
We have implemented all the above features of the ALN-based learning
path construction method in an application program programmed by Java.
We kept all the data of LRs in text files which are downloaded from
www.reuters.com by a Web crawler. We use JSP (JavaServer Pages) to
compile the web pages. The interaction between the application program and
the user interface is connected through the Web Service. We use Tomcat as

5. Learning Path Construction based on Association Link Network 110
the web server to run the JSP Pages. Our experiments show that our method
offers better and much stable student learning performance. In practice, as
Web resources obtained from different providers may have very different
presentations and inconsistent contents.

111
Chapter 6
6. Fuzzy Cognitive Map based
Student Progress Indicators
Learning path shows students what to learn and how to learn, but we still
need to evaluate student learning performance and check their learning
quality. This learning progress information can help teachers improve their
teaching approaches and let students know if they are on the right track of
progress. As there are a lot of attributes that can affect student learning
quality, we have developed a method to identify the attributes that may affect
certain type of students a lot or a little, and present students how their
learning progress changes with these attributes.
Student learning progress is critical for determining proper learning
materials and their dissemination schedules in an e-Learning system.
However, existing work usually identifies student learning progress by scoring
subject specific attributes or by determining status about task completion,
which are too simple to suggest how teaching and learning approaches can be
adjusted for improving student learning performance. To address this, we
propose a set of student learning progress indicators based on the Fuzzy
Cognitive Map to comprehensively describe student learning progress on
various aspects together with their causal relationships. These indicators are
built on top of a student attribute matrix that models both performance and
non-performance based student attributes, and a progress potentiality
function that evaluates student achievement and development of such
attributes. We have illustrated our method by using real academic

6. Fuzzy Cognitive Map based Student Progress Indicators 112
performance data collected from 60 high school students. Experimental
results show that our work can offer both teachers and students a better
understanding on student learning progress.
6.1. Introduction
Both teaching and learning become flexible and adaptive. Teachers often need
to provide students various feedbacks, including scores and breakdowns,
description on what went good/wrong, and suggestions for further
improvement. Most of this information can be expressed numerically and
consolidated to form inputs to the e-Learning systems [Li08] for generating
adaptive courses. They may also form meaningful feedbacks to help teachers
and students make various enhancements. However, existing work has not
exploited such information well. This chapter addresses this issue. We present
a student progress-monitoring model which forms a core component of e-
Learning systems. Our model aims to generate comprehensive feedback
indicators which allow students to understand their learning performance and
how they can be improved, and allow teachers to adjust their teaching
approaches based on student learning performance, and allow both parties to
identify main parameters to affect student learning progress and their
developments in different attributes. Our model based on students’
performance related attributes (PAs) as well as non-performance related
attributes (NPAs) to model student learning performance and their
potentialities to make progress. We also infer the causal relationships among
these attributes to reflect how they affect the changes of one another. They are
useful to making teaching approaches to different groups of students. Hence,
our work contributes to the development of adaptive e-Learning technologies.
The main contributions are:
• Proposing student attribute descriptors to mathematically model the
casual relationship and the changes of both performance and non-
performance based attributes of students. This sets the foundation to
support student learning progress analysis.

6. Fuzzy Cognitive Map based Student Progress Indicators 113
• Proposing student learning progress indicators to pedagogically depict
student learning progress and development in terms of individual student
and various groupings, and against teacher’s expectations.
The rest of this chapter is organized as follows. Section 6.2 summarizes
existing work. Section 6.3 presents our modeling on student learning progress
and development. Section 6.4 presents experimental results and discussions.
Section 6.5 shows an evaluation of the work on measuring student learning
progress. Finally, Section 6.6 concludes this chapter.
6.2. Related Work
A learning path is the implementation of a curriculum design. It comprises
elements forming steps for students to go through for acquiring knowledge
and skills. In existing work, learning outcome assessment is generally tied up
with these steps. In this section, we examine how existing approaches define
learning paths and assess learning outcomes. The discussion includes
conventional classroom teaching, learning path generation systems and de
facto standards that define learning paths.
6.2.1. Student Attributes
To model student learning state, subject specific and general attributes can be
considered. By considering subject specific attributes, [Chen05] evaluates how
students make progress on their understanding of certain learning materials.
The method runs maximum likelihood estimation on the level of
understanding claimed by students against the difficulty of learning materials.
[Mitr01] investigates self-assessment skills of students by identifying the
reasons for a student to give up solving a problem and the ability of the
student to identify the types of problems to work on. The method collects
student learning progress based on mainly two attributes: the difficulty level
and the type of problem. [Guzm07] studies the use of self-assessment tests to
improve student’s examination performance; the tests generate questions
adaptively based on student’s answers to each previous question. The method
applies item response theory (IRT) to predict student’s probability of correctly

6. Fuzzy Cognitive Map based Student Progress Indicators 114
answering questions based on a student’s knowledge level. A student is
assessed based on the correctness of the answers and the probability
distribution of these corrected answers on each knowledge level, i.e., the
probability of the corresponding knowledge level, associated with each
concept.
Besides subject specific attributes, there are also non-subject related
attributes governing student learning progress, which are referred to general
attributes. [Yang10B] studies how students learn through peer assessment.
Students are asked to qualitatively assess peers based on feasibility, creativity
and knowledge, where the first two are general attributes, which respectively
represent the ability to identify appropriate learning materials and to come up
with original ideas. [Gres10] investigates the minimal set of social behavior to
be included in the brief behavior rating scale (BBRS), forming a compact
progress monitoring tool for efficiently identifying the change in student’s
social behavior. [Limo09] shows that learning styles are critical to student
learning and can help identify adaptive learning materials to students. In
addition, learning styles can be evolved over time. As shown above, existing
works model student learning state using a few specific types and numbers of
attributes. They give students feedback on certain aspects but can hardly
provide students a global picture showing how improvement can be made
across different subjects or learning activities, as they do not consider that
student learning progress can be governed by student learning performance
and development in both subject specific and general attributes as well as the
causal relationships among such attributes.
6.2.2. Student Assessment
To evaluate student learning progress, existing work has developed ways
to collectively model knowledge and skill sets of students. For instance,
[Chen01] uses attributed concept maps to represent both knowledge gained by
a student after a learning activity and the teacher’s prototypical knowledge. A
fuzzy map matching process is then used to compare both maps to determine
how well the student has progressed in the learning. [Feng09] proposes to use

6. Fuzzy Cognitive Map based Student Progress Indicators 115
a fine-grained skill model to represent a set of skills hierarchically. A
generalized linear mixed effects model is then applied to generate statistic
information to describe the student progress on different skills. [Stec05]
proposes curriculum-based measurements to intuitively monitor student
progress. It monitors student knowledge and skills frequently and depicts the
results graphically in order to show what progress a student has made globally
over a period of time and locally among each piece of knowledge/skill, and
whether such progress meets the teacher expectation. [Bake10] predict
student performance use the contextual estimation of student guessing
correctly and making errors despite knowing the skill to construct the
Bayesian Knowledge Tracing to model student knowledge.
Existing work mainly identify student progress as a set of state changes
made by a student regarding certain learning attributes and whether they
match with the teacher expectations. However, such progress information is
quite primitive. It is not sufficient to form indicators helping students and
teachers make improvement on learning and teaching, unless they pay extra
cognitive efforts to manually extract more comprehensive progress
information from the feedback. It is because learning attributes are not
independent but may have certain causal relationships among each others,
which can also be dynamically changed over time. In addition, at different
learning stages, student progress may be governed by a different set of
learning attributes. For example, a student may be expected to mainly train up
with concept memorization at an initial stage rather than focusing on the
learning outcome of applying knowledge. However the situation will become
in the opposite when a student is going through a mature learning stage. On
the other hand, a teacher may need a higher level of student progress
information, such as the performance distribution within a cohort, the portion
of students meeting the teacher expectations, or whether a student or a group
of students is/are developing certain learning skills, to support teaching
approaches adjustment. Our work is developed to provide a comprehensive
solution to address such complicated needs.

6. Fuzzy Cognitive Map based Student Progress Indicators 116
6.2.3. Student Grouping
The information about the progress of a group of students also contributes to
analyze the learning characters or behavior of one type of students. Teacher
can know the major character of a group of students and make teaching
approaches accordingly. On the other hand, teachers compare progress
individually and in a group, so that they can provide students accurate and
detailed feedbacks, effective instructions. And it is also convenient for an
individual student to know the student’s own progress and what is the
student’s difference from the others.
There are many criteria for grouping students. Some works simply group
students by their attribute levels. [Mart07] groups students by their
knowledge levels, and then recommends different learning tasks to different
levels of students. [McMa07] groups elementary student with different levels
of writing skill and uses writing assessments to examine the criterion validity
and the sensitivity of growth. So that to make sure that students are
progressing towards writing standards, to identify those who struggle, and to
inform instruction aimed at improving students’ writing proficiency. [Bisw10]
analyzes the student distribution of their misconceptions. A student may have
a misconception when the student builds up the relationship of two knowledge
concepts incorrectly. Students have the same misconception are grouped
together to analyze how they understand knowledge. However, it is not
enough to analyze the performance of a group of students who have only one
common attribute. Sometimes, students’ progress is affected only when
combined attributes act together. [Brus04] groups students with similar
knowledge backgrounds and also with the same knowledge level that they
want to achieve, and then they could be provided with the same navigation
support of learning materials. However, students with different learning
abilities would still being grouped together, so the learning materials may not
appropriate to everyone.
We find out that existing works just group students whose attributes are
either all good or all bad, while miss the effect of the other situations.

6. Fuzzy Cognitive Map based Student Progress Indicators 117
However, they do not consider about the other patterns of attribute
distribution. It is more intelligent to synthetically consider several aspects of
student attributes, no matter if students are good at all of them or bad at all of
them, as long as they keep the similar performance. It is not necessary to
group all good students together and all bad students together. For example,
according to students’ performance, students with good communication skill,
good listening skill and bad writing skill maybe grouped together for activity
like ‘debating’, but students with bad communication skill, good listening skill
and good writing skill would be considered as another group for activity like
‘summary report’. In fact, some attributes are related to each other, and only
the same attributes cannot represent student behavior patterns. Students with
similar ability distribution should be the better way that is used to group the
same type of student.
6.3. Mathematics Model
Analyzing student learning progress is not trivial. Different subjects (or
learning activities (LAs) [Yang10]) have different assessment criteria, where
some are subject specific but some are shared among subjects. On the other
hand, student learning styles and learning modes also play significant roles on
how a student perform and make development in different assessment
criteria. We have developed the student attribute descriptors to provide a
more complete picture on student learning progress and development.
6.3.1. Modeling of Student Attribute Descriptors
Student Attribute Matrix
We propose a student attribute model (SAM) (Eqs. 6.1-2) to incorporate both
performance (PA) and non-performance (NPA) based learning attributes,
forming an unified representation to support student learning progress and
development analysis. SAM is the foundation of student attribute descriptors.
It comprises subject-related and generic outcome attributes from Bloom’s
Taxonomy [Bloo56] (Table 6. 1), learning style attributes from Felder-
Silverman’s model [Feld88] and learning mode attributes describing whether

6. Fuzzy Cognitive Map based Student Progress Indicators 118
a learning activity is an individual or a collaborative one [Gokh95] (Table 6.
2). We apply a different version of Bloom’s Taxonomy from the version we
applied in chapter 4, which categorizes the Psychomotor domains into 7 levels
rather than 5 levels. Because we found that this way to divide Psychomotor
domains is much more easier to be understood by teachers and students in the
user study. We have adopted these well-established models to describe
student attributes as they have been widely used and verified. In practice,
teachers can use only a subset of attributes to model their teaching subjects
(or LAs), forming a local measurement, and optionally annotate attributes
with subject specific names if needed. Teachers can also put together local
measurements to reveal a bigger picture on the all-round performance and
development of a student, forming a global measurement.
Table 6. 1 Attributes from Bloom’s Taxonomy
Level of
Complexity
Cognitive
(Knowledge)
Affective (Attitude) Psychomotor
(Skill)
1 Knowledge Receiving Perception
2 Comprehension Responding Mind Set
3 Application Valuing Guided Response
4 Analysis Organizing Mechanism
5 Synthesis Characterizing by value or
value concept
Complex Overt
Response
6 Evaluation / Adaptation
7 / / Origination
Table 6. 2 Attributes regarding learning styles and learning modes.
Learning Mode Perception Input Organization Processing Understanding
Collaborative Concrete Visual Inductive Active Sequential
Individual Abstract Verbal Deductive Reflective Global

6. Fuzzy Cognitive Map based Student Progress Indicators 119
SAM is modeled as a dot product of the attribute criteria matrix C, which
comprises criteria for PAs (CPA) and NPAs (CNPA), and the score matrix, which
comprises scores 𝛼!". As shown in Eq. 6.1, each criterion is modeled as a row
vector 𝐴!, which comprises a set of 𝑎!" to model the different aspects of an
attribute. For attributes from Bloom’s Taxonomy, each aspect corresponds to
a level of complexity, while for attributes regarding learning styles and
learning modes, each aspect corresponds to a characteristic of each learning
style or learning mode. An aspect is modeled by a real number between 0 and
1 to represent its importance in a subject (or LA), where an aspect is set to be
0 if it is not being assessed. To model student learning state and teacher’s
expectation of a subject (or LA), as shown in Eq. 6.2, we define a score matrix
to comprise scores 𝛼!", where each score represents the level of achievement
(or required efforts) of an aspect of a PA (or NPA). In an e-Learning system,
each subject (or LA) will associate with a SAM to define the teacher’s
expectation, while each student studying the subject (or LA) will be assigned
with a SAM that is constructed by the same C to maintain the student’s
learning state.
𝐶 = 𝐶!"𝐶!"#
= 𝐴!,⋯ ,𝐴! ,⋯ ,𝐴! ! =
𝑎!! ⋯ 𝑎!!⋮ ⋱ ⋮
𝑎!"#,! ⋯ 𝑎!"#,!𝑎!"#!!,! ⋯ 𝑎!"#!!,!
⋮ ⋱ ⋮𝑎!! ⋯ 𝑎!"
(6.1)
SAM =α!! ⋯ α!"⋮ ⋱ ⋮α!" ⋯ α!"
,C =α!! ∙ a!! ⋯ α!" ∙ a!"
⋮ ⋱ ⋮α!" ∙ a!" ⋯ α!" ∙ a!"
=sa!! ⋯ sa!"⋮ ⋱ ⋮
sa!" ⋯ sa!"
(6.2)
Because a student will perform independently among different aspects of
the attributes, each aspect could then be considered as a random variable,
which follows the normal distribution 𝑠𝑎!"~𝑁 𝜃,𝜎! as shown in Eq. 6.3.
𝑝 𝑠𝑎!";𝜃 = 1 2𝜋𝜎 ∙ 𝑒! !"!"!!! !!! (6.3)

6. Fuzzy Cognitive Map based Student Progress Indicators 120
where 𝑝 ∙ is the probability distribution function of𝑠𝑎!"; 𝜃 is the estimation
value of 𝑠𝑎!"; 𝜎! measures the width of the distribution. We use Maximum
Likelihood Estimation [Kay93] to estimate 𝜃, where the largest probability
happens when 𝑠𝑎!" equals to 𝜃, which is proved as a correct expectation of the
observed data of 𝑠𝑎!". So SAM could be dynamically updated by the mean
value of all previous SAMs (Eq. 6.4).
𝑆𝐴𝑀 𝑡 = 1 𝑡 𝑆𝐴𝑀!!!!! (6.4)
where 𝑆𝐴𝑀! only expresses the learning state for the ith LA. 𝑆𝐴𝑀 𝑡 records the
overall learning state of a student after learning t LAs. Because the change
between SAM(t) and SAM(t-1) may be perturbed by some uncertain factors
and may not reflect the real learning performance, we consider averaging all
previous learning performance to be the latest learning state of a student to
reduce such an error.
Progress Potentiality Function (PPF)
To analyze the potentiality of a student for making progress in learning
performance and for developing skills in non-performance based attributes,
we have developed a PPF to form a student achievement descriptor (Eq. 6.5).
𝑃 = 𝑓 𝐿!"#, 𝐿!"#$ (6.5)
where 𝑓 ∙ is the PPF, P is the student learning progress, LPAs and LNPAs , as
shown in Eqs. 6.6-7, are the student learning performance in PAs and the
degree of balance of a student’s development in NPAs, respectively. A student
has a higher potentiality to achieve more if the student can perform better in
PAs and/or has a more balanced development in NPAs.
𝐿!"# = 𝑠𝑎!"!!!!!
!"#!!! (6.6)
𝐿!"#$!! = 1 𝑛𝑁𝑃𝐴× 𝑚!!!!!!!"# 𝑠𝑎!" − 1 𝑚!
!!!!!!
!!!!!!"# (6.7)
where mi is the number of non-zero aspects for each attribute, nPA is the
number of PAs, nNPA is the number of NPAs, and n is the number of
attributes. 1/mi is the perfect probability if NPAs can be developed evenly. Eq.
6.6 reflects that students who have higher value of learning outcome, their

6. Fuzzy Cognitive Map based Student Progress Indicators 121
overall student learning performance could be higher as well. And Eq. 6.7
reflects that if the different aspects of non-performance related attributes tend
to be developed evenly, then the student can have a more balanced
development in NPAs. We normalize the values of all LPAs and LNPAs-1 to be
within [0, 1] to allow them to be processed in a unified way. In the end, 𝑓 ∙ is
given by P= LPAs+𝐿!"#$.
Fuzzy Cognitive Map (FCM)
Existing work evaluate student learning progress mainly by their subject
performance (PAs). However, student learning is a complicated process.
Student learning performance can also be affected by NPAs, e.g. an active
student tends to have better communication skills than a passive student. In
addition, both PAs and NPAs may affect among each others. To model such
complicated relationships and infer changes among the attributes, we apply
Fuzzy Cognitive Map (FCM), which is formulated by Eqs. 6.8-10, to analyze
changes of SAMs and infer the causal relationship among the attributes in a
SAM.
𝐹! = 𝑓 𝐹!!!!!!!!
𝑓!" (6.8)
where 𝐹! and 𝐹! are the state values of a pair of a starting attribute Aj and an
ending attribute Ai, respectively. There are n attributes in total. The value of
state 𝐹! indicates the existent degree of a FCM node (i.e. an attribute). In our
model, 𝐹! reflects the overall strength of impact of an attribute on all the
others, which can be formulated by:
𝐹! 𝑡 = 𝐹! 𝑡 − 1!!!!!!!
∙ 𝑓!" 𝑡 (6.9)
where 𝐹! 𝑡 is the state value of attribute Aj after finished the tth LA. It is
updated by the current causal weights fij from all the other attributes to
attribute Aj together with the previous status values of all the other attributes.
We assume all attributes having the same impact on each other at the
beginning and set their initial state values to ‘1’. Note that fij is represented by
a real number within [-1, 1] as it reflects the fuzzy meaning showing the

6. Fuzzy Cognitive Map based Student Progress Indicators 122
impact degree from a starting attribute to an ending attribute, where fij> 0 (or
fij< 0) implies increasing (decreasing) in the state value of a starting attribute
will lead to an increase (decrease) in the state value of ending attribute.
Otherwise, fij = 0 implies no causal relation existing between a starting and an
ending attribute. The matrix of the causal weights forming the FCM is shown
as follows:
FCM =
0 𝑓!"𝑓!" 0
… 𝑓!!… 𝑓!!
⋮ ⋮𝑓!! 𝑓!!
⋱ ⋮… 0
(6.10)
After a student finished the current LA, the causal relationships among
attributes are re-evaluated by taking mean of the Mahalanobis distances
between the current and each of all previous SAMs, which essentially captures
the changes of attributes of the SAMs. Because Mahalanobis distance can
measure the similarity of an unknown multivariate vector to a known one (e.g.
a group of mean values), and also measure the dissimilarity between two
random vectors. The larger is d, the more dissimilar of the two vectors. d is 0
when the two vectors are exactly the same. The Mahalanobis distance is
defined as Eq. (6.11):
𝑑 𝑆𝐴𝑀! , 𝑆𝐴𝑀! = 𝑆𝐴𝑀! − 𝑆𝐴𝑀! 𝑆!! 𝑆𝐴𝑀! − 𝑆𝐴𝑀!!
(6.11)
where S is the Covariance matrix of 𝑆𝐴𝑀! and𝑆𝐴𝑀! , which measures the
dissimilarity of two matrixes and is defined by Eq. (6.12)
𝑆 = cov 𝑆𝐴𝑀! , 𝑆𝐴𝑀! = 𝐸 𝑆𝐴𝑀! − 𝐸 𝑆𝐴𝑀!! 𝑆𝐴𝑀! − 𝐸 𝑆𝐴𝑀! (6.12)
where 𝐸 𝑆𝐴𝑀! is the expectation value of𝑆𝐴𝑀! . If we only measure the
similarity of a specific attribute 𝐴!, then the Mahalanobis distance turns to the
following form:
𝑑! 𝑆𝐴𝑀! , 𝑆𝐴𝑀! = 𝑆𝐴!" − 𝑆𝐴!" 𝑆!! 𝑆𝐴!" − 𝑆𝐴!"!
(6.13)
where S turns to

6. Fuzzy Cognitive Map based Student Progress Indicators 123
𝑆 = cov 𝑆𝐴!" , 𝑆𝐴!" = 𝐸 𝑆𝐴!" − 𝐸 𝑆𝐴!"! S𝐴!" − 𝐸 𝑆𝐴!" (6.14)
Hence, the causal weights 𝑓!" of FCM can then be dynamically updated.
Such calculations are shown by Eqs 6.15-17.
𝑓!" 𝑡 =1
!!! !!
(𝑡 − 2) 𝑡 − 12
𝑓!" 𝑡 − 1 + 𝑦!" 𝑘, 𝑡!!!
!!!
𝑖 ≠ 𝑗
0 𝑖 = 𝑗
=𝑡 − 2𝑡
𝑓!" 𝑡 − 1 +2
𝑡 𝑡 − 1𝑦!" 𝑘, 𝑡
!!!
!!!
𝑖 ≠ 𝑗
0 𝑖 = 𝑗
(6.15)
𝑦!" 𝑘, 𝑡 = !"#$!∙!! !"#!,!"#!!"#$!∙!! !"#!,!"#!
(6.16)
𝑆𝑖𝑔𝑛! = 𝑠𝑖𝑔𝑛 𝑆𝐴!,! − 𝑆𝐴!,!!"# !" !"#"!$!"#"!!! = 1 𝑝𝑟𝑜𝑔𝑟𝑒𝑠𝑠
−1 𝑟𝑒𝑔𝑟𝑒𝑠𝑠 (6.17)
where 𝑓!" 𝑡 expresses a causal weight after a student finished the tth LA and
𝑘 ∈ 1, 𝑡 − 1 is the index of previous t-1 activities. Since the changes of
attributes are measured between the current SAM and each of the previous
SAMs, after a student finished studying a new LA (i.e. a new SAM is
generated), there will be 𝑡 − 1 𝑡/2 times comparisons in total. 𝑦!" 𝑘, 𝑡
models how much 𝐴! will change relative to the change of 𝐴! between SAMs
obtained at the tth and the kth LAs, where 𝑑! 𝑆𝐴𝑀! , 𝑆𝐴𝑀! is the Mahalanobis
distance of these SAMs. 𝑆𝑖𝑔𝑛! equals to 1 if the student makes progress,
otherwise it equals to -1.
6.3.2. Student Progress Indicators
Learning Attribute and Student Groups
To analyze student learning progress and development, we need different
kinds of groupings, namely learning attribute groups (LAGs) and student
groups (SGs). LAGs are formed to support local measurement. They comprise
groups to maintain subsets of learning attributes. These groups are:

6. Fuzzy Cognitive Map based Student Progress Indicators 124
• Subject Group: to assess subject (or LA) specific knowledge or skills. In
our experiments, we maintain groups for Arts, Science and all subjects.
• Learning Stage Group: to assess students at appropriate cognitive
levels during different stages. Learning stages contain three stages to
imitate students’ early, interim, and mature stages respectively. The early
stage assesses students’ basic knowledge in cognitive levels. The interim
stage assesses student learning progress potentiality in non-performance
related attributes as well as attributes in Affective and Psychomotor
domains to monitor if they have balance development. And the mature
stage assesses students’ advanced knowledge in cognitive levels.
SGs are formed to support a more holistic analysis. They can be
constructed manually or automatically, which include:
• Study Group: to divide students based on subject of study, e.g. Arts and
Sciences. We also consider individual or all students as general groups. All
these groups’ types are manually pre-defined.
• Performance Group: to divide students based on their learning
performance associated to skills. Teachers are expected to apply their
experience to define groups of best, good, satisfactory, below average, and
disqualified students, which form performance metrics describing
teacher’s expectation on students with different learning performance.
Such metrics may also be automatically generated by applying
performance information from former cohorts. Because we also define
students’ attribute values in a fuzzy meaning which indicates the degree of
requirements for each aspect, we can apply these fuzzy values to measure the
degrees of belonging to clusters. And in Fuzzy C-mean clustering method,
each point has a degree of belonging to clusters, rather than belonging
completely to just one cluster. Points on the edge of a cluster may have a less
degree than points in the center of cluster. When analyze students’ actual
performance, we apply the Fuzzy C-mean clustering method [Bezd81] to
divide students into groups based on their SAMs, where the student learning

6. Fuzzy Cognitive Map based Student Progress Indicators 125
performance metrics defined by teachers forming the representatives of the
clusters.
Formulation of Student Progress Indicators
Student learning progress indicators are functions developed to produce
information for pedagogically depicting student learning progress and
development. There are three indicators:
• Knowledge Construction Indicator (KCI): Inputs of KCI are PAs,
NPAs based on selected LAGs. It produces the learning status of a student
with respect to certain learning stage by evaluating the updated SAM and
FCM, followed by classifying the student into a proper performance group.
KCI offers comprehensive information describing how a student performs.
• Teacher’s Expectation Indicator (TEI): Inputs of TEI are a set of KCI
based on selected LAGs and SGs, i.e. collective information indicates the
learning progress and development from a group of students. Based on the
performance metrics, TEI produces a picture on how a selected group of
students make progress against the teacher’s expectation. For instance,
showing whether there are too many students perform significantly better
than what a teacher expected. In such a case, the teacher may conclude the
course is too easy.
• Student Growth Indicator (SGI): Inputs of SGI are a number of sets
of PAs and NPAs of a student or a group of students from certain series of
learning stages, i.e. the learning progress and development made by
certain student(s) over a period of time. SGI evaluates PPF based on the
inputs to indicate whether certain student(s) make progress or regress over
time.
According to the above description, we can provide with the Eq. 6.18 to
present the whole idea of student(s) learning progress.
𝑆𝑃, 𝑡 = 𝑓 𝑠!, 𝑠!, 𝐿𝑆,𝑔 ,𝑎 (6.18)
where f(*) presents the function of type of student(s) (𝑠!), selected subjects
(𝑠!), Learning Stage (LS) or the general growth (g)over time, and attributes’
performance (a). The type of student(s) could be a type of student group, an

6. Fuzzy Cognitive Map based Student Progress Indicators 126
individual student, or all students. And attributes’ performance could be
learning performance on PAs, or balance degree of NPAs. We can get the
student(s)’ learning progress (SP) and teacher’s expectation (t) with f(*) for
the type of students (𝑠!) in the corresponding subjects (𝑠!) and attributes, and
corresponding learning stage (LS) or the general growth over time (g).
6.4. Experiment Results and Analysis
In order to analyze student learning progress with our Fuzzy Cognitive Map
based student progress indicator, we have collected performance data of 60
high school students from No.83 Xi’an Middle School, China. These data
contains their test results in both year 1 and year 2. Meanwhile, we ask 6
teachers in 6 subjects to set their learning outcomes by the PAs and NPAs. We
generate questionnaires for both teachers and students by providing them the
learning progress analysis results and ask if they can understand and agree
with the learning progress results. In the end, we analyze the results
quantitatively by showing student learning progress by graphs, and provide
qualitative analysis to explain their meanings.
6.4.1. Experiment Data Collection
We conducted experiments with our method by evaluating the learning
progress of 60 students from No. 83 High school of Xi’an, China. Results are
collected from 4 assessments conducted on the students over last year. All
students studied the same 6 subjects, including Math, English, Physics,
Chemistry, Political economy, and History. Math, Physics, and Chemistry are
considered as Science subjects, while the other ones are Arts subjects.
Requirements of PAs and NPAs of each subject are set by the corresponding
subject teachers.
6.4.2. Progress and Development in Different Stages
We select student S2 to demonstrate how we depict the learning progress and
development of a student at different stages. We just need to set different
parameters under different requirements, then we can view the student
learning progress in different conditions. For example, during the early stage,

6. Fuzzy Cognitive Map based Student Progress Indicators 127
S2 was assessed by the lower levels (level 1 to 3) attributes of Bloom’s
cognitive domain (Fig.6. 1). According to the above conditions, these
parameters could be set as s1=individual student S2, s2=All subjects, LS=early
stage, p=performance on PAs. During the interim stage, S2 was mainly
assessed by the student’s progress potentiality in non-subject specific
attributes with a formative assessment (Fig.6. 2). The student’s performance
is much higher than teacher’s expectation, so the student achieves the
learning outcomes required by teachers. Similarly, according to the above
conditions, these parameters could be set as s1=individual student S2, s2=All
subjects, LS=interim stage, a=performance on PAs. Such attributes included
Fig.6. 1 Early stage performance of S2.
0 0.1 0.2 0.3 0.4 0.5 0.6 0.7 0.8 0.9 1
level 1 level 2 level 3
S2 Teacher's expectation
Fig.6. 2 Interim stage performance of S2.
0 0.1 0.2 0.3 0.4 0.5 0.6 0.7 0.8 0.9 1
Level 1 Level 2 Level 3 Level 1 Level 2 Level 3 Level 4
Affective Psychomotor
S2 Teacher’s expectation

6. Fuzzy Cognitive Map based Student Progress Indicators 128
those of the first 3 levels of the affective domain and the first 4 levels of
psychomotor domain of Bloom’s Taxonomy. Results show that S2 performed
much better than the teacher’s expectation in both stages. This suggests that
S2 had developed the required set of learning skills very well.
Fig.6. 3 depicts the balance degree of NPAs of all students, where s1=all
students, s2=All subjects, LS=early stage, a=balance degree of NPAs. The left
half of the figure shows the balance degree for Science students, while the
right half is for Arts students. We sorted the results based on the balance
degree within each subject major for sake of readability. S2 has a more
balanced development in NPAs comparing to other students. Such a balance
degree is significantly above the teacher’s expectation. In addition, S2 has
developed a higher balance degree in Science subjects than Arts subjects.
Overall, the teacher expects that S2 would not have any major problem when
moving forward to later stages, and encouraged S2 to keep on studying in this
way.
During the mature stage, the students were mainly assessed by the high
levels of attributes to examine whether they had properly developed more
advanced skills to handle more complicated parts of the study. Fig.6. 4 shows
S2 had continuously performed better than the teacher’s expectation, where
s1=all students, s2=All subjects, LS=mature stage, a=performance on PAs.
Part of the reason was S2 had built up a solid foundation during earlier stages.
Fig.6. 5 shows S2 had scored very high from PPF, i.e. S2 had both a high
progress potentiality in PAs and high degree of balance in NPAs. Hence, the
student had developed advanced skills very well. Although scores from PPF of
Fig.6. 3 Students’ development in NPAs during the interim stage
0
0.5
1
'S6'
'S12'
'S57'
'S41'
'S20'
'S36'
'S48'
'S23'
'S40'
'S8'
'S38'
'S17'
'S55'
'S43'
'S11'
'S54'
'S25'
'S10'
'S22'
'S28'
'S34'
'S3'
'S44'
'S33'
'S31'
'S13'
'S18'
'S14'
'S19'
'S58'
'S2'
'S59'
'S45'
'S51'
'S60'
'S53'
'S27'
'S32'
'S39'
'S52'
'S46'
'S4'
'S50'
'S21'
'S16'
'S29'
'S24'
'S37'
'S42'
'S26'
'S9'
'S5'
'S7'
'S1'
'S35'
'S56'
'S47'
'S15'
'S49'
'S30'
Balance Degree Average Balance Degree Teacher's Expectation Science Balance Degree Art Balance Degree

6. Fuzzy Cognitive Map based Student Progress Indicators 129
S2 was lower in Arts subjects than Science subjects, the scores were above
average, which means S2 would likely to perform better than average students.
We also construct FCM for the students to examine the causal
relationships among attributes to suggest students the ways for improvement.
Fig.6. 6 (a) and Fig.6. 6 (b) shows the FCM for all students and S2,
respectively. The FCM was constructed using the high-level Bloom’s attributes
(i.e. domains) and the attributes from learning styles and learning modes. As
shown in Fig.6. 6 (a) if a student could make more balance development on
each learning styles and learning modes, the psychomotor domain skills of the
student could get improved, due to the positive causal relationships (all
Fig.6. 4 Mature stage performance of S2.
0 0.1 0.2 0.3 0.4 0.5 0.6 0.7 0.8 0.9 1
Level 4 Level 5 Level 6 Level 4 Level 5 Level 5 Level 6 Level 7
Cognitive Affective Psychomotor
S2 Teacher’s expectation
Fig.6. 5 PPF scores of S2
0 0.1 0.2 0.3 0.4 0.5 0.6 0.7 0.8 0.9 1
All Subjects Science Arts
Potential PAs Performance Balance Degree

6. Fuzzy Cognitive Map based Student Progress Indicators 130
weights = 0.59). Once the psychomotor domain skills were improved, the
student would significantly improve the cognitive domain performance
(weight = 0.92) and slightly improve the affective domain skills (weight =
0.39). If the student improved the affective domain skills, the psychomotor
domain skills would be significantly improved (weight = 0.96). As shown in
Fig.6. 6 (b), the FCM of S2 also had similar causal relationships among
attributes, except the weights were much stronger. This means that S2 could
make all-round improvement more easily than the other students in average.
Finally, we examine the continual progress and development made by
S2. Four tests were conducted on S2 during the year of study. As shown in
Fig.6. 7, S2 made similar learning performance and development on PAs and
NPAs, respectively. Until taking test 2, S2 had been improving and had a very
high level of achievement in progress. However, the progress of S2 started to
deteriorate after test 2. It might be due to the fact that the subject materials
were getting more complicated during the later stages. Fortunately, S2 were
still performing by making an above-average progress.
(a) FCM of all students
(b) FCM of S2
Fig.6. 6 Attributes causal relationships
CognitiveAffective Psychomotor
Learning ModesPerceptionInputOrganizationProcessingUnderstanding
0.590.590.590.590.590.59
0.960.92
0.390.92
CognitiveAffective Psychomotor
Learning ModesPerceptionInputOrganizationProcessingUnderstanding
111111
11
0.421

6. Fuzzy Cognitive Map based Student Progress Indicators 131
6.4.3. Progress and Development of Student Groups in
Different Subjects
We examine the progress and development of all students by all Bloom’s
attributes (Fig.6. 8). We classify students into different learning performance
groups by running Fuzzy C-mean on the student attributes against teacher’s
performance metrics.
Each student group is depicted with a different color. We also show the
number of students in each group in the legends of the figures. Fig.6. 8(a) and
Fig.6. 8(b) present the results from Science, and Arts students, respectively.
We mainly discuss Fig.6. 8(b), while Fig.6. 8(a) can be interpreted in a similar
way. As shown in Fig.6. 8(b), students of the “best” and “good” types
performed evenly across all attributes, while other types of students
performed not well in some attributes, e.g. they generally performed poorly
with the level 5 attribute of the affective domain. However, an individual
student, such as S2, might perform differently from the group that the student
belonged. Although S2 was classified as a student with good learning
performance, the student also had weakness in the level 5 of the affective
domain attribute. On the other hand, teacher’s expectation fell into the range
of the below average students. This indicates that most of the Art students
performed much better than the teacher’s expectation. Hence, the teacher’s
expectation was too low and would be recommended to adjust higher.
Fig.6. 7 Continual progress made by S2.
0
0.2
0.4
0.6
0.8
1
Test 1 Test 2 Test 3 Test 4
PAs performance Balance Degree
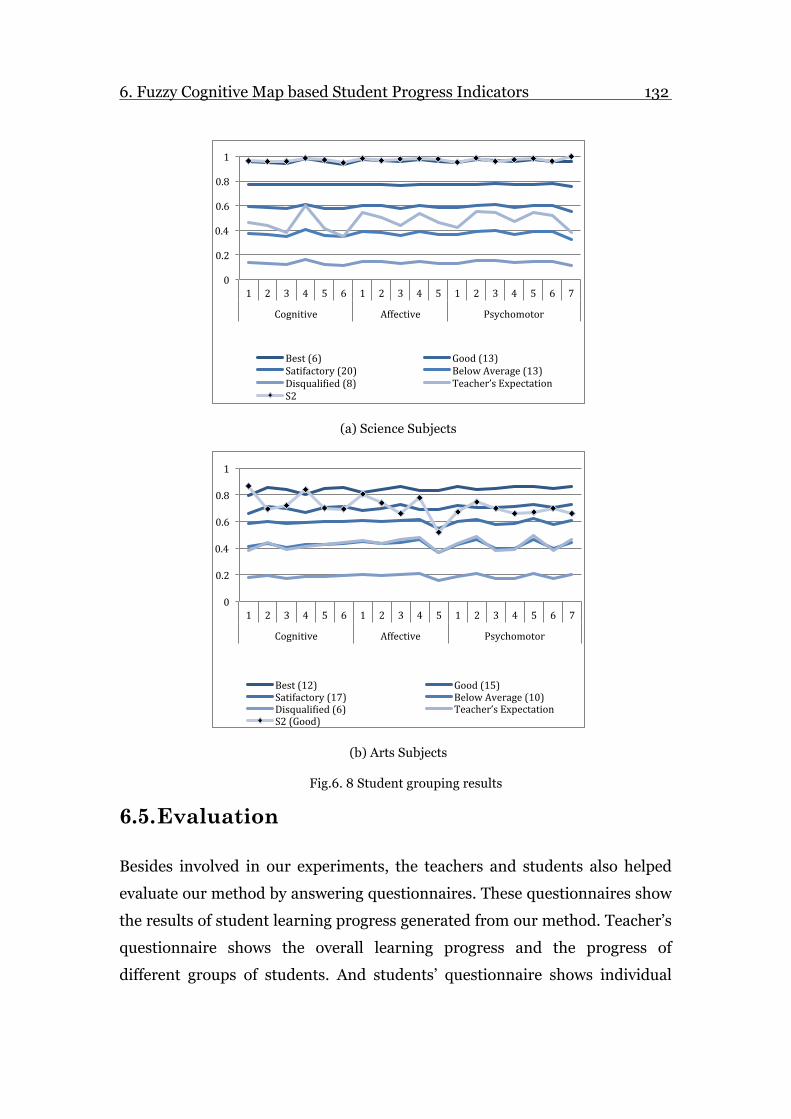
6. Fuzzy Cognitive Map based Student Progress Indicators 132
6.5. Evaluation
Besides involved in our experiments, the teachers and students also helped
evaluate our method by answering questionnaires. These questionnaires show
the results of student learning progress generated from our method. Teacher’s
questionnaire shows the overall learning progress and the progress of
different groups of students. And students’ questionnaire shows individual
(a) Science Subjects
(b) Arts Subjects
Fig.6. 8 Student grouping results
0
0.2
0.4
0.6
0.8
1
1 2 3 4 5 6 1 2 3 4 5 1 2 3 4 5 6 7
Cognitive Affective Psychomotor
Best (6) Good (13) Satifactory (20) Below Average (13) Disquali^ied (8) Teacher’s Expectation S2
0
0.2
0.4
0.6
0.8
1
1 2 3 4 5 6 1 2 3 4 5 1 2 3 4 5 6 7
Cognitive Affective Psychomotor
Best (12) Good (15) Satifactory (17) Below Average (10) Disquali^ied (6) Teacher’s Expectation S2 (Good)

6. Fuzzy Cognitive Map based Student Progress Indicators 133
student’s learning progress and the group progress of the student belongs to.
Because these students and teachers are Chinese, so the questionnaires are
conducted in Chinese as shown in Appendix B (Analysis results for teachers)
and Appendix C (Analysis results for teachers). Both teachers and students
evaluate our results mainly from the aspects of if the results coincide with
their cognition and can help them better understand the learning progress.
We have asked them opinions on our 6 parts of experiments (P1 – P6). P1, P2
and P3 concerns results describing the early, interim and mature stages of
study. P4 concerns student progress over time. P5 concerns student grouping.
Finally, P6 concerns the strength of impact of each attribute for different
groups of students. We respectively asked opinions from teachers and
students about how accurate our experiment results explain student learning
performance and how good our results in helping students understand their
learning performance and make improvement. We used a Likert-type scale
with scores from 1 to 5 in each of the questions P1 – P6. Scores 1 – 5 means
totally disagree, agree with a small part, agree with half of the experiment
results, mostly agree, and totally agree, respectively. Based on the scores
obtained, we normalized them within the range of [0, 1] as shown in Fig.6. 9
to intuitively illustrate the level of agreement by teachers and students. As
shown in Fig.6. 9, the average score 0.74 shows teachers mostly agree our
results explain student learning performance accurately. Specifically, as
shown in Fig.6. 9(b), such level of agreement applied to both teachers of the
Science and Arts subjects as they got almost the same scores. Fig.6. 9(c) shows
opinion from students. Results show that students had a very high level of
agreement (scored 0.86 in average and scores of P2 and P6 >= 0.9) that our
results well depicted their learning performance and could help them to make
improvement.

6. Fuzzy Cognitive Map based Student Progress Indicators 134
6.6. Summary
We have developed student descriptors, which are formed by SAM, PPF and
FCM to mathematically model both students’ PAs and NPAs, the changes of
(a) Teachers’ opinion
(b) Subject teachers’ opinion
(c) Students’ opinion
Fig.6. 9 Evaluation results
0.8 0.7 0.73 0.7 0.73 0.77 0.74
0
0.2
0.4
0.6
0.8
1
P1 P2 P3 P4 P5 P6 Average
0.74 0.73 0.74
0
0.2
0.4
0.6
0.8
1
Average Science Arts
0.85 0.95
0.8 0.8 0.85 0.9 0.86
0
0.2
0.4
0.6
0.8
1
P1 P2 P3 P4 P5 P6 Average

6. Fuzzy Cognitive Map based Student Progress Indicators 135
these attributes over time and their causal relationship. This supports
comprehensive student progress analysis. We have also developed student
progress indicators to pedagogically depict student progress and development
in both individual and group of students setting, and also show such
information against the teacher’s expectation. We have conducted
experiments with 60 students and have disseminated information on student
progress and development based on our method. Our evaluations show that
both the teachers and the students mostly agree that our method can well
explain student progress and development, and the information that we
depicted can clearly illustrate how a student can make improvement. As a
future work, we are now working on visualization methods to help
disseminate student progress and development in a more intuitive way.

136
Chapter 7
7. Conclusion and Future Work
7.1. Introduction
This thesis focuses on developing methods for constructing learning paths in
terms of “learning resources”, “learning approaches”, and “learning quality” to
support student learning. To find out a model that helps teachers design
teaching approaches, we define different teaching approaches for learning
activities and organize them into a learning path which indicates the learning
sequence of different learning activities. And to find out the appropriate
learning resources, we automatically generate well-structured learning
resources from loosely connected Web resources. These learning resources are
delivered to students, who have different knowledge backgrounds, learning
interests, and knowledge levels, to study knowledge. In the end, to provide
methods to help teachers and students determine student learning quality in a
more intuitive way, we evaluate student learning performance to analyze their
learning progress using the proposed student attribute descriptors and
student progress indicators.
7.2. Research Contribution
7.2.1. A Fine-grained Outcome-based learning path model
Existing methods generate learning paths based on attributes that describe
learning contents and student learning performance. However, these content-
based works do not properly incorporate the teaching and learning
approaches. As a result, the learning outcomes are assessed by the mastery

7. Conclusion and Future Work 137
levels of learning contents. However, it is hard to assess other forms of
learning outcomes, such as generic skills. In addition, the learning activities
only provide simple forms of teaching methods that make them hard to be
defined and reused for another courses.
We have proposed a fined-grained outcomes based learning path model
which provides a learning path construction method to design the
components of the learning path and to change the setting of these
components based on learning outcomes. The proposed model allows the
assessment methods open to different types of learning outcomes, supports
different teaching approaches to different types of courses, and also students
can obtain more comprehensive guidance.
Our outcome-based learning path model incorporates the Bloom’s
Taxonomy [Bloo56] for learning path construction to support more precise
learning outcome assessment. In fact, the proposed model is also open to
different types of learning outcome assessment methods and inference
algorithms [Cona02, Chen06]. This feature allows an ITS that is built on top
of our learning path model to easily incorporate specific subjects and even a
combination of methods for evaluating student learning performance more
accurately and comprehensively.
The proposed model offers an adjustable fine-grained learning activity
formulation to support the implementation of different teaching approaches
in a learning path. This also enhances the modeling of KEs to allow a KE to be
delivered and assessed in different ways.
In the proposed model, the components of a learning path have
relationships and constraints among each other. This simplifies the
implementations of learning path construction systems. We also implement a
prototype to display our system, and ask experienced teachers to use it and
evaluate our model. In the user study, our model displays excellent
functionalities that teachers with different knowledge backgrounds and
different teaching experiences have shown their great interests, saying our

7. Conclusion and Future Work 138
model is useful and helpful to design learning path and to guide student
learning.
According to the discussion above, the fine-grained outcome based
learning path model fulfills the research objective of finding out the teaching
approaches and answers the question of how to learn, so that teachers can
provide different teaching approaches for different courses, which can
evaluate different types of learning outcomes including both subject-specific
knowledge and skills as well as generic skills.
7.2.2. Learning Path Construction based on Association
Link Network
The learning resources are not easy to manually create, especially when
designing for different students. Reusing Web resources to form learning
resources offers a way for rapid course construction. However, the challenges
are how to identity the properties of the Web resources, including the
relevance, importance and complexity, etc., and how to find out the
relationships among them, especially, how to find out tailored learning
resources for different students with different learning abilities and
knowledge backgrounds, etc.
To address these problems, we proposed an Association Link Network
based learning path construction method to automatically find out the
personalized learning resources according to students’ knowledge
backgrounds, learning preferences, learning abilities, etc. This method can
automatically construct well-structured learning resources from loosely
connected Web resources as teacher knowledge model. The learning path is
extracted from teacher knowledge model, which contains three-abstraction
levels, i.e. keyword, topic, and learning resources ALNs. The learning path
with three-abstraction levels provides more information about the
relationships among knowledge, which can help students better understand
the knowledge. Also, the method comes with a test generation scheme which
can automatically generate tests and assess student understanding against
learning resources.

7. Conclusion and Future Work 139
In the ALN-based learning path construction method, we apply
Association Links Network to form teacher knowledge model which identifies
the associations among unorganized Web resources. Given the mass Web
resources, even if we have no idea about their knowledge domains, concept
structures, or learning outcomes, we still can structure the knowledge via the
model. It can provide a very efficient way to organize Web resources rather
than ask teachers to manually create learning resources.
Our system incrementally extracts adaptive learning path from the
teacher knowledge model, which automatically converts the LRs into
associated UOLs as the learning path with a set of three different ALNs. The
learning path also has three abstraction levels. Any node in an ALN also can
be respectively mapped to some other nodes in the other two ALNs, so that
students can have more information to understand knowledge concepts with
the help of the associated nodes of knowledge concepts.
We construct a test generation scheme to automatically assess student
understanding against a LR within a UOL. We use the associations between
topics or keywords as the rules to test if students can build up the correct
association between major concepts. This automatic scheme saves a lot of
efforts than manually designed tests. In the end, two comparison studies are
designed to demonstrate that students using a system-recommended learning
path can have better and more stable learning performance than using
manually-selected learning path by a teacher.
As the discussion above, the proposed ALN based learning path
construction method fulfills the research objective of automatically finding out
the appropriate learning resources to construct personalized learning path
which helps students better understand the knowledge and achieves their
learning outcomes.
7.2.3. Fuzzy Cognitive Map based Student Learning
Progress Indicators
Existing works on student learning progress mainly identify student learning
progress as a set of state changes made by a student regarding certain learning

7. Conclusion and Future Work 140
attributes and whether the student meets with the teachers’ expectations.
However, such progress information is quite primitive. It is not sufficient to
form indicators to help students and teachers make improvements on learning
and teaching, unless they pay extra cognitive efforts to manually extract more
comprehensive learning progress information from the feedbacks. It is
because learning attributes are not independent but may have certain causal
relationships among each other, which can also be dynamically changing over
time. In addition, at different learning stages, student learning progress may
be governed by a different set of learning attributes. For example, a student
may be expected to mainly train up with concept memorization at an initial
stage rather than focusing on the ability of applying knowledge. However the
situation becomes in the opposite when a student is going through a mature
learning stage. On the other hand, a teacher may need a higher level of student
learning progress information, such as the performance distribution within a
cohort, the portion of students meeting the teachers’ expectations, or whether
a student or a group of students is/are developing certain learning skills, to
support teaching approaches adjustment.
Our work is developed to provide a comprehensive solutions to address
such complicated needs. We proposed Fuzzy Cognitive Map based student
learning progress indicators which collect student performance on student
performance related attributes and non-performance related attributes,
analyze how their performance is changing and what factor can cause the
changes of performance on certain attribute, categorize students into different
types according to their different learning progress, and also propose a
progress potential function to predict student learning performance in the
future.
We propose a student attribute matrix to formulate all levels of both
performance related attributes and all aspects of non-performance related
attributes. In the student attribute matrix, the row vector represents one kind
of student attribute and the components in the vector represent quantified
values of attribute levels, It is easy to measure student progress from different
perspectives of student attributes. On the other hand, it supports the fuzzy

7. Conclusion and Future Work 141
property that a student may stay in two or more levels according to different
cases. It is better to formulate a non-linear function to calculate the effect of
one attribute on one another. With the student attribute matrix, we also can
group students together by one of these attributes or by a selection of
attributes.
Fuzzy Cognitive Map (FCM) is used to infer the causal relationships
among student attributes which behave as the concept nodes in the map. With
the FCM, we can analyze the learning behaviors of a single student, or a group
of students with similar attributes. More importantly, it can analyze the
factors that affect student learning progress, and describe the causal
relationships among these factors, i.e. how a factor affects each other in terms
of student learning progress.
According to the discussion above, the proposed student learning
progress indicators fulfill the research objective of guarantee the learning
quality and answer the question of how well students have learned. Teachers
can adjust teaching approaches and try to help students have a balanced
development to handle different learning environments.
7.3. Limitations and Future work
The outcome-based learning path model currently formulates a representation
of a learning path. Basically, we can prepare learning path templates to best fit
with each type of students, so teachers do not need to manually create the
learning path. However, it still cannot automatically construct a learning path.
Because it has to depend on teachers to manually adjust the requirements and
learning outcomes of each learning activity as well as the sequences among
them. These adjustments will cause a lot of extra work for teachers. And on
the other hand, teachers cannot clearly know every student’s learning status,
so the adjustment may contain some errors. As a future work, we will work on
some automatic algorithms for managing and adjusting the learning outcomes
and the delivery of learning activities, based on which we plan to develop an
adaptive e-Learning system.

7. Conclusion and Future Work 142
In order to find out appropriate learning resources, we construct
learning resources directly from the Web resources and identify the attributes
of these learning resources to suit different types of students, and also we can
make sure there is no similar learning resource exists in the teacher
knowledge model. However, the selected learning resources in a learning path
are obtained from different websites and created by different authors, their
formats/styles of describing knowledge and skills are not consistent enough
for students to smoothly obtain knowledge. Students may get confused if the
contexts between learning resources are not well connected, or if the learning
resources use different symbols to express the same terminology, etc. All of
these deficiencies will affect students’ understanding. It is necessary to find
out a way to improve the consistency of the learning resources. As a future
work, we will investigate methods to address such presentation and
consistency problems, in order to allow students to learn more smoothly with
the Web resources constructed learning materials.
Student learning progress can provide dynamic information about how
students’ performance on some attributes is changing, such as how student
learning performance is changing over a particular attribute, predicting a
student’s learning performance according to the student’s previous
performance as well as peers learning performance, etc. However, our work
only shows limited perspectives of student learning progress. On the other
hand, teachers from different knowledge disciplines may be interested in
different perspectives of student learning progress. They may feel some of the
progress we have provided is not very useful for their teaching. If we can
provide them a progress customization tool where they can customize their
interested learning progress, then it will improve their teaching quality a lot.
Also, if the dynamical learning process and various perspectives of student
learning progress could be visual to teachers and students, they would better
understand student learning progress, so that students can enhance their
learning, and teachers can adjust their teaching approaches accordingly. As a
reference, we could use the visualization tool [Gource] not only to present the
progress across different stages, to show student learning performance in

7. Conclusion and Future Work 143
multi-resolution, but also to present the relationship among different types of
attributes.
7.4. Conclusion
This chapter summarizes our works presented in the thesis, highlights the
contributions including the proposed methods, the advantages, and how they
achieve the research objectives, discusses the limitations of the works and the
future works to overcome the limitations. This research has proposed a fine-
grained outcome-based learning path model, which teachers can use to design
learning tasks, learning activities, and learning path for different types of
students. This research study also proposed a learning path construction
method which can automatically generate learning resources from loosely
connected Web resources. This research proposed a Fuzzy Cognitive Map
based student progress indicator to analyse and present student progress and
to find out the factors that may affect student learning performance. The
future work depicts possible directions of this research study. The future
improvements of the work include automatically adjusting the components
and their settings of the outcome-based learning path, presenting the learning
resources in a consistent format, and designing a more effective way to
visually present student learning progress. If such research work can be
successfully done, more contributions on constructing learning path will be
achieved.

144
References
[Armo06] R. R. Amorim, M. Lama, E. Sanchez, A. Riera, and X. A. Vila, ‘A
Learning Design Ontology based on the IMS Specification’, Journal of
Educational Technology & Society, 9(1): 38-57, 2006.
[Band77] A. Bandura, ‘Social Learning Theory’, New York: General
Learning Press, pp.1-46, 1977.
[Bart32] F.C. Bartlett, ‘Remembering: A Study in Experimental and Social
Psychology’, Cambridge University Press, 1932
[Bete09] D. Betebenner, ‘Norm- and Criterion-Referenced Student
Growth’, Educational Measurement: Issues and Practice, 28(4): 42-51, 2009.
[Bezd81] J. C. Bezdek, ‘Pattern Recognition with Fuzzy Objective
Functional Algorithms’. New York: Plenum Press, 1981.
[Bigg07] J. Biggs and C. Tang, Teaching for Quality Learning at
University, 3rd Ed., Open University Press, 2007.
[Bloo56] B. Bloom, M. Englehart, E. Furst, W. Hill, and D. Krathwohl,
Taxonomy of Educational Objectives: Handbook I: The Cognitive Domain,
David McKay & Co., Inc., 1956.
[Bloom] Bloom's Taxonomy - Learning Domains,
www.businessballs.com/bloomstaxonomyoflearningdomains.htm
[Brow78] J. Brown and R. Burton, “Diagnostic Models for Procedural Bugs
in Mathematical Skills,” Cognitive Science, 2:155-192, 1978.
[Brus92] P. Brusilovsky, ‘A framework for intelligent knowledge
sequencing and task sequencing’, Intelligent Tutoring Systems, 608: 499-
506, 1992.

Appendix 145
[Brus04] P. Brusilovsky, ‘KnowledgeTree: A Distributed Architecture for
Adaptive E-Learning’, International World Wide Web conference on
Alternate track papers & posters, NewYork, USA, 2004.
[Brus07] P. Brusilovsky and E. Millán, “User Models for Adaptive
Hypermedia and Adaptive Educational Systems,” The Adaptive Web, LNCS
4321, pp.3–53, 2007.
[Carb70a] J. Carbonell, “AI in CAI: An Artificial Intelligence Approach To
Computer-Assisted Instruction,” IEEE Trans. on Man-Machine Systems,
II(4):190-202, Dec. 1970.
[Carb70b] J. Carbonell, “Mixed-initiative Man-computer Instructional
Dialogues,” Tech. Rep. #1971, Bolt, Beranek and Newman, 1970.
[Chan04] T. Chan, M. Sharples, G. Vavoula, P. Lonsdale, ‘Educational
Metadata for Mobile Learning’, Proc. Wireless and Mobile Technologies in
Education, 2004.
[Chan07] S.N. Chang, L. S-J. Tonya, ‘Web-based Learning Environment: A
Theory-Based Design Process for Development and Evaluation’, Journal of
Information Technology Education, 6: 23-43, 2007.
[Chen01] S. W. Chen, S. C. Lin, and K. E. Chang, ‘Attributed concept
maps: fuzzy integration and fuzzy matching’, IEEE Transactions on Systems,
Man, and Cybernetics, Part B: Cybernetics, 31 (5): 842-852, 2001.
[Chen05] C.M. Chen, H.M. Lee, and Y.H. Chen, ‘Personalized e-Learning
system using Item Response Theory’, Computers & Education, 44(3): 237–
255, April 2005.
[Chen06] C. Chen, C. Liu, and M. Chang, “Personalized Curriculum
Sequencing using Modified Item Response Theory for Web-Based
Instruction,” Expert Systems with Applications, 30(2):378–396, Feb. 2006.
[Chen08] C. Chen, “Intelligent web-based learning system with
personalized learning path guidance,” Computers & Education, 5:7878-814,
2008.

Appendix 146
[Cola10] F. Colace, M. De Santo, ‘Ontology for E-Learning: A Bayesian
Approach’, IEEE Transaction on Education, 53(2): 223-233, 2010.
[Cona02] C. Conati, A. Gertner, and K. Vanlehn, “Using Bayesian
Networks to Manage Uncertainty in Student Modeling,” User Modeling and
User-Adapted Interaction, 12(4):371-417, Nov. 2002.
[Cono05] G. . Conole, and K. Fill, ‘A Learning Design Toolkit to Create
Pedagogically Effective Learning Activities’, Journal of Interactive Media in
Education, Special Issue (8): 1-16, Sept. 2005.
[Coop04] S. E. Cooperstein, and E. K. Weidinger, ‘Beyond Active Learning:
a Constructivist Approach to Learning’, Reference Services Review, 32(2):
141-148, 2004.
[Dagg07] D. Dagger, A. O’Connor, S. Lawless, E. Walsh, and V.P. Wade,
‘Service-Oriented E-Learning Platforms: From Monolithic System to Flexible
Services’, IEEE Transaction on Internet Computing, 11(3): 28-35, 2007.
[Dalz03] J. Dalziel, “Implementing Learning Design: The Learning
Activity Management System (LAMS),” Proc. ASCILITE, pp. 593-596, Dec.
2003.
[Dieg00] Juan-Diego Zapata-Rivera and Jim E. Greer, ‘Inspecting and
Visualizing Distributed Bayesian Student Models’, Intelligent Tutoring
Systems, 1839: 544-553, 2000.
[Dodr99] M. Dodridge, “Learning Outcomes and Their Assessment in
Higher Education,” Engineering Science and Education Journal, 8(4):161-
168, Aug. 1999.
[Dolo08] P. Dolog, B. Simon, W. Nejdl, and T. Klobucar, “Personalizing
Access to Learning Networks,” ACM Trans. on Internet Technology, 8 (2) ,
2008.
[Elso93] M. Elsom-Cook, “Student Modelling in Intelligent Tutoring
Systems,” Artificial Intelligence Review, 7(3-4):221-240, Aug. 1993.
[Farr04] R. Farrell, S. Liburd, and J. Thomas, “Dynamic Assembly of
Learning Objects,” Proc. World Wide Web, pp. 162-169, May 2004.

Appendix 147
[Feng09] M. Feng, N.T. Heffernan, C. Heffernan, and M. Mani, ‘Using
Mixed-Effects Modeling to Analyze Different Grain-Sized Skill Models in an
Intelligent Tutoring System’, IEEE Transactions on Learning Technologies,
2(2): 79 - 92 , April-June, 2009.
[Feld88] R. M. Felder, and L. K. Silverman, ‘Learning and Teaching Styles
in Engineering Education’, Engineering. Education, 78 (7): 674-681, 1988.
[Fink03] L.D. Fink, ‘Creating significant learning experiences: An
integrated approach to designing college courses’. San Francisco: Jossey Bass,
2003.
[Fink09] L.D. Fink, ‘A self directed guide to designing course for
significant learning’. Access 21st Feb 2009
http://www.ou.edu/pii/significant/selfdirected1.pdf
[Fran06] S. Franklin, and F. G. Patterson, ‘The LIDA Architecture: Adding
New Modes of Learning to an Intelligent, Autonomous, Software Agent’,
Integrated Design and Process Technology, June, 2006.
[Full07] U. Full, etc., ‘Developing a Computer Science-specific Learning
Taxonomy’, ACM SIGCSE Bulletin, 39(4):152-170, 2007.
[Gagn72] R.M. Gagne, ‘Domains of Learning’, 3(1):1-8, Interchange, 1972.
[Garc07] P. García, A. Amandi, S. Schiaffino, and M. Campo, ‘Evaluating
Bayesian networks precision for detecting students learning styles’,
Computers & Education, 49 (3): 794-808, 2007.
[Gokh95] A. A. Gokhale, ‘Collaborative Learning Enhances Critical
Thinking’, Journal of Technology Eudcation, 7 (1), Fall, 1995.
[Good09] M. H. Goodarzi, A. Amiri, ‘Evaluating Students' Learning
Progress by Using Fuzzy Inference System’, Sixth International Conference on
Fuzzy Systems and Knowledge Discovery, 2009.
[Gource] http://code.google.com/p/gource/

Appendix 148
[Gust02] K. L. Gustafson, R. M. Branch, ‘What is Instructional Design?’,
In R.A. Reiser & J. A. Dempsey (Eds.), Trends and issues in instructional
design and technology, pp. 16-25, 2002.
[Guzm07] E.Guzman, R.Conejo, and J.-L. Perez-de-la-Cruz, ‘Improving
Student Performance Using Self-Assessment Tests’, IEEE Transaction on
Intelligent Systems, 22(4): 46-52, 2007.
[Gres10] F.M. Gresham, C. R. Cook, T. Collins, E. Dart, K. Rasetshwane,
E. Truelson, and S. Grant, ‘Developing a change-sensitive brief behavior rating
scale as a progress monitoring tool for social behavior An example using the
Social Skills Rating System’, School Psychology Review, 39(3): 364-379,
2010.
[Hanu05] E. A. Hanushek, and M. E. Raymond, ‘Does School
Accountability Lead to Improved Student Performance?’, Journal of Policy
Analysis and Management, 24(2): 297-327, 2005.
[Hatz10] I. Hatzilygeroudis, and J. Prentzas, ‘Integrated Rule-Based
Learning and Inference’, IEEE Transactions On Knowledge And Data
Engineering, 22(11): 1549-1562, 2010.
[Hayk99] S. Haykin, ‘Neural networks: a comprehensive foundation’,
Prentice-Hall, Engelwoods Cliffs, NJ, 1999.
[Hern06] D. Hernandez-Leo, E. D. Villasclaras-Fernández, J. I. Asensio-
Pérez, Y. Dimitriadis, I. M. Jorrín-Abellán, I. Ruiz-Requies and B. Rubia-Avi,
“COLLAGE: A collaborative Learning Design editor based on
patterns”,Educational Technology & Society, 9 (1): 58-71, Jan. 2006.
[Huan07] M. Huang, H. Huang, and M. Chen, “Constructing a
personalized e-Learning system based on genetic algorithm and case-based
reasoning approach,” Expert System with Applications, 33:551-564, 2007.
[IMSLD] http://www.imsglobal.org/learningdesign/
[Imri95] B. Imrie, “Assessment for Learning: Quality and Taxonomies,”
Assessment & Evaluation in Higher Education, 20(2):175-189, Aug. 1995.

Appendix 149
[Jamu09] R.S. Jamuna, ‘A survey on service-oriented architecture for E-
learning system’, International Conference on Intelligent Agent & Multi-
Agent System, 2009.
[Jere10] M. Jevremovic, and Z. Vasic, ‘Adaptive e -Learning’,
International Scientific Conference, Gabrovo, 2010.
[Kara05] P. Karampiperis and D. Sampson, “Adaptive Learning Resources
Sequencing in Educational Hypermedia Systems,” Educational Technology &
Society, 8(4):128-147, Oct. 2005.
[Kay93] S.M. Kay, ‘Fundamentals of Statistical Signal Processing:
Estimation Theory’, vol. I, Prentice-Hall, 1993.
[Kazi04] S. A. Kazi, ‘A Conceptual Framework for Web-based Intelligent
Learning Environments using SCORM-2004’, Proc. IEEE International
Conference on Advanced Learning Technologies, pp.12-15,2004.
[Kirk95] R. E. Kirk, ‘Experimental design: procedures for the behavioral
sciences (Third Edition)’, Pacific Grove, CA, USA, 1995.
[Kore08] M. Koretsky, D. Amatore, C. Barnes, and S. Kimura,
“Enhancement of Student Learning in Experimental Design Using a Virtual
Laboratory,” IEEE Trans. on Education, 51(1):76–85, Feb. 2008.
[Krat73] D. Krathwohl, B. Bloom, and B. Masia, Taxonomy of
Educational Objectives, the Classification of Educational Goals. Handbook
II: Affective Domain, David McKay Co., Inc., 1973.
[Kwas08] H. Kwasnicka, D. Szul, U. Markowska-Kaczmar, and P.B.
Myszkowski, ‘Learning Assistant - personalizing learning paths in e-Learning
environments’, Computer Information Systems and Industrial Management
Applications, pp. 308, Ostrava, 2008.
[LD] http://www.imsglobal.org/learningdesign/
[Leac07] T.L. Leacock, and J.C. Nesbit, ‘A Framework for Evaluating the
Quality of Multimedia Learning Resources’, Journal of Educational
Technology & Society, 10(2): 44-59, 2007.

Appendix 150
[Lefo98] G. Lefoe, ‘Creating Constructivist Learning Environments on
The Web: the Challenge in Higher Education.’ ASCILITE, pp. 453-464, 1998.
[Limo09] C. Limongelli, F. Sciarrone, M. Temperini, and G. Vaste,
“Adaptive Learning with the LS-Plan System: A Field Evaluation,” IEEE
Trans. on Learning Technologies, 2(3):203-215, May 2009.
[Li08] Q. Li, R. Lau, T. Shih, and F. Li, “Technology Support for Distributed
and Collaborative Learning over the Internet,” ACM Trans. on Internet
Technology, 8(2), Article No. 5, Feb. 2008.
[Li10] F. Li, R. Lau and P. Dharmendran, “An Adaptive Course Generation
Framework,” International Journal of Distance Education Technologies,
8(3):47-64, Jul.-Sep. 2010.
[Liu99] Z.Q. Liu, and R. Satur, ‘Contextual Fuzzy Cognitive Maps for
Decision Support in Geographic Information Systems’, IEEE Trans. Fuzzy
Systems, 7 (10): 495-502, 1999.
[Liu05] H. Liu, and M. Yang, “QoL Guaranteed Adaptation and
Personalization in E-Learning Systems,” IEEE Trans. on Education,
48(4):676-687, Nov. 2005.
[Luo08A] X.F. Luo, N. Fang, B. Hu, K. Yan, and H. Xiao, ‘Semantic
representationof scientific documentsfor the e-science Knowledge Grid’,
Concurrency and Computation: Practice and Experience, 20:839-862, 2008.
[Luo08B] X.F. Luo, Q.L. Hu, F.F. Liu, J. Yu, and X.H. T, ‘Textual
Knowledge Flow based Intelligent Browsing of Topics’, International
Conference on Grid and Pervasive Comupting, pp. 57-62, June, 2008.
[Luo10] X.F. Luo, X. Wei, and J. Zhang, ‘Guided Game-Based Learning
Using Fuzzy Cognitive Maps’, IEEE Transactions on Learning Technologies,
3 (4): 344-357, 2010.
[Luo11] X. Luo, Z. Xu, J. Yu, and X. Chen, “Building Association Link
Network for Semantic Link on Learning resources,” IEEE Trans. on
Automation Science and Engineering, 8(3):482-494, 2011.

Appendix 151
[Ma00] J. Ma and D. Zhou, “Fuzzy Set Approach to the Assessment of
Student-Centered Learning,” IEEE Trans. on Education, 43(2):pp.237-241,
May 2000.
[Mart07] JMartineau, P. Paek, J. Keene, and T. Hirsch, ‘Integrated,
Comprehensive Alignment as a Foundation for Measuring Student Progress’,
Educational Measurement: Issues and Practice,26(1):28-35, 2007.
[Meli09] M. Melia, and C. Pahl, ‘Constraint-Based Validation of Adaptive
e-Learning Courseware’, IEEE Transaction on Learning Technologies, 2(1):
37-49, Jan. 2009.
[Mish06] P. Mishra, and M. J. Koehler, ‘Technological Pedagogical
Content Knowledge: A Framework for Teacher Knowledge’, Teachers College
Record, 108(6): 1017-1054, 2006.
[Mitr01] A. Mitrovic, ‘Investigating Students’ Self-Assessment Skills’,
Lecture Notes in Computer Science, 2109/2001: 247-250, 2001.
[Murr03] T. Murray, S. Blessing, and S. Ainsworth, ‘Authoring Tools for
Advanced Technology Learning Environments’, Kluwer Academic Publishers,
Netherland, pp. 493-546, 2003.
[Nash] R. Nash, and M. Wild, ‘Writing Student Learning Outcomes with
the Help of Bloom’s Taxonomy’, Coastline Community College Editor’s note:
http://www.ncstatecollege.edu/committees/curric/Writing%20Student%20L
earning%20Outcomes.pdf.
[Neve02] F. Neven, E. Duval, ‘Reusable Learning Objects: a Survey of
LOM-Based Repositories’, Proceedings of the tenth ACM international
conference on Multimedia, 2002.
[Osca11] M. Oscarson, and B. M. Apelgren, ‘Mapping language teachers’
conceptions of student assessment procedures in relation to grading: A two-
stage empirical inquiry’, Journal of System, 39(1):2-16, 2011.
[Pets11] Y. Pets, ‘A Simulation Study on the Performance of the Simple
Difference and Covariance-Adjusted Scores in Randomized Experimental
Designs’, Journal of Educational Measurement, 48(1): 31-43, 2011.

Appendix 152
[Reis01] R.A. Reiser, ‘A History of Instructional Design and Technology Part
II: A History of Instructional Design’, Educational Technology Research and
Development, 49(2): 57-67, 2010.
[SCORM] http://www.adlnet.gov/capabilities/scorm/scorm-2004-4th
[Shaw10] R. S. Shaw, ‘A study of learning performance of e-Learning
materials design with knowledge maps’, Computers & Education, 54 (1): 253-
264, 2010.
[Shut98] V. Shute, “DNA - Uncorking the Bottleneck in Knowledge
Elicitation and Organization,” Proc. Intelligent Tutoring Systems, pp. 146-
155, Aug. 1998.
[Shut03] V. Shute, and B. Towle, ‘Adaptive E-Learning’, Educational
Psychologist, 38(2):105-114, 2003.
[Simp72] E. Simpson, The Classification of Educational Objectives in the
Psychomotor Domain, Gryphon House, 1972.
[SIMSEQ] http://www.imsgp;ba;.org/simplesequencing/
[Stec05] P. M. Stecker, L. S. Fuchs, and D. Fuchs, ‘2005 Using
Curriculum-Based Measurement to Improve Student Achievement: Review Of
Research’, Psychology in the Schools, 42 (8): 795-819, 2005.
[Stec08] P.M. Stecker, E.S. Lembke, and A. Foegen, ‘Using Progress-
Monitoring Data to Improve Instructional Decision Making’, Preventing
School Failure, 52(2): 48-58, 2008.
[Stiu10] I. Stiubiener, W.V. Ruggiero, and M. Rosatelli, ‘E-Learning, Chapter
6: An Approach in Personalisation and Privacy in E-Learning Systems’, ISBN
978-953-7619-95-4, 2010.
[Stud98] R. Studer, V. R. Benjamins, and D. Fensel, ‘Knowledge
Engineering: Principles and methods’, Data & Knowledge Engineering, 25 (1-
2): 161-197, 1998.

Appendix 153
[Su06] J-M. Su, S-S Tseng, C-Y Chen, J-F Weng, and W-N
Tsai,‘Constructing SCORM compliant course based on High-Level Petri
Nets’,Computer Standards & Interfaces, 28(3): 336-355, 2006.
[Su07] M.T. Su, C. S. Wong, C.F. Soo, C. T. Ooi, and S.L. Sow, ‘Service-
Oriented E-Learning System’, IEEE International Symposium on
Information Technologies and Applications in Education, pp. 6-11, 2007.
[Tabe91] R. Taber, ‘Knowledge Processing with Fuzzy Cognitive Maps’,
Expert Systems With Application, (2): 83-97, 1991.
[Totk04] G. Totkov, C. Krusteva, and N. Baltadzhiev, ‘About the
Standardization and the Interoperability of E-Learning Resources’,
International Conference on Computer System and Technologies, pp. 1-6,
2004.
[Wang05] F. Wang, and M. J. Hannafin, ‘Design-Based Research and
Technology-Enhanced Learning Environments’, ETR&D, 53(4): 5-23, 2005.
[Wage08] R. Wagenaar, ‘Learning Outcomes a Fair Way to Measure
Performance in Higher Education: the TUNING Approach’, IMHE, pp.2-8,
2008.
[Wiel10] M.B. Wieling, and W.H.A. Hofman, ‘The Impact of online video
lecture recordings and automated feedback on student performance’,
Compertes & Education,54(4): 992-998, May 2010.
[Yang05] K. M. Yang, R. J. Ross, and S. B. Kim, ‘Constructing Different
Learning Paths Through e-Learning’, International Conference on
Information Technology: Coding and Computing, 1, pp. 447-452, Las Vegas,
USA, 2005.
[Yang10] F. Yang, F. Li, and R. Lau, "An Open Model for Learning Path
Construction", Proceedings of International Conference on Web-based
Learning, pp. 318-328, Dec. 2010.
[Yang10B] Y.F. Yang, and C.C Tsai, ‘Conceptions of and approaches to
learning through online peer assessment’, Learning and Instruction, 20: 72-
83, 2010.

Appendix 154
[Zapa02] D. Zapata-Rivera and J. E. Greer, ‘Exploring Various Guidance
Mechanisms to Support Interaction with Inspectable Student Models’,
Intelligent Tutoring Systems, 2363: 442-452, 2002.
[Zhu02] X. Zhu, and Z. Ghahramani, ‘Towards semi-supervised
classification with Markov random fields’, Technical Report CMU-CALD-02-
106, Carnegie Mellon Univ., 2002.

Appendix 155
155
Appendix A
Questionnaire on Learning Progress Scheme
Covering Letter
This study is organized by Miss Fan Yang, a PhD student in the School of
Engineering and Computing Sciences, Durham University, who is working on
a research project in e-learning.
Project introduction
Learning path construction is a complicated task, which involves formulating
and organizing activities, defining ways to evaluate student learning progress
and to match such progress with designated learning outcome requirements.
Our project proposes a mathematical model to formulate learning paths and
learning activities. This model can lead to the implementation of a generic
system to support learning path design for teachers from any subject
disciplines. We have developed a simple prototype based on this model and
are now conducting this user study to evaluate our work.
Abstract of the questionnaire
The results of this study will determine if our system can provide a convenient
environment for you to design a course in terms of its learning path, track
student learning progress and evaluate their performance, and provide
feedback to help students enhance their learning quality.
Note that at this stage, the design of our prototype e-learning tool focuses only
on its functionalities, i.e. generating learning paths, evaluating student
progress and learning outcomes, rather than focusing on the user interface
design.
Other Information
If there are questions about particular items, simply respond: ‘Just answer the
question as you interpret it’.

Appendix 156
156
You will not be identified by name. All information provided by you will be
treated as strictly confidential.
Your participation would help us confirm the importance and usefulness of
our research on designing personalized learning path for different students.
If you have any problem, please feel free to contact me.
E-mail: [email protected]
Mobile: 07594324631
Department: School of Engineering and Computing Sciences, Durham
University
Your participation is very much appreciated and will allow us to focus on
critical issues related to control student learning progress and evaluate
learning outcomes.
The questionnaire should only take less than 10 minutes to complete. Could
you please return it by 10 June 2010?

157
Questions: (19 questions)
It is recognized that teachers are likely to respond quite differently to the
enclosed questions. Please answer all questions in such a way as to reflect
most clearly your viewpoints.
There is no right or wrong answer. Answer the questions in the order in which
they appear on the paper. Most questions will require you to circle your
selected response. Others will require you to write down a few words. Do not
leave blanks.
We thank you for your contribution to this important research.
1. What’s your subject?
□Science
□Art
□Engineering
□Other, please specify:
2. Do you have any experience of using e-learning tools?
□Yes.
□No, but I know what it is.
□No, I have no idea about it.
3. How many years of teaching experience do you have?
□ 0-1 year
□ 1-3 years
□ 3-5 years
□ More than 5 years
4. Do you have any experience of designing/modifying teaching
materials?
If yes, how do you design/modify teaching materials?
□ No.

Appendix 158
158
□Yes, I design/modify my teaching materials by hand.
□Yes, I design/modify my teaching materials with professional
software. Please specify what kind of software are you using:
____________________________.
□ Yes, I use others. Please specify:
____________________________.
5. When you design your teaching materials, you need to define student
learning outcomes. How do you find the criteria to define student
learning outcomes?
□Subject area
□Difficulty level
□Skill set
□Others:____________________________.
6. Student ability refers to a set of attributes describing how a student has
been trained up while studying a subject area. These attributes may
indicate whether a student can only recall the subject content or can
apply subject knowledge to solve problems in unseen situations, for
instance.
An example of a student ability table
Teacher can use these abilities for assessment and put them to a student
ability table. How will you rank the usefulness of the student ability table?
□Very useful

Appendix 159
159
□Useful
□Not so useful
□Not useful at all
7. To support a more fine-grained formulation for describing the learning
processes of knowledge elements, we propose the idea of learning task,
which is simple in nature and is designed for training up a student with
a certain abilities in the way they prefer, including individual or
collaborative and active or passive.
An example of a single learning task
How do you find this idea will help you design what a student needs to learn?
□Very useful
□Useful
□Not so useful
□Not useful at all
8. We divide an activity into tasks help a teacher have a better
understanding on how to create/organize the activity. As somehow, a
task is more closely related to abilities, so it is a bridge between an
activity and a set of abilities. For example, a ‘lecture’ activity may
include ‘delivering bookwork type of materials’ task for training up the
student comprehension skill, ‘question-answering’ task for testing out
the student understandings.

Appendix 160
160
Divide an activity into several tasks
Do you think this will help you have a better picture on why the student needs
to create an activity, and how this activity can help a student to make
progress/to improve the student’s abilities?
□Very useful
□Useful
□Not so useful
□Not useful at all
9. When designing a course, it is typical for a teacher to establish a set of
learning activities, such as lecture, tutorial or practical, to support
students learning different knowledge elements. Teacher is expected to
put together a list of learning tasks to form the basis for constructing
learning activities. By changing the abilities requirements and tasks
importance weights, the difficulty level of a learning activity would be
changed as well.

Appendix 161
161
An example of a learning activity
How do you find this idea will help you decide the learning process and
learning outcome of a learning activity?
□Very useful
□Useful
□Not so useful
□Not useful at all
10. Especially, collaborative learning activity refers to the learning activity
that students are learning collaboratively in a group setting. This type
of learning activity is modeled to comprise two types of learning tasks:
collaborative and individual, where they are designed to be performed
by a group of students collaboratively and by each individual student
within a group respectively. For example, a ‘Sell your Product’
collaborative learning activity assigns student A an individual task
‘design advertisement’ and assigns student B an individual task ‘design
PPT’ and each student has been assigned different individual task, but
all of them should do the collaborative task together: Presentation.
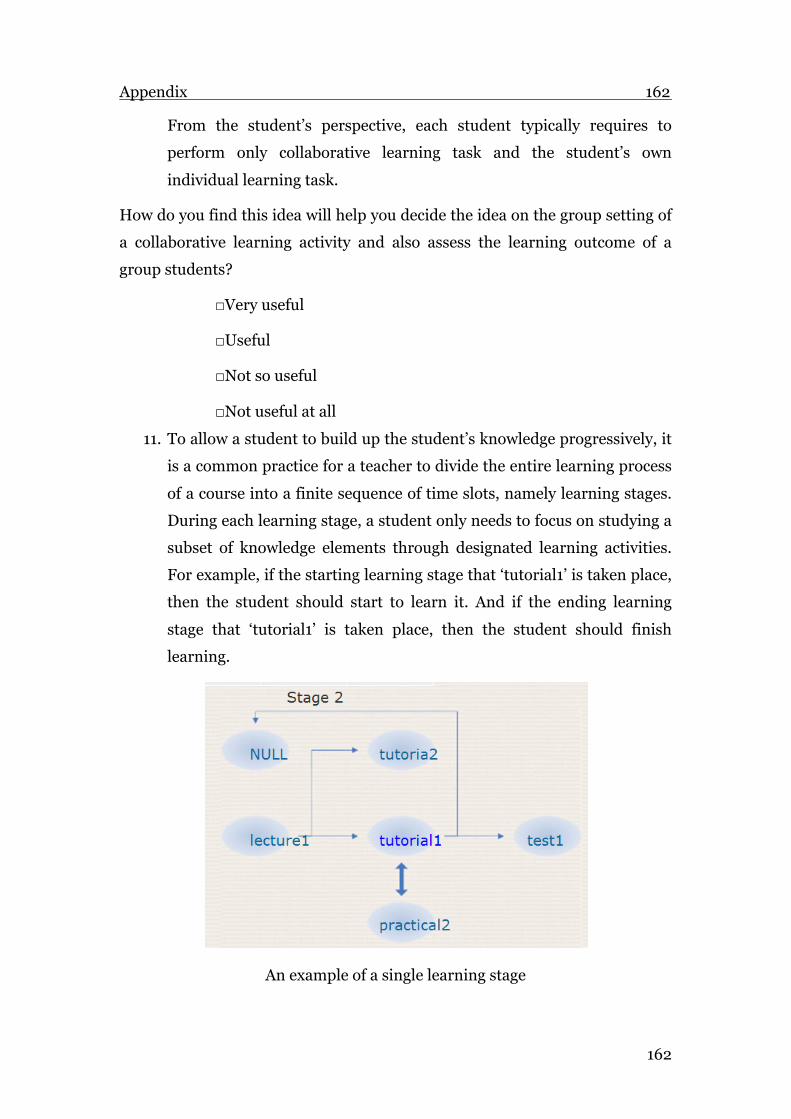
Appendix 162
162
From the student’s perspective, each student typically requires to
perform only collaborative learning task and the student’s own
individual learning task.
How do you find this idea will help you decide the idea on the group setting of
a collaborative learning activity and also assess the learning outcome of a
group students?
□Very useful
□Useful
□Not so useful
□Not useful at all
11. To allow a student to build up the student’s knowledge progressively, it
is a common practice for a teacher to divide the entire learning process
of a course into a finite sequence of time slots, namely learning stages.
During each learning stage, a student only needs to focus on studying a
subset of knowledge elements through designated learning activities.
For example, if the starting learning stage that ‘tutorial1’ is taken place,
then the student should start to learn it. And if the ending learning
stage that ‘tutorial1’ is taken place, then the student should finish
learning.
An example of a single learning stage

Appendix 163
163
How do you find this idea will help you better manage the learning process?
□Very useful
□Useful
□Not so useful
□Not useful at all
12. A learning path comprises a set of learning activities. There exist time
constraints and dependencies among the learning activities. The
starting learning stage decides when to learn a learning activity and the
ending learning stage decides when to finish a learning activity. And
the time constrains also useful for verifying the coexistence dependency
between two learning activities. They are useful especially when two or
more learning activities are running together. For example, the ending
stage of ‘lecture1’ is the starting stage of ‘tutorial1’, which decide
‘lecture1’ is the prerequisite of ‘tutorial1’. Also, ‘lecture1’ and ‘practical1’
share the same starting stage and ending stage, then both of them
should be taken as the same time.

Appendix 164
164
An example of a learning path
How do you find this idea will help you better design the learning path?
□Very useful
□Useful
□Not so useful
□Not useful at all
13. Learning process describes the current state of a student regarding how
much knowledge that the student has been built up in a subject area. In
our project, learning process can be obtained by evaluating the
accumulated learning outcomes of the student across a relevant
number of learning stages.
Would you find this idea helpful when you apply the results to set up rules for
defining the prerequisite of a learning activity or to adjust the learning path
for enhancing student learning?
□Very helpful
□ Helpful
□Not so helpful
□Not helpful at all
14. We also allow different assessment methods to be incorporated for
better capturing student performance or learning outcomes. Based on a
well developed theory Bloom’s taxonomy, we can assess a student in
three domains: cognitive (knowledge based), affective (attitudinal
based) and psychomotor (skill based). For example, Bloom’s Taxonomy
classify the cognitive domain into six levels from easy to difficult:
knowledge, comprehension, application, analysis, synthesis and
evaluation.
How do you find this idea will help you better assess a student performance?
□Very useful
□Useful

Appendix 165
165
□Not so useful
□Not useful at all
15. To assess student learning outcome, we propose to use student abilities
as the basis due to its practicality and the availability of the Bloom’s
Taxonomy. A student ability specific evaluation function can generate a
score to describe the level of achievement of a student in a particular
student ability. The evaluation function could be simple marking,
grading or item response theory.
How do you find this idea will be easier to assess a student performance?
□Very easy
□ Easy
□Not so easy
□Not easy at all
16. Is that possible to apply our e-learning tool to in your teaching subject?
□All of them could be applied to my teaching subject.
□Most of them could be applied to my teaching subject.

Appendix 166
166
□Part of them could be applied to my teaching subject.
□None of them could be applied to my teaching subject.
17. What’s the biggest difference from the e-learning tools you had
experienced before?
From the aspect of functionality____ ____ ____ ____ ____
____
From the aspect of convenience____ ____ ____ ____ ____
____
From the aspect of flexibility ____ ____ ____ ____ ____
____ ____
From the aspect of accuracy____ ____ ____ ____ ____
____ ____
From the aspect of understandability____ ____ ____ ____
____ ____
Others__ ____ ____ ____ ____ ____ ____ ____ ____
____ ____ ____
18. When you design your teaching materials, which aspect do you focus
most? Could you provide some details how you design your teaching
materials?
__ ____ ____ ____ ____ ____ ____ ____ ____ ____
____ ____ ____ ____ ____ ____ ____ ____ ____ ____
____ ____ ____ ____ ____ ____ ____ ____ ____ ____
____ ____ ____ ____ ____ ____ ____ ____ ____ ____
____ ____ ____ ____ ____ ____ ____ ____ ____ ____
__
19. Please make any further comments on the design / usage / clarity / or
suggestions for improvement of this system below.
__ ____ ____ ____ ____ ____ ____ ____ ____ ____
____ ____ ____ ____ ____ ____ ____ ____ ____ ____
____ ____ ____ ____ ____ ____ ____ ____ ____ ____

Appendix 167
167
____ ____ ____ ____ ____ ____ ____ ____ ____ ____
____ ____ ____ ____ ____ ____ ____ ____ ____ ____
__
Appendix 168
168
Appendix B
Questionnaire: Analysis results for teachers
提供给老师的分析结果
本次实验分析的课程包括:数学,物理,化学,政治,历史,和英语。其中视
前 3 门为理科科目,后 3 门为文科科目。基于上次从各位老师那里收集来得数
据,各位老师分别根据衡量学生表现的三个范畴(知识认知,学习态度,和行
为技巧)给出了自己的教学要求,我们基于这些方面,对学生进行评估,并将
其表现在刻度 0 到 1 范围内划分为 5 个等级:极差,较差,中等,良好,以及
优秀。
1. 学习的初级阶段
该阶段包括了衡量学生表现的三个范畴(知识认知,学习态度,和行为
技巧)里的几个较低级别,为一般情况下老师用到的衡量级别。
知识认知:认识并记忆,理解,应用;
学习态度:接受知识,做出响应;
行为技巧:使用感官线索指导活动的能力,学习前的准备工作,根据指导进行
练习。
1.1分类结果
则这 60 名同学的整体分布结果如下图所示:(图 1-1)全部课程;
(图 1-2)理科;(图 1-3)文科。其中,每一类的学生人数都表示在类别后
的括号内。可以看出,对于这 5 类学生,综合所有科目, 每一类学生在各个范
畴的各个方面都有稳定的表现。一个基本规律是:在一个范畴表现较好的学生,
在其他范畴也会有较好的表现。同样的结论适用于理科科目(图 1-2)和文科
科目(图 1-3)。但是在这 3 个范畴上,这 60 名同学(1)在理科上的整体表

Appendix 169
169
现要普遍好过在文科上的表现;(2)在理科上的差异(两级分化)明显大于在
文科上的差异。
图 1-1. 所有课程 图 1-2. 理科科目
图 1-3. 文科科目
请问各位老师,根据您在教学实践中对这 60 名学生的学习情况的了解,
该分析结果是否和您的理解一致?(请从 1-5 打分,1:完全不一致;2:
小部分一致 3:半数一致;4:大部分一致;5:基本一致;)
__________________________________________________________
_____
1.2 各个属性间的关系
根据上次的问卷调查,我们不仅仅收集了各位老师在知识,学习态度,行为技
巧 3 个范畴的教学要求,以及学生的参与模式(同学合作或单人作业)同时也
收集了各位老师在学习内容(具体或抽象),表达方式(视觉表达或口头表
0
0.1
0.2
0.3
0.4
0.5
0.6
0.7
0.8
0.9
1
1 2 3 1 2 1 2 3
认知范畴 学习态度 行为技巧
优秀 (8)
良好 (20)
中等 (13)
较差(14)
极差 (5)
0
0.1
0.2
0.3
0.4
0.5
0.6
0.7
0.8
0.9
1
1 2 3 1 2 1 2 3
认知范畴 学习态度 行为技巧
优秀 (6)
良好 (13)
中等 (21)
较差(12)
极差 (8)
0
0.2
0.4
0.6
0.8
1
1 2 3 1 2 1 2 3
认知范畴 学习态度 行为技巧
优秀 (12)
良好 (14)
中等 (18)
较差(10)
极差 (6)

Appendix 170
170
达),知识组织方式(归纳/收敛知识,或演绎/发散知识),学生参与态度
(主动或被动),教学顺序(从前到后一步一步教授知识,或从整体到细节教
授知识)5 个方面所形成的教学风格。我们相信,一个属性的变化(进步或退
步)会影响到其他属性的变化(进步或退步),所以我们根据学生的表现,分
析了这 9个属性的相互关系。
综合各门课程,60 名学生在初级阶段所呈现出来的 9 个属性的相互关系如图 2
-1 所示,每一个节点表示一个属性,箭头表示出发节点对终止节点有影响,
箭头上的权重表示一个属性对其他属性影响的相对大小(权值 0 为无影响,权
值 1 为影响最大)。可以发现学生的认知范畴,学习态度,和行为技巧 3 者之
间是相互影响的,任何一个的进步都会引起另外 2 个属性的进步。而学生的学
习风格的平衡发展又会直接影响到学生认知范畴和行为技巧的表现。其中学习
风格的平衡度对认知范畴的影响作用要大于对行为技巧的影响作用。
图 2-1. 60名学生在初级阶段所呈现出来的 9个属性的相互关系
综合所有课程,根据所有学生在初级阶段的表现,学生各个属性对其他属性的
总影响力分布如图 2-2 所示。因为初级阶段只衡量了学生的初级能力,所以衡
量这 3 个范畴对较优和较差学生的区分力度也相应较小。所以在该阶段,学生
各种学习风格的平衡发展主要影响了学生在其他方面的表现。另外,无论是对
每一类学生,还是分别对文科理科科目进行分析,各个属性所呈现出来的相互
关系都基本相似,只有影响力大小有略微差别。
认知范畴
学习态度
行为技巧
学习方式视角学生参与组织表达方式学习内容
0.940.560.560.560.560.560.56
0.92
0.870.88
0.950.950.950.950.95
0.59

Appendix 171
171
图 2-2. 根据所有学生在所有课程上初级阶段的表现,各个属性对其他属性的
总影响力分布
请问各位老师,根据您在教学实践中对这 60 名学生的学习情况的了解,
该分析结果是否和您的理解一致?(请从 1-5 打分,1:完全不一致;2:
小部分一致 3:半数一致;4:大部分一致;5:基本一致;)
___________________________________________________________
______
2. 中期阶段-进步潜力
该部分分析了学生取得更大进步的可能潜力。如果学生不仅仅在这 3 个
范畴上的表现良好,并且可以根据老师不同的教学模式,平衡地发展自己的学
习风格,以此来适应各种各样的学习要求和学习环境,那么该学生就具备了较
大的潜力做出更大的进步,并且具备更强的自学能力。对于该类学生,无论老
师设置何种难度的学习活动,或使用何种方式的教学手段,他们都可以取得良
好的表现。相反,对于‘进步潜力’较低的学生,老师应当有针对性的按照其
擅长的学习风格对其进行指导。中期阶段的评估同时也指示了是否该学生是否
按正确的方向发展自己做出进步。
以下 3 图分别是根据学生们的 9 个属性在所有课程,理科,和文科的表现进行
的分析结果。对于每一附图,横坐标表示了学生 ID,左边的纵坐标表示了他们
的相对表现(0:最差;1:最好),右边的纵坐标表示了他们的类别等级(1:
极差;5:优秀)。图中的 3条曲线分别是学生的潜力在 3个范畴的总体表现,
9.03% 11.50%
9.90%
11.73%
11.57%
11.57%
11.57%
11.57%
11.57%
0
0.02
0.04
0.06
0.08
0.1
0.12
0.14
0.16
0.18
0.2
认知范畴
学习态度
行为技巧
学习模式
视角 学生参与态度
组织方式
表达方式
学习内容
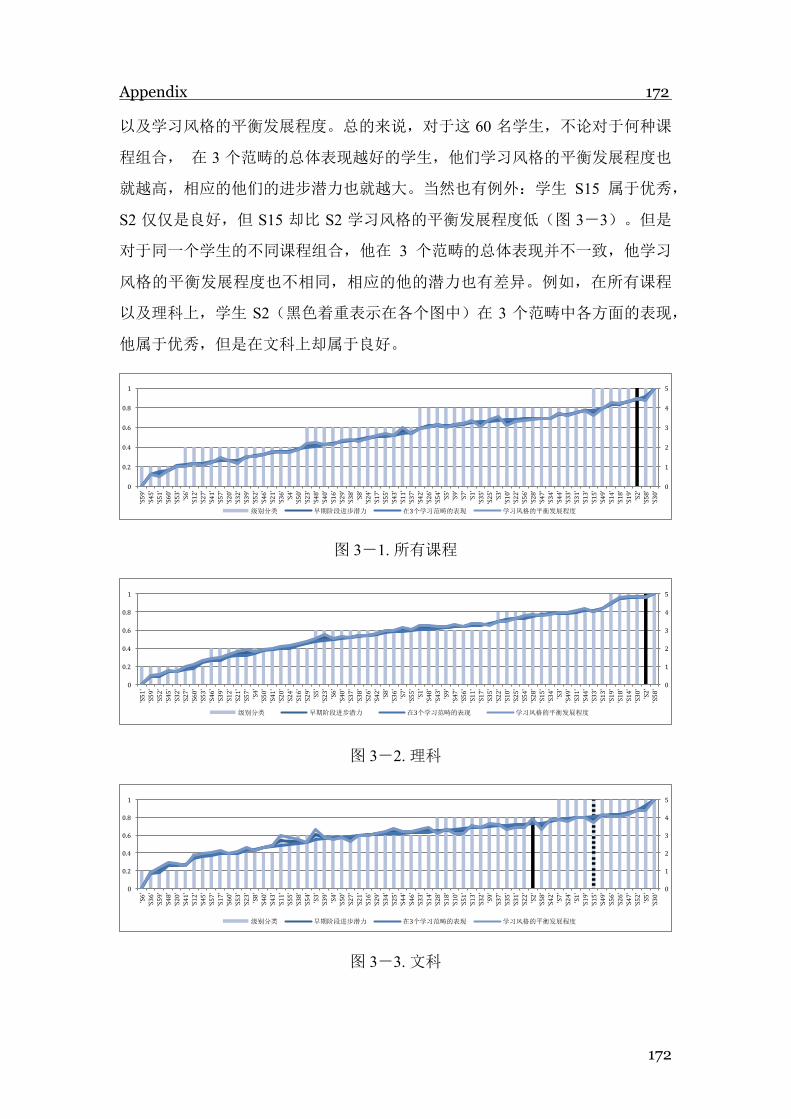
Appendix 172
172
以及学习风格的平衡发展程度。总的来说,对于这 60 名学生,不论对于何种课
程组合, 在 3 个范畴的总体表现越好的学生,他们学习风格的平衡发展程度也
就越高,相应的他们的进步潜力也就越大。当然也有例外:学生 S15 属于优秀,
S2 仅仅是良好,但 S15 却比 S2 学习风格的平衡发展程度低(图 3-3)。但是
对于同一个学生的不同课程组合,他在 3 个范畴的总体表现并不一致,他学习
风格的平衡发展程度也不相同,相应的他的潜力也有差异。例如,在所有课程
以及理科上,学生 S2(黑色着重表示在各个图中)在 3 个范畴中各方面的表现,
他属于优秀,但是在文科上却属于良好。
图 3-1. 所有课程
图 3-2. 理科
图 3-3. 文科
0
1
2
3
4
5
0
0.2
0.4
0.6
0.8
1
'S59'
'S45'
'S51'
'S60'
'S53'
'S6'
'S12'
'S27'
'S41'
'S57'
'S20'
'S32'
'S39'
'S52'
'S46'
'S21'
'S36'
'S4'
'S50'
'S23'
'S48'
'S40'
'S16'
'S29'
'S38'
'S8'
'S24'
'S17'
'S55'
'S43'
'S11'
'S37'
'S42'
'S26'
'S54'
'S5'
'S9'
'S7'
'S1'
'S35'
'S25'
'S3'
'S10'
'S22'
'S56'
'S28'
'S47'
'S34'
'S44'
'S33'
'S31'
'S13'
'S15'
'S49'
'S14'
'S18'
'S19'
'S2'
'S58'
'S30'
级别分类 早期阶段进步潜力 在3个学习范畴的表现 学习风格的平衡发展程度
0
1
2
3
4
5
0
0.2
0.4
0.6
0.8
1
'S51'
'S59'
'S52'
'S45'
'S32'
'S27'
'S60'
'S53'
'S46'
'S39'
'S12'
'S21'
'S57'
'S4'
'S50'
'S41'
'S20'
'S24'
'S16'
'S29'
'S5'
'S23'
'S6'
'S40'
'S37'
'S38'
'S26'
'S42'
'S8'
'S36'
'S7'
'S55'
'S1'
'S48'
'S43'
'S9'
'S47'
'S56'
'S11'
'S17'
'S35'
'S22'
'S10'
'S25'
'S54'
'S28'
'S15'
'S34'
'S3'
'S49'
'S31'
'S44'
'S33'
'S13'
'S19'
'S18'
'S14'
'S30'
'S2'
'S58'
级别分类 早期阶段进步潜力 在3个学习范畴的表现 学习风格的平衡发展程度
0
1
2
3
4
5
0
0.2
0.4
0.6
0.8
1
'S6'
'S36'
'S59'
'S48'
'S20'
'S41'
'S12'
'S45'
'S57'
'S17'
'S60'
'S53'
'S23'
'S8'
'S40'
'S43'
'S11'
'S55'
'S38'
'S54'
'S3'
'S39'
'S4'
'S50'
'S27'
'S21'
'S16'
'S29'
'S34'
'S25'
'S44'
'S46'
'S33'
'S14'
'S28'
'S18'
'S10'
'S51'
'S13'
'S32'
'S9'
'S37'
'S35'
'S31'
'S22'
'S2'
'S58'
'S42'
'S7'
'S24'
'S1'
'S19'
'S15'
'S49'
'S56'
'S26'
'S47'
'S52'
'S5'
'S30'
级别分类 早期阶段进步潜力 在3个学习范畴的表现 学习风格的平衡发展程度

Appendix 173
173
请问各位老师,根据您在教学实践中对这 60 名学生的学习情况的了解,
该分析结果是否和您的理解一致?(请从 1-5 打分,1:完全不一致;2:
小部分一致 3:半数一致;4:大部分一致;5:基本一致;)
___________________________________________________________
______
3. 成熟阶段Mature stage
该阶段包括了衡量学生表现的三个范畴(知识认知,学习态度,和行为
技巧)里的低级别和高级别。特别用于区分优秀学生和一般学生。
知识认知:认识并记忆,理解,应用,分析,综合,创造能力;
学习态度:接受知识,做出响应,评价,组织,形成价值观影响自己的行为;
行为技巧:使用感官线索指导活动的能力,学习前的准备工作,根据指导进行
练习,对所学知识可以灵活运用,所学技能已经熟能生巧,随机应变能力,基
于高度发达技巧创造新的行为模式来解决具体问题。
3.1分类结果
则这 60 名同学的整体分布结果如下图所示:(图 4-1)全部课程;(图 4-2)
理科;(图 4-3)文科。其中,每一类的学生人数都表示在类别后的括号内。
我们可以得出和‘初级阶段’完全相同的结论。可以看出,综合所有科目, 每
一类学生在各个范畴的各个方面都有稳定的表现。同样的规律是:在一个范畴
表现较好的学生,在其他范畴也会有较好的表现。同样的结论适用于理科科目
(图 4-2)和文科科目(图 4-3)。但是在这 3个范畴上,这 60名同学(1)
在理科上的整体表现要普遍好过在文科上的表现;(2)在理科上的差异(两级
分化)明显大于在文科上的差异。不同的是,学生在各个类别上的分布和初级
阶段相比有小小不同。

Appendix 174
174
图 4-1. 所有课程 图 4-2. 理科
图 4-3. 文科
请问各位老师,根据您在教学实践中对这 60 名学生的学习情况的了解,
该分析结果是否和您的理解一致?(请从 1-5 打分,1:完全不一致;2:
小部分一致 3:半数一致;4:大部分一致;5:基本一致;)
___________________________________________________________
______
3.2成熟阶段-进步潜力
类似于第 2 节中中级阶段的分析,以下 3 图分别是根据学生们的 9 个属性在所
有课程,理科,和文科的表现进行的分析结果。对于每一幅图,横坐标表示了
学生 ID,左边的纵坐标表示了他们的相对表现(0:最差;1:最好),右边的
纵坐标表示了他们的类别等级(1:极差;5:优秀)。图中的 3 条曲线分别是
学生的潜力在 3 个范畴的总体表现,以及学习风格的平衡发展程度。同初级阶
0
0.1
0.2
0.3
0.4
0.5
0.6
0.7
0.8
0.9
1
1 2 3 4 5 6 1 2 3 4 5 1 2 3 4 5 6 7
认知范畴 学习态度 行为技巧
优秀 (7)
良好 (21)
中等 (14)
较差(13)
极差 (5)
0
0.1
0.2
0.3
0.4
0.5
0.6
0.7
0.8
0.9
1
1 2 3 4 5 6 1 2 3 4 5 1 2 3 4 5 6 7
认知范畴 学习态度 行为技巧
优秀 (6)
良好 (13)
中等 (20)
较差(13)
极差 (8)
0
0.1
0.2
0.3
0.4
0.5
0.6
0.7
0.8
0.9
1
1 2 3 4 5 6 1 2 3 4 5 1 2 3 4 5 6 7
认知范畴 学习态度 行为技巧
优秀 (12)
良好 (13)
中等 (16)
较差(13)
极差 (6)

Appendix 175
175
段的分析结果基本相似,不同之处在于对学生的分类结果有略微差异,其中有
9 名学生的潜略有提高,另外 8 名学生的潜能略有下降。总的来说,对于这 60
名学生,不论对于何种课程组合, 在 3 个范畴的总体表现越好的学生,他们学
习风格的平衡发展程度也就越高,相应的他们的进步潜力也就越大。当然也有
例外:学生 S15比学生 S2在 3个范畴的总体表现更好,但 S15却比 S2学习风
格的平衡发展程度更低(图 3-3)。但是对于同一个学生的不同课程组合,他
们在 3 个范畴的总体表现并不一致,他们学习风格的平衡发展程度也不相同,
相应的他们的潜力也有差异。例如,根据学生 S2(黑色着重表示在各个图中)
3 个范畴中各方面在所有课程以及理科上的表现,他属于优秀,但是在文科上
却属于良好。
图 5-1. 所有课程
图 5-2. 理科
0
1
2
3
4
5
0
0.2
0.4
0.6
0.8
1
'S59'
'S45'
'S51'
'S60'
'S53'
'S12'
'S6'
'S27'
'S32'
'S20'
'S41'
'S57'
'S52'
'S39'
'S46'
'S21'
'S4'
'S36'
'S50'
'S23'
'S48'
'S40'
'S16'
'S29'
'S38'
'S8'
'S24'
'S55'
'S17'
'S43'
'S37'
'S11'
'S42'
'S26'
'S5'
'S9'
'S7'
'S54'
'S1'
'S35'
'S25'
'S10'
'S3'
'S22'
'S56'
'S47'
'S34'
'S28'
'S33'
'S44'
'S31'
'S13'
'S15'
'S49'
'S14'
'S18'
'S19'
'S2'
'S58'
'S30'
级别分类 成熟阶段进步潜力 在3个学习范畴的表现 学习风格的平衡发展程度
0
1
2
3
4
5
0
0.2
0.4
0.6
0.8
1
'S51'
'S59'
'S52'
'S45'
'S32'
'S27'
'S60'
'S53'
'S46'
'S39'
'S12'
'S21'
'S4'
'S57'
'S50'
'S41'
'S20'
'S24'
'S16'
'S29'
'S5'
'S6'
'S40'
'S23'
'S37'
'S38'
'S26'
'S42'
'S36'
'S8'
'S7'
'S55'
'S48'
'S1'
'S9'
'S43'
'S56'
'S47'
'S11'
'S17'
'S35'
'S22'
'S10'
'S25'
'S54'
'S28'
'S15'
'S34'
'S3'
'S49'
'S31'
'S33'
'S44'
'S13'
'S19'
'S18'
'S14'
'S30'
'S2'
'S58'
级别分类 成熟阶段进步潜力 在3个学习范畴的表现 学习风格的平衡发展程度
0
1
2
3
4
5
0
0.2
0.4
0.6
0.8
1
'S6'
'S36'
'S59'
'S48'
'S20'
'S41'
'S12'
'S45'
'S57'
'S53'
'S60'
'S17'
'S23'
'S8'
'S40'
'S11'
'S43'
'S55'
'S38'
'S54'
'S3'
'S39'
'S50'
'S4'
'S21'
'S27'
'S16'
'S25'
'S34'
'S29'
'S44'
'S46'
'S33'
'S14'
'S28'
'S18'
'S10'
'S51'
'S13'
'S32'
'S9'
'S37'
'S22'
'S31'
'S35'
'S2'
'S58'
'S42'
'S7'
'S1'
'S24'
'S19'
'S49'
'S15'
'S26'
'S56'
'S47'
'S52'
'S5'
'S30'
级别分类 早期阶段进步潜力 在3个学习范畴的表现 学习风格的平衡发展程度

Appendix 176
176
图 5-3. 文科
请问各位老师,根据您在教学实践中对这 60 名学生的学习情况的了解,
该分析结果是否和您的理解一致?(请从 1-5 打分,1:完全不一致;2:
小部分一致 3:半数一致;4:大部分一致;5:基本一致;)
___________________________________________________________
______
3.3 各个属性间的关系
同 1.2 中所描述的实验相似,一个属性的变化(进步或退步)会影响到其他属
性的变化(进步或退步),所以我们根据学生在‘成熟阶段’的表现,同样分
析了这 9 个属性的相互关系。综合各门课程,60 名学生在初级阶段所呈现出来
的 9 个属性的相互关系如图 6 所示。行为技巧成为了核心属性,它分别和学习
态度,认知范畴相互影响。而同时,由于学生的学习风格反应了学生学习行为
的各方面特点,所以学习风格中任何一个属性的变化都可以影响到学生在行为
技巧方面的表现。
图 6. 根据所有学生在所有课程上成熟阶段的表现,各个属性之间的相互影响
而根据所有学生在所有课程上成熟阶段的表现,图 7 给出了各个属性对其他属
性的总影响力的分布情况。明显在成熟阶段,学生的行为技巧成为了对其他属
性影响力最大的属性。而其他属性都基本上有着相等的影响力。另外,无论是
对每一类学生,还是分别对文科理科科目进行分析,各个属性所呈现出来的相
互关系都基本相似,只有影响力大小有略微差别。
认知范畴学习态度 行为技巧
学习方式视角学生参与组织表达方式学习内容
0.590.590.590.590.590.59
0.960.92
0.390.92

Appendix 177
177
图 7. 根据所有学生在所有课程上成熟阶段的表现,各个属性对其他属性的总影
响力分布
请问各位老师,根据您在教学实践中对这 60 名学生的学习情况的了解,
该分析结果是否和您的理解一致?(请从 1-5 打分,1:完全不一致;2:
小部分一致 3:半数一致;4:大部分一致;5:基本一致;)
___________________________________________________________
______
11.22%
10.49%
14.19%
10.68%
10.69%
10.69%
10.69%
10.69%
10.68%
0
0.04
0.08
0.12
0.16
0.2
认知范畴
学习态度
行为技巧
学习模式
视角 学生参与态度
组织方式
表达方式
学习内容

Appendix 178
178
Appendix C
Questionnaire: Analysis results for student S2
提供给学生的分析结果
本次实验分析的课程包括:数学,物理,化学,政治,历史,和英语。其中视
前 3 门为理科科目,后 3 门为文科科目。基于上次从各位老师那里收集来得数
据,各位老师分别根据衡量学生表现的三个范畴(知识认知,学习态度,和行
为技巧)给出了自己的教学要求,我们基于这些方面,对学生进行评估,并将
其表现在刻度 0 到 1 范围内划分为 5 个等级:极差,较差,中等,良好,以及
优秀。
1. 学习的初级阶段
该阶段包括了衡量学生表现的三个范畴(知识认知,学习态度,和行为
技巧)里的几个较低级别,为一般情况下老师用到的衡量级别。
知识认知:认识并记忆,理解,应用;
学习态度:接受知识,做出响应;
行为技巧:使用感官线索指导活动的能力,学习前的准备工作,根据指导进行
练习。
1.1分类结果
综合所有课程(图 1-1),学生 S2 在 3 个范畴的各个方面的表现被归为‘优
秀’,并且他的各个方面还略高于优秀生的平均水平,远高于老师对学生的最
低要求。
综合理科课程(图 1-2),学生 S2 在 3 个范畴的各个方面的表现被归为‘优
秀’,并且他的各个方面几乎和优秀生的平均水平保持一致,远高于老师对学
生的最低要求。

Appendix 179
179
综合文科课程(图 1-3),学生 S2 在 3 个范畴的各个方面的表现被归为‘良
好’,并且他的各个方面还略高于良好生的平均水平,甚至某些方面还可以达
到‘优秀生’的水平,同时也高于老师对学生的最低要求。
图 1-1. 所有课程 图 1-2. 理科
图 1-3. 文科
请问如果您是学生 S2,该分析结果能否帮助您更好的理解自己的学习情
况?(请从 1-5 打分,1:完全不清楚自己的学习情况;2:不太清楚自
己的学习情况 3:只了解到了一般情况;4:还比较清楚的了解了自己的
学习情况;5:清楚的了解自己的学习情况;)
__________________________________________________________
_____
1.2 各个属性间的关系
0
0.2
0.4
0.6
0.8
1
1 2 3 1 2 1 2 3
认知范畴 学习态度 行为技巧
优秀 (8) 学生S2 (优秀) 最低要求
0
0.2
0.4
0.6
0.8
1
1 2 3 1 2 1 2 3
认知范畴 学习态度 行为技巧
优秀 (6) 学生S2 (优秀) 最低要求
0
0.2
0.4
0.6
0.8
1
1 2 3 1 2 1 2 3
认知范畴 学习态度 行为技巧
优秀 (12) 良好 (14)
学生S2 (优秀) 最低要求

Appendix 180
180
根据上次的问卷调查,我们不仅仅收集了各位老师在知识,学习态度,行为技
巧 3 个范畴的教学要求,以及学生的参与模式(同学合作或单人作业)同时也
收集了各位老师在学习内容(具体或抽象),表达方式(视觉表达或口头表
达),知识组织方式(归纳/收敛知识,或演绎/发散知识),学生参与态度
(主动或被动),教学顺序(从前到后一步一步教授知识,或从整体到细节教
授知识)5 个方面所形成的教学风格。我们相信,一个属性的变化(进步或退
步)会影响到其他属性的变化(进步或退步),所以我们根据学生的表现,分
析了这 9个属性的相互关系。
综合各门课程,学生 S2 在初级阶段所呈现出来的 9 个属性的相互关系如图 2-
1 所示,每一个节点表示一个熟悉,箭头表示出发节点对终止节点有影响,箭
头上的权重表示一个属性对其他属性影响的相对大小(权值 0 为无影响,权值
1 为影响最大)。可以发现学生的认知范畴,学习态度,和行为技巧 3 者之间
是相互影响的,任何一个的进步都会引起另外 2 个属性的进步。而学生的学习
风格的平衡发展又会直接影响到学生认知范畴和行为技巧的表现。其中学习风
格的平衡度对认知范畴的影响作用要大于对行为技巧的影响作用。
图 2-1. 学生 S2在初级阶段所呈现出来的 9个属性的相互关系
初级阶段综合所有课程,学生 S2 各个属性的总影响力分布如图 2-2 所示。另
外给出了优秀生和所有学生的情况作为参考。因为初级阶段只衡量了学生的初
级能力,所以衡量这 3 个范畴对较优和较差学生的区分力度也相对较小。所以
在该阶段,学生各种学习风格的平衡发展主要影响了学生在其他方面的表现。
另外,无论是对每一类学生,还是分别对文科理科科目进行分析,各个属性所
呈现出来的相互关系都基本相似,只有影响力大小有略微差别。
认知范畴
学习态度
行为技巧
学习方式视角学生参与组织表达方式学习内容
10.680.650.650.650.650.65
1
1
11111
0.62
1
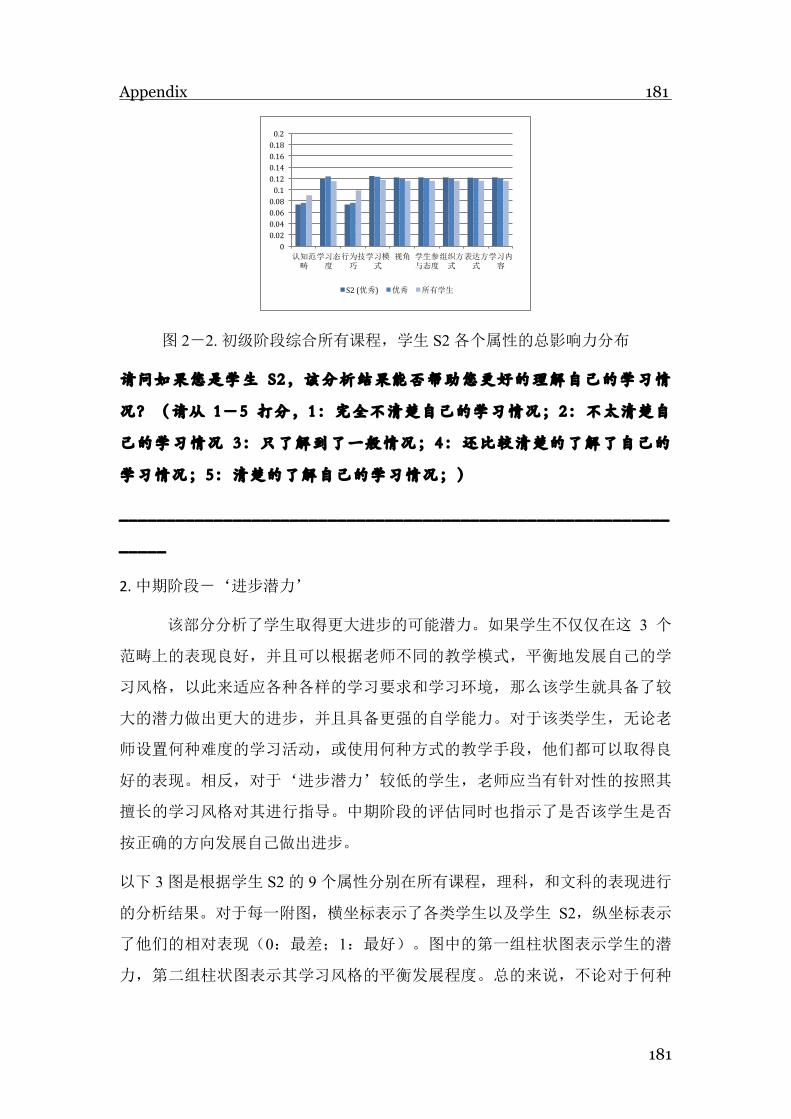
Appendix 181
181
图 2-2. 初级阶段综合所有课程,学生 S2各个属性的总影响力分布
请问如果您是学生 S2,该分析结果能否帮助您更好的理解自己的学习情
况?(请从 1-5 打分,1:完全不清楚自己的学习情况;2:不太清楚自
己的学习情况 3:只了解到了一般情况;4:还比较清楚的了解了自己的
学习情况;5:清楚的了解自己的学习情况;)
__________________________________________________________
_____
2. 中期阶段-‘进步潜力’
该部分分析了学生取得更大进步的可能潜力。如果学生不仅仅在这 3 个
范畴上的表现良好,并且可以根据老师不同的教学模式,平衡地发展自己的学
习风格,以此来适应各种各样的学习要求和学习环境,那么该学生就具备了较
大的潜力做出更大的进步,并且具备更强的自学能力。对于该类学生,无论老
师设置何种难度的学习活动,或使用何种方式的教学手段,他们都可以取得良
好的表现。相反,对于‘进步潜力’较低的学生,老师应当有针对性的按照其
擅长的学习风格对其进行指导。中期阶段的评估同时也指示了是否该学生是否
按正确的方向发展自己做出进步。
以下 3图是根据学生 S2的 9个属性分别在所有课程,理科,和文科的表现进行
的分析结果。对于每一附图,横坐标表示了各类学生以及学生 S2,纵坐标表示
了他们的相对表现(0:最差;1:最好)。图中的第一组柱状图表示学生的潜
力,第二组柱状图表示其学习风格的平衡发展程度。总的来说,不论对于何种
0 0.02 0.04 0.06 0.08 0.1 0.12 0.14 0.16 0.18 0.2
认知范畴
学习态度
行为技巧
学习模式
视角 学生参与态度
组织方式
表达方式
学习内容
S2 (优秀) 优秀 所有学生

Appendix 182
182
课程组合, 在 3 个范畴的总体表现越好的学生,他们学习风格的平衡发展程度
也就越高,相应的他们的进步潜力也就越大。但是对于同一个学生的不同课程
组合,他在 3 个范畴的总体表现并不一致,他学习风格的平衡发展程度也不相
同,相应的他们的潜力也有差异。在所有课程以及理科上,学生 S2在 3个范畴
中各方面的表现属于优秀,但是在文科上却属于良好。
图 3-1. 所有课程
图 3-2. 理科 图 3-3. 文科
请问如果您是学生 S2,该分析结果能否帮助您更好的理解自己的学习情
况?(请从 1-5 打分,1:完全不清楚自己的学习情况;2:不太清楚自
己的学习情况 3:只了解到了一般情况;4:还比较清楚的了解了自己的
学习情况;5:清楚的了解自己的学习情况;)
__________________________________________________________
_____
0
0.2
0.4
0.6
0.8
1
Disquali^ied Below Average
Satisfactory Good Best S2' (Best)
Potential Balance Degree
0
0.2
0.4
0.6
0.8
1
Disquali^ied Below Average
Satisfactory Good Best S2' (Good)
Potential Balance Degree
0
0.2
0.4
0.6
0.8
1
Disquali^ied Below Average
Satisfactory Good Best S2' (Best)
Potential Balance Degree

Appendix 183
183
3. 成熟阶段Mature stage
该阶段包括了衡量学生表现的三个范畴(知识认知,学习态度,和行为
技巧)里的低级别和高级别。特别用于区分优秀学生和一般学生。
知识认知:认识并记忆,理解,应用,分析,综合,创造能力;
学习态度:接受知识,做出响应,评价,组织,形成价值观影响自己的行为;
行为技巧:使用感官线索指导活动的能力,学习前的准备工作,根据指导进行
练习,对所学知识可以灵活运用,所学技能已经熟能生巧,随机应变能力,基
于高度发达技巧创造新的行为模式来解决具体问题。
3.1分类结果
学生 S2成熟阶段的整体分布结果如下图所示:(图 4-1)全部课程;(图 4-
2)理科;(图 4-3)文科。其中,一类的学生人数都表示在类别后的括号内。
我们可以得出和‘初级阶段’完全相同的结论。可以看出,综合所有科目, 每
一类学生在各个范畴的各个方面都有稳定的表现。在一个范畴表现较好的学生,
在其他范畴也会有较好的表现。同样的结论适用于理科科目(图 4-2)和文科
科目(图 4-3)。但是在这 3 个范畴上,学生 S2 在理科上的整体表现要普遍
好过在文科上的表现。根据所有课程以及理科课程,S2 都是优秀生,但是根据
文科课程,虽然这 3 个范畴的部分方面他还是可以达到优秀生的水平,却也在
学习态度范畴的最高等级这一方面被划分为中等,所以总的来说他在这 3 个范
畴上的表现只能算是良好。
图 4-1. 所有课程 图 4-2. 理科
0
0.2
0.4
0.6
0.8
1
1 2 3 4 5 6 1 2 3 4 5 1 2 3 4 5 6 7
认知范畴 学习态度 行为技巧
优秀 (7) 最低要求 S2(优秀)
0
0.2
0.4
0.6
0.8
1
1 2 3 4 5 6 1 2 3 4 5 1 2 3 4 5 6 7
认知范畴 学习态度 行为技巧
优秀 (6) 最低要求 S2(优秀)

Appendix 184
184
图 4-3. 文科
请问如果您是学生 S2,该分析结果能否帮助您更好的理解自己的学习情
况?(请从 1-5 打分,1:完全不清楚自己的学习情况;2:不太清楚自
己的学习情况 3:只了解到了一般情况;4:还比较清楚的了解了自己的
学习情况;5:清楚的了解自己的学习情况;)
__________________________________________________________
_____
3.2成熟阶段-进步潜力
类似于第 2 节中中级阶段的分析,成熟阶段同初级阶段的分析结果相似,在此
不再赘述。总的来说,S2 仍属于优秀生。学生 S2 在 3 个范畴中各方面在所有
课程以及理科上的表现属于优秀,但是在文科上却属于良好。
请问如果您是学生 S2,该分析结果能否帮助您更好的理解自己的学习情
况?(请从 1-5 打分,1:完全不清楚自己的学习情况;2:不太清楚自
己的学习情况 3:只了解到了一般情况;4:还比较清楚的了解了自己的
学习情况;5:清楚的了解自己的学习情况;)
__________________________________________________________
_____
3.3 各个属性间的关系
0
0.2
0.4
0.6
0.8
1
1 2 3 4 5 6 1 2 3 4 5 1 2 3 4 5 6 7
认知范畴 学习态度 行为技巧
优秀 (12) 良好 (13) 中等 (16) S2 (良好) 最低要求

Appendix 185
185
同 1.2 中所描述的实验相似,一个属性的变化(进步或退步)会影响到其他属
性的变化(进步或退步),所以我们根据学生 S2在‘成熟阶段’的表现,同样
分析了这 9个属性的相互关系。综合各门课程,学生 S2在初级阶段所呈现出来
的 9 个属性的相互关系如图 5 所示。行为技巧成为了核心属性,它分别和学习
态度,认知范畴相互影响。而同时,由于学生的学习风格反应了学生学习行为
的各方面特点,所以学习风格中任何一个属性的变化都可以影响到学生在行为
技巧方面的表现。
图 5. 根据学生 S2在所有课程上成熟阶段的表现,各个属性之间的相互影响
而根据学生 S2 在所有课程上成熟阶段的表现,图 6 比较了 S2,优秀生,以及
所有学生的各个属性对其他属性的总影响力的分布情况。明显在成熟阶段,S2
的行为技巧成为了对其他属性影响力最大的属性。而其他属性都基本上有着相
等的影响力。另外,无论是对每一类学生,还是分别对文科理科科目进行分析,
各个属性所呈现出来的相互关系都基本相似,只有影响力大小有略微差别。
图 6. 成熟阶段,根据学生 S2在所有课程上的表现,其各个属性对其他属性的
总影响力分布
请问如果您是学生 S2,该分析结果能否帮助您更好的理解自己的学习情
况?(请从 1-5 打分,1:完全不清楚自己的学习情况;2:不太清楚自
认知范畴学习态度 行为技巧
学习方式视角学生参与组织表达方式学习内容
111111
11
0.421
0 0.02 0.04 0.06 0.08 0.1 0.12 0.14 0.16 0.18 0.2
认知范畴
学习态度
行为技巧
学习模式
视角 学生参与态度
组织方式
表达方式
学习内容
S2 (优秀) 优秀 所有学生

Appendix 186
186
己的学习情况 3:只了解到了一般情况;4:还比较清楚的了解了自己的
学习情况;5:清楚的了解自己的学习情况;)
__________________________________________________________
_____

Appendix 187
187
Appendix D– Vitae
I received my Bachelor degree in Communication Engineering from
Northwesten Polytechnical University in 2007, and then I spent my
postgraduate study of MSc. in Information and Communication Engineering
in National University of Defense Technology. I have been a PhD candidate in
School of Engineering and Computing Sciences, Durham University since
Nov. 2008.
Publications
1. Fan Yang, Frederick Li, Rynson Lau, “A Fine-Grained Outcome-based
Learning Path Model”, IEEE Transactions on SMC: Systems, (To be
published), 2014.
2. Fan Yang, Frederick Li, Rynson Lau, “Association Link Network based
Automatic Test Generation Scheme”, Learning Technology for Education
in Cloud, (To be published), Taiwan, Sept. 2013.
3. Fan Yang, Frederick Li, Rynson Lau, " Learning Path Construction based
on Association Link Network", Proceedings of International Conference
on Web-based Learning, LNCS 7558, pp. 120–131, Sept.2012.
4. Fan Yang, Frederick Li, Rynson Lau, "Fuzzy Cognitive Map based Student
Progress Indicators", Proceedings of International Conference on Web-
based Learning, pp. 174-181, Dec.2011.
5. Fan Yang, Frederick Li, Rynson Lau, "An Open Model for Learning Path
Construction", pp. 318-328, Proceedings of International Conference on
Web-based Learning, Dec. 2010. (ICWL 2010 Best Student Paper
Award)
6. Fan Yang, Frederick Li, "Active Contour Projection for Multimedia
Application", Journal of Multimedia, 6(2): 170-180, 2010.
7. Fan Yang, Frederick Li, Rynson Lau, "Active Contour Projection for Mesh

Appendix 188
188
Segmentation", Proceedings of IEEE Joint Conferences on Pervasive
Computing (JCPC), pp.865-874, Dec. 2009.
![Personalized Learning Path Generation Approach … Learning Path Generation Approach ... learner-customized tutorial lessons, ... (CAT) theory [16] through a conscientiousAuthors:](https://static.fdocuments.us/doc/165x107/5b0640877f8b9ac33f8c8f94/personalized-learning-path-generation-approach-learning-path-generation-approach.jpg)