
Learning Objectives
51
Learning Objectives In this chapter, you will learn: How statistics is used in business The sources of data used in business The types of data used in business The basics of Microsoft Excel
-
Upload
tasha-fowler -
Category
Documents
-
view
23 -
download
2
description
Learning Objectives. In this chapter, you will learn: How statistics is used in business The sources of data used in business The types of data used in business The basics of Microsoft Excel. Why Study Statistics?. Decision Makers Use Statistics To: - PowerPoint PPT Presentation
Transcript of Learning Objectives

Learning Objectives
In this chapter, you will learn:
How statistics is used in business The sources of data used in business The types of data used in business The basics of Microsoft Excel
Why Study Statistics?
Decision Makers Use Statistics To:
Present and describe business data and information properly
Draw conclusions about large populations, using information collected from samples
Make reliable forecasts about a business activity Improve business processes
Types of Statistics
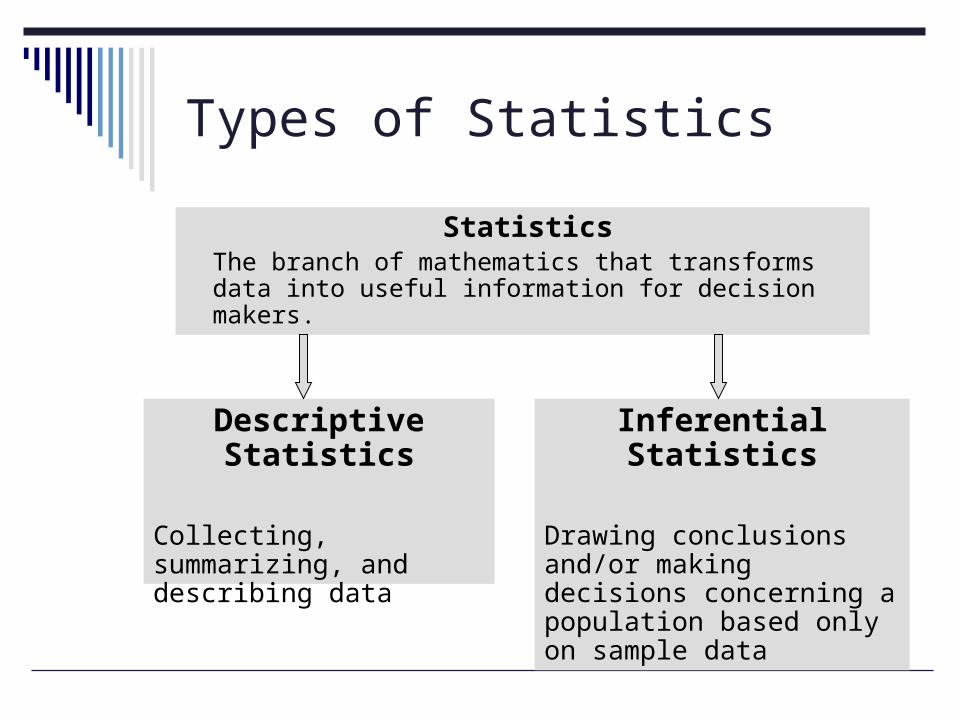
Statistics The branch of mathematics that transforms data
into useful information for decision makers.
Descriptive Statistics
Collecting, summarizing, and describing data
Inferential Statistics
Drawing conclusions and/or making decisions concerning a population based only on sample data
Specific numbernumerical measurement determined by a set
of data
Example: Twenty-three percent of people polled believed that there are too many polls.
Statistics

Descriptive Statistics
Collect data ex. Survey
Present data ex. Tables and graphs
Characterize data ex. Sample mean = iX
n∑
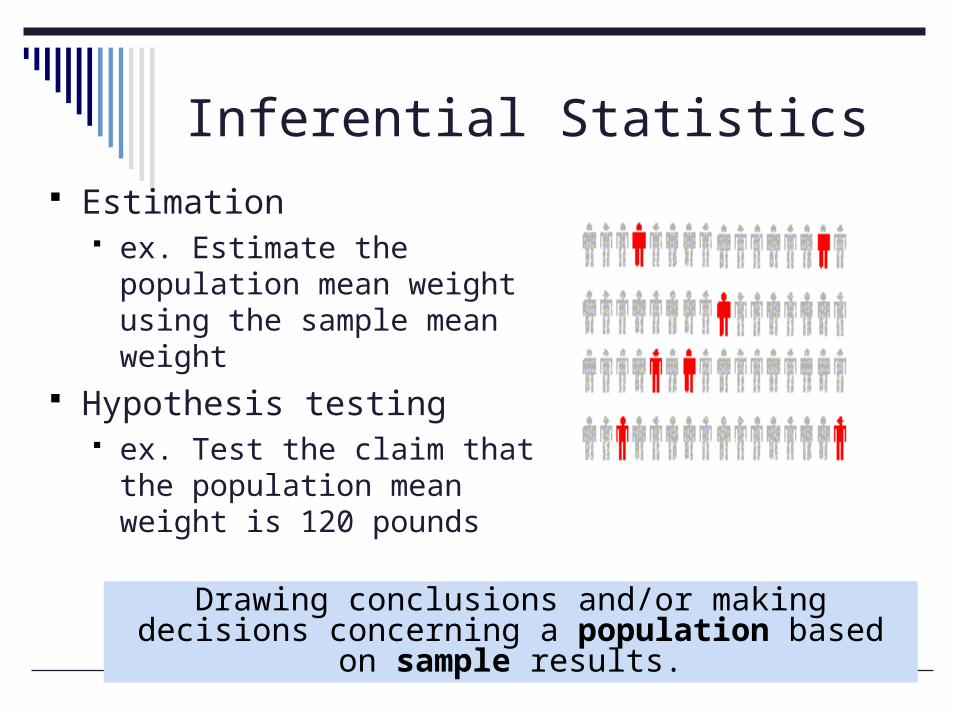
Inferential Statistics
Estimation ex. Estimate the population
mean weight using the sample mean weight
Hypothesis testing ex. Test the claim that the
population mean weight is 120 pounds
Drawing conclusions and/or making decisions concerning a population based on sample results.
Method of analysisa collection of methods for planning
experiments, obtaining data, and then
then organizing, summarizing, presenting,
analyzing, interpreting, and drawing
conclusions based on the data
Statistics

Basic Vocabulary of Statistics
VARIABLEA variable is a characteristic of an item or individual.
DATAData are the different values associated with a variable.
OPERATIONAL DEFINITIONSVariable values are meaningless unless their variables have operational definitions, universally accepted meanings that are
clear to all associated with an analysis.
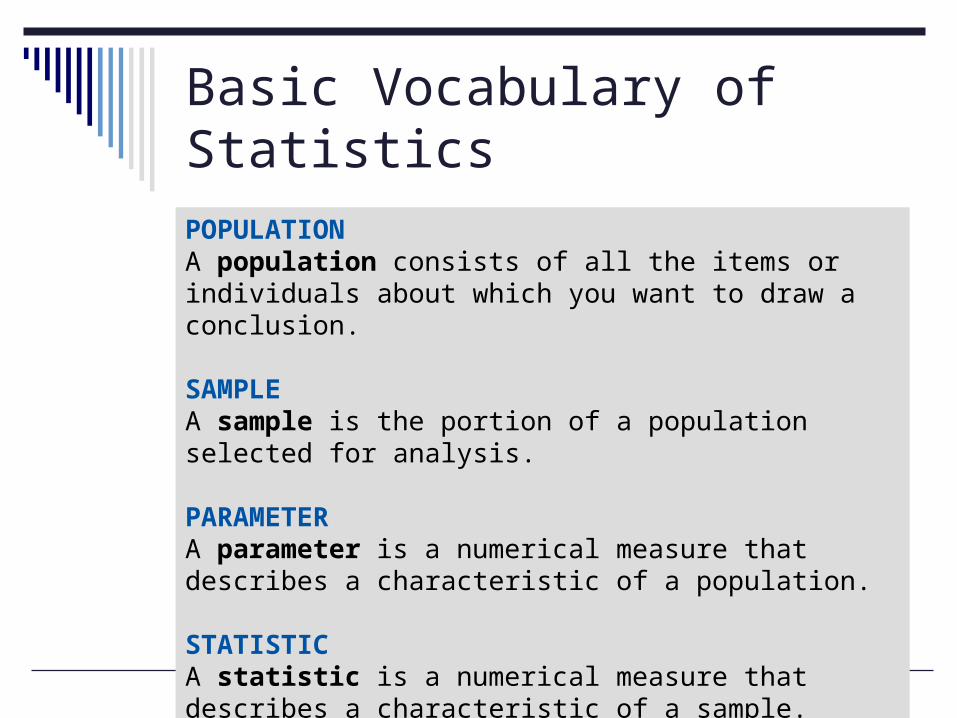
Basic Vocabulary of Statistics
POPULATIONA population consists of all the items or individuals about which you want to draw a conclusion.
SAMPLEA sample is the portion of a population selected for analysis.
PARAMETERA parameter is a numerical measure that describes a characteristic of a population.
STATISTICA statistic is a numerical measure that describes a characteristic of a sample.
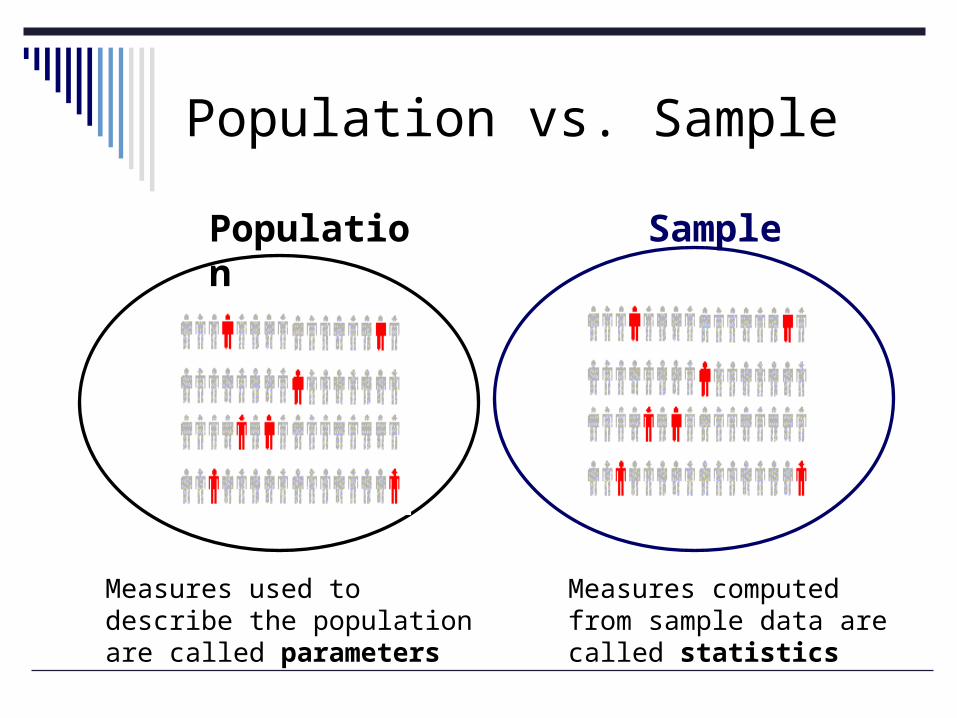
Population vs. Sample
Population Sample
Measures used to describe the population are called parameters
Measures computed from sample data are called statistics
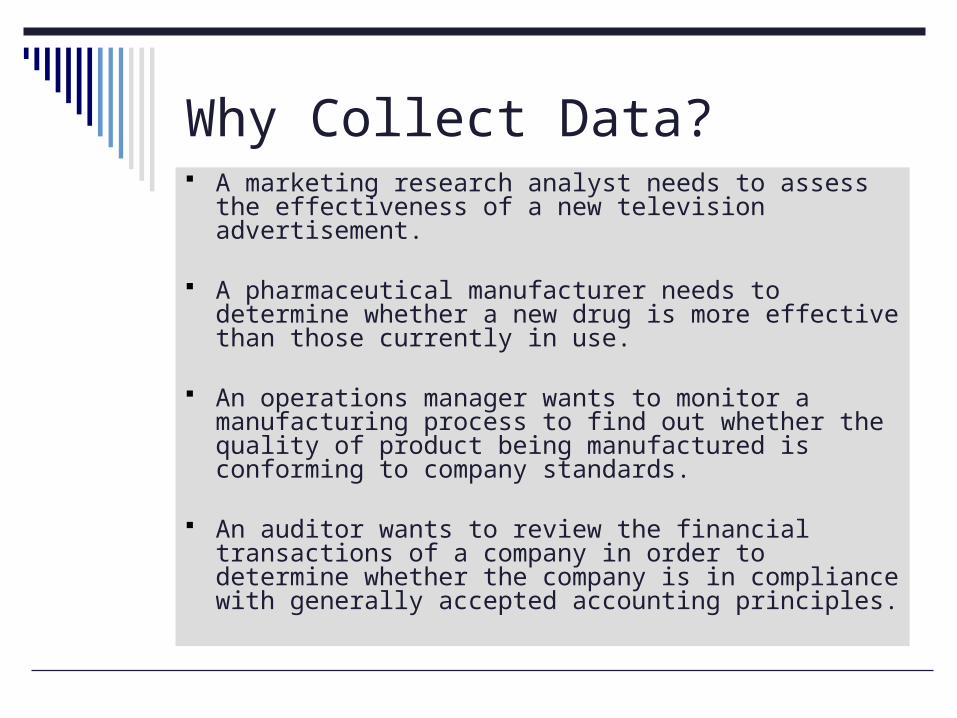
Why Collect Data? A marketing research analyst needs to assess the
effectiveness of a new television advertisement.
A pharmaceutical manufacturer needs to determine whether a new drug is more effective than those currently in use.
An operations manager wants to monitor a manufacturing process to find out whether the quality of product being manufactured is conforming to company standards.
An auditor wants to review the financial transactions of a company in order to determine whether the company is in compliance with generally accepted accounting principles.
Sources of Data
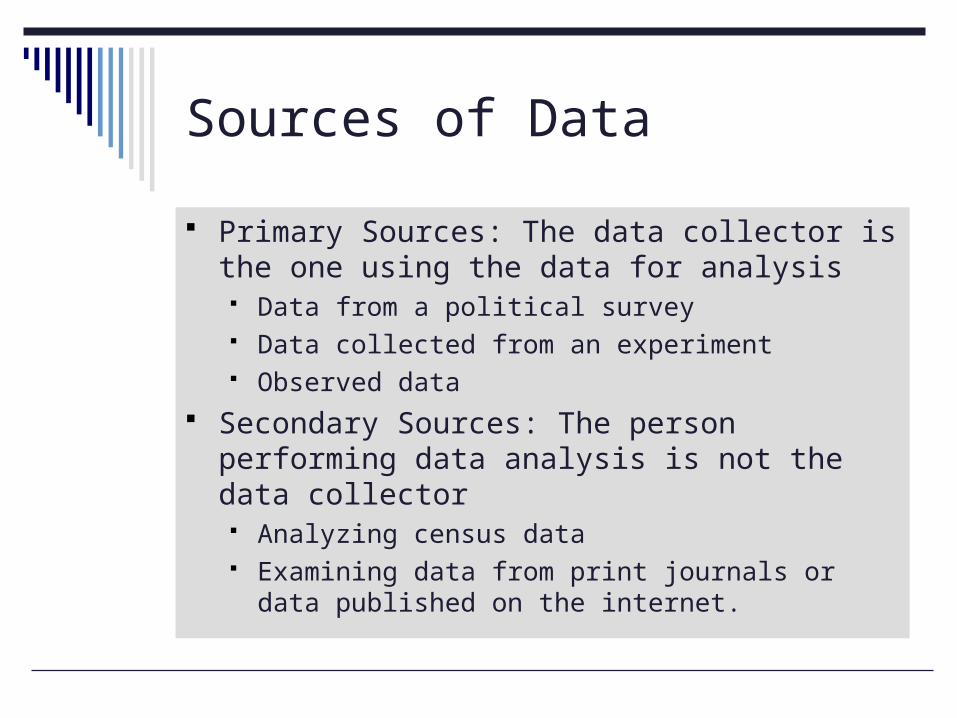
Primary Sources: The data collector is the one using the data for analysis Data from a political survey Data collected from an experiment Observed data
Secondary Sources: The person performing data analysis is not the data collector Analyzing census data Examining data from print journals or data published on
the internet.
Types of Variables
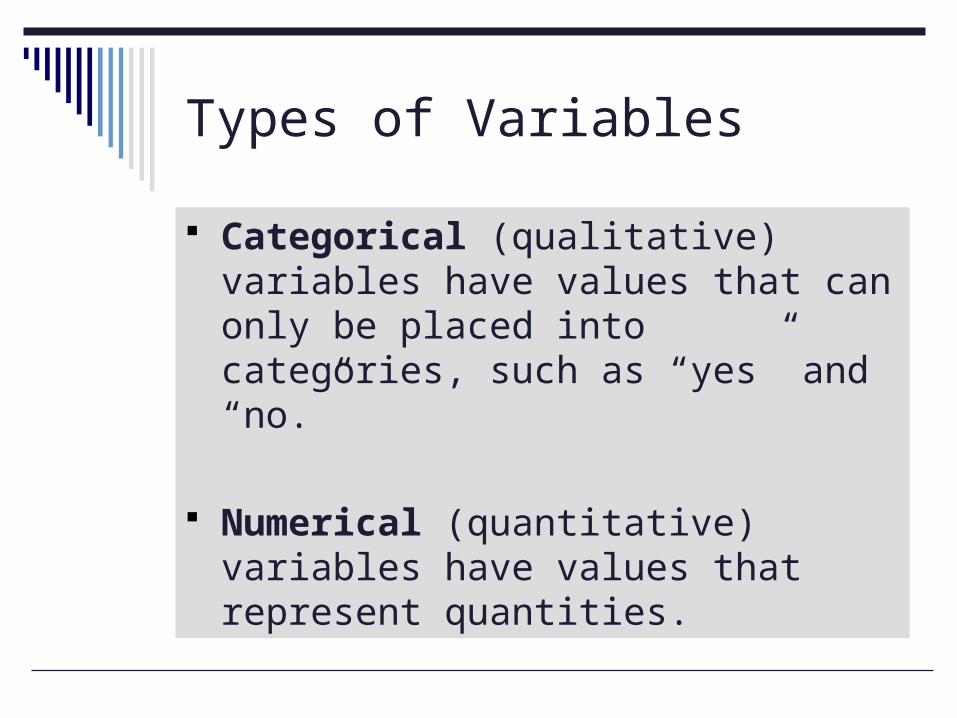
Categorical (qualitative) variables have values that can only be placed into categories, such as “yes” and “no.”
Numerical (quantitative) variables have values that represent quantities.
Types of Variables
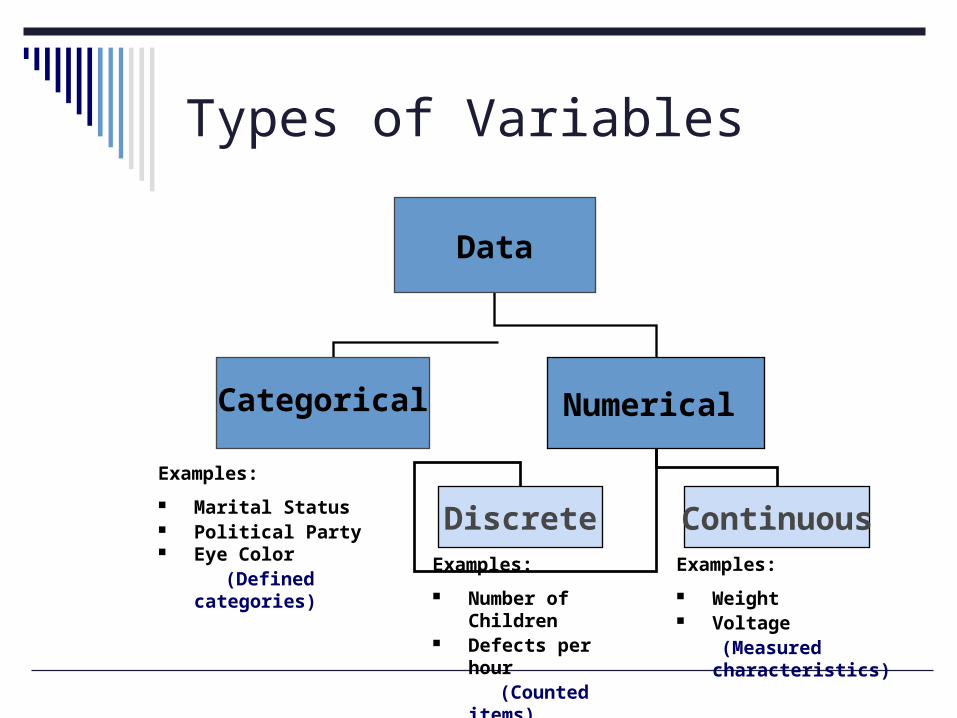
Data
Categorical Numerical
Discrete Continuous
Examples:
Marital Status Political Party Eye Color (Defined categories)
Examples:
Number of Children Defects per hour (Counted items)
Examples:
Weight Voltage (Measured
characteristics)
Levels of Measurement
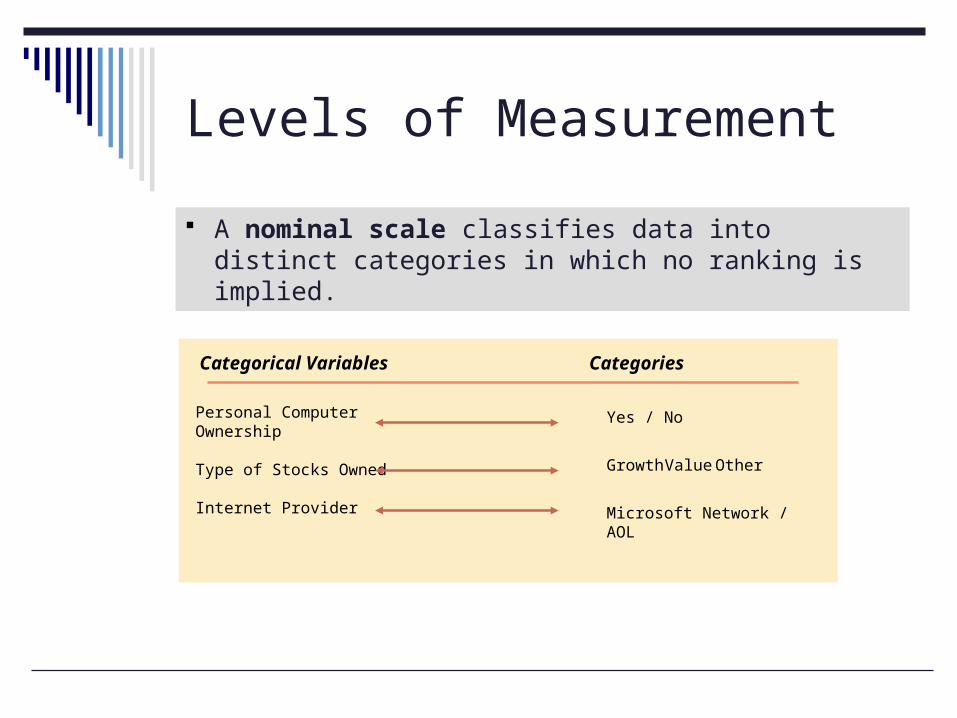
A nominal scale classifies data into distinct categories in which no ranking is implied.
Categorical Variables Categories
Personal Computer Ownership
Type of Stocks Owned
Internet Provider
Yes / No
Microsoft Network / AOL
Growth Value Other
Levels of Measurement
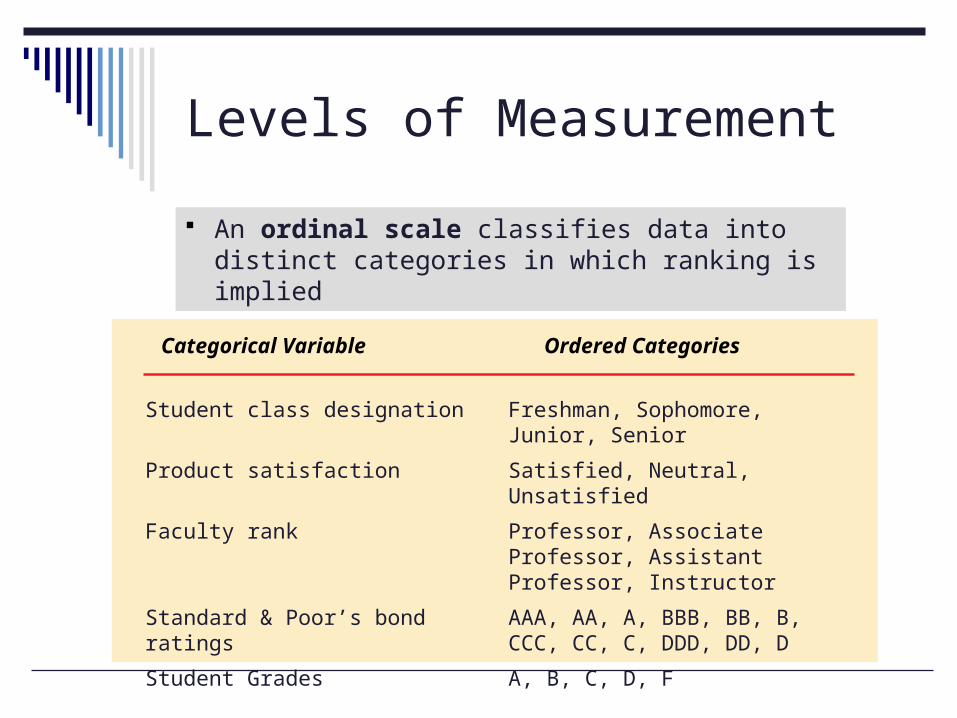
An ordinal scale classifies data into distinct categories in which ranking is implied
Categorical Variable Ordered Categories
Student class designation Freshman, Sophomore, Junior, Senior
Product satisfaction Satisfied, Neutral, Unsatisfied
Faculty rank Professor, Associate Professor, Assistant Professor, Instructor
Standard & Poor’s bond ratings AAA, AA, A, BBB, BB, B, CCC, CC, C, DDD, DD, D
Student Grades A, B, C, D, F
Levels of Measurement
An interval scale is an ordered scale in which the difference between measurements is a meaningful quantity but the measurements do not have a true zero point.
A ratio scale is an ordered scale in which the difference between the measurements is a meaningful quantity and the measurements have a true zero point.
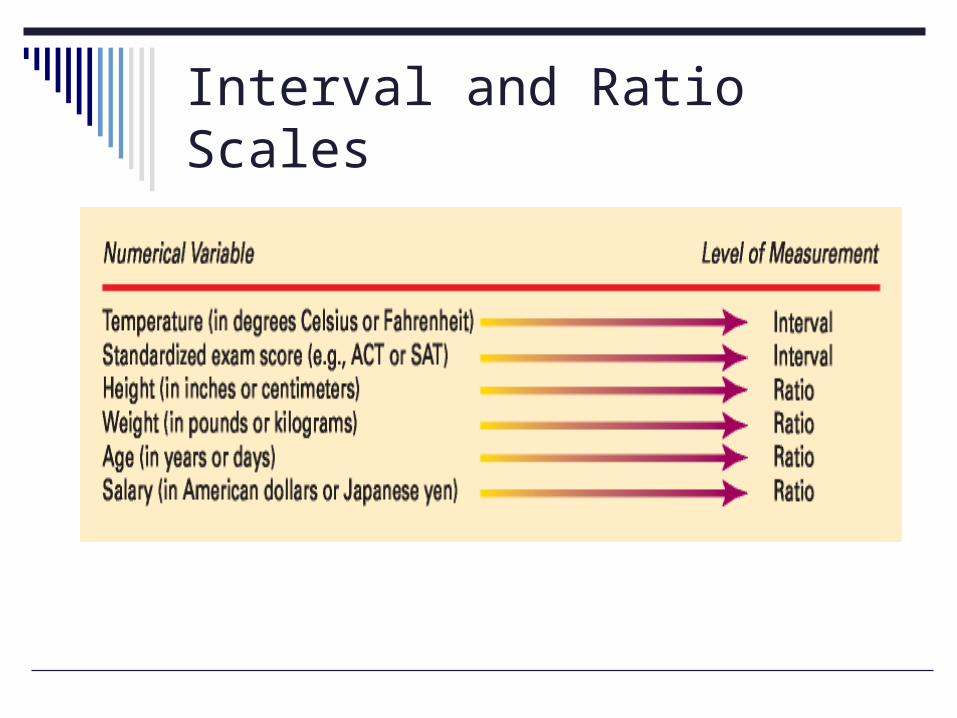
Interval and Ratio Scales
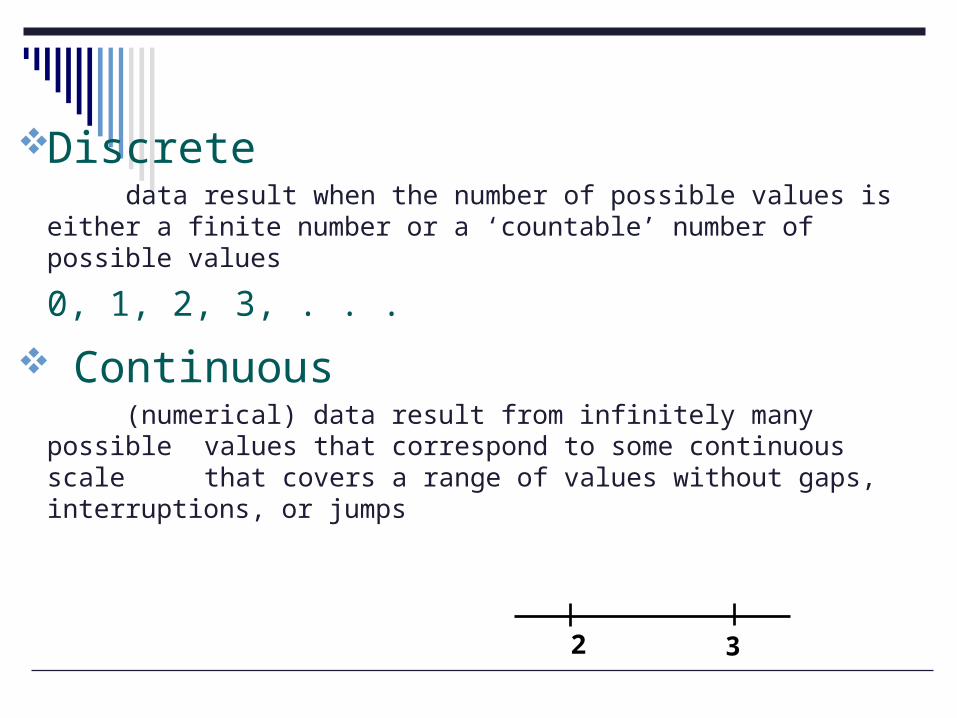
Discrete data result when the number of possible values is
either a finite number or a ‘countable’ number of possible values
0, 1, 2, 3, . . .
Continuous (numerical) data result from infinitely many possible values
that correspond to some continuous scale that covers a range of values without gaps, interruptions, or jumps
2 3
Discrete
The number of eggs that hens lay; for
example, 3 eggs a day.
Discrete
The number of eggs that hens lay; for example, 3 eggs
a day.
Continuous
The amounts of milk that cows produce; for example, 2.343115
gallons a day.
Definitions
Microsoft Excel Terms
When you use Microsoft Excel, you place the data you have collected in worksheets.
The intersections of the columns and rows of worksheets form boxes called cells.
If you want to refer to a group of cells that forms a contiguous rectangular area, you can use a cell range.
Worksheets exist inside a workbook, a collection of worksheets and other types of sheets, including chart sheets that help visualize data.
Designing Effective Worksheets You should associate column cell ranges with variables.
You do not skip any rows as you enter data, so column cell ranges will never contain any empty cells.
Place all the variables on a worksheet that is separate from the worksheet containing the statistical results.
Allow the user to be able to explicitly see the chain of calculations from the starting data.
Create two copies of your worksheets: one optimized for the screen, the other for the printer.
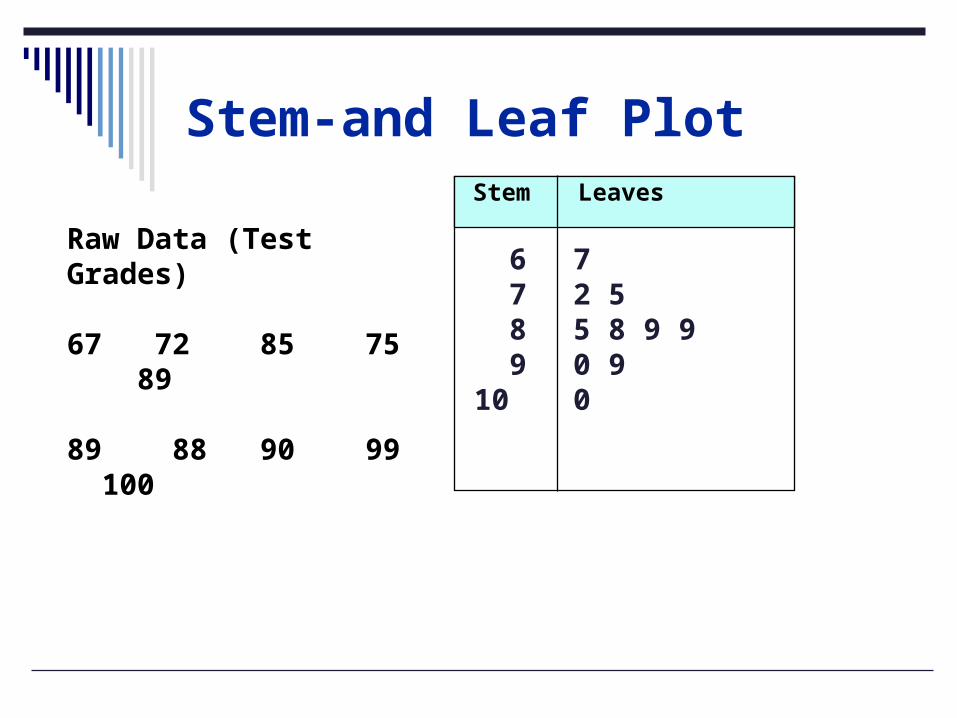
Stem-and Leaf Plot
Raw Data (Test Grades)
67 72 85 75 89
89 88 90 99 100
6 7 8 910
72 55 8 9 90 9 0
Stem Leaves
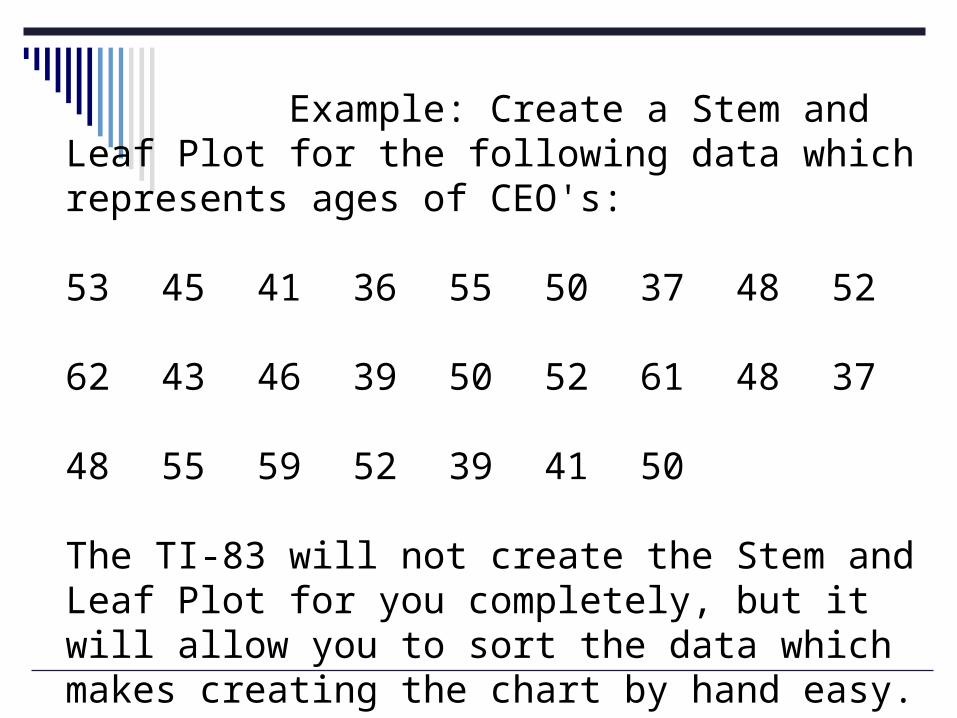
Example: Create a Stem and Leaf Plot for the following data which represents ages of CEO's:
53 45 41 36 55 50 37 48 52
62 43 46 39 50 52 61 48 37
48 55 59 52 39 41 50
The TI-83 will not create the Stem and Leaf Plot for you completely, but it will allow you to sort the data which makes creating the chart by hand easy. Here is what to do:
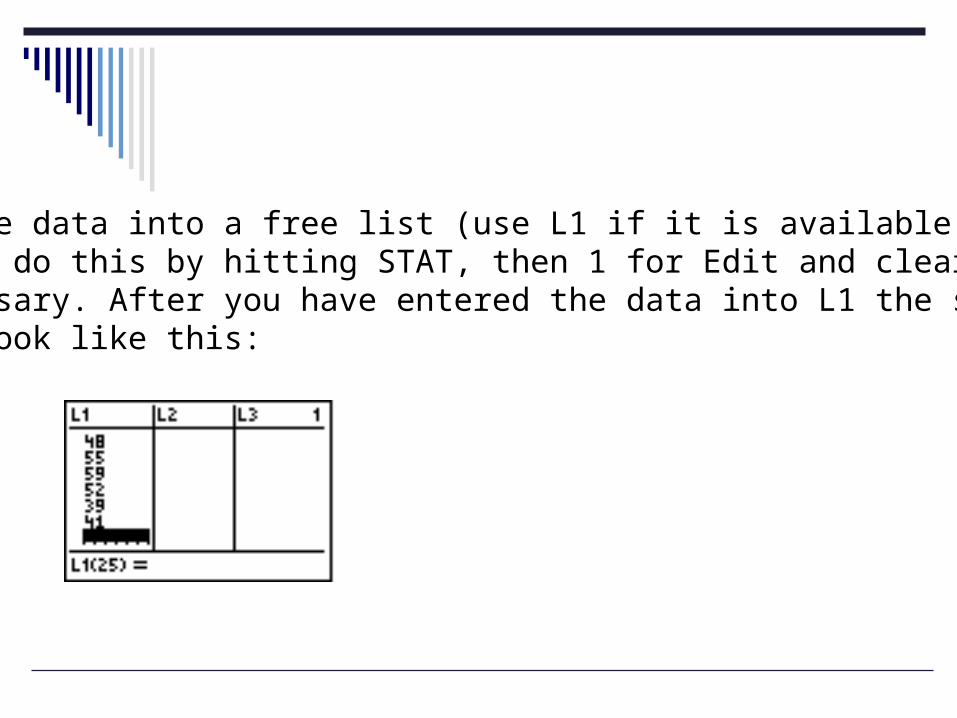
1. Enter the data into a free list (use L1 if it is available). Recall that you do this by hitting STAT, then 1 for Edit and clear L1 if necessary. After you have entered the data into L1 the screen should look like this:
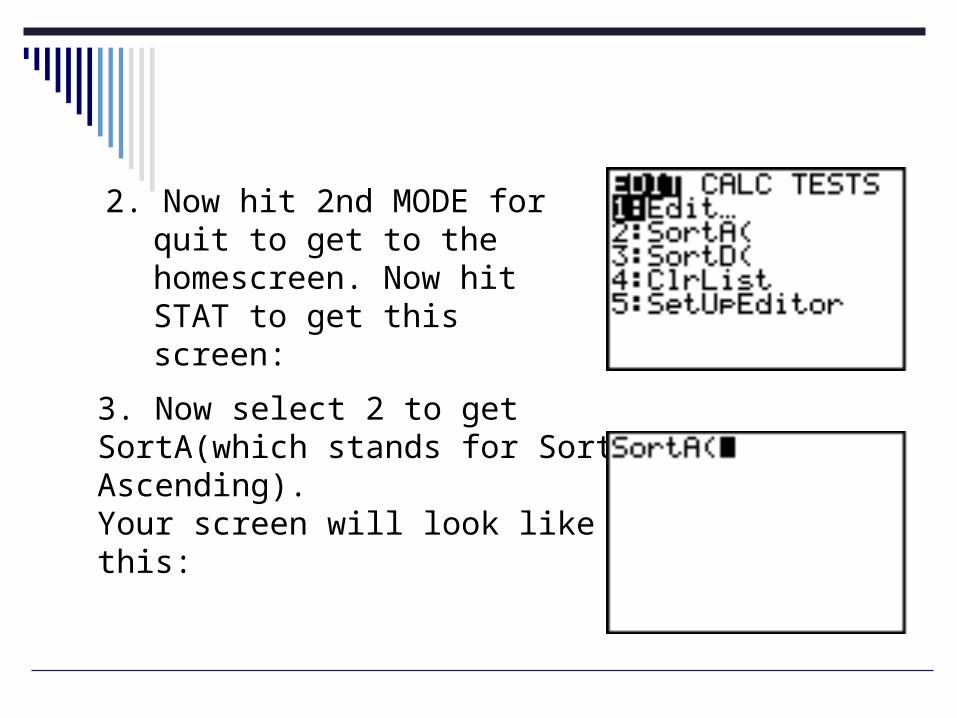
2. Now hit 2nd MODE for quit to get to the homescreen. Now hit STAT to get this screen:
3. Now select 2 to get SortA(which stands for Sort Ascending). Your screen will look like this:
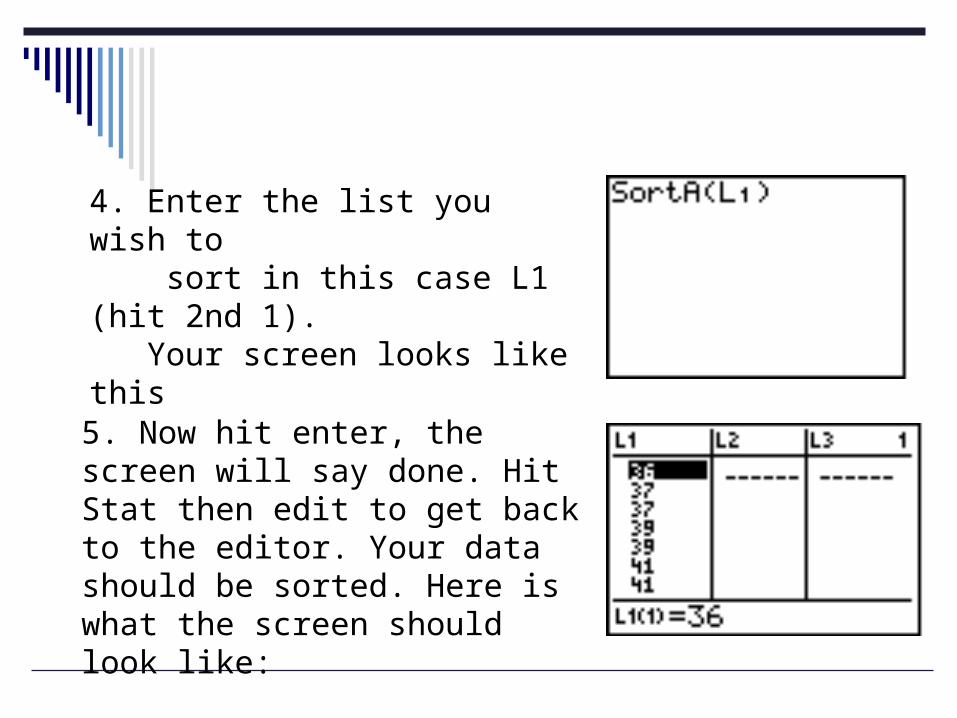
4. Enter the list you wish to sort in this case L1 (hit 2nd 1). Your screen looks like this
5. Now hit enter, the screen will say done. Hit Stat then edit to get back to the editor. Your data should be sorted. Here is what the screen should look like:
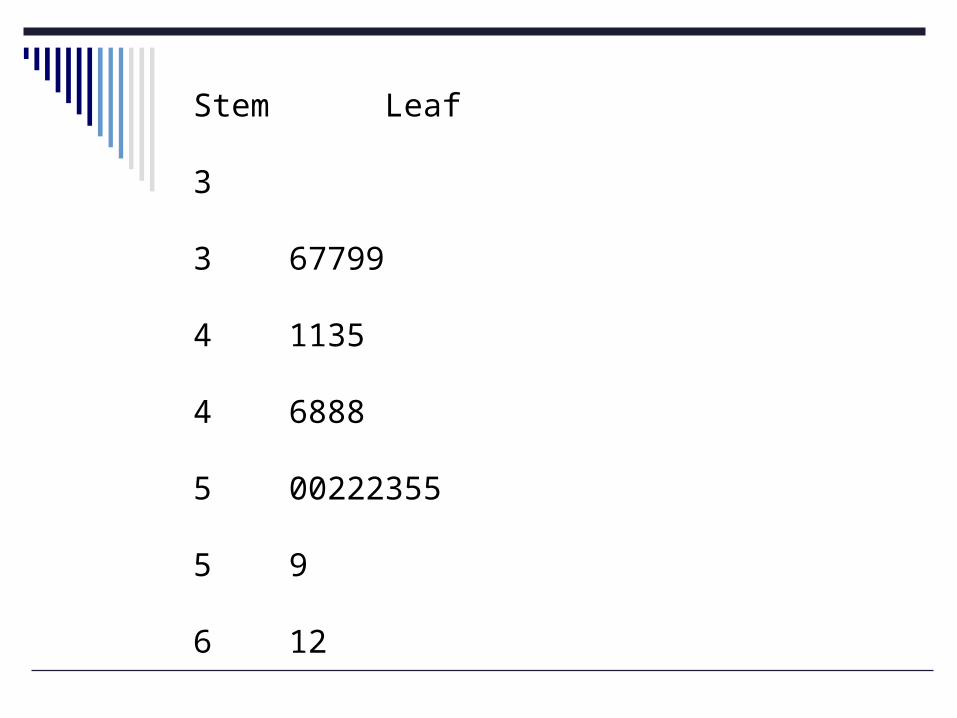
Stem Leaf
3
3 67799
4 1135
4 6888
5 00222355
5 9
6 12
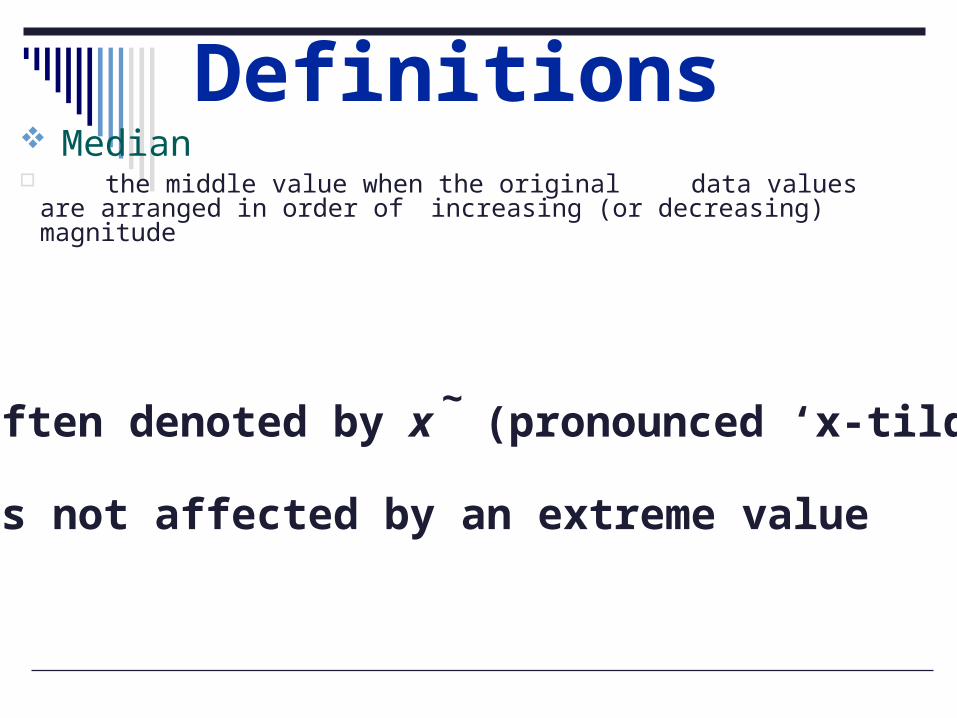
Definitions Median the middle value when the original data values are
arranged in order of increasing (or decreasing) magnitude
Definitions Median the middle value when the original data values are
arranged in order of increasing (or decreasing) magnitude
often denoted by x (pronounced ‘x-tilde’)~
Definitions Median the middle value when the original data values are
arranged in order of increasing (or decreasing) magnitude
often denoted by x (pronounced ‘x-tilde’)
is not affected by an extreme value
~
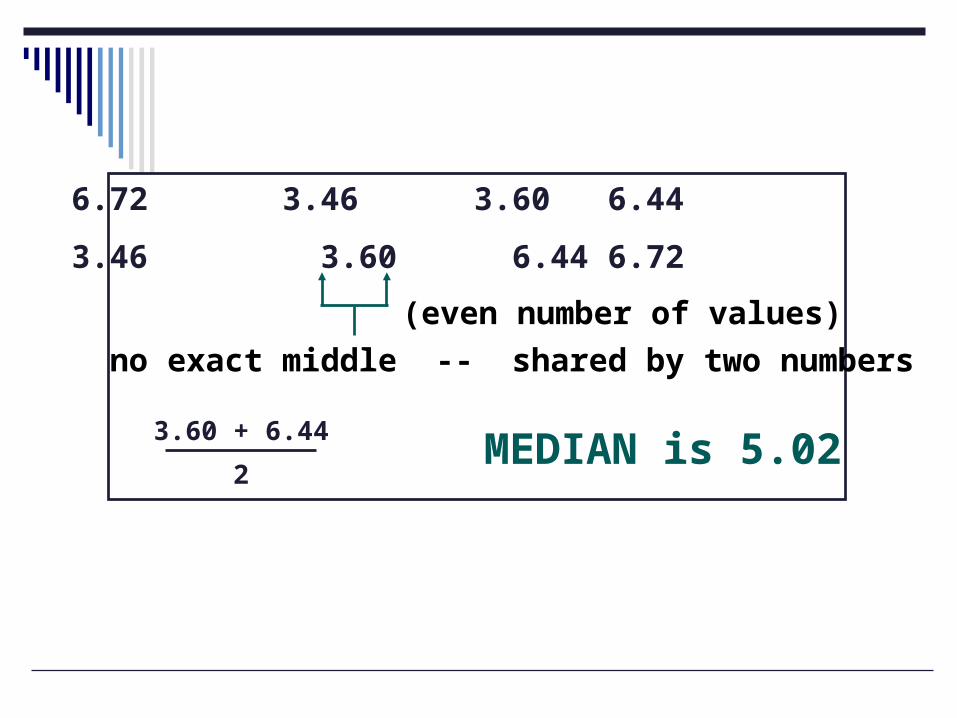
6.72 3.46 3.60 6.44
3.46 3.60 6.44 6.72 no exact middle -- shared by two numbers
3.60 + 6.44
2
(even number of values)
MEDIAN is 5.02
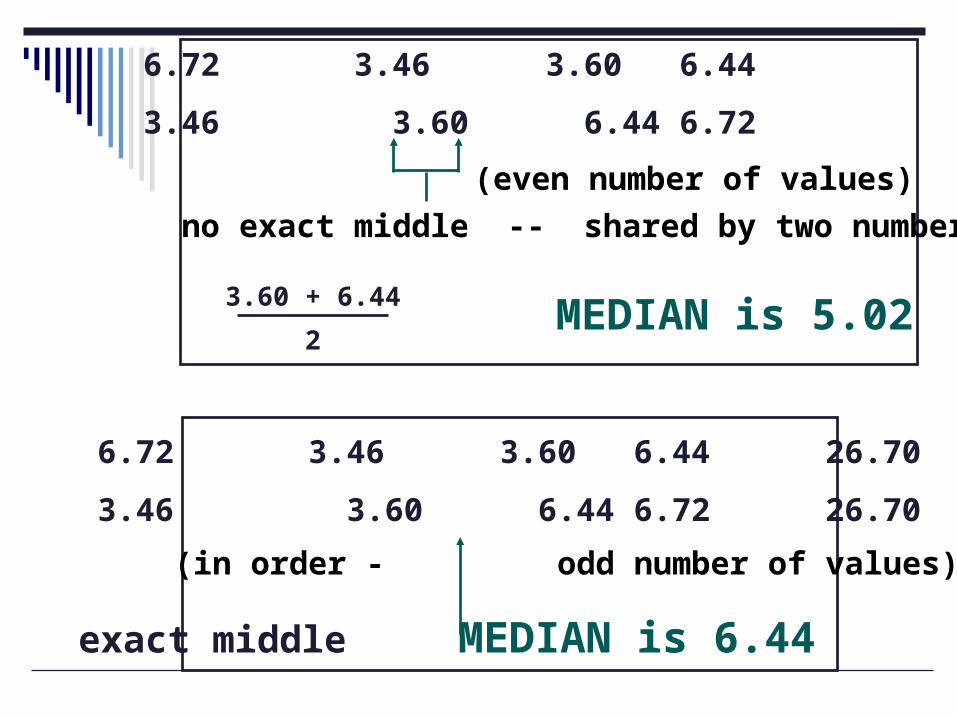
6.72 3.46 3.60 6.44 26.70
3.46 3.60 6.44 6.72 26.70
(in order - odd number of values)
exact middle MEDIAN is 6.44
6.72 3.46 3.60 6.44
3.46 3.60 6.44 6.72 no exact middle -- shared by two numbers
3.60 + 6.44
2
(even number of values)
MEDIAN is 5.02
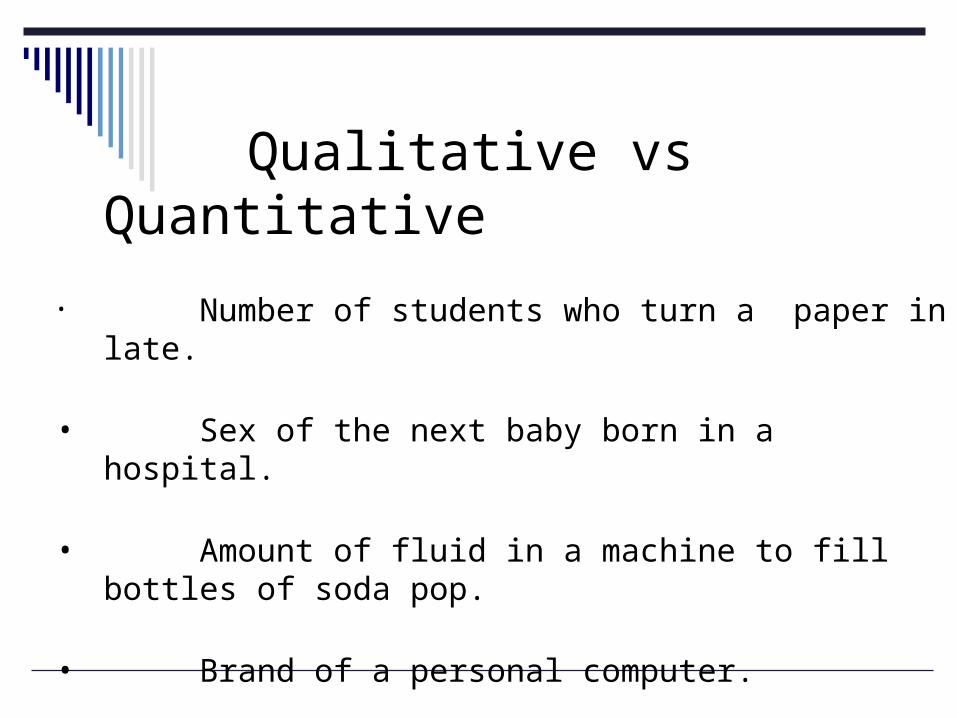
Qualitative vs Quantitative
• Number of students who turn a paper in late.
• Sex of the next baby born in a hospital.
• Amount of fluid in a machine to fill bottles of soda pop.
• Brand of a personal computer.
• Zip Codes.
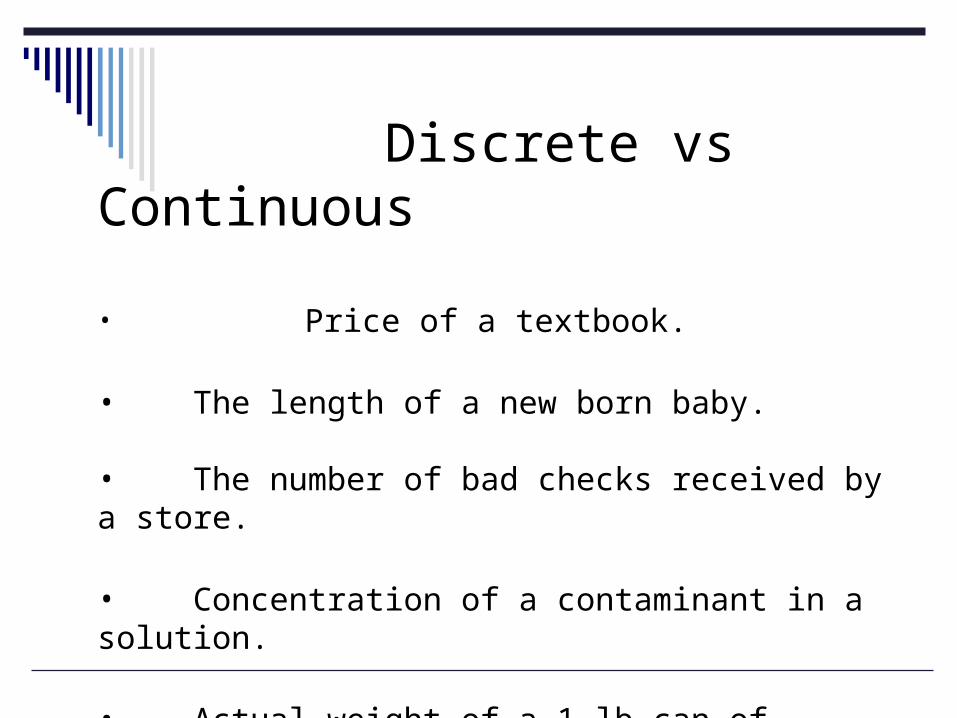
Discrete vs Continuous
• Price of a textbook.
• The length of a new born baby.
• The number of bad checks received by a store.
• Concentration of a contaminant in a solution.
• Actual weight of a 1-lb can of coffee.
Measures of Position
Quartiles, Deciles,
Percentiles
Quartiles
Q1, Q2, Q3
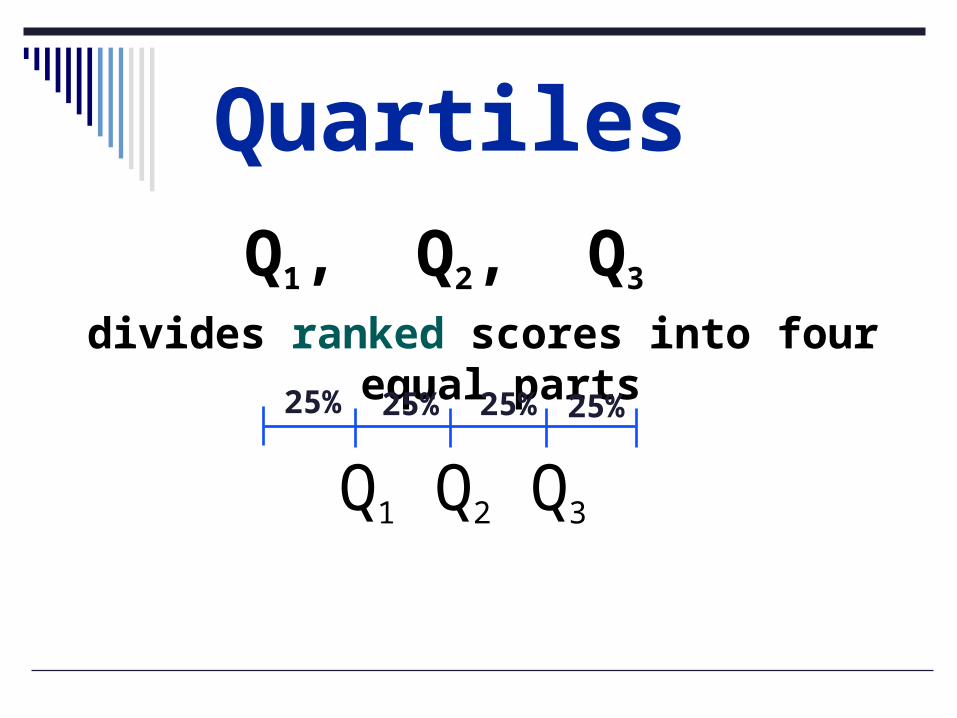
Quartiles
Q1, Q2, Q3 divides ranked scores into four equal parts
25% 25% 25% 25%
Q3Q2Q1
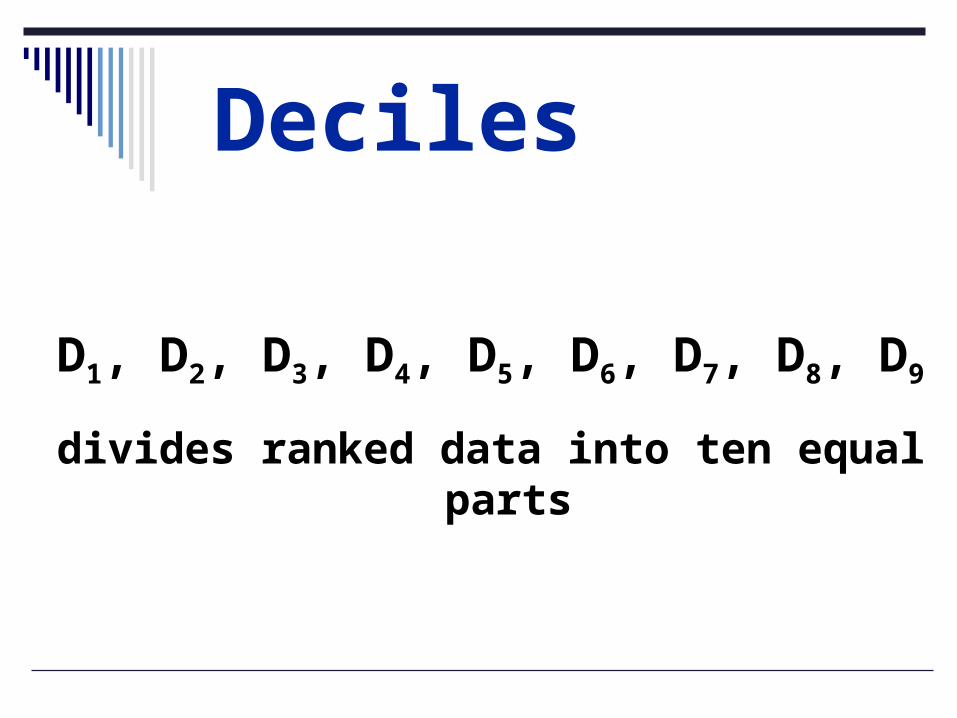
Deciles
D1, D2, D3, D4, D5, D6, D7, D8, D9
divides ranked data into ten equal parts

D1, D2, D3, D4, D5, D6, D7, D8, D9
divides ranked data into ten equal parts
Deciles
10% 10% 10% 10% 10% 10% 10% 10% 10% 10%
D1 D2 D3 D4 D5 D6 D7 D8 D9
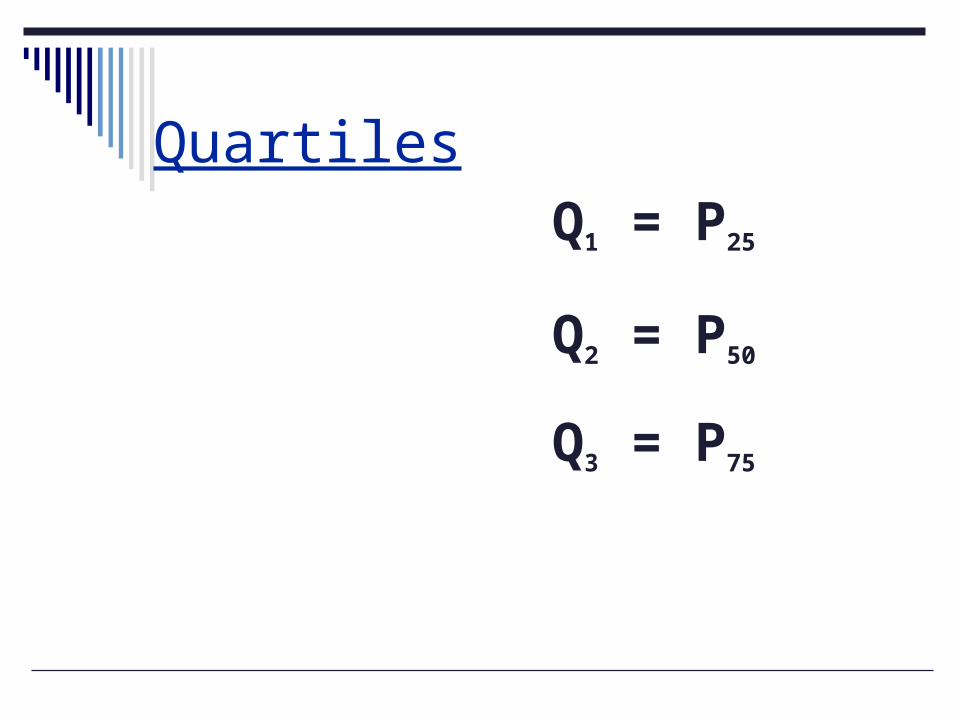
QuartilesQ1 = P25
Q2 = P50
Q3 = P75
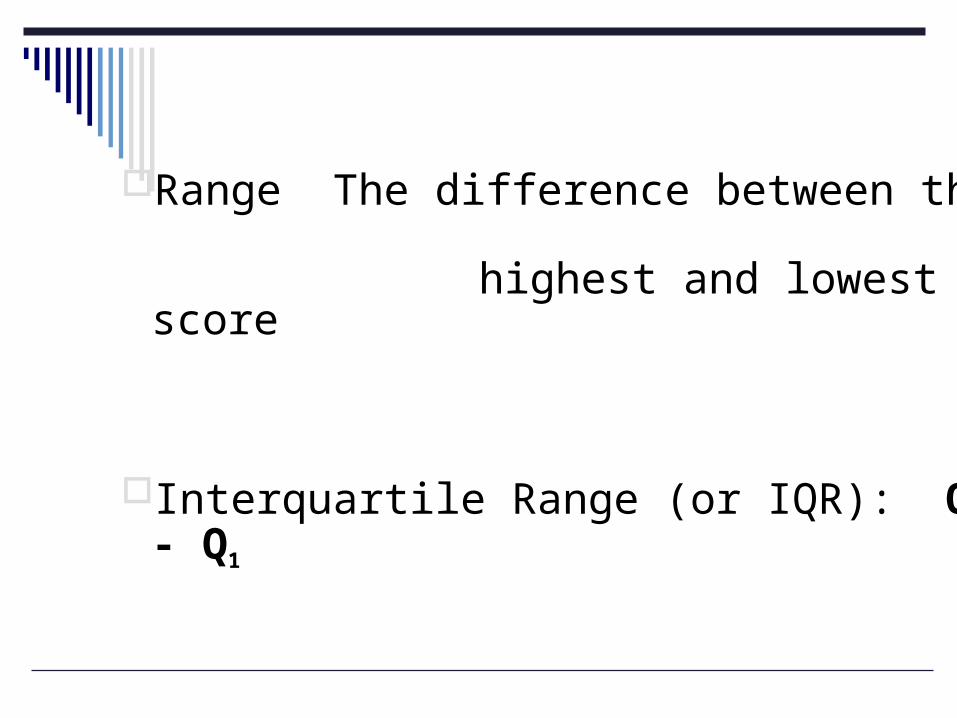
Range The difference between the
highest and lowest score
Interquartile Range (or IQR): Q3 - Q1
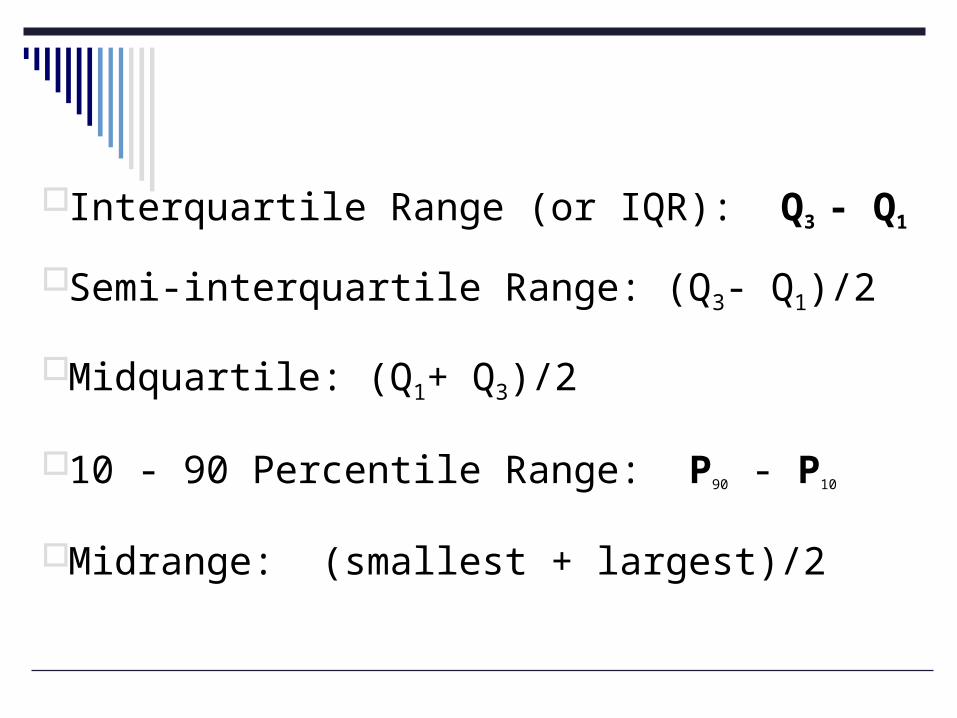
Interquartile Range (or IQR): Q3 - Q1
Semi-interquartile Range: (Q3- Q1)/2
Midquartile: (Q1+ Q3)/2
10 - 90 Percentile Range: P90 - P10
Midrange: (smallest + largest)/2
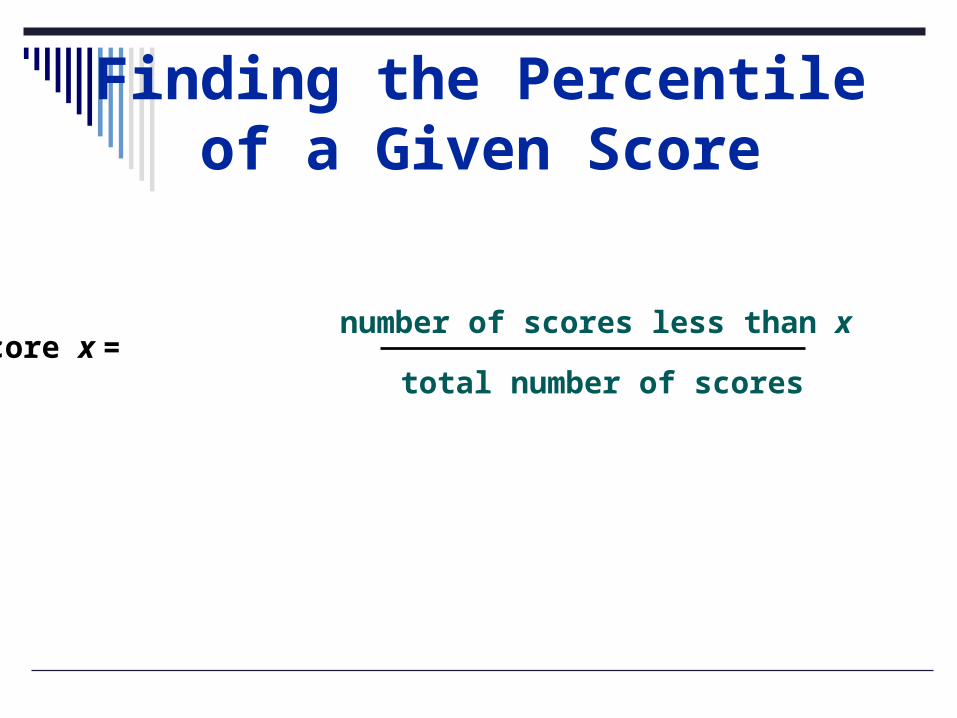
Finding the Percentile of a Given Score
Percentile of score x = • 100number of scores less than x
total number of scores
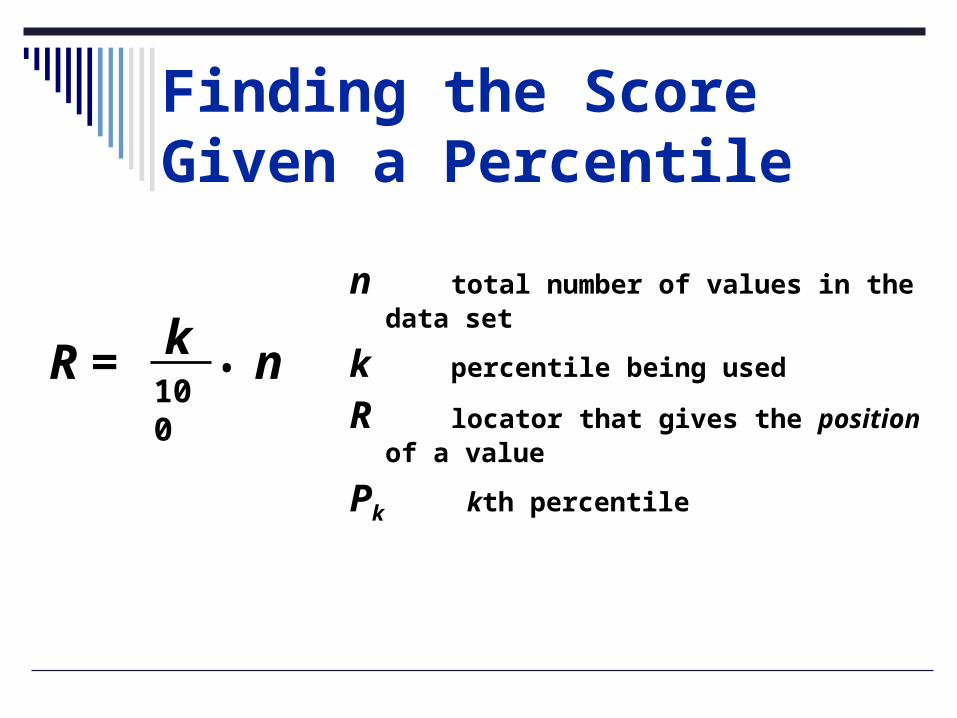
Finding the Score Given a Percentile
n total number of values in the data set
k percentile being used
R locator that gives the position of a value
Pk kth percentile
R = • nk100
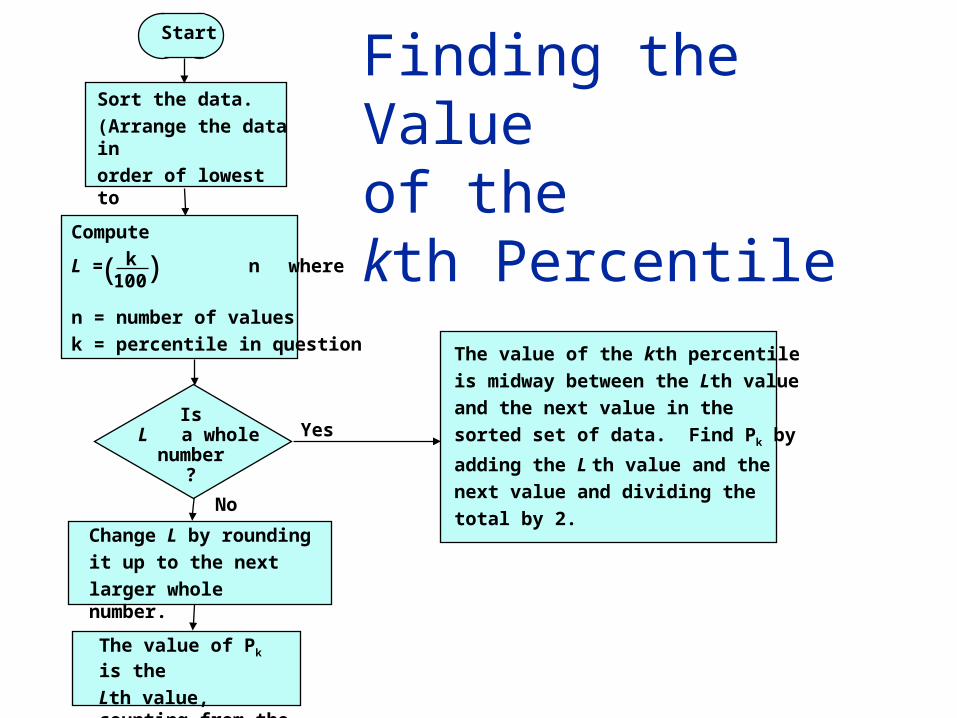
Finding the Value of the kth Percentile
Sort the data.
(Arrange the data in
order of lowest to
highest.)
The value of the kth percentile
is midway between the Lth value
and the next value in the
sorted set of data. Find Pk by
adding the L th value and the
next value and dividing the
total by 2.
Start
Compute
L = n where
n = number of values
k = percentile in question
)( k100
Change L by rounding
it up to the next
larger whole number.
The value of Pk is the
Lth value, counting from the lowest
Is L a whole
number?
Yes
No
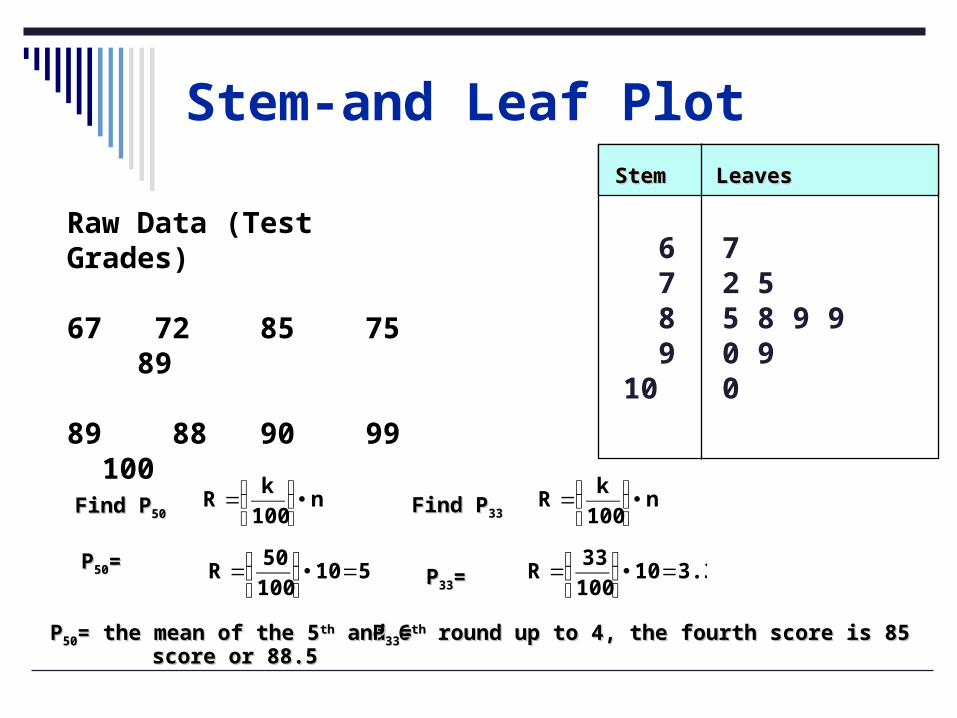
Stem-and Leaf Plot
Raw Data (Test Grades)
67 72 85 75 89
89 88 90 99 100
Find PFind P5050n
100
kR •⎟
⎠⎞
⎜⎝⎛=
PP5050==
Find PFind P3333
PP3333==510100
50R =•⎟
⎠⎞
⎜⎝⎛=
PP5050= the mean of the 5= the mean of the 5thth and 6 and 6thth
score or 88.5score or 88.5
3.310100
33R =•⎟
⎠⎞
⎜⎝⎛=
PP3333= round up to 4, the fourth score is 85= round up to 4, the fourth score is 85
6 7 8 910
72 55 8 9 90 9 0
StemStem LeavesLeaves
n100
kR •⎟
⎠⎞
⎜⎝⎛=

Stem-and Leaf Plot
Raw Data
16 19 22 23 24 25 26 27 28 28 29 30 31 31 34
Find PFind P5050n
100
kR •⎟
⎠⎞
⎜⎝⎛=
PP5050==
Find PFind P3030
4.515100
30R =•⎟
⎠⎞
⎜⎝⎛=PP3030==7.515
100
50R =•⎟
⎠⎞
⎜⎝⎛=
PP5050= round up to 8, the eight = round up to 8, the eight score is 27score is 27
PP3030= round up to 5, the fifth score is 24= round up to 5, the fifth score is 24
1 2 3
6 92 3 4 5 6 7 8 8 90 1 1 4
StemStem LeavesLeaves
n100
kR •⎟
⎠⎞
⎜⎝⎛=
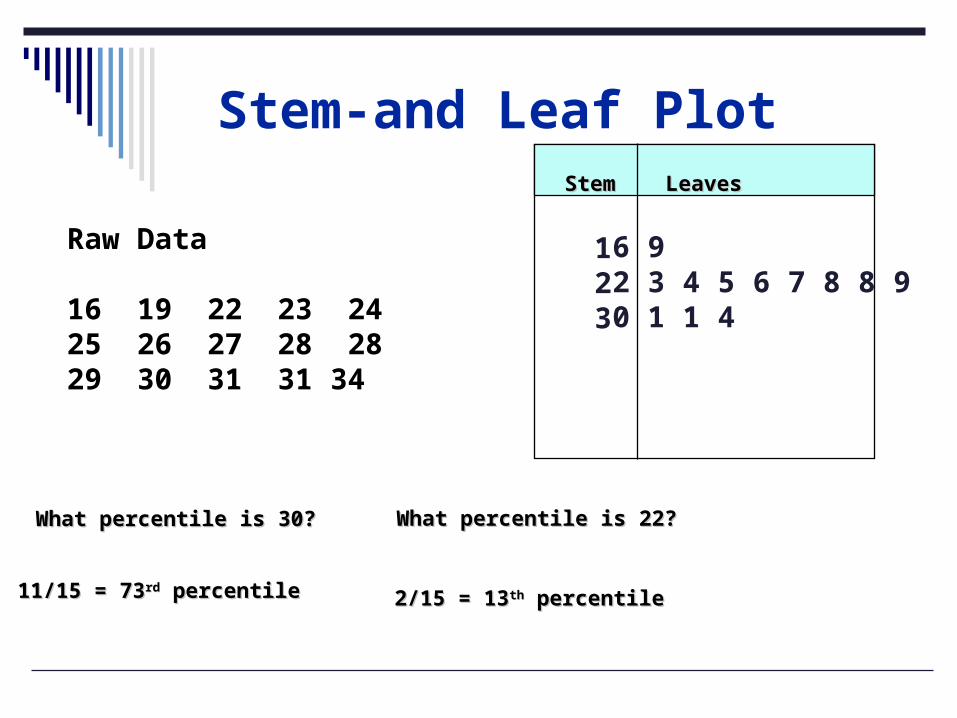
Stem-and Leaf Plot
Raw Data
16 19 22 23 24 25 26 27 28 28 29 30 31 31 34
1 2 3
6 92 3 4 5 6 7 8 8 90 1 1 4
StemStem LeavesLeaves
What percentile is 30?What percentile is 30?
11/15 = 7311/15 = 73rdrd percentile percentile
What percentile is 22?What percentile is 22?
2/15 = 132/15 = 13thth percentile percentile
Chapter Summary
Reviewed why a manager needs to know statistics Introduced key definitions:
Population vs. Sample Primary vs. Secondary data types Categorical vs. Numerical data
Examined descriptive vs. inferential statistics Reviewed data types and measurement levels Discussed Microsoft Excel terms and tips
In this chapter, we have


