Learning in the context of math anxiety
93
UNLV Retrospective Theses & Dissertations 1-1-2008 Learning in the context of math anxiety Learning in the context of math anxiety Michelle Melissa Guillaume University of Nevada, Las Vegas Follow this and additional works at: https://digitalscholarship.unlv.edu/rtds Repository Citation Repository Citation Guillaume, Michelle Melissa, "Learning in the context of math anxiety" (2008). UNLV Retrospective Theses & Dissertations. 2348. http://dx.doi.org/10.25669/z2w3-50l4 This Thesis is protected by copyright and/or related rights. It has been brought to you by Digital Scholarship@UNLV with permission from the rights-holder(s). You are free to use this Thesis in any way that is permitted by the copyright and related rights legislation that applies to your use. For other uses you need to obtain permission from the rights-holder(s) directly, unless additional rights are indicated by a Creative Commons license in the record and/ or on the work itself. This Thesis has been accepted for inclusion in UNLV Retrospective Theses & Dissertations by an authorized administrator of Digital Scholarship@UNLV. For more information, please contact [email protected].
Transcript of Learning in the context of math anxiety

UNLV Retrospective Theses & Dissertations
1-1-2008
Learning in the context of math anxiety Learning in the context of math anxiety
Michelle Melissa Guillaume University of Nevada, Las Vegas
Follow this and additional works at: https://digitalscholarship.unlv.edu/rtds
Repository Citation Repository Citation Guillaume, Michelle Melissa, "Learning in the context of math anxiety" (2008). UNLV Retrospective Theses & Dissertations. 2348. http://dx.doi.org/10.25669/z2w3-50l4
This Thesis is protected by copyright and/or related rights. It has been brought to you by Digital Scholarship@UNLV with permission from the rights-holder(s). You are free to use this Thesis in any way that is permitted by the copyright and related rights legislation that applies to your use. For other uses you need to obtain permission from the rights-holder(s) directly, unless additional rights are indicated by a Creative Commons license in the record and/or on the work itself. This Thesis has been accepted for inclusion in UNLV Retrospective Theses & Dissertations by an authorized administrator of Digital Scholarship@UNLV. For more information, please contact [email protected].
LEARNING IN THE CONTEXT OF
MATH ANXIETY
by
Michelle Melissa Guillaume
Bachelor of Science University o f New Orleans
2002
Master of Science University of Nevada, Las Vegas
2005
A thesis submitted in partial fulfillment of the requirements for the
Master of Arts Degree in Psychology Department of Psychology
College of Liberal Arts
Graduate College University of Nevada, Las Vegas
August 2008

UMI Number: 1460468
INFORMATION TO USERS
The quality of this reproduction is dependent upon the quality of the copy submitted. Broken or indistinct print, colored or poor quality illustrations and photographs, print bleed-through, substandard margins, and improper alignment can adversely affect reproduction.
In the unlikely event that the author did not send a complete manuscript and there are missing pages, these will be noted. Also, If unauthorized
copyright material had to be removed, a note will indicate the deletion.
UMIUMI Microform 1460468
Copyright 2009 by ProQuest LLC.
All rights reserved. This microform edition is protected against
unauthorized copying under Title 17, United States Code.
ProQuest LLC 789 E. Eisenhower Parkway
PC Box 1346 Ann Arbor, Ml 48106-1346

UNIY. Thesis ApprovalThe Graduate College University of Nevada, Las Vegas
J u ly 25 20^8
The Thesis prepared by
Michelle Melissa Guillaume
Entitled
Learning in the Context of Math Anxiety
is approved in partial fulfillment of the requirements for the degree of
M aster o f A r ts in P sy c h o lo g y
Exam ination C om m ittee M em ber
m m ination C om m ittee M em ber
G raduate College F acidty R epresentative
Exam ination C om m ittee Chai:
Dean o f the Graduate College
11

ABSTRACT
Learning in the Context of Math Anxiety
by
Michelle Melissa Guillaume
Dr. Mark H. Ashcraft, Examination Committee Chair Professor of Psychology
University o f Nevada, Las Vegas
Previous studies have examined the effects of math anxiety on working memory
and performance. It has been shown that having a high level of math anxiety not only
decreases performance, but also interferes with working memory such that the anxiety
competes for working memory resources, decreasing the amount of working memory
resources available to work on a math task. Previous research has focused on the
semantic memory approach, i.e., testing people on what they already know. The current
study took this research one step further and looked at learning, specifically stimulus
learning, in the context of math anxiety. A well studied lab task, the true/false
verification task, was adapted to study learning on the part of individuals who vary in
their math anxiety. Some of the addition problems were shown only once to participants
while other addition problems were shown nine times. One prediction of this study was
that low math anxious individuals would be able to learn more mathematical information
across blocks of trials than high math anxious individuals, and would demonstrate this on
a recall test of incidental learning after three blocks of making true/false judgments to
simple addition problems. Although this learning effect between high and low math
111

anxious individuals was not found, another interesting effect was discovered with regard
to the learning recall task. High math anxious participants learned more of the false
answers with large splits than the low math anxious participants. This was an unexpected
finding, and one inference that could be drawn from this is that low math anxious
participants are not looking at the false problems with the large splits long enough to
encode them, whereas the high math anxious individuals may be looking at the problem
longer, unable to quickly judge it as false.
IV

TABLE OF CONTENTS
ABSTRACT.................................................................................................................................. iii
ACKNOWLEDGEMENTS.......................................................................................................vii
CHAPTER 1 INTRODUCTION........................................................................................ 1
CHAPTER 2 LITERATURE REVIEW ............................................................................3Math Cognition................................................................................. 3Math Cognition and Working M emory............................................................................. 11Math Anxiety and the Math Anxiety Rating Scale...........................................................15Math Anxiety Research........................................................................................................ 16Math Anxiety and Working M em ory.................................................................................17Current Experiment............................................................................................................... 19
CHAPTER 3 METHODOLOGY.................................................................................... 23Participants............................................................................................................................. 23M aterials................................................................................................................................ 23Experimental Stim uli........................................................................................................... 25Procedure............................................................................................................................... 25Statistical Analyses...............................................................................................................27
CHAPTER 4 DATA ANALYSIS AND RESULTS......................................................28Demographics........................................................................................................................29Reaction Time Data (Experimental T ask)........................................................................ 31Error Rate Data (Experimental Task)................................................................................ 35Operation Span (OSPAN) Reaction Times and Error R ates ..........................................37Forced Recall T ask ...............................................................................................................42
CHAPTER 5 DISCUSSION AND CONCLUSIONS.................................................. 44Hypotheses............................................................................................................................. 44Added Findings and Possible Explanations...................................................................... 46General Conclusions.............................................................................................................50
APPENDIX TABLES AND FIGURES........................................................................ 52
REFERENCES............................................................................................................................79

VITA............................................................................................................................................. 84
VI

ACKNOWLEDGEMENTS
Firstly, I would like to take this opportunity to thank my advisor, Mark, for all of your
patience and encouragement. My confidence in my writing ability has grown immensely.
You really know how to deal with all of your students as individuals with their own
personalities and ideas, and you have made this experience a very positive one for me.
Tm looking forward to working with you toward earning my Ph.D.
Secondly, I want to thank Linda and Norval Jessogne. Your support and guidance
both personally and professionally have helped me through my many, many, many years
of schooling. As I have both struggled and succeeded, you have been there to encourage
me and to keep my spirits high. Thank you from the bottom of my heart. I will love you
always
V ll
CHAPTER 1
INTRODUCTION
Over the past thirty five years, researchers have become increasingly interested in the
topic of math anxiety. Math anxiety involves discomfort and nervousness that can result
from a situation dealing with numbers or a situation involving simple calculations. It can
be felt in a math classroom, in a restaurant, and even in the comfort o f one’s own home
while trying to balance a checkbook. Having this specific type of anxiety has been found
to correlate with students avoiding math classes as well as avoiding careers involving
math (Hembree, 1990).
Since 2001 several studies have investigated the consequences o f math anxiety as it
relates to gender (Miller & Bichsel, 2004), education (Chen & Geng, 2002), cognition
(Ashcraft, 2002), and performance (Ashcraft & Kirk, 2001). With all of this research that
has looked at math anxiety and performance and math anxiety and working memory,
little work has been done to see what effect math anxiety may have on the learning and
storage of math facts in memory. In this thesis, math anxiety as it relates to the learning
and storage o f math facts was investigated.
Before discussing the thesis experiment and its results, a detailed review of the
literature will take a comprehensive look at math cognition to show what has been found
in terms of how children and adults comprehend numbers as well as the

different strategies they use to tackle different types o f math problems. The review will
then cover research that has examined the relationship between math cognition and
working memory. Once an understanding o f the theories and models behind math
cognition and working memory has been established, the literature review will turn to
examine the initial research on math anxiety as well as the relationship between math
anxiety and working memory, the development o f the Math Anxiety Rating Scale, and
the possible causes and consequences o f having math anxiety. Finally, the experiment
for this thesis project will be explained, results will be given, and a discussion will follow

CHAPTER 2
LITERATURE REVIEW
Math Cognition
Some of the first pioneering work involving how both children and adults thought
about math and exactly how math problems and processes were mentally represented was
found in the work of Parkman and Groen (1971) and Groen and Parkman (1972). In the
1971 study, they gave college students a yes/no verification task in which the participants
looked at simple addition problems of the form a + b = c, where c was a double digit sum,
and pushed the yes button if the equation was correct and pushed the no button if the
equation was incorrect. For the incorrect equations, the answers were wrong by not more
than ±2. Results of the experiment indicated the problem size effect; reaction time
latencies increased as both a function of minimum addend and sum (Parkman & Groen,
1971). Reaction time latencies for tie problems (6 +6) were also found to be significantly
faster than for nontie problems. The authors indicated that adults may be performing
simple addition problems in the same way that children were, only the process had
become automated and much faster; however, more reaction time data for children was
needed before that conclusion could be confirmed (Parkman & Groen, 1971).

In 1972, Groen and Parkman set out to obtain more evidence with regard to children
performing simple addition. They considered several counting models for first grade
children who were attempting to solve simple addition problems (problems with single
digit addends and sums of less than or equal to nine). The five predicted models were
tested using data obtained with a production task. Participants had a box with the
numbers one through nine on it. A problem was presented to them, they then had to
calculate the answer and press the numbered button that corresponded to the correct sum.
This was in contrast to the verification task used in the 1971 Parkman and Groen
experiment in which the participant would be shown the problem with an answer, and
they would simply have to verify whether the answer provided made the equation true or
false. After testing all five predicted counting models, the results showed that, in the first
grade, children were using what Groen and Parkman referred to as a “count by min”
model for solving simple addition problems. According to the “count by min” model, a
first grader would solve the problem X + Y = ? in the following manner: first, a mental
counter would be set to the larger of the two addends (max(X,Y)). The child would then
count up by the minimum addend (min(X,Y)) one step at a time to achieve the answer.
For example, given a problem such as 5 + 2, the child would hold the larger addend, 5, in
memory, and then increment by Is until the number of increments equaled the minimum
addend, 2. One exception found in the study was in the case of tie problems. Tie
problems all appeared to have the same reaction time latency, and the authors stated that
children must have been using some type of retrieval system for tie problems, indicating
that those answers were already stored in memory.

After the conclusion of the study, there were two possible ideas presented about how
adults might have been processing simple addition problems; one idea was that the
process for adults would be the same as that for the first graders, only faster (Parkman &
Groen, 1971). There were some discrepencies between the data, however, that did not fit
with that idea. Firstly, even though the minimum addend provided the best fit, for the
adult data, the sum of the problem accounted for almost as much of the variance as the
minimum addend. Secondly, with adults being extremely faster than children, it did not
seem that adults were incrementing by counting to themselves, and that meant that if
adults were incrementing, then they were doing it by some unknown mechanism (Groen
& Parkman, 1972). Those discrepancies led to a rejection of the idea that the simple
addition process for adults and children was the same. A second idea was that adults
would use the same reproductive process that children used for tie problems on most
simple addition problems; however, for an unknown proportion of simple addition
problems, adults would revert back to the counting model used by children (Groen &
Parkman, 1972).
Evidence pointing to a direct retrieval process in adults came from Parkman (1972).
An experiment was conducted to try and extend the “count-by min” model to
multiplication. In the experiment, college students were given a verification task in
which they were given a single-digit multiplication problem with an answer (p x q = r),
and they had to respond whether the equation presented to them was true or false. The
latencies increased as a function o f min(p,q) and as a function o f the sum of p and q; that
result showed the problem size effect. This was the same effect found for simple addition
in Groen and Parkman, 1972. It seemed that simple addition and multiplication were

governed by the same underlying processes (Parkman, 1972). However, to interpret the
new findings for multiplication in terms of the “count-by min” model, the participants
would need to be counting-on as indicated by the larger multiplier; for example, in the
case of 7 X 3, an individual would count-on by 7s for 3 increments (Ashcraft, 1992). In
comparing the count-by min model for simple addition to the same model for
multiplication, it was pointed out that the restriction of incrementing by 1 s for addition
did not make sense if for multiplication, one could count-on by 7s (Miller, Perlmutter, &
Keating, 1984). In the discussion section, Parkman (1972) talked about the limitations of
the “count-by min” model and wrote that if single-digit multiplication was assumed to be
achieved through a process of direct retrieval, then single-digit addition would also seem
to operate under that same process.
In 1978, the ideas given regarding adults’ processing of simple addition problems by
Groen and Parkman (1972) were tested by Ashcraft and Bataglia in two experiments
using college students as participants. In the first experiment, simple addition problems
with answers were presented in a true/false verification task. For the false problems, the
authors investigated the split effect. Originally, the term split was used to describe the
distance between two digits presented on a mental number line. If a participant was
presented with two digits, he/she would use a mental number line to compare the two
digits and decide which one was larger (e.g. Moyer & Landauer, 1967). For the Ashcraft
and Bataglia study, the split effect was manipulated in the answers of the false stimuli
presented such that some of the false answers were different from the real answer by ± lor
2 (termed reasonable false) and other false answers were different from the real answer
by ±5 or 6 (termed unreasonable false).

The results o f the first experiment did not lead to evidence o f a strictly counting
model in adults. Unlike the previous results, which indicated the minimum addend to
account for most of the variance (Groen & Parkman, 1972), the first experiment found
that 48% of the variance was accounted for by the square of the correct sum for true and
reasonable false problems, indicating the problem size effect. Also found was that the
minimum addend was only the best predictor for unreasonable false problems.
According to these results, a strictly counting model for adults did not make sense
because the squared term accounting for most of the variance could not be made to
correspond with a counting factor as proposed in the “count-by min” model (Ashcraft &
Bataglia, 1978).
To test that result thoroughly, the second experiment in the study used the same
stimuli as the first experiment with the exception of some repeated stimuli. The authors
investigated what happened to reaction times when the stimulus was repeated in its
entirety, when only the sum was repeated, and when either the first or the second addend
was repeated. Results indicated that the reaction times were significantly decreased when
the problem was repeated in its entirety, and that even when only the sum was repeated,
reaction times were facilitated (Ashcraft & Bataglia, 1978). These repetition effects
provided direct evidence against a strictly counting model for adults in that Groen and
Parkman’s 1972 “count-by min” model could not explain the facilitation in reaction times
that occurred when exactly repeated stimuli were presented. A network retrieval model
was posited in which the network representation for addition was a square with the digits
0-9 on two adjacent sides and the sums located at the intersection point o f any two
numbers. Incorporating the exponential problem size effect, modifications to the square

were presented that included stretching out the distance between larger sums or making
the distance between entry sums larger as the addends got larger (Ashcraft & Bataglia,
1978).
To examine the various models for mental addition, a study was conducted which
tested the strictly counting model, the direct access model with backup counting (Groen
& Parkman, 1972), and the network retrieval model (Ashcraft & Bataglia, 1978) o f adults
processing of mental addition (Ashcraft & Stazyk, 1981). The results showed that
reaction times again increased with problem size and also decreased with increased split
in the false answers. These results were consistent with the network retrieval model
proposed by Ashcraft and Bataglia, and they did not refute the network representation
scheme proposed in that study.
By the early 1980s, it had been shown that first graders used a “count by min” model
(Groen & Parkman, 1972) and that adults were using a network retrieval model (Ashcraft
& Bataglia, 1978, Ashcraft & Stazyk, 1981). Researchers were beginning to wonder
exactly where the transition occurred from a counting model in the first grade to a
retrieval model in adulthood. In 1982, Ashcraft and Fierman conducted a study to try and
investigate that very question. The experiment consisted of simple addition problems
presented to third, fourth, and sixth graders for a true/false verification task. Results
showed that half of the third graders were using a counting process and the other half
were using retrieval methods indicating that there may be a transition occurring from
counting to retrieval happening in the third grade. Fourth and sixth graders were found to
have similar reaction time profiles to adults indicating a retrieval method, and, although
fourth graders were still slow to judge the false problems, sixth graders were found to

perform the same as adults. Analyses showed a switch from the minimum addend being
the best predictor to the correct sum squared being the best predictor starting in the third
grade and the correct sum squared being the best predictor from then on.
Another interesting finding arose when the math textbooks of elementary schools
were examined to see what kinds of simple addition problems were shown most
frequently. The results showed that small problems were presented much more
frequently than large problems (Hamarm & Ashcraft, 1986). This result gave evidence in
favor of the network representation scheme presented by Ashcraft and Bataglia in 1978.
Small problems had stronger network representations due to experience and lots of
practice, resulting in shorter reaction times. Also, longer reaction times, indicating
weaker network representations for large problems, could be explained by a lack of
experience and practice beginning from the initial learning of simple addition.
As more researchers became interested in math cognition and the mental processes
involved in performing math tasks, more evidence was found confirming repetition
effects (LeFevre, Bisanz, & Mrkonjic, 1988). Also, evidence was found that challenged
a strictly retrieval model for adults’ processing of simple addition problems (LeFevre,
Sadesky, & Bisanz 1996). Lefevre et al. found that the strategies used by adults
depended on the characteristics o f the task. In fact, it was found that the size of the
problem affected exactly which strategies adults would choose to use (LeFevre et al.,
1996). As the problems got larger (having a sum greater than 10), adults were just as
likely to use a procedural strategy as a retrieval strategy. Reaction time data obtained by
Lefevre et al. (1996) showed slower reaction times when participants reported using
procedural strategies and faster reaction times when participants used retrieval strategies.

Another result showed that if the minimum addend was 1,2, or 3, the participant was
most likely to report using a counting strategy.
In 2001, Kirk and Ashcraft performed two experiments to further investigate the
results obtained by Lefevre et al. (1996). The first experiment replicated the conditions
in Lefevre et al. (1996) with the addition of two contrasting instruction conditions and a
silent control condition. Instruction conditions consisted o f four groups: retrieval bias,
strategy bias, replication, and silent control. The results showed a verbal report bias
based on which instructions the participant received; those participants who had been
biased to report direct retrieval strategies did so 90% of the time, and those participants
who were biased toward non-retrieval strategies showed a higher increase in reporting
non-retrieval strategies in their verbal reports as well. The second experiment replicated
the first with the exception of using multiplication problems instead of addition problems;
all instructions were also changed to accommodate multiplication. Once again, the
results showed that participants’ verbal reports were biased when given demand
instructions. Overall, demand instructions were shown to play an important role in
participants’ verbal reports which was not an accurate reflection of their cognitive
processes (Kirk & Ashcraft, 2001).
Summary o f Math Cognition Research
So it has been shown that children in the first grade use a “count by min” model
(Groen & Parkman, 1972); however, a transition occurs somewhere in the third grade
where children are switching from the “count by min” model to a retrieval model for
simple addition (Ashcraft & Fierman, 1982). Different results have been obtained with
regard to the performance on simple addition problems by adults. One result indicated
1 0

that adults used various strategies as a function of problem size (LeFevre et.al, 1996).
Other results pointed to adults using a strietly retrieval model to perform simple addition
tasks (Asheraft & Bataglia, 1978, Asheraft & Stazyk, 1981).
Sinee the evidence points to frequent, but not continuous use o f a direct retrieval
strategy, it would be good to examine why adults may be choosing procedural strategies
or why some adults may just be taking longer to retrieve the solution. One explanation
ean be found by looking at math cognition through a model for working memory. The
next section will give an explanation of the working memory model for which the
framework of the eurrent study is based. Researeh examining the relationship between
math cognition and working memory will also be discussed.
Math Cognition and Working Memory
Working memory involves the temporary storage and proeessing o f information.
Cognitive psychologists looking at working memory typically look at it in terms of
Baddeley’s (1986) working memory model. There are three parts to the working memory
model: the eentral exeeutive and two storage systems (the visuospatial sketchpad and
phonological loop). The central exeeutive acts as the supervisory system; it initiates
retrieval from long term memory and controls the information going to and from the
visuospatial sketchpad and the phonological loop. The phonological loop deals mainly
with auditory verbal information such as remembering somebody’s name that you just
met, and the visuospatial sketchpad is involved with visual and spatial information such
as how fast an object is moving or where it is located. Recently, Baddeley (2000) has
added a fourth component to the model, called the 'episodic buffer'. This component is a
11

third storage system, dedicated to linking information across domains to form integrated
units of visual, spatial, and verbal information.
According to Baddeley’s working memory model, working memory only has a
limited number of resources to work with at any one time, allowing only a certain number
of tasks to be done at the same time. Sometimes more than one task can be accomplished
at the same time; however, it depends on which subsystems of the central executive are
involved and if there is competition for any of the working memory resources. It is easier
to do two tasks, each relying on a different subsystem of the central executive (i.e. a
verbal and a spatial task), than it is to do two tasks in which each task is relying on the
same subsystem (i.e. two spatial tasks) (Baddeley & Hitch, 1974).
By the early 1990s, questions were being asked as to the involvement of working
memory in the process o f solving arithmetic problems. One experiment aimed at
investigating the role o f working memory in addition was conducted by Ashcraft,
Donley, and Halas (1992). The authors used both single digit and two column addition
problems for a true/false verification task. Three concurrent tasks (repeat,
alphabetization, and word generation) were also presented to each participant. For the
single digit addition problems, it was found in the word generation and the
alphabetization tasks that the participants exhibited slower verbal performance, which
implicated working memory in the process o f simple addition. The two column addition
problems showed an even stronger reliance on working memory; the interference of the
concurrent task was evident, especially when the carry operation was required (Ashcraft
et al., 1992). Although working memory was shown to be involved in both single and
1 2

two column addition problems, specific subsystems of the working memory model (the
central executive, phonological loop, and visuo-spatial sketchpad) were not discussed.
Several studies provided evidence that the central executive is involved in solving
single-digit arithmetic problems. In 1996, a study was done with the intention of finding
out which parts o f the working memory system were active when adults performed
simple addition problems. Lemaire, Abdi, and Fayol used college students in their
experiment and gave them simple addition and multiplication problems in a true/false
verification task. For a subset of the false problems, confusion problems were presented;
confusion problems were considered those problems in which the proposed answer
matched a correct answer to another problem or was correct under another operation (i.e.
3 + 4 - 12 or 3 X 4 - 7). Another subset of false problems did not contain confusion
problems. The authors did not manipulate split for the experiment, and easy and difficult
problems were determined using a difficulty rating scale (Ashcraft’s index; see Hamann
& Ashcraft, 1985). One of four memory load conditions was assigned to participants:
control, articulatory suppression, canonical letters, and random letters. In the articulatory
suppression condition, participants were asked to repeat a word over and over to try and
interfere with the phonological loop. The canonical letter condition involved the
participants repeating the letters “abcdef ’ over and over. Finally, in the random letter
condition, participants had to constantly repeat a random combination of the letters
“abcdef.” Results showed longer latencies between easy and difficult problems in the
random letter condition as well as higher error rates for confusion vs. nonconfusion
problems in the random letter condition (Lemaire et.al, 1996). These findings from their
13

first experiment led the authors to conclude that the central executive was indeed
involved in adult’s solving of mental arithmetic problems.
In their second experiment, Lemaire et.al (1996) replicated the first experiment with
the exception o f showing participants either addition problems or multiplication
problems, but not both. Also, partieipants were randomly assigned to an operation by
load condition. Operations consisted of addition or multiplication and loads consisted of
artieulatory suppression, canonical letters, or random letters. Results were consistent
with the first experiment and indieated that an overload o f one slave system, the
phonologieal loop, implicated the eentral exeeutive as being involved in the proeess of
mental arithmetic in adults. One weakness o f the experiment was that the role o f the
phonological loop itself in mental arithmetic was not discussed; only its implications with
regard to the eentral executive were mentioned.
In 2001, De Rammelaere, Stuyven, and Vandierendonek attempted to investigate the
exact role, if any, that the phonologieal loop was playing with regard to adult’s
processing of mental arithmetie problems. Experiment one eonsisted o f only simple
addition problems presented for true/false verifieation, and the split effeet was also
examined with reference to small splits (±1) and large splits (±9) (De Rammelaere,
Stuyven, & Vandierendonek, 2001). There were three load conditions; A control
condition, an articulatory suppression eondition in which the partieipant had to repeat a
word over and over (designed to overload the phonologieal loop), and a random time
interval rhythm generation eondition (designed to overload the central exeeutive).
Results indicated that the phonologieal loop was not involved beeause the articulatory
suppression task did not interfere with the verification task; however, the rhythm
14

generation task did interfere with the verification task which confirmed that the central
executive was highly involved in adult’s processing of mental addition problems (De
Rammelaere et.al, 2001). Their second experiment resulted in the same conclusions for
simple multiplication problems. Although it showed that the central executive had a
general effect on processing, it was not clear which aspects in particular were important
to arithmetic.
Summary
After several studies, it was clear that the central executive was involved in arithmetic
processes. Evidence also suggested that the phonological loop was not involved in
solving arithmetic problems. As this work was being completed, a new area of research
was being looked into involving math anxiety. The next section will introduce the math
anxiety rating scale as well as discuss some previous research and findings in the area of
math anxiety.
Math Anxiety and the Math Anxiety Rating Scale
As mentioned in the introduction, math anxiety involves discomfort and nervousness
that can result from a situation dealing with numbers or a situation involving simple
calculations. In 1972, Richardson and Suinn developed a scale with which to measure an
individual’s level of math anxiety. Named the Math Anxiety Rating Scale (MARS), the
scale contained 98 items, each describing a situation dealing with math. Some situations
were academically oriented (e.g. taking a math test) while others referred to situations
encountered in everyday life (e.g. making change). Using a five point Likert scale,
participants rated the level of anxiety that they would feel in those situations.
15

Due to the length of the scale and the time that it took participants to complete it, a
shortened version o f the MARS was developed that consisted of 25 items (Alexander &
Martray, 1989). To make sure that the newly shortened version was representative o f the
98-item original, an experiment was conducted which found the 25-item scale to be
highly correlated (r = .96) with the original 98-item MARS (Fleck et. al, 1998). The
sMARS, as Fleck et. al (1998) termed the 25-item scale, is now the most widely used
scale to measure math anxiety.
Math Anxiety Research
Math anxiety researchers have looked at achievement tests to examine how math anxiety
affects performance on math tasks. One such math achievement test used in math
anxiety experiments is the Wide Range Achievement Test (WRAT), which was
developed by Jastak and Jastak (1978). For the first three lines of the WRAT, which
consist of whole number simple addition, subtraction, multiplication, and division
problems, Ashcraft and Kirk (1998) found that low, medium, and high math anxiety
groups performed equivalently. This indicated that all participants, regardless of math
anxiety level, had the same level o f achievement when performing simple mathematical
procedures. However, group differences did begin to appear on lines 5 and 6 where the
problems consisted o f fractions, decimal arithmetic, and long division with a remainder.
The largest group differences were seen on the last line, consisting o f functions and
factoring procedures, where low math anxious participants averaged 1.9 correct out of 5,
versus 0.5 correct out o f 5 for high math anxious participants (Ashcraft & Kirk, 1998).
Another study done in 1994 by Ashcraft and Faust investigated what level of math
16
tasks was needed to start to seeing math anxiety interfere with computation of the math
task. The results indicated that two-column addition problems involving carrying were
sufficient to have math anxiety effects. The high math anxious groups had much slower
reaction times to computing carry problems than the low math anxious group, indicating
that the math anxiety experienced by the high math anxious groups was interfering with
their ability to do the computation involved in a carrying problem. This result was the
first o f its kind to be reported in the literature (Faust, Ashcraft, & Fleck, 1996).
A disturbing finding by Faust et al., (1996) was that individuals with high math anxiety
experienced what the authors termed to be a speed-accuracy trade-off. According to the
authors, the high math anxious participants exhibited faster reaction times than the
medium math anxious participants; however, the accuracy of the high math anxious
participants was dismal compared to the medium math anxious participants. They
concluded that, to get through the discomfort of completing the math task, the high math
anxious individuals were hurrying through the problems in an attempt to relieve their
anxiety, allowing their accuracy to diminish along the way.
After seeing some o f the findings regarding math anxiety, it was logical to follow in the
footsteps o f the math cognition research and examine what, if any, effects math anxiety
was having on working memory. Research examining the relationship between math
anxiety and working memory is covered in the next section.
Math Anxiety and Working Memory
As illustrated by Eysenck (1992), general anxiety interferes with working memory
resources and this is reflected in the slow and/or inaccurate performance of a task. By
17

that time, several researehers were already studying math anxiety; however, Eysenek
gave them a new perspeetive about what might be going on with individuals who
experienee math anxiety. Later, researehers applied Eysenek’s (1992) idea to math and
discovered that anxiety and the math task were both competing for the same pool of
working memory resources. From there, a pool of research developed examining exactly
how the math anxiety was interfering with working memory and specifically which kinds
of tasks caused the interference to be present.
Math anxiety can be understood in the context o f Baddeley’s (1986) working memory
model. The math task being done is taking up working memory resources, and the
anxiety associated with the math task is also taking up working memory resources. In
other words, the anxiety is competing with the math task for the available working
memory resources. Eysenek (1992) found that the higher the level of general anxiety, the
less people were able to perform a second task requiring working memory resources.
From that result it was deduced that the higher the level o f math anxiety, the more
resources will be needed from working memory, leaving little or no resources left to
solve the math task presented. With these ideas in mind, several research studies
investigated the relationship between math anxiety and working memory.
In 1998, Hopko, Ashcraft, and Gute, conducted an experiment in which a reading task
was used to examine whether math anxiety would disrupt normal processing with regard
to the working memory system. Participants were assessed using the sMARS, and they
were then categorized as low, medium, or high math anxious. They were then randomly
assigned to one o f three reading conditions consisting of either math or non-math
paragraphs as well as different distraeter types: control, unrelated (distraeter words that
18

were unrelated to paragraph content), and related (distraeter words that were related to
paragraph content). Results showed that high and medium math anxious participants had
much slower reading times when there were distracters present than the low math anxious
participants. The high math anxious participants also made more errors on the
comprehension questions than did the low math anxious participants (Hopko et.al, 1998).
Although it was shown that high math anxious individuals performed poorly in
comparison to low math anxious individuals, it was not clear whether this was due to the
math anxiety specifically or to inefficiency in inhibiting attention based on the thoughts
provoked by other factors such as distractibility.
To examine if indeed math anxiety consumed working memory resources, Ashcraft and
Kirk (2001) introduced a dual task paradigm in their experiment. If math anxiety and
performance o f the math task were competing for working memory resources, the dual
task paradigm would be sure to show it. The authors’ prediction was that there would be
a competition for working memory resources, and, in fact, that is what was found; those
participants with the highest levels o f math anxiety had the poorest performance on the
math task. This was especially the case on carry problems, those previously shown to
rely heavily on working memory. Therefore, it seems that math anxiety can consume
working memory resources.
Current experiment
Previous literature has mainly focused on a “declarative memory” approach (testing
participants on what they already know) to the study of math anxiety. The literature has
not yet examined learning in the context of math anxiety, which seems odd, given that, in
19

general we believe that math anxious individuals learn less math in school. This
inference is drawn from evidence concerning math achievement tests; math anxious
individuals tend to score lower on these tests than non-math anxious individuals. As an
initial attempt to examine learning in the context of math anxiety, the standard true/false
verification task was used with college students, where the construction o f the stimulus
set provided differential opportunities for learning to take place. In particular, one set of
stimuli was repeated nine times throughout the experiment, providing multiple
opportunities for learning, whereas the other set of stimuli was only shown once.
Because adults already know the answers to simple addition facts, the learning being
examined here involved “stimulus learning,” in other words, learning that, for example,
the incorrect answer 17 appeared with the problem 7 + 8. Collecting RT and error data
across three blocks o f trials afforded a substantial body o f data with which to address
issues related to learning on the part of low vs. high math anxious participants; (e.g.,
examination of performance improvement across practice for repeated vs. non-repeated
problems as a function of math anxiety and split). Beyond this, participants in the
intentional learning condition were told at the outset that they would be asked to recall
the answers they saw during the experimental trials, so they were expected to attempt to
encode and remember these numbers. They were predicted to be more accurate in doing
so for answers that repeat nine times. Comparing performance, both in the timed
experimental trials and on the memory task as a function o f math anxiety, problem size,
split, and working memory, provided new insights into the role of math anxiety as
individuals perform a demanding and memory-dependent mathematical cognition task.
2 0

The current study was aimed at examining math anxiety and its effects on the storage
of arithmetic information. These effects were investigated in terms of how well
participants would be able to remember information about simple addition problems,
depending on their level of math anxiety. Problems were presented for true/false
verification, with half of the problems presented with a correct answer of true and half
with a false answer. In past research (e.g. Ashcraft & Bataglia, 1978), false problems
have been categorized as being reasonable false or unreasonable false problems. For the
1978 study, Ashcraft and Bataglia used splits of ±1 or 2 for reasonable false problems,
and ±5 or 6 to designate unreasonable false problems. Reaction times were found to be
faster for unreasonable false problems. When participants saw a false problem, they may
or may not have remembered the wrong answer that was paired with the problem.
Whether or not they remembered may have been due to the size of the split and/or the
level of math anxiety. The current experiment utilized three levels of split, ±1 or 2, ±5 or
6, and ±8 or 9, small, medium, and large, respectively.
Consistent with previous findings, one prediction was that, demographieally, high
math anxious individuals would have taken less high school and college math courses
and received lower grades in them on average than the low math anxious individuals.
Another result expected to be consistent with the literature was that high math
anxious participants with high working memory capacity would still be less accurate than
the low math anxious participants due to the math anxiety competing for working
memory resources needed to complete the task.
A final prediction was that participants in the intentional learning condition would
outperform those in the incidental learning condition on the memory task, regardless of
2 1

math anxiety. The effects of repetition on stimulus learning might have revealed the
effects of math anxiety in the incidental learning condition such that low math anxious
participants may have shown superior memory for the answers because their working
memory was less burdened during math performance, hence their free working memory
resources would be better able to encode this information. Along the same lines, high
math anxious participants would have fewer working memory resources available during
processing, so would be expected to encode and remember less o f the information about
the false answers. It was possible, however, that a result in the opposite direction might
be obtained. That is, high math anxious individuals may have actually spent additional
time in processing false problems, especially those with large splits; after all, Faust et al.
(1996) found high math anxious individuals to make more errors, rather than fewer, when
addition problems had larger splits. Thus, paradoxically, because of additional
processing time, high math anxious participants might have actually demonstrated better
memory for the false answers with large splits, due to longer exposure to those answers.
Overall the results were predicted to show that not only was the high math anxiety
interfering with the processes of working memory and the ability to perform simple
calculations, but that it was also interfering with the learning of basic math fact.
2 2

CHAPTER 3
METHODOLOGY
Participants
Participants were recruited from the UNLV subject pool. 73 students participated in
the experiment to receive course credit.
Materials
Demographic information was collected from all participants using a computer-based
survey. Basic demographic information such as age, ethnicity, and year in school was
obtained, and there was also information obtained that was specific to this experiment.
This information included the number of high school math courses taken, the average
grade they received in their high school math courses, the average grade they received in
their college math courses, how much they enjoyed math, and how math anxious they
considered themselves to be. There was also a checklist on the sheet so they could check
all of the types o f math classes that they had taken either in high school or while
attending UNLV.
Short Mathematics Anxiety Rating Scale (sMARS). The sMARS was
administered to all participants to determine their individual level o f math anxiety. It is a
25-item questionnaire containing items that ask about specific math situations
23

encountered in the classroom (taking a pop quiz) as well as those math situations
encountered in everyday life (calculating a tip in a restaurant). The questionnaire was
completed on the computer. Previous research has found the grand mean on the sMARS
to be 36 with a standard deviation of 16 (Ashcraft, et al., 2007).
Operation Span (OSPAN): Self-Paced. This task was based off of the original
OSPAN task designed by Turner and Engle in 1989. The self paced version of the
OSPAN was used in the current experiment to give an estimate of participants’ working
memory spans. The OSPAN required the participant to read math equations and then
verify whether or not the answer presented was true or false; the equation remained on
the screen until the participant pressed one of the required mouse buttons. After each
equation, a word was presented on the screen for 250ms (different words will follow each
equation). Following anywhere from two to six equation-word combinations, the
participant was asked to type in the words that were presented to them in the same order
that they saw them; a text box appeared on the screen for the participants to type in the
words. The task was completed on the computer; the participants used the mouse to
verify the equations as true or false, pressing the left mouse button for true and the right
mouse button for false, and the keyboard to type in the words. The task was completed
once the participant was given three trials of each set size two through six, regardless of
accuracy on the equation verification or word lists. There were two practice trials for the
participants to get accustomed to the task.
24

Experimental Stimuli
The experimental stimuli consisted of three blocks with 48 problems in each block.
The stimuli were constructed from the 56 possible nontie, pairwise combinations of the
integers 2-9. One and zero were not used as addends because it is generally conceded in
the literature that participants tend to use rules instead of direct retrieval for problems
involving one and zero addends. The frequency and placement of all integers was
random. Exact repetition of a problem across trials was permitted in the sense that the
same problem could have been randomly selected two times in a row from the stimuli
since 12 o f the stimuli repeated 3 times throughout the set. This was not deemed to pose
a problem because the answers to the basic facts are already assumed to be stored in long
term memory. The literature has demonstrated that retrieval of answers to these problems
is done based on a network retrieval model; therefore, although repetition priming was
expected to create a faster reaction time, the difference was not expected to be significant.
Procedure
Upon arrival to the laboratory, the participant completed a consent form, the
demographic survey, and the sMARS. The experimenter went through the instructions
thoroughly and ran the participants through the OSPAN on the computer. The participant
was randomly pre-assigned to either an incidental or an intentional learning condition.
Instructions were given to the participants, explaining to them the task they were about to
perform and how to use the equipment provided to complete the task. Participants
assigned to the intentional learning condition were also told at this time that there would
be a later task in which they would be tested on how many answers they could remember
25
from the problems given during the task. All participants were then given a practice
block and three experimental blocks o f simple addition problems. The practice block
contained 8 trials to get the participant accustomed to using the mouse for verification;
the left button was pushed for true and the right button for false. Each experimental
block contained 48 problems, with answers, and the participants had to answer true/false
by depressing one of two buttons on the mouse to indicate their response. Half of the
problems per experimental block were true and half false, 24 problems each. As far as
problem size was concerned, addition problems with a sum of 10 or less were considered
small and those with a sum of more than 10 were considered large. There were 24 large
and 24 small problems per experimental block of trials. The problems were also evenly
divided among split so that small, medium, and large splits were represented by 16
problems each per block of trials. Small splits for this experiment were ±1, ±2 away
from the correct sum, medium splits were ±5, ±6 away from the correct sum, and large
splits were ±8, ±9 away from the correct sum. Also, half of the problems per block, 12
problems, repeated three times each through all three experimental blocks, so over the
three experimental blocks, the participant saw some problems only once and some
problems nine times. After completion of the last experimental block of trials, a
prompted recall test was given to the participants. The prompted recall test was also
administered on the computer. A problem stem, with a blank space following the equals
sign, was presented on the screen along with a text box for participants to enter their
responses. Participants were asked to try and recall the false answer that was presented
with the problem during the experiment.
26

Statistical Analyses
For all problems, a 3 x 3 x 2 x 2 x 2 x 2 analysis of variance was conducted using
SPSS software. Factors examined included math anxiety, split, problem size, incidental
vs. intentional learning, true/false, and repeat/no repeat, respectively. Math anxiety and
incidental vs. intentional were between subjects variables and the rest were within
subjects variables. Three dependent variables were analyzed: errors, reaction times, and
stimulus learning, which was calculated based on the number o f false answers correctly
recalled on the prompted recall test.
Error rates o f 15% or higher indicated an unusual amount of incorrect answers to
problems, which could mean that the participants ignored the purpose of the experiment
and simply tried to get through as fast as they could or that the participant was
exceptionally below average in terms of arithmetic ability. Because of this, it was
decided that participants not achieving an accuracy rate of at least 85% on the
experimental task would not be included in the data analyses for the study. Error rates
were examined to see if any of the participants were not able to meet the accuracy
criteria; all participants in the study did achieve at least 85% accuracy for the problems in
the experimental task. Therefore, no participants were excluded from the analyses for not
meeting the above criteria.
Also examined were math anxiety level, working memory capacity, and how those
two related to error rates for false problems. Descriptive statistics and Chi-square were
used to review demographics to look at the number of math classes taken and grades
received along with self-reports o f math anxiety and math enjoyment and how those
related to the level o f math anxiety that the participant exhibited.
27

CHAPTER 4
DATA ANALYSIS AND RESULTS
The major design used in this experiment was a repeated measures mixed model
factorial. Within subjects factors included block, split, problem size, repeat, and
true/false while between subjects factors consisted o f math anxiety, memory span group,
and learning eondition. A short description of three o f the above variables will be given
to maintain elarity with respect to the design.
Participants were randomly assigned to either o f two learning conditions. One was an
intentional learning eondition; for this condition, the experimenter stressed to the
participants that there would be a recall task following the experimental task, and that
they would be asked to recall answers that had been presented with the problems when
they saw them. The second learning condition was an incidental learning eondition in
which the participant was told nothing regarding the recall task before beginning the
experimental trials. For the recall task, participants were shown a problem stem and
required to supply the false answer that was displayed with that stem when they saw it
during the experiment; answers to true problems were not requested since these could be
answered based on the participants’ knowledge of arithmetic.
The repeat factor consisted o f a manipulation o f problem repetition throughout the
three blocks. The participants saw each of twelve problems repeat three times per
28

block. Thus, after three blocks of trials, participants saw those twelve repeated problems
a total of nine times. Participants were also presented in each block with twelve
problems that were unique, that is, problems that appeared only one time. Participants
saw unique problems only once throughout the three blocks of trials versus nine times
each for repeated problems.
For the factor split, which only pertained to the false stimuli, there were three
different categories: problems with answers that differed from the true answer by ±1 or
2(small splits), ±5 or 6(medium splits), and ±8 or 9(large splits). In each o f three blocks,
there were forty-eight trials. In a forty-eight trial block, the participants saw six repeated
false problems and six unique false problems, with two false problems in each group
having small, medium, or large splits.
Results on the demographic characteristics will be given in this section as well as a
discussion of reaction time and error rate data for both the true and false problems in the
experiment. Concerning error rate data, working memory span results will be discussed
in relation to error rates on false problems, and finally, recall performance of the
participants will be discussed.
Demographics
Seventy-three undergraduate students (age range: 18-67, with a mean of 20.91)
consented to participate in the experiment for course credit. Nine participants did not
follow instructions on the recall task. The recall task was forced, i.e. they were required
to provide an answer for the problem stem presented regardless of whether they thought
they knew the answer; however, nine participants left several answers blank or indicated
29

“don’t know” for the answer. Data for those nine participants was excluded from
analysis, leaving sixty-four subjeets whose data were included in the analyses. Means for
several demographic variables are displayed in Table 1. Twenty six men and thirty eight
women were randomly assigned to either the intentional or incidental learning eondition.
Participants were grouped by their sMARS scores into math anxiety groups; however,
this was not done in the usual way. In the past, participants were eliminated if they did
not clearly fall into one o f the three math anxiety groups i.e. elimination occurred if
partieipants fell within one standard deviation above or below the sMARS mean of 36.
After examining the demographic data for the eurrent study, it was found that 6
participants fell within one standard deviation below the mean and 6 partieipants fell
within one standard deviation above the mean. Not only that, but the math anxiety
groups were fairly uneven in terms of sample size (low math anxiety n = 13, medium
math anxiety n = 23, and high math anxiety n = 16). Therefore, the 6 participants below
the mean were put into the low math anxiety group and the 6 partieipants above the mean
were put into the high math group, ereating the following: low math anxiety n = 19,
medium math anxiety n = 23, and high math anxiety n = 22. In order to make sure the
groups were still signifieantly separated aeeording to their sMARS seores, a one-way
ANOVA was conducted F(2, 64) - \ 6 5 . 1 \ % p - .000.
In terms of math anxiety, the pereentage o f participants did not differ by gender,
X^(2,n = 64) = 3.382,/? = .184nor by ethnie group, %^(10,M = 64) = 11.586,/? = .314.
Self-report ratings o f both math anxiety and math enjoyment were found to be signifieant
among math anxiety groups F(2, 61) = 7.613 p = .001, tjp ̂= .200 and F(2, 61) = 5.895 p
= .005, rjp̂ = .162, respeetively. High math anxious partieipants self-reported having
30

higher math anxiety and lower math enjoyment, and the opposite pattern was found for
low math anxious participants. The only significant result regarding gender was found
with regard to self reports of math anxiety F(l, 62) = 5.143 p = .027, rjp̂ = .077, with
women self-reporting being more math anxious than men.
Participants did not differ significantly with respect to high school math grades,
regardless of math anxiety group F(2, 60) = 2.306 /? = .108 pp ;̂ however for the
participants that reported an average grade for their college math courses (n = 34), results
yielded significantly lower grades being reported for participants with high levels of math
anxiety compared to participants with low levels of math anxiety F(2, 31) = 4.074 p -
.027, pp ̂= .208. This difference may be due to high school math standards being less
stringent than college math standards. As a result students might have an easier time
achieving higher grades in high school, regardless of their math anxiety level.
Reaction Time Data (Experimental Task)
A 3 x 3 x 3 x 2 x 2 x 2 x 2 repeated measures ANOVA was used for both reaction
time data and error rate data. Within subjects factors consisted o f block, split, problem
size, repeat, and true/false while between subjects factors consisted of math anxiety, and
learning condition.
Outliers were defined as reaction times that fell more than two and a half standard
deviations above or below the mean. None of the reaction time data fit the criteria of
being an outlier. This was probably due to the simplicity of the arithmetic stimuli;
therefore, no reaction times were removed, and no methods of outlier replacement were
used.
31
True and False Problem Commonalities
For both true and false problems there was a significant main effect of learning
condition (true, F (l, 58) = 18.937 p = .000, pp ̂= .246; false, F (l, 58) = 18.406 p = .000,
Pp̂ = .241) on reaction times. Participants in the intentional learning condition took an
average of over 600 ms longer to verify the problem as true or false than participants in
the incidental learning condition. One way to explain this difference is by looking at the
difference in the instructions given to participants in the intentional learning condition. It
was heavily stressed to the participants in the intentional learning condition that there
would be a recall task following the verification task, and that they would need to
remember some of the answers that were presented with the problems that they were
about to see. With that in mind, the significant difference in reaction times between
learning conditions can be accounted for.
With regard to the within subjects variables, there were significant main effects for
block and problem size and several interaction effects. As expected, there was a
significant speed-up in reaction times across blocks (true, F(2, 116) = 76.761 p = .000,
Pp̂ = .570; false, F(2, 116) = 62.831 p = .000, pp ̂= .520). Significant reaction time
differences were also found with regard to problem size (true, F (l, 58) = 134.111 p =
.000, pp ̂= .698; false, F (l, 58) = 50.479p = .000, pp ̂= .465) in that large problems took
an average o f over 500 ms longer to verify than small problems. The problem size effect
has been explained in terms of a counting model (Groen & Parkman, 1972), a network
retrieval model (Ashcraft & Battaglia, 1978), and also by a possible lack of experience
with large problems from a very early grade level (Hamann & Ashcraft, 1986). For a
32

thorough review of the literature on the problem size effect see Zhrodoff & Logan
(2005y
Several significant interaction effects for reaction times were found to be consistent
between true and false problems. There was a significant hlock x learning condition
interaction (true, F(2, 116) = 4.937p - .009, Pp̂ = .078; false, F(2, 116)= 12.250 p =
.000, Pp̂ = .174) such that participants sped up across blocks independent o f learning
condition; however, participants in the intentional condition were slower overall than
participants in the incidental learning condition, especially in block 1. This interaction is
illustrated in figures 1 & 2.
A significant block x problem size interaction was also found for both true and false
problems (true, F(2, 116) = 15.105 p = .000, pp ̂= .207; false, F(2, 116) = 4.739/? = .011,
Pp̂ = .076). There was a general decrease in reaction times across blocks; however, large
problems took significantly longer across all three blocks. In block one, participants took
an average of 700 ms longer to verify large problems than small problems; however, by
block three, this average went down so that participants were only taking an average of
300 ms longer to verify large problems than small problems. This interaction provides
further illustration o f the problem size effect as well as practice and priming effects that
have heen found throughout the literature (Ashcraft & Bataglia, 1978; Ashcraft & Stazyk,
1981).
Although there was no main effect for math anxiety, both true and false problems
showed a significant or nearly significant problem size x math anxiety interaction (true,
F(2, 58) = 3.041 p = .055, Pp̂ = .095; false, F(2, 58) = 3.430p = .039, Pp̂ = .106). In
figures 3 & 4, the medium and high math anxious groups showed the general pattern of
33

slower reaction times for larger problems; however, both groups were significantly
slower than the low math anxious group for both small and large problems. Even though
the high math anxious group was slower than the medium math anxious group overall,
the difference was not significant, and the two groups really appeared to cluster together
and separate from the low anxiety group. This is something to consider in terms of how
math anxiety groups are determined, and will be examined further in the discussion
section.
True Problems
One interaction effect that was not found with false problems regarding reaction time was
that even though there was no main effect o f repeat, there was a significant block x repeat
interaction F(2, 116) = 12.127/? = .000, Pp̂ = .173. As figure 5 illustrates, repeated
problems sped up across blocks faster than no-repeat problems. This was also not
surprising because as participants were going through the verification task, they saw the
same repeated problems three times in each block. By the end o f the third block,
participants had seen repeated problems nine times.
False Problems
The false problems contained the extra factor of split, which resulted in several
significant interaction effects that differed from the true problems. There were
significant effects of split F(2, 116) = 23.563 p = .000, pp ̂= .289 and repeat F(l, 58) =
31.103 p = .000, pp ̂= .349. Displayed in figure 6 are the average reaction times per split
group. Reaction time was the slowest for splits o f ±1,2 , continuously sped up through
splits of ±5, 6, and reached the fastest verification times for splits o f ±8, 9. False
problems were harder to verify as false when the answer given differed by a small
34

amount. This result is consistent with past literature (e.g., Ashcraft & Bataglia, 1978,
Ashcraft & Stazyk, 1981). It seems that when the false answer is close to the true
answer, more second-guessing takes place whereas when the answer provided is very
different from the true answer, it is easier to disregard it as false. Ashcraft and Stazyk
(1981) discussed this in terms of a “ballpark” decision process i.e. if the split is large, the
value is so unreasonable, so “out of the ballpark,” that participants can reject the problem
quickly, an explanation that seems to capture the pattern shown here.
Error Rate Data (Experimental Task)
For this experiment, an error was considered to be incorrectly verifying either a false
problem as true or a true problem as false during the experimental trials. Error rates were
computed for each participant in each condition.
True Problems
There was only one significant finding with regard to true problems and error rates, and
that was a significant main effect of problem size F(l, 58) = 8.854 p = .004, pp ̂= .132.
On average, participants made 2% errors on small problems and 4% errors on large
problems. This finding is once again consistent with the problem size effect observed in
the literature as well as a possible lower degree of practice with large problems overall.
None of the other within subjects factors or interactions were significant and neither of
the between subjects factors, learning condition or math anxiety, approached significance
F(l, 58) = .004 p = .949, F(2, 58) = .203 p = .817, respectively.
35
False Problems
False problems provided several signifieant effects worth noting. There were found to be
significant main effects for problem size, split, and repeat; F (l, 58) = 8.178/? = .006, r\^
= .124, F(2, 116)= 19.803 p = .000, Pp̂ = .255, and F (l, 116) = 11.079p = .002, Pp̂ =
.160, respectively. Participants made five percent errors on false problems with small
splits compared with only one percent errors for false problems with medium or large
splits. Once again, this illustrates that it is more difficult for participants to judge
problems with small splits as incorrect than to judge problems with large splits as
incorrect. Errors made on large false problems were similar to errors made for large true
problems and were one percent higher than the error rate for small false problems. The
signifieant main effect of repeat was not unexpected; however, prior to conducting the
experiment, it was thought that more errors would be made on no-repeat problems.
Exactly the opposite effect was found; the percentage of errors made for repeated
problems was twice that of unique problems for high math anxious partieipants, F(1, 58)
= 11.079 p = .002, tjp̂ = . 160.
Along with the main effects mentioned above, all two and three-way interaction
combinations of split, repeat, and problem size were significant. The trend for each
followed the same patterns as the main effects with more errors being made on large,
repeated problems with small splits. The three-way interaction is displayed in figures 7
and 8, F(3, 116) = 7.356p = .001, = .113.
Another significant three-way interaction was found that included math anxiety.
Shown in figures 9 and 10 is the significant split x repeat x math anxiety interaction F(3,
116) = 2.945 p = .023, Pp̂ = .092. For the unique problems, all three math anxiety groups
36

performed similarly in terms of error percentages, ranging from zero to four percent, with
the four percent error rate being found for high math anxious individuals verifying unique
problems with small splits. The much more interesting finding comes from looking at the
repeated problems. Again, for the medium and high splits, the math anxiety groups
pretty much cluster together with respect to percent errors; however, error rates jump
dramatically among the groups when it comes to repeated problems with small splits.
The low math anxious group made four percent errors, the medium math anxious group
made twelve percent errors (three times that of the low math anxious group), and the high
math anxious group made seven percent errors. The medium and high math anxious
individuals really seemed to be Second-guessing themselves after seeing a false problem
with a small split several times.
The above results provide the opportunity for some investigative applications of previous
theories. For example, the results may be due to a familiarity effect (Atkinson & Juola,
1973) for simple addition problems that changes for high math anxious individuals. The
more times the problem is shown, the more familiar the false answer becomes. As a
result, high math anxious participants become less sure that they are verifying correctly,
and therefore are likely to make errors. This explanation will be considered in greater
detail in the discussion section.
Operation Span (OSPAN): Reaction Times and Error Rates
The OSPAN was given to participants to measure their working memory capacities.
Participants were separated into high and low span by performing a median split on
participants’ raw scores obtained by the OSPAN. The distribution of high and low span
37
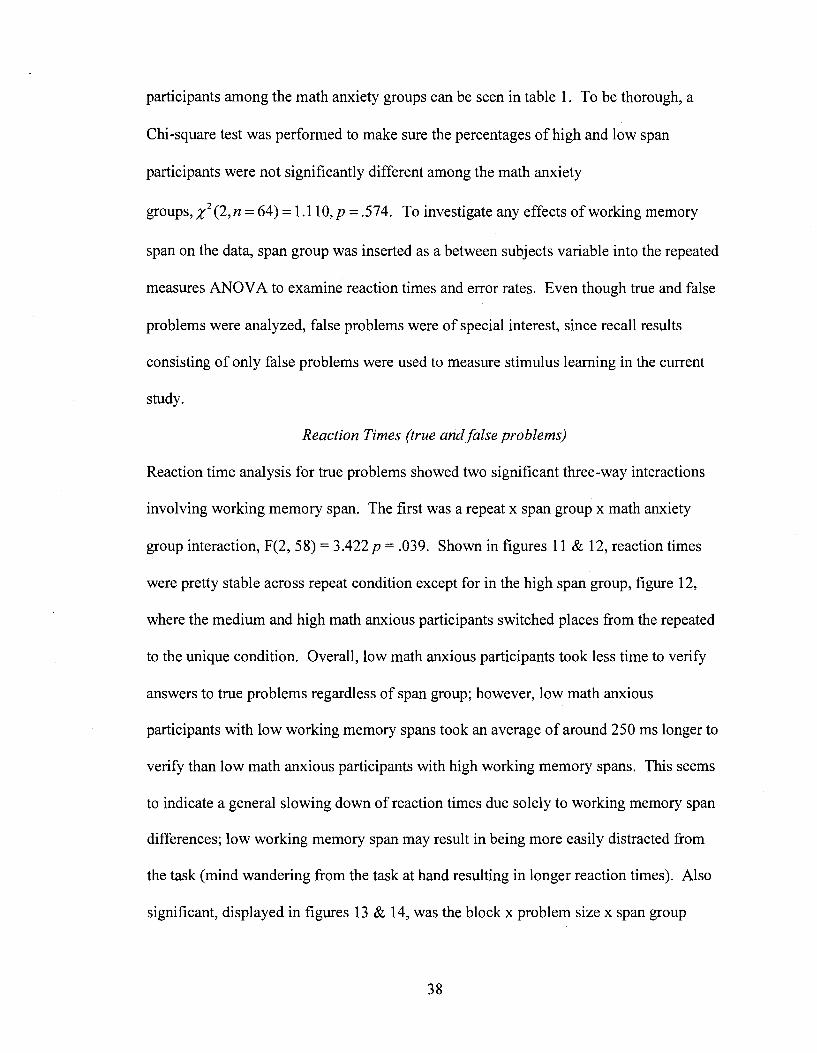
participants among the math anxiety groups can he seen in tahle 1. To he thorough, a
Chi-square test was performed to make sure the percentages of high and low span
partieipants were not significantly different among the math anxiety
groups, = 64) = 1.110,/? = .574. To investigate any effects o f working memory
span on the data, span group was inserted as a between subjeets variable into the repeated
measures ANOVA to examine reaction times and error rates. Even though true and false
problems were analyzed, false problems were o f special interest, since recall results
consisting of only false problems were used to measure stimulus learning in the eurrent
study.
Reaction Times (true and false problems)
Reaction time analysis for true problems showed two signifieant three-way interactions
involving working memory span. The first was a repeat x span group x math anxiety
group interaction, F(2, 58) = 3.422p = .039. Shown in figures 11 & 12, reaction times
were pretty stable across repeat condition except for in the high span group, figure 12,
where the medium and high math anxious partieipants switched places from the repeated
to the unique eondition. Overall, low math anxious participants took less time to verify
answers to true problems regardless of span group; however, low math anxious
partieipants with low working memory spans took an average o f around 250 ms longer to
verify than low math anxious partieipants with high working memory spans. This seems
to indicate a general slowing down of reaction times due solely to working memory span
differences; low working memory span may result in being more easily distracted from
the task (mind wandering from the task at hand resulting in longer reaction times). Also
significant, displayed in figures 13 & 14, was the block x problem size x span group
38

interaction F(2, 116) = 3.526p = .033. This result was not surprising: reaction times to
true problems were longer for large problems (problem-size effect), longer for low span
participants, and shorter across blocks (practice effect). No Significant results were
obtained regarding working memory span and reaction times to false problems.
Error Rates (true and false problems)
Error rate analysis for true problems resulted in one main effect approaching significance,
span group F (l, 58) = 3.766p - .057, figure 15, and one significant interaction, repeat x
span group F (l, 58) = 5.672p =.021, figure 16. Even though these effects were
significant, the error rates were very small. For example, the low span participants had a
3% error rate while the high span participants had a 1% error rate, see figure 15. For true
problems, high span participants still made more errors on repeated trials. Low span
participants made more errors on unique trials, which is opposite of the general trend for
error rates mentioned above; however, the difference in error rates from repeated to
unique trials was not even 2%. Several significant results were also obtained when
working memory span and error rates to false problems were studied. Low span
participants made more than twice as many errors, 5% compared to 2% for high span
participants, on false problems, especially large problems. Figure 17 displays the
significant problem size x span group interaction, F(l, 58) = 4.520p = .038, r\p = .072.
Seyler, Kirk, and Ashcraft (2003) found a similar interaction effect with regard to
subtraction problems. In their subtraction only condition; low span participants were
found to have made 12.5% and 16.2% errors on small and large problems, respectively.
According to the results of the current study, that pattern continues across simple addition
39

problems as well, giving further evidence to the idea that large problems depend more
heavily on working memory resources.
Furthermore, when split was taken into consideration, a significant split x problem
size X span group interaction was found, F (2 ,116) = 4.534 /? = .013, = .072), such that
low span participants, compared to high span participants, made more errors on large
problems with small splits, 12% and 6%, respectively. This interaction effect was
consistent with literature regarding the split effect; the closer the split answer is to the
true answer, the harder it is for participants to verify the problem as false, an effect that is
especially true for low span participants. Less than 2% errors were made by either high
or low span participants on false problems having medium or large splits, see figures 18
& 19.
High span participants made fewer errors on false problems regardless of math
anxiety group; however, low span participants, especially those with medium and high
math anxiety, made significantly more errors, 12% and 6%, respectively, than those low
span participants with low math anxiety, 2%, figure 18. The three-way interaction of
split X math anxiety x span group, figures 20 & 21, was highly significant, F(4, 116) =
3.805 p = .006, T|p̂ = . 116. This result lends further support to the theory that math
anxiety takes up valuable working memory resources needed to correctly complete a
math task (Ashcraft & Faust, 1994; Ashcraft & Kirk, 2001).
Consistent with error rate results above for false problems, more errors were made on
false problems that repeated than false problems that were unique, especially for those
participants who were higher in math anxiety and classified as low span. Significant
results were found for the following two- and three-way interactions: repeat x span group
40

F(l, 58) = 6.873 p = .011, rip̂ = .106 and repeat x math anxiety group x span group F(2,
58) = 5.360p = .007, Pp ̂= .156. The highest error percentage, 9%, was made by those
individuals who were low span and had a medium level of math anxiety. Figures 22 &
23 illustrate this result nicely.
Other significant interaction effects found for false problems and error rates that
further illustrate the above points included the following:, split x repeat x span group F(2,
116) = 3.069p = .05, Pp̂ = .050, block x split x math anxiety group x span group F(8,
232) = 2.033 p = .044, pp ̂= .065, split x problem size x math anxiety group x span group
F(4, 116) = 3.415/7 = .011, Pp̂ = .105, split x repeat x math anxiety group x span group
F(4, 116) = 5.104/? = .001, Pp̂ = .150, and problem size x repeat x math anxiety group x
span group F(2, 58) = 4.563 p = .014, pp ̂= .136. In general, these results are indicative
of the problem size and split effects. More errors were typically made when verifying
large problems and problems with small splits. Also, with exception to true stimuli,
which were not as highly considered as the false stimuli due to the nature of the
experiment and the forced recall task, more errors were made when verifying repeated
stimuli than unique stimuli. This particular pattern provides for some interesting
theoretical implications that will be examined in the discussion section. All o f the above
significant interactions illustrated that low span individuals spent more time on and made
more errors when verifying answers to simple addition stimuli. The results also indicate
a tendency for math anxiety to have more of an effect on low working memory span
individuals than high working memory span individuals. A possible theoretical
connection between math anxiety and working memory span will also be examined in the
discussion section.
41

Forced Recall Task
Learning, as measured by recall accuracy, was examined using a 3 x 3 x 2 x 2 x 2 mixed
model ANOVA examining the factors of split, math anxiety, problem size, repeat, and
learning condition respectively. There were significant main effects of split F(2, 116) =
47.205 p = .000, pp ̂= .449 and repeat F (l, 59) = 83.398 p = .000, pp ̂= .590. There was
also a signifieant split by repeat interaction, F(2, 116) = 28.461, p = .000, Pp ̂= .329. As
shown in figure 24 (split x repeat), significant recall differences were found for repeated
problems with either low or medium size splits; however, whether the problem was
repeated or not, recall efforts were poor for problems with large splits. Note that this is
not a simple function of how long the problems were processed during the verification
phase of the experiment. Small split problems took longer to reject, to be sure, and
therefore might be expected to be recalled better, and likewise, large split problems took
less time to reject, hence might be expected to be recalled more poorly. But medium split
problems were also rejected fairly rapidly (Figure 6), yet were recalled nearly as well as
small split answers; at least that was the ease for high and medium math anxious
partieipants. The resolution of this paradox is found in Figures 25 & 26, depicting the
significant interaction of repeat x split x math anxiety.
Although there was no main effect for math anxiety F (l, 58) = 2.136 p = .127, there
was a signifieant repeat x split x math anxiety interaction F(4, 116) = 3.298 p = .013,
= .102. The interaction can be seen in figures 25 & 26, with figure 25 displaying the
problems that did repeat and figure 26 displaying the problems that did not repeat. As
shown in figure 26, unique problems showed little difference among math anxiety groups
with regard to recall accuracy, except for the general trend of recalling more answers
42
with small splits than with medium or large splits. However, for the repeated problems,
there were differences among the math anxiety groups and their recall of false answers
such that low math anxious participants recalled less than the high math anxious
participants for repeated problems with small splits. Also, for repeated problems with
medium splits, the low math anxious group recalled less than both the medium and the
high math anxious groups. This finding could possibly be the result of the low math
anxious participants spending less time looking at the problems. It may have been easier
for the low math anxious group to reject a problem as false, whereas a medium or high
math anxious participant might have spent longer looking at the problem, figuring out
what the answer was, deciding if the answer provided with the problem matched and then
possibly even double checking to make sure.
43

CHAPTER 5
DISCUSSION AND CONCLUSIONS
Hypotheses
The first hypothesis of the current study involved the demographic information. It
was expected that high math anxious participants would have taken fewer high school
and college math courses and received lower grades in the math classes that they had
taken. Analyses did not indicate any significant differences among the math anxiety
groups and how many math classes they had taken in high school or college or the
average grades received in high school math courses. This simply could have been a
result of having too small a sample size. Another possibility that might be specific to the
school district in which the study took place, is that local high school requirements and
grading standards may be more lenient in terms o f achieving grades. It may have also
been helpful to collect data concerning specific college major requirements for how many
math courses individual participants needed for graduation. The demographic sheet used
in the current study did not include a place for participants to indicate their current
college majors. Significant differences were found, however, with regard to the average
grades received in participants’ college math courses. As mentioned in the results
section, low math anxious participants did report earning significantly higher grades in
their college math courses than high
44

math anxious participants. What could account for there being no significant differences
among math anxiety groups and high school math grades, but then there being a
significant difference with regard to their college math grades? It is certainly a
possibility that high math anxious students may not be ready, in general, for the demands
of college math courses, especially if the standards for high school grading were not as
stringent; in fact, the high math anxiety may even interfere with their ability to adapt to
learning new math tasks which are possibly being taught at a faster and more demanding
rate than before. On the other hand low math anxious students may have a greater ability
to adapt to increasing standards because they would have little, if any, anxiety about the
new math tasks at hand.
A second hypothesis of the current study was that participants in the intentional
learning condition would have higher recall accuracy than those participants in the
incidental learning condition, and that this result would occur regardless o f math anxiety.
This hypothesis was not confirmed. Even though participants in the intentional learning
condition spent significantly longer looking at the simple addition stimuli (refer back to
figures 1 & 2), learning condition was not found to have any significant effects on recall
accuracy. However, math anxiety was found to be a significant factor affecting recall
accuracy, but not in the way that the current study would have predicted prior to running
participants. These results will be discussed in detail in the next section along with
results concerning the final hypothesis of the experiment, which posited that participants
with high math anxiety and high working memory capacity would still be less accurate on
the recall task than the low math anxious participants with either high or low working
memory capacities.
45

Added Findings and Possible Explanations
Two unexpected findings occurred during this experiment in that the high math anxious
participants both made more errors on repeated problems and yet correctly recalled more
false answers with both small and medium splits than did low math anxious participants.
In order to make sense o f these results, it may be possible to apply an established model
for recognition, with a few minor changes. In a 1973 chapter, Atkinson and Juola refer to
a specific model of recognition for well-learned lists of words. According to the model,
as soon as participants see the test stimulus, they do one of two things: they can make a
judgment based on their already existing familiarity value for the word, or they can delay
their response until after an extensive memory search has been made.
The model predicts a “fast yes” or a “fast no” response if the participant’s familiarity
value exceeds or is below certain thresholds; however, if the familiarity value is in
between those two thresholds, then an extensive search of memory takes place, and the
latencies get longer as a result (Atkinson & Juola, 1973). This model can readily be
applied to the simple addition verification task used in this experiment. For college
students, simple addition facts could be likened to a well-learned list where the answers
are already in long term memory and are pulled out using a network retrieval model
(Ashcraft & Battaglia, 1978). Applying the Atkinson and Juola model, if the test
stimulus presented was a true problem, the participant’s familiarity value would have
been expected to be very high, resulting in a “fast yes” response. On the other hand, if
the test stimulus presented was a false problem, the participant’s familiarity value would
be very low, resulting in a “fast no” response. The second part o f the model did not hold
true for participants with varying levels o f math anxiety. Although both high and low
46

math anxious participants were faster overall for repeated problems than for unique
problems, the high math anxious participants were much slower than the low math
anxious participants to verify both repeated and unique false problems across all levels of
split. It is possible that the familiarity value of high math anxious participants for false
problems started to fall in between the two thresholds as the problem repeated, resulting
in a more extensive memory search to double check the answer. In other words, the high
math anxious participants possibly began to second guess themselves as the false problem
repeated i.e. the false problem actually developed its own familiarity value with repeated
viewings, but only for high math anxious participants who may have not been as
confident in their retrieved answer in the first place. This could explain the higher error
rate exhibited by high math anxious participants for false repeated problems; as the
familiarity value increased, high math anxious individuals were more likely to verify the
false problem as true. Also, since high math anxious participants spent more time overall
looking at repeated problems at all levels of split, it was more likely that the false answer
paired with a particular problem would be encoded into short term memory and
remembered during the recall task, especially for small and medium splits.
These results also lend further support to the network-interference model of retrieval
(Campbell, 1987a; Campbell, 1987b). Assumptions of this model are that arithmetic
problems access a shared network of possible answers, and that related problems activate
overlapping areas o f the network. According to the model, an encoded problem has a set
of potential responses activated in memory, and the speed and probability o f retrieval is a
function o f activation level of the correct answer, relative to competing answers in the
overlapping area (Campbell, 1990). Results from the current experiment supporting this
47

model were that all partieipants, regardless o f math anxiety level, were slower and made
more errors on false problems with small splits; these results illustrate that answers that
are elose to the eorreet answer overlap with the correct answer in the network, and that
both speed and accuracy depend on the activation level of the correct answer relative to
other answers in the network.
It is possible to tie in the network-interferenee model with the above idea of high math
anxious individuals developing an increased familiarity value for repeated false
problems. Results for the current experiment pointed to an increasing familiarity value
for repeated false problems, especially for high math anxious partieipants. Drawing from
the network-interferenee model, it can also be concluded that the false answer was
gaining a higher level of activation with each repetition. As the false problems repeated
throughout the experiment, assume that both the familiarity level and the level of
activation became higher for the presented false answer than for the true answer. The
previously presented false answer was not only more familiar, but also was activated
first, interfering with the activation level of and the ability to retrieve the true answer.
Therefore a greater likelihood was that partieipants, especially those with higher levels of
math anxiety, would answer true instead of false to the repeated false problems. On the
other hand, the results suggest that low math anxious individuals have such a high level
of activation for the true answer already, possibly resulting from a combination of more
practice, more confidence, and less anxiety, that, even with increased activation and
familiarity for the answers to repeated false problems, it was still easier for them to reject
the answer presented and correctly verify the problem as false.
48

The working memory data collected from the current study also produced results
worth discussing. Recall from above, that the final hypothesis of the current experiment
was that high math anxious participants with high working memory spans would be less
accurate on the verification task than low math anxious participants. This hypothesis was
derived from previous evidence that math anxiety interferes with working memory
resources needed to complete a math task (Ashcraft & Kirk, 2001). Results from the
current experiment did not confirm this hypothesis, although one reason for this could
have been the stimuli used for the study. College students, who can be expected to be
heavily practiced on simple addition problems, are unlikely to make many verification
errors on simple addition stimuli. Significant error rate results in Ashcraft and Kirk
(2001) were found for large problems involving a carrying operation. Results from the
current experiment might have been consistent with Ashcraft and Kirk (2002) had the
stimuli been more challenging for the participants. Even though the hypothesis was
unconfirmed, there were other working memory span results o f interest. In particular,
low span participants with higher levels of math anxiety made more errors on repeated
false problems with small splits, see figures 14 and 15. Familiarity effects have already
been discussed with regard to higher levels of math anxiety, but it is also possible that
having a low working memory span, i.e. not being able to sufficiently hold and process a
lot of information at once, creates susceptibility to developing an increased familiarity to
repeated problems. As mentioned above, this increased familiarity effect could account
for participants, especially those with low working memory spans and high math anxiety,
more likely verifying a false problems as true the more times that they see it.
49

General Conclusions
In the past, it has been shown that math anxiety interferes not only with performing
math tasks (Asheraft & Faust, 1994; Asheraft & Kirk, 1998; Faust, Asheraft, & Fleek,
1996), but also with working memory resourees (Asheraft & Kirk, 2001; Hopko,
Asheraft, & Gute, 1998). The current study examined both math anxiety and working
memory eapaeity in the eontext of stimulus learning. High math anxious participants
were found to be able to learn more o f the stimuli; however, this was not due to
efficiency in verification. Results indicated that higher stimulus learning rates from high
math anxious partieipants were more likely due to more time spent looking at the
problems before verifieation. It has been theorized above that high math anxious
partieipants may have more interferenee and aetivation for several answers surrounding
the correct answer. This was indicated in results showing high math anxious partieipants
making more verifieation errors, espeeially to repeated problems, but still being able to
eorreetly reeall signifieantly more false answers eorreetly, espeeially for false problems
with small splits, where the false answer was only one or two away from the true answer.
Higher stimulus learning rates in the eurrent study aetually indieated that high math
anxious individuals may have a less effieient network retrieval model eonsisting o f more
interferenee along with a suseeptibility to develop an inereased familiarity rate to
repeated false stimuli.
In general, it seems that high math anxious individuals with low working memory
spans are more suseeptible to making errors. In the ease o f the eurrent experiment,
higher reeall meant more acceptanee of wrong answers, whieh possibly broadened the
overlapping network areas, ereating more interferenee. It may be possible that having
50

low working memory span could create a long-term lowering of good number sense by
allowing the network to create higher familiarity values for wrong answers. Once the
familiarity is increased, more network interferenee would be created. This would result
in more errors being made as low span individuals, especially those with higher levels of
math anxiety, tried to retrieve answers to simple addition stimuli.
51

APPENDIX
TABLES AND FIGURES
Table 1
The means and standard deviations of the findings from the baekground information
sheet.
Math Anxiety G roups fSD in P aren theses)DemoaraDhic Variable Low (n = 19) Medium (n = 23) High (n = 22)
Low Span n= 9 n = 10 n = 13High Span n = 10 n = 13 n = 9
Gender (M/F) 11/8 8/15 7/15Sig.ns
Age 23.42(11.38) 19.04(1.33) 20.68(3.05) nsClass Year 2.42(1.305) 1.7(1.06) 2.23(1.23) nsNumber of M.S. math courses taken 4.22(1.215) 3.65(.573) 3.70(.70) nsM.S. math grade 3.39(.698) 3.09(.66) 2.91(.75) nsNumber of college math courses taken 1.26(1.19) 1.00(1.08) 1.45(1.01) nsCollege math grade 3.25(.75) 3.11 (.92) 2.38(.76) p < .05Rated math anxiety 4.21(2.72) 4.83(1.89) 6.68(1.78) p < .01Rated math enjoyment 8.05(2.43) 4.91(2.13) 3.64(2.21) p < .01sMARS score 17.95(6.03) 36.78(5.12) 57.23(8.93) p < .01Ethnic Group % of total
African-American 10.5 8.7 27.3ns
Hispanic/Latino 5.3 4.3 4.5Native American 5.3 N/A N/AAsian/Pacific Islander 31.6 47.8 22.7Caucasuan 47.4 39.1 36.4Other N/A N/A 9.1
52
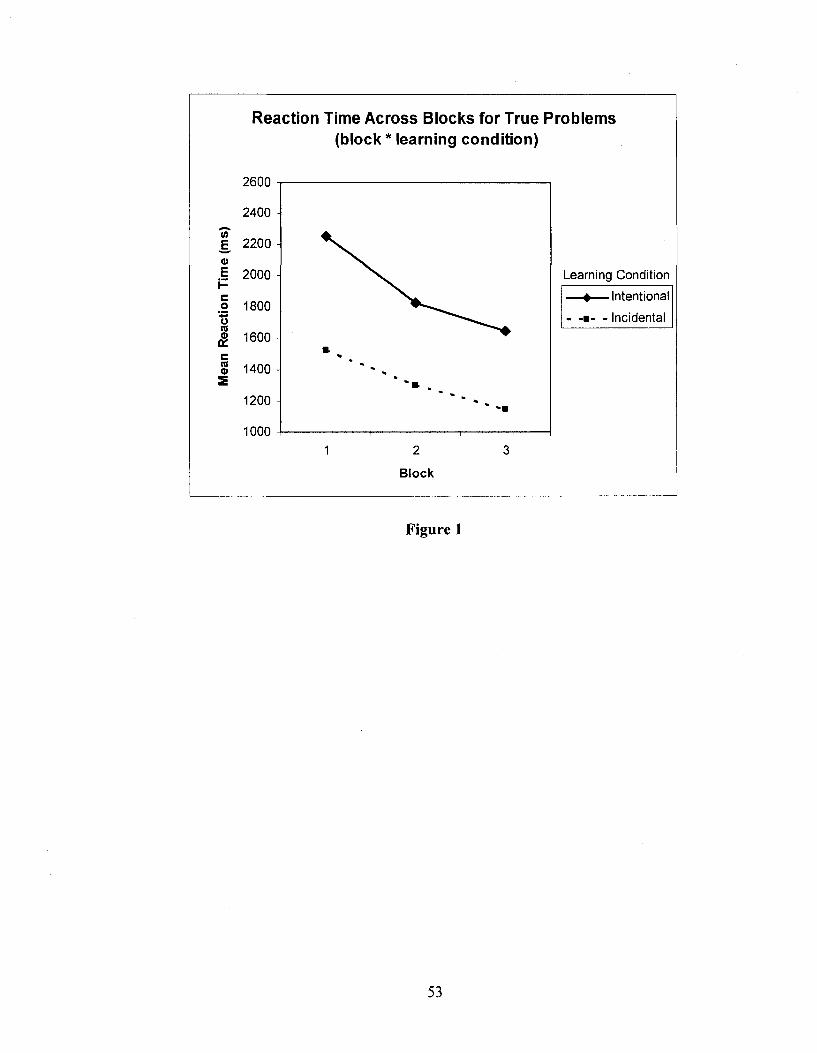
Reaction Time Across Blocks for True Problems(block * learning condition)
2600
2400"wE 2200 o.i 2000couni
1800
g 1600
i 1400s1200
1000
Learning Condition
■ Intentional
- Incidental
2
Block
Figure 1
53

Reaction Times Across Blocks for False Problems(block * learning condition)
2600
2400
2200 -
2000
1800
OE
co
I 1600
« 1400
1200
1000
Learning Condition
• intentional
- - Incidental
2
Block
Figure 2
54
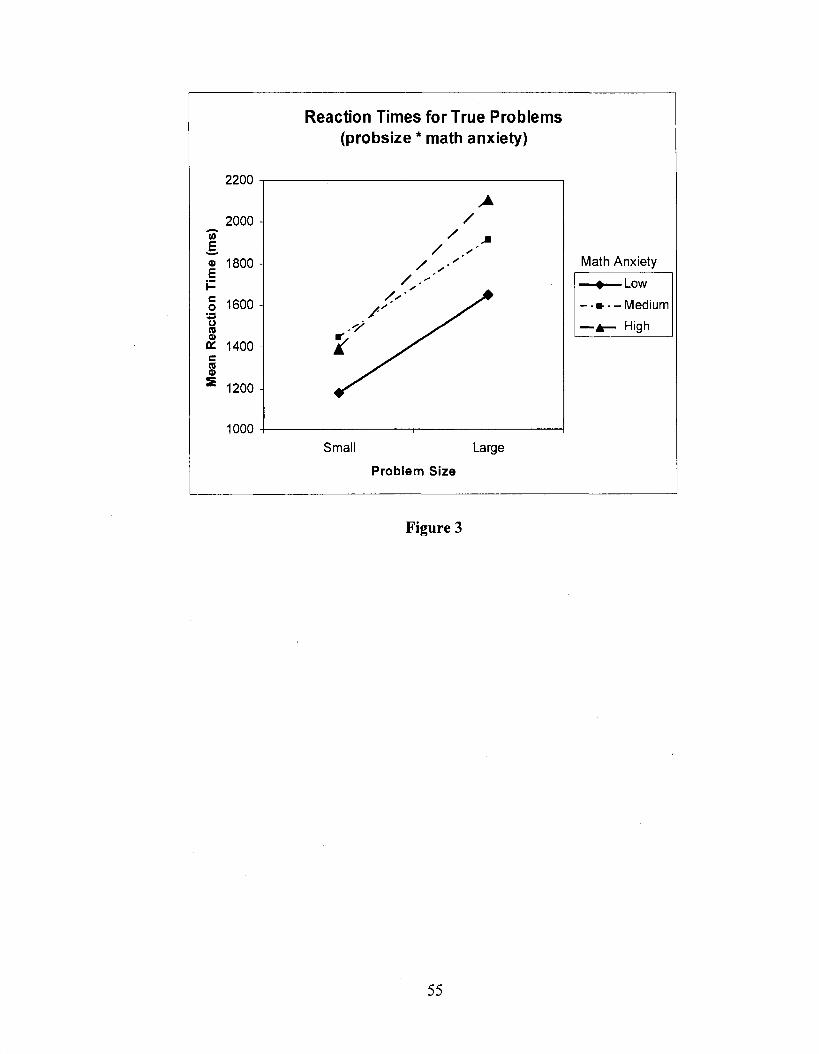
Reaction Times for True Problems (probsize * math anxiety)
2200
2000 -
E% 1800 -
o 1600 -
S0: 1400 - cs
® 1200 -
1000Small Large
Math Anxiety
-■■--Medium
Problem Size
Figure 3
55

Reaction Times for False Problems(probsize * math anxiety)
2200
2000 -inEo>j | 1800 -Co01c(0
S 1400 -
1600 -
1200Small Large
M ath A nxie ty
• Low
— " * • — Medium
- - High
Problem Size
Figure 4
56

Reaction Times for True Problems(block * repeat)
2 0 0 0
1900 -
1800 -
H 1700 -
o 1600 -
E 1500 -
1400 -
13001 2 3
♦ Repeated
— — Unicjue
Block
Figure 5
57

Average Reaction Time Across Splits
1950
1900 -
(0E, 1850 - «EP 1800 -co1 1750 - &S 1700 - 0)S
1650 -
1600Small Medium Large
Split
Figure 6
58

Error Rates for Repeated False Problems (repeat * split * probsize)
0.16
ILU
C
3
0.12 -
0.08
0.04
Small Medium
Split
Large
Problem Size
♦ Small
• » ■ - Large
Figure 7
59

ILUC
S
Error Rates for Unique False Problems (repeat* split* probsize)
.16
12
08
04
0Small Medium Large
Problem Size
• Small
- - » - - Large
Split
Figure 8
60

Error Rates for Repeated False Problems(repeat * split * math anxiety)
0.12 -
0.08 -
t 0.06 - LU
C
I 0.04 -
0.02 -
Small Medium Large
M ath A nx ie ty
- Medium
Split
Figure 9
61

Error Rates for Unique False Problems(repeat * split * math anxiety)
0 .1 2
0.08 -
S.O 0.06 -u
H I
i 0.04- S
0.02 -
Small Medium Large
M ath A n x ie ty
- Medium
Split
Figure 10
62

Reaction Times for True Problems(repeat x manx_group x span_group)
Low Span Group
2000
E, 1800 0>E
1600c0
1B 1400 0)S
1200
Math Anxiety■ Low
- • • - - M e d iu m
— - A— • * High
Repeated Unique
Figure 11
63

Reaction Times for True Problems(repeat x manx_group x span_group)
High Span Group
2000
(0E 1800 - 0)EFo 1600 -
n 1400 -d>S
1200R epeated Unique
Math Anxiety
— • —-L ow
— ■ ■— • Medium
A High
Figure 12
64

Reaction Times for True Problems(block X probsize x span_group)
Low Span Group
2500
_ 2250 -tfig® 2000 -
Ho 1750 - »osOS 1500 - csS 1250 -
1000Block 1 Block 3Block 2
Problem Size- • • - Smell
— ■— Large
Figure 13
65

Reaction Times for True Problems(block X probsize x span_group)
High Span Group
2500
_ 2250 -(A
&I 2000 -
o 1750 - %3os 1500 csS 1250 -
1000Block 1 Block 3Block 2
Problem Size
Smell
— ■— Large
Figure 14
66

Error Rates for True Problems by Span Group
0.04
0.03 -
0.02 -
0.01 -
Low Span High Span
Figure 15
67
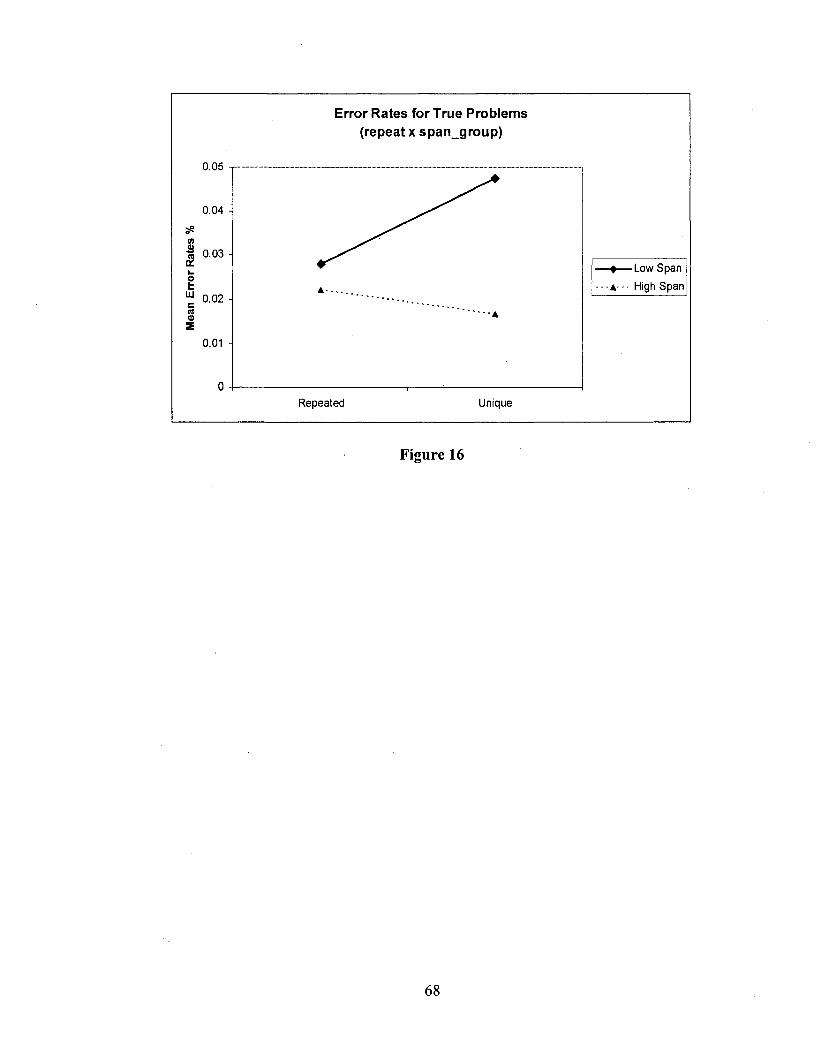
Error Rates for True Problems (repeat x span_group)
0.05
0.04 -
0.03 -— ♦ — Low Span
A High Span0.02 -
0.01 -
UniqueRepeated
Figure 16
68
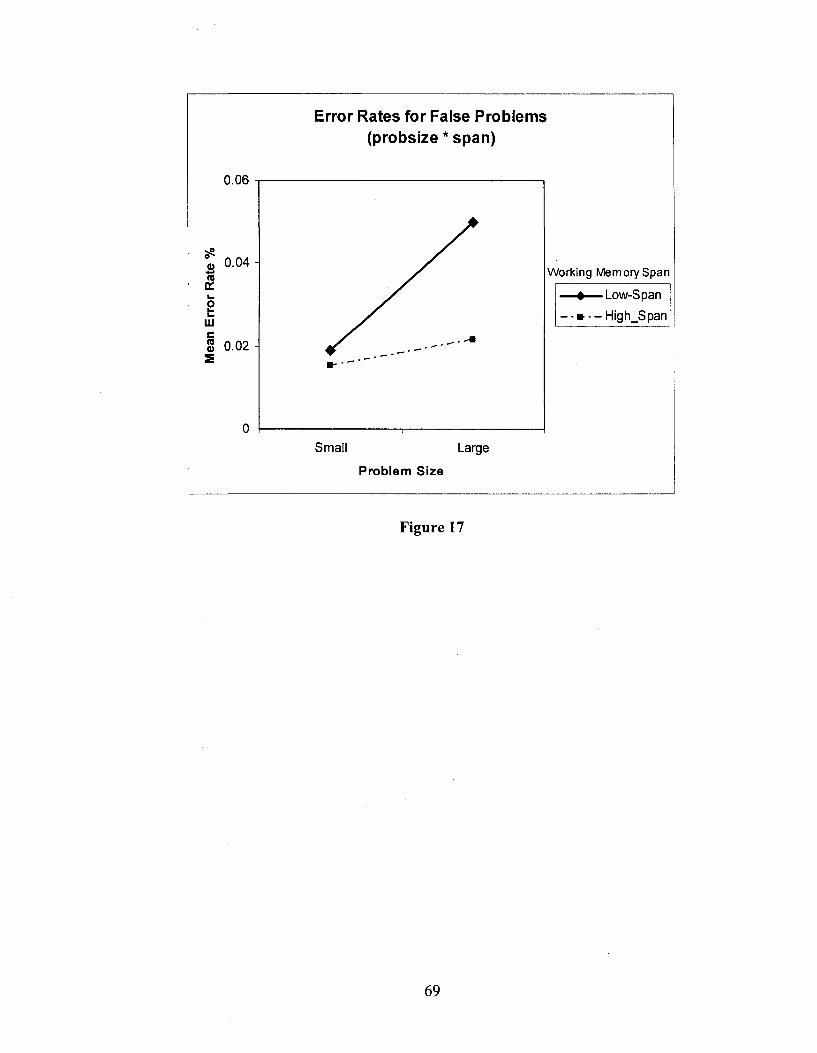
Error Rates for False Problems (probsize * span)
0.06
W orking M em ory S p an
♦ Low-Span
- High_SpanilU
i 0.02 -S
Small Large
Problem Size
Figure 17
69

Error Rates for False Problems(split X probsize x span_group)
Low Span Group
Split
0.14
0.12 -
IK 0.08 - o
Problem Size
♦ Small
— Lergelii 0.06 -cSI 0.04 -
0.02 -
Small Medium Large
Figure 18
70

Error Rates for False Problems(split X probsize x span_group)
High Span Group
0 .14
0 ,12 -
1K 0.08 -2LU 0.06 -
I 0.04 -
0.02 -
Small Medium Large
Problem Size
— ♦— Small
— ' * - — Large
S p lit
Figure 19
71
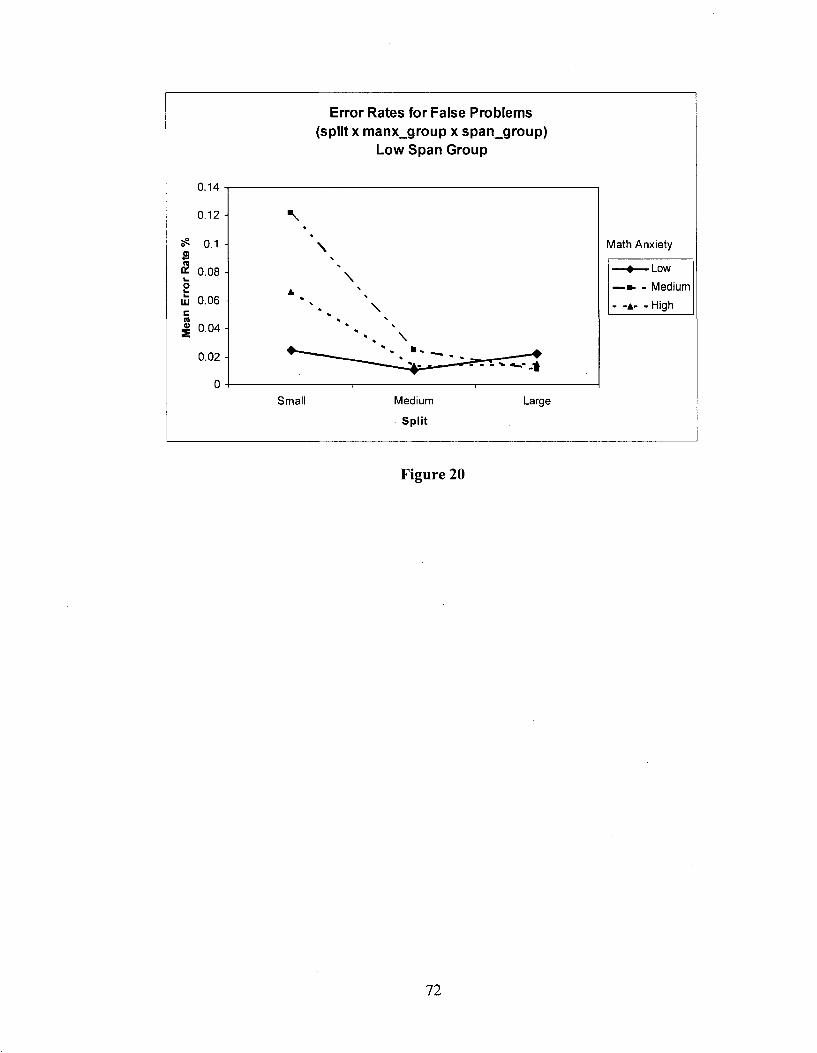
Error Rates for False Problems(split X manx_group x span_group)
Low Span Group
0.14
0.12 -
Math Anxiety
1 0.08 -
2HI 0.06 -
I 0.04 -
— ♦ — Low
— - Medium
- “A" - High
0.02 -
MediumSmall Large
S p lit
Figure 20
72

Error Rates for False Problems(split X manx_group x span_group)
High Span Group
0.14
0.12 -
0: 0.08 2lb 0.06 -
« 0.04 -
0.02 -
Small Medium Large
Math Anxiety
— m- - Medium
A - - High
Split
Figure 21
73

Error Rates for False Problems(repeat X manx_group x span_group)
Low Span Group
0.09 -
0.08 -
5? 0.07 -ag 0.06 -
g 0.05 -
c 0.04 -
I 0.03 -- A
0.02 -
0.01 -
UniqueRepeated
Math Anxiety
• Low
— «- . Medium
- -A" “ High
Figure 22
74

Error Rates for False Problems(repeat x manx_group x span_group)
High Span Group
0.09 -
0.08 -
5? 0.07 -ag 0.06
0.05 -
c 0.04 -(Ü2 0.03
0.02 -
0.01 -
UniqueRepeated
Math Anxiety
- Medium
-A - - High
Figure 23
75

Mean Recall(split X repeat)
IC
8s
0.45
0.35 -
0.25 -
0.05 -
■ '♦ Repeated--■■ --U nique
Small Medium
Split
Large
Figure 24
76

Mean Recall for Repeated False Problems(split * manx_group * repeat)
0.6
IIS
Small Medium Large
Math Anxiety
-Low— m- - Medium - -A” - High
Spilt
Figure 25
77

Mean Recall for Unique False Problems(split X manx_group x repeat)
0.6
nuKcn0)S
Small Medium Large
Math Anxiety
♦' Low
— » - Medium- -A - - High
S p l i t
Figure 26
78

REFERENCES
Alexander, L., & Martray, C. (1989). The development of an abbreviated version of the
Mathematics Anxiety Rating Scale. Measurement and Evaluation in Counseling and
Development, 22, 143-150.
Ashcraft, M. H. (1982). Cognitive arithmetic: A chronometric approach. Developmental
Review, 22, 143-150.
Ashcraft, M. H. (1992). Cognitive arithmetic: A review of data and theory. Special issue:
Numerical Cognition, 44(1-2), 75-106.
Ashcraft, M.H. (2002). Math anxiety: Personal, educational, and cognitive consequences.
Current Directions in Psychological Science, 77(5), 181-185.
Ashcraft, M. H., & Battaglia, J. (1978). Cognitive arithmetic: Evidence for retrieval and
decision processes in mental addition. Journal o f Experimental Psychology: Human
Learning and Memory, 4, 527-538.
Ashcraft, M. H., Donley, R. D., & Halas, M. A. (1992). Working memory, automaticity,
and problem difficulty. In J. I. D Campbell (Ed.), The Nature and Origins of
Mathematical Skills (pp. 301-329). Oxford, England: North-Holland.
Ashcraft, M. H. & Faust, M. W. (1994). Mathematics anxiety and mental arithmetic
performance: An exploratory investigation. Cognition & Emotion, 8, 97-125.
Ashcraft, M.H. & Fierman, B.A. (1982). Mental addition in third, fourth, and sixth
graders. Journal o f Experimental Child Psychology, 33(2), 216-234.
79

Ashcraft, M. H. & Kirk, E. P. (1998). The relationship among working memory, math
anxiety, math competence, and attitudes toward math. Unpublished manuscript.
Ashcraft, M. H. & Kirk, E. P. (2001). The relationships among working memory, math
anxiety, and performance. Journal o f Experimental Psychology: General, 130, 224-
237.
Ashcraft, M. H., Krause, J. A., & Hopko, D. R. (2007). Math Anxiety as a Mathematics
Learning Disability. In D. B. Berch & M. M. M. Mazzocco (Eds.), Why Is Math So
Hard for Some Children? The Nature and Origins of Mathematical Learning
Difficulties and Disabilities (pp.329-348). Baltimore, MD: Paul H. Brookes
Publishing Co.
Ashcraft, M. H., & Stazyk, E. H. (1981). Mental addition: A test of three verification
models. Memory and Cognition, 9(2), 185-196.
Atkinson, R. C., & Juola J. F. (1973). Factors influencing the speed and accuracy of work
recognition. In S. Korablum (Ed.), Attention and Performance {Vol. 4, pp. 583-612).
New York: Academic Press.
Baddeley, A. D. (2000). The episodic buffer: a new component of working memory?
Trends in Cognitive Science, 4, 417-423.
Baddeley, A. (1986). Working memory. Oxford: Clarendon Press.
Baddeley, A.D., & Hitch, G. (1974). Working memory. In G.H. Bower (Ed.), The
psychology o f learning and motivation: Advances in research and theory, 8, 47-89.
New York: Academic Press.
Campbell, J. I. D. (1987a). Network interference and mental multiplication. Journal o f
Experimental Psychology: Learning, Memory, and Cognition, 13{\), 109-123.
80

Campbell, J. I. D. (1987b). The role of assoeiative interferenee in learning and retrieving
arithmetie faets. In J. Sloboda & D. Rogers (Eds.), Cognitive processes in
mathematics (pp.107-122). Oxford, England: Oxford University Press.
Campbell, J. I. D. (1990). Retrieval inhibition and interferenee in eognitive arithmetie.
Canadian Journal o f Psychology, 44{A), 445-464.
Campbell, J. I. D., & Oliphant, M. (1992). Representation and retrieval of arithmetie
faets: A network-interferenee model and simulation. In J. I. D. Campbell (Ed.), The
nature and origins o f mathematical skills (pp. 331-364). Amsterdam: Elsevier.
Chen, Y. & Geng, L. (2002). An approaeh of eognition in the researeh of mathematieal
anxiety. Psychological Science (China), 25(6), 653-655, 648.
DeRammelaere, S., Stuyven, E., & Vandierendonek, A. (2001). Verifying simple
arithmetie sums and produets: Are the phonological loop and the eentral executive
involved? Memory & Cognition, 29(2), 267-273
Eysenek, M. W. (1992). Anxiety: The cognitive perspective. Hove: Lawrenee Erlbaum
Associates Ltd.
Faust, M. W., Ashcraft, M. H., & Fleck, D. E. (1996). Mathematics anxiety effects in
simple and eomplex addition. Mathematical Cognition, 2, 25-62.
Fleck, D. E., Sloan, J., Ashcraft, M. H., Slane, S., & Strakowski, S. M. (1998). Testing
mathematics anxiety: Psychometric characteristics o f the sMARS. Manuscript
submitted for publieation.
Groen, G. J. & Parkman, J. M. (1972). A ehronometric analysis o f simple addition.
Psychological Review, 79(4), 329-343.
81

Hamann, M. S. & Ashcraft, M. H. (1986). Textbook presentations o f the basic addition
facts. Cognition and Instruction, 3, 173-192.
Hamann, M. S. & Ashcraft, M. H. (1985). Simple and complex mental addition across
development. Journal o f Experimental Child Psychology, 40(1), 49-72.
Hembree, R. 1990. The Nature, effects, and relief o f Mathematics anxiety. Journal for
Research in Mathmematics Education, 21, 33-46.
Hopko, D. R., Ashcraft, M. H., & Gute, J. (1998). Mathematics anxiety and working
memory: Support for the existence of a deficient inhibition mechanism. Journal o f
Anxiety Disorders, 12(4), 343-355.
Miller, K., Perlmutter, M., & Keating, D. (1984). Cognitive arithmetic: A comparison of
operations. Journal o f Experimental Psychology: Learning, Memory, and Cognition,
10(1), 46-60.
Moyer, R. S., & Landauer, T. K. (1967). Time required for judgments of numerical
inequality. Nature, 215, 1519-1520.
Jastak, J. & Jastak, S. (1976). The wide range achievement test manual o f instruction.
Wilmington: Guidance Associates of Delaware, Inc.
Kirk, E. P. & Ashcraft, M. H. (2001). Telling stories: The perils and promise of using
verbal reports to study math strategies. Journal o f Experimental Psychology:
Learning, Memory, and Cognition, 27, 157-175.
Lemaire, P., Abdi, H., & Fayol, M. (1996). The role of working memory resources in
simple cognitive arithmetic. European Journal o f Cognitive Psychology, 8(1), 73-
103.
82

Lefevre, J., Bisanz, J., & Mrkonjic, L. (1988). Cognitive arithmetic: Evidence for
obligatory activation of arithmetic facts. Memory & Cognition, 16(1), 45-53.
LeFevre, J., Sadesky, G. S., & Bisanz, J. (1996). Selection of procedures in mental
addition: Reassessing the problem size effect in adults. Journal o f Experimental
Psychology: Learning, Memory, and Cognition, 22, 216-230.
Miller, H. & Bichsel, J. (2004). Anxiety, working memory, gender, and math
performance. Personality and Individual Differences, 37(3), 591-606.
Miller, K., Perlmutter, M., & Keating, D. (1984). Cognitive arithmetic; Comparison of
operations. Journal o f Experimental Psychology: Learning, Memory, and Cognition,
10(1), 46-60.
Parkman, J. M. (1972). Temporal aspects of simple multiplication and comparison.
Journal o f Experimental Psychology, 95(2), 437-444.
Richardson, F. C., & Suinn, R. M. (1972). The Mathematics Anxiety Rating Scale.
Journal o f Counseling Psychology, 19, 551-554.
Seyler, D. J., Kirk, E. P., Ashcraft, M. H. (2003). Elementary subtraction. Journal o f
Experimental Psychology: Learning, Memory, and Cognition, 29(6), 1339-1352.
Turner, M.L., & Engle, R. W. (1989). Is working memory capacity task dependent?
Journal o f Memory and Language, 28, 127-154.
Zbrodoff, J. N, & Logan, G. D. (2005). What Everyone Finds: The Problem-Size Effect.
In Jamie I.D. Campbell (Ed.), Handbook of Mathematical Cognition (pp. 331-345).
New York, NY: Psychology Press.
83
VITA
Graduate College University of Nevada, Las Vegas
Michelle Melissa Guillaume
Home Address:395 Rosado Springs St.Henderson, NV 89014
Degrees:Bachelor o f Science, Mathematics, 2002 University o f New Orleans
Master o f Science, Mathematical Sciences, 2005 University o f Nevada, Las Vegas
Professional Presentations:Guillaume, M., and Ashcraft, M. H. (2008, April). Learning in the Context of Math Anxiety. Poster presented at the Western Psychological Association, Long Beach, CA.
Steiner, E.T., Guillaume, M., and Silver, N.C. (2007, May). Testing Individual Correlations in a Matrix: Beware o f Output Probabilities. Poster presented at the Association for Psychological Science conference, Washington, D C.
Thesis Title: Learning in the Context of Math Anxiety
Thesis Examination Committee:Chairperson: Dr. Mark H. Ashcraft, Ph. D.Committee Member: Dr. David Copeland, Ph. D. Committee Member: Dr. Karen Kemtes, Ph. D.Graduate Faculty Representative: Dr. Gale Sinatra, Ph. D.
84