
Learning from Problem Analyses of design information...
12
1 LEARNING FROM PROBLEM ANALYSES OF DESIGN INFORMATION QUALITY DATA J. Lockert 1 , O. Berard 2 ABSTRACT A lacking Design Information Quality (DIQ) is known to cause budget overruns, schedule delays and defects in the construction and operation of buildings. In spite of this, both research and practice within structured Quality Assurance/Control (QA/QC) of design information is limited. Design checking is largely an inefficient process, e.g. lacking structure. However, the emerging technologies and methods of building information modeling (BIM) allow for a structured and software supported checking. This research studies data provided by a Nordic construction company. The data set consists of design information analyses of 2D drawings as well as 3D models, from 100 projects. The construction company has realized the problem of lacking DIQ, and hence both implemented explicit requirements for DIQ, as well as a procedure for design information QA/QC, primarily on tender projects as well as design-build projects. The quality information requirements are based on best practices from the BIM community. In conclusion, we propose new requirements to Design Information Quality as identified by the research, as well as our suggestions to input to new best practices in quality information requirements in the BIM community, integrating BIM and Lean principles from our particular context, to address design information problems in the future. KEYWORDS Design, Information, Quality Assurance/Quality Control, Building Information Modeling, Lean INTRODUCTION The architectural, engineering and construction (AEC) industry is driven by information. The information flows from the design team, who create the design information, to the builders, who plan and execute the construction project. AEC professionals spend a significant amount of time managing information, e.g., designers spend up to 54% of their time addressing information flows (Flager and Haymaker, 2007). Furthermore, inadequate design information leads to unintended outcomes, as indicated by extensive research on building defects (Josephson and Hammarlund, 1999), schedule delays (Sullivan and Harris, 1986) and cost overruns (Reichelt and Lyneis, 1999). The information flow in the AEC industry is more complicated than that described by the simple model above. However, there is a propensity is in this direction, and more complexity is not crucial to this study. Design information is the medium used to communicate the form, function and behavior of a product to a user. Design information is created by the design team, in this case, architects, engineers and design consultants, but it is also generated by 1 Civil engineer MSc., Building Informatics, BIM-coordinator - MT Højgaard, [email protected] 2 Civil engineer, MSc. Software development, Ph D, Design Information Quality, BIM-specialist - MT Højgaard, [email protected]
Transcript of Learning from Problem Analyses of design information...

1
LEARNING FROM PROBLEM ANALYSES OF
DESIGN INFORMATION QUALITY DATA J. Lockert
1, O. Berard
2
ABSTRACT
A lacking Design Information Quality (DIQ) is known to cause budget overruns,
schedule delays and defects in the construction and operation of buildings. In spite of
this, both research and practice within structured Quality Assurance/Control (QA/QC)
of design information is limited. Design checking is largely an inefficient process,
e.g. lacking structure. However, the emerging technologies and methods of building
information modeling (BIM) allow for a structured and software supported checking.
This research studies data provided by a Nordic construction company. The data set
consists of design information analyses of 2D drawings as well as 3D models, from
100 projects. The construction company has realized the problem of lacking DIQ, and
hence both implemented explicit requirements for DIQ, as well as a procedure for
design information QA/QC, primarily on tender projects as well as design-build
projects. The quality information requirements are based on best practices from the
BIM community. In conclusion, we propose new requirements to Design Information
Quality as identified by the research, as well as our suggestions to input to new best
practices in quality information requirements in the BIM community, integrating BIM
and Lean principles from our particular context, to address design information
problems in the future.
KEYWORDS
Design, Information, Quality Assurance/Quality Control, Building Information
Modeling, Lean
INTRODUCTION
The architectural, engineering and construction (AEC) industry is driven by
information. The information flows from the design team, who create the design
information, to the builders, who plan and execute the construction project. AEC
professionals spend a significant amount of time managing information, e.g.,
designers spend up to 54% of their time addressing information flows (Flager and
Haymaker, 2007). Furthermore, inadequate design information leads to unintended
outcomes, as indicated by extensive research on building defects (Josephson and
Hammarlund, 1999), schedule delays (Sullivan and Harris, 1986) and cost overruns
(Reichelt and Lyneis, 1999). The information flow in the AEC industry is more
complicated than that described by the simple model above. However, there is a
propensity is in this direction, and more complexity is not crucial to this study.
Design information is the medium used to communicate the form, function and
behavior of a product to a user. Design information is created by the design team, in
this case, architects, engineers and design consultants, but it is also generated by
1 Civil engineer MSc., Building Informatics, BIM-coordinator - MT Højgaard, [email protected] 2 Civil engineer, MSc. Software development, Ph D, Design Information Quality, BIM-specialist - MT
Højgaard, [email protected]
2
manufacturers and subcontractors. There are a multitude of users, but this study
focuses on the subset of design information that enables builders to plan and execute
construction projects. This subset currently consists of models; orthographic drawings;
specifications for the different disciplines; schematics and schedules. As the design
evolves, changes are covered by addenda, answers to requests for information (RFI)
and change orders. Determining the quality of construction work is traditionally the
assessment of a built facility in its environment. Validating Design Documentation
(DD) calls for assessing the direct effectiveness (performance and validity) of the
documentation itself –prior to assessing its potential merits as a product. The move
toward structured quality assurance/quality control (QA/QC) of design information
therefore deals with the question: “can it be built, on the basis of this documentation?”
rather than “should it be built, on the basis of this documentation?”
The traditional medium of design information is documents. Quality in its simplest
definition is ‘fitness for purpose’ (Juran et al, 2010). In this sense, the quality of
design information is the degree to which it enables the builder to plan and execute
the construction work successfully. The emergence of Building Information Modeling
(BIM; Eastman and Siabiris, 1995) and Virtual Design and Construction (VDC;
Fischer, 2006) in the AEC industry implies the replacement of documents with digital
integrated information, thereby improving the quality of design information.
Research has established that BIM and VDC techniques can improve the design
process (Shea et al, 2005; Flager et al, 2009) design review (Hartmann and Fischer,
2009), the builder’s estimation (Staub-French, 2003), planning (Heesom and
Mahdjoubi, 2004) and work coordination (Khanzode et al, 2008) and can facilitate
prefabrication (Sachs et al, 2010). The DD’s information content, such as its Level Of
Development (AGC, 2013) and the dependability of this content, will have a degree
of fitness for a particular purpose. This is defined as its Design Information Quality
(DIQ). The case company is working with a systematic framework for QA/QC,
through applicable datasets, in order to ensure valid Design Documentation as the
basis for executing construction contracts. The scope of QA/QC in the case company
is a data-driven approach quality assurance and control by providing numerical scores,
on which a common denominator for DIQ can be established.
Quality Control is defined as activities for fulfilling quality requirements. (ISO,
2005) This is not the case here, as the work does not aim to correct the process; nor
rectify the product itself. The objective is to identify and delegate tasks on the basis of
the quality assurance, to proactively resolve potential problems. This includes
assessing the significance, incidence and frequency of specific problems and
determining the main types of issues with which the case company is faced on its
building sites.
Lately, the BIM community has developed tools for formulating information
requirements, amongst those Information Delivery Manuals (IDM; ISO 29481-1; ISO
2010), Model Progression Specifications (MPS; AIA 2008), Level of Development
(LOD; AGC 2013) and BIM Execution Plans. The IDM (ISO 29481-1; ISO 2010) is
developed and maintained by buildingSMART. The IDM comprises a collaborative
method to identify business process and information requirements; but is also a
notation for model processes and information flow that is specific to the AEC
industry. The LOD is developed and maintained by BIMForum, a US AEC industry
collaboration. The LOD’s define the content of BIM objects according to 5 main

3
levels from LOD100 to LOD500 which can be subdivided in to numerous sublevels,
e.g. LOD350. LOD’s define both geometrical content as well as properties. The MPS
(AIA, 2008) was introduced by the California Chapter of the American Institute of
Architects (AIA) as part of the IPD (AIA, 2007) framework. The MPS has been
further developed by the BIM software vendor Vico Software (Vico, 2012) and the
US contractor Webcor (Bedrick, 2008). The MPS is a document upon which
agreements can be facilitated, through building models. It covers levels of detail,
actor, and phase. BIM execution plans define how the BIM collaboration is set up.
BIM Execution plans comprises BIM goals, BIM process, BIM use cases, exchange
formats, naming conventions as well as time schedules. Examples include Penn state
(2010), Department of Veteran Affairs (2010) and Building and Construction
Authority (2013).
METHODOLOGY
INTRODUCTION TO DATA SET
This article documents the results of one year’s work of QA/QC in the case company.
The obtained data set consists of a record of quality assessments, from 100 projects in
four different areas of operation, tendered in five different procurement forms and at a
variety of design development stages. The data collection methods practiced are
directly adapted in the present research and the statistical results are therefore
unaltered from the data set. In spanning the 100 projects that have been scrutinized,
the data set also consists of 250 different discipline-level consultancy services, be it a
3D model of structural steel members, or a set of drawings of a ventilation system.
2D and 3D/BIM projects are represented equally in the dataset, with a respective
distribution of 50/50. In practice, projects are controlled and scored on a scale from 1-
100. This (project-level) score is the average of the scores of all design contributions
(discipline-level), simultaneously given a score from 1-100. 250 different discipline-
level consultancy services show several differing types of necessity to the builders,
different demands to information content and quality, as well as varying degrees of
exact compliance to the material. Thus, a framework for QA/QC in the case company
must be uniform and observed at a high level of abstraction, in response to this
varying nature of the data. The checklist used to evaluate each discipline-level
consultancy service was filled out by a member of the case company’s QA/QC group.
Data Collection
A process wherein diverse projects are reviewed on a quantifiable, common ground,
must facilitate uniformity: The answers to an individual quality assurance procedure
is recorded through 36 control points in the categories of Reception Control;
Modeling Technique and Information Content; Consistency and the Basis for
extraction (such as quantity take-offs) and Planning. Each control-point is reported
on either a Likert scale (Likert, 1932) of 0-5, through Y/N questions, or multiple-
choice answers. All the analyzed projects have been formally tendered. Within the
practice of numerically scoring projects on discipline and project levels, the
progression below has been developed. The data are generated, collected and
validated in the process, figure 1.

4
Figure 1: Diagram showing how the data are generated, collected and validated.
Note the relative weight of results from the checklist: In a given category
composed of, say, 6 different questions, the individual questions are weighted by
relative importance (e.g. as 0.6 or 1.4). The weighting of a control point assumes a
predilected bias, in that the case company has specific, main interests regarding its
application of QA/QC on projects. A main priority for a construction company is the
basis for scheduling/planning and controlling its projects, ensuring projected
turnovers. The weighting is governed by the partiality of the case company to engage
in procurement processes and on projects seen as beneficial and cost-effective:
Averting budget overruns, schedule delays and defects.
PURPOSE OF ANALYSIS METHOD
The case company has provided the data set to examine the following assumptions:
The organization can learn valuable lessons about current and finished
projects through its practice of QA/QC.
The organization can identify solutions to recurring, common problems and
act to improve its practice with regards to setting demands to deliverables.
The data set and the general approach to QA/QC will inform the organization
of proactive responses to progress in these specific areas of operation.
As the organization sets out to learn from the DIQ data, the main focus is not on
remedial work, but to proactively ensure a high DIQ. The present research applies
this notion to its analyses.
Root Cause Analysis
A causal factor analysis displays the “root causes” of a problem. Graphically
represented below, figure 2:
5
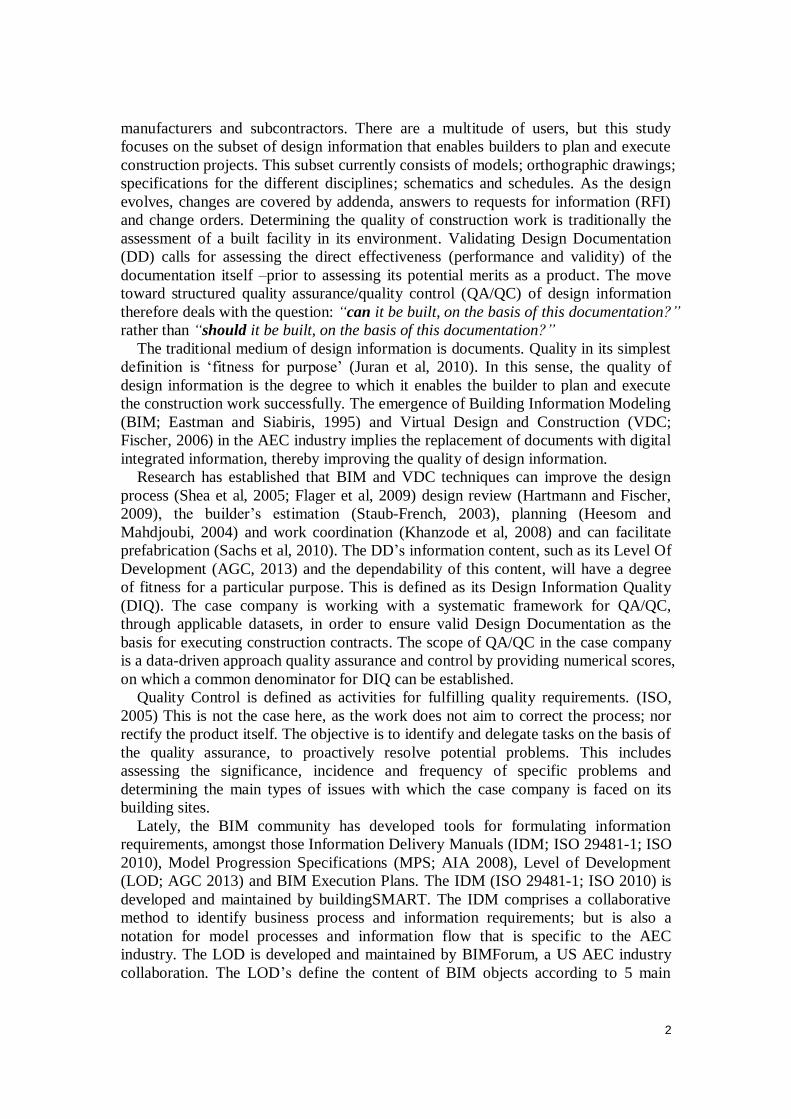
Figure 2: The basic structure of a Root Cause Analysis, identifying causal factors in problem analysis.
The data analysis informs the organization of a problem, who then issues a direct
statement to prevent recurrence. The effect of identifying the root causes is an
undeviating indication of how not to proceed, under the current circumstances. As
such, it presents achievable proactive responses to identified problems, by identifying
(and facilitating the exclusion of) root causes from a strategy.
DATA ANALYSIS
The 100 projects show several revealing tendencies in the distribution of design
methods and the use of digital technologies. Figure 3 exemplifies one such view, as it
serves to identify a problem: hired consultants on 3/4 projects have failed to transfer
to BIM, one arguably recognized way of structuring and delivering information:
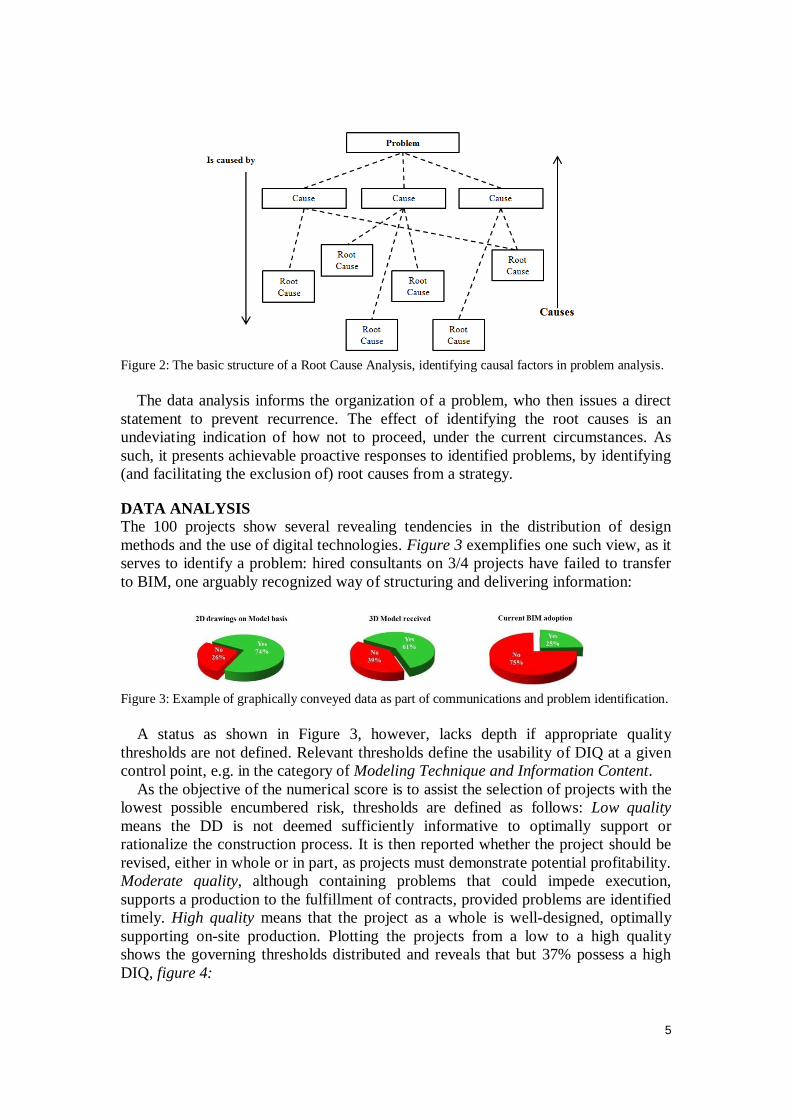
Figure 3: Example of graphically conveyed data as part of communications and problem identification.
A status as shown in Figure 3, however, lacks depth if appropriate quality
thresholds are not defined. Relevant thresholds define the usability of DIQ at a given
control point, e.g. in the category of Modeling Technique and Information Content.
As the objective of the numerical score is to assist the selection of projects with the
lowest possible encumbered risk, thresholds are defined as follows: Low quality
means the DD is not deemed sufficiently informative to optimally support or
rationalize the construction process. It is then reported whether the project should be
revised, either in whole or in part, as projects must demonstrate potential profitability.
Moderate quality, although containing problems that could impede execution,
supports a production to the fulfillment of contracts, provided problems are identified
timely. High quality means that the project as a whole is well-designed, optimally
supporting on-site production. Plotting the projects from a low to a high quality
shows the governing thresholds distributed and reveals that but 37% possess a high
DIQ, figure 4:

6
Figure 4: Distribution of the 100 projects, plotted in the color code of the numerical quality thresholds.
The supposition is that all design trades are equally capable in the delivery of a
high DIQ. In figure 5, the plot displays no relation between design trades and DIQ
/numerical score, confirming that design trades are irrelevant to the quality of
deliverables. Red is low, yellow is moderate, blue is high:
Figure 5: 250 discipline-level consultancy services distributed by design trade.
A striking correlation is seen, however, when plotting and color coding design
method versus DIQ/numerical score. Red indicates 3D/BIM design; blue 2D, figure 6:
Figure 6: Different design methods in correlation with DIQ /numerical score
IDENTIFYING RECURRING PROBLEMS IN DESIGN QUALITY
Because the numerical scores of the discipline-level consultancy services show a
strong relationship between design methodology/delivery and DIQ, cf. figure 6, the
following is a comparison of selected results from the dataset, based on the
differences between projects delivered with and without 3D/BIM, respectively.
3D/BIM based projects perform better overall. Figure 7 emphasizes the necessity of
contracts (namely ICT-agreements, in a Nordic context) to stipulate sufficiently clear
demands, in that 82% of projects carried out in 2D lack contractual demands to the
use of information technologies. Furthermore, 43% of 3D/BIM projects also lack
these vital documents. This is an identified problem:
7
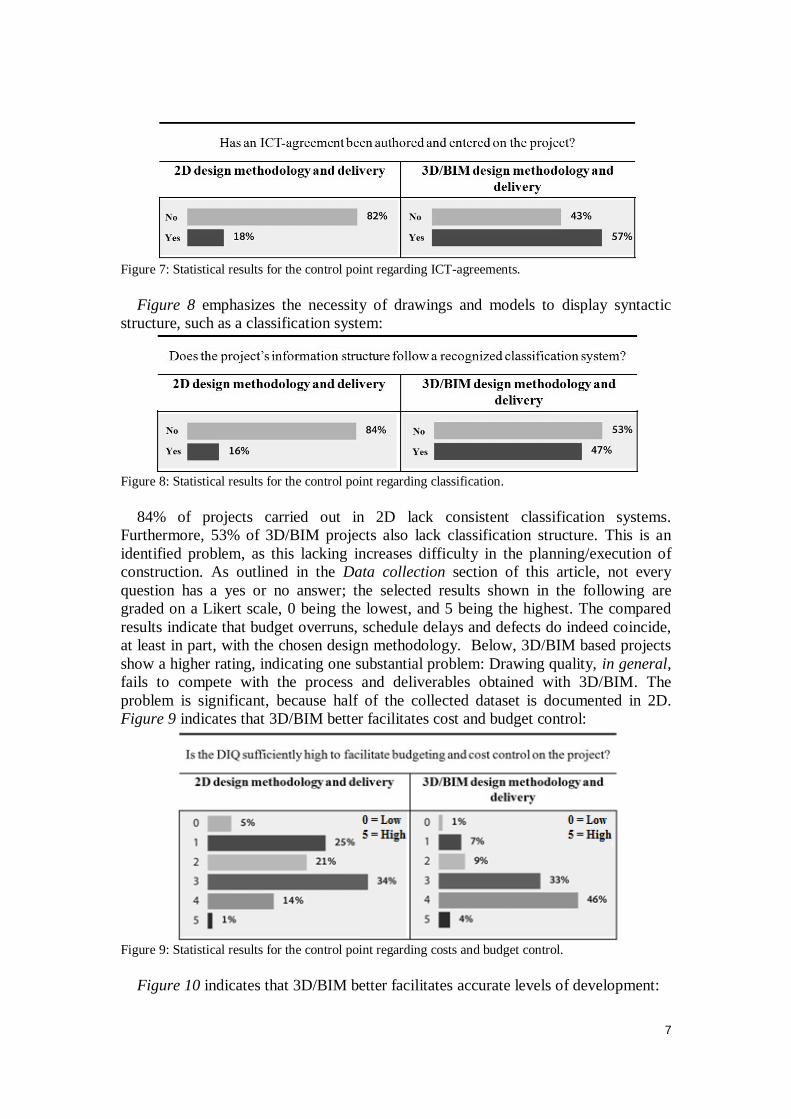
Figure 7: Statistical results for the control point regarding ICT-agreements.
Figure 8 emphasizes the necessity of drawings and models to display syntactic
structure, such as a classification system:
Figure 8: Statistical results for the control point regarding classification.
84% of projects carried out in 2D lack consistent classification systems.
Furthermore, 53% of 3D/BIM projects also lack classification structure. This is an
identified problem, as this lacking increases difficulty in the planning/execution of
construction. As outlined in the Data collection section of this article, not every
question has a yes or no answer; the selected results shown in the following are
graded on a Likert scale, 0 being the lowest, and 5 being the highest. The compared
results indicate that budget overruns, schedule delays and defects do indeed coincide,
at least in part, with the chosen design methodology. Below, 3D/BIM based projects
show a higher rating, indicating one substantial problem: Drawing quality, in general,
fails to compete with the process and deliverables obtained with 3D/BIM. The
problem is significant, because half of the collected dataset is documented in 2D.
Figure 9 indicates that 3D/BIM better facilitates cost and budget control:
Figure 9: Statistical results for the control point regarding costs and budget control.
Figure 10 indicates that 3D/BIM better facilitates accurate levels of development:

8
Figure 10: Statistical results for the control point regarding Levels of development.
Figure 11 indicates that 3D/BIM better facilitates time planning and control:
Figure 11: Statistical results for the control point regarding time planning and control.
The distributions above indicate that choosing 3D/BIM based methodologies, in
the design phase, actively counters the susceptibility of construction work to be
burdened by budget overruns, schedule delays and defects in the construction and
operation of buildings.
PROBLEM ANALYSIS Analyzing selected results from 2D projects exposes that 62% of drawing sets are not
3D/BIM-geometry based and moreover, 33% are not complete by submittal, figure 12:

9
Figure 12: Statistical results for the control points regarding drawing creation and comprehensiveness.
Root Cause (problem) Analysis
In summation, the data analysis identifies the following causal factors:
Contracts hold uncertain demands to DIQ/ICT.
Designs commonly lack classification and naming structure.
2D Drawing production methods are short of quality, scope and dimension.
Figure 13: Root cause analysis diagram based on data analysis.

10
Learning from the problem analysis
The design services carried out by consultants in the Nordic AEC industry show
several distinct tendencies, pertaining to the potential improvement of general DIQ
and the constructability of designs. From the perspective of the case company, as a
contractor, all involved design disciplines provide services that lack in the same areas,
with similar identified root causes: frequently, ICT-agreements are non-existent with
the consequence that contracts are vague and ill-defined on the subject of design
deliveries. Some projects have no modeling carried out, which lessen the potential for
information sharing. Many projects lack classification syntax and a systematic
approach to detailing and the maturity of designs (such as the LODs). Finally, the
planning and monitoring/control disciplines of projects lack the clarity and actionable
information that is possible with 3D/BIM.
CONCLUSIONS AND RECOMMENDATIONS
Making a persuasive case for 3D/BIM, the results show that the choice of design
methodologies that support a contractor’s apparatus is crucial to its progress. It is the
conclusion of this research that a full transition to cost-effective 3D/BIM, in
compliance with the strategy of the case company, should put into operation the
following learning points, which relate to the purpose of the analysis method, cf. p.3:
The organization can learn valuable lessons about current and finished projects
through its practice of QA/QC.
Since the numerical score is based on a checklist approach to quality assurance, in
which a critical inquiry asks and answers questions about DIQ, the analyses are both
distinctly phenomelogical and distinctly quantifiable. Quality, unless tested on a
homogenous product, is subject to the specific needs of the recipient/user of the
information. An ability to compare results across various design disciplines,
construction trades and procurement forms, allows for this subjection, demonstrating
the value of the quantifiable output.
The problems of budget overruns, schedule delays and defects can proactively be
counteracted, through maintaining a high DIQ on projects. Currently, the design
methodology that best suits the needs of the case company as a large contractor is
3D/BIM, but the transition also has to focus on improving the reception of Design
Documentation –to rapidly assess if a specific DIQ is sufficient.
The organization can identify solutions to recurring, common problems and act to
improve its practice with regards to setting demands to deliverables.
The uniformity of the structured QA/QC, as accounted for in this research, is
critical. Design processes and deliverables must be stipulated to meet the following
criteria:
o Every project has an ICT-agreement with relevant appendices.
o Every project displays syntactic structure, by naming or classification.
o Every project has LOD universally implemented in ICT-agreements.
o Every project has LOD universally implemented in deliverables, e.g.
through the use of Model Progression Specifications.
o Every contracted project utilizes information modeling to an
appropriate degree, which requires, as the minimum, quantity takeoffs
and planning/control in the execution phase, on the basis of models.

11
The data set and the general approach to QA/QC will inform the organization of
proactive responses to progress in these specific areas.
The present research is focused on budget overruns, schedule delays and defects.
For this reason, the case company should focus an effort on selecting consultants
whose services are historically reliable in terms of counteracting these problems. In
rating each discipline-level consultancy services by design trade and design
method/delivery, the case company can build a registry of dependable partners for the
projects commenced.
ACKNOWLEDGMENTS
Our expressed gratitude goes to the case company for supplying the basis for the
research.
REFERENCES
F. Flager, J. Haymaker, A comparison of multidisciplinary design, analysis and
optimization processes in the building construction and aerospace industries, CIB
24th W078 Conference, Maribor, Slovenia, (2007) 625-630.
P.E. Josephson, Y. Hammarlund, The causes and costs of defects in construction - A
study of seven building projects, Automation in Construction 8 (1999) 681-687.
A. Sullivan, F.C. Harris, Delays on large construction projects, International Journal
of Operations & Production Management 6 (1986) 25-33.
K. Reichelt, J. Lyneis, The dynamics of project performance: benchmarking the
drivers of cost and schedule overrun, European Management Journal 17 (1999)
J.M. Juran, J.A. De Feo, Juran's Quality Handbook: The Complete Guide to
Performance Excellence, sixth ed., McGraw Hill, New York, 2010.
C.M. Eastman, A. Siabiris, Generic building product model incorporating building
type information, Automation in Construction 3 (1995) 283-304.
M. Fischer, Formalizing construction knowledge for concurrent performance-based
design, Intelligent Computing in Engineering and Architecture 4200 (2006) 186-205.
K. Shea, R. Aish, M. Gourtovaia, Towards integrated performance-driven generative
design tools, Automation in Construction 14 (2005) 253-264.
F. Flager, B. Welle, P. Bansal, G. Soremekun, J. Haymaker, Multidisciplinary process
integration and design optimization of a classroom building, Journal of Information
Technology in Construction 14 (2009) 595-612.
T. Hartmann, M. Fischer, Supporting the constructability review with 3D/4D models,
Building Research & Information 35 (2007) 70-80.
S. Staub-French, M. Fischer, B. Paulson, M. Fischer, J. Kunz, K. Ishii, A feature
ontology to support construction cost estimating, AIEDAM: Artificial Intelligence for
Engineering Design, Analysis and Manufacturing 17 (2003) 133-154.
D. Heesom, L. Mahdjoubi, Trends of 4D CAD applications for construction planning,
Construction Management and Economics 22 (2004) 171-182.
A. Khanzode, M. Fischer, D. Reed, Benefits and lessons learned of implementing
building virtual design and construction (VDC) technologies for coordination of
mechanical, electrical, and plumbing (MEP) systems on a large Healthcare project,
Journal of Information Technology in Construction 13 (2008) 324-342.

12
R. Sacks, I. Kaner, C.M. Eastman, Y. Jeong, The Rosewood experiment — building
information modeling and interoperability for architectural precast facades,
Automation in Construction 19 (2010) 419-432.
F. Naumann, C. Rolker, Assessment methods for information quality criteria,
Proceedings of IQ2000 MIT Conference on Information Quality, 2000, 148-162.
R.Y. Wang, D.M. Strong, Beyond accuracy: what data quality means to data
consumers, Journal of Management Information Systems 12 (1996) 5-33.
Y.W. Lee, D.M. Strong, B.K. Kahn, R.Y. Wang, AIMQ: a methodology for
information quality assessment, Information & Management 40 (2002) 133-146.
AGC 2013, LOD Specification For Building Information Models Version: 2013
ISO. 2010. ISO 29481–1: Building information modelling – Information delivery
manual – Part 1: Methodology and format. International Organization for
Standardization
AIA. 2008. Model Progression Specification. The American Institute of Architects,
Washington, DC
AIA. 2007. Integrated Project Delivery: A Guide, Contract Documents. The
American Institute of Architects, Washington, DC
Bedrick, J. 2008. Organizing the Development of a Building Information Model.
2012. www.aecbytes.com/feature/2008/MPSforBIM.html
Vico. 2012. Model Progression Specification. 2012
Department of Veteran Affairs, 2010, The VA BIM Guide
Penn State, 2010, BIM Project Execution Planning Guide and Templates – V.2
Building and Construction Authority, 2013 , BIM Essential Guide For BIM
Execution Plan, Singapore
Likert, R, 1932. "A Technique for the Measurement of Attitudes". Archives of
Psychology 140: 1–55.