Learning for Dynamic and Personalised Knowledge-Based ...
201
UNIVERSIDAD DE DEUSTO L EARNING FOR DYNAMIC AND P ERSONALISED K NOWLEDGE -BASED ACTIVITY M ODELS Tesis doctoral presentada por Gorka Azkune Dirigida por Dr. Diego L´ opez-de-Ipi˜ na y Dr. Liming Chen Bilbao, Enero de 2015
Transcript of Learning for Dynamic and Personalised Knowledge-Based ...

UNIVERSIDAD DE DEUSTO
LEARNING FOR DYNAMIC AND
PERSONALISED KNOWLEDGE-BASED
ACTIVITY MODELS
Tesis doctoral presentada por Gorka Azkune
Dirigida por Dr. Diego Lopez-de-Ipina y Dr. LimingChen
Bilbao, Enero de 2015


UNIVERSIDAD DE DEUSTO
LEARNING FOR DYNAMIC AND
PERSONALISED KNOWLEDGE-BASED
ACTIVITY MODELS
Tesis doctoral presentada por Gorka Azkunedentro del Programa de Doctorado en Ingenierıa para la Sociedad de la
Informacion y Desarrollo Sostenible
Dirigida por Dr. Diego Lopez-de-Ipina y Dr. Liming Chen
El doctorando Los directores
Bilbao, Enero de 2015

Author: Gorka AzkuneAdvisor: Dr. Diego Lopez-de-IpinaCo-advisor: Dr. Liming Chen
Text printed in BilbaoFirst edition, January 2015

Ama eta Nagoreri


Abstract
Human activity recognition is one of the key competences for humanadaptive technologies. The idea of such technologies is to adapt theirservices to human users, so being able to recognise what human usersare doing is an important step to adapt services suitably.
One of the most promising approaches for human activity recognitionis the knowledge-driven approach, which has already shown very in-teresting features and advantages. Knowledge-driven approaches al-low using expert domain knowledge to describe activities and envi-ronments, providing efficient recognition systems. However, there arealso some drawbacks, such as the usage of generic and static activitymodels, i.e. activities are defined by their generic features - they do notinclude personal specificities - and once activities have been defined,they do not evolve according to what users do.
This dissertation presents an approach to using data-driven techniquesto evolve knowledge-based activity models with a user’s behaviouraldata. The approach includes a novel clustering process where initial in-complete models developed through knowledge engineering are usedto detect action clusters which describe activities and aggregate newactions. Based on those action clusters, a learning process is then de-signed to learn and model varying ways of performing activities in or-der to acquire complete and specialised activity models. The approachhas been tested with real users’ inputs, noisy sensors and demandingactivity sequences. Results have shown that the 100% of complete andspecialised activity models are properly learnt at the expense of learn-ing some false positive models.


Resumen
El reconocimiento de actividades realizadas por humanos es una delas competencias clave para las tecnologıas cuyo objetivo es adaptarsea los humanos. La principal idea de dichas tecnologıas es adaptar losservicios que ofrecen a sus usuarios, por lo que ser capaz de identi-ficar lo que el usuario hace en cada momento es muy importante paraadaptar los sevicios de forma adecuada.
Uno de los sistemas mas prometedores para reconocer las actividadeshumanas es el llamado sistema basado en el conocimiento, que yaha demostrado varias propiedades interesantes y ventajas importantes.Los sistemas basados en el conocimiento permiten usar el conocimien-to de expertos para describir las actividades y los entornos en los quese llevan a cabo, ofreciendo sistemas de reconocimiento eficientes. Sinembargo, dichos sistemas tambien presentan algunos inconvenientes,como son el uso de modelos de actividad genericos y estaticos. Es de-cir, por un lado las actividades se definen por sus caracterısticas gene-rales, y por ello no son capaces de incorporar informacion personal, ypor otro, una vez que las actividades se han definido, no hay mecanis-mos para hacer que evolucionen a medida que los usuarios cambian.
Esta tesis doctoral presenta un sistema de modelado que usa tecnicasbasadas en datos para hacer evolucionar modelos de actividad basadosen el conocimiento usando los datos generados por un usuario. El sis-tema de modelado se basa en un algoritmo nuevo de clustering dondese usan modelos incompletos iniciales creados por tecnicas basadas enel conocimiento para detectar grupos de acciones que describen ac-tividades y poder anadir ası nuevas acciones. Sobre estos grupos deacciones se despliega un proceso de aprendizaje para aprender y mode-lar distintas formas de realizar actividades. De este modo, se obtienenmodelos completos y especializados de las actividades definidas ini-cialmente. El sistema de modelado se ha probado con informacion deusuarios reales, sensores defectuosos y secuencias exigentes de activi-dades. Los resultados muestran que se pueden aprender el 100 % de losmodelos de actividad completos y especializados, con el inconvenientede aprender tambien algunos modelos falsos.


Laburpena
Giza-jarduerak igartzeko gaitasuna mugarrietako bat da gizakienganaegokitzen diren teknologiak garatzerako orduan. Teknologia horienhelburua zerbitzuak gizakien behar eta nahietara egokitzea da, eta ho-rretarako, giza-erabiltzailea momentuoro egiten ari dena igartzeko gaiizatea oso garrantzitsua da.
Giza-jarduerak igartzeko egin diren sistemen artean, etorkizun oparoe-netako bat duen sistema ezagutzan oinarriturikoa da. Ezagutzan oina-rrituriko sistemek jada hainbat abantaila eta ezaugarri interesgarri era-kutsi dituzte. Beren muinean dago adituen ezagutza erabili ahal izateagiza-jarduerak eta inguruneak deskribatzeko, eta modu horretara, jar-duerak igartzeko sistema eraginkorrak eskaintzen dituzte. Hala ere,sistema horiek badituzte beren desabantailak ere. Hala nola, jardueraereduak orokorrak izan ohi dira, hots, jarduerak beren ezaugarri oro-korren medioz deskribatzen direnez, ez dituzte ezaugarri pertsonalakerabiltzen, eta gainera jarduerak behin definituz gero, ez dira denboranzehar eguneratzen.
Tesi honetan giza-jarduerak modelatzeko sistema berri bat aurkeztenda. Erabiltzaileek sortutako datuak erabiliz eta datuetan oinarritutakoteknikak aplikatuz, ezagutzan oinarritutako jarduera ereduak egunera-tzako sistemak aurkezten dira. Sistemaren oinarrietako bat clusteringalgoritmo berri bat da. Bere bitartez, ezagutzan oinarrituriko hasierakoeredu osatugabeak erabiltzen dira giza-jarduerak deskribatzen dituztenekintza multzoak detektatu eta ekintza berriak gehitzeko. Ekintza mul-tzo horien gainean, ikasketa prozesu bat jartzen da martxan, jarduerabat egiteko modu ezberdinak ikasi eta modelatzeko. Modu horreta-ra, jarduera eredu oso eta espezializatuak ikas daitezke. Modelatzesistema benetako erabiltzaileen informazioa, sentsore zaratatsuak etajarduera sekuentzia konplexuak erabiliz probatu da. Emaitzek erakus-ten duten arabera, jarduera eredu oso eta espezializatuak ikas daitezke%100eko arrakasta tasekin, nahiz eta eredu faltsu batzuk ere ikastendiren prozesuan.


Acknowledgements
Even though science aims at overcoming human biases and irrationalbehaviours, science is done by scientists. And scientists, in the endof the day, are human. Humans tend to feel gratitude for those whohelp them pursuing an objective. I am not an exception. I think it isvery important to express that gratitude, because without the help andsupport of several people, this PhD dissertation would not have beenpossible. Thus, my objective, my dream, would only exist in my mind.
Lo primero de todo es agradecer a Diego: has creıdo en mı y has puestotoda la carne en el asador para que se pueda realizar esta tesis doctoraltal y como habıamos previsto. Despues de muchos anos, has consegui-do que me sienta un investigador de nuevo.
It is also very important for me to thank Luke. Your research workinspired many of the ideas of this dissertation and I was lucky enoughto get you on board. It is not only about your technical support andguidance, but also about your kindness. It has been a pleasure to workwith you.
La persona que mas ha tenido que soportarme ha sido sin duda Aitor.Desde el primer dıa me has ayudado mucho. Hemos tenido muchasreuniones y discusiones donde esta tesis ha ido cogiendo forma. Hasrevisado todo mi trabajo, nuestras publicaciones y me has echado unamano con la burocracia interna que siempre tanto me cuesta. Por todoello, muchısimas gracias.
No podrıa olvidarme tampoco de todos los companeros del laboratorio.Ademas de acogerme tan bien, os agradezco el esfuerzo que dedicas-teis a la evaluacion de esta tesis. Toda la informacion que me disteis hasido clave para poder validar todo mi trabajo.
Pertsonarik garrantzitsuenak egunero zurekin daudenak dira. Eskerrikasko bihotz-bihotzez Nagoreri. Badakit zenbaterainoko sakrifizioakegin dituzun bide honetan. Zu izan zara nire sustengu egunero. Askozor dizut eta espero dut denborarekin dena itzultzeko gai izango naize-la. Eskerrik asko baita ere nire anaiei eta hiloba paregabeei, bizitzako

momentu zoragarriak oparitu dizkidazuelako. Eta eskerrik asko nos-ki Taber eta Edurneri. Zuen etxean besoak zabalik hartu nauzue denaaskoz errazago bilakatuz.
Baina batez ere pertsona bat dut gogoan hitz hauek idaztean: ama. Tesihau, beste gauza guztien gainetik, nire amarentzat omenaldi xume batda. Badakit, ama, zuretzat berandu iritsi dela, ezin duzula gustatuko li-tzaizukeen bezala disfrutatu, baina oraindik badut esperantza zure bu-rutxo horretan, txokoren batean eta momenturen batean, zure semeazharro sentituko zarela. Ez zenuen hainbeste gustatzen zitzaizun pianoajotzen ikasteko aukerarik izan, txikia zinenean lan egitea tokatu bai-tzitzaizun. Eta lan horrekin jarraituz, beti langile, beti maitakor, zurebizitza osoa eman duzu zure semeek dena izan dezaten. Hezkuntzarengarrantzia beti izan duzu oso present eta hala erakutsi diguzu guri ere.Inoiz ez dugu nahikoa egingo zuri eskertzeko. Ama, izan dadila lanhau nire esker on guztia erakusteko beste modu bat.
Eskerrik asko,
Gorka Azkune
January 2015

Contents
List of Figures xv
List of Tables xix
List of definitions xxiii
Acronyms xxv
1 Introduction 11.1 Context and Motivation . . . . . . . . . . . . . . . . . . . . . . . 21.2 Hypothesis, Objectives and Scope . . . . . . . . . . . . . . . . . 61.3 Methodology . . . . . . . . . . . . . . . . . . . . . . . . . . . . 81.4 Contributions . . . . . . . . . . . . . . . . . . . . . . . . . . . . 91.5 Thesis Outline . . . . . . . . . . . . . . . . . . . . . . . . . . . . 10
2 Related Work 112.1 Human Activity Recognition . . . . . . . . . . . . . . . . . . . . 122.2 Sensor-Based Activity Recognition . . . . . . . . . . . . . . . . . 162.3 Sensor and Activity Monitoring . . . . . . . . . . . . . . . . . . 18
2.3.1 Wearable sensor-based activity monitoring . . . . . . . . 182.3.2 Dense sensing-based activity monitoring . . . . . . . . . 19
2.4 Data-Driven Approaches . . . . . . . . . . . . . . . . . . . . . . 212.4.1 Generative modelling . . . . . . . . . . . . . . . . . . . . 222.4.2 Discriminative modelling . . . . . . . . . . . . . . . . . . 242.4.3 Other approaches . . . . . . . . . . . . . . . . . . . . . . 262.4.4 Summary of data-driven approaches . . . . . . . . . . . . 28
2.5 Knowledge-Driven Approaches . . . . . . . . . . . . . . . . . . . 302.5.1 Mining-based approach . . . . . . . . . . . . . . . . . . . 312.5.2 Logic-based approaches . . . . . . . . . . . . . . . . . . 332.5.3 Ontology-based approaches . . . . . . . . . . . . . . . . 35
xi

Contents
2.5.4 Summary of knowledge-driven approaches . . . . . . . . 382.6 Hybrid Approaches . . . . . . . . . . . . . . . . . . . . . . . . . 392.7 Summary and Conclusions . . . . . . . . . . . . . . . . . . . . . 41
3 The Approach to Learn Specialised and Complete Activity Models 433.1 Ontology-Based Activity Modelling . . . . . . . . . . . . . . . . 44
3.1.1 Ontological ADL modelling . . . . . . . . . . . . . . . . 443.1.2 Ontological context modelling . . . . . . . . . . . . . . . 463.1.3 Final remarks about ontology-based activity modelling . . 47
3.2 Definitions and Constraints . . . . . . . . . . . . . . . . . . . . . 483.3 Solution Design . . . . . . . . . . . . . . . . . . . . . . . . . . . 50
3.3.1 Inputs of the learning system . . . . . . . . . . . . . . . . 513.3.2 Intuition behind the solution . . . . . . . . . . . . . . . . 533.3.3 Description of the solution . . . . . . . . . . . . . . . . . 55
3.4 Summary and Conclusions . . . . . . . . . . . . . . . . . . . . . 57
4 A Clustering Process for Activity Annotation 614.1 SA3: Semantic Activity Annotation Algorithm . . . . . . . . . . . 62
4.1.1 The sensor-action transformation step . . . . . . . . . . . 644.1.2 The activity sequence finding step . . . . . . . . . . . . . 654.1.3 The correct activity sequence fitting step . . . . . . . . . . 674.1.4 The complete SA3 algorithm . . . . . . . . . . . . . . . . 67
4.2 AA: Action Aggregator . . . . . . . . . . . . . . . . . . . . . . . 704.2.1 Insider actions . . . . . . . . . . . . . . . . . . . . . . . 724.2.2 Outsider actions . . . . . . . . . . . . . . . . . . . . . . 724.2.3 The complete AA algorithm . . . . . . . . . . . . . . . . 76
4.3 Summary and Conclusions . . . . . . . . . . . . . . . . . . . . . 79
5 Activity Model Learner 815.1 Objectives . . . . . . . . . . . . . . . . . . . . . . . . . . . . . . 825.2 Identifying Relevant Information . . . . . . . . . . . . . . . . . . 835.3 The Learning Algorithm . . . . . . . . . . . . . . . . . . . . . . 84
5.3.1 The filtering step . . . . . . . . . . . . . . . . . . . . . . 855.3.2 The similarity-based outlier detection step . . . . . . . . . 865.3.3 The complete AML algorithm . . . . . . . . . . . . . . . 91
5.4 Summary and Conclusions . . . . . . . . . . . . . . . . . . . . . 94
6 Evaluation 976.1 Evaluation Methodology . . . . . . . . . . . . . . . . . . . . . . 98
6.1.1 Analysis of the viability of the standard methodology forthe extended activity model learning system . . . . . . . . 99
xii

Contents
6.1.2 Hybrid evaluation methodology approach . . . . . . . . . 1026.1.2.1 Survey for activities of daily living . . . . . . . 1046.1.2.2 Synthetic dataset generator . . . . . . . . . . . 107
6.1.3 Discussion about the hybrid methodology . . . . . . . . . 1146.2 Evaluation Scenarios, Results and Discussions . . . . . . . . . . . 117
6.2.1 SA3 performance . . . . . . . . . . . . . . . . . . . . . . 1186.2.1.1 Evaluation scenarios and metrics . . . . . . . . 1186.2.1.2 Results . . . . . . . . . . . . . . . . . . . . . . 1216.2.1.3 Discussion about SA3 . . . . . . . . . . . . . . 127
6.2.2 Activity clustering performance . . . . . . . . . . . . . . 1296.2.2.1 Evaluation scenarios and metrics . . . . . . . . 1296.2.2.2 Results . . . . . . . . . . . . . . . . . . . . . . 1306.2.2.3 Discussion about the clustering process . . . . . 132
6.2.3 EAM learning performance . . . . . . . . . . . . . . . . 1356.2.3.1 Evaluation scenarios and metrics . . . . . . . . 1356.2.3.2 Results . . . . . . . . . . . . . . . . . . . . . . 1366.2.3.3 Discussion about the EAM learning system . . . 140
6.3 Summary and Conclusions . . . . . . . . . . . . . . . . . . . . . 142
7 Conclusions and Future Work 1457.1 Summary of Work and Conclusions . . . . . . . . . . . . . . . . 1457.2 Contributions . . . . . . . . . . . . . . . . . . . . . . . . . . . . 1487.3 Hypothesis and Objective Validation . . . . . . . . . . . . . . . . 1507.4 Relevant Publications . . . . . . . . . . . . . . . . . . . . . . . . 153
7.4.1 International JCR journals . . . . . . . . . . . . . . . . . 1537.4.2 International conferences . . . . . . . . . . . . . . . . . . 154
7.5 Future Work . . . . . . . . . . . . . . . . . . . . . . . . . . . . . 1557.5.1 Integrate the EAM learning system in a complete activity
modelling process . . . . . . . . . . . . . . . . . . . . . 1557.5.2 Discard meaningless user-object interactions . . . . . . . 1567.5.3 Single user - concurrent activities . . . . . . . . . . . . . 1567.5.4 Perception for complex actions . . . . . . . . . . . . . . . 1577.5.5 Learn temporal relations between actions . . . . . . . . . 157
7.6 Final Remarks . . . . . . . . . . . . . . . . . . . . . . . . . . . . 158
Bibliography 159
xiii

List of Figures
1.1 The continuous activity model process to obtain dynamic and per-sonalised models from generic expert provided models. . . . . . . 3
1.2 Illustrative example of the objective of the dissertation: using theinitial incomplete model for MakeCoffee and user generated data,the learning algorithm learns two specialised and complete models. 5
1.3 Followed research methodology. . . . . . . . . . . . . . . . . . . 9
2.1 A high-level taxonomy of activity recognition systems, spanned bytwo axis: monitoring and modelling approach. . . . . . . . . . . . 15
2.2 The Google Glass wearable, with its processing unit, camera, head-phones and screen. . . . . . . . . . . . . . . . . . . . . . . . . . 19
3.1 An example of ADL granularity represented as a tree. . . . . . . . 453.2 Example of activities, objects and sensors modelled in the context
knowledge file. Activity duration is given in seconds. . . . . . . . 523.3 A slice of a sensor activation dataset. . . . . . . . . . . . . . . . . 533.4 A plot of the actions executed by a user for performing several
activities in the three-dimensional space spanned by location, typeand time. . . . . . . . . . . . . . . . . . . . . . . . . . . . . . . 54
3.5 The detailed design architecture of the proposed approach to learnEAMs. . . . . . . . . . . . . . . . . . . . . . . . . . . . . . . . . 55
3.6 Information stored in the activity clusters file for activity ReadBook. 58
4.1 The three-step algorithm for SA3. . . . . . . . . . . . . . . . . . 634.2 Illustrative example of the output of the activity sequence finding
step of SA3. MWC refers to MakeWhippedCream, MT to Make-Tiramisu and BT to BrushTeeth. . . . . . . . . . . . . . . . . . . 69
4.3 Output of SA3 for a concrete sequence of actions, where outsiderand insider actions are identified. . . . . . . . . . . . . . . . . . . 71
xv

List of Figures
4.4 Gaussian distributions of activity durations for activitiesA1 andA2.Vertical lines show the standard deviation and the star represents anoutsider action. . . . . . . . . . . . . . . . . . . . . . . . . . . . 74
5.1 Jaccard coefficient-based similarity values for 11 action sequencesdetected for a concrete activity and a concrete user. . . . . . . . . 88
5.2 The threshold calculated for the similarity values of 11 action se-quences representing a concrete activity. . . . . . . . . . . . . . . 90
5.3 Both thresholds depicted in an example of few available data: θSand λ. . . . . . . . . . . . . . . . . . . . . . . . . . . . . . . . . 91
5.4 Example of the output of the AML algorithm. Two specialisedand complete models for MakePasta activity are depicted. As theirsemantic tags are not known, they are tagged with numbers 1 and 2. 93
6.1 The hybrid evaluation methodology steps depicted in a flowchart. . 103
6.2 The first part of the survey. A brief introduction can be found wherethe aim of the survey is explained, continuing with the behaviourmodel part. . . . . . . . . . . . . . . . . . . . . . . . . . . . . . 105
6.3 The questions of the survey to capture the activity model of Make-Coffee. . . . . . . . . . . . . . . . . . . . . . . . . . . . . . . . . 106
6.4 High-level design of the synthetic dataset generator tool. . . . . . 108
6.5 Sensor activation patterns for MakeCoffee activity obtained froma real user. The activity has two activation patterns with differentoccurrence probabilities. . . . . . . . . . . . . . . . . . . . . . . 110
6.6 An example of a behaviour model for a concrete day, which hasan occurrence probability of 0.29 and it is composed of three se-quences and an alteration. . . . . . . . . . . . . . . . . . . . . . . 111
6.7 Example of sensor missing noise models for contact and tilt sensors. 112
6.8 A flowchart of the simulation loop of the synthetic dataset generator. 113
6.9 Sensor activation patterns for the defined activities as given to thesynthetic dataset generator. . . . . . . . . . . . . . . . . . . . . . 119
6.10 Behaviour models for a given user as given to the synthetic datasetgenerator. . . . . . . . . . . . . . . . . . . . . . . . . . . . . . . 120
6.11 The IAMs of all seven defined activities for the first three evalua-tion scenarios. . . . . . . . . . . . . . . . . . . . . . . . . . . . . 122
6.12 The true positive percentages of SA3 for activities MakeChocolateand BrushTeeth in presence of increasing sensor missing noise. . . 124
xvi

List of Figures
6.13 A representative situation encountered in positive sensor noise sce-narios. Dashes represent time intervals without sensor activations,circles represent real sensor activations and crosses represent falsesensor activations. While AR stands for real activity, ASA3 standsfor the activity detected by SA3. . . . . . . . . . . . . . . . . . . 126
6.14 Another representative situation encountered in positive sensor noisescenarios. Dashes represent time intervals without sensor activa-tions, circles represent real sensor activations and crosses representfalse sensor activations. While AR stands for real activity, ASA3
stands for the activity detected by SA3. . . . . . . . . . . . . . . 126
7.1 The relation of the objectives defined in Section 1.2, the contribu-tions listed in Section 7.2 and their location in this dissertation. . . 152
xvii


List of Tables
2.1 The summary and comparison of activity recognition approaches. 402.2 The classification of this dissertation in terms of activity modelling
and activity monitoring approaches marked with an X. . . . . . . 42
4.1 Example of a partially annotated dataset, the output of the SA3
algorithm shown in table format. . . . . . . . . . . . . . . . . . . 644.2 Example of a fully annotated dataset, the output of the AA algo-
rithm shown in table format. To visualise better, timestamps havebeen shortened. The asterisk refers to the result given by SA3. . . 78
6.1 Interaction recognition rate as shown in (Chen et al., 2012b). . . . 1096.2 Results of the SA3 algorithm for the ideal scenario. . . . . . . . . 1236.3 Results of SA3 for the sensor missing noise scenario, where TP:
true positives, FP: false positives and FN: false negatives. The ac-tivities affected by the noise have an asterisk. . . . . . . . . . . . 124
6.4 Results of SA3 for positive sensor noise scenario; TP: true posi-tives; FP: false positives; FN: false negatives . . . . . . . . . . . . 125
6.5 Results of SA3 for demanding activity models scenario. . . . . . . 1276.6 Average results for 8 users of the clustering process for the ideal
scenario using simple time distance. . . . . . . . . . . . . . . . . 1316.7 Average results for 8 users of the clustering process for the ideal
scenario using normalised time distance. . . . . . . . . . . . . . . 1316.8 Average results for 8 users of the clustering process for the ideal
scenario using dynamic normalised time distance for previous andnormalised time distance for next activity. . . . . . . . . . . . . . 132
6.9 Comparative between the usage of the three time metrics for theclustering process in the ideal scenario. t1 refers to simple time dis-tance, t2 to normalised time distance and t3 to using dynamic centrenormalised time distance for previous activity and normalised timedistance for next activity. . . . . . . . . . . . . . . . . . . . . . . 132
xix
List of Tables
6.10 Average results for 8 users of the clustering process for the com-plete scenario using simple time distance. . . . . . . . . . . . . . 133
6.11 Average results for 8 users of the clustering process for the com-plete scenario using normalised time distance. . . . . . . . . . . . 133
6.12 Average results for 8 users of the clustering process for the com-plete scenario using dynamic normalised time distance for previousand normalised time distance for next activity. . . . . . . . . . . . 133
6.13 Comparative between the usage of the three time metrics for theclustering process in the complete scenario. t1 refers to simpletime distance, t2 to normalised time distance and t3 to using dy-namic center normalised time distance for previous activity andnormalised time distance for next activity. . . . . . . . . . . . . . 134
6.14 Average results for 8 users of the EAM learning process for theideal scenario, using the simple time distance in the clustering pro-cess. . . . . . . . . . . . . . . . . . . . . . . . . . . . . . . . . . 137
6.15 Average results for 8 users of the EAM learning process for theideal scenario, using the normalised time distance in the clusteringprocess. . . . . . . . . . . . . . . . . . . . . . . . . . . . . . . . 137
6.16 Average results for 8 users of the EAM learning process for theideal scenario, using dynamic centre normalised time distance forthe previous activity and normalised time distance for the next ac-tivity. . . . . . . . . . . . . . . . . . . . . . . . . . . . . . . . . 137
6.17 Comparative of applying AML to the clustering process with thethree time metrics in the ideal scenario. t1 refers to simple time dis-tance, t2 to normalised time distance and t3 to using dynamic centrenormalised time distance for previous activity and normalised timedistance for next activity. . . . . . . . . . . . . . . . . . . . . . . 138
6.18 Average results for 8 users of the EAM learning process for thecomplete scenario, using simple time distance in the clustering pro-cess. . . . . . . . . . . . . . . . . . . . . . . . . . . . . . . . . . 139
6.19 Average results for 8 users of the EAM learning process for thecomplete scenario, using normalised time distance in the clusteringprocess. . . . . . . . . . . . . . . . . . . . . . . . . . . . . . . . 139
6.20 Average results for 8 users of the EAM learning process for thecomplete scenario, using dynamic centre normalised time distancefor the previous activity and normalised time distance for the nextactivity. . . . . . . . . . . . . . . . . . . . . . . . . . . . . . . . 139
xx

List of Tables
6.21 Comparative of applying AML to the clustering process with thethree time metrics in the complete scenario. t1 refers to simpletime distance, t2 to normalised time distance and t3 to using dy-namic centre normalised time distance for previous activity andnormalised time distance for next activity. . . . . . . . . . . . . . 139
6.22 Average number of learnt actions compared to the number of ac-tions in the IAMs of defined activities. Results are obtained for 8users in the complete scenario, using dynamic centre normaliseddistance for the previous activity and normalised time distance forthe next activity. . . . . . . . . . . . . . . . . . . . . . . . . . . . 140
xxi


List of definitions
1 Definition (Sensor activation (SA)) . . . . . . . . . . . . . . . . . 482 Definition (Sensor activation dataset) . . . . . . . . . . . . . . . . 483 Definition (Actions) . . . . . . . . . . . . . . . . . . . . . . . . . 484 Definition (Type) . . . . . . . . . . . . . . . . . . . . . . . . . . 495 Definition (Location) . . . . . . . . . . . . . . . . . . . . . . . . 496 Definition (Initial Activity Model (IAM)) . . . . . . . . . . . . . 497 Definition (Extended Activity Model (EAM)) . . . . . . . . . . . 498 Definition (User Erratic Behaviour) . . . . . . . . . . . . . . . . 499 Definition (Positive Sensor Noise) . . . . . . . . . . . . . . . . . 4910 Definition (Missing Sensor Noise) . . . . . . . . . . . . . . . . . 49
11 Definition (Insider action) . . . . . . . . . . . . . . . . . . . . . . 7112 Definition (Outsider action) . . . . . . . . . . . . . . . . . . . . . 71
13 Definition (Activity model) . . . . . . . . . . . . . . . . . . . . . 10414 Definition (Behaviour model) . . . . . . . . . . . . . . . . . . . . 104
xxiii


Acronyms
AA Action Aggregator
ADL Activities of Daily Living
AML Activity Model Learner
API Application Programming Interface
CHMM Coupled Hidden Markov Model
COM Continuous varied Order Multi Threshold
CRF Conditional Random Field
CSV Comma Separated Value
DBN Dynamic Bayesian Network
DL Description Logic
EAM Extended Activity Model
EC Event Calculus
GCP Google conditional Probabilities
GNU GNU’s Not Unix
GPS Global Positioning System
HMM Hidden Markov Model
HTML Hyper Text Markup Language
HTTP Hyper Text Transfer Protocol
xxv

Acronyms
IAM Initial Activity Model
ID Identifier
IEEE Institute of Electrical and Electronics Engineers
ILSA Independent Lifestyle Assistant
IO Input/Output
JSON JavaScript Object Notation
KL Kullback-Leibler
LDS Linear Dynamical System
NN Nearest Neighbour
OWL Web Ontology Language
PEAT Planning and Execution Assistant and Trainer
RDF Resource Description Framework
RFID Radio Frequency Identification
SA3 Semantic Activity Annotation Algorithm
SMC Sequential Monte Carlo
SVM Support Vector Machine
xxvi

The first step, my son, which onemakes in the world, is the one onwhich depends the rest of our days.
Francois Marie Arouet, Voltaire
CHAPTER
1Introduction
HUMAN activity recognition aims at recognising what a human is doing indifferent environments and domains. To perform activity recognition,different kinds of sensors have to be deployed in human-populated en-vironments to monitor inhabitants’ behaviours and capture environ-
mental changes generated by human actions. The information provided by thosesensors has to be processed through data analysis techniques and/or knowledgerepresentation formalisms to create appropriate activity models and subsequentlyuse them for activity recognition. Thus using sensing and computing capabilities,activities performed by humans can be detected and recognised.
Being able to recognise what human beings are doing in their daily life canopen the door to a lot of possibilities in diverse areas. Technology is becomingmore and more human-centred in order to provide personalised services. In otherwords, technological services have to adapt to human users and not the other wayaround.
Following that trend, human activity recognition becomes a natural enabler toadaptive technologies. As such, it has become an important research topic in ar-eas such as pervasive and mobile computing (Choudhury and Consolvo, 2008),ambient assisted living (Philipose and Fishkin, 2004), social robotics (Fong et al.,2003), surveillance-based security (Fernandez-Caballero, 2012) and context-awarecomputing (Laerhoven and Aidoo, 2001).
The scientific community has developed two main approaches to solve activ-ity recognition, namely the data-driven and knowledge-driven approaches. Data-driven approaches make use of large-scale datasets of sensors to learn activitymodels using data mining and machine learning techniques. On the other hand,
1

1. Introduction
knowledge-driven approaches exploit rich prior knowledge in the domain of inter-est to build activity models using knowledge engineering and management tech-nologies.
For knowledge-driven activity recognition systems, a widely recognised draw-back is that activity models are usually static, i.e. once they have been defined, theycannot be automatically adapted to users’ specificities (Chen et al., 2014). This isa very restrictive limitation, because it is not generally possible to define completeactivity models for every user. Domain experts have the necessary knowledge aboutactivities, but this knowledge may not be enough to generate complete models inall the cases. To make knowledge-driven activity recognition systems work in realworld applications, activity models have to evolve automatically to adapt to users’varying behaviours. It turns out that model adaptability and evolution are aspectsthat can be properly addressed by data-driven approaches. Hence, the objective ofthis dissertation is to use data-driven techniques to make knowledge-based activitymodels evolve automatically based on sensor data generated by specific users.
The remainder of this chapter is structured as follows: Section 1.1 explainsthe context and motivation of the research. Afterwards, Section 1.2 formulates thehypothesis, derived goals and the scope of the work. Section 1.3 describes thefollowed research methodology to achieve the goals, and Section 1.4 summarisesthe scientific and technical contributions of this dissertation. The chapter finaliseswith an outline of the dissertation in Section 1.5.
1.1 Context and MotivationIndependently from the approach used to implement activity recognition systems, itis usually the case that activity modelling and recognition are carried out separately.Activity modelling is very important for activity recognition, since it provides themodels which have to be recognised in the sensor datasets generated by humanswhile they perform activities. While data-driven approaches obtain those modelsdirectly from user generated data, knowledge-driven approaches obtain them bymeans of knowledge engineering techniques. However, both approaches share usu-ally the same assumption, i.e. activity modelling is performed once and afterwards,the generated models are used for activity recognition.
Assuming the static nature of activity models does not fit to the reality. Peopletend to change the way they perform the same activities in time. Hence, the sameactivity models cannot be used forever. From the point of view of data-driven activ-ity modelling approaches, implementing dynamic activity models is not a problem,as incremental learning techniques can be used (Rashidi and Cook, 2011). More-over, as activity models are learnt directly from user generated data, personalisedactivity models are naturally obtained. Two of the positive features of data-driven
2

1.1 Context and Motivation
modelling are thus dynamic and personalised models. But those virtues pose alsosome drawbacks: activity models are not generic so they cannot be applied to otherusers and activity models are usually incomprehensible for humans which maketheir usage for other applications much harder.
On the other hand, knowledge-driven modelling produces generic and humanunderstandable models, since activities are modelled by their intrinsic features andrelations rather than from data, and activity models are expressed using logical anddescriptive formalisms (Chen et al., 2012b). However, those models are usuallystatic, i.e. once they have been defined they do not evolve. In addition to it, ob-taining personalised models is very complicated because experts cannot know inadvance all the personal features of a concrete user.
It is quite clear then that both activity modelling approaches have complemen-tary advantages and disadvantages. An approach excels where the other fails. Itseems natural thus to try to combine both approaches in order to develop a betteractivity modelling process where generic and personalised models can be obtainedand those models evolve in time with user generated data.
In this dissertation, a continuous activity modelling process is presented, wheredomain experts provide initially generic activity models using knowledge engineer-ing tools, to afterwards run data-driven learning algorithms on user generated datato learn personalised models. Such personalised models will be presented to the ex-pert, who can add or update them in the knowledge base. This loop is continuouslyrepeated in time to achieve dynamic and personalised models based on initiallyprovided generic models and user generated data. Figure 1.1 shows a diagram withthe described process.
PersonalisedModel
PersonalisedModel
GenericModels
Domain expert Smart
Environment
LearningSystem
Knowledge base
Present modelsto expert
Obtain sensordata
LearnModels
Provideinitially
Add/update
Figure 1.1: The continuous activity model process to obtain dynamic and personalisedmodels from generic expert provided models.
The described activity modelling process uses generic knowledge-based activ-
3

1. Introduction
ity models provided by a domain expert, achieving thus generic and understandableactivity models. To solve the problem of personalised models, user generated datais used in a learning process to produce knowledge-based personalised models.This means that data-driven learning techniques are used to capture personal fea-tures of generic activities and obtain understandable personalised activity models.Such models, after expert validation, are added to the knowledge base to use themsubsequently in activity recognition systems. Repeating this process continuously,dynamic activity models are obtained, which evolve in time as users change - ornot - their habits.
When modelling activities, two major aspects are considered: the actions car-ried out to perform the activity and the descriptive features of the activity (Chenet al., 2014). Actions refer to object interactions. For example, to prepare a coffeea user might have coffee and a cup to drink the coffee. This sequence can be mod-elled as the action sequence of hasCoffee and hasContainer, which are obtainedfrom the interactions with the respective objects monitored by sensors. Descriptiveproperties of an activity refer to the time when the activity has been performed, itsduration, the concrete set of objects used and their order. Both aspects of an activitymodel, i.e. actions and descriptive properties, may vary from person to person.
As far as learning personalised descriptive properties for knowledge-basedmodels regards, Chen et al. already combined data-driven and knowledge-drivenapproaches in (Chen et al., 2014). However, to the best of our knowledge, a sim-ilar work to learn specific actions for activity models has not been published yet.In that sense, the work presented in this dissertation tackles a novel problem. Infact, Chen et al. assume in their work that the actions in the seed activity modelsprovided by domain experts can be applied to any user. This means that every userhas to execute the same actions to perform a concrete activity.
In this dissertation, the problem of learning actions for given activities is anal-ysed. It cannot be generally assumed that every user executes the same actions toperform a concrete activity. Imagine, for instance, that a user prepares a coffee andadds sugar to it. To make it simple, the activity model for this user could contain theactions hasCoffee, hasContainer, hasWater and hasFlavour. But there is anotheruser who does not like any flavourant, so she prepares coffee by means of actionshasCoffee, hasContainer and hasWater. As it can be seen, both activity models aredifferent as far as actions regard, but both of them are valid models for the activityof making a coffee.
To develop a proper activity modelling process, learning actions is a key fea-ture. It has been observed that generic activity models provided by a domain experthave the necessary actions to perform an activity, but not sufficient actions for per-sonalised models. Those activity models can be used to further learn new actionsfor different users and thus generate new personalised activity models. Let us il-lustrate our hybrid activity modelling approach with an example. Figure 1.2 shows
4

1.1 Context and Motivation
an initial generic activity model for the MakeCoffee activity, which is composedby the actions hasCoffee and hasContainer. These are the necessary actions forevery person to perform a MakeCoffee activity, which highlight the indispensableactions of making a coffee, i.e. the use of coffee and a container to place the coffeein. Nevertheless, some users might add some milk and sugar, others cream andso on. The idea of our approach is to create high-level activity models with onlythese indispensable actions - generic models -, and then use the data generated by aspecific user performing the activity to learn those new actions which also config-ure the personal way of making coffee. In the case of Figure 1.2, where the initialactivity model will only include coffee and container, the system would learn thatMakeCoffee is performed in two ways by the user: in the first one, the user addsmilk (hasMilk) and sugar (hasFlavour), while in the second one only sugar is added(hasFlavour). Hence two specialised and complete activity models of MakeCoffeecan be learnt. This way, experts, initially, only have to provide generic but incom-plete activity models with necessary actions. Afterwards the learning system cananalyse a user’s behavioural data and learn the specialised and complete models toenrich the knowledge base, thus improving initial activity models.
MakeCoffee
hasCoffee hasContainer
InitialActivity Model
MakeCoffee
hasCoffee
hasMilk hasContainer
hasFlavour1 hasCoffee
hasContainer
hasFlavour2
Learned Activity Modelwith 2 specialised and
complete models
LearningAlgorithm
UserGenerated
Data
Figure 1.2: Illustrative example of the objective of the dissertation: using the initialincomplete model for MakeCoffee and user generated data, the learning algorithmlearns two specialised and complete models.
Running the proposed learning process periodically with new data generated bya concrete user, a dynamic activity modelling system is achieved. As a user evolvesregarding the way she performs certain activities, the learning approach learns new
5

1. Introduction
versions of the initial activity models. Hence, activity models can be adapted tousers’ varying behaviours.
Notice that the proposed modelling approach does not only learn new actionsfor initial activity models, but it also learns sub-activities of already defined activ-ities. In the example depicted in Figure 1.2, the two specialised models are twosub-activities of the MakeCoffee activity, namely MakeBlackCoffee and Make-CoffeeWithMilk. This feature makes possible for the expert to define activitiesin a higher level of abstraction and let the system learn different sub-activities togenerate specialised knowledge.
As a summary, this dissertation is focused on making another step towards dy-namic and personalised activity models for knowledge-driven activity recognitionsystems. A learning system to obtain complete and specialised activity modelsfrom generic but incomplete expert provided models has been developed. This stepallows implementing activity modelling approaches that use expert knowledge tohave generic activity models applicable to every user, and learn new actions forconcrete users achieving personalised and dynamic activity models.
1.2 Hypothesis, Objectives and ScopeBased on the current state of activity modelling and recognition, the hypothesis ofthis dissertation is:
Hypothesis. Using domain experts’ previous knowledge as generic but incompleteactivity models and data-driven learning techniques on user generated data, it ispossible to learn accurately new actions to obtain personalised activity models forevery user.
To be able to validate this hypothesis the general goal of this dissertation is:
Goal. To design and implement a learning system that uses generic but incompleteactivity models to analyse unlabelled activity sensor datasets and acquire person-alised models which contain new actions.
This general goal can be achieved by addressing the following more specificand measurable objectives:
6

1.2 Hypothesis, Objectives and Scope
1. To study the current state of the art on knowledge- and data-driven activitymodelling and recognition.
2. To choose a knowledge representation formalism and design proper struc-tures to represent domain experts’ knowledge.
3. To design and implement a multiple step learning algorithm which uses pre-vious knowledge and user generated data to obtain personalised activity mod-els.
4. To identify the evaluation methodology for the learning system which betteraddresses the requirements of the system.
5. To validate the obtained results quantitatively, with the objective of capturingthe 100% of real activity models performed by a user.
The resulting learning system should also fulfil the following requirements:
1. User independence: the learning system should be able to acquire person-alised models for any user.
2. Use the same generic activity models for every user: to show that incompleteactivity models provided by experts are really generic, the same models haveto be used for every user.
3. Environment independence: the knowledge representation formalism and thelearning algorithm should be defined to cope with different environments.As such, representing new locations and objects of a different environmentshould be straightforward.
The work presented in this dissertation does not deal with the following condi-tions:
1. Unknown activities: this dissertation does not propose any method to iden-tify and learn unknown activities. Personalised models of already definedactivities are learnt, thus leaving the integration of other techniques to learnunknown activities for future work.
2. Multiple users being monitored: it is assumed that only one user will bemonitored in a particular experiment and dataset. Considering multi-usermonitoring approaches is beyond the scope of this research work.
3. Concurrent and interwoven activities: users are not allowed to perform ac-tivities concurrently, i.e. once they start an activity, they have to finish itbefore starting another activity. Concurrent and interwoven activities posechallenges that will not be addressed in this dissertation.
7

1. Introduction
1.3 MethodologyA research strategy has been defined in order to achieve the statement and derivedgoals presented in Section 1.2. The strategy is defined as follows:
1. Update knowledge by reviewing the literature in the area of activity mod-elling and recognition, knowledge engineering, machine learning and datamining. This analysis has been reinforced by attending specialised scientificconferences.
2. Critically evaluate existing activity modelling and recognition solutions,analysing their scope and limitations and identifying weak areas where con-tributions to the state of the art can be done.
3. Design and develop the different modules of the activity model learner, in-crementally adopting more complex and efficient solutions.
4. Test developed modules through experiments and analyse results to enhancethe performance of the system.
5. Attend conferences and workshops to present partial results and validatethem with the scientific community.
6. Experimentation and evaluation of the prototype at each particular stage.
7. Network with experts at conferences, project meetings and consortia (theauthor is an active member of the SONOPA project1 - SOcial Networks forOlder adults to Promote an Active Life -). Contact for particular details by e-mail or by visiting other research groups (the author was a visiting researcherin De Montfort University for 6 weeks in 2014).
8. Redesign the activity model learner system with feedback from all this net-work, as well as the literature.
9. Select an appropriate evaluation methodology and evaluate consequently theactivity model learner system.
10. Dissemination of the results obtained during the research process.
This methodology is illustrated in Figure 6.1, as a cyclic process which startswith the review of the state of the art and finishes with the publications and the finalprototype.
1http://www.sonopa.eu/
8

1.4 Contributions
Evaluation
Development
SolutionDesign
Dissemination
UpdateKnowledge
Prototypes
Expertfeedback
Review stateof the art
Experimentalfeedback
PublicationsFinal prototype
Figure 1.3: Followed research methodology.
1.4 ContributionsThe following scientific contributions can be found in this dissertation:
• A two-step activity clustering algorithm which uses generic but incompleteactivity models and context knowledge to recognise action clusters that forman activity and aggregate new actions. The activity clustering algorithm ideais introduced in Chapter 3 and is explained through Chapter 4.
• A learning algorithm that uses action clusters which describe activities tolearn personalised activity models for every defined activity. This learningalgorithm is first presented in Chapter 3 and further developed in Chapter 5.
• A hybrid evaluation methodology for activity modelling and recognition,based on surveys to users and simulation tools. This evaluation methodologyis fully described and applied in Chapter 6. The details of the methodologycan be found in Section 6.1.2.
In order to deliver those scientific contributions, a technical contribution hasalso be posed in this dissertation:
• A synthetic dataset generator tool: a special simulation tool for sensor datasetgeneration designed and developed to apply the hybrid evaluation methodol-
9

1. Introduction
ogy to the activity modelling approach. The software tool is described inChapter 6, concretely in Section 6.1.2.2.
1.5 Thesis OutlineThe thesis is structured in seven chapters.
Chapter 1 is the current chapter. It presents the context and motivation of theresearch, as well as the hypothesis, goals and scope. To achieve those goals andvalidate the hypothesis, a research methodology is proposed. Finally, the contribu-tions of the dissertation and their location in the document are also shown.
Chapter 2 describes the state of the art relevant to the dissertation. The mostimportant activity monitoring, modelling and recognition approaches are presentedproviding a well structured taxonomy. The chapter also shows the position in suchtaxonomy of the research performed in this dissertation.
Chapter 3 establishes the basis of the dissertation, giving a high-level view ofthe whole system. First of all, the chapter describes in detail ontology-based ac-tivity modelling approaches, which serve as reference for the work carried out inthis dissertation. Afterwards, a set of definitions and constraints is posed to estab-lish the scope of the research clearly. The knowledge representation formalism andstructures are presented and the input data of the system is identified. Finally, theintuition behind the learning system and a high-level design are described.
Chapter 4 describes the proposed activity clustering algorithm, which is dividedinto two main steps: initialisation and action aggregation. Both steps are describedin detail, providing pseudo-code for their implementation.
Chapter 5 explains the last stage of the learning process. Design decisionsare explained and a rigorous analysis of all available information to learn activitymodels is done. The learning algorithm’s steps are described in detail and pseudo-code for its implementation is provided.
Chapter 6 evaluates the complete learning system and its constituent parts. Forthis purpose, the most relevant evaluation methodologies for activity recognitionsystems are shown and their suitability to evaluate the learning system is analysed.The chapter proposes a new hybrid evaluation methodology, based on surveys tousers and simulation tools. Afterwards, evaluation scenarios and metrics are pre-sented and obtained results are shown, leading to a discussion of the learning sys-tem, its advantages and drawbacks.
Finally, Chapter 7 summarises the dissertation, draws the conclusions of thisresearch work and shows the related future lines of work.
10

If I have seen further it is by stand-ing on the shoulders of giants.
Isaac Newton
CHAPTER
2Related Work
HUMAN activity recognition is a broad research area which can be anal-ysed from many different points of view. The objective of this chapteris to provide a high-level picture of the current status of the researchtopic, to then describe more in detail the concrete approaches that are
related to the work presented in this dissertation.First of all, Section 2.1 introduces the concept of Human Activity Recognition,
shows its main applications and provides a high-level taxonomy of activity recog-nition approaches. Section 2.2 describes in detail the category in which this disser-tation fits regarding the monitoring approach: Sensor-Based Activity Recognition.Based on the specific sensors used for activity monitoring, Section 2.3 presents amore detailed taxonomy for the category of sensor-based activity recognition. Onthe other hand, the following sections analyse the main currents of activity mod-elling, which is the focus of this dissertation: Section 2.4 presents Data-DrivenApproaches, while Section 2.5 describes in detail Knowledge-Driven Approaches.A summary and comparison of both activity modelling currents is provided in Ta-ble 2.1. Some recent work has settled the basis to combine both currents, giving asresult the Hybrid approaches, as shown in Section 2.6. This dissertation is anotherstep in order to achieve hybrid approaches that can combine effectively the best fea-tures of knowledge- and data-driven approaches. The chapter finalises with Section2.7, where a concise summary is provided alongside with some conclusions.
11

2. Related Work
2.1 Human Activity RecognitionHuman activity recognition has become a key research topic in diverse areas, in-cluding pervasive and mobile computing (Weiser, 1991) (Choudhury and Con-solvo, 2008), surveillance-based security (Poppe, 2010), (Akdemir et al., 2008),(Weinland et al., 2011), context-aware computing (Laerhoven and Aidoo, 2001),(Wren and Tapia, 2006), ambient assisted living (Philipose and Fishkin, 2004),(Cook and Schmitter-Edgecombe, 2009), (Kasteren and Noulas, 2008), (Chenet al., 2012b) and social robotics (Fong et al., 2003). The recent increase in in-terest in activity recognition can be attributed to the intensive thrusts from thelatest technology development and application demands. The progress in sensortechnologies has been substantial over the past decade, especially low-power, low-cost, high-capacity and miniaturised sensors, wired and wireless communicationnetworks (Pantelopoulos and Bourbakis, 2010), (Alemdar and Ersoy, 2010), (Dinget al., 2011). In parallel, data processing techniques have also shown important ad-vances, based on higher computational capabilities of devices and the developmentof novel algorithms. The progress and maturity of these supporting technologieshave pushed the research focuses of the aforementioned areas to shift from low-level data collection and transmission towards high-level information integration,context processing and activity recognition and inference.
At the same time, activity recognition has been demanded by a growing numberof solutions for real-world problems and applications. For example, surveillanceand security try to make use of activity recognition technologies to address thethreats of terrorists (Akdemir et al., 2008). Ambient assisted living aims to exploitactivity monitoring, recognition and assistance to support independent living andageing in place. Other emerging applications, such as intelligent meeting rooms(Mikic et al., 2000) and smart hospitals (Sanchez et al., 2008), are also dependenton activity recognition in order to provide multimodal interactions, proactive ser-vice provision, and context aware personalised activity assistance.
As a result of the technology push and application pull, activity recognition hasbuilt its own space in the academic world. As such, research related to activityrecognition has become regular topics in mainstream international conferences inrelated areas such as the AAAI Conference on Artificial Intelligence1, ComputerVision and Pattern Recognition2, International Joint Conference on Artificial Intel-ligence3, International Joint Conference on Pervasive and Ubiquitous Computing4,International Conference on Pervasive Computing and Communications5 and In-
1http://www.aaai.org/2http://www.cvpr201x.org/3http://ijcai.org/4http://ubicomp.org/5http://www.percom.org/
12

2.1 Human Activity Recognition
ternational Joint Conferences on Ambient Intelligence1. In order to try to channelthe research towards future applications, a substantial number of projects and ini-tiatives have been undertaken. Good examples are The Ambient Assisted LivingJoint Programme2, The House of the Future3, The Gator-Tech Smart House4 orThe iDorm project5.
Apart from potential applications, activity recognition has gained research in-terest because it is a multidisciplinary and complex process. Activity recognitioncan be roughly characterised by four basic tasks. These tasks include:
1. Selection and deployment of appropriate sensors to objects and environmentsin order to monitor and capture a user’s behaviour along with the state changeof the environment.
2. To collect, store and process perceived information through data analysistechniques and/or knowledge representation formalisms at appropriate levelsof abstraction.
3. To create computational activity models in a way that allows software sys-tems/agents to conduct reasoning and manipulation.
4. To select or develop reasoning algorithms to infer activities from sensor data.
Each individual task can be tackled by a great variety of methods, technologiesand tools. It is often the case that the selection of a method used for one task isdependent on the method of another task. As such, activity recognition has beenclassified in the following ways according to (Chen et al., 2012a). The first clas-sification criterion focuses on the sensors used for activity monitoring, while thesecond one pays attention to activity modelling techniques:
1. Vision-based vs. sensor-based activity recognition: In terms of the type ofsensor that is used for activity monitoring, activity recognition can be gen-erally classified into two categories. The first is referred to as vision-basedactivity recognition, which is based on the use of visual sensing facilitiessuch as video cameras to monitor an actor’s behaviour and environmentalchanges. The generated sensor data are video sequences or digitized visualdata. The approaches in this category exploit computer vision techniques,including feature extraction, structural modelling, person and object recog-nition, movement segmentation, action extraction and movement tracking to
1http://www.ami-conferences.org/2www.aal-europe.eu3http://architecture.mit.edu/house n4http://www.icta.ufl.edu/gt.htm5http://cswww.essex.ac.uk/iieg/idorm.htm
13

2. Related Work
analyse visual observations for pattern recognition. The second category isreferred to as sensor-based activity recognition, which is based on the useof emerging sensor network technologies for activity monitoring (Section2.2). The generated sensor data from sensor-based monitoring are mainlytime series of state changes and/or various parameter values that are usuallyprocessed through data fusion, probabilistic or statistical analysis methodsand formal knowledge technologies for activity recognition. Sensor-basedactivity monitoring can be further classified into two categories: (i) wearablesensor-based activity monitoring, where sensors are attached to an actor un-der observation, and (ii) dense sensing-based activity monitoring, where sen-sors are attached to objects that constitute the activity environment. Wearablesensors, including modern smartphones, often use inertial measurement unitsand RFID tags to gather an actor’s behavioural information. This approach iseffective for recognising physical movements such as physical exercises. Incontrast, dense sensing infers activities by monitoring human-object interac-tions through the usage of multiple multi-modal miniaturised sensors.
2. Data-driven vs. knowledge-driven activity recognition: The informationobtained through activity monitoring has to be structured and processed torecognise activities. For that purpose, activity models play a critical role. Inparticular, the mechanisms activities are recognised are closely related to thenature and representation of activity models. Generally speaking, activitymodels can be built using one of two methods. The first is to learn activ-ity models from pre-existent large-scale datasets of users’ behaviours usingdata mining and machine learning techniques. This method involves the cre-ation of probabilistic or statistical activity models, followed by training andlearning processes. As this method is driven by data, and the ensued activ-ity inference is based on probabilistic or statistical classification, it is oftenreferred to as data-driven or bottom-up approaches (in the rest of this disser-tation, data-driven will be used to refer to this category). The advantages ofthe data-driven approaches are the capabilities of handling uncertainty andtemporal information (Brand et al., 1997). However, this method requireslarge datasets for training and learning, and suffers from the data scarcity orthe “cold start” problem. It is also difficult to apply learnt activity modelsfrom one person to another. As such this method suffers from the problemsof scalability and reusability. Data-driven approaches are described in detailin Section 2.4. The other method for building activity models is to exploitrich prior knowledge in the domain of interest to construct activity modelsdirectly using knowledge engineering and management technologies. Thisusually involves knowledge acquisition, formal modelling and representa-tion. Activity models generated in this method are normally used for activity
14

2.1 Human Activity Recognition
recognition or prediction through formal logical reasoning, e.g., deduction,induction or abduction. As such, this method is referred to as knowledge-driven or top-down approach (knowledge-driven will be used from now on).Knowledge-driven approaches have the advantages of being semanticallyclear, logically elegant and easy to get started. But they are weak in han-dling uncertainty and temporal information and the models could be viewedas static and incomplete. For a complete review of knowledge-driven ap-proaches, see Section 2.5. With the purpose of combining the advantages ofthose two methods, hybrid approaches have recently emerged (Section 2.6).
The situation generated by both classification criteria is represented in Figure2.1, providing a high-level view of activity recognition systems’ taxonomy.
Datadriven
Knowledgedriven
Sensorbased
Visionbased
ActivityMonitoring
ActivityModelling
Figure 2.1: A high-level taxonomy of activity recognition systems, spanned by twoaxis: monitoring and modelling approach.
Vision-based activity recognition has been a research focus for a long periodof time due to its important role in areas such as surveillance, robot learning andsecurity. However, as this dissertation is based on sensor-based approaches, anexhaustive review of vision-based systems is not provided. Detailed up to datereviews can be found in (Poppe, 2010), (Moeslund et al., 2006), (Yilmaz et al.,2006), (Weinland et al., 2011) and (Turaga, 2008). Even though all those surveyscover different topics, together they have provided an extensive overview on thevision-based approach. It is concluded from those contributions that while visual
15

2. Related Work
monitoring is intuitive and information-rich, vision-based activity recognition suf-fers from issues relating to privacy and ethics (Yilmaz et al., 2006) as cameras aregenerally perceived as recording devices.
Compared to the number of surveys in vision-based activity recognition, andconsidering the wealth of literature in sensor-based activity recognition, there is alack of extensive review on the state of the art of sensor-based activity recognition.This may be because the approach only recently became feasible when the sensingtechnologies matured to be realistically deployable in terms of the underpinningcommunication infrastructure, costs and sizes. An exception to this rule is thesurvey published by Chen et al. (Chen et al., 2012a), which can be considered asthe reference work for any sensor-based activity recognition approach.
2.2 Sensor-Based Activity RecognitionFor the upcoming discussions about activity monitoring, modelling and recogni-tion, it is useful to distinguish human behaviours at different levels of granularity.For physical behaviours, the terms “action” and “activity” are commonly used inactivity recognition communities. In some cases they are used interchangeably andin other cases they are used to denote behaviours of different complexity and dura-tion. In the latter cases the term “action” is usually referred to as simple ambula-tory behaviour executed by a single person and typically lasting for short durationsof time. Examples of actions include bending, retrieving a cup from a cupboard,opening a door, putting a teabag into a cup and so forth. On the other hand, theterm “activities” here refers to complex behaviours consisting of a sequence of ac-tions and/or interleaving or overlapping actions. They could be performed by asingle human or several humans who are required to interact with each other ina constrained manner. They are typically characterized by much longer temporaldurations, such as making tea or two persons making meals. For the rest of this dis-sertation, the second case will be adopted. As such, “actions” will be consideredshort-time simple executions, while “activities” will be described by a sequence ofactions.
The first approaches that implemented the idea of using sensors for activitymonitoring and recognition appeared in the late 90s. The Neural Network House(Mozer, 1998), in the context of home automation, can be considered a pioneer inthis area, alongside with a number of location-based applications aiming to adaptsystems to users’ whereabouts (Leonhardt and Magee, 1998), (Golding and Lesh,1999), (Ward et al., 1997). The approach was soon found to be more useful andsuitable in the area of ubiquitous and mobile computing – an emerging area in thelate 90s, due to its easy deployment. As such, extensive research has been un-dertaken to investigate the use of sensors in various application scenarios of ubiq-
16

2.2 Sensor-Based Activity Recognition
uitous and mobile computing, leading to considerable work on context-awareness(Schmidt et al., 1999), (Randell and Muller, 2000), (Gellersen et al., 2002), smartappliances (Schmidt and Laerhoven, 2001), (Laerhoven and Aidoo, 2001) and ac-tivity recognition (Laerhoven, 2001), (Foerster and Fahrenberg, 2000), (Lee andMase, 2002). Those initial research works usually made use of wearable sensors,either dedicated sensors attached to human bodies or portable devices like mo-bile phones, with application to ubiquitous computing scenarios such as providingcontext-aware mobile devices. Activities being monitored in these researches aremainly physical activities like motion, walking and running. These early works laya solid foundation for wearable computing and still inspire and influence today’sresearch.
In the early 2000s, a new sensor-based approach that uses sensors attachedto objects to monitor human activities appeared. This approach, which was laterdubbed as the “dense sensing” approach, performs activity recognition throughthe inference of user-object interactions (Bao and Intille, 2004), (Patterson et al.,2003). The approach is particularly suitable for dealing with activities that involvea number of objects within an environment, or instrumental Activities of DailyLiving (ADL) (Chan et al., 2008), (Nugent and Mulvenna, 2009). Research onthis approach has been heavily driven by the intensive research interests and hugeresearch effort on smart home based assisted living, such as the EU’s Ambient As-sisted Living program. In particular, sensor-based activity recognition can betteraddress sensitive issues in assisted living such as privacy, ethics and obtrusive-ness than conventional vision-based approaches. This combination of applicationneeds and technological advantages has stimulated considerable research activitiesin a global scale, which gave rise to a large number of research projects, where aplethora of impressive works on sensor-based activity recognition have been de-veloped (Kern et al., 2003), (Mantyjarvi, 2001), (Philipose and Fishkin, 2004),(Patterson and Fox, 2005), (Buettner and Prasad, 2009), (Wren and Tapia, 2006),(Gu et al., 2009), (Patterson et al., 2003), (Liao et al., 2007a).
While substantial research has been undertaken, and significant progress hasbeen made, the two main approaches, wearable sensors based and dense sensingbased activity recognition are currently still focuses of study. The former is mainlydriven by the ever-popular pervasive and mobile computing while the latter is pre-dominantly driven by smart environment applications such as ambient assisted liv-ing. Interests in various novel applications are still increasing and application do-mains are rapidly expanding.
17

2. Related Work
2.3 Sensor and Activity MonitoringThanks to the rapid development in electronics, a wide range of sensors, includingcontact sensors, RFID, accelerometers, audio and motion detectors, to name buta few, are available for activity monitoring. These sensors are different in types,purposes, output signals, underpinning theoretical principles and technical infras-tructure. However, they can be classified into two main categories in terms of theway they are deployed in activity monitoring applications. These are wearablesensors and dense sensors, and are described in detail in the following sections.
2.3.1 Wearable sensor-based activity monitoringWearable sensors generally refer to sensors that are positioned directly or indirectlyon human body. These kinds of sensors can be worn by humans, so they are namedwearable sensors. They generate signals when the user performs actions and ac-tivities. As a result, they can monitor features that are descriptive of the person’sphysiological state or movement. Wearable sensors can be embedded into clothes,eyeglasses, belts, shoes, wristwatches, mobile devices or positioned directly on thebody. They can be used to collect information such as body position and movement,pulse, and skin temperature. Researchers have found that different types of sensorinformation are effective for classifying different types of activities. As wearablesensors are not directly related to this dissertation, some references are shown forfurther reading, classified by the sensors used:
1. Inertial measurement units: those sensors are composed by accelerometersand gyroscopes and are probably the most frequently used wearable sen-sor for activity monitoring. Inertial measurement units provide informationabout acceleration and speed of the units while moving. In consequence,they are appropriate to monitor human movements and actions and activitiesrelated to body motion, such as physical exercise. Some examples of theusage of inertial measurement units are provided in (Bao and Intille, 2004),(Lukowicz et al., 2004), (Lee and Mase, 2002) and (Mantyjarvi, 2001).
2. GPS sensors: specially used for monitoring outdoor location-based activities,such as in (Patterson et al., 2003), (Ashbrook and Starner, 2003) and (Liaoet al., 2007b).
3. Biosensors: to monitor activities through vital signs, e.g. (Sung, M., DeVaul,R., Jimenez, S., Gips, J., Pentland, 2004), (Harms et al., 2008) and (Finniet al., 2007).
Wearable sensor-based activity monitoring suffers from limitations. Most wear-able sensors need to run continuously and be operated hands-free. This may have
18

2.3 Sensor and Activity Monitoring
difficulties in real world application scenarios. Practical issues include the accept-ability or willingness to use wearable sensors and the viability and ability to wearthem. Technical issues include the size, ease of use, battery life and effectivenessof the approach in real-world scenarios. A way to overcome such problems is tomake use of existing gadgets that have already been carried in a daily basis likesmartphones as intelligent sensors for activity monitoring, recognition and assis-tance. This practice has been in place for a while (Gellersen et al., 2002), (Schmidtand Laerhoven, 2001) and is expected to gain large-scale uptake given the latest de-velopment and affordability of such palm-held electronic devices. Recently, a newand promising class of wearable sensors have appeared in the market, namely theGoogle Glasses1 (see Figure 2.2). Those special glasses include a camera, a smalleye-screen, headphones and a computing unit. It is expected that the irruption ofsuch glasses will bring to market more similar options. The potential of these kindsof devices for activity monitoring and recognition is still to be explored.
Obviously wearable sensors are not suitable for monitoring activities that in-volve complex physical motions and/or multiple interactions with the environment.In some cases, sensor observations from wearable sensors alone are not sufficient todifferentiate activities involving simple physical movements (e.g., making tea andmaking coffee). As a result, dense sensing based activity monitoring has emerged,which is described below.
Figure 2.2: The Google Glass wearable, with its processing unit, camera, headphonesand screen.
2.3.2 Dense sensing-based activity monitoringDense sensing-based activity monitoring is based on attaching sensors to objectsthat a user manipulates while performing activities. Hence activity monitoring is
1https://www.google.com/glass/start/
19

2. Related Work
carried out by detecting user-object interactions. The approach is based on real-world observations that activities are characterised by the objects that are manip-ulated during their performance. A simple indication of an object being used canoften provide powerful clues about the activity being undertaken. As such it isassumed that activities can be recognised from sensor data that monitors humaninteractions with objects in the environment. By dense sensing, the way and scalewith which sensors are used is characterised. Using dense sensing a large numberof sensors, normally low-cost low-power and miniaturised, are deployed in a rangeof objects or locations within an environment for the purpose of monitoring move-ment and behaviour. Following the dense sensing paradigm, sensors are movedfrom human bodies to human-populated environments.
The dense sensing paradigm has been widely used for creating ambient intelli-gent applications such as smart homes, because sensors are embedded within en-vironments. The pre-eminence of dense sensing in ambient assisted living (AAL),via the smart home paradigm, can be seen in (Chan et al., 2008), (Nugent andMulvenna, 2009) or (Helal et al., 2005). Sensors in a smart home can monitoran inhabitant’s movements and environmental events so that activities can be in-ferred based on the sensor observations, thus providing just-in-time context-awareassistance. For instance, a switch sensor in the bed can strongly suggest sleepingor relaxing, and pressure mat sensors can be used for tracking the movement andposition of people within the environment.
Since the introduction of the idea in early 2000s (Bao and Intille, 2004), (Pat-terson et al., 2003), extensive research has been undertaken to investigate the appli-cability of the approach in terms of sensor types, modalities and applications. Forexample, Tapia et al. (Tapia et al., 2004) use environmental state-change sensorsto collect information about interaction with objects and recognise activities thatare of interest to medical professionals such as toileting, bathing, and grooming.Wilson et al. (Wilson and Atkeson, 2005) use four kinds of anonymous and binarysensors, motion detectors, break-beam sensors, pressure mats, and contact switchesfor simultaneous tracking and activity recognition. Wren et al. (Wren and Tapia,2006) employ networks of passive infrared motion sensors to detect presence andmovement of heat sources. With this captured data they can recognise low-level ac-tivities such as walking, loitering, and turning, as well as mid-level activities suchas visiting and meeting. Srivastava et al. (Srivastava et al., 2001) exploit wirelesssensor network to develop smart learning environment for young children. Hol-losi et al. (Hollosi and Schroder, 2010) use voice detection techniques to performacoustic event classification for monitoring in Smart Homes. Simple object sensorsare adopted in (Aipperspach et al., 2006).
Given the abundance of different types and modalities of sensors, sensors havebeen used in different ways and combinations for dense sensing activity monitoringin many application scenarios. It is impossible to claim that one sensor deployment
20

2.4 Data-Driven Approaches
for a specific application scenario is superior to the other. The suitability and per-formance is usually down to the nature of the type of activities being assessed andthe characteristics of the concrete applications.
Generally speaking, wearable sensor-based activity monitoring receives moreattention in mobile computing while dense sensing is more suitable for intelligentenvironment enabled applications. It is worth pointing out that wearable sensorsand dense sensing are not mutually exclusive. In some applications they have towork together. For example, RFID (Radio Frequency Identification) based activitymonitoring requires that objects are instrumented with tags and users wear an RFIDreader affixed to a glove or a bracelet. Philipose and Fishkin (Philipose and Fishkin,2004), (Fishkin et al., 2005) developed two devices, iGlove and iBracelet, workingas wearable RFID readers that detect when users interact with unobtrusively taggedobjects. Patterson et al. (Patterson and Fox, 2005) performed fine-grained activityrecognition (i.e., not just recognising that a person is cooking but determining whatthey are cooking) by aggregating abstract object usage. Hodges et al. (Hodges andPollack, 2007) proposed to identify individuals from their behaviour based on theirinteraction with the objects they use in performing daily activities. Buettner et al.(Buettner and Prasad, 2009) recognise indoor daily activities by using an RFID sen-sor network. In most cases wearable sensors and dense sensing are complementaryand can be used in combination in order to yield optimal recognition results. Forexample, Gu et al. (Gu et al., 2009) combine wearable sensors and object sensorsfor collecting multimodal sensor information. Through a pattern-based method,they recognise sequential, interleaved and concurrent activities.
Dense sensing activity monitoring has also some drawbacks. One of the mostobvious ones is the need to install a lot of sensors in human populated environ-ments, which may involve considerable infrastructure changes (install pressuremats or movement sensors), or the problem of adding sensors to any new object in-troduced in the environment (attach contact sensors to glasses bought in the super-market). The practical feasibility of the approach is probably linked to introducingsensors in the production steps of objects and building phases of the environments.Another drawback is the simple information provided by the sensors, which cannotbe enough if very detailed activities have to be recognised. A contact sensor mayindicate an interaction between a human and an object, but it cannot provide anyinformation about how the object is being used by the human.
2.4 Data-Driven ApproachesIn terms of the techniques and methods used for activity modelling and recognition,abstracting from specific activity monitoring systems, data-driven activity mod-elling is one of the most successful approaches. Data-driven activity modelling can
21

2. Related Work
be generally classified into two main categories: generative and discriminative. Thegenerative approach attempts to build a complete description of the input or dataspace, usually with a probabilistic model such as a Bayesian Network. In contrast,the discriminative approach only models the mapping from inputs (data) to outputs(activity labels). Discriminative approaches include many heuristic (rule-based)approaches, neural networks, conditional random fields and linear or non-lineardiscriminative learning (e.g. support vector machines). Results using each of thosemethods are covered in the following.
2.4.1 Generative modellingThe simplest possible generative approach is the Naıve Bayes classifier, which hasbeen used with promising results for activity recognition (Bao and Intille, 2004),(Brdiczka et al., 2007), (Cook and Schmitter-Edgecombe, 2009), (Tapia et al.,2004), (van Kasteren and Krose, 2007), (Maurer and Rowe, 2006). Naıve Bayesclassifiers model all observations (e.g. sensor readings) as arising from a commoncausal source: the activity, as given by a discrete label. The dependence of obser-vations on activity labels is modelled as a probabilistic function that can be usedto identify the most likely activity given a set of observations. Despite the fact thatthese classifiers assume conditional independence of the features, the classifiersyield good accuracy when large amounts of sample data are provided. Neverthe-less, Naıve Bayes classifiers do not explicitly model any temporal information,usually considered important in activity recognition.
The Hidden Markov Model (HMM) is probably the most popular generativeapproach that includes temporal information. A HMM is a probabilistic modelwith a particular structure that makes it easy to learn from data, to interpret the dataonce a model is learnt, and is both easy and efficient to implement. It consists ofa set of hidden (latent) states coupled in a stochastic Markov chain, such that thedistribution over states at some time depends only on the values of states at a finitenumber of preceding times. The hidden states then probabilistically generate ob-servations through a stochastic process. HMMs made their impact initially throughuse in the speech recognition literature, where latent states correspond to phonemelabels, and observations are features extracted from audio data. HMMs have morerecently been adopted as a model of choice in computer vision for modelling se-quential (video) data (see (Gavrila, 1999), (Moeslund et al., 2006) for surveys and(Galata et al., 1999), (Starner, 1995) for early examples). HMMs use a Markovchain over a discrete set of states. A closely relative of the HMM uses continuousstates, a model usually referred to as a linear dynamical system (LDS). State es-timation in LDSs is better known as a Kalman filter. LDSs have been used withinputs from a variety of sensors for physiological condition monitoring (Quinn,2009) in which a method is also introduced to deal with unmodelled variations in
22

2.4 Data-Driven Approaches
data, one of the major shortcomings of the generative approach.HMMs form the basis of statistical temporal models. They are, in fact, a special
case of the more general Dynamic Bayesian Networks (DBNs), which are Bayesiannetworks in which a discrete time index is explicitly represented. Inference andlearning in DBNs is simply an application of network propagation in Bayesiannetworks. DBNs usually make a Markovian assumption, but explicitly representconditional independence in the variables, allowing for more efficient and accurateinference and learning. A well known early use of DBNs for activity monitoringwas in the Lumiere project, where a Microsoft Windows user’s need for assistancewas modelled based on their activities on the screen (Horvitz et al., 1998).
A simple DBN extension of HMMs is the coupled HMM for recognition ofsimultaneous human actions (e.g. pedestrian motions (Brand et al., 1997)). Cou-pled Hidden Markov Models (CHMMs) have two Markovian chains, each mod-elling a different stream of data, with a coupling between them to model their inter-dependence. Oliver et al. (Oliver et al., 2004) learn a multi-layer model of officeactivity to choose actions for a computational agent. The model uses multimodalinputs, making only very slight use of computer vision. The Assisted Cognitionproject (Kautz et al., 2002) has made use of DBNs, in particular for OpportunityKnocks (Liao et al., 2007b), a system designed to provide directional guidance to auser navigating through a city. This system uses a three level hierarchical Markovmodel represented as a DBN to infer a user’s activities from GPS sensor readings.Movement patterns, based on the GPS localization signals, are translated into aprobabilistic model using unsupervised learning. From the model and the user’scurrent location, future destinations and the associated mode of transportation canbe predicted. Based on the prediction, the system has the ability to prompt the userif an error in route is detected.
Wilson and Atkeson use DBNs to simultaneously track persons and model theiractivities from a variety of simple sensors (motion detectors, pressure sensors,switches and so on) (Wilson and Atkeson, 2005). DBNs were also used in theiSTRETCH system, a haptic robotic device to assist a person with stroke rehabil-itation (Kan et al., 2011). The DBN models the person’s current behaviours, theircurrent abilities, and some aspects of their emotional state (e.g. their responsive-ness, learning rate and fatigue level). The person’s behaviours correspond to howlong they take for each exercise, what type of control they exhibit and whether theycompensate. These behaviours are inferred from sensors on the device and in theperson’s chair.
Even though they are simple and popular, HMMs and DBNs have some lim-itations. A HMM is incapable of capturing long-range or transitive dependenciesof the observations due to its very strict independence assumptions (on the obser-vations). Furthermore, without significant training, a HMM may not be able torecognise all of the possible observation sequences that can be consistent with a
23

2. Related Work
particular activity.
2.4.2 Discriminative modellingA drawback of the generative approach is that enough data must be available tolearn the complete probabilistic representations that are required. In this section,an alternative approach for modelling is discussed, in which the focus is on solvingthe classification problem, rather than on the representation problem. The completedata description of a generative model induces a classification boundary, which canbe seen by considering every possible observation and applying the classificationrule using inference. The boundary is thus implicit in a generative model, but a lotof work is necessary to describe all the data to obtain it. A discriminative approach,on the other hand, considers this boundary to be the primary objective.
Perhaps the simplest discriminative approach is Nearest Neighbour (NN), inwhich a novel sequence of observations is compared to a set of template sequencesin a training set, and the most closely matching sequences in the training set votefor their activity labels. This simple approach can often provide very good results.Bao and Intille investigated this method along with numerous other base-level clas-sifiers for the recognition of activities from accelerometer data (Bao and Intille,2004). They found that the simple NN approach is outperformed by decision trees,a related method, where the training data is partitioned into subsets according to ac-tivity labels and a set of rules based on features of the training data. The rules canthen be used to identify the partition (and hence the activity label) correspondingto a new data sample. Maurer et al. (Maurer and Rowe, 2006), employed decisiontrees to learn logical descriptions of activities from complex sensor readings froma wearable device (the eWatch). The decision tree approach offers the advantage ofgenerating rules that are understandable by the user, but it is often brittle when highprecision numeric data is collected. Stikic and Schiele use a clustering method inwhich activities are considered as a “bag of features” to learn template models ofactivities from data with only sparse labels (Stikic and Schiele, 2009).
For the classification problem, the points closest to the boundary are the onesthat give more information about the boundary itself. Points lying far apart theboundary should not be taken into account then. There are several discriminativeapproaches that effectively take advantage of this fact. The challenge is therefore tofind these “hard” data points (the ones closest to the boundary). These data pointswill be known as the “support vectors”, and actually define the boundary. A sup-port vector machine (SVM) is a machine learning technique to find these supportvectors automatically. A recent example of an SVM in use for activity modelling ispresented by Brdiczka et al. (Brdiczka, 2009) where a model of situations is learntautomatically from data by first learning roles of various entities using SVMs andlabelled training data, then using unsupervised clustering to build ’situations’ or
24

2.4 Data-Driven Approaches
relations between entities, which are then labelled and further refined by end users.The key idea in this work is to use a cognitive model (situation model) based oncognitive theory motivated by models of human perception of behaviour in an en-vironment. The CareMedia project (Chen et al., 2005) also uses an SVM to locateand recognise social interactions in a care facility from multiple sensors, includ-ing video and audio. The fusion of video and audio allowed 90% recall and 20%precision in identifying interactions including shaking hands, touching, pushingand kicking. The CareMedia project’s goals are to monitor and report behaviourassessments in a care home to caregivers and medical professionals.
Ravi et al. also found that SVMs performed consistently well, but also in-vestigated meta-level classifiers that combined the results of multiple base-levelclassifiers (Ravi et al., 2005). Features extracted from worn accelerometers areextracted and classified using five different base-level classifiers (decision tables,decision trees, k-NN, SVM and Naıve Bayes). The meta-level classifiers are gen-erated through a variety of techniques such as boosting, bagging, voting, cascadingand stacking. For recognising a set of eight activities including standing, walk-ing, running, going up/down stairs, vacuuming and teeth brushing, they found thata simple voting scheme performed the best for three easier experimental settings,whereas boosted SVM performed best for the most difficult setting (test/trainingseparation across users and days)
In practice, many activities may have non-deterministic natures, where somesteps of the activities may be performed in any order, and so are concurrent or in-terwoven. A conditional random field (CRF) is a more flexible alternative to theHMM that addresses such practical requirements. It is a discriminative and gen-erative probabilistic model that represents the dependence of a hidden variable yon an observed variable x (Sutton et al., 2007). Both HMMs and CRFs are usedto find a sequence of hidden states based on observation sequences. Nevertheless,instead of finding a joint probability distribution p(x, y) as the HMM does, a CRFattempts to find only the conditional probability p(y|x). A CRF allows for arbitrary,non-independent relationships among the observation sequences, hence the addedflexibility. Another major difference is the relaxation of the independence assump-tions, in which the hidden state probabilities may depend on the past and evenfuture observations. A CRF is modelled as an undirected acyclic graph, flexiblycapturing any relation between an observation variable and a hidden state. CRFsare applied to the problem of activity recognition in (Vail et al., 2007) where theyare compared to HMMs, but only in a simple simulated domain. Liao et al. use hi-erarchical CRFs for modeling activities based on GPS data (Liao et al., 2007a). Huand Yang use skip-chain CRFs, an extension in which multiple chains interact in amanner reminiscent of the CHMM, to model concurrent and interleaving goals (Huand Yang, 2008), a challenging problem for activity recognition. Mahdaviani andChoudhury show how semi-supervised CRFs can be used to learn activity models
25

2. Related Work
from wearable sensor data (Mahdaviani and Choudhury, 2008).
2.4.3 Other approachesThere are many approaches in the literature which cannot be clearly classified intodiscriminative or generative categories, but rather use a combination of both. TheIndependent Lifestyle Assistant (ILSA) is an example, as it uses a combination ofheuristic rules and statistical models of sequential patterns of sensor firings andtime intervals to help a person with planning and scheduling (Guralnik and Haigh,2002). PEAT (the Planning and Execution Assistant and Trainer) is a cognitive as-sistant that runs on a mobile device, and helps compensate for executive functionalimpairment. PEAT uses reactive planning to adjust a user’s schedule based on theircurrent activities. Activity recognition in PEAT is based on what the user is doing,and on data from sensors on the mobile device. These are fed into a HMM, theoutputs of which are combined with the reactive planning engine (Modayil et al.,2008).
Other work has investigated how activities can be modelled with a combinationof discriminative and generative approaches (Lester et al., 2005), how commonsense models of everyday activities can be built automatically using data miningtechniques (Pentney et al., 2008), (Pentney et al., 2007), and how human activitiescan be analysed through the recognition of object use, rather than the recognition ofhuman behaviour (Wu and Osuntogun, 2007). This latter work uses DBNs to modelvarious activities around the home, and a variety of radio frequency identification(RFID) tags to bootstrap the learning process. Some authors have attempted tocompare discriminative and generative models (Bao and Intille, 2004), (Ravi et al.,2005), generally finding the discriminative models yield lower error rates on unseendata, but are less interpretable. Gu et al. use the notion of emerging patterns to lookfor frequent sensor sequences that can be associated with each activity as an aid forrecognition (Gu et al., 2009). Omar et al. present a comparative study of a variety ofclassification methods for analysing multi-modal sensor data from a smart walker(Omar et al., 2010).
One of the biggest problems of data-driven approaches, regardless their cate-gory, is the need of large-scale labelled data bases. This problem arises becauseactivity recognition is posed as a supervised learning problem. However, due to therequired effort and time for annotating activity data bases, supervised methods donot scale up well in practice. Annotating activity data imposes a burden on anno-tators and users and often introduces a source of error in the process. Rashidi andCook show how to overcome the problem of depending on labelled activity databases in (Rashidi and Cook, 2011), improving the approach in (Rashidi and Cook,2013). They use a non-labelled data base, where they extract activity clusters usingunsupervised learning techniques. More concretely, they develop a new activity
26

2.4 Data-Driven Approaches
modelling method named COM, which stands for Continuous, varied Order, MultiThreshold. COM not only discovers discontinuous patterns and their variations, butis able to better handle real life data by dealing with different frequencies/sensorproblem. All patterns discovered by COM are then used as inputs for a hierarchi-cal agglomerative clustering algorithm. The clustering algorithm aims at groupingthose sensor patterns which are similar in terms of their structure. An activity struc-ture is defined as the start time, duration and region or location. Those clusters arefinally used to train a boosted HMM, which is shown to be able to recognise dis-covered activities.
Rashidi and Cook bring a new paradigm to data-driven activity recognition intheir work, showing the real possibility of using an unsupervised model and avoiddata base annotation problems. However, their approach still suffers some othertraditional problems of data-driven approaches. Firstly, even though they do notuse labelled data bases, they do not overcome the “cold start” problem, since theyhave to collect data in order to discover activities and train HMMs. Besides, asother data-driven approaches, they have many difficulties when generalising whatthey have discovered and learnt from previous users, since every user has his/herown ways of performing activities. The price to pay for avoiding labelled data basesis that the approach cannot set activity granularity and that discovered activities donot have any semantic meaning. The first problem refers to the impossibility of de-ciding at design phase what kind of activities will be recognised. For example, if auser usually washes dishes after preparing meal, COM will discover this sequenceas a typical activity. However, the discovered activity is actually a sequence oftwo lower-grain activities. The second problem refers to the fact that discoveredactivities are only sequences of sensors with their location and time information,but without any semantic meaning. A human expert is needed afterwards to in-terpret discovered activities and label them with semantic tags. Notice that this aposteriori labelling step may be difficult since activity granularity is not set.
The other big problem of data-driven approaches is related to activity modelgeneralisation. As activity models are learnt from specific users’ behavioural data,the acquired models are personal. Those personal models cannot be generalised andapplied to other users. To overcome this problem, some researchers have alreadyworked on transfer learning techniques. A complete survey on transfer learningtechniques for activity recognition can be found in (Cook et al., 2013). The ideabehind transfer learning is to take advantage of the learnt models whenever a newtraining process is launched in a new environment and/or for a new user. This way,the new training phase can be boosted, transferring the knowledge acquired in aprevious scenario. Information about sensors, specific activities or locations can bevery similar and can provide interesting hints to train new models with few data.
Transfer learning scenarios usually distinguish between the source domain andthe target domain. The first domain is composed by the environment, sensors, activ-
27

2. Related Work
ities and person where initial activity models have been learnt. The second domainrefers to the environment, sensors, activities and person where the new models haveto be learnt. Notice that there can be big differences between both domains. For in-stance, sensors may be completely different, some new activities may appear in thetarget domain or environments may vary slightly. Depending on those differences,learning techniques vary. However, the most influential parameters to define thelearning techniques are related to the availability of labelled data in both domains.Following the classification established in (Cook et al., 2013), depending on theavailability of labelled data, the following scenarios are distinguished:
• Informed supervised transfer learning: when labelled data is available forboth, target and source domains. Those scenarios are solved using inductivelearning techniques.
• Uninformed supervised transfer learning: labelled data is only available inthe source domain, so transductive learning approaches are applied.
• Informed unsupervised transfer learning: in this case, labelled data is avail-able only in the target domain. Inductive learning techniques are used forthose kinds of scenarios.
• Uninformed unsupervised transfer learning: there is no labelled data avail-able, neither in the target nor in the source domain. Unsupervised learningtechniques have to be used to work in those scenarios.
Transfer learning can mitigate the problem of model generalisation, and thus,reusability, but it cannot solve those problems completely. Notice that whenever anew domain is approached, even using transfer learning techniques, a new trainingphase has to be carried out. The merit of transfer learning is to use previously learntmodels to enhance and accelerate new training processes.
2.4.4 Summary of data-driven approachesData-driven approaches have been extensively used for activity recognition. Theiradvantages and disadvantages are very well known by the scientific community (asummary and comparison to knowledge-driven approaches can be found in Table2.1):
Advantages• Uncertainty modelling: as probabilistic and statistical activity modelling is
used, data-driven approaches are very good modelling sensor uncertainty.
28

2.4 Data-Driven Approaches
As sensors do not provide certain information and are exposed to failures,modelling uncertainty is a very important feature for real-world deployments.
• Temporal information modelling: modelling approaches such as DBNs,HMMs and similar implicitly model temporal information of activities, suchas time lapses between two sensor readings, activity duration or activity starttime. Time information can be learnt from data in a natural way.
• Introduce heuristics: discriminative approaches make possible introducingheuristics about activity models. Heuristics can be used to insert basic knowl-edge about activities and avoid making activity models totally dependent ondata.
• Dynamic activity models: as learning is a continuous process, activity mod-els evolve as the user changes its habits. As such, activity models are dy-namic.
• Personal activity models: learning activity models directly over user data,makes activity models personalised. This means that activity models capturethe particular way of performing an activity by a user.
Disadvantages• “Cold start” problem: data is needed to model activities. The dependency
with data arises the “cold start” problem, since data-driven techniques cannotwork immediately after deployment. A data collecting and activity modeltraining process is required for every user.
• Lack of reusability: as activity models are directly learnt from concrete userdata, they cannot generally be used for other users. The main problem is thatdata-driven approaches cannot build generic activity models, only personalactivity models. These problems are mitigated, but not solved, by transferlearning techniques, as shown in Section 2.4.3.
• Dataset annotation problems: if annotated datasets are needed (supervisedlearning approaches), scalability becomes a real problem, since the effortrequired for annotation is huge and annotation methods are prone to errors. Ifannotated datasets are not used (unsupervised approach), activity granularityand activity semantics is lost.
29

2. Related Work
2.5 Knowledge-Driven ApproachesIt has been observed that for most activities the list of objects required for a par-ticular activity is limited and functionally similar. Knowledge-driven activity mod-elling is motivated by those observations. The idea is that even if the activity canbe performed in different ways the number and type of involved objects do notvary significantly. For example, it is common sense that the activity “make coffee”consists of a sequence of actions involving a coffee pot, hot water, a cup, coffee,sugar and milk; the activity “brush teeth” contains actions involving a toothbrush,toothpaste, water tap, cup and towel. On the other hand, as humans have differentlife styles, habits or abilities, they may perform various activities in different ways.For instance, one may like strong white coffee and another may prefer a specialbrand of coffee. Even for the same type of activity (e.g., making white coffee),different individuals may use different items (e.g., skimmed milk or whole milk)and in different orders (e.g., adding milk first and then sugar, or vice versa). Suchdomain-dependent activity-specific prior knowledge provides valuable insights intohow activities can be constructed in general and how they can be performed by in-dividuals in specific situations.
Similarly, knowledge-driven activity recognition is founded upon the observa-tions that most activities, in particular, routine activities of daily living and work-ing, take place in a relatively specific circumstance of time, location and space.The space is usually populated with events and entities pertaining to the activities,forming a specific environment for specific purposes. For example, brushing teethis normally undertaken twice a day in a bathroom in the morning and before go-ing to bed and involves the use of toothpaste and a toothbrush; meals are made in akitchen with a cooker roughly three times a day. The implicit relationships betweenactivities, related temporal and spatial context and the entities involved (objects andpeople) provide a diversity of hints and heuristics for inferring activities.
Knowledge-driven activity modelling and recognition intends to make use ofrich domain knowledge and heuristics for activity modelling and pattern recogni-tion. The rationale is to use various methods, in particular, knowledge engineer-ing methodologies and techniques, to acquire domain knowledge. The capturedknowledge can then be encoded in various reusable knowledge structures, includ-ing activity models for holding heuristics and prior knowledge in performing ac-tivities, and context models for holding relationships between activities, objectsand temporal and spatial contexts. Comparing to data-driven activity modellingthat learns models from large-scale datasets and recognises activities through dataintensive processing methods, knowledge-driven activity modelling avoids a num-ber of problems, including the requirement for large amounts of observation data,the inflexibility that arises when each activity model needs to be computationallylearnt, and the lack of reusability that results when one person’s activity model is
30

2.5 Knowledge-Driven Approaches
different from another’s.Knowledge structures can be modelled and represented in different forms, such
as schemas, rules or networks. This will decide the way and the extent to whichknowledge is used for further processing such as activity recognition, predictionand assistance. In terms of the manner in which domain knowledge is captured, rep-resented and used, knowledge-driven approaches to activity modelling and recog-nition can be roughly classified into three main categories as presented in the fol-lowing sections.
2.5.1 Mining-based approachThe objective of a mining-based approach is to create activity models by mining ex-isting activity knowledge from publicly available sources. More specifically, givena set of activities, the approach seeks to discover from the text corpuses a set ofobjects used for each activity and extract object usage information to derive theirassociated usage probabilities. The approach essentially views an activity modelas a probabilistic translation between activity names (e.g., “make coffee”) and thenames of involved objects (e.g., “mug”, “milk”). As the correlations between ac-tivities and their objects are common-sense prior knowledge (e.g., most of us knowhow to carry out daily activities), such domain knowledge can be obtained fromvarious sources such as how-tos (e.g., those at ehow.com or wikihow.com), recipes(e.g., from epicurious.com), training manuals, experimental protocols, and facili-ty/device user manuals.
A mining-based approach consists of a sequence of distinct tasks. Firstly itneeds to identify activities of concern and relevant sources that describe these ac-tivities. Secondly, it uses various methods, predominantly information retrievaland analysis techniques, to retrieve activity definitions from specific sources andextract phrases that describe the objects used during the performance of the activ-ity. Then algorithms, predominantly probabilistic and statistic analysis methodssuch as co-occurrences and association are used to estimate the object-usage prob-abilities. Finally, the mined object and usage information is used to create activitymodels such as a HMM that can be used further for activity recognition.
Mining-based activity modelling was initially investigated by researchers fromIntel Research (Wu and Osuntogun, 2007), (Wyatt et al., 2005). Perkowitz et al.(Perkowitz et al., 2004) proposed the idea of mining the Web for large-scale ac-tivity modelling. They used the QTag tagger to tag each word in a sentence withits part of speech (POS) and a customized regular expression extractor to extractobjects used in an activity. They then used the Google Conditional Probabilities(GCP) APIs to determine automatically the probability values of object usage. Themined object and their usage information are then used to construct DBN modelsthrough Sequential Monte Carlo (SMC) approximation. They mined the website
31

2. Related Work
ehow.com for roughly 2300 directions on performing domestic tasks (from “boilingwater in the microwave” to “change your air filter”), and the website ffts.com andepicurious.com for a further 400 and 18,600 recipes respectively, generating a total21,300 activity models. Using the DBN activity models they have performed activ-ity recognition for a combination of real user data and synthetic data. While initialevaluation results were positive, the drawback was that there are no mechanisms toguarantee the mined models capturing completely the sequence probabilities andthe idiosyncrasy of certain activities. The inability to capture such intrinsic charac-teristics may limit the model’s accuracy in real deployments.
Wyatt et al. (Wyatt et al., 2005) followed Perkowitz’s approach by mining theWeb to create DBN activity models. However, this group extended the work inthree aspects, aiming to address the idiosyncrasies and to improve model accuracy.To cover the wide variety of activity definition sources, they mined the Web in amore discriminative way in a wider scope. They did this by building a specialisedgenre classifier trained and tested with a large number of labelled Web pages. Toenhance model applicability, they used the mined models as base activity modelsand then exploited the Viterbi Algorithm and Maximum Likelihood to learn cus-tomized activity parameters from unsegmented, unlabelled sensor data. In a bidto improve activity recognition accuracy they also presented a bootstrap methodthat produced labelled segmentations automatically. Then they used the Kullback-Leibler (KL) divergence to compute activity similarity.
A difficulty in connecting mined activities with tagged objects (Perkowitz et al.,2004), (Wyatt et al., 2005) is that the activity models may refer to objects synony-mously. For example, both a “mug” and “cup” can be used for making tea; botha “skillet” and “frying pan” may be used for making pasta. This leads to a situa-tion that one activity may have different models with each having the same activityname but different object terms. To address this, Tapia et al. (Tapia et al., 2006)proposed to extract collections of synonymous words for the functionally-similarobjects automatically from WordNet, an online lexical reference system for the En-glish language. The set of terms for similar objects is structured and representedin a hierarchical form known as the object ontology. With the similarity measureprovided by the ontology, an activity model will not only cover a fixed numberof object terms but also any other object terms that are in the same class in theontology.
Another shortcoming of early work in the area (Perkowitz et al., 2004), (Wyattet al., 2005) is that the segmentation is carried out in sequential order based onthe duration of an activity. As the duration of performing a specific activity mayvary substantially from one to another, this may give rise to applicability issues.In addition, in sequential segmentation one error in one segment may affect thesegmentations of the subsequent traces. To tackle this, Palmes et al. (Palmes et al.,2010) proposed an alternate method for activity segmentation and recognition. In-
32

2.5 Knowledge-Driven Approaches
stead of relying on the order of object use, they exploited the discriminative traitof the usage frequency of objects in different activities. They constructed activitymodels by mining the Web and extracting relevant objects based on their weights.The weights are then utilised to recognise and segment an activity trace containinga sequence of objects used in a number of consecutive and non-interleaving activi-ties. To do this, they proposed an activity recognition algorithm, KeyExtract, whichuses the list of discriminatory key objects from all activities to identify the activitiespresent in a trace. They further proposed two heuristic segmentation algorithms,MaxGap and MaxGain, to detect the boundary between each pair of activities iden-tified by KeyExtract. Boundary detection is based on the calculation, aggregation,and comparison of the relative weights of all objects sandwiched in any two key ob-jects representing adjacent activities in a trace. Though the mining based approachhas a number of challenges relating to information retrieval, relation identificationand the disambiguation of term meaning, nevertheless, it provides a feasible alter-native to model large amount of activities. Initial research has demonstrated theapproach is promising.
Mining-based approaches are similar to data-driven approaches in that they alladopt probabilistic or statistical activity modelling and recognition. But they aredifferent from each other in the way that the parameters of the activity modelsare decided. The mining-based approaches make use of publicly available datasources avoiding the “cold start” problem. Nevertheless they are weak in dealingwith idiosyncrasies of activities. On the other hand, data-driven approaches havethe strength of generating personalised activity models, but they suffer from issuessuch as “cold start” and model reusability for different users.
2.5.2 Logic-based approachesA logic-based approach views an activity as a knowledge model that can be for-mally specified using various logical formalisms. From this perspective, activ-ity modelling is equivalent to knowledge modelling and representation. As such,systematic knowledge engineering methodologies and techniques are used for do-main knowledge acquisition and formal construction of activity structures. Knowl-edge representation formalisms or languages are used to represent these knowledgemodels and concrete knowledge instances, thus enabling inference and reasoning.In this way, activity recognition and other advanced application features such asprediction and explanation can be mapped to knowledge-based inference such asdeduction, induction and abduction.
Logic-based approaches are composed of a number of distinct tasks. Eventhough each task can be undertaken in different ways the role of each task is specificand unique. Normally the first step is to carry out knowledge acquisition, whichinvolves eliciting knowledge from various knowledge sources such as domain ex-
33

2. Related Work
perts and activity manuals. The second step is to use various knowledge modellingtechniques and tools to build reusable activity structures. This will be followed by adomain formalization process in which all entities, events and temporal and spatialstates pertaining to activities, along with axioms and rules, are formally specifiedand represented using representation formalism. This process usually generatesthe domain theory. The following step will be the development of a reasoningengine in terms of knowledge representation formalisms to support inference. Inaddition, a number of supportive system components will be developed, which areresponsible for aggregating and transforming sensor data into logical terms andformula. With all functional components in place, activity recognition proceeds bypassing the logical representation of sensor data onto the reasoning engine. Theengine performs logical reasoning, e.g., deduction, abduction or induction, againstthe domain theory. The reasoning will extract a minimal set of covering models ofinterpretation from the activity models based on a set of observed actions, whichcould semantically explain the observations.
There exist a number of logical modelling methods and reasoning algorithmsin terms of logical theories and representation formalisms. One thread of work isto map activity recognition to the plan recognition problem in the well studied ar-tificial intelligence field (Carberry, 2001). The problem of plan recognition can bestated in simple terms as: given a sequence of actions performed by an actor, howto infer the goal pursued by the actor and also to organise the action sequence interms of a plan structure. Kautz et al. (Kautz, 1991) adopted first-order axiomsto build a library of hierarchical plans. They proposed a set of hypotheses such asexhaustiveness, disjointedness and minimum cardinality to extract a minimal cov-ering model of interpretation from the hierarchy, based on a set of observed actions.Wobke (Wobcke, 2002) extends Kautz’s work using situation theory to address thedifferent probabilities of inferred plans by defining a partial order relation betweenplans in terms of levels of plausibility. Bouchard et al. (Bouchard et al., 2006)borrow the idea of plan recognition and apply it to activity recognition. They useaction Description Logic (DL) to formalize actions and entities and variable statesin a smart home to create a domain theory. They model a plan as a sequence ofactions and represent it as a lattice structure, which, together with the domain the-ory, provides an interpretation model for activity recognition. As such, given asequence of action observations, activity recognition amounts to reasoning againstthe interpretation model to classify the actions through a lattice structure. It wasclaimed that the proposed DL models can organize the result of the recognitionprocess into a structured interpretation model in the form of lattice, rather than asimple disjunction of possible plans without any classification. This minimises theuncertainty related to the observed actor’s activity by bounding the plausible plansset.
Another thread of work is to adopt the Event Calculus (EC) (Shanahan, 1997)
34

2.5 Knowledge-Driven Approaches
formalism, a highly developed logical theory of actions, for activity recognitionand assistance. The EC formalizes a domain using fluents, events and predicates.Fluents are any properties of the domain that can change over time. Events arethe fundamental instrument of change. All changes to a domain are the result ofnamed events. Predicates define relations between events and fluents that specifywhat happens when and which fluents hold at what times. Predicates also de-scribe the initial situation and the effects of events. Chen et al. (Chen and Nugent,2008) proposed an EC-based framework in which sensor activations are modelledas events, and object states as properties. In addition, they developed a set of high-level logical constructors to model compound activities, i.e. the activities consist-ing of a number of sequential and/or parallel events. In the framework, an activitytrace is simply a sequence of events that happen at different time points. Activityrecognition is mapped to deductive reasoning tasks, e.g., temporal projection orexplanation, and activity assistance or hazard prevention is mapped to abductivereasoning tasks. The major strength of this work is its capability to address tempo-ral reasoning and the use of compound events to handle uncertainty and flexibilityof activity modelling.
Logic-based approaches are totally different from data-driven approaches in theway activities are modelled and the mechanisms activities are recognised. They donot require pre-existing large-scale datasets, and activity modelling and recogni-tion is semantically clear and elegant in computational reasoning. It is easy toincorporate domain knowledge and heuristics for activity models and data fusion.The weakness of logical approaches is their inability or inherent infeasibility torepresent fuzziness and uncertainty even though there are recent works trying tointegrate fuzzy logics into the logical approaches. Another drawback is that logicalactivity models are viewed as one-size-fits-all, inflexible for adaptation to differentusers’ activity habits.
2.5.3 Ontology-based approachesUsing ontologies for activity recognition is a recent endeavour and has gainedgrowing interest. In the vision-based activity recognition community, researchershave realised that symbolic activity definitions based on manual specification of aset of rules suffer from limitations in their applicability, because the definitions areonly deployable to the scenarios for which they have been designed. There is a needfor a commonly agreed explicit representation of activity definitions or an ontol-ogy. Such ontological activity models are independent of algorithmic choices, thusfacilitating portability, interoperability and reuse and sharing of both underlyingtechnologies and systems. Chen et al. (Chen et al., 2004) propose activity ontolo-gies for analysing social interaction in nursing homes, Hakeem et al. (Hakeem andShah, 2004) for the classification of meeting videos, and Georis et al. (Georis et al.,
35

2. Related Work
2004) for activities in a bank monitoring setting. To consolidate these efforts andto build a common knowledge base of domain ontologies, a collaborative effort hasbeen made to define ontologies for six major domains of video surveillance. Thishas led to a video event ontology (Nevatia et al., 2004) and the corresponding repre-sentation language (Francois et al., 2005). For instance, Akdemir (Akdemir et al.,2008) used the video event ontologies for activity recognition in both bank andcar park monitoring scenarios. In principle these studies use ontologies to providecommon terms as building primitives for activity definitions. Activity recognitionis performed using individually preferred algorithms, such as rule-based systems(Hakeem and Shah, 2004) and finite-state machines (Akdemir et al., 2008).
In the dense sensing-based activity recognition community, ontologies havebeen utilised to construct reliable activity models. Such models are able to matchdifferent object names with a term in an ontology which is related to a particularactivity. For example, a Mug sensor event could be substituted by a Cup event inthe activity model MakeTea as Mug and Cup can both be used for the MakeTeaactivity. This is particularly useful to address model incompleteness and multiplerepresentations of terms. Tapia et al. (Tapia et al., 2006) generated a large objectontology based on functional similarity between objects from WordNet, which cancomplete mined activity models from the Web with similar objects. Yamada et al.(Yamada et al., 2007) use ontologies to represent objects in an activity space. Byexploiting semantic relationships between things, the reported approach can au-tomatically detect possible activities even given a variety of object characteristicsincluding multiple representation and variability. Similar to vision-based activityrecognition, these studies mainly use ontologies to provide activity descriptors foractivity definitions. Activity recognition can then be performed based on proba-bilistic and/or statistical reasoning (Tapia et al., 2006), (Yamada et al., 2007).
Ontology-based modelling and representation has been applied to general am-bient assisted living. Latfi et al. (Latfi et al., 2007) propose an ontological architec-ture of a telehealth-based smart home aiming at high-level intelligent applicationsfor elderly persons suffering from loss of cognitive autonomy. Klein et al. (Kleinet al., 2007) developed an ontology-centred design approach to create a reliable andscalable ambient middleware. Chen et al. (Chen et al., 2009) pioneered the notionof semantic smart homes in an attempt to leverage the full potential of semantictechnologies in the entire lifecycle of assistive living i.e. from data modelling, con-tent generation, activity representation, processing techniques and technologies toassist with the provision and deployment. While these endeavours, together withexisting work in both vision- and dense sensing-based activity recognition, providesolid technical underpinnings for ontological data, object, sensor modelling andrepresentation, there is a gap between semantic descriptions of events/objects re-lated to activities and semantic reasoning for activity recognition. Most works useontologies either as mapping mechanisms for multiple terms of an object (Tapia
36

2.5 Knowledge-Driven Approaches
et al., 2006) or the categorization of terms (Yamada et al., 2007) or a commonconceptual template for data integration, interoperability and reuse (Latfi et al.,2007), (Klein et al., 2007), (Chen et al., 2009). Activity ontologies which providean explicit conceptualization of activities and their interrelationships have only re-cently emerged and have been used for activity recognition. Chen et al. (Chen andNugent, 2009), (Chen et al., 2012b) proposed and developed an ontology-based ap-proach to activity recognition. They constructed context and activity ontologies forexplicit domain modelling. Sensor activations over a period of time are mapped toindividual contextual information and then fused to build a context at any specifictime point. They made use of subsumption reasoning to classify the constructedcontext based on the activity ontologies, thus inferring the ongoing activity. Ye etal. (Ye et al., 2011) developed an upper activity ontology that facilitates the cap-ture of domain knowledge to link the meaning implicit in elementary informationto higher-level information that is of interest to applications. Riboni et al. (Riboniand Bettini, 2011b) investigated the use of activity ontologies, in particular, thenew feature of rule representation and rule-based reasoning from OWL2, to model,represent and reason complex activities.
Compared with data-driven and mining-based approaches, ontology-based ap-proaches offer several compelling features: firstly, ontological ADL models cancapture and encode rich domain knowledge and heuristics in a machine understand-able and processable way. This enables knowledge based intelligent processing ata higher degree of automation. Secondly, DL- based descriptive reasoning along atime line can support incremental progressive activity recognition and assistance asan ADL unfolds. The two levels of abstraction in activity modelling, concepts andinstances, also allow coarse-grained and fine-grained activity assistance. Thirdly,as the ADL profile of an inhabitant is essentially a set of instances of ADL con-cepts, it provides an easy and flexible way to capture a user’s activity preferencesand styles, thus facilitating personalised ADL assistance. Finally, the unified mod-elling, representation and reasoning for ADL modelling, recognition and assistancemakes it natural and straightforward to support the integration and interoperabilitybetween contextual information and ADL recognition. This will support system-atic coordinated system development by making use of seamless integration andsynergy of a wide range of data and technologies.
Compared with logic-based approaches, ontology-based approaches have thesame mechanisms for activity modelling and recognition. However, ontology-based approaches are supported by a solid technological infrastructure that hasbeen developed in the semantic Web and ontology-based knowledge engineeringcommunities. Technologies, tools and APIs are available to help carry out eachtask in the ontology-based approach, e.g., ontology editors for context and activitymodelling, web ontology languages for activity representation, semantic repositorytechnologies for large-scale semantic data management and various reasoners for
37

2. Related Work
activity inference. This gives ontology-based approaches huge advantage in large-scale adoption, application development and system prototyping.
2.5.4 Summary of knowledge-driven approachesThe advantages and drawbacks of knowledge-driven approaches are summarisedin the following listing. A summary and comparison with data-driven approachescan be found in Table 2.1.
Advantages• No “cold start” problem: knowledge-driven approaches model activities us-
ing generic knowledge rather than data, so activity models are built beforedeployment and the system does not need any training/learning process be-fore beginning to work.
• Interoperability and reusability: specially true for ontology-based ap-proaches, but also for all the other approaches, as activity models are mod-elled using knowledge engineering techniques and built models are genericand not specific to a concrete user.
• Clear semantics: activity models are semantically clear and can be under-stood by human beings. This allows interpreting how the system works anddeveloping easier auxiliary systems that work on top of the activity recogni-tion system, such as notification systems, recommender systems and so on.
Disadvantages• Weak in handling uncertainty: inference and reasoning are usually based
on certain facts, rather than uncertain sensor information. There are someapproaches that work using fuzzy logics and/or probabilistic reasoning, butthey are not fully integrated with modelling techniques yet (Helaoui et al.,2013), (Almeida and Lopez-de-Ipina, 2012).
• Weak in handling temporal information: inference and reasoning mecha-nisms used for activity recognition do not usually consider temporal aspectsof activities. In order to tackle this limitation, there are already some ap-proaches that, for example, integrate ontological and temporal knowledgemodelling formalisms for activity modelling (Okeyo and Chen, 2012).
• Static activity models: knowledge-based activity models are static, sinceonce they are defined, they cannot automatically evolve. This means that
38

2.6 Hybrid Approaches
if a user changes its way of performing activities, initially defined activitymodels will still be used for activity recognition.
2.6 Hybrid ApproachesAnalysing carefully the advantages and disadvantages of knowledge- and data-driven approaches, it can be seen that they are complementary at some extent. Forinstance, while knowledge-driven approaches are weak in handling uncertainty andtemporal information, data-driven ones are good at it. On the other hand, whiledata-driven approaches cannot build reusable generic activity models, knowledge-driven approaches can. This complementarity has recently raised the need to re-search on hybrid approaches to activity modelling. The main idea of hybrid ap-proaches is to fuse data- and knowledge-driven approaches in order to solve theproblems of both approaches in a single system.
Tran et al. (Tran and Davis, 2008) and Healaoui et al. (Helaoui et al., 2011)use Markov Logic Networks (MLN) to model temporal relations between actionsand activities. The first one uses MLNs to naturally integrate common sense rea-soning with uncertain analyses produced by computer vision algorithms for objectdetection, tracking and movement recognition. The second work is focused on pro-viding activity models for interleaved and concurrent executions using qualitativeand quantitative temporal relationships. With a similar objective, Steinhauer et al.(Steinhauer and Chua, 2010) combine HMMs with Allen logic, providing anotherhybrid approach example. All those approaches encode and use temporal knowl-edge and rely on automatically extracting these temporal patterns from datasets.
Another hybrid approach example is provided by Riboni et al. (Riboni andBettini, 2011a). Their approach combines statistical inference techniques with on-tological activity modelling and recognition. Statistical inferencing is performedbased on raw data retrieved from body-worn sensors (e.g., accelerometers) to pre-dict the most probable activities. Then, symbolic reasoning is applied to refine theresults of statistical inferencing by selecting the set of possible activities performedby a user based on his/her current context. By decoupling the use of context in-formation, statistical inferencing becomes more manageable in terms of necessarytraining data, while symbolic reasoning can more effectively select candidate ac-tivities taking into account context-dependent ontological relationships.
Finally, Chen et al. (Chen et al., 2014) present an ontology-based hybrid ap-proach to activity modelling. They combine knowledge-based activities with spe-cially developed learning algorithms to overcome the “cold start” problem, modelreusability and incompleteness. The approach uses semantic technologies as a con-ceptual backbone and technology enablers for ADL modelling, classification andlearning. The distinguishable feature of the approach from existing approaches is
39
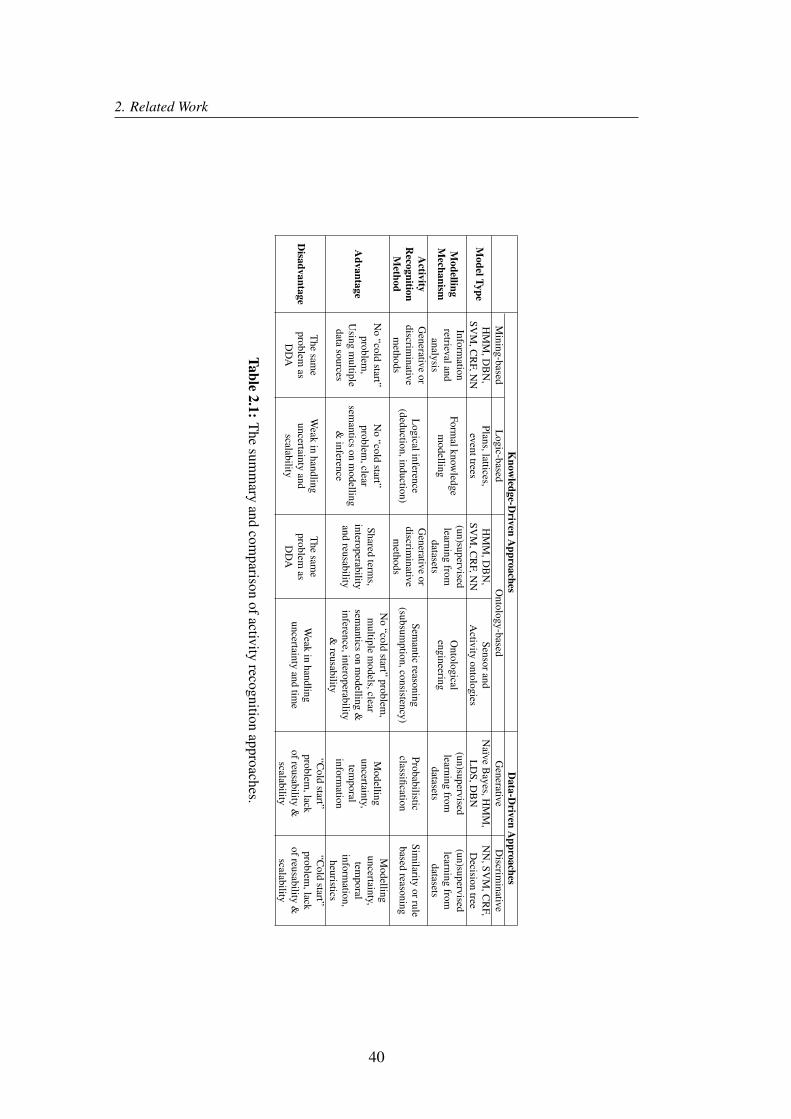
2. Related Work
Know
ledge-Driven
Approaches
Data-D
rivenA
pproachesM
ining-basedL
ogic-basedO
ntology-basedG
enerativeD
iscriminative
ModelType
HM
M,D
BN
,SV
M,C
RF,N
NPlans,lattices,
eventtreesH
MM
,DB
N,
SVM
,CR
F,NN
SensorandA
ctivityontologies
Naıve
Bayes,H
MM
,L
DS,D
BN
NN
,SVM
,CR
F,D
ecisiontree
Modelling
Mechanism
Information
retrievalandanalysis
Formalknow
ledgem
odelling
(un)supervisedlearning
fromdatasets
Ontological
engineering
(un)supervisedlearning
fromdatasets
(un)supervisedlearning
fromdatasets
Activity
RecognitionM
ethod
Generative
ordiscrim
inativem
ethods
Logicalinference
(deduction,induction)
Generative
ordiscrim
inativem
ethods
Semantic
reasoning(subsum
ption,consistency)Probabilisticclassification
Similarity
orrulebased
reasoning
Advantage
No
“coldstart”
problem,
Using
multiple
datasources
No
“coldstart”
problem,clear
semantics
onm
odelling&
inference
Sharedterm
s,interoperabilityand
reusability
No
“coldstart”
problem,
multiple
models,clear
semantics
onm
odelling&
inference,interoperability&
reusability
Modelling
uncertainty,tem
poralinform
ation
Modelling
uncertainty,tem
poralinform
ation,heuristics
Disadvantage
The
same
problemas
DD
A
Weak
inhandling
uncertaintyand
scalability
The
same
problemas
DD
A
Weak
inhandling
uncertaintyand
time
“Cold
start”problem
,lackofreusability
&scalability
“Cold
start”problem
,lackofreusability
&scalability
Table2.1:
The
summ
aryand
comparison
ofactivityrecognition
approaches.
40
2.7 Summary and Conclusions
that ADL modelling is not a one-off effort, instead, a multi-phase iterative pro-cess that interleaves knowledge-based model specifications and data-driven modellearning. The process consists of three key phases. In the first phase the initialseed ADL models are created through ontological engineering by leveraging do-main knowledge and heuristics, thus solving the “cold start” problem. Ontologicalactivity modelling creates activity models at two levels of abstractions, namely asontological activity concepts and their instances respectively. Ontological activityconcepts represent generic coarse-grained activity models applicable and reusablefor all users, thus solving the reusability problem. The seed ADL models are thenused in applications for activity recognition at the second phase. In the third phase,the activity classification results from the second phase are analysed to discovernew activities and user profiles. These learnt activity patterns are in turn used toupdate the ADL models, thus solving the incompleteness problem. Once the firstphase completes, the remaining two-phase process can be iterated many times toincrementally evolve the ADL models, leading to complete, accurate and up-to-date ADL models. In consequence, this approach is a first step to solve the staticnature of activity models in knowledge-driven systems. However, the approach hasa limitation: it considers that seed activity models contain all the actions performedby any user to perform an activity and hence, it is limited to learn only descriptiveproperties. This means that if different users perform the same activity by means ofdifferent sets of actions, the system will not be able to learn those distinct actions.
2.7 Summary and ConclusionsA deep review of human activity recognition has been provided in this chapter.In terms of activity monitoring technologies, the work presented in this disserta-tion can be classified into the dense sensing-based category. In principle, there areno limitations to extend the methods and techniques exposed in this dissertationto other activity monitoring approaches such as wearable sensor- or vision-basedcategories. But dense sensing paradigm has been chosen because it is the best ap-proach for Intelligent Environments - since there are no privacy issues with usersand specific objects can be monitored - and the usage of simple sensors makes sen-sor processing steps simpler. As research on sensor processing is beyond the scopeof this work, dense sensing-based activity monitoring provides a perfect scenario.Notice that the selection of the dense sensing-based activity monitoring scenario ismore an implementation decision rather than a theoretical limitation.
In terms of activity modelling, the work presented in this dissertation clearlyfalls into the hybrid approach. It combines knowledge- and data-driven techniquesin order to provide dynamic activity models that combine generic and personalisedmodels. As such, it tries to solve the problem of the hybrid activity modelling
41

2. Related Work
approach presented by Chen et al. (Chen et al., 2014), i.e. learning new actions forany user. Solving other problems of knowledge-driven approaches, such as sensoruncertainty or temporal information handling, is out of scope of this dissertation.The concrete position of this dissertation in the two axis taxonomy adopted foractivity recognition can be seen in Table 2.2.
Activity Monitoring ApproachVision-based Sensor-based
Wearable-based Dense sensing-basedActivity
ModellingApproach
Data-DrivenKnowledge-Driven
Hybrid X
Table 2.2: The classification of this dissertation in terms of activity modelling andactivity monitoring approaches marked with an X.
Finally, this chapter has been mainly focused on single user - single activityscenarios, although some examples of single user - concurrent activities scenarioswere also described. This is because the human activity recognition research com-munity has mainly focused its efforts in the single user - single activity scenario,despite recently, single user - concurrent activities scenario has gained more popu-larity. It is worth to highlight that the work presented in this dissertation has beendesigned to tackle the single user - single activity scenario.
42

Simplicity is the shortest path to asolution.
Ward Cunningham
CHAPTER
3The Approach to Learn
Specialised and CompleteActivity Models
THIS chapter describes the theoretical foundations of the dissertation anddescribes the high-level solution designed to learn activity models fromuser’s behavioural data and previous knowledge. The contributions ofthis dissertation are based on the ontology-based activity modelling ap-
proach, where an important limitation has been found: providing complete andgeneric activity models is generally impossible. To solve this problem, a learningsolution is suggested, whose underpinning modules and their relationships are de-scribed in detail. The integration of the developments presented in Chapters 4 and5 is structured around the designed solution in this chapter.
The chapter is divided in four sections: Section 3.1 describes the ontology-based activity modelling approach on which the contributions of this dissertationare built. Section 3.2 provides formal definitions of the concepts and terms that willbe used during the following chapters and shows the constraints of the approach tolearn activity models. Section 3.3 discusses the adopted solution design, describingthe defined architecture, constituent modules and their relationships. And finallySection 3.4 concludes the chapter with a summary and extracted conclusions.
43

3. The Approach to Learn Specialised and Complete Activity Models
3.1 Ontology-Based Activity ModellingOntology-based activity modelling has already been introduced in Chapter 2, con-cretely in Section 2.5.3. Some of the most relevant research work was presentedthere. However, the objective of this section is to provide a deep description of oneof the presented approaches, which is the basis of the contributions presented inthis dissertation.
The activity modelling approach introduced in (Chen et al., 2012b) is central tothe real-time activity recognition system for smart homes described in the paper.This approach has been designed for the dense sensing-based activity monitoringscenario and deployed in a smart home research laboratory, obtaining an averageactivity recognition rate of 94.44%. The reported results suggest that the systemperforms robustly for the selected scenarios.
Even though the activity recognition process is very interesting, the focus ofthis section will be on the ontology-based activity modelling approach which isintroduced in (Chen et al., 2012b). Roughly speaking, two high-level concepts aremodelled in the paper to support activity recognition: (i) Activities of Daily Living(ADL) and (ii) the context in which those ADLs are performed (in the case of thepaper, a smart home). To specify conceptual structures and relationships, DL basedmarkup language, i.e. Web Ontology Language (OWL) and Resource DescriptionFramework (RDF)1 are used. Both languages support inference and reasoning, afeature which plays a key role for activity recognition.
3.1.1 Ontological ADL modellingActivities of Daily Living, or ADLs, refer to a set of activities that are performedby any person in a daily basis. Some examples for ADLs are making tea, makingpasta or washing dishes. When ADLs are carefully analysed, two features can beidentified: (i) ADLs can be defined at different levels of granularity, and (ii) ADLsare generic, but each person performs them in different ways. Both features can beproperly addressed by the ontological ADL modelling approach.
The first feature, activity granularity, refers to the fact that ADLs form super-class and sub-class relations. For example, making a hot chocolate can be consid-ered a sub-activity of making a hot drink, which can also be classified as a sub-activity of making a drink. As such, ADLs form a tree where leafs model primitiveADLs and other nodes refer to composite ADLs (see Figure 3.1).
To address different levels of activity granularity, ontological modelling, i.e.the process to explicitly specify key concepts and their properties for a problemdomain, is applied. More concretely, ADLs are modelled as ontological concepts
1http://www.w3.org/
44

3.1 Ontology-Based Activity Modelling
Make drink
Make hot drink Make cold drink
Make chocolate Make coffee Make tea Make juice
Figure 3.1: An example of ADL granularity represented as a tree.
which are organised in a hierarchical structure in terms of their shared propertiesto form super-class and sub-class relations. Those relations between primitive andcomposite ADLs are characterised by “is-a” and “part-of” relationships, properlysupported by OWL. For example, as shown in Figure 3.1 making tea is a subclassof making hot drink. The ADL for making tea is represented by the ontologicalconcept of MakeTea, while making hot drink is represented by MakeHotDrink.Properties establish the interrelations between concepts. For instance, hasDrink-Type is a property of the MakeHotDrink activity that links the DrinkType concept(e.g., tea, coffee, chocolate) to the MakeHotDrink concept. Both, concepts andproperties, are modelled using the commonly shared terms in the problem commu-nity. The resulting ontologies are essentially knowledge models able to encode andrepresent domain knowledge and heuristics.
The second feature of ADLs highlights the difference between generic and per-sonalised ADLs. Even though making coffee implies the use of coffee and a con-tainer, some users prefer African coffee to Colombian coffee and some users usecups and others mugs. Furthermore, the order of the sequence of objects used tomake coffee, vary from user to user, e.g. some users might add sugar before coffeeand others add sugar once coffee has been poured to the container. In consequence,generic and personalised ADLs can be distinguished.
1. Generic activity models: defined at the conceptual level as an activity classdescribed by a number of properties. These properties describe the types ofobjects and their usage to perform an activity. Generic activity models areapplicable to all users.
2. Personalised activity models: they capture the specific way of a user to per-form an activity and are modelled as instances of a corresponding conceptualactivity model, which consists of specific information related to the concreteobjects used and the sequential order they are used in.
45

3. The Approach to Learn Specialised and Complete Activity Models
Activities are defined as ontological concepts and all actions that are requiredto perform the activity as the properties of the concept. For example, making teainvolves taking a cup from the cupboard, putting a teabag into the cup, adding hotwater to the cup, then milk and/or sugar. The ontological model of making tea,i.e. MakeTea concept, can be defined by action properties hasContainer, hasTe-abag, hasHotwater, hasMilk and hasFlavour in conjunction with descriptive prop-erties such as activity start time actStartTime and duration actDuration. Notice thattwo kinds of properties are defined: action properties, which refer to action-basedproperties and descriptive properties, which are used to characterise the manner inwhich an activity is performed. This distinction is very important, because actionproperties play a crucial role for activity recognition. Indeed, activities are inferredfrom action properties which are generated by the sensor activations occurring dueto human-object interactions. On the other hand, descriptive properties are not de-terminant in activity recognition. For instance, making coffee can happen at anytime, it can be performed in different sequences and it may take variable amountsof time. As such, descriptive properties are used to model user’s activity profiles,which are not used for the activity recognition process.
Hence, action properties define generic ADL models, which are used for activ-ity recognition and are applicable to any user. Descriptive properties capture thedifferent ways of performing generic ADLs, in terms of the objects used, the orderin which those objects have been used, activity start time and duration. Person-alised ADL models are instances of the corresponding generic ADL model.
In summary, ontological ADL modelling properly addresses different levels ofactivity granularity and the difference between generic and personalised ADLs,using the tools provided by markup languages such as OWL and RDF.
3.1.2 Ontological context modellingThe ADL modelling scheme described above establishes a clear dependency be-tween the context and an ADL. Indeed, ADLs are described as a set of contextevents, where context refers to temporal, spatial, event and environmental aspects.Exemplary temporal aspects of an ADL may be the start time and the duration ofthe activity, which are captured by descriptive properties. Spatial aspects relate tolocation information and surrounding entities such as rooms, household furnitureand appliances. Event contexts capture dynamic state changes of the objects of theenvironment, for example, state changes of doors, fridge door or a microwave oven.Those events are modelled by action properties. Finally, environmental aspects ofthe context are composed of environmental information such as temperature, hu-midity and general weather conditions.
In the dense sensing paradigm, contextual information is captured through var-ious sensors. Each sensor monitors and reflects one facet of a situation. Based on
46

3.1 Ontology-Based Activity Modelling
this observation the context modelling is centred on ontological sensor modelling.Sensors are inherently linked to a number of physical and conceptual entities suchas objects, locations and states. For example, a contact sensor is attached to a teapotin the second cupboard to the left of the sink in the kitchen. By explicitly capturingand encoding such domain knowledge in a sensor model it is possible to infer thecorresponding objects and location from the activation of the sensor. This impliesthat a user performs an activity in the inferred location with the inferred object.
As most ADLs require the interlinking and fusion of data from multiple, dis-parate sensor sources in order to infer the high-level activities, it is necessary toaggregate a sequence of sensor activations to generate a situation at a specific timepoint. The situation formation process can be described as follows. Each sensorhas a default state value for its state property, denoting the state of the object towhich it is attached. When a sensor is activated, the state property will change.Subsequently the system will translate the state change as an occurrence of a user-object interaction at the specific time. As it is difficult, if not impossible, to moni-tor what happens at detailed levels after an object is interacted with, it is commonpractice to interpret a sensor activation as a user-object interaction, ignoring howthe object is used and when it is de-activated. As such a user-object interaction isequivalent to an instantaneous sensor activation and can be interpreted as an ob-ject being used for performing an activity. In this way, by aggregating individualuser-object interactions along a timeline the situation at specific time points can begenerated.
Under this context modelling approach, sensor activations are assumed to beproduced by user-object interactions, which may denote an action property or adescriptive property, depending on the nature of the object and sensor. For exam-ple, a thermometer state change will be captured by a descriptive property such ashasTemperature(value), whereas a contact sensor installed in a cup will generatethe action property hasContainer(cup).
3.1.3 Final remarks about ontology-based activity modellingA common framework to model ADLs and contextual information is provided bythe ontology-based activity modelling approach described in (Chen et al., 2012b).Ontology-based activity modelling provides semantically clear, structured andreusable models. Furthermore, it offers a unified framework to combine genericmodels that can be applied to any user with personal models. By means of on-tological modelling some traditional problems of data-driven approaches can beavoided, such as the manual class labelling, pre-processing and training processes.In addition, ontologies allow software agents to interpret data and reason againstontological contexts, thus enhancing the capabilities of automated data interpreta-tion and inference.
47

3. The Approach to Learn Specialised and Complete Activity Models
However, the main problem of this modelling approach is related to model in-completeness. Obtaining complete models from domain knowledge for every per-son is not generally possible. An ADL model is composed by action and descriptiveproperties, so model incompleteness refers to the impossibility of completely defin-ing all the action and descriptive properties of an ADL. In the case of descriptiveproperties, model incompleteness is obvious, since those properties refer to person-alised ways of performing activities. Chen et al. propose in (Chen et al., 2014) ahybrid activity modelling approach to learn descriptive properties from user gen-erated data. But they assume that ADL models in terms of action properties arecomplete. This assumption does not generally hold, because even though there arecertain actions that every user performs for a given activity, there might be someother actions that cannot be known in the modelling step.
Hence, this dissertation tackles the problem of learning unmodelled actionproperties for activity models. By means of learning new actions through incre-mental data-driven learning techniques, the static and generic nature of knowledge-based activity models is also tackled. The contributions of this dissertation allowdynamic activity models which evolve in time and support both, generic and per-sonalised models.
3.2 Definitions and ConstraintsFor the rest of the dissertation the following terms and concepts will be used ac-cording to the definitions provided in this section:
Definition 1 (Sensor activation (SA)). A sensor activation occurs when a sensorchanges its state from the no-interaction state to interaction state. Reverse tran-sitions, i.e. de-activations of sensors, are not considered. For example, when auser takes a glass, the activation is tagged as glassSens. A sensor activation is thencomposed by a timestamp and a sensor identifier:
SA = {timestamp, sensorID} (3.1)
Definition 2 (Sensor activation dataset). A time-ordered sequence of sensor acti-vations.
Definition 3 (Actions). Actions are the primitives of activities and are directlylinked to sensor activations. For example, the activation of sensors cupSens andglassSens are linked to the action hasContainer. A sensor activation can only bemapped to one single action, but an action can be generated by different sensoractivations. Actions do not have any duration and are hence described by a times-tamp.
48

3.2 Definitions and Constraints
Definition 4 (Type). When referring to activities and objects, type captures a pur-pose based classification. In this dissertation, the types considered are Cooking,Hygiene, Entertainment and Housework. An activity can only have one type, whileobjects can have more than one. For example, an object like a tap can be used forcooking, housework or hygiene. But a MakeCoffee activity can only be a cookingactivity. On the other hand, when referring to sensors, type classifies sensors interms of their technological base. In this dissertation, the modelled sensor typesare contact, electric, pressure and tilt sensors.
Definition 5 (Location). Location refers to semantic places of the monitored envi-ronment, where sensor activations occur and hence, activities are performed. Forexample, in a house, possible locations might be bedroom, bathroom or kitchen.
Definition 6 (Initial Activity Model (IAM)). Activity models are sequences of ac-tions defined by a domain expert. Initial activity models refer to the minimumnumber of necessary actions to perform an activity. The objective of such modelsis to represent incomplete but generic activity models applicable to any user. Initialactivity models also have an estimation of the maximum duration of the activity.
IAM(Activityn) = {actiona, actionb, . . . ,max duration} (3.2)
Definition 7 (Extended Activity Model (EAM)). A complete and specialised ver-sion of an IAM. By complete we mean that an activity model contains all the actionsperformed by a user for the corresponding activity. By specialised we mean thereare two or more different complete action sequences for the corresponding activ-ity, i.e. specialised sub-classes of that activity exist. The EAM for an activity isrepresented as a list of action sequences with their occurrence frequency:
EAM(Activityn) = {as1, as2, . . . , asn} where
asi = {frequency, actiona, actionb, . . . , actionm}(3.3)
Definition 8 (User Erratic Behaviour). It happens when a user interacts with anobject but the interacted object is not being used to perform the ongoing activity.Consider the case where a user wants to prepare pasta. In order to take the pastafrom the store, the sugar package has to be removed first. The user will touch thesugar package and thus, a sensor activation will be generated. But this interactiondoes not mean that sugar is being used to prepare pasta.
Definition 9 (Positive Sensor Noise). A sensor that should not get activated, i.e.there is no interaction with the object monitored by the sensor, gets activated be-cause of sensor or monitoring infrastructure errors.
Definition 10 (Missing Sensor Noise). A sensor that should get activated, i.e. thereis an interaction with the object monitored by the sensor, does not get activatedbecause of sensor or monitoring infrastructure errors.
49

3. The Approach to Learn Specialised and Complete Activity Models
The learning approach for activity models presented in this dissertation hassome constraints:
Constraint 1 (Dense sensing-based activity monitoring). Even though there is notheoretical constraint that prevents the approach to be implemented for other ac-tivity monitoring approaches, the implementation presented in this dissertation isdesigned for the dense sensing-based activity monitoring approach.
Constraint 2 (Single user - single activity scenario). This is a hard constraint, inthe sense that the theoretical foundations of the learning approach assume explic-itly that only one user is being monitored and this user is not allowed to performconcurrent or interleaving activities.
Constraint 3 (Uniquely located activities). It is assumed that an activity can onlybe performed in a single location, during a concrete execution, i.e. although Read-Book can be performed in the bedroom and in the lounge, a concrete execution willtake place in the bedroom or in the lounge (exclusive or).
Constraint 4 (“Static” objects). Objects used by a user are assumed to be “static”respect to the location, i.e. if the location of a toothbrush is the bathroom, theobject will always stay in the bathroom.
3.3 Solution DesignBased on the definitions and constraints shown in Section 3.2, an offline systemfor extended activity model learning is presented. The objective of the system isto learn extended activity models (EAM, Definition 7) for every defined activityand a particular user, since every user has his/her own way to perform activities interms of executed actions. The initial activity models (IAM, Definition 6) for everyactivity provided by a domain expert will be the same for every user, because theyare generic models. But the extended activity models are personal models. Theycapture different complete activity models performed by a user. Notice that EAMlearning has several implications in the ontology-based activity model approach:
1. Complete models are learnt for every activity and a particular user. Completerefers to the sequence of executed actions for a concrete activity.
2. If two or more different complete models are learnt for a concrete activ-ity, specialised models of the same activity are found. This means that thedefined activity is not a leaf in the ADL ontological tree and hence, sub-activities of that activity are discovered.
3. Activity models can be dynamic. If the EAM learning system is continuouslyupdated with new data, activity models can be updated. In consequence,activity models evolve and are adapted to users’ varying behaviours.
50

3.3 Solution Design
3.3.1 Inputs of the learning systemThe learning system for EAMs works on user generated data. It combines domainknowledge and user generated data in a learning algorithm. Notice that user datacomes in an unlabelled sensor activation dataset, so there is no need to manuallylabel any dataset. On the other hand, domain knowledge concerning the environ-ment and activities is provided to the learning system. More concretely, the inputsof the EAM learning system are:
1. Context knowledge: the context knowledge represents the prior knowledgeprovided by a domain expert which is relevant to learn activity models. Theconcepts modelled in the context knowledge include:
(a) Activities: every activity is defined by its name, type, location and IAM.Following Definition 4, an activity has only one type. However, anactivity can be performed in several locations (notice that this does notcontradict Constraint 3).
(b) Objects: objects refer to every object in the environment which is mon-itored by sensors and is used to perform activities. An object is definedby its name, type, location and attached sensors. As Definition 4 states,an object can have several types. But an object is subjected to Con-straint 4, so it has a unique location. In principle, objects can be mon-itored by several sensors. For instance, a fridge may have a tilt sensorattached to its door to monitor open/close door actions and an electricsensor to monitor the power usage.
(c) Sensors: following Constraint 1, sensors are attached to objects andthey are defined by a sensor identifier, type, described action and objectto which is attached. Sensors produce sensor activations (Definition 1)when they transition from their no-interaction state to interaction state.Sensors have a unique type and they are mapped to one single action,as stated in Definition 3. The object to which the sensor is attached isalso stored in the context knowledge.
2. Sensor activation dataset: as defined in Definition 2, an unlabelled times-tamped sensor activation dataset with the activity traces of a concrete user.
In the current implementation, context knowledge is formatted in a JavaScriptObject Notation (JSON)1 file. JSON has been selected because it provides a light-weight knowledge formatting syntax which is widely supported and used to share
1http://json.org/
51

3. The Approach to Learn Specialised and Complete Activity Models
information. Although OWL or RDF could be used to implement context knowl-edge, the overhead introduced by such markup languages comes without any ad-vantage for the EAM learning system. The decision of using JSON responds tothe principle of providing a simple solution, focusing on modelling only relevantknowledge. As an example, Figure 3.2 shows how an activity, an object and a sen-sor are modelled in the context knowledge file. This knowledge is provided by adomain expert and modelled by knowledge engineers.
” MakeCoffee ” : {” t y p e ” : [ ” Cooking ” ] ,” l o c a t i o n ” : [ ” K i t c h e n ” ] ,”IAM” : [ ” h a s C o n t a i n e r ” , ” h a s C o f f e e ” ] ,” d u r a t i o n ” : 300
}−−−−−−−−−−−−−−−−−−−−−−−−−−−−−−−−−−−−−−−−−−−−−−−−−−−” k i t c h e n−t a p ” : {
” t y p e ” : [ ” Cooking ” , ” HouseWork ” ]” l o c a t i o n ” : ” K i t c h e n ”” s e n s o r s ” : [ ” k t a p S e n s ” ]
}−−−−−−−−−−−−−−−−−−−−−−−−−−−−−−−−−−−−−−−−−−−−−−−−−−−” k t a p S e n s ” : {
” t y p e ” : ” t i l t ” ,” a c t i o n ” : ” turnOnTap ” ,” a t t a c h e d−t o ” : ” k i t c h e n−t a p ”
}
Figure 3.2: Example of activities, objects and sensors modelled in the context knowl-edge file. Activity duration is given in seconds.
The second input to the EAM learning system is the sensor activation dataset.For the implementation presented in this dissertation, sensor activation datasets areformatted in Comma Separated Value files (CSV)1. Each row of the file containsa timestamp (year, month, day and time) and a sensor activation tagged with thesensor identifier which has produced the activation (see Figure 3.3).
Based on those inputs, a context knowledge file and a sensor activation dataset,the output of the EAM learning system is a list of action sequences for each activity,which describe the EAMs for each activity (see Equation 3.3).
1http://en.wikipedia.org/wiki/Comma-separated values
52

3.3 Solution Design
2014−05−23 0 9 : 4 7 : 3 3 . 9 8 4 3 4 1 , s t o r e S e n s2014−05−23 0 9 : 4 7 : 3 9 . 3 3 3 5 2 8 , p o t S e n s2014−05−23 0 9 : 4 7 : 5 2 . 7 5 0 2 1 6 , c o o k e r S e n s2014−05−23 0 9 : 4 8 : 0 7 . 7 6 4 1 3 8 , f r i d g e S e n s2014−05−23 0 9 : 4 8 : 1 2 . 5 9 1 8 3 6 , wmilkSens2014−05−23 0 9 : 4 8 : 4 7 . 1 9 9 5 1 2 , chocoSens2014−05−23 0 9 : 5 4 : 1 1 . 5 5 3 6 9 5 , mugSens2014−05−23 0 9 : 5 4 : 4 0 . 7 9 4 9 7 9 , r c o n t r o l S e n s2014−05−23 0 9 : 5 4 : 5 0 . 3 9 0 6 9 6 , t v S e n s2014−05−23 0 9 : 5 4 : 5 9 . 3 4 8 8 6 2 , s o f a S e n s
Figure 3.3: A slice of a sensor activation dataset.
3.3.2 Intuition behind the solutionThe rationale for the designed solution to EAM learning comes when sensor ac-tivations are plotted in a three-dimensional space spanned by location, type andtime, as shown in Figure 3.4. This three-dimensional space, named activity space,reflects the prior knowledge about activities. An activity has a concrete type thatis shared with the object types used to perform that activity and is performed in alocation and a time segment.
When sensor activations describing several activities are plotted in the activityspace, several lumps or clusters can be distinguished. Intuition says that sensoractivations, and hence actions, have to be close to each other when they form anactivity (close in the activity space), i.e. if a user is making pasta, it is commonsense to think that sensor activations describing that activity will be located in thekitchen, and the objects which are being used by the user will be for cooking pur-poses. As far as time regards, sensor activations will occupy a time segment whichwill denote the duration of the activity.
This grouping of actions in the activity space can be seen in Figure 3.4. Six ac-tivities can be identified there, namely MakeChocolate, BrushTeeth, WashHands,MakePasta, MakeCoffee and WatchTelevision. Due to time resolution in thegraphic, actions composing BrushTeeth, WashHands and WatchTelevision cannotbe properly distinguished. Those three activities are quite short in time, but de-picted actions for each of them are respectively five, three and three. There aresome actions that are not grouped in any activity. Those actions are generated byobjects that have multiple types. For example, in the case of MakePasta, the kitchentap is used. The kitchen tap can be used for cooking or for housework and that iswhy it appears in both positions.
It is interesting to see how Figure 3.4 supports the intuition about action distri-bution in the activity space. In general, actions can be easily grouped in activities,
53

3. The Approach to Learn Specialised and Complete Activity Models
Figure 3.4: A plot of the actions executed by a user for performing several activitiesin the three-dimensional space spanned by location, type and time.
but there are also some tough cases. This is the case of actions composing activitiesBrushTeeth and WashHands, which are very close in time and are performed in thesame location and with the same purpose. The last action of MakePasta seems alsodifficult to group, since it is closer in time to activity MakeCoffee, sharing againthe same location and type.
In consequence, the idea is to design a clustering algorithm which takes advan-tage of location, type and time information to aggregate actions to clusters. Theclustering process needs heuristics and metrics that take special care of those ac-tions that are difficult to group in the corresponding activity. But this is not enough.Action clusters have to be identified and labelled with one of the defined activities.To identify action clusters with activity names, initial activity models in the con-text knowledge can be used. Initial activity models contain an incomplete sequenceof actions. Despite being incomplete sequences, they can be used to identify ac-tivities. So the clustering algorithm has to produce several labelled action/sensoractivation sequences per activity.
The clusters extracted in the clustering process may contain all the actions exe-cuted by a user to perform a concrete activity. Those clusters may be used to learndifferent ways of performing an activity and hence, to learn extended activity mod-els. In summary, the key idea is to design a clustering algorithm that uses initialactivity models to detect activities and some metrics in the activity space to aggre-gate actions to activities. Afterwards, using the clusters extracted and labelled, they
54

3.3 Solution Design
are analysed to learn extended activity models for each activity.
3.3.3 Description of the solutionFollowing the rationale described in section 3.3.2, a solution for the EAM learningsystem has been designed. The devised system architecture is depicted in Figure3.5. At a first glance, the two important blocks identified in section 3.3.2 can bedistinguished in the architecture: a clustering process and an activity model learn-ing process. The clustering process is implemented in two modules, namely theSemantic Activity Annotation module (SA3) and the Action Aggregator module(AA). On the other hand, the activity learning process is implemented by a modulecalled Activity Model Learner (AML).
ActionAggregator
Semantic ActivityAnnotation
SyntheticData Generator
Sensor activationdataset
ContextKnowledge
ADL script
Partially Annotateddataset
Activity clusters
Activity ModelLearner
Learnt Action Sequencesfor Activities
Clustering process
Real smartenvironment
Fully Annotateddataset
Figure 3.5: The detailed design architecture of the proposed approach to learn EAMs.
Two kinds of elements can be distinguished in the architecture depicted in Fig-ure 3.5: files and software modules. The only exception to this rule is the real smartenvironment, which represents a sensorised environment where a user performsseveral activities. All the other elements can be classified into files or softwaremodules. There are three kinds of files: plain text files (ADL script), JSON files(context knowledge, activity clusters and learnt action sequences for activities) andCSV files (sensor activation dataset, partially annotated dataset and fully anno-tated dataset). Files are used to exchange information between software modules.The developed software modules are four: Synthetic Data Generator, Semantic Ac-tivity Annotation, Action Aggregator and Activity Model Learner. All the softwaremodules of the diagram have been implemented using Python 2.71 and its packagesNumpy2 for numerical computing and Pandas3 for data analysis.
1https://www.python.org/2http://www.numpy.org/3http://pandas.pydata.org/
55

3. The Approach to Learn Specialised and Complete Activity Models
Once the elements of the architecture have been described, the solution itselfwill be detailed. Firstly, a sensor activation dataset has to be collected for a concreteuser. A real smart environment or a synthetic data generator can be used to get thisdataset. The sensor activation dataset contains all sensor activations registered fora user performing certain activities during a fixed period of time. Remember thatsensor activations are unlabelled. Whatever method has been chosen to obtain it,the resulting sensor activation dataset is formatted in a CSV file and its informationhas already been described in Definition 2.
Afterwards, a novel clustering process is run on the sensor activation dataset,using the context knowledge provided by an expert and formatted in a JSON file.The proposed clustering process, which is extensively discussed in Chapter 4, isdivided into two steps:
1. Semantic Activity Annotation algorithm (SA3): this algorithm uses IAMsstored in the context knowledge to detect activities in the unlabelled dataset.It transforms sensor activations to actions according to the given contextknowledge to apply a novel pattern recognition algorithm that has been de-signed and implemented to detect the occurrence of IAMs in the unlabelledsensor activation dataset. SA3 also uses object and activity location infor-mation to infer from sensor activations where an activity is being performedand analyse consequently the feasibility of the detected pattern. SA3 is aninitialisation process from the clustering point of view, because it finds initialclusters in the time axis and identifies the label of those clusters. The outputof SA3 is given in the so called partially annotated dataset, where sensoractivations and their resultant actions are labelled with activity names or thespecial label None, which indicates that the action could not be labelled withany known activity name. Notice that SA3 only labels those actions that per-tain to IAMs thus leaving the vast majority of actions without any label. Thisis the reason why the output of the algorithm is called partially annotated. Adetailed description of SA3 is given in Section 4.1.
2. Action Aggregator algorithm (AA): the input to the algorithm is the outputof SA3, i.e. the partially annotated dataset file. AA uses activity, object andaction knowledge described in the context knowledge to expand initial actionclusters detected by SA3. To analyse those actions that remain unlabelledafter SA3, AA defines boolean functions based on location, type and timeinformation of actions and objects. It analyses unlabelled actions that areclose to initial clusters, checking the feasibility of those actions pertainingto those close initial clusters. The feasibility is computed using location,type and time information, implementing the idea that actions pertaining toan activity are performed in the same location, with a coherent purpose and
56

3.4 Summary and Conclusions
close in time. The AA algorithm’s result is stored in another CSV file calledfully annotated dataset, which assigns an activity label to all actions and theiroriginal sensor activations. The special label None is used for those actionsthat are not considered part of any activity. Those actions can be originatedby sensor noise or user erratic behaviour, i.e. a user that interacts with anobject that is not being used for performing an activity. Additionally, AAalso generates a JSON file called activity clusters. This file contains all theclusters found by the algorithm for each activity. Clusters, which are actionsequences, come with an occurrence frequency. The activity clusters file isalso used to store some interesting statistics found byAA about the frequencyof objects used and actions executed for each activity, frequency of locationswhere each activity has been performed and activity duration statistics (meanand standard deviation). An example of an activity clusters file can be seenin Figure 3.6. The AA algorithm is described in Section 4.2.
The main result of the clustering process is thus stored in the activity clustersJSON file. This file has the information of all action sequences executed by a userto perform a concrete activity. For example, in the file shown in Figure 3.6, in the“patterns” section, all the action sequences found by AA are stored. In this case,for activity ReadBook, only one cluster has been generated with 53 occurrences inthe sensor activation dataset. According to AA, ReadBook has been performed bymeans of executing the action sequence useFurniture, turnOnLamp and hasBook.Nevertheless, AA generally finds many different clusters per activity. Those clus-ters are finally processed by Activity Model Learner (AML), which filters incor-rect action sequences and outliers to learn final EAMs as a list of action sequences.AML uses action sequence similarity metrics to implement an outlier detection al-gorithm. Notice that all action sequences or clusters detected by AA are not validactivity models, since they may contain incorrectly labelled actions (due to cluster-ing errors, sensor errors and/or user erratic behaviour) and missed actions (due tosensor errors). Those spurious action sequences have to be detected and removed,to discover those action sequences that are valid models for a given activity. Validaction sequences are the EAMs for activities and are stored in a JSON file calledlearnt action sequences for activities. All the details about AML are provided inChapter 5.
3.4 Summary and ConclusionsA global solution has been designed to learn extended activity models from initialgeneric but incomplete activity models. The base of the solution is the ontology-based activity modelling, which provides a unified and reusable framework to
57

3. The Approach to Learn Specialised and Complete Activity Models
” ReadBook ” : {” l o c a t i o n s ” : [
[ 4 2 , ” Bedroom ” ] ,[ 1 1 , ” Lounge ” ]
] ,” a c t i o n s ” : [
[ 5 3 , ” u s e F u r n i t u r e ” ] ,[ 5 3 , ” turnOnLamp ” ] ,[ 5 3 , ” hasBook ” ]
] ,” p a t t e r n s ” : [
[53 ,[
” u s e F u r n i t u r e ” ,” turnOnLamp ” ,” hasBook ”
]]
] ,” o b j e c t s ” : [
[ 4 2 , ” bed ” ] ,[ 4 2 , ” bedroom−lamp ” ] ,[ 4 2 , ” book−b ” ] ,[ 1 1 , ” s o f a ” ] ,[ 1 1 , ” lounge−lamp ” ] ,[ 1 1 , ” book−a ” ]
] ,” o c c u r r e n c e s ” : 53 ,” d u r a t i o n ” : [
14 .773584905660377 ,2 .6467602797835856
]} ,
Figure 3.6: Information stored in the activity clusters file for activity ReadBook.
58

3.4 Summary and Conclusions
model ADLs. The presented solution for learning aims at completing and spe-cialising initial activity models provided by a domain expert.
For that purpose, this chapter introduces some important definitions and con-straints, setting the scenario in which the learning system works. Afterwards, therationale behind the solution design has been described. It has been shown thatwhen actions pertaining to activities are plotted in the so called activity space -spanned by time, type and location - activities are arranged in clusters. The ideais to be able to identify those clusters and aggregate surrounding actions defin-ing appropriate metrics and heuristics. Once those clusters have been identified, alearning algorithm will be deployed to learn extended activity models from identi-fied clusters.
In conclusion, this chapter has established the ground in which the contributionsof the dissertation stand. The addressed problem has been described and a solutionfor that problem has been proposed. The following chapters will show how thissolution is deployed.
59


If you keep doing what you’ve al-ways done, you’ll keep getting whatyou’ve always gotten.
Neil Strauss
CHAPTER
4A Clustering Process for
Activity Annotation
A novel clustering process for activity annotation in an unlabelled datasetis described in this chapter. Using previous knowledge obtained from adomain expert, the clustering process identifies activities performed bya user in an unlabelled sensor activation dataset. The clustering process
is claimed to be novel because it combines unsupervised learning techniques withdomain knowledge. In contrast with a typical clustering algorithm, which findsa structure in a given dataset, the proposed algorithm can also link the extractedstructures with a semantic activity name. This is possible because initial activitymodels are used, i.e. generic but incomplete activity models provided by a domainexpert.
The clustering algorithm is divided into two steps, as introduced in Chapter 3:(i) a special pattern recognition algorithm that finds initial activity models’ occur-rences in the sensor activation dataset (SA3), and (ii) a data aggregation step whereobject, sensor and action knowledge is used to define location, type and time basedmetrics which are used to aggregate actions to activities (AA). Following this di-vision, the chapter is divided in three sections: Section 4.1 describes the SemanticActivity Annotation algorithm (SA3), which is presented as the initialisation stepof the clustering process. Section 4.2 presents the second step of the clusteringprocess, where actions are aggregated to corresponding initial action clusters pro-vided by SA3 which describe an activity performance. Section 4.3 summarises thischapter and draws the extracted conclusions.
61

4. A Clustering Process for Activity Annotation
4.1 SA3: Semantic Activity Annotation AlgorithmThe objective of the SA3 algorithm is to find sequences of actions that are describ-ing an activity in an unlabelled sensor activation dataset. For that purpose, initialactivity models (IAM) stored in the context knowledge are used. Remember thatIAMs, as defined in Definition 6, are characterised by a sequence of necessaryactions to perform an activity plus a duration estimation.
The problem can be stated more formally as:
Problem (SA3). Given a context knowledge file where activities, sensors and ob-jects are described and an unlabelled sensor activation dataset, find the occur-rences of IAMs that form valid executions of activities.
Considering that IAMs are sequences of actions and that sensor activationdatasets are sensor sequences, the SA3 problem can be seen as a pattern recognitionproblem, where IAMs act as the patterns to be recognised in the sensor activationdataset. Although SA3 is actually a pattern recognition algorithm, there are someimportant features that make the problem special:
1. IAMs are sequences of actions, whereas sensor activation datasets containsensor activations, i.e. the activation of a concrete sensor of the environment.
2. As IAMs are incomplete activity models, a user will generally execute moreactions than those considered in the IAMs to perform activities. As a con-sequence a sensor activation dataset will generally include sensor activationsand actions that are interleaved with IAM actions for the same activity.
3. IAMs have no information about the order in which actions are executed, thusif IAM(A) = {a, b, c}, a sensor activation dataset containing the sequence{c, a, b} has to be identified as activity A, i.e. the elements of the pattern tobe recognised might appear in varied orders.
4. Even though a sequence corresponding to an IAM is found, it does not neces-sarily describe a valid activity, since duration and location are important. Forexample, for an activity whose typical duration is 5 minutes, the correspond-ing actions are found but their distance is of 3 hours; it is then common senseto think that those actions do not form a valid activity. Hence, the patternrecognition algorithm needs to take action time distances and locations intoaccount.
5. Sensors are prone to errors and in consequence, sensor activation datasetscontain noise. The pattern recognition algorithm has to work thus in noisyenvironments. More concretely, the considered kinds of sensor noise arepositive and missing sensor noise (Definitions 9 and 10).
62

4.1 SA3: Semantic Activity Annotation Algorithm
In summary, SA3 has to use IAMs as patterns to be recognised in an unla-belled sensor activation dataset, where actions are executed in varied orders, whereactions that are not in IAMs can appear interleaved, where duration and locationinformation is crucial for the validity of a pattern and where sensor noise exists.
In order to tackle the described problem a three-step algorithm has been de-signed and implemented (see Figure 4.1). The first step, named sensor-action trans-formation step, uses sensor information from the context knowledge to transformsensor activations into actions (Section 4.1.1). The second step, the activity se-quence finding step, runs a pattern recognition algorithm using IAMs and objectinformation from context knowledge, as described in Section 4.1.2. This step ad-dresses the varied order of actions, interleaved actions not pertaining to IAMs,duration and location information for valid activities and sensor noise. Finally,the third step called correct activity sequence fitting fixes the overlapping activitiesgenerated in the second step (Section 4.1.3).
Activity SequenceFinding
Sensor-actiontransformation
Sensor activationdataset
ContextKnowledge
Partially Annotateddataset
Correct ActivitySequence Fitting
Sensorinfo
IAM and objectinfo
Figure 4.1: The three-step algorithm for SA3.
The result of SA3 is the partially annotated dataset. SA3 can only label thoseactions pertaining to IAMs and thus it cannot infer a label for all the other actions ofthe sensor activation dataset. An example of how a partially annotated dataset lookslike is provided in Table 4.1. The first column shows the timestamp of the sensoractivation. The second column shows the activated sensor. Those two columnsform the sensor activation dataset. SA3 adds the third, fourth and fifth columns,where action, activity label and start/end tags are provided. Start tag refers to thefirst action pertaining to the IAM of a valid activity discovered by SA3. End taghas the same meaning but for the last action. In consequence, start and end tagsshow the start and end times for a detected activity. For convenience, and eventhough any action not pertaining to the IAM of the detected activity cannot belabelled by SA3, all the actions between start and end times are labelled with thedetected activity name, and not with the special label None. This labelling criterionis applied to make visualization easier and it does not have any effect on the outputof SA3, neither for AA nor for evaluation purposes.
The next sections describe in detail the three steps of SA3 depicted in Figure
63

4. A Clustering Process for Activity Annotation
Timestamp Sensor Action Activity Start/End2014-05-23 07:42:17.106962 wsugarSens hasFlavour None2014-05-23 07:49:17.310460 bedSens useFurniture None2014-05-23 09:43:44.128079 cupSens hasContainer MakeChocolate start2014-05-23 09:47:33.984341 storeSens openStore MakeChocolate2014-05-23 09:47:39.333528 potSens useCookingUtensil MakeChocolate2014-05-23 09:47:52.750216 cookerSens useCookingAppliance MakeChocolate2014-05-23 09:48:07.764138 fridgeSens openFridge MakeChocolate2014-05-23 09:48:12.591836 wmilkSens hasMilk MakeChocolate2014-05-23 09:48:47.199512 chocoSens hasChocolate MakeChocolate end2014-05-23 09:54:11.553695 mugSens hasContainer None
Table 4.1: Example of a partially annotated dataset, the output of the SA3 algorithmshown in table format.
4.1. Finally, Section 4.1.4 shows the complete algorithm and illustrates it with anexample.
4.1.1 The sensor-action transformation stepThe first step takes as inputs the sensor activation dataset and the context knowledgefile to transform every sensor activation into an action. For each sensor activationin the dataset, the corresponding sensor model is checked in the context knowl-edge file. As shown in Figure 3.2 every sensor has the action to which it has to bemapped in the context knowledge file provided by the domain expert. This simpletransformation is possible due to the dense sensing-based activity monitoring ap-proach, where sensor activations are directly linked to user-object interactions andthus to actions.
In consequence, a sensor activation sequence such as:
{cupSens, wsugarSens, smilkSens}
will be transformed to:
{hasContainer(cup), hasF lavour(white-sugar), hasMilk(skimmed-milk)}
For the sake of clarity, and given that action matching does not care aboutconcrete objects used to execute that action, hasContainer(cup) will be used ashasContainer. But notice that the object information obtained through the sensoractivation is not removed.
Sensor-action transformation step allows performing pattern recognition in theaction space, abstracting from concrete sensor activations. This step can be keptsimple thanks to the dense sensing-based approach. For different activity monitor-ing approaches, such as wearable sensors, more complex sensor-action transforma-tion steps should be implemented. However, notice that as far as sensor information
64

4.1 SA3: Semantic Activity Annotation Algorithm
can be transformed to actions, SA3 and the entire clustering process can work with-out any problem. This is why Constraint 1 is considered to be a weak constraint.
4.1.2 The activity sequence finding stepThe objective of this step is to find all valid occurrences of IAMs in the actionspace obtained from the sensor-action transformation step. An iterative process isrun over actions. Firstly, the algorithm checks whether the current action pertainsto any of the IAMs stored in the context knowledge file. If the answer is no, theaction is labelled with the None label and the next action is treated. But if theanswer is yes, the IAMs of the activities in which the action appears are consideredas possible activities. Notice that if the action pertains to more than one IAM,all the possibilities are treated. Assume the action a pertains to IAM(A1) andIAM(A2). Two action sequences are created S(A1) = {a} and S(A2) = {a}. Thealgorithm iterates through the next actions, in order to find sequences of actionsthat form valid activities in correspondence of possible activities.
The process to find valid activities works as follows:
1. Current action b is added to the created action sequences: S(Ai) =append(S(Ai), b).
2. If current action b pertains to an IAM of an activity for which no sequencehas been open, open a new sequence.
3. Check whether candidate sequences form a valid activity in terms of comple-tion, duration and location
4. If any of the candidate sequences forms a valid activity, close the sequenceand follow with remaining sequences.
5. Iterate through actions until all sequences are closed (valid activities) or re-moved (invalid activities).
To fully understand the described process to check for valid activities, the com-pletion, duration and location criteria have to be explained:
1. Completion criterion: an action sequence has to contain all the actions ofthe corresponding IAM to be considered a complete action sequence for thecorresponding activity. An action sequence S(Ai) is complete for activity Ai
if and only ifIAM(Ai) ⊆ S(Ai) (4.1)
65

4. A Clustering Process for Activity Annotation
2. Duration criterion: for an action sequence to fulfil the duration criterion, theduration of the action sequence has to be smaller than the duration estima-tion of the corresponding IAM. The duration of an action sequence S(Ai) iscalculated as the rest of the timestamps of the last action and the first action:
∆t(S(Ai)) = t(S(Ai)last)− t(S(Ai)first) (4.2)
where t(S(Ai)j) is the timestamp of the j-th action of the sequence S(Ai).Duration estimations for activities are stored in the context knowledge fileand are written as ∆t(Ai). Hence, the duration criterion establishes that anaction sequence fulfils the duration criterion if and only if
∆t(S(Ai)) ≤ ∆t(Ai) (4.3)
3. Location compatibility criterion: the actions of sequence S(Ai) which per-tain to IAM(Ai) have been transformed from corresponding sensor activa-tions. Those sensor activations can be traced in the context knowledge to theused objects. And those objects have a location in their model. Hence, thelocation of actions can be inferred using the context knowledge file. Usingthis information, the location of the possible activity described by sequenceS(Ai) is inferred. The location of sequence S(Ai) is inferred as the com-mon locations of actions of the sequence pertaining to IAM(Ai). If actionspertaining to the IAM do not share a common location, the sequence has nolocation and thus, it is not compatible with any activity in terms of location.On the other hand, if a common location is shared, that location has to becompatible with the locations of the corresponding activity, modelled in thecontext knowledge file. Notice that only locations of actions pertaining toan IAM are considered. All the other actions can be generated by noise orerratic behaviour and in consequence, their locations are not considered inSA3. This can be seen better with an example: let S = {a, b, c, d} be asequence of actions, where a and d pertain to the IAM of activity A. Forlocation inference, only actions that pertain to the IAM of the detected ac-tivity are considered, since all the other actions of the sequence S cannot beconsidered as part of the activity yet. For instance, some of those actionsmight be produced by positive noise. Hence, the sequence S is an activity Awith location L if a and d have been executed in the same location and thatlocation is compatible with A activity’s locations. Formally expressed:
S = {a, b, c, d}, A : candidate activity and IAM(A) = {a, d}S is explained by A→ loc(obj(a)) = loc(obj(d)) ∈ Locations(A)
(4.4)
66

4.1 SA3: Semantic Activity Annotation Algorithm
where obj(a) returns the object which has been mapped to action a, loc(o)returns the location of object o in the environment and Locations(A) returnsthe list of possible locations of activityA according to the context knowledgefile.
Action sequences that fulfil the completion, duration and location criteria willbe considered as valid activities and stored as such. Action sequences that do notfulfil those criteria will be removed, since they do not form a valid activity descrip-tion.
4.1.3 The correct activity sequence fitting stepDepending on the activity models, the sensor activation dataset and noise levels,valid activities can overlap each other. Moreover, as many IAMs will share someactions, activity overlapping will be a normal situation after the activity sequencefinding step described in Section 4.1.2. But by virtue of Constraint 2 (only singleuser - single activity scenarios are considered), interleaving thus overlapping ac-tivities cannot appear in the sensor activation dataset. So a special step has to bedesigned to treat overlapping activities generated in the activity sequence findingstep.
Having a set of overlapping activities, described through the corresponding ac-tion sequences, this step introduces a heuristic directly derived from Constraint 2to return a set of non-overlapping activities which provides the best explanationfor the generated situation. The heuristic states that in a set of overlapping actionsequences, the maximum number of non-overlapping action sequences have to bereturned.
The reason to adopt this heuristic is that the vast majority of sensor activationsare originated by deliberated user-object interactions. In consequence, the vastmajority of sensor activations must be part of an activity. In order to maximisethe number of sensor activations which correspond to the execution of an activity,the heuristic chooses the maximum number of non-overlapping activities in a givensequence. Because this is the way to maximise the number of sensor activations inactivities.
4.1.4 The complete SA3 algorithmSections 4.1.1, 4.1.2 and 4.1.3 describe the first, second and third steps of the SA3
algorithm. This three-step algorithm is depicted as pseudo-code in Algorithm 1. Ithas been designed to work with noisy sensor activations, varying order for activityexecutions and sensor activations that do not belong to any initial activity model.That flexibility allows applying the tool to many different datasets.
67

4. A Clustering Process for Activity Annotation
Algorithm 1 SA3 algorithm for semantic activity annotationRequire: sensor activation dataset, context knowledgeEnsure: partially annotated datasetpartially annotated dataset← createDataset(sensor activation dataset)action dataset ← applyTransformFunction(sensor activation dataset,context knowledge)IAM list← obtainIAMS(context knowledge)for all action ∈ action dataset do
if action ∈ initial activity models thenactivities← obtainActivities(action, IAM list)
end iffor all activity ∈ activities do// Use duration, completion and location criteriavalid activities← findV alidActivities(context knowledge)
end forend forpartially annotated dataset← findNonOverlappingActivities(valid activities)
return partially annotated dataset
An illustrative example is shown next, to describe how SA3 works. Timestampsare ignored in the example, assuming that the duration criterion is fulfilled by theshown action sequence and considered activities. This assumption helps makingthe example clearer. The illustrative example has been designed to show in detailhow SA3 works, so it does not have to be coherent with the reality.
Imagine initial activity models for MakeCoffee, MakeTiramisu, Make-WhippedCream and BrushTeeth are defined as follow:
MakeCoffee = {hasCoffee, hasContainer, hasF lavour}MakeT iramisu = {hasCream, hasContainer, hasCoffee}
MakeWhippedCream = {hasF lavour, hasContainer, hasCream}BrushTeeth = {hasBrusher, hasToothPaste, turnOnTap}
Notice that there are many actions that are used for the IAMs of several activi-ties. For instance, hasContainer is used in the IAMs of MakeCoffee, MakeTiramisuand MakeWhippedCream. Using the same actions for various activities makes theproblem harder, since overlapping activities are more common.
Let us consider the following sensor activation sequence from the sensor acti-vation dataset:
68

4.1 SA3: Semantic Activity Annotation Algorithm
{mugSens, creamSens, spoonSens, whitesugarSens, brusherSens,afcoffeeSens, toothpasteSens, glassSens, btapSens}
Applying the sensor-action transformation step using the context knowledgeas described in Section 4.1.1, the following action sequence is obtained (concreteobjects are ignored in the action sequence):
{hasContainer, hasCream, useCookingUtensil, hasF lavour, hasBrusher,hasCoffee, hasToothpaste, hasContainer, turnOnTap}
Figure 4.2 shows all the activities found by the second step of SA3 (Section4.1.2). Activities overlap each other, because there are several actions that belongto several activities. Notice also that there are some actions that are not in anyactivity model, which is totally feasible for the approach.
h a s C o n t a i n e r | |hasCream | MWC |u s e C o o k i n g U t e n s i l | |h a s F l a v o u r | | MTh a s B r u s h e r | |h a s C o f f e e | |h a s T o o t h p a s t e | BTh a s C o n t a i n e r |turnOnTap |
Figure 4.2: Illustrative example of the output of the activity sequence finding step ofSA3. MWC refers to MakeWhippedCream, MT to MakeTiramisu and BT to Brush-Teeth.
Assuming that the duration criterion is always fulfilled for this example, Fig-ure 4.2 shows how the completion and location criteria work. For instance, actionsequence S = {hasContainer, hasCream, useCookingUtensil, hasF lavour}is a valid sequence to describe activity MakeWhippedCream, because it con-tains all the actions of IAM(MakeWhippedCream) and it is location com-patible. Actions hasContainer, hasCream and hasFlavour, which pertain toIAM(MakeWhippedCream) are obtained by interacting with objects mug,cream and white-sugar. The location of all those objects is the kitchen. As ac-tivity location for MakeWhippedCream is also the kitchen, the action sequenceand the activity are location compatible.
69

4. A Clustering Process for Activity Annotation
However, consider the following action sequence S = { hasF lavour,hasBrusher, hasCoffe, hasToothpaste, hasContainer}. Assuming durationcriterion is satisfied, it can be seen that the completion criterion is also satisfied foractivity MakeCoffee. But sequence S does not form a valid activity because thelast action hasContainer is produced by the object glass, which is located in thebathroom. As hasContainer is in IAM(MakeCoffee), its location is taken intoaccount for location inference and compatibility. In this case, sequence S does nothave a unique location and hence, it is removed.
After the activity sequence finding step finishes, three overlapping valid activi-ties are found, namely MakeWhippedCream, MakeTiramisu and BrushTeeth. Sucha situation cannot happen in a single user - single activity scenario, so the third stephas to be applied: the correct activity sequence fitting step (Section 4.1.3). Usingthe defined heuristic, two activities are returned:
MakeWhippedCream = {hasContainer, hasCream, useCookingUtensil,hasF lavour}
BrushTeeth = {hasBrusher, hasCoffee, hasToothPaste, hasContainer,turnOnTap}
Those two activities correspond to the maximum number of non-overlappingactivities found in the set of valid activities. The action sequence for Make-WhippedCream makes perfect sense. There is an action, useCookingUtensil, whichis not in any IAM, but it is very coherent with the activity. Even though SA3 labelsthis action with the MakeWhippedCream tag, remember there is no way for SA3 toknow whether this action is really part of the activity. Such a labelling is done onlyfor convenience. On the other hand, the action sequence for activity BrushTeethcontains a strange action: hasCoffee. In a noisy scenario this action may be gener-ated by sensor or communication infrastructure errors. The other action which isnot in the IAM of BrushTeeth is hasContainer. It is generated by the glass sensor,which is located in the bathroom. The action hasContainer may refer to a glassused in the bathroom to rinse the mouth.
Looking at Figure 4.2, the heuristic defined in the correct activity sequencefitting step can be visually understood. As it can be seen, returning the maximumnumber of non-overlapping activities maximises also the number of actions insideactivities.
4.2 AA: Action AggregatorInitial clusters provided by SA3 are expanded in this step, using context knowledgeand time-based metrics for action aggregation. The inputs of the AA algorithm
70

4.2 AA: Action Aggregator
are the context knowledge file (see Section 3.3 and specially Figure 3.2) and thepartially annotated dataset returned by SA3 (see Table 4.1). The output of SA3
is interpreted as the initialisation of the clustering process in the activity spacespanned by location, type and time axis. SA3 has been designed to provide thenumber of clusters in the dataset, their semantic label and their centroids in thetime axis. Having this initialisation, AA is responsible for analysing all actionsconsidering the three dimensions of the activity space and deciding which actionsare aggregated to the initial clusters provided by SA3.
Assume Figure 4.3 shows the output of SA3 for a concrete sequence of actions.For simplicity, only the time axis is shown in the figure. Dashes represent timeintervals without any action. Circles represent actions that are in one or more IAMs.Notice that two circles do not necessarily have to be the same action. The onlyproperty they have is that a circle action is in at least one of the IAMs of the contextknowledge file. Crosses, on the other hand, are actions that are not included in anyIAM. Once again, two crosses do not have to represent the same action.
Outsider action
Insider action
Figure 4.3: Output of SA3 for a concrete sequence of actions, where outsider andinsider actions are identified.
Figure 4.3 shows that SA3 detects activities A1 and A2 in that sequence ofactions. As stated in Section 4.1 only actions that are in the IAM of the detectedactivity can be really considered part of that activity, i.e. only circles that are insideactivities A1 and A2 are labelled with the corresponding activity labels.
Given that action classification, two new definitions can be assumed:
Definition 11 (Insider action). Every action that is inside the initial clusters pro-vided by SA3 but is not in their IAMs is considered an insider action or insider, inshort.
Definition 12 (Outsider action). Every action out of the initial clusters provided bySA3 is an outsider action or outsider, in short.
Due to single-user single-activity scenario constraint (Constraint 2), an insidermay pertain to its wrapping activity or to none assuming the output of SA3 iscorrect, i.e. it has been produced by noise or user erratic behaviour. There isno chance for an insider to pertain to an activity other than its wrapping activitybecause such an assumption would imply the existence of interleaved activities
71

4. A Clustering Process for Activity Annotation
(remember this is true assuming that the output of SA3 is correct, which is assumedin the AA algorithm). The situation for outsiders is different since an outsider canpertain to its previous activity, next activity or to none.
The inherent difference between insiders and outsiders demands a differenttreatment for both cases. AA first treats all insider actions and afterwards com-putes all outsiders using different approaches.
4.2.1 Insider actionsTo decide whether an insider has to be added to its wrapping activity, a compatibil-ity function between an activity and an action is defined. The compatibility functionis a boolean function that captures whether an insider action has been executed inthe same location as the activity and its purpose is coherent with the activity type:
Comp(A, a) = Loc(A, a) ∧ Type(A, a) (4.5)
where A is an activity and a is an action. Loc(A, a) is the location compatibilitybetween an activity and an action, defined as in Section 4.1.2. The location of theconcrete activity A is inferred using the same process as in SA3, i.e. the commonlocation of the actions pertaining to the IAM of the activity is set to be the locationof the activity. Loc(A, a) returns whether the inferred location for action a is thesame as the inferred location for activity A. On the other hand, Type(A, a) is thetype compatibility between an activity and an action. Action type is inferred fromthe object used to execute the action. Every object in the context knowledge hasa list of types. Activity type is unique and it is also retrieved from the contextknowledge file. So Type(A, a) is calculated as the intersection between the list oftypes of the action a and the type of the activity A. If the intersection is empty, theaction and the activity are not type compatible.
Hence an insider action a will only be aggregated to its wrapping activity A,if Comp(A, a) = True, i.e. the insider has been executed in the same location ofthe activity, and its purpose is compatible with the activity type. If Comp(A, a) =False, the insider will be labelled with the None label, which means that it is notpart of any activity.
4.2.2 Outsider actionsAs an outsider can be aggregated to its previous or next activity, first of all thealgorithm checks the feasibility of both options, defining another boolean functioncalled candidate function:
Cand(A, a) = Comp(A, a) ∧ InRange(A, a) (4.6)
72

4.2 AA: Action Aggregator
Comp(A, a) has already been defined in Equation 4.5, so the candidate func-tion also takes into account location and type. The InRange function is an-other boolean function that captures time feasibility. Thus the candidate functionstates that an activity A is a candidate activity for action a, if they are compatible(Comp(A, a) = True) and in range (InRange(A, a) = True).
As commented above, the InRange function has been defined to capture thetime feasibility. For example, if an action has been executed two hours beforean activity whose estimated duration is three minutes, the action should not beaggregated to that activity, since it is almost impossible for the action to be relatedwith the activity. This reasoning can be implemented in a boolean function usingtime distance and activity duration.
To capture time feasibility, the duration given by the expert in an IAM is inter-preted as the standard deviation for concrete executions of that activity, i.e. the vastmajority of the activities executed by any user, will lie inside the time area limitedby the duration. This can be seen in Figure 4.4. So time distances among actionspertaining to a concrete activity are modelled by a Gaussian distribution, where theduration estimation given by the expert for that activity is the standard deviation. AGaussian distribution has been selected since it captures perfectly the idea of activ-ity duration as a time estimation where the majority of executions of that activityoccur. The probability for actions of an activity to lie in the area limited by theduration estimation is very high and gets lower as it gets further from that duration.
Nevertheless, due to human behaviour variations, there will be some executionswhose duration is outside the standard deviation. To capture those executions, theInRange function considers all the actions lying inside k standard deviations. Forthe experiments run in this dissertation k = 2 has been set, but the value can beadjusted depending on the area which is desired to cover. For a concrete activityexecution, the mean of the activity is calculated as the centre of the detected startand end of the activity, as given by SA3. Using this mean calculation, the durationestimation given in the context knowledge is the standard deviation of the Guas-sian distribution for action time distances. Hence, in the case depicted in Figure4.4, where Gaussian distributions are calculated as described, the outsider actionrepresented with a star is in range with activities A1 and A2 for k = 2.
In consequence, using the candidate function, the following cases can be facedfor an outsider action a and surrounding activities A1 and A2:
1. Cand(A1, a) = Cand(A2, a) = False→ a is noise (None label)
2. Cand(A1, a) = True ∧ Cand(A2, a) = False→ aggregate a to A1
3. Cand(A1, a) = False ∧ Cand(A2, a) = True→ aggregate a to A2
4. Cand(A1, a) = Cand(A2, a) = True→ need of a new heuristic
73

4. A Clustering Process for Activity Annotation
Figure 4.4: Gaussian distributions of activity durations for activities A1 and A2. Ver-tical lines show the standard deviation and the star represents an outsider action.
74

4.2 AA: Action Aggregator
The first three cases provide a clear classification for an outsider. The candidatefunction determines unambiguously the label for action a. But for the fourth case,where previous and next activities are both candidate activities, a new heuristic hasto be defined. There is no more information in the context knowledge than thelocation and type information to relate outsider actions to activities, thus contextknowledge cannot be used to decide between activities A1 and A2. Hence a newheuristic is defined stating that an outsider action a will be aggregated to the timeclosest activity:
min{∆t(A1, a),∆t(A2, a)} (4.7)
To implement this heuristic, a definition for ∆t(A, a), the time distance betweenan activity and an action, is needed. As an activity has a duration and an action isdescribed by a time instant, three time metrics are proposed:
1. Simple time distance: the distance between the centre of the activity as givenby SA3 and the action time coordinate.
∆t(A, a) = |CA − ta|, where CA =tSA
3
end − tSA3
start
2(4.8)
2. Normalised time distance: simple time distance normalised by the durationof the activity as given by the expert. This time metric, as opposed to thesimple time distance, treats equally all activities regardless of their duration.Notice that the duration given by the expert is used rather than the durationdetected by SA3, since SA3 may give varying durations depending on theorder of executed actions that pertain to the IAM of the detected activity.Hence, the duration given by SA3 cannot be a good reference. But noticealso that to calculate the centre of the activity, the output of SA3 is used. Inthis case, this information is the only one that allows calculating the centre.So the duration given by the expert is projected symmetrically around thecentre calculated from SA3:
∆t(A, a) =|CA − ta|DurationA
, where CA =tSA
3
end − tSA3
start
2(4.9)
3. Dynamic centre normalised time distance: only used for the previous activ-ity, it dynamically calculates the centre of the activity depending on alreadyaggregated actions.
∆t(A, a) =|CA − ta|DurationA
, where CA =tAAstart +DurationA
2(4.10)
75

4. A Clustering Process for Activity Annotation
Let us explain the third time distance in detail. Activity start and end timesprovided by SA3 are not generally trustful, since they depend on what actions are inthe IAM of the detected activity and on the order of executions of those actions bythe user. Imagine that IAM(A) = {a, b} and that the action sequence processed bySA3 is S = {d, b, a, c}. Assume that sequence S is the action sequence performedby the user for activity A. SA3 will detect that activity A is being performed insequence S, but it will only label actions b and a as pertaining to the activity. SA3
does not have any information to know whether actions d and c pertain to activityA. So the start time of activityA for SA3 will be the timestamp associated to actionb and not to action d. The same happens for the activity end time.
Nevertheless, while executing the AA algorithm, starting times of activities canbe estimated better, but with some limitations. In the previous example, as outsidersin AA are treated in time order for convenience, when treating outsider c, all theactions preceding action c have already been treated (in this case, action d, sinceactions b and a are in the IAM of activity A). AA has already determined thataction d pertains to activity A. This means that the start of activity A, which is theprevious activity for action c, has been fixed and it is different from the start timeprovided by SA3 (tAA
start 6= tSA3
start).In contrast with time metrics 1 and 2, where activity start and end were given
by SA3 and activity duration was assumed to be located symmetrically around thecentre of the activity, the third time metric uses the start time of the previous activityas found by AA. Afterwards, the centre of the activity is calculated projecting theduration from the starting point. This makes the previous activity treatment moreaccurate. However, notice that the same approach cannot be applied to the nextactivity, since it has not been treated yet. The estimation given by SA3 cannot beimproved, because surrounding activities have not been treated when action c isbeing analysed. Hence, the best guess is to keep using start and end times providedby SA3.
4.2.3 The complete AA algorithmTo sum up, the AA algorithm takes the results of SA3 as the initialisation step.First, it treats insiders for all the activities detected by SA3, using the compatibilityfunction (Equation 4.5). Afterwards, it treats outsiders in time order, using thecandidate function (Equation 4.6) and defined three time metrics (Equations 4.8,4.9 and 4.10). The complete algorithm is depicted as pseudo-code in Algorithm 2.
The algorithm returns two files: (i) a fully labelled sensor activation dataset,which is formatted in a CSV file in the current implementation, and (ii) a list ofclusters, which has been implemented through a JSON file. Additionally, that filecontains: (i) the frequency of each action cluster, (ii) duration statistics (mean and
76

4.2 AA: Action Aggregator
Algorithm 2 AA algorithm for action aggregationRequire: partially annotated dataset, context knowledgeEnsure: fully annotated dataset, activity clusters filefully annotated dataset← createDataset(partially annotated dataset)insiders← obtainInsiders(partially annotated dataset)outsiders← obtainOutsiders(partially annotated dataset)for all action ∈ insiders doactivity ← obtainWrappingActivity(action, partially annotated dataset)
if Comp(activity, action, context knowledge) thenlabel(a, activity, fully annotated dataset)
elselabel(a,None, fully annotated dataset)
end ifend forfor all action ∈ outsiders doprevious activity ← obtainPreviousActivity(action, partially annotated dataset)
next activity ← obtainNextActivity(action, partially annotated dataset)
Prev ← Cand(action, previous activity, context knowledge)Next← Cand(action, next activity, context knowledge)if ¬Prev ∧ ¬Next thenlabel(a,None, fully annotated dataset)
else if Prev ∧ ¬Next thenlabel(a, previous activity, fully annotated dataset)
else if ¬Prev ∧Next thenlabel(a, next activity, fully annotated dataset)
else if Prev ∧Next then//Use time metricsprev dist← timeDist(action, previous activity, time metric)next dist← timeDist(action, next activity, time metric)if prev dist ≤ next dist thenlabel(a, previous activity, fully annotated dataset)
elselabel(a, next activity, fully annotated dataset)
end ifend if
end foractivity clusters← createClusters(fully annotated dataset)return fully annotated dataset, activity clusters
77

4. A Clustering Process for Activity Annotation
standard deviation), (iii) frequencies of used objects and actions and (iv) frequen-cies of locations per activity.
An example of the fully annotated dataset can be seen in Table 4.2. AA takes thepartially annotated dataset generated by SA3 (columns Activity* and Start/End*)and adds two new columns: the label assigned by AA (Activity) and the start andend tags for activities (Start/End). Table 4.2 is taken from a real experiment andshows very well the difference between SA3 andAA. The action sequence depictedshows a particular execution of the MakePasta activity, where due to sensor errors, arcontrolSens activation occurred. It can be seen how SA3 detects that a MakePastaactivity is being performed in the action sequence. But activity start and end timesdiffer substantially from the real ones. However, AA detects perfectly activity startand end times, using the outsider action treatment process. And for the insideraction hasRemoteControl, AA assigns a None label, since the action is not typecompatible with the activity. So in this case, AA completes its work perfectly,assigning the appropriate labels to every action and enhancing the results obtainedby SA3.
Timestamp Sensor Action Activity* Start/End* Activity Start/End2014-05-23 13:34:09 storeSens openStore None MakePasta start2014-05-23 13:34:15 potSens useCookingUtensil MakePasta start MakePasta2014-05-23 13:34:35 ktapSens turnOnTap MakePasta MakePasta2014-05-23 13:35:01 cookerSens useCookingAppliance MakePasta MakePasta2014-05-23 13:35:59 rcontrolSens hasRemoteControl MakePasta None2014-05-23 13:36:15 macaroniSens hasPasta MakePasta end MakePasta2014-05-23 13:45:15 drainerSens useCookingUtensil None MakePasta2014-05-23 13:45:54 fridgeSens openFridge None MakePasta2014-05-23 13:46:00 baconSens hasBacon None MakePasta2014-05-23 13:46:05 creamSens hasCream None MakePasta end
Table 4.2: Example of a fully annotated dataset, the output of theAA algorithm shownin table format. To visualise better, timestamps have been shortened. The asteriskrefers to the result given by SA3.
An example of the activity clusters file has already been shown in Figure 3.6.As it can be seen in that figure, several concepts per activity are stored in the file:
1. Locations: a list of different locations where the activity has been performedwith occurrence frequencies. Locations are obtained using activity locationinference.
2. Actions: a list of actions executed by the user to perform the activity withassociated occurrence frequencies.
3. Patterns: patterns refers to different action sequences performed by the userfor the activity, i.e. the action clusters detected by the clustering process.Every detected cluster has its occurrence frequency.
78

4.3 Summary and Conclusions
4. Objects: a list of objects used by the user while performing the activity. Onceagain, every object has its occurrence frequency.
5. Occurrences: the total number of instances of the activity captured by theclustering process, which has to be equal to the sum of all the occurrences ofpatterns.
6. Duration: the mean duration of the detected instances of the activity and thestandard deviation, both in seconds.
This information will be used by the Activity Model Learner (AML) algorithmto learn EAMs from the clusters extracted by the clustering process. Additionally,the information stored in the activity clusters file may be very useful to domainexperts, since they may be able to analyse how activities are carried out by differentusers in terms of the executed actions, used objects, different sequences of actionsand duration. The potential applications of such information, specially consideringthat it can be updated periodically to monitor the evolution of the user, is out of thescope of this dissertation, but it can open the doors to detect cognitive impairmentand its evolution, inappropriate behaviour or user bad habits.
4.3 Summary and ConclusionsA two-step clustering process has been developed and implemented in this chap-ter, in order to detect and identify activities in a sensor activation dataset using thecontext knowledge provided by a domain expert. The first step of the clusteringprocess has been devoted to find the occurrences of IAMs in an unlabelled sensoractivation dataset. For that purpose, a novel pattern recognition algorithm has beendeveloped, which uses IAMs as patterns, but also takes into account duration, lo-cation and completeness criteria. The algorithm is called SA3 and it can work inscenarios where actions can appear in varied orders and both positive and missingsensor noise exist.
The initial clusters detected by SA3 are then expanded in the second step of theclustering process. The AA algorithm distinguishes between insider and outsideractions. For the former group of actions, a compatibility function has been definedto decide whether an insider belongs to its wrapping activity, whereas for the lattergroup, previous and next activities are analysed in terms of compatibility and timefeasibility. For those actions which can be aggregated to the previous and the nextactivities, three time metrics have been defined. Using those metrics, the actionsare aggregated to the time closest activity.
The results of the clustering process are finally stored in two files: the fullyannotated dataset, where every sensor activation has an activity label, and the ac-tivity clusters file, where different clusters for each activity are depicted alongside
79

4. A Clustering Process for Activity Annotation
other information. Even though the clustering process has to be understood insidethe global solution designed to learn extended activity models, it can also be usedfor further objectives. For instance, it can be used to annotate sensor activationdatasets. Notice that manual methods are usually used for annotating datasets thatare used for activity recognition applications. However, manual annotation has a lotof problems, namely it is prone to errors and it is very time consuming, as shown byRashidi and Cook in (Rashidi and Cook, 2011). Hence, the developed activity clus-tering process for unlabelled sensor activation datasets can be used as an activityannotator method, as far as the required previous knowledge can be provided.
80

The beautiful thing about learningis that nobody can take it away fromyou.
B.B. King
CHAPTER
5Activity Model Learner
THE objective of this chapter is to describe and analyse the proposed learn-ing algorithm for specialised and complete activity models which iscalled Activity Model Learner (AML). AML uses the results obtainedby the activity clustering process described in Chapter 4, where different
action sequences for every activity are identified in the form of clusters. The aimof AML is to learn extended activity models from the information given by theclustering process.
The learning algorithm presented in this chapter is a statistical algorithm. It usesthe similarity between action sequences describing the same activity to identifyspurious action sequences, based on statistical outlier detection techniques. Asreal world scenarios contain sensor errors and as the clustering process may notalways label correctly the actions, some of the clusters provided to AML will notbe valid. More concretely, some of the clusters will be spurious variations of theactual activity models for a given activity. AML detects those spurious actionsequences and fuses them with the most similar action sequence which has beenconsidered valid. The result of such a process is a set of specialised and completeactivity models for every activity defined in the context knowledge.
The chapter is divided in four sections: Section 5.1 states clearly and conciselythe objectives of the learning algorithm and the criteria followed to design it. Sec-tion 5.2 discusses the relevance of all the information provided by the clusteringprocess to learn extended activity models, in order to identify what informationcan be used and why. Section 5.3 describes in detail the Activity Model Learneralgorithm. Section 5.4 provides a summary of the chapter and presents the mostrelevant conclusions.
81

5. Activity Model Learner
5.1 ObjectivesThe main objective of the Activity Model Learner is to learn extended activitymodels (EAM), which have been defined in Definition 7. An EAM of an activ-ity represents complete and specialised models of the activity for a concrete user.Assuming that different users execute different actions to perform the same activ-ity and that a concrete activity may be performed in different ways by the sameuser, a user adaptable activity modelling approach has to be able to capture activitymodels that fulfil these requirements. For example, making a coffee is a commonactivity for many users. However, a concrete user may prepare a coffee with milksometimes and a black coffee other times. Both, coffee with milk and black coffee,are specialised sub-activities of making coffee, which will be characterised by dif-ferent action sequences. So the objective of AML is to learn those different actionsequences for a concrete user based on the output given by the clustering processdescribed in Chapter 4.
Problem (AML). Given the activity clusters and fully annotated dataset files com-ing from the activity clustering process, learn extended activity models, i.e. com-plete and specialised activity models for a concrete user.
Notice that in some cases, a user may only perform an activity in a single way.In that case AML would learn only one complete activity model, since for a modelto be considered a specialised model, at least two complete models have to belearnt.
When extended activity models are learnt, they are presented to the domainexpert, mainly due to two reasons: (i) the specialised models do not have a semantictag as sub-activities of the detected activity - e.g. sub-activities MakeBlackCoffeeand MakeCoffeeWithMilk may be learnt, but their names or semantic tags cannotbe known by the learner - and (ii) to let the expert analyse and add the learnt modelsto the main activity ontology if convenient. The first reason refers to the fact that theAML cannot know whether an specialised model refers to making a black coffeeor making coffee with milk. Nevertheless, having the specialised activity model, itis usually easy for an expert to decide the semantic label of the specialised activitymodel. The second reason is derived from the fact that the AML will not be ableto deliver without any error, specially considering the limited previous knowledgeprovided and the noisy sensor scenario in which it has to work. An expert willanalyse the EAMs learnt by the AML to filter them if necessary and add them tothe activity ontology with appropriate specialised activity labels.
Based on the role of the domain expert and assuming that the action clustersobtained in the clustering process do contain all the activity variations for a concreteuser, a conservative policy for activity learning is the best option. In this context,conservative means that it is better to learn false activity models as far as all real
82

5.2 Identifying Relevant Information
activity models are learnt. If an activity variation detected by the clustering processis removed in the learning stage, the expert will no be able to recover that variationfrom the information provided by the AML. However, false activity models canbe purged by the expert, so the objective of the AML is to learn the 100% of realactivity models, minimising the number of spurious models learnt.
5.2 Identifying Relevant InformationTo address the problem addressed in Section 5.1, the information that theAML canuse is the one stored in the output of the clustering process (activity clusters andfully annotated dataset) and the context knowledge file. Notice that the informationfrom the context knowledge has already been exploited in the clustering process(Chapter 4), both by SA3 (Semantic Activity Annotation Algorithm explained inSection 4.1) and AA (Action Aggregator, described in Section 4.2), so it cannotoffer any new relevant information for AML. In other words, the output of theclustering process cannot be further analysed and refined using the informationfrom the context knowledge file.
Thus, theAML can only rely on the activity clusters file and the fully annotateddataset. It is important to identify what information can be obtained from thosefiles and whether they are relevant in order to learn EAMs from the action clusterswhich define activities. Basically, the activity clusters file is obtained as a summaryof the fully annotated dataset. The only information which is not stored in theactivity clusters file and it is in the fully annotated dataset is the start and end timesfor concrete executions of activities. Notice that the mean duration and standarddeviation are calculated for each activity (not for each activity variation) and storedin the activity clusters file. However, all the clusters in the activity clusters file havebeen obtained applying the time feasibility InRange function (Equation 4.6), soall of them are feasible models from the duration point of view. Hence, concreteactivity durations are not relevant forAML and in consequence, the fully annotateddataset will not be used as an input to AML.
The activity clusters file is then the only input to the AML algorithm. Theinformation provided in this file has already been shown in Figure 3.6 and describedin Section 4.2.3. Now, this information will be analysed to assess its relevance tolearn EAMs:
1. Locations: the locations contained for each activity are compatible with thelocations defined in the context knowledge. The relative occurrences of thoselocations are not relevant to learn EAMs. They can be used to learn descrip-tive properties, for instance, but this is not the objective ofAML, so locationswill not be used.
83

5. Activity Model Learner
2. Actions: the list of all actions used and their frequencies may serve to identifyactions that are executed very rarely for a given activity. However, even beingrare, an action could really be executed for a given activity by a concreteuser. In those cases, the conservative policy selected dictates that frequencyinformation of actions cannot be directly used to discard any of them.
3. Patterns: patterns represent the action sequences (clusters) with their asso-ciated frequencies. They contain all the varied ways a user performed anactivity, so they are the key element to learn EAMs.
4. Objects: the AML aims to learn activity models as sequences of actions.The concrete objects used to execute those actions are not relevant. Objectsmay be used to learn descriptive properties, but not action properties, so theywill not be used for the AML.
5. Occurrences: the total number of clusters for a given activity. It does notprovide any significant information to learn EAMs.
6. Duration: it can be used to learn descriptive properties and update durationinformation provided by domain experts in the context knowledge. However,it cannot be used to learn action properties.
In consequence, the information stored in patterns is the only relevant informa-tion for the AML. Remember that patterns store all the different action sequencesextracted by the clustering process for a given activity with associated frequencies.
5.3 The Learning AlgorithmSumming up the conclusions obtained in Sections 5.1 and 5.2, the task of learningEAMs can be seen as purging spurious action clusters from all the clusters extractedby the clustering process. The information that the AML can use for this task isthe action clusters themselves and associated occurrence frequencies. So the mainidea is that action clusters contain all the action sequences performed by a userfor each activity, but some of those clusters are spurious, due to sensor noise, usererratic behaviour and/or clustering errors. The AML has to detect those spuriousaction sequences or outliers and remove them in order to keep only those actionsequences that really represent an activity.
The designed learning algorithm works on the similarity between action se-quences and their occurrence frequencies. A two-step process has been designedand implemented for that purpose: (i) the filtering step (Section 5.3.1), where actionsequences will be treated in terms of repeated actions and varied order of actions,and (ii) the similarity-based outlier detection step (Section 5.3.2), where outlier
84

5.3 The Learning Algorithm
action sequences will be detected in the similarity space and fused with the mostsimilar action sequence taking their occurrence frequencies into account. The com-plete AML algorithm and its final output are described in Section 5.3.3.
5.3.1 The filtering stepIf action clusters which define activities are carefully analysed, it can be seen thatthere are some clusters that contain repeated actions. Additionally, some clus-ters contain the same actions but in different order. In the ontology-based activitymodelling approach described in Section 3.1, the activity models in terms of ac-tion properties do not contain repeated actions and the order in which actions areexecuted is not important (notice that descriptive properties do reflect this infor-mation, but they are not used when recognising activities). In consequence, twofiltering steps are performed:
1. Remove repeated actions into a sequence: some action sequences containrepeated actions. For instance, consider the sequence S = {a, b, a, c}. Asrepeated actions do not add any new information for activity modelling, theyare removed. S becomes S ′ = {a, b, c}. Notice that this step does not removeany action sequence of an activity. This step can be omitted depending onhow activity models are used by the activity recognition system. The workpresented in this paper is based on the knowledge-driven approach developedby Chen et al. in (Chen et al., 2012b). This activity recognition system doesnot consider repeated actions in the recognition phase, so activity models donot have this information. However, if the recognition system is sensitive torepeated actions, the learning algorithm can be easily modified to omit thisfirst filtering step.
2. Fuse equal action sequences: some action sequences contain the same ac-tions, but in different order. For example, S1 = {a, b, c} and S2 = {b, c, a}.The order of actions is not important for activity models, so both sequencesare fused. Two action sequences are equal if:
S1 ∩ S2 = S1 ∪ S2 (5.1)
Any two action sequences that fulfil Equation 5.1 are fused. Fusing impliesremoving one of the action sequences and to sum occurrence frequencies ofboth action sequences to assign it to the fused sequence. Thus from twosequences a resultant sequence will remain, reducing the number of validaction sequences.
As a consequence of the filtering step, the number of clusters for an activitywill be equal or less than the clusters provided as input.
85

5. Activity Model Learner
5.3.2 The similarity-based outlier detection stepThe idea behind the similarity-based outlier detection is simple: all the action se-quences describing the same activity will have their own similarity distribution de-pending on the varied ways of performing the activity by a concrete user. Spuriousaction sequences will be those which are very similar to valid action sequences, andtheir difference will be related to sensor noise or clustering errors. Hence, if out-liers are detected in the similarity space between action sequences, those outlierswill point to spurious action sequences.
The first thing needed to apply the idea introduced above is a similarity mea-sure for two action sequences. The literature offers a lot of similarity measuresto compare two sequences. However, many of them take into account the orderof the elements of both sequences, such as the Levenshtein distance (Levenshtein,1966), Hamming distance (Hamming, 1950) or most frequent k characters (Sekeret al., 2014). As explained in Section 5.3.1, the order of actions is not relevant forontology-based activity modelling, thus order-based similarity measures are notuseful to detect outlier action sequences.
There are two similarity measures that do not care about the order of the el-ements of sequences, namely the Jaccard coefficient (Jain and Dubes, 1988) andthe Sørensen-Dice coefficient (Sørensen, 1948). The Jaccard coefficient measuressimilarity between finite sample sets, and is defined as the size of the intersectiondivided by the size of the union of the sample sets:
Jaccard(A,B) =|A ∩B||A ∪B|
(5.2)
It can be seen that Jaccard(A,B) ∈ [0, 1]. Moreover, if sequencesA andB areequal, Jaccard(A,B) = 1. IfA andB are empty sequences the Jaccard coefficientis defined to be 1.
The Sørensen-Dice coefficient is very similar to the Jaccard coefficient. It isdenoted as QS and defined as the size of the intersection multiplied by two dividedby the sum of the elements of both sequences:
QS(A,B) =2|A ∩B||A|+ |B|
(5.3)
Similarly to Jaccard coefficient,QS(A,B) ∈ [0, 1]. Since it does not satisfy thetriangle inequality, the Sørensen-Dice coefficient can be considered a semimetricversion of the Jaccard coefficient. This coefficient is mainly useful for ecologicalcommunity data. Justification for its use is primarily empirical rather than theoret-ical, although it can be justified theoretically as the intersection of two fuzzy sets(Roberts, 1986).
86

5.3 The Learning Algorithm
For the outlier detection step, the Jaccard coefficient has been selected, becauseit is a theoretically well founded measure which can be seen as the basis of theSørensen-Dice coefficient. So the similarity between two action sequences is givenby the Jaccard coefficient of both sequences. The value 1 denotes that both se-quences are equal, whereas 0 means that there is nothing in common between bothsequences. Notice that due to the filtering step (Section 5.3.1) there will not beequal action sequences at this stage, hence value 1 will not appear. Similarly, hav-ing a 0 value is also impossible, since all the action sequences describing the sameactivity share at least the actions contained in their IAMs.
The similarity-based outlier detection is an iterative algorithm which uses theJaccard coefficient to calculate the similarity between action sequences. The algo-rithm calculates the so called Jaccard Matrix (JM ), which is a square matrix ofall action sequences that remain from the previous iteration (in the case of the firstiteration, action sequences coming from the filtering step in Section 5.3.1). JMi,j
stores the Jaccard coefficient for action sequences Si and Sj .
JM =
Jaccard(S0, S0) · · · Jaccard(S0, SN)... . . . ...
Jaccard(SN , S0) · · · Jaccard(SN , SN)
(5.4)
The diagonal of JM is 1, since two equal action sequences’ Jaccard coefficientis 1 (∀i, j : i = j → Jaccard(Si, Sj) = 1). Diagonal values do not provideany information for outlier detection, so they are removed. Additionally, valuesfrom the upper and lower triangles of JM are the same, since Jaccard(Si, Sj) =Jaccard(Sj, Si). So extracting only the values of the upper triangle from JM ,
ˆJM is obtained, which is stored as a vector. The ˆJM vector has the informationof the similarity of all action sequences detected for a concrete activity. Figure5.1 shows a plot of the similarity values between 11 action sequences, taken froma real example (they are representing the activity MakePasta for a concrete user).The idea of the similarity-based outlier detection is to identify similarity values thatstand out among everyone else; then, take the action sequences that are representedby those outlier similarity values and fuse them.
To detect outlier similarity values, a statistical approach has been defined. Fix-ing a static threshold value for every activity is not appropriate, since some ac-tivities may contain many actions, whereas others are performed by means of fewactions. So a difference of a single action in a “short” activity cannot have the sameweight as in a “long” activity (short and long are here used to refer to the numberof actions of activities). Furthermore, some users may execute very different actionsequences to perform the same activity, while others may only add slight variations.In consequence, the outlier detection method has to calculate a threshold for everyaction sequence group describing an activity.
87

5. Activity Model Learner
Figure 5.1: Jaccard coefficient-based similarity values for 11 action sequences de-tected for a concrete activity and a concrete user.
The strategy followed to calculate the threshold is based on the median value ofthe ˆJM vector. The median is the numerical value separating the higher half of adata sample from the lower half. The median of a finite list of numbers can be foundby arranging all the observations from lowest value to highest value and pickingthe middle one. If there is an even number of observations, then there is no singlemiddle value; the median is then usually defined to be the mean of the two middlevalues. The median has been chosen rather than the mean, because the median is arobust estimator which is less influenced by outliers than the mean value. Using themedian allows detecting the similarity “centre of gravity” minimising the influenceof outliers.
Once the median of ˆJM measures the central tendency, another statistic isneeded to capture the dispersion of similarity in ˆJM . Two good candidates to mea-sure the dispersion in univariate datasets have been found in the literature (Hoaglinet al., 1983). The first one is the median absolute deviation (MAD) and it is definedas the median of the absolute deviations from the data’s median:
MAD = mediani(|Xi −medianj(X)|) (5.5)
The MAD is a measure of statistical dispersion. Moreover, the MAD is a robuststatistic, being more resilient to outliers in a dataset than the standard deviation. Inthe standard deviation, the distances from the mean are squared, so large deviationsare weighted more heavily, and thus outliers can heavily influence it. In the MAD,
88

5.3 The Learning Algorithm
the deviations of a small number of outliers are irrelevant.There is another dispersion measure, which is known as the average absolute
deviation about median (ADM). The ADM offers a direct measure of the scale ofa random variable about its median and it is defined as:
ADM = Ei|Xi −median(X)| (5.6)
where Ei|X| stands for the mean value of X . Both the MAD and the ADM can beused to establish a proper threshold and identify outlier similarity values. However,in the current implementation the ADM has been chosen. It is true that the ADMis more influenced by outliers than the MAD, but from the point of view of theconservative policy selected for learning, the ADM is more suitable. The reason isthat the MAD can have a value of zero if there are some similarity values with thesame values as the median. This fact makes that the median itself could be taken asthe threshold, which is quite aggressive. On the other hand, the only way the ADMcan be zero is to have all similarity values being equal to the median. Moreover, itcan be shown mathematically that the MAD of a given dataset will always be lessor equal to the ADM, so the MAD is more aggressive in all the cases.
Due to those reasons, the ADM has been chosen to establish a statistical thresh-old to separate normal similarity values from outlier values. The threshold is de-fined as:
θS = median( ˆJM) + ADM( ˆJM) (5.7)
As the threshold in Equation 5.7 has been calculated using statistical ap-proaches, it is denoted as θS . Applying Equation 5.7 to the similarity values plottedin the example of Figure 5.1, a threshold can be calculated. This threshold is de-picted in Figure 5.2. Similarity values above the threshold can be considered asoutliers.
Statistical approaches work well when “a lot of” data is available. But when“few” data is available, statistic-based approaches may extract weak conclusions.For example, imagine the following action sequences are being analysed by AMLfor the activity MakePasta (this example is extracted from a real experiment):
S1 = {turnOnTap, useCookingAppliance, hasPasta,useCookingUtensil, hasPesto}
S2 = {hasPasta, useCookingAppliance, turnOnTap,hasBacon, hasCream, useCookingUtensil}
S3 = {turnOnTap, useCookingAppliance, hasPasta,useCookingUtensil, hasTomato}
89

5. Activity Model Learner
Outliers
Threshold
Figure 5.2: The threshold calculated for the similarity values of 11 action sequencesrepresenting a concrete activity.
The difference between S1 and S3 is that the user adds pesto in the first andtomato in the second, i.e. only one action out of five. All three action sequences arereally performed by the user and they should not be removed or fused. However, ifθS is calculated for the group of action sequences, a value of 0.6 is obtained. Con-sidering that Jaccard(S1, S3) = 0.66, action sequences S1 and S3 should be fused,thus removing one of the action sequences which has actually been performed bythe user. Notice that detecting outliers using statistical approaches on three samplesis not generally feasible. Removing one of the action sequences would contradictthe conservative policy selected for the AML, where the priority is given to learn-ing all real action sequences performed by a user. Hence, a defensive mechanismfor those cases is adopted. The threshold to identify outliers is defined as:
θ = max{θS, λ} (5.8)
where λ is a fixed value. The idea of this approach is to state a similarity valuethat acts as a minimum value for action sequences to be fused. In the experimentsperformed in this dissertation λ = 0.75 (Chapter 6). If λ is set to higher values, theAML will be even more conservative, whereas decreasing λ will make the AMLrely more on the statistic-based approach (θS). Figure 5.3 shows both thresholds, θSand λ, for the example of MakePasta activity and its three action sequences. Noticethat Jaccard(S1, S2) = Jaccard(S2, S3) and thus, only one point is depicted inthe graphic. It can be seen clearly how using only θS , Jaccard(S1, S3) is an outlier
90

5.3 The Learning Algorithm
and in consequence, sequences S1 and S3 would be incorrectly fused. But usingEquation 5.8 and taking the maximum of both thresholds, there is not any outlierand hence all three sequences are kept as valid activity models.
θ S
λ
Figure 5.3: Both thresholds depicted in an example of few available data: θS and λ.
The similarity-based outlier detection algorithm is an iterative process that fusessequences whose Jaccard coefficient is higher than θ, until no sequences can befused. Fusing implies defining a function which returns a single action sequencehaving as input two different action sequences. In the case of the AML a fusingheuristic has been adopted, which states that given two action sequences to befused, the lower frequency sequence is a spurious variation of the higher frequencysequence. In consequence, the higher frequency action sequence is the valid oneand the function will return it as the fused action sequence.
Fusion(Si, Sj) =
{Si, if fSi
≥ fSj
Sj, otherwise (5.9)
where fSiis the occurrence frequency of action sequence Si. The fused action
sequence will have a new occurrence frequency which is calculated as the sum ofthe occurrence frequencies of fused sequences: fSfused
= fSi+ fSj
.
5.3.3 The complete AML algorithmCombining the filtering step described in Section 5.3.1 and the similarity-basedoutlier detection step described in Section 5.3.2, the complete AML algorithm can
91

5. Activity Model Learner
be built. Its inputs are the activity clusters file, where the result of the clusteringprocess is given, and the fixed threshold λ. Algorithm 3 shows the AML algorithmwritten in pseudo-code.
Algorithm 3 AML algorithm for learning extended activity modelsRequire: activity clusters, λEnsure: learnt action sequencesactivities← obtainActivities(activity clusters)for all activity ∈ activities doaction sequences← obtainSequences(activity, activity clusters)// The filtering stepaction sequences← filteringStep(action sequences)// The similarity-based outlier detection steprepeatJM ← jaccardMatrix(action sequences)
ˆJM ← extractUpperTriangle(JM)θS ← calculateStatisticThreshold( ˆJM)outliers← detectOutliers( ˆJM, θS, λ)action sequences← fuseSequences(action sequences, outliers)
until outliers = ∅learnt action sequences← addActivityModel(activity, action sequences)
end forreturn learnt action sequences
The output of the AML algorithm is the so called learnt action sequences file,stored in a JSON file in the current implementation. This file contains the ex-tended activity models for every activity defined in the context model. An examplecan be seen in Figure 5.4, where two complete and specialised models for activityMakePasta are provided. The example is extracted from a real experiment, wherethe user prepares pasta carbonara more or less the 50% of times and pasta withtomato sauce also around 50% of times. Looking at the action sequences, the dif-ferent ways of preparing pasta can be distinguished. In the first way, labelled bythe user as pasta carbonara, bacon and cream are used by the user (actions hasBa-con and hasCream). In the second way, action hasTomato appears, which makesreference to the usage of tomato sauce. Notice also that the first action sequencecontains an openFridge action, which suggests that some of the ingredients arestored in the fridge. This does not happen in the second action sequence, where allthe ingredients are taken from the food store (action openStore).
92

5.3 The Learning Algorithm
” MakePasta ” : {” 1 ” : [
0 .5074626865671642 ,[
” h a s P a s t a ” ,” us eC o ok in g Ap p l i an ce ” ,” hasBacon ” ,” turnOnTap ” ,” o p e n F r i d g e ” ,” o p e n S t o r e ” ,” hasCream ” ,” u s e C o o k i n g U t e n s i l ”
]] ,
” 2 ” : [0 .49253731343283574 ,[
” hasTomato ” ,” h a s P a s t a ” ,” us eC o ok in g Ap p l i an ce ” ,” turnOnTap ” ,” o p e n S t o r e ” ,” u s e C o o k i n g U t e n s i l ”
]]
} ,
Figure 5.4: Example of the output of the AML algorithm. Two specialised andcomplete models for MakePasta activity are depicted. As their semantic tags are notknown, they are tagged with numbers 1 and 2.
93

5. Activity Model Learner
5.4 Summary and ConclusionsAn algorithm to learn extended activity models has been designed and developed inthis chapter. The algorithm takes the results of the clustering process described inChapter 4, assuming that the action clusters have all the action sequences executedby a user to perform a concrete activity. Based on this assumption, it has beenshown that learning extended activity models from action clusters can be seen aspurging spurious action sequences which appear due to sensor noise, clusteringerrors and/or user erratic behaviour (Section 5.1). It is very important to highlightthe conservative policy adopted by the AML algorithm. The highest priority isgiven to keep all real action sequences, even though this may imply not removingall spurious action sequences. The AML algorithm has been designed around thisconservative policy.
Before describing the AML algorithm, all the available information has beenanalysed in order to identify what is relevant to learn extended activity models (Sec-tion 5.2). It has been shown that the action clusters per activity and their associatedoccurrence frequencies are the only relevant available information.
With the objective clearly defined and the relevant input information identified,Section 5.3 describes how theAML algorithm has been developed. It has two mainsteps: the filtering step (Section 5.3.1), where action sequences are filtered basedon the repeated actions and their order, and the similarity-based outlier detectionstep (Section 5.3.2), where the Jaccard coefficient is used to compute the similaritybetween action sequences to calculate a threshold which allows distinguishing be-tween inlier and outlier similarities; the action sequences whose similarity is higherthan the threshold are fused, taking their occurrence frequencies into consideration.The complete AML algorithm and the output it generates have been described inSection 5.3.3.
One of the most surprising facts about the AML might be that it does not usethe occurrence frequencies of action sequences in the outlier detection step. It canbe argued that if spurious action sequences are generated by sensor noise, clusteringerrors and/or user erratic behaviour, their occurrence frequency should be relativelylow. This is generally true. However, using frequencies to detect outliers has apernicious effect: it can identify as spurious those action sequences that even beingvalid, have been executed few times by the user. Imagine, for instance, that auser prepares coffee frequently. Only in some special occasions, this user likespreparing Irish coffee. If frequency is taken into account for outlier detection, theaction sequences describing the preparation of an Irish coffee might be removed.This contradicts the conservative policy adopted for the AML.
Indeed, the first metrics used for outlier detection combined Jaccard-based simi-larity and occurrence frequencies. It was observed that when the executed action se-quences for a concrete activity had big differences in their occurrence frequencies,
94

5.4 Summary and Conclusions
those with lowest frequencies were fused incorrectly with other action sequences.After defining and testing many metrics combining similarity and frequency, theconclusion was that frequencies should not be used for detecting outliers. As de-scribed in Section 5.3.2, AML uses frequency only in the fusion function (Equa-tion 5.9) implementing the heuristic that for two action sequences to be fused, oncetheir similarity has been identified as being an outlier, the lower frequency actionsequence is a spurious variation of the higher frequency one.
The output of AML, stored in the learnt action sequences file (Figure 5.4),is presented to the domain expert, who can analyse the extended activity modelsextracted by the solution and add them to the knowledge base with appropriateactivity names, if convenient. As such, a human expert will always have the lastdecision about the learnt activity models. That is one of the main reasons why theconservative approach for AML has been adopted. If an activity model is removedincorrectly, a human expert will not have any way to recover that activity model.But if a spurious activity model is learnt, the domain expert may remove it easily,looking at the action sequence and occurrence frequencies.
95


Science is a way of trying not tofool yourself. The first principle isthat you must not fool yourself, andyou are the easiest person to fool.
Richard FeynmanCHAPTER
6Evaluation
THIS chapter describes and analyses the proposed evaluation methodol-ogy for the extended activity model learning system described throughChapters 3, 4 and 5. To test the learning system properly, detailed datafrom various users is needed, containing different ways of performing
the same activity by the same user. In order to achieve such datasets, the proposedevaluation methodology is based on surveys to users and a synthetic dataset gener-ator tool. Surveys allow capturing how users perform activities in terms of actions,while the synthetic dataset generator uses survey information to generate sensoractivation datasets, introducing different kinds of sensor noise.
Once the methodology is described and discussed, evaluation scenarios andmetrics will be introduced. To assess the performance of the learning system invarious situations, several evaluation scenarios have been prepared, consideringdifferent kinds of sensor noise and set-ups. Similarly, and based on the availableliterature, the most significant performance metrics have been chosen to measurethe performance of the approach.
Applying the evaluation methodology on the prepared scenarios and selectedmetrics, results are obtained. Those results are widely discussed in this chapterand compared to the objectives defined in Chapter 1. As the problem tackled inthis dissertation has not been approached by any other researcher (see Section 1.1),comparing different approaches has not been possible.
The chapter is divided in three sections: Section 6.1 introduces the conven-tional evaluation methodology used for activity recognition, detects its drawbacksand proposes a new evaluation methodology which is more appropriate to validatethe learning system. Section 6.2 presents evaluation scenarios, metrics, results and
97

6. Evaluation
discussions divided in three main parts: SA3 performance (Section 6.2.1), the com-plete activity clustering performance (Section 6.2.2) and finally the EAM learningsystem performance (Section 6.2.3). All three sections discuss the results and com-pare them with the objectives identified at the beginning of this dissertation (Chap-ter 1). To conclude, Section 6.3 provides a global view of the system performance,summarises the contents of the chapter and presents the most relevant conclusions.
6.1 Evaluation MethodologyEven though activity recognition is very diverse in terms of sensor approaches andalgorithmic choices, evaluation is usually carried out applying a very well knownmethodology (Riboni and Bettini, 2011a), (Rashidi and Cook, 2011), (Tapia et al.,2004) which can be summarised in the following steps:
1. Choose a target environment and deploy sensors to acquire and process in-formation about human activities.
2. Select a group of people who can perform target activities in the preparedenvironment.
3. Select a dataset labelling system so datasets generated by users can be usedas a ground truth, both for the activity recognition system and the evaluationprocess.
4. Run experiments with users and label the obtained activity datasets.
5. Use the same datasets to test the activity recognition system and store thelabels produced by it.
6. Compare the labels of the activity recognition system with the ground truthusing appropriate metrics.
Each of the enumerated steps may vary depending on the activity recognitionapproach and the available resources. The described methodology, which will becalled standard methodology for the rest of the dissertation, is conventionally thereference for any group working on human activity recognition.
Nevertheless, there are some problems that make very difficult to implementthe so called standard methodology. For instance, (i) it is not always possible toown an environment and install sensors and processing systems, due to economicreasons, (ii) running experiments with human beings imply ethical and legal issuesthat can slow down the research process or sometimes make it impossible, (iii)dataset labelling systems are not perfect, since most of them rely on users’ memory
98

6.1 Evaluation Methodology
or discipline to annotate every activity carried out, and (iv) regulatory limitationson the use of human subjects prohibit the collection of extensive datasets that cantest all scenarios and theories under all circumstances.
There are several research groups who have made the datasets that they obtainin their pervasive environments publicly available, following different variants ofthe standard methodology. A Wiki Page called BoxLab1 contains a detailed listof public datasets collected in home environments. It contains a description ofthe deployed sensors, whether it is an annotated dataset and the availability of thedataset. Those public datasets can be a very good alternative for those researchgroups which cannot run their own experiments. Furthermore, public datasets canalso be used for benchmarking different activity recognition systems.
6.1.1 Analysis of the viability of the standard methodology forthe extended activity model learning systemTo evaluate properly the EAM learning system, activity datasets that fulfil severalconditions are needed. Namely:
1. Contain a lot of samples of different activities to enable a proper learningprocess. To make data-driven learning a meaningful process, many samplesof the same activities are needed, specially to learn noise free activity models.If few samples are available and those samples are affected by noise, it is verydifficult for the learning process to distinguish between noisy and noiselessmodels.
2. Sensor activations must be labelled in order to provide a solid ground truth.An accurate evaluation process needs an accurately labelled dataset, whereall sensor activations produced due to an activity execution are annotatedwith that activity name, whereas sensor noise is not included in the activity.
3. Specific objects used for activities have to be monitored (dense sensing sce-nario). Instead of getting data from context sensors such as thermometers,humidity sensors or even movement sensors, datasets have to contain sensoractivations monitoring concrete objects such as cups, dishes, food and so on,in order to be able to produce accurate activity models.
4. At least some of the activities have to be performed in varied ways to seewhether the presented learning process can capture all those variations. Dif-ferent ways of performing the same activity are needed, since the EAM learn-ing system aims at capturing sub-activities. If all the activities are performed
1http://boxlab.wikispaces.com/List+of+Home+Datasets
99

6. Evaluation
the same way in terms of executed actions, the dataset will only serve toevaluate the learning of complete models, but not specialised models.
5. Several users are needed as the approach aims at capturing personalised ac-tivity models for concrete users. Every user has his/her own way to performthe same activities and one of the objectives of the EAM learning system isto be able to model those personalised models. Thus, to show that the EAMlearning system can really deal with different users, datasets of several usersare required.
Following the standard methodology to generate such datasets implies a high-cost and lengthy process with many ethical and legal constraints regarding the useof people for experiments. That cost, both economical and time cost, could not beassumed during the development of the current dissertation. Due to this limitation,public dataset repositories were analysed carefully to find an appropriate dataset.
Unfortunately, datasets that meet all the enumerated conditions could not befound in those public repositories. Some datasets used different activity monitoringapproaches, such as vision- and wearable-based monitoring. Some other datasetscould be used for the dense sensing scenario since they monitor specific objects,but activities are performed from a list where no variations can be found. Yet otherdatasets are more focused on monitoring the contextual information, rather thanconcrete user-object interactions.
As Helal et al. state in their paper (Helal et al., 2011):
Access to meaningful collections of sensory data is one of the majorimpediments in human activity recognition research. Researchers of-ten need data to evaluate the viability of their models and algorithms.But useful sensory data from real world deployments of pervasivespaces are very scarce. This is due to the significant cost and elabo-rate groundwork needed to create actual spaces. Additionally, humansubjects are not easy to find and recruit. Even in real deployments, hu-man subjects cannot be used extensively to test all scenarios and verifymultitudes of theories. Rather, human subjects are used to validate themost basic aspects of the pervasive space and its applications, leavingmany questions unanswered and theories unverified.
This is the case of the presented approach for EAM learning. It turns out that nodatasets were found from real pervasive environments to verify the exposed theory.However, Helal et al. propose a solution to this problem in the same paper (Helalet al., 2011):
It is thus necessary to develop alternative and practical approaches tostudying human activity recognition. Powerful and realistic simulation
100

6.1 Evaluation Methodology
tools could be used to support the growing demand for test data. Sim-ulations enable researchers to create focused synthetic replications ofimportant events and activities under study. It can be easily changedand refined allowing researchers efficiently to experiment, analyze andfine-tune their models and associated algorithms. Simulation also al-lows a wider community of researchers to engage and collaborate tosolve a specific problem. Hence, a design based on preliminary sim-ulation studies would most likely to be a more robust and inclusivedesign. Also, a simulation model that mimics an existing real worldpervasive space is most likely to answer more questions (and generatemuch more data) than the target actual space.
Following those ideas, simulation tools have already been used for activityrecognition. For example, Okeyo et al. use a synthetic data generator tool to simu-late time intervals between sensor activations (Okeyo et al., 2012). Their researchis focused on sensor data stream segmentation, so the tool generates varying pat-terns of sensor activations in order to verify their approach. Liao et al. combinesimulation tools and real data for activity recognition in (Liao et al., 2006). Amore elaborated simulator has been developed by Bruneau et al. in (Bruneau et al.,2009): DiaSim. The DiaSim simulator executes pervasive computing applicationsby creating an emulation layer and developing simulation logic using a program-ming framework. However, it is more focused on simulating applications such asfire situations, intrusions and so on to identify potential conflicts. In consequence,DiaSim cannot be directly applied to activity recognition. Finally, Helal et al. pro-pose to develop powerful and realistic simulation tools to study human activityrecognition. They develop a simulator called Persim, which has been enhanced inthe new version Persim-3D (Helal et al., 2012). Persim is an event driven simulatorof human activities in pervasive spaces. Persim is capable of capturing elementsof space, sensors, behaviours (activities), and their inter-relationships. Persim isbecoming a very complete simulator tool for activity recognition in pervasive envi-ronments. However, it is still under development and one of the main limitations isthat it does not provide a way to model realistically human behaviour. Authors havealready identified this limitation and they are currently working on programmingby demonstration approaches to overcome the problem.
As can be seen in the literature review done in the paragraph above, simula-tion tools can be used for activity recognition, since they provide accurate enoughdatasets to verify some theories. However, none of the references given abovespecify a concrete methodology to use simulators to evaluate activity recognitionapproaches. There is no information about how activities should be defined, howdifferent users can be modelled, sensor error models and so forth, which are keyissues when using a simulator. Therefore, there is a lack of a sound methodology
101

6. Evaluation
that addresses the usage of simulation tools for activity recognition evaluation.
6.1.2 Hybrid evaluation methodology approachThe hybrid evaluation methodology has been specially designed for activity recog-nition systems which assume the dense sensing paradigm (see Constraint 1). Eventhough the methodology itself is not limited to concrete scenarios, the implementa-tion presented in this document works for single user - single activity scenarios, i.e.only one user is considered and concurrent or interleaved activities are not takeninto account (see Constraint 2).
The methodology has been named hybrid because it combines real users’ in-puts and simulation tools. The key idea is to circulate surveys among target userswith the objective of capturing how they perform certain activities of daily living.Additionally, users are also requested to describe how their days are in terms ofdefined activities. For example, a user might make a coffee and brush her teeth inweek days between 7:00 and 7:30 AM. So the aim of those surveys is to modelreal human behaviour, covering one of the major weaknesses of simulation-basedevaluation methodologies. Using the information collected by surveys, individualscripts are prepared, which are then processed by a synthetic dataset generator toolto simulate arbitrary number of days and generate perfectly labelled datasets ofactivities. To get as close as possible to real world settings, the synthetic datasetgenerator uses probabilistic sensor noise models and probabilistic time lapses.
Based on those constraints and ideas, the proposed hybrid evaluation method-ology has the following steps (see Figure 6.1):
1. Design activity surveys: to capture how users perform activities and modeltheir behaviour, a proper survey has to be designed. A detailed explanationof how surveys are designed for this dissertation can be found in Section6.1.2.1.
2. Select target users: depending on the objectives of the research, several usergroups can be selected. For example, if the system aims at providing help toelderly people, selecting members of that target group is recommended.
3. Distribute surveys among target users: a suitable way to distribute surveyshas to be used, which guarantees users’ anonymity. The distribution methodcan also be influenced by target users. For example, using web-based sur-veys can be a bad idea if surveys are directed to elderly people, who canbe unfamiliar with those technologies. Personal interviews may be a goodalternative for those cases.
102

6.1 Evaluation Methodology
4. Translate surveys to scripts: appropriate criteria have to be adopted to trans-late the answers obtained from surveys to scripts for the synthetic datasetgenerator - or any other simulator -. It is very important not to alter or losethe information provided by users.
5. Model sensor noise: sensor noise has to be modelled in order to achieverealistic activity datasets. Real sensors are not perfect and depending ontheir technological base, error models have to be provided.
6. Run synthetic dataset generator: using the scripts obtained from surveys andsensor error models, the synthetic dataset generator is executed. The outputof the tool is a labelled activity dataset which will serve as the ground truthfor evaluation.
7. Develop the activity modelling and/or recognition system: researchers haveto develop the activity modelling and/or recognition system in order to betested. Notice that datasets generated by the synthetic dataset generator canalso be used in this step, specially for data-driven approaches.
8. Compare results: finally, the results obtained by the activity modelling and/orrecognition system have to be compared with the ground truth, using appro-priate metrics.
LabelledActivity Dataset
Designactivity survey
Selecttarget users
Distributesurvey
Translate surveys to scripts
Run Syntheticdataset generator
with scripts
Modelsensor noise
Develop activity recognition
system
Compareresults
Figure 6.1: The hybrid evaluation methodology steps depicted in a flowchart.
103

6. Evaluation
6.1.2.1 Survey for activities of daily livingOne of the main advantages of considering dense sensing scenarios is that activitiesare described in terms of the objects which have been used to perform that activity.Furthermore, as only sensor activations (and not de-activations) are important forthe approach (see Definition 1), to model an activity, it is enough to know which ob-jects are used by the user and the order of usage of those objects. This informationis easy to obtain in a survey and will be named activity model.
Definition 13 (Activity model). An activity model is a sequence of objects usedby a user to perform an activity. A user might provide several activity models pereach defined activity, because the same activity can be performed in several ways.Activity models also provide a typical duration given by the user.
On the other hand, to model human behaviour appropriately, acquiring activitymodels is not enough. It is very important to know what activities are performedby a concrete user in a daily basis, alongside with the time slots and time lapsesbetween contiguous activities.
Definition 14 (Behaviour model). A behaviour model is a sequence of activitieswith associated time slots and time lapses. A user might provide several behaviourmodels, as every day can be different in terms of performed activities and times.
The main objective of the survey is to obtain activity and behaviour modelsfrom target users. Hence, the survey for activities of daily living has two main parts.The first part is devoted to capture what activities are performed in different days,i.e. behaviour models (see Definition 14). The second part, on the other hand, asksusers about how they perform those activities based on user-object interactions, i.e.activity models. The concrete survey used for the experiments carried out in thisdissertation can be found in the web1.
As can be seen in Figure 6.2, the survey begins with a brief explanation fortarget users, where the aims of the survey are stated and the target activities arepresented. In this case, the target activities are seven: (i) make a coffee, (ii) makea chocolate, (iii) make pasta, (iv) brush teeth, (v) watch television, (vi) wash handsand (vii) read a book. Afterwards, under the heading of “Day Description”, usersare asked to describe their week days in terms of activities. They are expectedto provide information about time slots and activity sequences performed in thosetime slots. Users are also asked to provide time relations between two consecutiveactivities. For example, between 7:00 and 7:30 AM a user might make a coffee andten minutes later might brush her teeth. This first part has been designed to obtainbehaviour models for target users.
1http://goo.gl/etCNyi
104

6.1 Evaluation Methodology
Figure 6.2: The first part of the survey. A brief introduction can be found where theaim of the survey is explained, continuing with the behaviour model part.
The second part of the survey is longer. Target activities are presented one byone. For each activity, several questions are asked to users, to capture the locationsof activities, the ways activities are performed, the objects used for each activity,a description of how those objects are used and typical duration estimations. Anexample of those questions can be found in Figure 6.3 for the activity MakeCoffee.
As Figure 6.3 shows six questions are asked per activity. The first question isto know where the activity is performed by the user. As stated in the brief expla-nation under the question, expected locations are home locations such as kitchen,lounge and so forth. Each activity may be performed in several locations, in con-cordance with the context knowledge model shown in Figure 3.2. Notice also thatthe expected locations fulfil with the location definition given in Definition 5.
The second question deals with different ways of performing an activity, i.e.sub-activities. Users are asked to provide a variation name, which will define thename of the sub-activity. The next question asks about the objects used to per-form the activity. This will serve not only to model the activity itself, but also tomodel the context knowledge, where objects and attached sensors are represented(see Section 3.3.1). Afterwards, the most important question for activity modellingcomes: a description of how the enumerated objects are used to perform the activ-ity. Descriptions are requested for each activity variation. From those descriptions,object usage order and time lapses will be obtained. Finally, the last question aimsat modelling typical durations for the variations of the target activity.
As described in the steps of the hybrid evaluation methodology in Section 6.1.2,it is also important to decide the way to circulate the survey and to guarantee user
105

6. Evaluation
Figure 6.3: The questions of the survey to capture the activity model of MakeCoffee.
106

6.1 Evaluation Methodology
anonymity. In our current experiments, we use the Google Forms1 service, mainlyfor three reasons:
1. Easy circulation: surveys can be sent by e-mail to target users, who receive alink to the web-based survey. This makes survey circulation easy and clear.
2. Anonymity: the answers of users are completely anonymous. When a usersubmits his/her answers, only a tag like “user 1” appears. There is no way tolink user answers to a concrete user.
3. Simple and centralised answer management: the Google Forms service gen-erates a centralised table where all the answers are collected. The table isautomatically updated whenever a new answer arrives. This web-based tablesystem for answers makes data management much easier.
Summarising, the survey for activities has different questions in order to ob-tain activity and behaviour models according to their definitions (Definitions 13and 14). Surveys are circulated among target users using Google Forms, whichoffers convenient tools to send them by e-mail and collect anonymous answers in acentralised manner.
6.1.2.2 Synthetic dataset generatorAlthough the hybrid methodology for evaluation could be used in principle withany simulator for human activity recognition, a custom simulation tool has beendeveloped to evaluate the EAM learning system. Available simulators such as Per-sim do not cover all the conditions to evaluate the EAM learning system appropri-ately. It may be very useful in the future, but nowadays it does not have the toolsto model sensor errors and different variations of activities.
Following the ideas of Okeyo et al. (Okeyo et al., 2012), instead of developinga simulator tool that provides visual interaction like Persim, a synthetic dataset gen-erator has been developed. The tool presented by Okeyo et al. does a very good jobsimulating time relations between sensor activations and activities, so their ideasregarding time management have been borrowed. But the simulator tool developedfor this dissertation has more capabilities, allowing researchers to introduce differ-ent sensor activation sequences for activities with occurrence probabilities, activitysequences which occur only with a given probability and different ways to modelsensor errors.
The synthetic dataset generator tool has been implemented in Python 2.72. Theinputs to the synthetic dataset generator are a script called ADL script, where ac-tivity and behaviour models for a concrete user are represented, and the context
1http://www.google.com/google-d-s/createforms.html2https://www.python.org/
107

6. Evaluation
knowledge file, where some sensor error models are provided. As sensor errormodels are linked to their type (pressure, tilt, contact and so on), it is a naturalchoice to place them where all the sensors of a concrete environment are repre-sented, i.e. in the context knowledge file. This part of the context knowledge filehas not been introduced in Section 3.3.1 because it was not important for the EAMlearning system. However, for simulation purposes, sensor error models play a cru-cial role, and including them in the context knowledge file was the straightforwardsolution. The considered sensor error modalities are two: sensor positive noise (seeDefinition 9) and missing noise (see Definition 10).
Figure 6.4 shows a high-level design for the synthetic dataset generator. As canbe seen in the figure, activity and behaviour models and sensor positive noise arerepresented in the ADL script. On the other hand, sensor missing noise models areobtained from the context knowledge file. Using probabilistic time managementtools, the synthetic dataset generator creates a sensor activation dataset, where allsensor activations are properly labelled to use it as ground truth. Sensor activationswhich are part of an activity are labelled with the activity name. But sensor activa-tions which appear due to sensor noise are labelled with the special label None.
SyntheticData Generator
Labelled sensor activation dataset
ADL script
ContextKnowledge
Activity modelsBehaviour models
Sensor positive noise
Sensor missing noise
Figure 6.4: High-level design of the synthetic dataset generator tool.
One of the design decisions was to separate the representation of both sensorerror models between two different files. The reason is that sensor missing noiseis completely linked to sensor technology and the pervasive infrastructure (wire-less receivers, communication, and system sampling and conversion mechanisms),whereas sensor positive noise is more related to environmental aspects, such as thedistribution of objects and human behaviour. Hence while sensor missing noisecan be considered a property of a sensor, sensor positive noise is more influencedby the inhabitant and the environment. That is why the missing error models areincluded in the context knowledge file depending on the sensor type and positiveerror models are represented in the ADL script which represents a concrete user.
108

6.1 Evaluation Methodology
To make this decision the research carried out by Chen et al. in (Chen et al.,2012b) has been considered. They show some experiments for activity recognitionin a smart home environment using the dense sensing activity monitoring approach.Throughout the experiment of 144 activities, a total of 804 user-object interactionswere performed. They used the so called User-object Interaction Recognition Ac-curacy (UoIR), defined as the system’s correctly captured interactions against thetotal occurred interactions, as the metric to evaluate the reliability and performanceof the activity monitoring mechanism. This metric takes into account not only un-fired or misread interactions caused by faulty sensors but also those circumstancescaused by the pervasive infrastructure. As such it is more accurate to reflect thesystem monitoring performance. Table 6.1 shows the UoIR for different types ofsensors with an overall average UoIR of 96.89%. They conclude that these dataprove the monitoring and acquisition mechanism of the system as being very reli-able.
Sensor type Total interactions Captured interactions Accuracy (%)Contact 624 611 97.92
Tilt 126 119 94.44Pressure 36 32 88.89Sound 18 17 94.44
Table 6.1: Interaction recognition rate as shown in (Chen et al., 2012b).
However, no positive sensor noise has been identified in (Chen et al., 2012b),even though they simulate it in some of their experiments. This is quite reasonable,since the normal state of the sensor represents no interaction. It is very complicatedfrom the technological point of view to change the state of a sensor when no inter-action occurs, so it can be concluded that spontaneous sensor activations are veryrare. If positive sensor noise is registered, it has to be mainly caused by undesiredinteractions that actually occur, even though they are not part of the activity. Thoseundesired interactions can be due to human erratic behaviour (see Definition 8) orinteractions among objects caused by their distribution and casual movements.
Given that according to literature spontaneous sensor activations are rare andinteractions among objects usually occur due to human intervention, it can be con-cluded that sensor positive noise is mainly caused by user erratic behaviour. Thusit has been included in the ADL script rather than in the contextual knowledge file.
ADL scriptThe ADL script defines activity models, behaviour models and sensor positivenoise for a concrete user. It is currently implemented as a plain text file whichhas its own syntax. A parser function has been implemented to parse the file andobtain all the models defined on it.
109
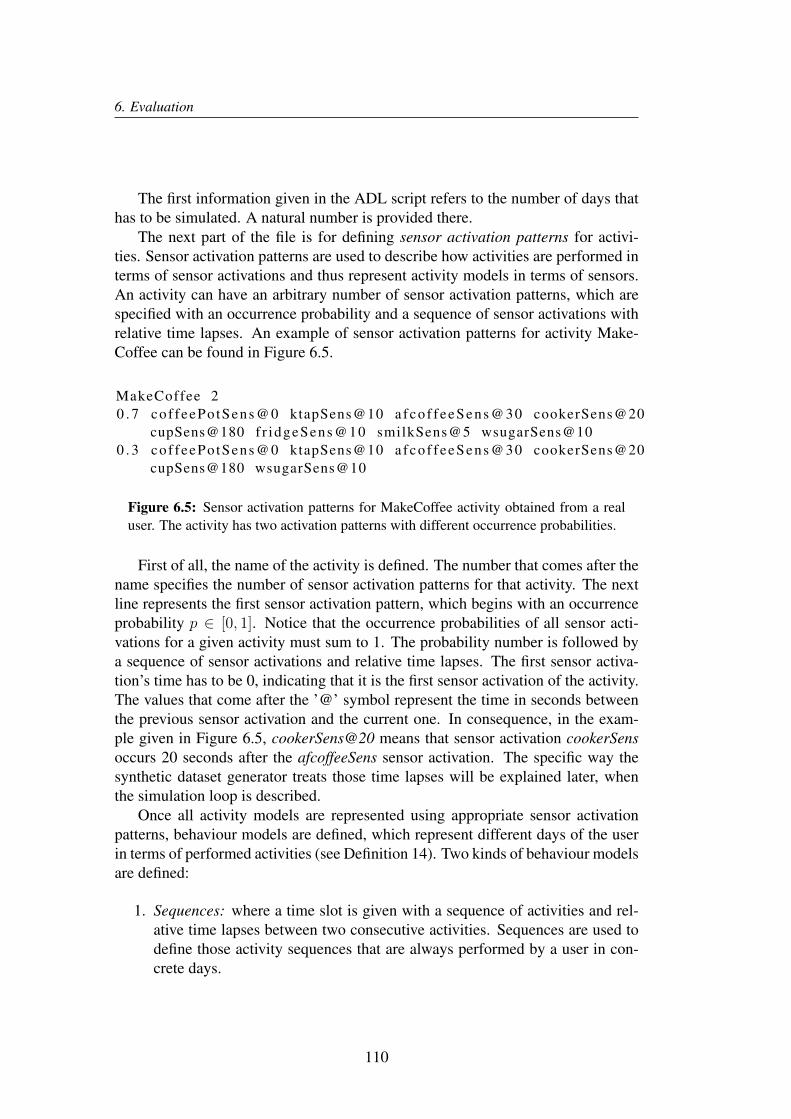
6. Evaluation
The first information given in the ADL script refers to the number of days thathas to be simulated. A natural number is provided there.
The next part of the file is for defining sensor activation patterns for activi-ties. Sensor activation patterns are used to describe how activities are performed interms of sensor activations and thus represent activity models in terms of sensors.An activity can have an arbitrary number of sensor activation patterns, which arespecified with an occurrence probability and a sequence of sensor activations withrelative time lapses. An example of sensor activation patterns for activity Make-Coffee can be found in Figure 6.5.
MakeCoffee 20 . 7 cof feePo tSens@0 ktapSens@10 afco f feeSens@30 cookerSens@20
cupSens@180 fr idgeSens@10 smilkSens@5 wsugarSens@100 . 3 cof feePo tSens@0 ktapSens@10 afco f feeSens@30 cookerSens@20
cupSens@180 wsugarSens@10
Figure 6.5: Sensor activation patterns for MakeCoffee activity obtained from a realuser. The activity has two activation patterns with different occurrence probabilities.
First of all, the name of the activity is defined. The number that comes after thename specifies the number of sensor activation patterns for that activity. The nextline represents the first sensor activation pattern, which begins with an occurrenceprobability p ∈ [0, 1]. Notice that the occurrence probabilities of all sensor acti-vations for a given activity must sum to 1. The probability number is followed bya sequence of sensor activations and relative time lapses. The first sensor activa-tion’s time has to be 0, indicating that it is the first sensor activation of the activity.The values that come after the ’@’ symbol represent the time in seconds betweenthe previous sensor activation and the current one. In consequence, in the exam-ple given in Figure 6.5, cookerSens@20 means that sensor activation cookerSensoccurs 20 seconds after the afcoffeeSens sensor activation. The specific way thesynthetic dataset generator treats those time lapses will be explained later, whenthe simulation loop is described.
Once all activity models are represented using appropriate sensor activationpatterns, behaviour models are defined, which represent different days of the userin terms of performed activities (see Definition 14). Two kinds of behaviour modelsare defined:
1. Sequences: where a time slot is given with a sequence of activities and rel-ative time lapses between two consecutive activities. Sequences are used todefine those activity sequences that are always performed by a user in con-crete days.
110

6.1 Evaluation Methodology
2. Alterations: where a probability value is assigned to an activity to be per-formed in a concrete time slot. Alterations represent a different kind of be-haviour model. Some users might perform an activity regardless of the weekday. For example, a user might watch television in evenings with a certainprobability. Some days the user watches television, but some days does not.It does not depend on the day, but on some other causes (mood, last hourplans and so forth).
Specific week days are not represented in behaviour models. Instead of that,the probability of a concrete list of sequences and alterations is given. A list ofsequences and alterations models a day. So if such a day model occurs 2 days in aweek, i.e. in weekends, the assigned probability will be 2/7 ' 0.29. An exampleis depicted in Figure 6.6. A typical day of a user is described, with an occurrenceprobability of 0.29, since the activity pattern describes a weekend day. In this case,the user reported that (s)he sometimes reads a book in the afternoon. Alterationsallow modelling this kind of behaviour.
Prob 0 . 2 9 4S 9:00−10:00 MakeCoffee@0 BrushTeeth@1800 ReadBook@120S 13:30−14:30 MakePasta@0 BrushTeeth@600S 22:00−23:00 BrushTeeth@0 WashHands@10A 18:00−20:00 ReadBook 0 . 5
Figure 6.6: An example of a behaviour model for a concrete day, which has an occur-rence probability of 0.29 and it is composed of three sequences and an alteration.
As it happens with sensor activation patterns, the occurrence probabilities ofbehaviour models must sum to 1.
The last part of the script is to define sensor positive noise (see Definition 9).As sensor positive noise is mainly caused by user erratic behaviour it is very com-plex to model it accurately. Besides, obtaining those models from user surveysis impossible, since users cannot tell how they interact with objects unpurposely.For those reasons, a simple sensor error model has been adopted which guaranteesnoise generation independently from ongoing activities. A probability value canbe assigned to concrete sensors to get activated in an hour interval using a uniformprobability distribution. For example, sensor cupSens can be assigned an activationprobability of 0.1, which means that each hour, the sensor has a 0.1 probability ofgetting activated.
111

6. Evaluation
Context knowledge fileThe context knowledge file has been described in Section 3.3.1, where an exampleof such a file was provided in Figure 3.2. But sensor missing noise models werenot shown in that example. As sensor missing noise is mainly related to the sensortype, another part is added to the context knowledge file. More concretely, Figure6.7 shows an example of how such error models are implemented for contact andtilt sensors. For each sensor type, a missing probability p ∈ [0, 1] is provided.
” e r r o r m o d e l s ” : {” c o n t a c t ” : {
” prob ” : 0 .0208} ,” t i l t ” : {
” prob ” : 0 .0556} ,. . .
}
Figure 6.7: Example of sensor missing noise models for contact and tilt sensors.
In consequence, the context knowledge file has the information about activities,objects, sensors and sensor missing noise models. It is mandatory for the syntheticdataset generator to keep the coherence between the sensors used in the ADL scriptand in the context knowledge file. The tool itself makes sure that coherence exists.If there is a sensor activation in the ADL script which is not represented in thecontext knowledge file, the synthetic dataset generator raises an error.
Simulation loopUsing the ADL script and the context knowledge file, the synthetic dataset gener-ator creates a CSV file where each sensor activation has an associated timestampand is labelled with an activity name or with the special label None if it is causedby noise. Additionally, activity start and end times are marked in the dataset.
For the purpose of generating realistic sensor activation datasets, the syntheticdataset generator has a simulation loop which has been represented in a flowchartin Figure 6.8. First of all, the simulator fixes the first day to start the simulation.In the current implementation the same day the simulator is launched is used asthe first day. Afterwards, for the selected day, sensor positive noise is generated.For that purpose, the simulator generates a random number per each sensor witha probability greater than zero. If the sensor has to be activated, the simulatorchooses a concrete time inside the current hour using a uniform distribution. Theprocess finishes when the 24 hours of the day have been treated.
112
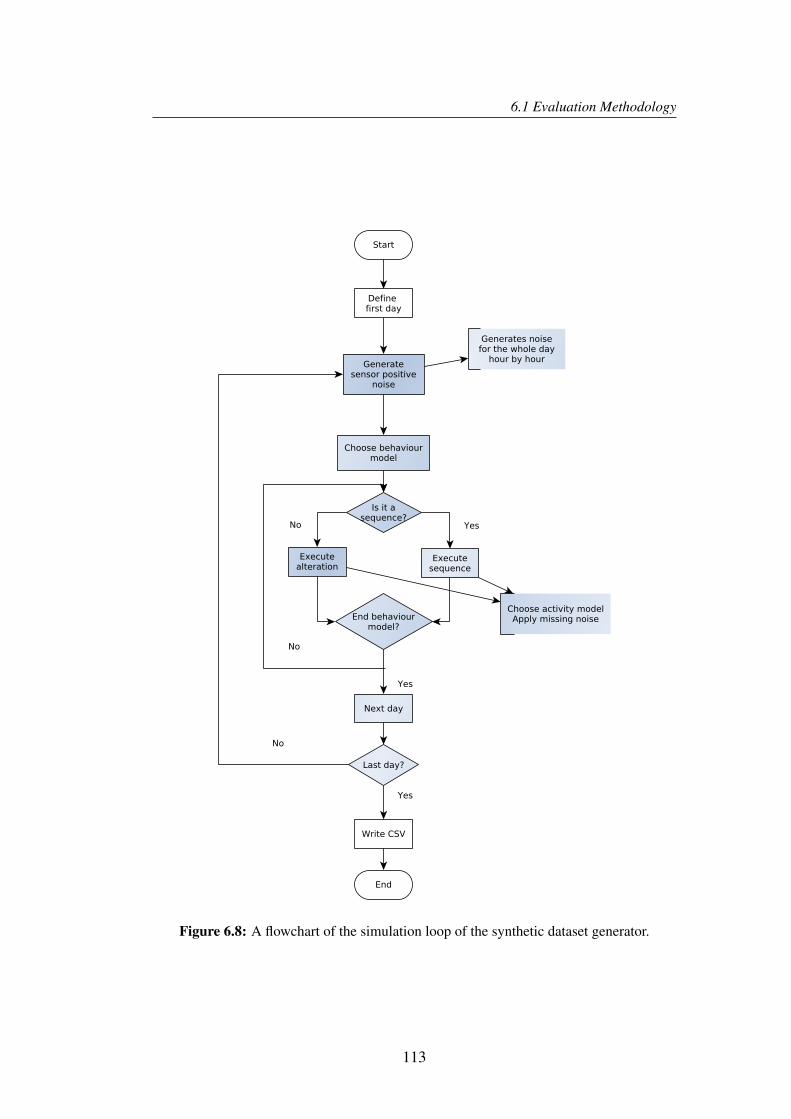
6.1 Evaluation Methodology
Figure 6.8: A flowchart of the simulation loop of the synthetic dataset generator.
113

6. Evaluation
Once sensor positive noise has been generated for the whole day, a behaviourmodel is chosen, taking into account the probabilities of each model. The behaviourmodel is a list of sequences and alterations. The first element of the list is taken.If it is a sequence, the activities of the sequence are executed in the specified timeslot.
Let us show an example of how a sequence is executed by the simulator. As-sume the sequence to be executed is such that
S 9:00−10:00 MakeCoffe@0 WatchTelevis ion@30 BrushTeeth@1800
In that case, the simulator generates a start time for the sequence in the providedtime slot, using a uniform distribution. Afterwards, it picks the first activity (Make-Coffee) and looks for the sensor activation patterns of that activity. The simulatorprobabilistically chooses one of the sensor activation patterns of the activity andexecutes it. While executing the activity itself, two main aspects are taken intoaccount:
1. Time lapses between sensor activations: the time lapses provided in the scriptare used as the mean values of Gaussian distributions, whose standard devi-ation is fixed to a 25% of the mean by default. So the time lapse is generatedprobabilistically using as reference the value given in the script. This makesvarying and realistic time lapses for consecutive sensor activations.
2. Sensor missing noise: before generating the sensor activation, its missingprobability is consulted in the context file. The simulator uses the missingprobability to decide whether to generate the activation.
Similarly to sensor activations, time lapses between activities are treatedthrough Gaussian distributions. At the end of the process, the whole sequence willbe executed, with probabilistically chosen time lapses and sensor missing errors.
To execute an alteration, the simulator uses its occurrence probability. If it hasto be executed, the activity is performed as in sequences. When the behaviourmodel is fully executed, i.e. all the elements of the list have been treated, thesimulator generates the next day and repeats the whole process until the last day isreached. When this happens, the generated dataset is written in a CSV file, whereproperly labelled timestamped sensor activations can be found.
6.1.3 Discussion about the hybrid methodologyThe hybrid methodology explained in Section 6.1.2 is based on the limitations andsolutions identified in the literature (Helal et al., 2011), (Helal et al., 2012), (Okeyoet al., 2012). It has been specially designed to evaluate the EAM learning systemand thus, it has some specific tools to adapt the methodology to the constraints
114

6.1 Evaluation Methodology
of the system. However, the methodology itself, apart from concrete implemen-tations, can be used to evaluate other activity recognition systems and has severaladvantages over the standard methodology explained in the beginning of Section6.1. Let us enumerate and justify the advantages:
1. The hybrid methodology is cost effective, both from economic and time per-spectives: from the economic point of view, the hybrid methodology does notneed any pervasive environment, which can become an important investment.Furthermore, the cost of the experiments is also avoided, such as paying toparticipants, preparations and so on. From the time point of view, savings canbe very important too, specially if a high number of experiments is planned.Preparing, distributing and processing surveys among users needs a variableamount of time, but it is unarguably less than preparing and running realexperiments with humans.
2. A lot of users’ information can be used: as is based on surveys, it is generallyeasy to achieve a great number of users for the tests, in contrast with whathappens using the standard methodology. When running experiments withhumans, finding volunteers is usually very difficult, specially if the experi-ment is long in time.
3. Ethical and legal issues are much softer: as there are no experiments withhuman beings many ethical and legal aspects can be avoided. The only im-portant point to be considered is the anonymity of users regarding the infor-mation they provide in the surveys.
4. Datasets can be generated on demand: using the synthetic dataset genera-tor or any other convenient simulator, arbitrary number of datasets can begenerated as needed.
5. Perfectly labelled datasets can be obtained: the synthetic dataset generatorlabels all sensor activations according to the given script and sensor errormodels. In consequence, the generated dataset is a perfect ground truth. Onthe other hand, when using the standard methodology, dataset annotation isa real issue. As noted by Rashidi and Cook in (Rashidi and Cook, 2011):‘An aspect of activity recognition that has been greatly under-explored is themethod used to annotate sample data that the scientist can use to train theactivity model.’ Several annotation methods have been used by researchers,but all of them have their weaknesses. As a consequence, those datasetsare not perfectly labelled and they can include spurious sensor activations inactivities as ground truth.
115

6. Evaluation
6. Any kind of scenarios can be implemented: the synthetic dataset generatorallows preparing experiments where no sensor noise exists, where only aconcrete kind of sensor noise exists or where conditions are as close as pos-sible to realistic settings. The chance of implementing all those varieties ofscenarios allows researchers to test deeper their activity recognition systems,since they can see the influence of any factor they consider relevant.
The core ideas of the hybrid methodology are using surveys to capture userbehaviour and simulators to generate synthetic data. The concrete implementationsfor the EAM learning system are derived from the constraints and features of thesystem, such as focusing on dense sensing scenarios, single user - single activityscenarios and so forth. However, when constraints are different, different tools canbe used inside the same evaluation methodology.
In this case, the constraints and features of the EAM learning system make fea-sible the usage of surveys and simulators. The dense sensing paradigm for activitymonitoring establishes that user-object interactions are monitored through simplesensor activations, which are used for activity modelling. So sensor activations areboolean valued, making simulation much easier. For example, Persim introducessensor value generation functions, because the simulated sensors are broader andcan produce different values depending on the context.
Another simplification comes from the activity modelling approach, which isbased on action sequences mapped from sensor activations which monitor objects.This means that sensors like thermometers, humidity sensors and so on do not haveto be modelled and simulated for the EAM learning system. Only sensors attachedto objects. The same activity modelling approach makes feasible obtaining accurateactivity models from users, since it is easy for any user to describe what objects areused to perform activities.
The single user - single activity constraint also simplifies the whole evaluationprocess. Firstly, users do not have to provide information about overlapping andconcurrent activities, which is very complicated. Additionally, activity models andbehaviour models are kept simple for simulation. Modelling and simulating con-current activities is a challenge that is avoided in this case.
Finally, time lapses between actions and activities can also be simulated appro-priately, as shown by Okeyo et al. (Okeyo et al., 2012). Users report approximatetime lapses in the surveys and the synthetic dataset generator uses Gaussian randomnumber generators in order to generate user based varying time lapses.
However, there are some disadvantages too and they are mainly related to hu-man behaviour modelling. The first handicap is that modelling user erratic be-haviour is complex. It is very difficult for any user to specify what objects (s)heinteracts with unpurposely or to say how an activity is aborted because anotherthing has to be done. The synthetic dataset generator offers a very straightforward
116
6.2 Evaluation Scenarios, Results and Discussions
way to model this kind of interactions, but it is the researcher who has to assignprobability values to specific sensors without having an appropriate way to modeluser erratic behaviour. The strategy followed in this dissertation is to introducehigh levels of random positive noise to compensate the lack of appropriate models.As it will be shown in Section 6.2, the difference in the number of sensor activa-tions between noiseless and noisy scenarios are greater than 35% in average, whichmeans that the introduced sensor positive noise is more than a third of the originaldataset.
Another disadvantage refers to the information provided in surveys regardingactivity models. Some users are very precise in their answers, but some are not.Activity descriptions given by some users might be discarded due to their vague-ness. But this is not generally a big problem, since obtaining more answers isusually easy. Some other users may omit important details of activities in theiranswers, forgetting for example an object which has been used, hence the preciseway of performing activities cannot always be captured. This is certainly a problemwhile modelling activities, but from the EAM learning evaluation perspective, it isa minor problem. The aim of the EAM learning system is to learn activity modelswhich are represented in the datasets. Whether those datasets are really an accurateversion of an activity is not that important as far as the learning system capturesand models them as they appear.
In consequence, it can be claimed that the hybrid evaluation methodology withits current implementation, is appropriate to evaluate the proposed EAM learningsystem. Its advantages are many and very important, while the disadvantages canbe coped with specific strategies.
6.2 Evaluation Scenarios, Results and DiscussionsUsing the tools and methodologies described in Section 6.1, several evaluation sce-narios have been prepared to test and validate the most important aspects of theEAM learning system. More concretely, three major evaluation scenarios can bedistinguished:
1. SA3 evaluation scenarios: SA3 is a very important part of the whole EAMlearning system, since it is the initialisation step of the clustering algorithm.The performance of SA3 has to be carefully analysed to understand how itworks, its main advantages and strong points as well as its main weaknesses.Remember that the AA algorithm works on the results of SA3, adding -ornot- actions to the initial action clusters detected by SA3. But if SA3 fails atdetecting an activity, AA cannot recover it. Thus, the performance of SA3
in all possible situations is key for the performance of the clustering processand in consequence, the performance of the EAM learning system.
117

6. Evaluation
2. Activity clustering evaluation scenarios: the activity clustering process is thesum of the SA3 and AA algorithms. As a result of the process itself, everysensor activation of a dataset is labelled and several clusters for the definedactivities are obtained. Action clusters’ quality is directly linked to labellingperformance. Remember that those action clusters are finally processed bythe AML algorithm to learn extended activity models, so assessing the per-formance of the clustering process by means of labelled sensor activations isvery important.
3. EAM learning evaluation scenarios: finally, the EAM learning system has tobe evaluated. The system is composed by the sequential use of SA3, AA andAML. Evaluation scenarios have to be set-up in order to validate that theEAM learning system is able to learn extended activity models for differentusers. The results obtained in those evaluation scenarios are the most impor-tant ones, because they give a clear vision of the performance of the wholesystem.
6.2.1 SA3 performance6.2.1.1 Evaluation scenarios and metricsTo assess the performance of SA3 exhaustively, the features of the synthetic datasetgenerator will be used to set up different kinds of scenarios. To prepare thosescenarios, surveys will not be used. In the case of SA3, the main interest is tomeasure the performance in presence of severe constraints, e.g. increasing noise,activities with several variations, varied order of actions, using IAMs that sharethe same actions, activity sequences that are very close in time and so on. AsSA3 alone is not going to be used for real applications, the usage of surveys isnot necessary. SA3 makes sense inside the complete activity clustering algorithm,whose performance will be tested using real users’ inputs.
With this purpose, four scenarios have been prepared:
1. The ideal scenario: SA3 will be tested in ideal conditions, i.e. there is nosensor noise in the dataset.
2. Missing sensor noise scenario: increasing missing error probability is intro-duced to two sensors that are mapped to actions of the IAMs of two activ-ities, to understand how the detection of those activities evolves comparedto noiseless activities. It is also important to see whether the missing noiseaffecting to some activities influence the detection of the others.
3. Positive sensor noise scenario: increasing positive noise is introduced to as-sess the performance of SA3 in presence of positive noise.
118

6.2 Evaluation Scenarios, Results and Discussions
4. Demanding activities scenario: the fourth scenario tests how SA3 performswhen IAMs of several activities share many actions among them.
The base of the first three scenarios is an ADL script prepared to offer somecommon features to all experiments. From the activity models point of view: (i)several variations for every activity, (ii) different probability distributions betweenactivity variations, (iii) varied order of actions in activities and (iv) varied timelapses between consecutive sensor activations. From the behaviour model perspec-tive: (i) different day types, (ii) activities which are very close in time and (iii)combinations of sequences and alterations.
MakeCoffee 20 . 5 mugSens@0 smilkSens@20 microwaveSens@20 afcof feeSens@120
wsugarSens@200 . 5 cupSens@0 ktapSens@10 microwaveSens@15 wsugarSens@90
afco f feeSens@30MakeChocola te 20 . 8 mugSens@0 wmilkSens@20 microwaveSens@20 chocoSens@1200 . 2 cookerSens@0 potSens@5 wmilkSens@20 chocoSens@30
mugSens@200MakePasta 20 . 8 potSens@0 ktapSens@20 cookerSens@30 macaroniSens@120
ftomatoSens@6000 . 2 s p a g h e t t i S e n s @ 0 potSens@20 ktapSens@25 cookerSens@30
baconSens@50 creamSens@600BrushTee th 20 . 7 brusherSens@0 t o o t h p a s t e S e n s @ 5 glassSens@30 btapSens@50 . 3 brusherSens@0 t o o t h p a s t e S e n s @ 5 glassSens@30 btapSens@5
d e n t a l f l o s s S e n s @ 1 5W a t c h T e l e v i s i o n 20 . 5 sofaSens@0 r c o n t r o l S e n s @ 5 tvSens@100 . 5 r c o n t r o l S e n s @ 0 tvSens@5 sofaSens@5WashHands 20 . 8 5 btapSens@0 bsoapSens@15 handcreamSens@400 . 1 5 btapSens@0 bsoapSens@15ReadBook 20 . 9 bookbSens@0 bedSens@10 blampSens@50 . 1 bookaSens@0 sofaSens@10
Figure 6.9: Sensor activation patterns for the defined activities as given to the syntheticdataset generator.
The prepared ADL script reflects all those features and tries to be realistic in
119

6. Evaluation
the definition of the activity and behaviour models. However, notice that at thispoint, realism is not important (the following evaluation scenarios will address re-alism properly). Figure 6.9 shows the defined seven activities of daily living withall the sensor activation patterns and occurrence probabilities. As can be seen inFigure 6.9, the defined activities are: MakeCoffee, MakeChocolate, MakePasta,BrushTeeth, WatchTelevision, WashHands and ReadBook. Different probabilitydistributions can be found for different activities. For example, MakeCoffee has aneven occurrence probability for its two variations (50% - 50%). However, Read-Book is very unbalanced (90% - 10%). Varied order of actions and time lapses canalso be seen in the sensor activation patterns of each activity. Finally, some activ-ities contain a lot of sensor activations - six in the case of MakePasta - whereassome others are very short - WashHands or ReadBook with only two -. In general,activity models reflect all the desired features to test the performance of SA3, asidentified in the paragraph above.
Behaviour models defined for the first three evaluation scenarios are depicted inFigure 6.10. Three typical days are defined with different occurrence probabilities.The first one has three sequences and one alteration. Activity WashHands is veryclose in time to activity BrushTeeth, for example. The second day type tries tosimulate a typical day where the inhabitant spends a short time in home, showinga big time difference between both activity sequences. Finally, the third day typecontains two alterations and three new activity sequences where some activities areagain very close in time.
Prob 0 . 4 3 4S 7:00−7:30 MakeChocolate@0 BrushTeeth@120 WashHands@30S 13:00−13:30 MakePasta@0 MakeCoffee@60 BrushTeeth@1800S 20:00−20:30 MakePasta@0 BrushTeeth@200 ReadBook@150A 18:00−19:30 W a t c h T e l e v i s i o n 0 . 8Prob 0 . 2 8 2S 7:00−7:30 MakeChocolate@0 BrushTeeth@100 WashHands@30S 20:30−21:00 BrushTeeth@0 ReadBook@50Prob 0 . 2 9 5S 9:00−10:00 MakeChocolate@0 WatchTelevis ion@30 BrushTeeth@1800S 13:30−14:30 MakePasta@0 BrushTeeth@150S 22:00−23:00 BrushTeeth@0 WashHands@10A 15:00−16:00 W a t c h T e l e v i s i o n 0 . 7 5A 18:00−20:00 ReadBook 0 . 5
Figure 6.10: Behaviour models for a given user as given to the synthetic dataset gen-erator.
Another common element of the first three evaluation scenarios is the IAMs of
120

6.2 Evaluation Scenarios, Results and Discussions
the activities. All seven activities have the same IAMs alongside the three scenar-ios. Figure 6.11 shows the IAMs used for the experiments. It is very important tokeep the same IAMs in all the experiments, since IAMs aim at describing incom-plete but generic activity models for any user.
The fourth evaluation scenario is different from the other three scenarios. Theidea is to use some activities whose IAMs share the same actions. For that purpose,and in order to keep the realism, the following seven activities have been defined:MakeCoffee, MakeWhippedCream, MakeTiramisu, BrushTeeth, WatchTelevision,WashHands and ReadBook. The first three activities’ IAMs are formed by the samefour actions. More concretely:
IAM( MakeCoffee ) = { h a s C o n t a i n e r , ha sCof fee , h a s F l a v o u r }IAM( MakeWhippedCream ) = { h a s C o n t a i n e r , hasCream , h a s F l a v o u r }IAM( MakeTiramisu ) = { h a s C o n t a i n e r , hasCream , h a s C o f f e e }
The other activities are defined as in the previous scenarios. So the aim ofthis evaluation scenario is to see how SA3 behaves with challenging IAMs. Tofocus only on the pattern recognition performance, no noise is added to this fourthevaluation scenario.
For all four evaluation scenarios the same metrics have been used. The mostimportant aspect for SA3 to be evaluated is whether activities are well detected. Solabels given to sensor activations are not important. Rather, a comparison betweenthe start and end times of the activity detected by SA3 and the real activity has tobe done. Assume AR is the real activity and ASA3 the activity detected by SA3.ASA3 is a correct activity detection if AR contains ASA3 and both activities havethe same label:
tstart(AR) ≤ tstart(ASA3) and tend(ASA3) ≤ tend(AR)
Label(AR) = Label(ASA3)(6.1)
This evaluation criterion is called activity-based evaluation. Using activity-based evaluation criterion, true positives, false positives and false negatives arecalculated for every activity, comparing the output of SA3 with the ground truth.Notice that true negatives are ignored, since they are equivalent to computing thetrue positives for the None activity, which is not interesting for evaluation purposes.
6.2.1.2 ResultsIdeal scenario
To test the performance of SA3 and have a base reference, the ideal scenario hasbeen designed. The ADL script has already been described (Section 6.2.1.1) and itcontains varying order of sensor activations per activity, varied occurrence proba-bility distributions and varied time lapses between sensor activations and activities.
121

6. Evaluation
” MakeCoffee ” : {” t y p e ” : [ ” Cooking ” ] ,” l o c a t i o n ” : [ ” K i t c h e n ” ] ,”IAM” : [ ” h a s C o n t a i n e r ” , ” h a s C o f f e e ” ] ,” d u r a t i o n ” : 360
} ,” MakeChocola te ” : {
” t y p e ” : [ ” Cooking ” ] ,” l o c a t i o n ” : [ ” K i t c h e n ” ] ,”IAM” : [ ” h a s C o n t a i n e r ” , ” h a s C h o c o l a t e ” ] ,” d u r a t i o n ” : 500
} ,” MakePasta ” : {
” t y p e ” : [ ” Cooking ” ] ,” l o c a t i o n ” : [ ” K i t c h e n ” ] ,”IAM” : [ ” h a s P a s t a ” , ” us e Co ok i ng Ap p l i an c e ” ,
” u s e C o o k i n g U t e n s i l ” ] ,” d u r a t i o n ” : 1200
} ,” BrushTee th ” : {
” t y p e ” : [ ” Hygiene ” ] ,” l o c a t i o n ” : [ ” Bathroom ” ] ,”IAM” : [ ” h a s B r u s h e r ” , ” h a s T o o t h p a s t e ” , ” turnOnTap ” ] ,” d u r a t i o n ” : 130
} ,” W a t c h T e l e v i s i o n ” : {
” t y p e ” : [ ” E n t e r t a i n m e n t ” ] ,” l o c a t i o n ” : [ ” Lounge ” ] ,”IAM” : [ ” hasRemoteCon t ro l ” , ” useTV ” ] ,” d u r a t i o n ” : 40
} ,” WashHands ” : {
” t y p e ” : [ ” Hygiene ” ] ,” l o c a t i o n ” : [ ” Bathroom ” ] ,”IAM” : [ ” turnOnTap ” , ” hasSoap ” ] ,” d u r a t i o n ” : 90
} ,” ReadBook ” : {
” t y p e ” : [ ” E n t e r t a i n m e n t ” ] ,” l o c a t i o n ” : [ ” Bedroom ” , ” Lounge ” ] ,”IAM” : [ ” hasBook ” , ” u s e F u r n i t u r e ” ] ,” d u r a t i o n ” : 30
}
Figure 6.11: The IAMs of all seven defined activities for the first three evaluationscenarios.
122

6.2 Evaluation Scenarios, Results and Discussions
The aim of the ideal scenario is to obtain a base reference of the performance ofSA3 in noiseless conditions. Activity-based evaluation is used and true positives,false positives and false negatives are measured.
With the objective of getting reliable results, 130 days have been simulated.More concretely, the sensor activation dataset contains 4093 sensor activations de-scribing a total number of 1027 activity instances. The results are shown in Table6.2. For each activity, the number of instances and the percentages of true positives,false positives and false negatives are given.
Activity Instances True Positives (%) False Positives (%) False Negatives (%)MakeChocolate 130 100 0 0WatchTelevision 103 100 0 0
BrushTeeth 350 100 0 0WashHands 130 100 0 0MakePasta 146 100 0 0ReadBook 112 100 0 0
MakeCoffee 56 100 0 0
Table 6.2: Results of the SA3 algorithm for the ideal scenario.
Table 6.2 shows that the 100% of all activities are properly captured by SA3
under ideal conditions. There are neither false positives nor false negatives. Re-member that the activity-based evaluation does not check for the labels of everysensor activation. The fact that a 100% of all activities are properly captured indi-cates that SA3 gets activity time locations robustly.
Sensor missing noise scenario
For the next experiments, assessing the performance of SA3 under sensor missingerror noise is the objective. In principle, the completion criterion of the activitysequence finding step of SA3 suggests that if a sensor activation which is mappedto one of the IAMs fails, SA3 will fail to detect that activity (see Section 4.1.2 fora detailed explanation). In order to test that suggestion, two of the seven activitieshave been chosen. Sensor activations which are mapped to the IAMs of thoseactivities are given an increasing missing probability, to see how this missing noiseaffects the detection of those activities. The rest of the activities are kept noiseless,to measure the effect of missing noise in other activities. Table 6.3 shows the resultsfor the sensor missing noise scenario. The activities which suffer missing noise aremarked with an asterisk (MakeChocolate and BrushTeeth). Five experiments arerun, each of them simulating 130 days. Sensor missing probabilities are 0.01, 0.02,0.05, 0.07 and 0.1. For each experiment, true positives, false positives and falsenegatives are measured, using the activity-based evaluation criterion.
As can be seen in Table 6.3, the performance of SA3 for the rest of activitiesdoes not vary. It keeps on producing 100% of true positives, while false positives
123

6. Evaluation
Activity Sensor missing probability0.01 0.02 0.05 0.07 0.1
TP FP FN TP FP FN TP FP FN TP FP FN TP FP FNMakeChocolate* 99.2 0 0.8 99.2 0 0.8 94.6 0 5.4 92.3 0 7.7 89.2 0 10.8WatchTelevision 100 0 0 100 0 0 100 0 0 100 0 0 100 0 0
BrushTeeth* 98.9 0 1.1 98.6 0 1.4 96 0 4 93.8 0 6.2 89.4 0 10.6WashHands 100 0 0 100 0 0 100 0 0 100 0 0 100 0 0MakePasta 100 0 0 100 0 0 100 0 0 100 0 0 100 0 0ReadBook 100 0 0 100 0 0 100 0 0 100 0 0 100 0 0
MakeCoffee 100 0 0 100 0 0 100 0 0 100 0 0 100 0 0
Table 6.3: Results of SA3 for the sensor missing noise scenario, where TP: true pos-itives, FP: false positives and FN: false negatives. The activities affected by the noisehave an asterisk.
and negatives are null. However, true positive rate of activities MakeChocolate andBrushTeeth seems to be linearly reducing with sensor missing noise probability.The reduction of true positives generates the appearance of false negatives, sincethose activities that are not detected, are labelled as None. Thus, they are con-sidered false negatives. There is no effect in false positives, but the effect on truepositives is clear, as expected. To make the linearity more clear, Figure 6.12 plotstrue positive rates for both activities for measured sensor missing noise probabili-ties.
Figure 6.12: The true positive percentages of SA3 for activities MakeChocolate andBrushTeeth in presence of increasing sensor missing noise.
Taking into account that noise generation is probabilistically accomplished in
124

6.2 Evaluation Scenarios, Results and Discussions
the synthetic dataset generator, Figure 6.12 is a confirmation of the inverse lin-ear relation between sensor missing noise and SA3 activity detection performance.When missing error increases, activity detection decreases.
Sensor positive noise scenario
To test the sensor positive noise scenario, five experiments have been run. Foreach of the experiments, six sensors are picked up randomly and they are assignedincreasing sensor positive noise probabilities. This strategy allows measuring theperformance of SA3 in presence of positive noise. For each of the experiments130 days are simulated again. To have a reference of the level of noise, sensoractivations in each dataset scale from 5054 to 8850. The noiseless scenario pre-sented 4093 sensor activations, so the noisiest dataset contains around 46% moresensor activations. Table 6.4 shows the results for the sensor positive noise sce-nario. Each experiment is identified by its noise level, where 0.05 means that allrandomly selected sensors have a positive noise probability of 0.05 per hour. Foreach experiment, true positives, false positives and false negatives are depicted.
Activity Sensor positive probability0.05 0.1 0.15 0.2 0.25
TP FP FN TP FP FN TP FP FN TP FP FN TP FP FNMakeChocolate 100 0 0 100 0 0 100 0 0 100 0 0 100 0 0WatchTelevision 100 0 0 100 0 0 99.1 0.9 0 100 0 0 100 0 0
BrushTeeth 100 0 0 100 0 0 100 0 0 100 0 0 100 0 0WashHands 100 0 0 100 0 0 100 0 0 100 0 0 100 0 0MakePasta 100 0 0 100 0 0 100 0 0 100 0 0 99.3 0.7 0ReadBook 100 0 0 100 0 0 97.5 2.5 0 100 0 0 98.1 1.9 0
MakeCoffee 100 0 0 100 0 0 100 0 0 100 0 0 100 0 0
Table 6.4: Results of SA3 for positive sensor noise scenario; TP: true positives; FP:false positives; FN: false negatives
Table 6.4 shows that sensor positive noise affects true positives and false pos-itives. For the first one, a slight reduction for some activities can be seen. For thesecond one, some activities show rates that even being greater than zero, are stillvery low, 2.5% being the highest for those experiments. Exploring the obtaineddata deeper, it was found that in some cases, the false positives are generated over-lapped with the real activity, i.e. a false sensor activation appears close to the realactivity and changes the real time assignments for that activity. This happens whena sensor activation which is mapped to an action in the IAM of a given activity isgenerated by chance very close in time from a real execution of that activity. Theeffect is that the SA3 fails at annotating all real occurrences of a given activity andproduces false positive annotations. This can be seen in activities WatchTelevisionand MakePasta in Table 6.4, for example. To understand the problem better, Fig-
125

6. Evaluation
ure 6.13 shows a representation of the situation. Assuming that dashes representtime lapses without sensor activations, circles represent real sensor activations andcrosses those sensor activations generated due to positive noise, the problem canbe seen clearly. A false sensor activation which is mapped to the IAM of the realactivity AR is generated by chance just before the beginning of the activity. SA3
detects it as part of the activity and thus, the start time of the activity is not detectedcorrectly. The consequence is that a real activity is not detected and a false positiveactivity is generated.
- - x - - x - o o - - o - -
AR
ASA3
Figure 6.13: A representative situation encountered in positive sensor noise scenarios.Dashes represent time intervals without sensor activations, circles represent real sensoractivations and crosses represent false sensor activations. While AR stands for realactivity, ASA3 stands for the activity detected by SA3.
In some other cases, false positives do not affect the annotation of correct ac-tivities (look at ReadBook for 0.15 and 0.25 noise levels, where all instances ofthe activity were perfectly annotated). In those cases, the problem is that the IAMof activity ReadBook is composed by two actions: hasBook and useFurniture. Assensor activations for two sensors monitoring furniture and books were chosen ran-domly for noise generation, it turned out that both activations were given in suchcircumstances that they were detected as activities. However, they do not affectany other activity detection. This situation is represented in Figure 6.14. The realactivity is correctly detected by SA3, but another false activity is also detected dueto the false generation of two sensor activations that are mapped to actions in anIAM.
- - x - x - - - - - o - o - - o o - -
AR
ASA3ASA3
Figure 6.14: Another representative situation encountered in positive sensor noisescenarios. Dashes represent time intervals without sensor activations, circles representreal sensor activations and crosses represent false sensor activations. While AR standsfor real activity, ASA3 stands for the activity detected by SA3.
126

6.2 Evaluation Scenarios, Results and Discussions
Demanding activities scenario
The final scenario aims at testing SA3 under demanding activities. As it has beenexplained in Section 6.2.1.1, demanding activities are those which share many com-mon actions in their IAMs. It can be thought that as SA3 uses a pattern recogni-tion algorithm where some specific domain-based criteria are applied, its perfor-mance could be affected by very similar IAMs. Those conditions are simulated us-ing seven activities, where MakeCoffee, MakeTiramisu and MakeWhippedCreamshare the same four actions in their IAMs. Remember that even being very similar,they are still different and unique. For this special scenario, a total number of 1262activity instances have been produced. No sensor noise has been produced for theexperiment, since the objective is to see the effect of demanding activities. Theobtained results can be seen in Table 6.5.
Activity Instances True positives (%) False positives (%) False negatives (%)MakeCoffee 222 100 0 0
MakeTiramisu 120 100 0 0MakeWhippedCream 72 100 0 0
WashHands 150 100 0 0BrushTeeth 420 100 0 0ReadBook 127 100 0 0
WatchTelevision 151 100 0 0
Table 6.5: Results of SA3 for demanding activity models scenario.
Results show that SA3 is not affected by the similarity of IAMs, as long as theyare unique. True positives are 100% for all activities, whereas false positives andnegatives are zero. The situation is exactly the same as in the ideal scenario. Noticethat assuming unique IAMs for each activity is very reasonable, since if there aretwo equal IAMs for two activities, those two activities should actually be one.
6.2.1.3 Discussion about SA3
The results depicted in Section 6.2.1.2 show that SA3 can handle varying orderof actions in activity performance without any problem. All four set-ups containdifferent activation patterns, where actions are executed in different orders. Thiscan be seen in Figure 6.9: every activity has different sensor activation sequenceswith varying orders. As the ideal scenario shows (Table 6.2), the true positive rateof the algorithm for every activity is 100% and neither false positives nor negativesare observed. Notice that sensor activation sequences used for each activity containmany actions which are not used to define any of the IAMs, but the algorithm stillperforms perfectly when detecting activities. Hence, SA3 can also handle non-considered actions.
127

6. Evaluation
As far as noisy scenarios regard, results suggest that missing sensor activationscannot be properly handled by the algorithm, when those activations are linked toactions that are used to define IAMs, i.e. if a sensor activation which is mapped toone of the actions used to define the IAM of a concrete activity fails, that activitycannot be detected by SA3. The non-captured activities are proportional to themissing activation probability of those actions, as shown in Figure 6.12. This isdue to the completeness criterion used in the second step of SA3, as explained inSection 4.1, which demands the presence of all actions in the IAM of an activityto consider an action sequence a valid activity. However, missing sensor noiseonly affects true positive and false negative rates of the activities which are faultilyregistered by sensors. False positive rates keep behaving as the ideal scenario.Moreover, a non-detection of an activity does not have any other effect on the otheractivities. Following this reasoning, a good way to minimise the impact of sensormissing noise is to monitor key objects for IAMs using robust sensors such ascontact sensors.
Independently from such robust monitoring strategies, it is reasonable to thinkwhether algorithmic solutions to mitigate sensor missing noise can be adopted. Thecompletion criterion is very restrictive in that sense, but it is also very reasonable,since if not, distinguishing real activity executions from those ones generated bypositive noise would be very difficult, specially considering the low number of ac-tions used in the IAMs (see Table 6.22). Further approaches have not been analysedin this dissertation, because the low level of missing sensor noise in real environ-ments makes the detection rates very good. However, some ideas are suggested inChapter 7 for their future development.
For sensor positive noise, the scenario is different. SA3 has shown to performreliably even with high levels of noise. For example, even having certain sensorswith faulty activation probabilities of 0.25 per hour, average true positive rate overall activities is 99.9%. Simultaneously, false positive rates are still very low, con-cretely 0.3% in average, while false negative rates are 0. False positive activitydetections are due to random occurrences of actions in time instants which makethem compatible with the duration criterion of an activity. The probability of hav-ing such false positives increases as the noise level increases and the number ofactions in IAMs decreases. However, the results obtained with the highest level ofnoise of the experiments show how robust SA3 is in such scenarios.
Finally, a test involving challenging activity models has shown that as far asactivity models are unique, SA3 does not have any problem detecting them. Aver-age true positive rate for all activities is 100% and false positive and negative ratesare 0, as can be seen in Table 6.5. Remember that the experiments for challengingor demanding activity models were performed without any noise. So the obtainedresults suggest that the performance is exactly the same as for the ideal scenario.
In conclusion, SA3 has been tested for all the desired requirements listed in Sec-
128

6.2 Evaluation Scenarios, Results and Discussions
tion 6.2.1.1. From the activity models point of view: (i) several variations for everyactivity, (ii) different probability distributions between activity variations, (iii) var-ied order of actions in activities and (iv) varied time lapses between consecutivesensor activations. From the behaviour model perspective: (i) different day types,(ii) activities which are very close in time and (iii) combinations of sequences andalterations. All those features were present in all four evaluation scenarios, whereideal conditions, noisy scenarios and demanding activity models were also tested.The obtained results suggest that SA3 is a very reliable tool to detect activity execu-tions. It does not correctly label all the sensor activations, but it accurately capturesactivity time locations. Thus, it can be concluded that SA3 serves as a initialisationstep for an activity clustering process.
6.2.2 Activity clustering performance6.2.2.1 Evaluation scenarios and metricsTesting the activity clustering algorithm, i.e. SA3 + AA, requires the usage of thehybrid evaluation methodology. The activity clustering algorithm can be seen as anactivity annotator algorithm which labels each sensor activation with an activity la-bel. Notice that activity annotation and recognition are not the same thing. Activityrecognition is performed online, while sensor activations are being generated. Butactivity annotation happens offline, once all sensor activations have already beenproduced. So annotating is typically easier than recognising, since it does not havetime restrictions.
Contrary to the evaluation of SA3, realism is a key issue when testing activityclustering. That is why the hybrid evaluation methodology is used to set up twoevaluation scenarios: the ideal and the complete scenario. The first one does notcontain any sensor noise, which makes easier the annotation process. The com-plete scenario is closer to reality since it has sensor noise, which makes annotat-ing more demanding. Sensor missing noise errors are obtained from the statisticsgiven in (Chen et al., 2012b) and shown in Table 6.1. Noise error models have beenspecified depending on sensor type. For example, pressure sensors have a missingprobability of around 10%. This means that whenever the activity script containsa pressure sensor activation, the synthetic dataset generator will perform it with a90% of probability. On the other hand, to model sensor positive noise, the strategyintroduced in Section 6.1.3 has been followed, i.e. to introduce high levels of ran-dom positive noise to compensate the lack of appropriate models for user erraticbehaviour. For all experiments, 6 sensors are randomly chosen to assign them apositive noise probability of 0.05 per hour. And other five sensors are also chosenrandomly to assign them a 0.1 probability.
ADL surveys have been circulated among people from DeustoTech - Univer-
129

6. Evaluation
sity of Deusto. The target users are researchers, students and professors, with agesranging from 20 to 60 years old. The circulated ADL survey can be found in theweb1. A total number of 12 answers have been received, but 4 of them were dis-carded because they provided too vague information to model properly the activityand behaviour models. Thus, 8 real users are finally used for the experiments.
It is worth to remember that the AA algorithm has three different time metrics(see Section 4.2). To test which of them is better, all the generated datasets aretreated three times, using a different time metric for each experiment.
So the experimental set-up designed consists of:
1. 8 real users.
2. 7 activities of daily living labelled as MakeCoffee, MakeChocolate,MakePasta, BrushTeeth, WatchTelevision, WashHands and ReadBook.
3. 2 scenarios: the ideal scenario and the complete scenario.
4. 3 executions of the activity clustering process, using the three different timemetrics.
The datasets used for the experiments carried out to evaluate activity clusteringare available in the web2. As a summary, 16 different datasets can be found there, 2per user: the datasets for the ideal and the complete scenarios. All datasets simulate60 days according to the behaviour models provided by each user.
The evaluation criterion in this case, is the so called action-based evaluation:compare the labels given by the clustering process to every sensor activation/actionwith the ground truth produced by the synthetic dataset generator tool by means oftrue positives, false positives and false negatives (true negatives are ignored again,because they represent actions which have been correctly labelled as None). Thisevaluation criterion assesses the performance of the clustering process as an activityannotator.
6.2.2.2 ResultsIdeal scenario
The 8 datasets generated from the ADL surveys for the ideal scenario contain 2128sensor activations in average. For each of the experiments, the average true posi-tives, false positives and false negatives are depicted per activity. The averages arecalculated over the 8 users. A comparison between the actions labelled by SA3 andAA is depicted in the results. Remember that those results cannot be compared to
1http://goo.gl/etCNyi2http://www.morelab.deusto.es/pub/synthetic adl datasets/
130

6.2 Evaluation Scenarios, Results and Discussions
the results shown for SA3 evaluation (Section 6.2.1.2), since the evaluation crite-ria are different. Table 6.6 shows the results when simple time distance is used inAA (Equation 4.8). Similarly, Table 6.7 depicts the results when normalised timedistance is applied (see Equation 4.9). Finally, Table 6.8 shows how the clusteringprocess performs when the dynamic centre normalised time distance is used for theprevious activity (see Equation 4.10) and the normalised time distance for the nextactivity.
Activity Clustering ResultsTrue Positive (%) False Positive (%) False Negative (%)SA3 AA SA3 AA SA3 AA
MakeChocolate 55.05 98.67 0 0 44.95 1.33WatchTelevision 75.12 100 0 0 24.88 0
BrushTeeth 90.91 96.8 0 0 9.1 3.2WashHands 74.88 92.93 0.07 6.94 25.05 0.13MakePasta 55.74 99.73 0 0 44.26 0.27ReadBook 89.08 100 0 0 10.91 0
MakeCoffee 62.63 99.06 0 0.1 37.37 0.84
Table 6.6: Average results for 8 users of the clustering process for the ideal scenariousing simple time distance.
Activity Clustering ResultsTrue Positive (%) False Positive (%) False Negative (%)SA3 AA SA3 AA SA3 AA
MakeChocolate 55.05 98.67 0 0 44.95 1.33WatchTelevision 75.12 100 0 0 24.88 0
BrushTeeth 90.91 96.57 0 0 9.1 3.43WashHands 74.88 92.32 0.07 7.55 25.05 0.13MakePasta 55.74 99.8 0 0 44.26 0.2ReadBook 89.08 100 0 0 10.91 0
MakeCoffee 62.63 99.16 0 0 37.37 0.84
Table 6.7: Average results for 8 users of the clustering process for the ideal scenariousing normalised time distance.
To get a clearer comparison between three time metrics, Table 6.9 shows theaverage precision and recall for each time metric. The average is calculated over allactivities. As it can be seen, both precision and recall are very high for all three timemetrics. However, the combination of dynamic centre normalised and normalisedtime distances yields the best results, specially for precision. The difference forrecall is not very significant.
Complete scenario
The 8 datasets for the complete scenario are obtained from the same ADL surveysand scripts. But for these datasets, sensor error models are applied. As a result,
131

6. Evaluation
Activity Clustering ResultsTrue Positive (%) False Positive (%) False Negative (%)SA3 AA SA3 AA SA3 AA
MakeChocolate 55.05 98.67 0 0 44.95 1.33WatchTelevision 75.12 100 0 0 24.88 0
BrushTeeth 90.91 98.27 0 0 9.1 1.73WashHands 74.88 96.69 0.07 3.03 25.05 0.27MakePasta 55.74 99.78 0 0.02 44.26 0.2ReadBook 89.08 100 0 0 10.91 0
MakeCoffee 62.63 99.09 0 0 37.37 0.91
Table 6.8: Average results for 8 users of the clustering process for the ideal scenariousing dynamic normalised time distance for previous and normalised time distance fornext activity.
Avg. Precision Avg. Recallt1 98.98% 99.17%t2 98.91% 99.14%t3 99.56% 99.36%
Table 6.9: Comparative between the usage of the three time metrics for the clusteringprocess in the ideal scenario. t1 refers to simple time distance, t2 to normalised timedistance and t3 to using dynamic centre normalised time distance for previous activityand normalised time distance for next activity.
datasets have an average of 2942 sensor activations. Compared to the ideal sce-nario, those datasets have 38.25% more sensor activations in average, which givesa clear idea of the high level of sensor positive noise. Notice that this incrementcomes even having missing errors, which are applied to every sensor activation.The combination of missing and positive noise gives datasets containing 38.25%more sensor activations, thus sensor positive noise is very high.
Results are shown in the same manner as for the ideal scenario. As such, Table6.10 shows the results when using simple time distance, Table 6.11 when usingnormalised time distance and finally, Table 6.12 when combining dynamic centrenormalised and normalised time distances. Once again, a summary of the perfor-mance of the three variants is depicted in Table 6.13, where average precision andrecall are shown.
6.2.2.3 Discussion about the clustering processThe first discussion point for the clustering process is the difference in performanceof the three time metrics. Tables 6.9 and 6.13 show a clear comparative, bothin the ideal and complete scenario. It can be seen that the difference betweensimple time distance and normalised time distance is not significant. But usingdynamic centre normalised time distance for previous activity and normalised time
132

6.2 Evaluation Scenarios, Results and Discussions
Activity Clustering ResultsTrue Positive (%) False Positive (%) False Negative (%)SA3 AA SA3 AA SA3 AA
MakeChocolate 54.47 96.6 0.52 1.2 45.01 2.2WatchTelevision 71.13 100 0 0 28.87 0
BrushTeeth 90.95 96.64 0.25 0.35 8.8 3.01WashHands 75.74 91.96 0.51 6.66 24.75 1.38MakePasta 53.48 97.07 0.73 2.64 45.79 0.29ReadBook 82.56 94.37 0.39 0.29 17.05 5.33
MakeCoffee 58.53 97.91 0.9 1.91 40.57 0.17
Table 6.10: Average results for 8 users of the clustering process for the completescenario using simple time distance.
Activity Clustering ResultsTrue Positive (%) False Positive (%) False Negative (%)SA3 AA SA3 AA SA3 AA
MakeChocolate 54.47 96.6 0.52 1.18 45.01 2.22WatchTelevision 71.13 100 0 0 28.87 0
BrushTeeth 90.95 96.37 0.25 0.35 8.8 3.28WashHands 75.74 91.27 0.51 7.33 24.75 1.39MakePasta 53.48 97.19 0.73 2.64 45.79 0.17ReadBook 82.56 94.37 0.39 0.29 17.05 5.33
MakeCoffee 58.53 98.07 0.9 1.76 40.57 0.17
Table 6.11: Average results for 8 users of the clustering process for the completescenario using normalised time distance.
Activity Clustering ResultsTrue Positive (%) False Positive (%) False Negative (%)SA3 AA SA3 AA SA3 AA
MakeChocolate 54.47 96.69 0.52 1.09 45.01 2.22WatchTelevision 71.13 100 0 0 28.87 0
BrushTeeth 90.95 98.08 0.25 0.35 8.8 1.57WashHands 75.74 95.6 0.51 2.81 24.75 1.59MakePasta 53.48 96.58 0.73 2.83 45.79 0.59ReadBook 82.56 94.37 0.39 0.29 17.05 5.33
MakeCoffee 58.53 97.65 0.9 1.59 40.57 0.75
Table 6.12: Average results for 8 users of the clustering process for the completescenario using dynamic normalised time distance for previous and normalised timedistance for next activity.
133

6. Evaluation
Avg. Precision Avg. Recallt1 98.1% 98.19%t2 98.03% 98.17%t3 98.7% 98.25%
Table 6.13: Comparative between the usage of the three time metrics for the clusteringprocess in the complete scenario. t1 refers to simple time distance, t2 to normalisedtime distance and t3 to using dynamic center normalised time distance for previousactivity and normalised time distance for next activity.
distance for next activity, yields better results. Notice that even though differencesare not very big, the higher precision of the third approach is due to lower falsepositive rates. For some activities, the first two approaches produce even highertrue positives, but at the expense of generating more false positives. Recall valuesare very similar for all three time metrics in both scenarios. So results suggestthat as far as sensor activation labelling regards, combining the dynamic centrenormalised time distance and normalised time distance is the best option.
The small differences between three time approaches shown in Tables 6.9 and6.13 mean that for outsider actions, the candidate function solves the vast majorityof the cases (Equation 4.6). For those outsiders that cannot be classified by thecandidate function, the three time metrics play a role. But their effect is minimisedbecause of the low number of such outsiders.
For the rest of the discussion about the clustering process, the third time ap-proach will be considered, since it seems to be the best approach. Tables 6.7 and6.11 show the good performance of the activity clustering process using the con-text knowledge. True positive rate is very high for all activities. The lowest rateis found for activity ReadBook in the complete scenario: 94.37%. This is due totwo factors: (i) the missing sensor probability for pressure sensors is around 10%and (ii) the IAM for ReadBook has the action useFurniture (IAM(ReadBook) ={hasBook, useFurniture}); all the objects that are mapped to action useFurni-ture are monitored by pressure sensors, for example, sofa, chair or bed. Whenpressure sensors fail, SA3 cannot detect the activity and hence, true positive ratedecreases. Notice that this happens only because the missing action is part of theIAM of the activity. All other activities, even in the complete scenario, show truepositive rates higher than 95%, reaching in some cases 100% rates. Those highrates are accompanied with very low rates of false positives and negatives. For ex-ample, the highest false positive rate has been found for activity MakePasta in thecomplete scenario with 2.83%.
It is worth to point out the behaviour of the clustering process, divided intotwo steps. Tables 6.7 and 6.11 show how SA3 labels correctly varying number ofsensor activations. This number depends on the relation between the number of
134

6.2 Evaluation Scenarios, Results and Discussions
sensor activations performed by a user and the number of actions in the IAMs. Forinstance, if the IAM of activity A has two actions and a concrete user performs inaverage 9 actions for that activity, SA3 will only label correctly those actions thatlie inside the two actions of the IAM. It can be seen that for low action numberactivities like BrushTeeth and ReadBook, SA3 shows quite a high true positive rateand low false negative rate. However, activities like MakeChocolate or MakePastahave a true positive rate below 60% and high false negative rates. In any case, inthe second step run byAA, true positives rise, false negatives get very low and falsepositives slightly increase, giving similar results for all activities. This means thatSA3 discovers activities’ time locations very accurately and AA treats insider andoutsider actions properly to achieve very good rates building on the results of SA3.
As a conclusion, the clustering process depends on the results of SA3, its ini-tialisation step. As such, the clustering process is sensitive to sensor missing noisewhich affects to actions used in IAMs. However, the complete scenario shows sen-sor missing noise levels extracted from real deployments and results are very good.Notice that experiments are carried out for eight real users, each of them executingactivities in many different ways. The high true positive rates and low false positiveand negative rates obtained in such realistic set-ups suggest that the activity clus-tering process annotates very accurately each sensor activation and thus, action,giving as a result robust action clusters, even in noisy scenarios. Remember thatwhile sensor missing noise models have been extracted from real deployments,sensor positive noise has been exaggerated in order to provide very challengingconditions. Even in those conditions, many of the built action clusters will corre-spond to real activity models, and some others will contain spurious actions, due tofalse positive annotations. But looking at the low rate of false positives, it can beconcluded that correct action clusters will be dominant.
6.2.3 EAM learning performance6.2.3.1 Evaluation scenarios and metricsFor the evaluation of the EAM learning system, the same datasets used and de-scribed for the evaluation of the activity clustering system have been used (seeSection 6.2.2.1). The idea is to run the AML algorithm on the clusters extractedby the activity clustering process, using the same activity datasets for the same 8real users. In consequence, the evaluation scenarios are exactly the same, but theyare summarised for convenience:
1. 8 real users.
2. 7 activities of daily living labelled as MakeCoffee, MakeChocolate,MakePasta, BrushTeeth, WatchTelevision, WashHands and ReadBook.
135

6. Evaluation
3. 2 scenarios: the ideal scenario and the complete scenario.
4. 3 executions of the activity clustering process, using the three different timemetrics. AML is subsequently executed on all three clustering processesindependently.
The chosen evaluation criterion to assess the performance of the EAM learningsystem is named model-based evaluation. It compares the learnt activity modelswith the models provided by users in their answers to the survey. Activity modelsare compared action-wise, i.e. if a user states that activity A is performed by actionsequences S1 and S2, those sequences constitute the ground truth. The sequencesresulting from the learning process (clustering process + AML) are compared withthis ground truth. In this example, it should be checked whether the learning pro-cess learns S1 and S2 for activity A. The indicators used to show the performanceof the EAM learning system are: learnt correct action sequences, learnt spuriousaction sequences and learnt total action sequences.
Using the described evaluation scenarios and the model-based evaluation crite-rion, the EAM learning system’s capability of learning activity models is measured.For all experiments, IAMs have been defined previously and they are always thesame. Indeed, the IAMs defined in Figure 6.11 are the ones used for those experi-ments. This is important, since IAMs aim at being generic and incomplete activitymodels for every user. Using those IAMs, the EAM learning system should beable to learn extended activity models for the defined activities, and those modelsshould be the same as the models provided by the users in their surveys. Such re-sults would prove the main claim of this dissertation, i.e. complete and specialisedactivity models can be learnt from user generated data for previously defined in-complete activity models.
6.2.3.2 ResultsIdeal scenario
The datasets used for those experiments have already been described in Section6.2.2.1. Remember that the ideal scenario does not contain any sensor noise. AMLis run, taking as inputs the results of the clustering process generated in Section6.2.2.2. As a reference, using a laptop computer equipped with an Intel i5 pro-cessor with 4 cores running at 1.6 GHz and 8 GB of RAM memory, the completeEAM learning system needs around 30 seconds to process such datasets. The ob-tained results are summarised in the following tables: Table 6.14 shows the resultsfor the ideal scenario using the simple time distance in the clustering process; anal-ogously, Tables 6.15 and 6.16 show the results in the same scenario, but applying
136

6.2 Evaluation Scenarios, Results and Discussions
Activity Learning Results Average Number of PatternsCorrect Models Spurious Models Total Models
MakeChocolate 1 0 1 1WatchTelevision 1.14 0 1.14 1.14
BrushTeeth 1.25 0.31 1.56 1.25WashHands 1 0.37 1.37 1MakePasta 2 0 2 2ReadBook 1.12 0 1.12 1.12
MakeCoffee 1.71 0.24 1.71 1.71
Table 6.14: Average results for 8 users of the EAM learning process for the idealscenario, using the simple time distance in the clustering process.
Activity Learning Results Average Number of PatternsCorrect Models Spurious Models Total Models
MakeChocolate 1 0 1 1WatchTelevision 1.14 0 1.14 1.14
BrushTeeth 1.25 0.31 1.56 1.25WashHands 1 0.37 1.37 1MakePasta 2 0 2 2ReadBook 1.12 0 1.12 1.12
MakeCoffee 1.71 0 1.71 1.71
Table 6.15: Average results for 8 users of the EAM learning process for the idealscenario, using the normalised time distance in the clustering process.
Activity Learning Results Average Number of PatternsCorrect Models Spurious Models Total Models
MakeChocolate 1 0 1 1WatchTelevision 1.14 0 1.14 1.14
BrushTeeth 1.25 0.47 1.72 1.25WashHands 1 0.25 1.25 1MakePasta 2 0 2 2ReadBook 1.12 0 1.12 1.12
MakeCoffee 1.71 0 1.71 1.71
Table 6.16: Average results for 8 users of the EAM learning process for the idealscenario, using dynamic centre normalised time distance for the previous activity andnormalised time distance for the next activity.
137

6. Evaluation
the normalised time distance in the first and the combination of the dynamic centrenormalised distance and normalised distance in the second.
All the tables contain the same information. Tables are divided in two maincolumns: (i) Learning Results, where the results of the EAM learning system aredepicted using the indicators of correct, spurious and total models, and (ii) AverageNumber of Patterns, which shows the average number of different ways to performthe activity by all users. For instance, if a user executes two different action se-quences for an activity, and another user executes only one action sequence for thesame activity, the average number of patterns for that activity is (2 + 1)/2 = 1.5.Average number of patterns is obtained from the surveys to users and constitutesthe ground truth for the learning system. On the other hand, learning results aredepicted in the first three columns, providing three average values per activity: thecorrect models learnt by the system, the spurious models learnt and the total num-ber of learnt models, which is the sum of the previous two values. Remember thatthose values are average values for all 8 users.
Finally, a comparative table is shown in Table 6.17. Average precision andrecall are calculated for all activities, using different time distances in the clusteringprocess.
Avg. Precision Avg. Recallt1 91.46% 100%t2 93.25% 100%t3 93.25% 100%
Table 6.17: Comparative of applying AML to the clustering process with the threetime metrics in the ideal scenario. t1 refers to simple time distance, t2 to normalisedtime distance and t3 to using dynamic centre normalised time distance for previousactivity and normalised time distance for next activity.
Complete scenario
In the following experiments, AML has been run in the complete scenario, wheresensor missing and positive noise are applied. Table 6.18 shows the results usingsimple time distance in the clustering process. Table 6.19 does the same using thenormalised time distance. Finally, Table 6.20 presents the obtained numbers usingdynamic centre normalised time distance for the previous activity and normalisedtime distance for the next activity. All three tables show the correct, spurious andtotal models, alongside the average number of patterns per each activity.
As for the ideal scenario, Table 6.21 provides a summary of the performance ofeach time distance by means of average precision and recall.
138

6.2 Evaluation Scenarios, Results and Discussions
Activity Learning Results Average Number of PatternsCorrect Models Spurious Models Total Models
MakeChocolate 1 1.2 2.2 1WatchTelevision 1.14 0.89 2.03 1.14
BrushTeeth 1.25 1.17 2.42 1.25WashHands 1 0.75 1.75 1MakePasta 2 1.12 2.12 2ReadBook 1.12 0.14 1.26 1.12
MakeCoffee 1.71 1.34 3.05 1.71
Table 6.18: Average results for 8 users of the EAM learning process for the completescenario, using simple time distance in the clustering process.
Activity Learning Results Average Number of PatternsCorrect Models Spurious Models Total Models
MakeChocolate 1 1.2 2.2 1WatchTelevision 1.14 0.89 2.03 1.14
BrushTeeth 1.25 1.17 2.42 1.25WashHands 1 0.75 1.75 1MakePasta 2 1.12 3.12 2ReadBook 1.12 0.14 1.26 1.12
MakeCoffee 1.71 1.59 3.3 1.71
Table 6.19: Average results for 8 users of the EAM learning process for the completescenario, using normalised time distance in the clustering process.
Activity Learning Results Average Number of PatternsCorrect Models Spurious Models Total Models
MakeChocolate 1 1.2 2.2 1WatchTelevision 1.14 0.89 2.03 1.14
BrushTeeth 1.25 1.17 2.42 1.25WashHands 1 0.75 1.75 1MakePasta 2 1.12 3.12 2ReadBook 1.12 0.14 1.26 1.12
MakeCoffee 1.71 1.71 3.42 1.71
Table 6.20: Average results for 8 users of the EAM learning process for the completescenario, using dynamic centre normalised time distance for the previous activity andnormalised time distance for the next activity.
Avg. Precision Avg. Recallt1 59.87% 100%t2 59.28% 100%t3 59.02% 100%
Table 6.21: Comparative of applying AML to the clustering process with the threetime metrics in the complete scenario. t1 refers to simple time distance, t2 to nor-malised time distance and t3 to using dynamic centre normalised time distance forprevious activity and normalised time distance for next activity.
139

6. Evaluation
As the complete scenario is the most realistic one, yet another table is shownto see how many actions are learnt by the EAM learning system compared to thenumber of actions in the IAMs of each activity. Table 6.22 shows such results usingthe combination of dynamic centre normalised and normalised time distance, sinceresults for all three time distances are very similar. Once again, average numbersover 8 users are provided. This table is useful to see how far are the IAMs of someactivities from real executions by users.
Activity Actions in IAM Average Number of Learnt ActionsMakeChocolate 2 5.6WatchTelevision 2 2.55
BrushTeeth 3 3.5WashHands 2 2.79MakePasta 3 6.63ReadBook 2 2.37
MakeCoffee 2 6.36
Table 6.22: Average number of learnt actions compared to the number of actions in theIAMs of defined activities. Results are obtained for 8 users in the complete scenario,using dynamic centre normalised distance for the previous activity and normalisedtime distance for the next activity.
6.2.3.3 Discussion about the EAM learning systemThe most important objective of this dissertation is to evaluate the performance ofthe complete EAM learning system, which is composed by the activity clusteringprocess (SA3 + AA) and the AML algorithm. For that purpose, AML is runusing as inputs the clusters obtained in the clustering process. It has to be seenwhether extended activity models for every user are properly learnt by the system.To answer this question, the results obtained in Section 6.2.3.2 are analysed.
First of all, it is important to remember that the objective of the EAM learningsystem is to learn properly all activity models really executed by a user. To checkwhether the learning system accomplishes this objective, the learnt correct modelsshould be equal to the average number of patterns per activity, i.e. if a user hasexecuted one single action sequence to perform an activity, the learning systemshould learn correctly one action sequence (remember that the results provided inthe tables show the average values). The equality between correctly learnt modelsand the average number of patterns is obtained in all the experiments, regardlessof the applied noise and used time metrics for the clustering process. Hence, theEAM learning system is shown to correctly learn the 100% of the varying ways ofperforming an activity by all users.
Having three time approaches for the clustering process places the question ofwhat the effect of those time approaches is in the EAM learning system. Table 6.17
140

6.2 Evaluation Scenarios, Results and Discussions
shows a comparison for the ideal scenario and Table 6.21 for the complete one.While the third time approach is better for the ideal scenario, the same does nothappen in the complete one. However, the difference in average precision for thecomplete scenario is not significant, ranging from 59.87% to 59.02%. Notice thatas performed different activity models per activity are not high - the highest valueis two for MakePasta -, learning an additional activity model for a user makes quitea big difference in the calculated rates. That is why the slight differences in averageprecision between three time approaches cannot be considered significant.
The obtained results suggest that AML behaves very robustly regardless thetime approach used. Even though the initial number of clusters for time approachesone and two are more than for time approach three, AML is able to detect outliersand fuse them to get always very similar results. So from the point of view ofthe EAM learning system, it is not easy to say which time approach is the bestone. Nevertheless, taking into account that time approach three behaves better forclustering and for EAM learning in the ideal scenario, it seems natural to choose itas the reference time approach. From now on, the discussion will be focused thuson the third time approach.
The desired results for correctly learnt activity models come with the learningof some spurious models, specially in the complete scenario. Learning some spu-rious or false models was expected, since the objective of the learning algorithm isto avoid removing any activity pattern that has been actually performed by the user.It is preferable to get false action sequences than removing any activity pattern thathas been really performed. For that purpose, the learning process is conservativewhen removing and fusing activity patterns. Even with this conservative approach,it has been observed during experiments that the learning process can reduce clus-ters provided by the clustering process from 17 to 3 in some cases, thus removingmany false action sequences and keeping the 100% of correct action patterns.
In addition to the low number of spurious activity models learnt, it has to besaid that those false models are usually easy to discard for an expert for two rea-sons: (i) they have very low occurrence frequencies and (ii) they usually containactions that are not generally executed for those activities. For example, for activityMakeChocolate, actions like hasBacon have been seen. Notice that those actionscannot be discarded by AA during the clustering process, since they are type andlocation compatible with MakeChocolate. Such an action is produced by sensorpositive noise, which can be observed in the slight false positive increments fromideal scenario to complete scenario in Tables 6.7 and 6.11. Either those actions areinsiders that are not properly aggregated by the compatibility function (Equation4.5), or outsiders that fulfil the candidate function (Equation 4.6).
Adding more knowledge to the context knowledge would allow discarding suchactions in AA. For example, if object types state that meat (bacon or sausages) isonly used to prepare meals, the algorithm could infer that bacon cannot be used
141

6. Evaluation
for activity MakeChocolate, which is a sub-class of activity MakeDrink and dis-junct of activity MakeMeal. But this brings the initial knowledge balance problem:how much knowledge should be initially provided to such a learning system? Theanswer depends a lot on the domain. If obtaining and modelling knowledge for aconcrete domain is easy, adding knowledge is a good idea. However, obtaining andmodelling knowledge can be very expensive in certain domains. The approach pre-sented in this dissertation follows the philosophy of minimising initial knowledgeas much as possible, presenting the worst case scenario. We believe that the resultsshown in Section 6.2.3.2 support this decision.
Concluding, the EAM learning system is able to learn complete and specialisedactivity models for different users in realistic scenarios. As demanded in Chapter1, all the activity variations executed by a user are learnt. But this is achievedby means of conservative approaches that also generate false activity models. Ithas been observed that such spurious models are not generally a problem for anexpert. It has to be said though, that there are some other spurious models that arevery difficult to discard even by an expert. For those cases, adding some spuriousmodels to the knowledge base should not be a big problem, since if the user doesnot perform that activity model, the recognition system will not detect it.
The EAM learning system is a solid step towards dynamic and personalisedknowledge-based activity models. If the learning approach was applied periodi-cally, the learnt activity models would be dynamic. Whenever a user performs anactivity differently, the learning system will be able to capture that variation andprovide the corresponding activity model. The experiments shown in this disserta-tion are based on batch learning, but adapting the learning system for incrementallearning is only an implementation issue. On the other hand, the EAM learningsystem also supports personalised activity models. It has been shown that eightreal users’ personalised ways of performing activities are properly modelled usingthe same IAMs. Using previous incomplete knowledge about activities, completeand specialised activity models in terms of executed actions are shown to be learntwith user generated data.
6.3 Summary and ConclusionsAfter analysing the most used evaluation methodology in the community of activ-ity recognition (Section 6.1), it has been concluded that using such methodology toproperly assess the performance of the EAM learning system is not feasible. In con-sequence a novel evaluation methodology has been described in this chapter (Sec-tion 6.1.2), following the trend of several researchers who have already analysedthe benefits of using simulated environments for activity recognition. Combininga synthetic dataset generator tool with surveys to real users, realistic experimental
142

6.3 Summary and Conclusions
set-ups can be prepared, introducing varying time lapses and sensor noise. One ofthe most important novelties of the presented evaluation methodology is to providea tool to model human behaviour reliably using specially designed surveys.
To test all the relevant parts of the EAM learning system, several experimentsor evaluation scenarios have been prepared in Section 6.2. Those experiments havebeen prepared using the hybrid evaluation methodology. The performance of everyalgorithm has been measured based on well defined metrics.
The results obtained for all the experiments for SA3, the complete clusteringprocess and for the EAM learning system can be considered very good, even havinghigh levels of sensor noise - remember that the complete scenario contains morethan 38% more sensor activations due to sensor noise than the ideal scenario -. For instance, experiments for SA3 show how accurate is the algorithm whendetecting time locations of performed activities. It cannot label correctly everyaction of a dataset, but it can very accurately distinguish between action sequencesdescribing different activities. This initialisation, which is specially robust to sensorpositive noise, is the key step to make sure that all action sequences will be properlycaptured in the end of the clustering process. The obtained results show that theAAalgorithm analyses every action suitably after the initialisation step, using all theknowledge represented in the context knowledge file. Even though false positivescan be generated at this step, the vast majority of actions are properly tagged, takingadvantage of action type, location and the defined three time metrics. This can beseen in the high precision and recall values obtained in both scenarios. For example,precision is above 97% in the complete scenario using the third time approach,whereas recall is above 98% (see Table 6.13).
The combined results of both algorithms, SA3 and AA, allow capturing effec-tively all the action sequences which have been executed by a user for a concrete ac-tivity. At this stage, the most important thing is that the action clusters obtained foreach activity, actually contain the real action sequences executed by users. How-ever, there are also spurious variations of those real sequences due to sensor noiseand clustering errors. Based on those action clustersAML implements a similarity-based outlier detection algorithm. Such algorithm encodes action sequence infor-mation using the Jaccard coefficient and limits the problem of finding spuriousmodels to detect outliers in the similarity space. Using conservative approaches toavoid removing any real action sequence, a statistical outlier detection approach isrun. The approach works well because spurious action sequences are very similarto real action sequences. More concretely, as spurious action sequences are slightvariations of real action sequences, their similarity values are higher than expectedfor the similarity distribution of a given activity. AML establishes a threshold us-ing statistics that are robust to outliers. This threshold separates those similarityvalues that can be considered normal from anomalous or outlier similarity values.The result is that all real activity models are correctly learned, while the number of
143

6. Evaluation
spurious or false models is acceptable.
144

Alea jacta est.Gaius Julius Caesar
CHAPTER
7Conclusions and Future
Work
A general description of the main results and contributions presented inthis dissertation is given in this chapter. To finalise the dissertation, theobjectives posed in Chapter 1 are reviewed to see at what extent theyhave been achieved. Furthermore, a summary of all contributions done
during the research work is provided, alongside a list of publications which provehow this work has been validated with the research community. The chapter endswith some ideas for future research in the area of activity modelling and some finalremarks.
The rest of this chapter is divided in the following sections: Section 7.1 presentsa summary of work and the conclusions obtained from the research work and re-sults. Section 7.2 lists all the contributions done through the dissertation. Section7.3 shows how the objectives and goal of the dissertation are achieved, thus val-idating the hypothesis with the obtained results. Section 7.4 reviews all relevantscientific publications related to the development of the dissertation. Section 7.5provides some ideas for future research, extracted from the limitations and weak-nesses of the EAM learning system. Section 7.6 makes some final remarks.
7.1 Summary of Work and ConclusionsActivity modelling is a very important step for activity recognition. It provides themodels which will be used in the recognition step and thus encode the exact way
145

7. Conclusions and Future Work
an activity is performed. There are several desirable features for activity modellingapproaches, including:
1. Provide generic activity models which can be applied to any user.
2. Provide personalised activity models which capture the special way an activ-ity is performed by a concrete user.
3. Provide tools to make activity models evolve in time as users vary their be-haviour.
4. Provide human-understandable models, to make the usage of such modelseasy for the development of other applications for intelligent systems.
With the objective of achieving an activity modelling process which fulfils allthe listed requirements, a general framework was presented in Chapter 1, repre-sented in Figure 1.1. As a summary, the process starts with an expert who providesgeneric activity models. Those models are used in the learning system to identifyactivities in sensor datasets and learn personalised models. The expert reviews theobtained personalised models and includes them in the knowledge base. Expertintervention is convenient because the activity model learning approach will oftenlead to errors. Repeating those steps continuously in time, dynamic activity modelsare obtained.
One of the main gaps encountered to achieve the proposed activity modellingprocess was to learn new actions for already known activities. So the objective ofthe dissertation was to fill in that gap, combining knowledge-based activity modelswith data-driven learning techniques. The models learnt would be personal activitymodels with specific action sequences per user obtained from the sensor datasetsgenerated while performing activities.
This dissertation has introduced a novel approach to acquire complete and spe-cialised knowledge-based activity models through data-driven learning techniques.The approach makes possible using generic but incomplete knowledge-based activ-ity models to learn specialised and complete models, which represent the personalway an activity is performed by a concrete user. Central to the approach is thetwo-step clustering process (Chapter 4), which has the singularity of using previ-ous knowledge in order to find action clusters and label them with the appropriateactivity class. Those clusters are then treated by the learning algorithm in order toacquire extended activity models for different users (Chapter 5).
The results as shown in Chapter 6 indicate that the approach works well inrealistic experimental set-ups, with real users’ inputs, realistic time intervals foractivity sequences and sensor noise. It has to be stressed that all the varying waysof performing an activity by a user are correctly captured by the approach for all
146

7.1 Summary of Work and Conclusions
users and scenarios. Specialised and complete models for initial generic incom-plete activity models can be properly learnt automatically with minimum previouscontext knowledge. In consequence, the presented approach can be used to makeknowledge-based activity models evolve with user behavioural data, offering thetools to solve two of the problems of knowledge-driven approaches: the genericand static nature of activity models.
So it can be concluded that the extended activity model learning system de-veloped in this dissertation has served to validate the hypothesis posed in Section1.2. It has been shown that personalised activity models can be learnt accurately.Accuracy, in this case, refers to the ability to learn all the actions executed by auser to perform a concrete activity. The 100% of correct activities achieved in theexperiments backs the statement.
It is convenient though to remember the scope of the presented learning system.First of all, it works only for the single user - single activity scenario, so interwovenactivities are not addressed. The problem of learning new activities is not addressedin this dissertation either. Finally, the approach has been designed for the densesensing activity monitoring paradigm. In principle, the learning system should beable to work on top of any monitoring approach as far as concrete actions can beobtained.
The evaluation methodology used relies on simulation tools and user surveys(Chapter 6). There are some limitations, since users might omit some details intheir answers and the synthetic dataset generator cannot accurately simulate all thepossible situations. For example, simulating user erratic behaviour is a challenge.That is why the level of noise introduced in the experiments is so high (around 38%in average). The idea is to introduce high levels of positive sensor noise, muchhigher than those seen in real pervasive environments (see (Chen et al., 2012a)).The results obtained using this evaluation methodology can be deemed as rele-vant because it combines: (i) real users’ inputs regarding activities, objects, timelapses and locations, (ii) realistic sensor error models obtained from real environ-ments and (iii) high levels of positive sensor noise to properly cover the effectsof user erratic behaviour. The most important thing is to be able to capture whatusers describe in their surveys, showing that new actions can be learnt and differentways of performing the same activity can be identified and properly modelled. Theevaluation methodology designed and described in Section 6.1.2 guarantees this.Nevertheless, a final validation on real data would be desirable. Despite the tech-nical difficulties of running such experiments, we are currently working on it. Thefirst idea is to run some experiments with actors and pre-defined scripts in order toobtain some variations for a given list of activities. Afterwards, contacting researchgroups that own pervasive environments has to be considered, with the objective ofrunning large scale experiments.
147

7. Conclusions and Future Work
In conclusion, the EAM learning system designed and developed throughoutthis dissertation, is composed by the activity clustering process (Chapter 4) andthe Activity Model Learner (AML, Chapter 5). The activity clustering process isdivided into two steps: the initialisation of the clustering, provided by the Seman-tic Activity Annotation Algorithm (SA3, Section 4.1) and the Action Aggregatoralgorithm (AA, Section 4.2). This learning system has been designed to cope withthe problem of learning personalised activity models in terms of actions, usinggeneric but incomplete activity models provided by a domain expert. Such a prob-lem has been identified in the literature as one of the gaps to achieve an activitymodelling process to obtain dynamic and personalised models. Once results arecarefully analysed, it can be claimed that the EAM learning system accomplishesits objectives, being able to learn extended activity models for several users. Sothe EAM learning system is an important step towards a dynamic and personalisedknowledge-driven activity modelling process.
7.2 ContributionsA summary of the contributions explained in this dissertation is presented in thissection:
• The design architecture for learning extended activity models was describedin Chapter 3. This contribution addresses objective 2 and the design part ofobjective 3 (Section 1.2).
– It offers a convenient modular architecture which separates key con-cepts and allows the implementation of different approaches.
– Communication between different modules is carried out by meansof files which follow standard formats, such as JavaScript Notation(JSON) and Comma Separated Values (CSV).
– It uses a light-weight knowledge representation and processing frame-work based on JavaScript Object Notation (JSON) technology, present-ing compact and easy-to-extend structures for activities, objects, loca-tions and sensors, to achieve environment independence.
• A novel two-step activity clustering process which uses previous knowledgein unlabelled sensor datasets is explained in Chapter 4. This contributiontackles part of objective 3, defined in Section 1.2.
– The clustering algorithms found in the literature allow including priorknowledge in form of constraints or some points’ memberships, lim-iting substantially the kind of knowledge that can be provided to the
148

7.2 Contributions
algorithms. However, the approach presented in this dissertation spec-ifies prior knowledge as incomplete models, allowing higher levels ofexpressiveness.
– It allows grouping data in clusters and recognises each cluster’s labelusing previously given incomplete models. Even though it is an un-supervised approach, the activity clustering algorithm provides the se-mantic labels of each cluster. No previous work shows clustering ap-proaches with labelling capacities, due to the way prior knowledge isrepresented and incorporated.
– It works on the activity space, which is composed by location, type andtime axes, providing a meaningful low-dimensional space for efficientaction clustering.
– Typical clustering algorithms define distance functions in the corre-sponding space to group points that are close to each other. Defin-ing continuous distance metrics in the activity space is not possible, soheuristic functions which exploit domain knowledge and time distancemetrics are used to process actions. Heuristic functions process the in-formation provided by discontinuous location and type axes, whereastime distance metrics work on the continuous axis of time. The ac-tivity clustering approach is a good example of how clustering can beperformed in discontinuous spaces.
• An activity model learning algorithm was presented in Chapter 5, which usesaction clusters that define activities to extract activity models. With this con-tribution, objective 3 is completed (Section 1.2)
– It has a flexible filtering step to pre-process the action clusters in formof action sequences found by the activity clustering algorithm.
– It implements a model similarity-based outlier detection statistical al-gorithm to detect spurious action sequences. The main novelty of theapproach is to interpret outliers as pairs of a valid action sequenceand its spurious variation. Hence, the algorithm fuses both action se-quences, taking into account the occurrence frequencies of both actionsequences.
– It outputs complete and specialised activity models for a concrete useralongside with their occurrence frequencies.
• A hybrid evaluation methodology was designed and implemented to properlyevaluate the learning system in Chapter 6. The methodology can also be usedfor further activity modelling and recognition approaches. This contributionaddresses objective 4 (Section 1.2).
149

7. Conclusions and Future Work
– Following previous work on simulation for pervasive environments, thehybrid evaluation methodology offers a realistic and cost-efficient wayto evaluate activity modelling and recognition approaches.
– It addresses one of the major problems of simulation-based approaches,which is the problem of modelling human behaviour. Surveys to usersare designed in order to capture how activities are performed by themand model effectively their behaviour.
– Using surveys, it allows obtaining the information of any number ofusers minimising time-cost.
– It provides a special simulator to generate sensor datasets, namely thesynthetic dataset generator. Its usage allows generating on demand anykind of dataset representing different activity executions. The syntheticdataset generator allows modelling two kinds of sensor errors usingprobabilistic models: sensor positive and missing errors. The reviewedprevious work does not address the simulation of sensor noise for densesensing monitoring scenarios.
– Combining surveys and simulation tools, any kind of experiment canbe prepared generating as much data as needed, in contrast with stan-dard methodologies, where experiments are very expensive and testingdifferent situations is very difficult.
7.3 Hypothesis and Objective ValidationIn the beginning of this dissertation, concretely in Section 1.2, a hypothesis wasposed, which stated the following:
Hypothesis. Using domain experts’ previous knowledge as generic but incompleteactivity models and data-driven learning techniques on user generated data, it ispossible to learn accurately new actions to obtain personalised activity models forevery user.
In order to be able to validate this hypothesis, a goal was also defined, which isalso shown below for convenience:
150

7.3 Hypothesis and Objective Validation
Goal. To design and implement a learning system that uses generic but incompleteactivity models to analyse unlabelled activity sensor datasets and acquire person-alised models which contain new actions.
To achieve such a goal, some specific and measurable objectives were identifiedin Section 1.2. It is the moment now to go through all those objectives and see howthey have been addressed in this dissertation.
1. To study the current state of the art on knowledge- and data-driven activ-ity modelling and recognition. Chapter 2 provides a deep and critical studyof the current state of the art, analysing activity monitoring, modelling andrecognition. Special attention has been paid to activity modelling, presentingdata-driven, knowledge-driven and even hybrid approaches and identifyingtheir advantages and disadvantages.
2. To choose a knowledge representation formalism and design proper struc-tures to represent domain experts’ knowledge. This objective has been ad-dressed in Chapter 3. A light-weight knowledge representation formalismhas been chosen, namely the JavaScript Object Notation framework (JSON).Using JSON, the context knowledge file shows structures to represent activ-ities, objects and sensors.
3. To design and implement a multiple step learning algorithm which uses previ-ous knowledge and user generated data to obtain personalised activity mod-els. The design of the learning system and its rationale have been presentedin Chapter 3. Moreover, implementation details of the system architecturehave been provided, showing samples of the used files. The modules iden-tified in the architecture, which constitute the multiple step learning processhave been explained in the following chapters: Chapter 4 introduces the ac-tivity clustering process and Chapter 5 describes in detail the activity modellearner algorithm. All the implementation work has been done using Python2.7.
4. To identify the evaluation methodology for the learning system which betteraddresses the requirements of the system. Chapter 6 analyses the so calledstandard methodology for activity modelling and recognition. It is concludedthat using the standard methodology is not feasible to properly validate thelearning system. In consequence, a novel hybrid methodology is developedand presented in Section 6.1.2, which combines real users’ inputs and a sim-ulator.
151

7. Conclusions and Future Work
5. To validate the obtained results quantitatively, with the objective of capturingthe 100% of real activity models performed by a user. The results of severalexperiments are presented in Chapter 6. It has been shown that the 100% ofaction sequences executed by several users to perform the same seven activ-ities are captured and modelled (Section 6.2.3.2). These results are obtainedin scenarios which contain high levels of sensor noise.
For the sake of clarity, Figure 7.1 provides a diagram where the objectives, thecontributions that are related to these objectives and their location in this disserta-tion are shown.
1 Study stateof the art
2 Choose knowledgerepresentation
3 Design & implement
learning algorithm
4 Identify evaluationmethodology
5 Validate approachwith results
Architecture forthe learning system
Activity clusteringprocess
Activity modellearning algorithm
Hybrid evaluationmethdology
Chapter 2
Chapter 3
Chapter 4
Chapter 5
Chapter 6
Objective Contribution Location
Figure 7.1: The relation of the objectives defined in Section 1.2, the contributionslisted in Section 7.2 and their location in this dissertation.
It can be claimed that all the objectives set in Section 1.2 have been accom-plished in this dissertation. As a consequence of this, the goal of the dissertationhas been achieved. The EAM learning system which is composed by the activityclustering process (Chapter 4) and the activity model learner (Chapter 5) has beenimplemented and tested. The learning system uses generic but incomplete activity
152

7.4 Relevant Publications
models and unlabelled sensor datasets. As a result of the learning process, person-alised activity models have been shown to be learnt, capturing personal ways ofperforming activities in terms of actions.
Finally, through the accomplishment of the objectives and the goal, the hypoth-esis of this dissertation has been validated. The results obtained in Chapter 6 provethat it is possible to learn accurately new actions to obtain personalised activitymodels for every user, combining generic but incomplete activity models and data-driven learning techniques. Section 6.2.3.2 shows the results that prove that all theactions executed by several users to perform different activities are accurately cap-tured and modelled. Several spurious models are also learnt in the process, but thenumber of such models is assumable as discussed in Section 6.2.3.3.
7.4 Relevant PublicationsThe contributions of this dissertation have been presented to the scientific commu-nity in a series of international forums, such as journals and conferences.
7.4.1 International JCR journalsThe current version of the EAM learning system was published in the followingjournal:
• Gorka Azkune, Aitor Almeida, Diego Lopez-de-Ipina, Liming Chen. Ex-tending Knowledge-Driven Activity Models through Data-Driven Learn-ing Techniques. Expert Systems with Applications, vol. 42, no. 6,pp. 3115-3128. Pergamon-Elsevier Science LTD. United States. DOI:10.1016/j.eswa.2014.11.063, ISSN 0957-4174, JCR Impact Factor (2013):1.965, Q1. April 2015.
The formalisation of the hybrid evaluation methodology and the syntheticdataset generator was published in the following journal:
• Gorka Azkune, Aitor Almeida, Diego Lopez-de-Ipina, Liming Chen. Com-bining Users’ Activity Survey and Simulators to Evaluate Human ActivityRecognition Systems. MDPI Sensors. vol. 14, no. 4, pp. 8192-8213, DOI:10.3390/s150408192, ISSN 1424-8220, JCR Impact Factor (2013): 2.048,Q1. Basel, Switzerland, April 2015.
An up-to-date survey of the state of the art in activity modelling can be foundin the following journal:
153

7. Conclusions and Future Work
• Gorka Azkune, Aitor Almeida, Diego Lopez-de-Ipina, Liming Chen. LatestTrends in Human Activity Modelling. Dyna. JCR Impact Factor (2013):0.200, Q4. Accepted, to be published.
The preliminary work that led to the research developed in this dissertation waspublished in the following journal:
• Gorka Azkune, Pablo Orduna, Xabier Laiseca, Eduardo Castillejo, DiegoLopez-de-Ipina, Miguel Loitxate and Jon Azpiazu. Semantic Frameworkfor Social Robot Self-Configuration. MDPI Sensors. vol. 13, no. 6, pp.7004-7020, DOI: 10.3390/s130607004, ISSN 1424-8220, JCR Impact Factor(2013): 2.048, Q1. Basel, Switzerland, May 2013.
7.4.2 International conferencesThe Semantic Activity Annotation Algorithm (SA3) was presented in the followingconference:
• Gorka Azkune, Aitor Almeida, Diego Lopez-de-Ipina, Liming Chen. AKnowledge-Driven Tool for Automatic Activity Dataset Annotation. Pro-ceedings of the 7th International Conference Intelligent Systems IEEEIS’2014, September 24-26, 2014, Warsaw, Poland, Volume 1: MathematicalFoundations, Theory, Analyses. ISBN: 978-3-319-11312-8, pp. 593-604.
The hybrid evaluation methodology was presented in the following conference:
• Gorka Azkune, Aitor Almeida, Diego Lopez-de-Ipina, Liming Chen. A Hy-brid Evaluation Methodology for Human Activity Recognition Systems. InProceedings of 8th International Conference on Ubiquitous Computing &Ambient Intelligence, UCAmI 2014, December 2-4, 2014, Belfast, UnitedKingdom. ISBN: 978-2-319-13101-6, pp. 92-99.
Preliminary work which led to the research done in this dissertation was pre-sented in the following conferences:
• Gorka Azkune, Pablo Orduna, Xabier Laiseca, Diego Lopez-de-Ipina,Miguel Loitxate. Semantic Based Self-configuration Approach for SocialRobots in Health Care Environments. Ambient Assisted Living and HomeCare. Proceedings of 4th International Workconference on Ambient AssistedLiving, IWAAL 2012, Vitoria-Gasteiz, Spain, December 3-5, 2012. ISBN:978-3-642-35394-9, pp. 354-361.
154

7.5 Future Work
• Gorka Azkune, Mikel Astiz, Urko Esnaola, Unai Antero, Jose Vicente So-gorb, Antonio Alonso. A Navigation System for a High-Speed ProfessionalCleaning Robot. Towards Autonomous Robotic Systems. Proceedings of12th Annual Conference, TAROS 2011, Sheffield, UK, August 31 - Septem-ber 2, 2011. ISBN: 978-3-642-23231-2, pp. 24-35.
7.5 Future WorkInspired by the weaknesses and limitations of the research presented in this disser-tation, the following further research lines have been identified:
7.5.1 Integrate the EAM learning system in a complete activitymodelling processAs has been said in Section 7.1, the EAM learning system is a solid step towardsa dynamic and personalised activity modelling system. However, there are someother pieces to complete the jigsaw puzzle. For example, Chen et al. developed alearning approach to learn descriptive properties of knowledge-based activity mod-els in (Chen et al., 2014). They also presented a mechanism to discover new activ-ities.
Combining action and descriptive properties learning schemes with new activ-ity discovery mechanisms in the same activity modelling system is still a challenge.The building blocks are already there, but their integration is not straightforwardand it is beyond a technical issue.
Some of the posed challenges are:
1. Defining forgetting strategies for activity models that are not being executedany more by a concrete user. As a user changes her way to perform activities,models which populate the knowledge base but are not being observed shouldbe given a special treatment.
2. Integrating the approaches to learn action and descriptive properties. Bothaspects, actions and descriptive properties, are tightly coupled in an activ-ity model. However, there might be the case where the same activity modelin terms of actions, produces different patterns of descriptive properties. Aproper modelling design has to be set up in order to attain the complex rela-tions between actions and descriptive properties.
3. Obtaining generic models from discovered activities. As the most naturalway to discover new activities is observing personal data, discovered activi-ties will be by definition personalised models. The question of how generic
155

7. Conclusions and Future Work
models can be extracted from those discovered personalised models is veryimportant.
7.5.2 Discard meaningless user-object interactionsThe monitoring and modelling approach relies on user-object interactions moni-tored by simple sensors. However, not all the interactions registered by the sensorsare meaningful, in the sense that they are not always directed to the execution of aconcrete activity. This phenomenon has been identified in the dissertation as beingmainly caused by user erratic behaviour. The consequence of meaningless user-object interactions is the appearance of false positive actions within activity modelsin the learning process. Thus, research on sensor-action mapping steps to distin-guish between meaningful and meaningless user-object interactions is needed.
A possible approach could be to add a sensor-action mapping step, where onlythose sensor activations that last for a concrete amount of time are mapped to ac-tions. Such a processing step would require monitoring sensor state changes frominteraction state to no-interaction state and measuring state changes time lapses.Another criterion which can be used for sensor-action mapping step is to monitorhow many times a user interacts with an object in a time interval, even though thoseinteractions are short. Combining both criteria, only meaningful object interactionscould be identified. Such an approach would allow applying the same EAM learn-ing algorithm to probably obtain better results, reducing the false positive rate oflearnt activity models.
7.5.3 Single user - concurrent activitiesAnother promising future research direction is to extend the learning approach tothe single user - concurrent activities scenario. People do not usually perform ac-tivities sequentially, but they tend to interleave activities, such as washing disheswhile preparing pasta. This will have an impact in the clustering process, demand-ing more complex pattern recognition and time management. For instance, SA3
uses the single user - single activity constraint for its pattern recognition algorithm,and AA defines insider and outsider actions based on the same constraint. If con-current activities are considered, the clustering process should be changed. How-ever, some key ideas could be maintained.
A first idea to tackle such scenarios is to invert the sequence of the clusteringprocess. In the single user - single activity scenario, activities are sequentiallyordered in the time axis, which makes the usage of SA3 as the initialisation stepconvenient. But if activities are not sequentially arranged in time, initialisationis more complicated. It seems that defining more generic metrics in the activityspace, considering time, location and type information, would generate some initial
156

7.5 Future Work
clusters formed by several activities per cluster. Once those clusters are obtained,initial activity models could be used to try to analyse each cluster and see howmany activity combinations in terms of initial activity models can be found. Thisway, several action sequences per activity could be found, to afterwards apply theActivity Model Learner as described in this dissertation.
7.5.4 Perception for complex actionsDense sensing monitoring cannot capture all the actions performed by a user withan object. For example, it is not the same to grab a bottle or to open a bottle. Butto distinguish between those two actions with the same object is very complicated- if not impossible - following the dense sensing monitoring approach.
However, activity models would greatly benefit from the usage of more com-plex actions, because descriptions would be more accurate. Being able to use ac-tions such as opensBottle, poursBottleContent, closesBottle and so on would be abig step forward. It seems that vision-based monitoring is the best option for thisperception level. Looking at the recent expectation around head mounted deviceswith cameras like Google Glass1, making research on their benefits for activitymonitoring would be very interesting. Head mounted devices allow receiving in-formation about the concrete actions a user is executing, because people tend tolook to objects which are being manipulated. Besides, privacy problems are mit-igated, because head mounted devices do not record the user externally and theydo not have to be necessarily working continuously. Another advantage of suchdevices is the interaction capabilities they offer. In the case of Google Glass, voiceinteraction, gestures and a small screen are available, which can help developingmany applications around activity recognition systems.
Taking into account the recent progress made in artificial vision and the ex-pected proliferation of head mounted devices, vision-based activity monitoringmay become a very good option for activity recognition systems.
7.5.5 Learn temporal relations between actionsActivity models, as defined and used in this dissertation, do not provide any de-pendency information between actions. They are simple sequences of actions.Nevertheless, when performing an activity, actions have usually some temporaldependencies which can offer new information for recognition. For example, whenpreparing fish, fish should not be introduced in the oven until the oven has beenswitched on. There are some constraints and dependencies between actions thatare not currently modelled.
1https://www.google.com/glass/start/
157

7. Conclusions and Future Work
Thus, the first step is to design modelling approaches to properly address thedependencies and constraints between actions. The second step is to learn thosedependencies from user generated data. A learning solution might be the follow-ing: once action clusters defining activities have been extracted, the order in whichactions have been executed can be analysed. Using frequency analysis and someother learning techniques, it may be feasible to discover and learn temporal rela-tions between actions.
A final research question regarding action dependencies is how this informa-tion can be used for activity recognition. It has to be analysed whether modellingdependencies offers any advantage in the recognition step.
7.6 Final RemarksWith this dissertation we have tried to make significant contributions in the area ofactivity modelling and recognition, which is deemed to play an important role inhuman-centred intelligent systems. We hope that the presented contributions andidentified future research lines will serve to other researchers as a guide to deliverfurther contributions and thus keep advancing in such an important research area.
158

Bibliography
Aipperspach, R., Cohen, E., and Canny, J. (2006). Modeling human behavior fromsimple sensors in the home. In Pervasive Computing, pages 337–348. SpringerBerlin Heidelberg. 20
Akdemir, U., Turaga, P., and Chellappa, R. (2008). An ontology based approachfor activity recognition from video. In El-Saddik, Abdulmotaleb; Vuong, Son;Griwodz, Carsten; Del Bimbo, Alberto; Candan, K. Selcuk; Jaimes, A., editor,Proceedings of the 16th ACM international conference on Multimedia, pages709–712, Vancouver, Canada. ACM. 12, 36
Alemdar, H. and Ersoy, C. (2010). Wireless sensor networks for healthcare: Asurvey. Computer Networks, 54(15):2688–2710. 12
Almeida, A. and Lopez-de-Ipina, D. (2012). Assessing ambiguity of context datain intelligent environments: towards a more reliable context managing system.MDPI Sensors, 12(4):4934–51. 38
Ashbrook, D. and Starner, T. (2003). Using GPS to learn significant locations andpredict movement across multiple users. Personal and Ubiquitous Computing,7(5):275–286. 18
Bao, L. and Intille, S. (2004). Activity recognition from user-annotated accelerationdata. In Science, L. N. i. C., editor, Pervasive Computing, pages 1–17, Vienna,Austria. Springer Berlin Heidelberg. 17, 18, 20, 22, 24, 26
Bouchard, B., Giroux, S., and Bouzouane, A. (2006). A Smart Home Agentfor Plan Recognition of Cognitively-impaired Patients. Journal of Computers,1(5):53–62. 34
Brand, M., Oliver, N., and Pentland, A. (1997). Coupled hidden Markov modelsfor complex action recognition. In Proceedings of Computer Vision and PatternRecognition, pages 994–999. IEEE. 14, 23
159

Bibliography
Brdiczka, O. (2009). Learning situation models in a smart home. Systems, Man,and Cybernetics, Part B: Cybernetics, IEEE Transactions on, 39(1):56–63. 24
Brdiczka, O., Reignier, P., and Crowley, J. (2007). Detecting individual activitiesfrom video in a smart home. In Knowledge-Based Intelligent Information andEngineering Systems, pages 363–370. Springer Berlin Heidelberg. 22
Bruneau, J., Jouve, W., and Consel, C. (2009). DiaSim: A parameterized simu-lator for pervasive computing applications. In Mobile and Ubiquitous Systems:Networking & Services, MobiQuitous, 2009. MobiQuitous’ 09. 6th Annual In-ternational, pages 1–10. IEEE. 101
Buettner, M. and Prasad, R. (2009). Recognizing daily activities with RFID-basedsensors. In Proceedings of the 11th international conference on Ubiquitous com-puting, pages 51–60. ACM. 17, 21
Carberry, S. (2001). Techniques for plan recognition. User Modeling and User-Adapted Interaction, 11(1-2):31–48. 34
Chan, M., Esteve, D., Escriba, C., and Campo, E. (2008). A review of smarthomes—Present state and future challenges. Computer methods and programsin biomedicine, 91(1):55–81. 17, 20
Chen, D., Yang, J., and Wactlar, H. (2004). Towards automatic analysis of socialinteraction patterns in a nursing home environment from video. In Proceedingsof the 6th ACM SIGMM international workshop on Multimedia information re-trieval, pages 283–290. ACM. 35
Chen, D., Yang, J., and Wactlar, H. (2005). A study of detecting social interactionwith sensors in a nursing home environment. In Computer Vision in Human-Computer Interaction, pages 199–210. Springer Berlin Heidelberg. 25
Chen, L., Hoey, J., Nugent, C., Cook, D., and Yu, Z. (2012a). Sensor-based activ-ity recognition. IEEE Transactions on Systems, Man, and Cybernetics-Part C,42(6):790–808. 13, 16, 147
Chen, L. and Nugent, C. (2008). A logical framework for behaviour reasoningand assistance in a smart home. International Journal of Assistive Robotics andMechatronics, 9(4):20–34. 35
Chen, L. and Nugent, C. (2009). Ontology-based activity recognition in intelli-gent pervasive environments. International Journal of Web Information Systems,5(4):410–430. 37
160
Bibliography
Chen, L., Nugent, C., and Mulvenna, M. (2009). Semantic smart homes: towardsknowledge rich assisted living environments. Intelligent Patient Management,pages 279–296. 36, 37
Chen, L., Nugent, C., and Okeyo, G. (2014). An Ontology-based Hybrid Approachto Activity Modeling for Smart Homes. IEEE Transaction on Human-MachineSystems, 44(1):92–105. 2, 4, 39, 42, 48, 155
Chen, L., Nugent, C., and Wang, H. (2012b). A knowledge-driven approach toactivity recognition in smart homes. Knowledge and Data Engineering, IEEETransactions on, 24(6):961–974. xix, 3, 12, 37, 44, 47, 85, 109, 129
Choudhury, T. and Consolvo, S. (2008). The mobile sensing platform: An em-bedded activity recognition system. IEEE Pervasive Computing, 7(2):32–41. 1,12
Cook, D., Feuz, K., and Krishnan, N. (2013). Transfer learning for activity recog-nition: a survey. Knowledge and information systems, 36(3):537–556. 27, 28
Cook, D. and Schmitter-Edgecombe, M. (2009). Assessing the quality of activitiesin a smart environment. Methods of information in medicine, 48(5):480. 12, 22
Ding, D., Cooper, R., Pasquina, P., and Fici-Pasquina, L. (2011). Sensor technologyfor smart homes. Maturitas, 69(2):131–136. 12
Fernandez-Caballero, A. (2012). Human activity monitoring by local and globalfinite state machines. Expert Systems with Applications, 39(8):6982–6993. 1
Finni, T., Hu, M., and Kettunen, P. (2007). Measurement of EMG activitywith textile electrodes embedded into clothing. Physiological measurement,28(11):1405. 18
Fishkin, K., Philipose, M., and Rea, A. (2005). Hands-On RFID: Wireless Wear-ables for Detecting Use of Objects. In ISWC, pages 18–43. 21
Foerster, F. and Fahrenberg, J. (2000). Motion pattern and posture: correctly as-sessed by calibrated accelerometers. Behavior research methods, instruments, &computers, 32(3):430–457. 17
Fong, T., Nourbakhsh, I., and Dautenhahn, K. (2003). A survey of socially interac-tive robots. Robotics and autonomous systems, 42(3):143–166. 1, 12
Francois, A., Nevatia, R., and Hobbs, J. (2005). VERL: an ontology framework forrepresenting and annotating video events. MultiMedia, IEEE, 12(4):76–86. 36
161

Bibliography
Galata, A., Johnson, N., and Hogg, D. (1999). Learning structured behaviour mod-els using variable length Markov models. In IEEE International Workshop onModelling People, pages 95–102. IEEE. 22
Gavrila, D. (1999). The visual analysis of human movement: A survey. Computervision and image understanding, 73(1):82–98. 22
Gellersen, H., Schmidt, A., and Beigl, M. (2002). Multi-sensor context-awarenessin mobile devices and smart artifacts. Mobile Networks and Applications,7(5):341–351. 17, 19
Georis, B., Maziere, M., Bremond, F., and Thonnat, M. (2004). A video interpreta-tion platform applied to bank agency monitoring. In Proc. of the 2nd WorkshopIntell. Distributed Surveillance System, pages 46–50. 35
Golding, A. and Lesh, N. (1999). Indoor navigation using a diverse set of cheap,wearable sensors. In Wearable Computers, 1999. Digest of Papers. The ThirdInternational Symposium, pages 29–36. IEEE. 16
Gu, T., Wu, Z., Tao, X., Pung, H., and Lu, J. (2009). epsicar: An emerging patternsbased approach to sequential, interleaved and concurrent activity recognition.In IEEE, editor, IEEE International Conference on Pervasive Computing andCommunications (PerCom), pages 1–9. 17, 21, 26
Guralnik, V. and Haigh, K. (2002). Learning models of human behaviour withsequential patterns. In Proceedings of the AAAI-02 workshop “Automation asCaregiver”, pages 24–30. 26
Hakeem, A. and Shah, M. (2004). Ontology and taxonomy collaborated frameworkfor meeting classification. In Pattern Recognition, 2004. ICPR 2004. Proceed-ings of the 17th International Conference on, pages (4)219–222. 35, 36
Hamming, R. (1950). Error detecting and error correcting codes. Bell Systemtechnical journal, 29(2):147–160. 86
Harms, H., Amft, O., Troster, G., and Roggen, D. (2008). Smash: A distributedsensing and processing garment for the classification of upper body postures.In Proceedings of the ICST 3rd international conference on Body area net-works, page 22. ICST (Institute for Computer Sciences, Social-Informatics andTelecommunications Engineering). 18
Helal, A., Cho, K., and Lee, W. (2012). 3D modeling and simulation of humanactivities in smart spaces. In Ubiquitous Intelligence & Computing and 9th In-ternational Conference on Autonomic & Trusted Computing (UIC/ATC), 20129th International Conference on, pages 112–119. IEEE. 101, 114
162

Bibliography
Helal, S., Lee, J., and Hossain, S. (2011). Persim-Simulator for human activitiesin pervasive spaces. In Intelligent Environments (IE), 2011 7th InternationalConference on, pages 192–199. IEEE. 100, 114
Helal, S., Mann, W., and El-Zabadani, H. (2005). The gator tech smart house: Aprogrammable pervasive space. Computer, 38(3):50–60. 20
Helaoui, R., Niepert, M., and Stuckenschmidt, H. (2011). Recognizing interleavedand concurrent activities using qualitative and quantitative temporal relation-ships. Pervasive and Mobile Computing, 7(6):660–670. 39
Helaoui, R., Riboni, D., and Stuckenschmidt, H. (2013). A probabilistic ontologi-cal framework for the recognition of multilevel human activities. In Ambient In-telligence and Future Trends-International Symposium on Ambient Intelligence(ISAmI 2010), pages 247–254, Guimaraes, Portugal. Springer Berlin Heidelberg.38
Hoaglin, D., Mosteller, F., and Tukey, J. (1983). Understanding robust and ex-ploratory data analysis. Wiley, New York. 88
Hodges, M. and Pollack, M. (2007). An object-use fingerprint: The use of elec-tronic sensors for human identification. In Proc. of the 9th International Confer-ence on Ubiquitous Computing, pages 289–303. 21
Hollosi, D. and Schroder, J. (2010). Voice activity detection driven acoustic eventclassification for monitoring in smart homes. In Applied Sciences in Biomedicaland Communication Technologies (ISABEL), 2010 3rd International Symposiumon, pages 1–5. 20
Horvitz, E., Breese, J., and Heckerman, D. (1998). The Lumiere project: Bayesianuser modeling for inferring the goals and needs of software users. In Proceedingsof the Fourteenth conference on Uncertainty in artificial intelligence, pages 256–265. 23
Hu, D. and Yang, Q. (2008). CIGAR: Concurrent and Interleaving Goal and Ac-tivity Recognition. In AAAI, pages (8)1363–1368. 25
Jain, A. and Dubes, R. (1988). Algorithms for clustering data. Prentice Hall. 86
Kan, P., Huq, R., and Hoey, J. (2011). The development of an adaptive upper-limbstroke rehabilitation robotic system. Journal of neuroengineering and rehabili-tation, 8(1):1–18. 23
163

Bibliography
Kasteren, T. V. and Noulas, A. (2008). Accurate activity recognition in a homesetting. In Proceedings of the 10th International conference on Ubiquitous com-puting, pages 1–9. 12
Kautz, H. (1991). A Formal Theory of Plan Recognition and its Implementation,Reasoning About Plans. Morgan Kaufmann, San Mateo. 34
Kautz, H., Arnstein, L., and Borriello, G. (2002). An overview of the assistedcognition project. In AAAI-2002 Workshop on Automation as Caregiver: TheRole of Intelligent Technology in Elder Care, pages 60–65. 23
Kern, N., Schiele, B., and Junker, H. (2003). Wearable sensing to annotate meetingrecordings. Personal and Ubiquitous Computing, 7(5):263–274. 17
Klein, M., Schmidt, A., and Lauer, R. (2007). Ontology-centred design of anambient middleware for assisted living: The case of soprano. In Proc. of the30th Annual German Conference on Artificial Intelligence, Osnabruck. 36, 37
Laerhoven, K. V. (2001). Real-time analysis of data from many sensors with neu-ral networks. In Wearable Computers, 2001. Proceedings. Fifth InternationalSymposium on, pages 115–122. 17
Laerhoven, K. V. and Aidoo, K. (2001). Teaching context to applications. Personaland Ubiquitous Computing, 5(1):46–49. 1, 12, 17
Latfi, F., Lefebvre, B., and Descheneaux, C. (2007). Ontology-Based Manage-ment of the Telehealth Smart Home, Dedicated to Elderly in Loss of CognitiveAutonomy. CEUR Workshop Proceedings, 258. 36, 37
Lee, S. and Mase, K. (2002). Activity and location recognition using wearablesensors. IEEE pervasive computing, 1(3):24–32. 17, 18
Leonhardt, U. and Magee, J. (1998). Multi-sensor location tracking. In Proceedingsof the 4th annual ACM/IEEE international conference on Mobile computing andnetworking, pages 203–214. ACM. 16
Lester, J., Choudhury, T., and Kern, N. (2005). A Hybrid Discriminative/Gener-ative Approach for Modeling Human Activities. In IJCAI, pages (5)766–772.26
Levenshtein, V. I. (1966). Binary codes capable of correcting deletions, insertions,and reversals. Soviet Physics Doklady, 10(8):707–710. 86
Liao, L., Fox, D., and Kautz, H. (2006). Location-based activity recognition. Ad-vances in Neural Information Processing Systems, 18:787. 101
164

Bibliography
Liao, L., Fox, D., and Kautz, H. (2007a). Hierarchical conditional random fields forGPS-based activity recognition. In Robotics Research, pages 487–506. SpringerBerlin Heidelberg. 17, 25
Liao, L., Patterson, D., Fox, D., and Kautz, H. (2007b). Learning and inferringtransportation routines. Artificial Intelligence, 171(5):311–331. 18, 23
Lukowicz, P., Ward, J., Junker, H., and Stager, M. (2004). Recognizing workshopactivity using body worn microphones and accelerometers. In Pervasive Com-puting, pages 18–32. 18
Mahdaviani, M. and Choudhury, T. (2008). Fast and scalable training of semi-supervised crfs with application to activity recognition. In Advances in NeuralInformation Processing Systems, pages 977–984. 26
Mantyjarvi, J. (2001). Recognizing human motion with multiple acceleration sen-sors. In Systems, Man, and Cybernetics, 2001 IEEE International Conferenceon, pages 747–752. IEEE. 17, 18
Maurer, U. and Rowe, A. (2006). Location and activity recognition using eWatch:A wearable sensor platform. In Ambient Intelligence in Everyday Life, pages86–102. Springer Berlin Heidelberg. 22, 24
Mikic, I., Huang, K., and Trivedi, M. (2000). Activity monitoring and summa-rization for an intelligent meeting room. In Human Motion, 2000. Proceedings.Workshop on, pages 107–112. IEEE. 12
Modayil, J., Levinson, R., and Harman, C. (2008). Integrating Sensing and Cueingfor More Effective Activity Reminders. In AAAI Fall Symposium: AI in Elder-care: New Solutions to Old Problems, pages 60–66. 26
Moeslund, T., Hilton, A., and Kruger, V. (2006). A survey of advances in vision-based human motion capture and analysis. Computer vision and image under-standing, 104(2):90–126. 15, 22
Mozer, M. (1998). The neural network house: An environment hat adapts to itsinhabitants. In Proc. AAAI Spring Symp. Intelligent Environments, pages 110–114. 16
Nevatia, R., Hobbs, J., and Bolles, B. (2004). An ontology for video eventrepresentation. In Computer Vision and Pattern Recognition Workshop, 2004.CVPRW’04. Conference on, page 119. IEEE. 36
165

Bibliography
Nugent, C. and Mulvenna, M. (2009). Experiences in the development of a smartlab. International Journal of Biomedical Engineering and Technology, 2(4):319–331. 17, 20
Okeyo, G. and Chen, L. (2012). A hybrid ontological and temporal approach forcomposite activity modelling. In IEEE 11th International Conference on Trust,Security and Privacy in Computing and Communications. 38
Okeyo, G., Chen, L., Wang, H., and Sterritt, R. (2012). Dynamic sensor datasegmentation for real-time knowledge-driven activity recognition. Pervasive andMobile Computing, 10:155–172. 101, 107, 114, 116
Oliver, N., Garg, A., and Horvitz, E. (2004). Layered representations for learningand inferring office activity from multiple sensory channels. Computer Visionand Image Understanding, 96(2):163–180. 23
Omar, F., Sinn, M., and Truszkowski, J. (2010). Comparative analysis of proba-bilistic models for activity recognition with an instrumented walker. In Proc. ofthe 26th Conference on Uncertainty in Artificial Intelligence, pages 392–400. 26
Palmes, P., Pung, H., Gu, T., Xue, W., and Chen, S. (2010). Object relevanceweight pattern mining for activity recognition and segmentation. Pervasive andMobile Computing, 6(1):43–57. 32
Pantelopoulos, A. and Bourbakis, N. (2010). A survey on wearable sensor-basedsystems for health monitoring and prognosis. Systems, Man, and Cybernetics,Part C: Applications and Reviews, IEEE Transactions on, 40(1):1–12. 12
Patterson, D. and Fox, D. (2005). Fine-grained activity recognition by aggregatingabstract object usage. In Wearable Computers, 2005. Proceedings. Ninth IEEEInternational Symposium on, pages 44–51. IEEE. 17, 21
Patterson, D., Liao, L., Fox, D., and Kautz, H. (2003). Inferring high-level behaviorfrom low-level sensors. In UbiComp 2003: Ubiquitous Computing, pages 73–89.Springer Berlin Heidelberg. 17, 18, 20
Pentney, W., Philipose, M., and Bilmes, J. (2008). Structure Learning on LargeScale Common Sense Statistical Models of Human State. In AAAI, pages 1389–1395. 26
Pentney, W., Philipose, M., Bilmes, J., and Kautz, H. (2007). Learning large scalecommon sense models of everyday life. In Proceedings of the National Confer-ence on Artificial Intelligence, pages 465–470. 26
166

Bibliography
Perkowitz, M., Philipose, M., Patterson, D., and Fishkin, K. (2004). Mining modelsof human activities from the web. In Proc. of the 13th International World WideWeb Conference, pages 573–582. 31, 32
Philipose, M. and Fishkin, K. (2004). Inferring activities from interactions withobjects. Pervasive Computing, 3(4):50–57. 1, 12, 17, 21
Poppe, R. (2010). A survey on vision-based human action recognition. Image andvision computing, 28(2):976–990. 12, 15
Quinn, J. (2009). Factorial switching linear dynamical systems applied to physio-logical condition monitoring. Pattern Analysis and Machine Intelligence, IEEETransactions on, 31(9):1537–1551. 22
Randell, C. and Muller, H. (2000). Context awareness by analysing accelerometerdata. In Wearable Computers, The Fourth International Symposium on, pages175–176. IEEE. 17
Rashidi, P. and Cook, D. (2011). Discovering activities to recognize and track ina smart environment. Knowledge and Data Engineering, IEEE Transactions on,23(4):527–539. 2, 26, 80, 98, 115
Rashidi, P. and Cook, D. (2013). COM: A method for mining and monitoringhuman activity patterns in home-based health monitoring systems. ACM Trans-actions on Intelligent Systems and Technology (TIST), 4(4):64. 26
Ravi, N., Dandekar, N., Mysore, P., and Littman, M. (2005). Activity recognitionfrom accelerometer data. In AAAI, pages (5) 1541–1546. 25, 26
Riboni, D. and Bettini, C. (2011a). COSAR: hybrid reasoning for context-awareactivity recognition. Personal and Ubiquitous Computing, 15(3):271–289. 39,98
Riboni, D. and Bettini, C. (2011b). OWL 2 modeling and reasoning with complexhuman activities. Pervasive and Mobile Computing, 7(3):379–395. 37
Roberts, D. (1986). Ordination on the basis of fuzzy set theory. Vegetatio,66(3):123–131. 86
Sanchez, D., Tentori, M., and Favela, J. (2008). Activity recognition for the smarthospital. Intelligent Systems, IEEE, 23(2):50–57. 12
Schmidt, A., Beigl, M., and Gellersen, H. (1999). There is more to context thanlocation. Computers & Graphics, 23(6):893–901. 17
167

Bibliography
Schmidt, A. and Laerhoven, K. V. (2001). How to build smart appliances? PersonalCommunications, IEEE, 8(4):66–71. 17, 19
Seker, S., Altun, O., Ayan, U., and Mert, C. (2014). A Novel String Distance Func-tion based on Most Frequent K Characters. International Journal of MachineLearning and Computing (IJMLC), 4(2):177–183. 86
Shanahan, M. (1997). Solving the frame problem: a mathematical investigation ofthe common sense law of inertia. MIT Press. 34
Sørensen, T. (1948). A method of establishing groups of equal amplitude in plantsociology based on similarity of species and its application to analyses of thevegetation on Danish commons. Kongelige Danske Videnskabernes Selskab,5(4):1–34. 86
Srivastava, M., Muntz, R., and Potkonjak, M. (2001). Smart kindergarten: sensor-based wireless networks for smart developmental problem-solving environ-ments. In Proceedings of the 7th annual international conference on Mobilecomputing and networking, pages 132–138. 20
Starner, T. (1995). Visual Recognition of American Sign Language Using HiddenMarkov Models. 22
Steinhauer, H. and Chua, S. (2010). Utilising Temporal Information in BehaviourRecognition. In AAAI Spring Symposium, pages 54–59. 39
Stikic, M. and Schiele, B. (2009). Activity recognition from sparsely labeled datausing multi-instance learning. In Location and Context Awareness, pages 156–173. Springer Berlin Heidelberg. 24
Sung, M., DeVaul, R., Jimenez, S., Gips, J., Pentland, A. (2004). Shiver motionand core body temperature classification for wearable soldier health monitoringsystems. In Wearable Computers, 2004. ISWC 2004. Eighth International Sym-posium on, pages 192–193. IEEE. 18
Sutton, C., McCallum, A., and Rohanimanesh, K. (2007). Dynamic conditionalrandom fields: Factorized probabilistic models for labeling and segmenting se-quence data. The Journal of Machine Learning Research, 8:693–723. 25
Tapia, E., Intille, S., and Larson, K. (2004). Activity Recognition in the HomeUsing Simple and Ubiquitous Sensors. Pervasive computing, 3001:158–175.20, 22, 98
168

Bibliography
Tapia, E. M., Choudhury, T., and Philipose, M. (2006). Building Reliable ActivityModels Using Hierarchical Shrinkage and Mined Ontology. In Proc. of PERVA-SIVE, pages 17–32. 32, 36
Tran, S. and Davis, L. (2008). Event modeling and recognition using markov logicnetworks. In Forsyth, David A.; Torr, Philip H. S.; Zisserman, A., editor, Com-puter Vision–ECCV 2008, pages 610–623, Marseille. Springer Berlin Heidel-berg. 39
Turaga, P. (2008). Machine recognition of human activities: A survey. Circuits andSystems for Video Technology, IEEE Transactions on, 18(11):1473–1488. 15
Vail, D., Veloso, M., and Lafferty, J. (2007). Conditional random fields for ac-tivity recognition. In Proceedings of the 6th international joint conference onAutonomous agents and multiagent systems, page 235. ACM. 25
van Kasteren, T. and Krose, B. (2007). Bayesian activity recognition in residencefor elders. In Proc. of the International Conference on Intelligent Environments,pages 209–213. 22
Ward, A., Jones, A., and Hopper, A. (1997). A new location technique for theactive office. Personal Communications, IEEE, 4(5):42–47. 16
Weinland, D., Ronfard, R., and Boyer, E. (2011). A survey of vision-based methodsfor action representation, segmentation and recognition. Computer Vision andImage Understanding, 115(2):224–241. 12, 15
Weiser, M. (1991). The computer for the twenty-first century. Scientific American,265(3):94–104. 12
Wilson, D. and Atkeson, C. (2005). Simultaneous tracking and activity recognition(STAR) using many anonymous, binary sensors. In Pervasive computing, pages62–79. Springer Berlin Heidelberg. 20, 23
Wobcke, W. (2002). Two logical theories of plan recognition. Journal of Logic andComputation, 12(3):371–412. 34
Wren, C. and Tapia, E. (2006). Toward scalable activity recognition for sensornetworks. In Location-and context-awareness, pages 168–185. Springer BerlinHeidelberg. 12, 17, 20
Wu, J. and Osuntogun, A. (2007). A scalable approach to activity recognition basedon object use. In Computer Vision, 2007. ICCV 2007. IEEE 11th InternationalConference on, pages 1–8. IEEE. 26, 31
169

Bibliography
Wyatt, D., Philipose, M., and Choudhury, T. (2005). Unsupervised activity recog-nition using automatically mined common sense. In Proc. of AAAI, pages 21–27.31, 32
Yamada, N., Sakamoto, K., and Kunito, G. (2007). Applying ontology and proba-bilistic model to human activity recognition from surrounding things. Informa-tion and Media Technologies, 2(4):1286–1297. 36, 37
Ye, J., Stevenson, G., and Dobson, S. (2011). A top-level ontology for smart envi-ronments. Pervasive and mobile computing, 7(3):359–378. 37
Yilmaz, A., Javed, O., and Shah, M. (2006). Object tracking: A survey. Acmcomputing surveys (CSUR), 38(4):13. 15, 16
170

This dissertation was finished writing in Bilbao on January 7th, 2015