Learning Bayesian decision analysis by doing: lessons …mead/papers/learningbayesian... ·...
19
Ecological Modelling 119 (1999) 177 – 195 Learning Bayesian decision analysis by doing: lessons from environmental and natural resources management Olli Varis a, *, Sakari Kuikka b a Helsinki Uni6ersity of Technology, Laboratory of Water Resources, 02015 HUT, Finland b Finnish Game and Fisheries Research Institute, 00721 Helsinki, Finland Received 25 February 1998; received in revised form 22 January 1999; accepted 8 February 1999 Abstract The planet we are living on is getting small; each decade the number of people here grows by almost 1 billion. Due to the escalating pressure that mankind puts on natural resources and the environment, there is a pressing need to develop management schemes and approaches that acknowledge the pragmatic character of the problems: We scientists should not just passively obser6e and measure but also need to assist policy makers for better action. This requires the ability to combine, interconnect, link, and analyze jointly information, knowledge, and judgment across scientific disciplines. The methodological development is blooming and rich. However, the way to applications tends to be long. It is not enough that one has learned and applied a methodology; it has also to be comprehended and accepted by many others who often are not all that devoted to methodological challenges; and launched to responsible institutions. In this paper, we make an overview of lessons learned from studying, applying, and launching of Bayesian decision analysis — influence diagrams and belief networks in particular — in the field of resource and environmental management. A number of case studies from water resources and fisheries are used as an illustration. © 1999 Elsevier Science B.V. All rights reserved. Keywords: Bayesian statistics; Decision analysis; Environment; Fisheries; Natural resources; Risk analysis; Uncertainty; Water 1. Introduction Starting with an unconventional approach re- quires time, imagination, and ability to find analogies. This is our experience from applied sciences, when trying to digest and apply compu- tational approaches so that they would benefit us in solving real problems. The methodological lit- erature is blooming with most interesting ideas and techniques, yet the way to applications tends to be long and hard, albeit a most interesting one, bound to plenty of trials and errors. To comprehend a new methodology and ap- proach, and to apply it in a meaningful way is just * Corresponding author. Tel. +358-9-4513844; fax +358-9- 4513827. E-mail address: [email protected].fi (O. Varis) 0304-3800/99/$ - see front matter © 1999 Elsevier Science B.V. All rights reserved. PII:S0304-3800(99)00061-7
-
Upload
trankhuong -
Category
Documents
-
view
216 -
download
2
Transcript of Learning Bayesian decision analysis by doing: lessons …mead/papers/learningbayesian... ·...

Ecological Modelling 119 (1999) 177–195
Learning Bayesian decision analysis by doing: lessons fromenvironmental and natural resources management
Olli Varis a,*, Sakari Kuikka b
a Helsinki Uni6ersity of Technology, Laboratory of Water Resources, 02015 HUT, Finlandb Finnish Game and Fisheries Research Institute, 00721 Helsinki, Finland
Received 25 February 1998; received in revised form 22 January 1999; accepted 8 February 1999
Abstract
The planet we are living on is getting small; each decade the number of people here grows by almost 1 billion. Dueto the escalating pressure that mankind puts on natural resources and the environment, there is a pressing need todevelop management schemes and approaches that acknowledge the pragmatic character of the problems: Wescientists should not just passively obser6e and measure but also need to assist policy makers for better action. Thisrequires the ability to combine, interconnect, link, and analyze jointly information, knowledge, and judgment acrossscientific disciplines. The methodological development is blooming and rich. However, the way to applications tendsto be long. It is not enough that one has learned and applied a methodology; it has also to be comprehended andaccepted by many others who often are not all that devoted to methodological challenges; and launched toresponsible institutions. In this paper, we make an overview of lessons learned from studying, applying, and launchingof Bayesian decision analysis—influence diagrams and belief networks in particular—in the field of resource andenvironmental management. A number of case studies from water resources and fisheries are used as an illustration.© 1999 Elsevier Science B.V. All rights reserved.
Keywords: Bayesian statistics; Decision analysis; Environment; Fisheries; Natural resources; Risk analysis; Uncertainty; Water
1. Introduction
Starting with an unconventional approach re-quires time, imagination, and ability to findanalogies. This is our experience from applied
sciences, when trying to digest and apply compu-tational approaches so that they would benefit usin solving real problems. The methodological lit-erature is blooming with most interesting ideasand techniques, yet the way to applications tendsto be long and hard, albeit a most interesting one,bound to plenty of trials and errors.
To comprehend a new methodology and ap-proach, and to apply it in a meaningful way is just
* Corresponding author. Tel.+358-9-4513844; fax +358-9-4513827.
E-mail address: [email protected] (O. Varis)
0304-3800/99/$ - see front matter © 1999 Elsevier Science B.V. All rights reserved.
PII: S 0304 -3800 (99 )00061 -7

O. Varis, S. Kuikka / Ecological Modelling 119 (1999) 177–195178
the first step. Getting other people to under-stand and accept the idea, and launch it to thepractical level is often still more demanding. Itis, though, only there where the new methodolo-gies pay back in terms of real benefits to thesociety, beyond just scientific adventure andmerit. People who make real world decisionsshould be helped to make them in a better way.
The objective of this paper is to summarizethe experience gained, and lessons learned fromtrying to find, comprehend, and apply Bayesiandecision analytic approaches—influence dia-grams and belief networks in particular, see Ap-pendix—and to transfer this experience to thepractical level. This level has, in our case, con-sisted of a variety of national and internationalinstitutions working on the management of nat-ural resources and the environment. They in-clude regional river basin or watershedauthorities, government organizations, interna-tional organizations such as UNU/WIDER(United Nations University/World Institute forDevelopment Economics Research), ICES (Inter-national Council for the Exploration of theSea), and IIASA (International Institute for Ap-plied Systems Analysis). A part of the experi-ence, but a majority of the consolidation ofideas has taken place after our previousoverview paper (Varis et al., 1994) to Bayesiandecision analysis.
The basic idea of Bayesian network models(influence diagrams, belief networks) is that theuncertainty of the problems is described by themeans of probabilities. These can be either un-conditioned ones (variables is not dependent onother variables), or conditional ones, in whichcase the value of a variable depends at least onone of the other model variables. Conditionalprobabilities enable the modelling of ‘level ofdeterminism’, i.e. a poor knowledge or poorcontrol is modelled by weak conditional proba-bilities and vice versa.
2. Experiences with influence diagrams
Over a decade ago, we commenced to studythe possibilities of using influence diagrams in
our fields. At that point, we had quite a bit ofexperience on making process models for theanalysis of biological and chemical systems (i.e.differential equation models with ‘physicallybased’ parameterization). In addition, of course,we had used various statistics packages to theanalysis of data from lakes, rivers, seas, on fish,plankton, chemical compounds and so on.
It is definitely hard to imagine how manyweeks it took us to arrive at any influence dia-gram model that could possibly be processed ina direction of a practically useful model. Thegreatest difficulty perhaps was to get rid ofoverly physical thinking we had learned in ourtraining, and start to think in terms of informa-tion flows instead of material flows.
We finally had success in finding an analogywith the classical textbook problems such as theTake Umbrella and Oil Wildcatter (Appendix),in a lake restoration case. From that analogybecame the prototype for the first case studydescribed below.
2.1. Selected influence diagram studies
With further elaboration, we prepared a thor-ough decision analysis of that problem (Case 1),and presented it to the municipal corporation incharge of the restoration task. The delay fromthe first case to an accepted practicable ap-proach was notable, and only a few years ago,the methodology has become commonplace inthe discussions of ecosystem restoration analystsand practitioners in our country.
We found the approach fascinating, and triedit in several other cases. Within an IIASA studyon the management of the Zambezi river insouthern Africa, we did quite a bit of experi-menting on different model structures. The taskwas to analyze the overexploitation risks offisheries in Lake Kariba. It soon became veryevident how important the thorough and exactdefinition of the problem at hand is. The veryintuitive, graphical notation of influence dia-grams was highly useful in that work. Tens andtens of different models were produced, eachreflecting a slightly or not that slightly modified

O. Varis, S. Kuikka / Ecological Modelling 119 (1999) 177–195 179
angle to the problem. Finally the structure waschosen (Case 2) that met best the targets set tothe project.
Much of the practical research effort andfunds goes to various data collection activitiessuch as realization of measurement campaignsand monitoring programs. We made an analysisof a real-time monitoring system for a river(Case 3). The data collection costs were con-trasted and traded off with the decreased uncer-tainty in the information that a river basinauthority is using in giving recommendations towater user stakeholders including the public.Data collection was one of the leading elementsin the case study of Case 1, but in the Case 3,the whole analysis was focused on that question.
The literature knows influence diagrams whichinclude no decision nodes, just probabilistic ones(e.g. Howard, 1990). We have come across withsome cases in which such models, often calledrelevance maps, have been useful. One of ourgraduate students got a task to analyze variouspossibilities to rehabilitate fish stocks of a river,which has been subjected to various man-madedisturbances over the past few centuries (Case4). She used a.o. such models.
In a review on fisheries science, Kuikka (1998)discussed the use of Bayesian network models(both with and without decision and objectivevariables), especially when applying the precau-tionary approach to fisheries management. Inthis context the role of uncertainty is important:the higher it is, the lower the exploitationshould be. An essential conclusion was, thatstructural uncertainty (which models to use)tends to dominate, even though most of the sci-entific work is focused on the parameter uncer-tainty. This is a hard job for scientist; adding ofreasonable doubts (hypothesis, models) to theanalysis increases easily uncertainty, which leadsto lower allowable catches. The roads of scien-tists and managers should meet more pro-foundly. One key analysis that led to these ideasis presented as Case 5.
According to our experience, influence dia-grams are well suited to the analysis of prob-lems in which the decisions include different
options for reduction of uncertainty by im-proved information.
2.2. Case 1: Restoration of a temperate lake
The use of Lake Tuusulanjarvi; Finland, isremarkably harmed by eutrophication,cyanobacteria in particular. Among the variousrestoration measures taken during the last 3decades, we considered here the plan to divertwater from a water transfer tunnel to the basinto dilute the lake (Varis et al., 1990).
The influence diagram model consists of 10nodes (Fig. 1). Analogical to problem in Ap-pendix, on the top there is a node describing theuncontrolled state of the nature; the Prior WaterQuality. It contains a probability distributionderived from monthly water quality data in1974–85. The Forecast node contains a distribu-tion describing the accuracies obtainable forforecast models, given different MonitoringStrategies (monthly, bi-weekly, and weekly). Theinformation for this node was obtained from astudy on a set of transfer function models(Sirvio, 1988). The same study served also asthe basis of the information for node PosteriorWater Quality, which includes the assessmentfor changes in Prior Water Quality, given 4 dilu-tion options (no extra inflow, flow of 0.1 and0.5 m3 s−1, and adaptive discharge).
The rest of the model consists of costs andbenefits associated with different elements of theproject. The benefits of improved water qualitywere not fixed to any single monetary amount,but instead a risk-benefit sensitivity study wascarried out (Fig. 1). Among other things, itshows an interesting phenomenon: a risk aversemanager would act instead of measure. A riskprone one would measure instead of act. Such afeature is probably a more general property ofenvironmental systems, and implications to, e.g.climatic change impacts are highly interesting.For the potential monetary value of further de-velopment of the forecasting models, the value-of-information study showed a value of 0.5money units, using the scale of horizontal axisof Fig. 1. This is remarkably low value not sug-gesting too much emphasis on refinement offorecasting models for this purpose.

O. Varis, S. Kuikka / Ecological Modelling 119 (1999) 177–195180
2.3. Case 2: Fisheries management in a tropicalreser6oir
The second largest reservoir in Africa, LakeKariba, is situated on the Zambezi River betweenZimbabwe and Zambia. It was completed in 1960.The sardine, Limnothrissa miodon, was introducedinto the lake in 1967–68 from Lake Tanganyika.The commercial fishery started in 1973. The sar-dine accounts for more than 90% of the totalcommercial catch. The fishing effort has grownrapidly, but the catch per unit effort (CPUE) hasundergone a remarkable decrease till 1980, butstagnated after that. This unexpected developmentof the CPUE might be due to (a) changes in thefish production, or (b) changes in the behavior offishermen, or both.
This analysis (Varis and Kuikka, 1990) wasdirected to find a sustainable level of fishing effortfor the lake. The model (Fig. 2) consisted of thefollowing nodes: Actual producti6ity: seven pub-lished estimates on the maximal production ofsardine in the lake plus the catch and effort datawere used. Producti6ity or Exploitation rate?: Thetwo competing hypotheses given above were con-trasted in this node. Fishing mortality: The annualsurvival rate was assumed to range between 10–40% of the stock. Effort: The number of allowedfishing licenses. Values from 75 to 225% of the1985 level were used. Catch: Product of realizedproduction and exploitation rate. risk for collapseof stock: This unknown factor is an importantbasis of fisheries restrictions. A number ofthreshold values were used in sensitivity analyses.Market prices and elasticity of prices: Some pub-lished evidence was available for the modeling ofthe market mechanism part of the system. Objec-ti6e function : The income was maximized withconstraints for the Risk for collapse of stock andthe market valued CPUE.
In the policy analysis phase, a number of sensi-tivity analyses were performed. As an example,Fig. 2 shows the optimal Effort as a function ofrisk threshold and risk attitude r (Pratt 1964). Asan another example, the value-of-informationanalysis showed greatest value for the actualproduction.
Fig. 1. Influence diagram model for the restoration of LakeTuusulanjarvi with two example risk-benefit plots. A riskaverse manager would prefer action to measurements, while arisk neutral and risk prone one would measure and not act.

O. Varis, S. Kuikka / Ecological Modelling 119 (1999) 177–195 181
Fig. 2. Left, influence diagram for sardine fisheries management of Lake Karibe. Right, optimal level of fishing effort as a functionof risk attitude r and risk threshold for the collapse of sardine stock.
2.4. Case 3: Real-time monitoring system for ari6er
The major water quality problem in the Ker-ava River, Finland, is the occasional deteriora-tion of its hygienic state. Kløve et al. (1993)studied the design of a real-time monitoring sys-tem to inform the authorities and the public onthese problems. The system components wereon-line water quality sensor system and adjacentforecast models.
The influence diagram model (Fig. 3, Varis etal., 1993) had the following nodes: Monitoringsystem: The alternatives for making the forecastswere to use (a) river flow data, (b) water qualitymonitoring data, and (c) a laser-based Lidarmonitoring system. Forecast and MeasurementUncertainty: Results from the study by Kløve etal. (1993), expressed as Pearson’s r2 for eachalternative. Cost-Uncertainty Equi6alent: Aparameter for scaling costs and uncertainties tounits sensitive to the selection of the monitoringsystem. Objecti6e Function: The difference be-tween System Uncertainty and Total Costs,which is maximized. Other nodes are self ex-planatory.
Two types of sensitivity analyses were made.First, the risk attitude was traded-off with the
Cost-Uncertainty Equi6alent parameter. Second,the risk attitude was studied together with theDiscount Rate. Fig. 3 shows an example of theoutcome of the second analysis.
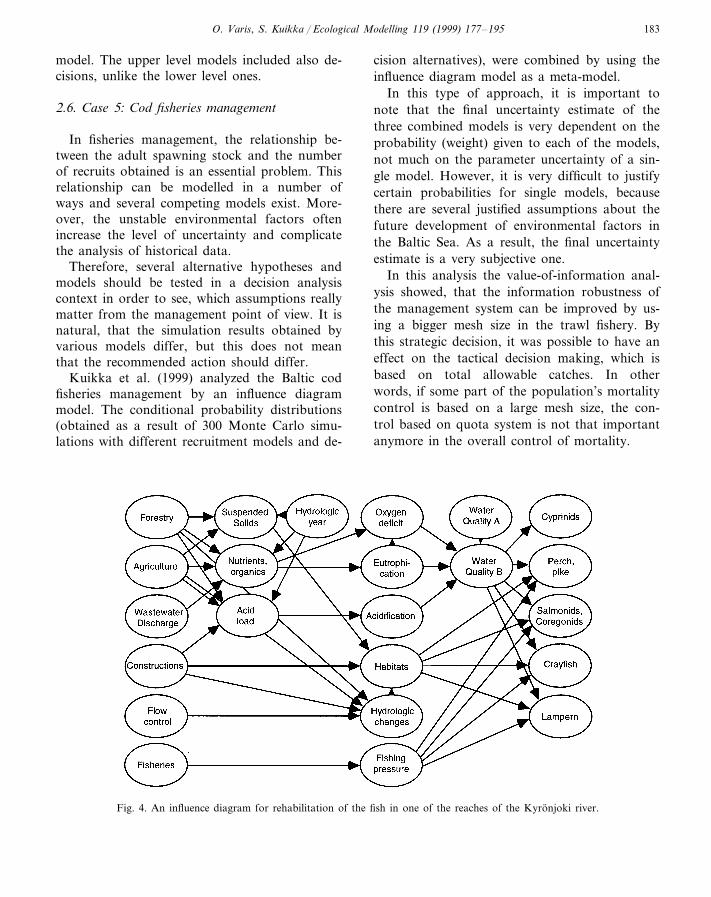
2.5. Case 4: Rehabilitation of fisheries in atemperate ri6er.
The Kyronjoki river, Finland has been heavilyconstructed for flood protection, hydropower,and other uses, over several centuries (Hildenand Rapport, 1993). The fish habitats have beenimpacted in many ways. The planning of therehabilitation process is realized as an interactiveprocedure in which all stakeholders participate.Sistonen (1995) made a comprehensive survey ofthe priorities of the stakeholders, and structuredthe various components of the problem usinginfluence diagrams. Remarkable part of the datawas obtained through interviews.
A number of models were constructed to forma two-level hierarchy. An upper level model wasa summary of several lower level influence dia-grams. Due to the problem’s character, the mod-els were very task specific, and therefore differeda lot from one another. As an example of alower-level model, Fig. 4 presents an influencediagram for one of the reaches of the river.Each node contains a probability distribution,allowing a base for further analyses using the

O. Varis, S. Kuikka / Ecological Modelling 119 (1999) 177–195182
Fig. 3. Above, influence diagram model for the Kerava river case. Below, optimal results for the river monitoring system as afunction of rish attitude and discount rate.
O. Varis, S. Kuikka / Ecological Modelling 119 (1999) 177–195 183
model. The upper level models included also de-cisions, unlike the lower level ones.
2.6. Case 5: Cod fisheries management
In fisheries management, the relationship be-tween the adult spawning stock and the numberof recruits obtained is an essential problem. Thisrelationship can be modelled in a number ofways and several competing models exist. More-over, the unstable environmental factors oftenincrease the level of uncertainty and complicatethe analysis of historical data.
Therefore, several alternative hypotheses andmodels should be tested in a decision analysiscontext in order to see, which assumptions reallymatter from the management point of view. It isnatural, that the simulation results obtained byvarious models differ, but this does not meanthat the recommended action should differ.
Kuikka et al. (1999) analyzed the Baltic codfisheries management by an influence diagrammodel. The conditional probability distributions(obtained as a result of 300 Monte Carlo simu-lations with different recruitment models and de-
cision alternatives), were combined by using theinfluence diagram model as a meta-model.
In this type of approach, it is important tonote that the final uncertainty estimate of thethree combined models is very dependent on theprobability (weight) given to each of the models,not much on the parameter uncertainty of a sin-gle model. However, it is very difficult to justifycertain probabilities for single models, becausethere are several justified assumptions about thefuture development of environmental factors inthe Baltic Sea. As a result, the final uncertaintyestimate is a very subjective one.
In this analysis the value-of-information anal-ysis showed, that the information robustness ofthe management system can be improved by us-ing a bigger mesh size in the trawl fishery. Bythis strategic decision, it was possible to have aneffect on the tactical decision making, which isbased on total allowable catches. In otherwords, if some part of the population’s mortalitycontrol is based on a large mesh size, the con-trol based on quota system is not that importantanymore in the overall control of mortality.
Fig. 4. An influence diagram for rehabilitation of the fish in one of the reaches of the Kyronjoki river.
O. Varis, S. Kuikka / Ecological Modelling 119 (1999) 177–195184
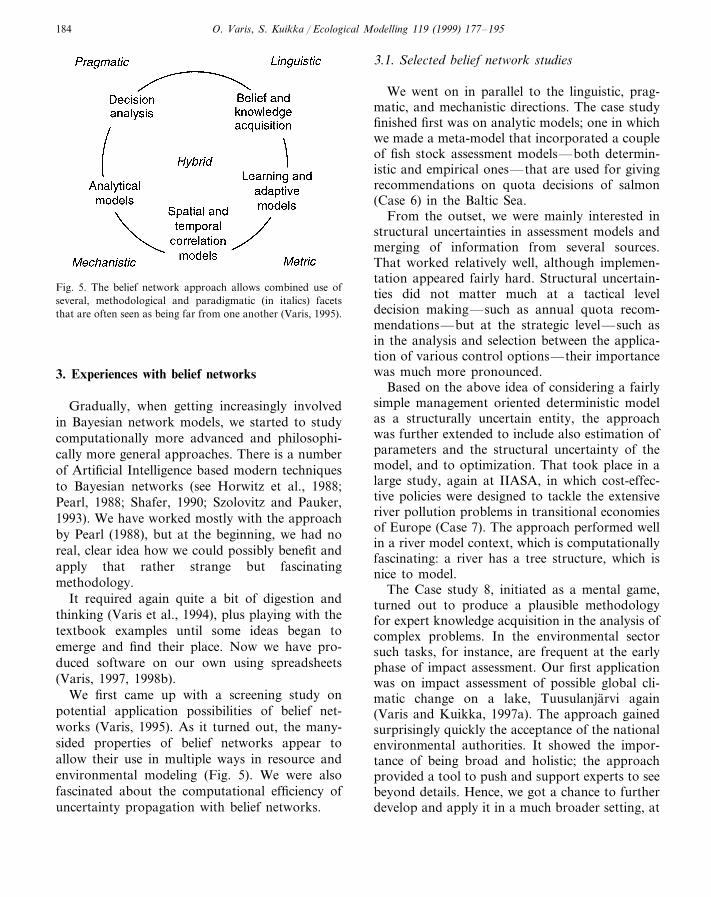
Fig. 5. The belief network approach allows combined use ofseveral, methodological and paradigmatic (in italics) facetsthat are often seen as being far from one another (Varis, 1995).
3.1. Selected belief network studies
We went on in parallel to the linguistic, prag-matic, and mechanistic directions. The case studyfinished first was on analytic models; one in whichwe made a meta-model that incorporated a coupleof fish stock assessment models—both determin-istic and empirical ones—that are used for givingrecommendations on quota decisions of salmon(Case 6) in the Baltic Sea.
From the outset, we were mainly interested instructural uncertainties in assessment models andmerging of information from several sources.That worked relatively well, although implemen-tation appeared fairly hard. Structural uncertain-ties did not matter much at a tactical leveldecision making—such as annual quota recom-mendations—but at the strategic level—such asin the analysis and selection between the applica-tion of various control options—their importancewas much more pronounced.
Based on the above idea of considering a fairlysimple management oriented deterministic modelas a structurally uncertain entity, the approachwas further extended to include also estimation ofparameters and the structural uncertainty of themodel, and to optimization. That took place in alarge study, again at IIASA, in which cost-effec-tive policies were designed to tackle the extensiveriver pollution problems in transitional economiesof Europe (Case 7). The approach performed wellin a river model context, which is computationallyfascinating: a river has a tree structure, which isnice to model.
The Case study 8, initiated as a mental game,turned out to produce a plausible methodologyfor expert knowledge acquisition in the analysis ofcomplex problems. In the environmental sectorsuch tasks, for instance, are frequent at the earlyphase of impact assessment. Our first applicationwas on impact assessment of possible global cli-matic change on a lake, Tuusulanjarvi again(Varis and Kuikka, 1997a). The approach gainedsurprisingly quickly the acceptance of the nationalenvironmental authorities. It showed the impor-tance of being broad and holistic; the approachprovided a tool to push and support experts to seebeyond details. Hence, we got a chance to furtherdevelop and apply it in a much broader setting, at
3. Experiences with belief networks
Gradually, when getting increasingly involvedin Bayesian network models, we started to studycomputationally more advanced and philosophi-cally more general approaches. There is a numberof Artificial Intelligence based modern techniquesto Bayesian networks (see Horwitz et al., 1988;Pearl, 1988; Shafer, 1990; Szolovitz and Pauker,1993). We have worked mostly with the approachby Pearl (1988), but at the beginning, we had noreal, clear idea how we could possibly benefit andapply that rather strange but fascinatingmethodology.
It required again quite a bit of digestion andthinking (Varis et al., 1994), plus playing with thetextbook examples until some ideas began toemerge and find their place. Now we have pro-duced software on our own using spreadsheets(Varis, 1997, 1998b).
We first came up with a screening study onpotential application possibilities of belief net-works (Varis, 1995). As it turned out, the many-sided properties of belief networks appear toallow their use in multiple ways in resource andenvironmental modeling (Fig. 5). We were alsofascinated about the computational efficiency ofuncertainty propagation with belief networks.
O. Varis, S. Kuikka / Ecological Modelling 119 (1999) 177–195 185
the final stage of the nationwide climatic changeresearch programme.
3.2. Case 6: Salmon fisheries management
The present state of wild Baltic salmon stocks ispoor. From the whole stock, the share of thesalmon with wild origin has decreased remarkablyduring the last decades to about 10% due to thelack of spawners (i.e. too high fishing mortality).The International Baltic Sea Fishery Commissionhas stated as the goal of the Baltic salmon man-agement to safeguard wild salmon stocks. Totalallowable catch (TAC) policy has been used toachieve this goal. The ICES produces the fishstock information.
The uncertainties of the stock predictions andTAC based management are high. To reducethem, some variables additional to the standardvirtual population analysis (VPA) approach canbe used. They include water temperature, post-smolt growth, and the CPUE. Both the scientificdiscussions on the usefulness of different informa-tion sources, and the assessment work itself werefound to require methodology that allows theconsideration of all relevant information at hand.This type of problems are common in fisheriesmanagement (Schnute and Hilborn, 1993).
To meet these requirements, a belief networkwas constructed, in which the VPA model and the
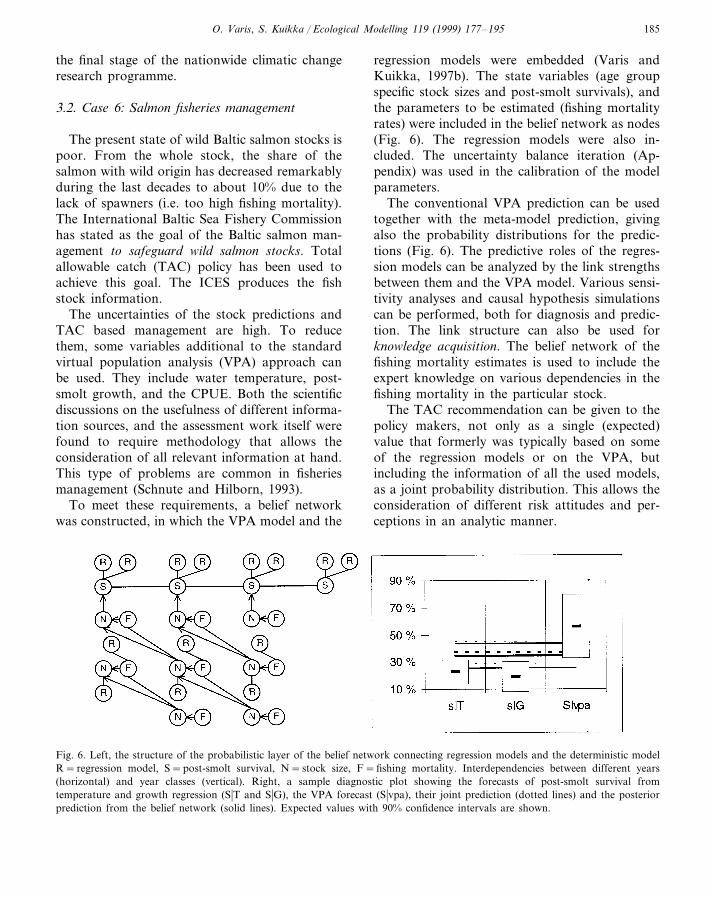
regression models were embedded (Varis andKuikka, 1997b). The state variables (age groupspecific stock sizes and post-smolt survivals), andthe parameters to be estimated (fishing mortalityrates) were included in the belief network as nodes(Fig. 6). The regression models were also in-cluded. The uncertainty balance iteration (Ap-pendix) was used in the calibration of the modelparameters.
The conventional VPA prediction can be usedtogether with the meta-model prediction, givingalso the probability distributions for the predic-tions (Fig. 6). The predictive roles of the regres-sion models can be analyzed by the link strengthsbetween them and the VPA model. Various sensi-tivity analyses and causal hypothesis simulationscan be performed, both for diagnosis and predic-tion. The link structure can also be used forknowledge acquisition. The belief network of thefishing mortality estimates is used to include theexpert knowledge on various dependencies in thefishing mortality in the particular stock.
The TAC recommendation can be given to thepolicy makers, not only as a single (expected)value that formerly was typically based on someof the regression models or on the VPA, butincluding the information of all the used models,as a joint probability distribution. This allows theconsideration of different risk attitudes and per-ceptions in an analytic manner.
Fig. 6. Left, the structure of the probabilistic layer of the belief network connecting regression models and the deterministic modelR=regression model, S=post-smolt survival, N=stock size, F=fishing mortality. Interdependencies between different years(horizontal) and year classes (vertical). Right, a sample diagnostic plot showing the forecasts of post-smolt survival fromtemperature and growth regression (S�T and S�G), the VPA forecast (S�vpa), their joint prediction (dotted lines) and the posteriorprediction from the belief network (solid lines). Expected values with 90% confidence intervals are shown.
O. Varis, S. Kuikka / Ecological Modelling 119 (1999) 177–195186
Fig. 7. Left, probabilistic layer in the diagnostic phase. Right, probabilistic layer in the policy analysis phase.
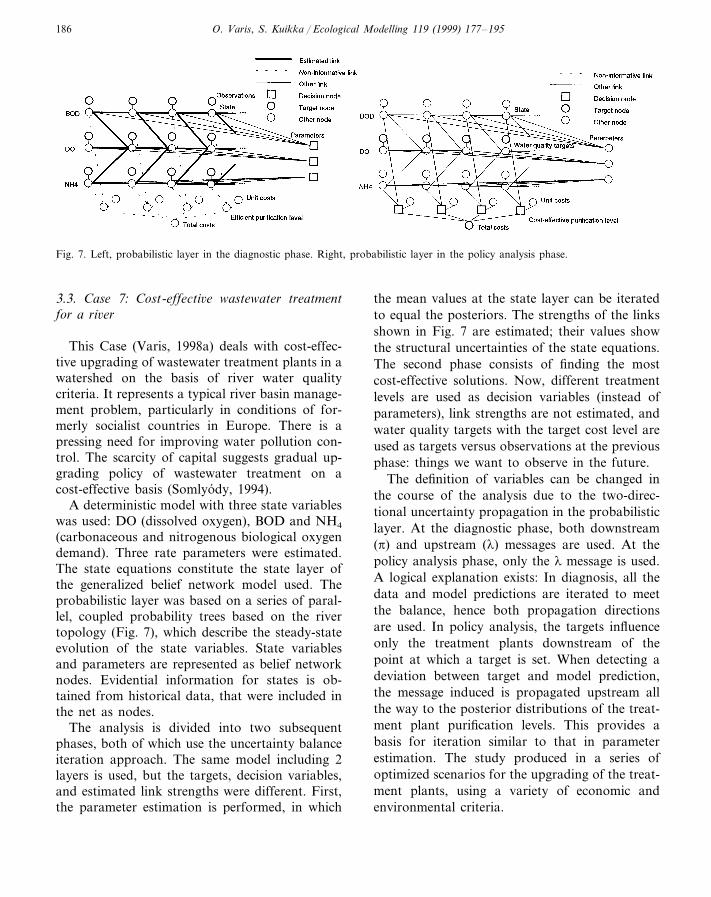
3.3. Case 7: Cost-effecti6e wastewater treatmentfor a ri6er
This Case (Varis, 1998a) deals with cost-effec-tive upgrading of wastewater treatment plants in awatershed on the basis of river water qualitycriteria. It represents a typical river basin manage-ment problem, particularly in conditions of for-merly socialist countries in Europe. There is apressing need for improving water pollution con-trol. The scarcity of capital suggests gradual up-grading policy of wastewater treatment on acost-effective basis (Somlyody, 1994).
A deterministic model with three state variableswas used: DO (dissolved oxygen), BOD and NH4
(carbonaceous and nitrogenous biological oxygendemand). Three rate parameters were estimated.The state equations constitute the state layer ofthe generalized belief network model used. Theprobabilistic layer was based on a series of paral-lel, coupled probability trees based on the rivertopology (Fig. 7), which describe the steady-stateevolution of the state variables. State variablesand parameters are represented as belief networknodes. Evidential information for states is ob-tained from historical data, that were included inthe net as nodes.
The analysis is divided into two subsequentphases, both of which use the uncertainty balanceiteration approach. The same model including 2layers is used, but the targets, decision variables,and estimated link strengths were different. First,the parameter estimation is performed, in which
the mean values at the state layer can be iteratedto equal the posteriors. The strengths of the linksshown in Fig. 7 are estimated; their values showthe structural uncertainties of the state equations.The second phase consists of finding the mostcost-effective solutions. Now, different treatmentlevels are used as decision variables (instead ofparameters), link strengths are not estimated, andwater quality targets with the target cost level areused as targets versus observations at the previousphase: things we want to observe in the future.
The definition of variables can be changed inthe course of the analysis due to the two-direc-tional uncertainty propagation in the probabilisticlayer. At the diagnostic phase, both downstream(p) and upstream (l) messages are used. At thepolicy analysis phase, only the l message is used.A logical explanation exists: In diagnosis, all thedata and model predictions are iterated to meetthe balance, hence both propagation directionsare used. In policy analysis, the targets influenceonly the treatment plants downstream of thepoint at which a target is set. When detecting adeviation between target and model prediction,the message induced is propagated upstream allthe way to the posterior distributions of the treat-ment plant purification levels. This provides abasis for iteration similar to that in parameterestimation. The study produced in a series ofoptimized scenarios for the upgrading of the treat-ment plants, using a variety of economic andenvironmental criteria.

O. Varis, S. Kuikka / Ecological Modelling 119 (1999) 177–195 187
3.4. Case 8: A nationwide climatic change impactassessment
Climatic change impact studies are among themost complicated environmental assessments thatscientists have ever faced. The risks and chancesthat policy-makers are facing are enormous. Al-though being dominated by uncertainties and in-terdisciplinary settings, the impact analyses aredominated by focused studies without a priorcross-sectoral scoping phase.
Using belief networks, a probabilistic impactmatrix approach was developed. Besides in cli-matic change research, the approach was designedto be applicable to conventional EnvironmentalImpact Assessment, where various impact ma-trices are common. The starting point is a sheetwith the most relevant attributes for the problemunder study, and a set of outcomes describingtheir possible future evolution. For each attribute,a discrete probability distribution is assessed bythe expert(s), describing its expected change. Us-
ing a cross-impact matrix, the expert(s) judge theinterdependencies (link strengths) between eachpair of attributes. The probability distributionsand link strengths are connected to a belief net-work, which updates the prior distributions (Fig.8). These posterior distributions should not di-verge much from the priors. If they do, though, asit often appears, the assessment is inconsistent.
An integrated assessment for the climaticchange impacts on the watersheds of southernFinland was made (Kuikka and Varis, 1997) usinga panel of 13 experts, who all were among theleading scientists in an extensive Finnish researchprogramme on Climatic Change. The present casestudy was one of the final assessments of theprogramme. This study included 24 attributes(Fig. 8). Comprehensive sensitivity analyses wereperformed on the information obtained. Thoseincluded studies of the roles of the attributes’states (expressed as probability distributions), aswell as the roles of the causalities between theattributes (expressed as links). Such analyses were
Fig. 8. Summary results of climatic change impact assessment for watersheds in southern Finland.
O. Varis, S. Kuikka / Ecological Modelling 119 (1999) 177–195188
made separately for each four groups of attributes.A range of results were produced, by analyzing
both the roles of different causalities in the models,as well as those of the states of the climatic,watershed, and socioeconomic variables. Wefound it very useful that both the state and thecausality uncertainties could be analyzed at thesame time. The study contributed to the compre-hension and acknowledgment of uncertaintyanalyses among the key scientists of theprogramme.
4. Discussion and conclusions
4.1. Experiences from organizations
As was explained in Introduction, we have beenable to apply this new methodology in severalinstitutes with different backgrounds. This gives usan opportunity to make some comments on theattitudes met. Probably the most positive attitudeshave been among university students; the method-ological orientation is not that deep at that stageof a scientific career. In Finnish national institutes,the attitude has been fairly positive as well, andseveral scientists have started to apply Bayesiannetworks to their own studies. However, the atti-tudes in the international institutes have been moreconservative. This is probably based on two facts:a very deep specialization on leads easily to aconservatives attitude, and on the other hand, acertain conservatism is justified in such cases,where the main task of the organization is anadvisory one. Mistakes might have an effect on thecredibility. However, it should be noted that evenin such cases the future development is totallydependent on the willingness to learn and applynew methodological tools and the historical bur-den should not be too restrictive.
4.2. Detecting typical features
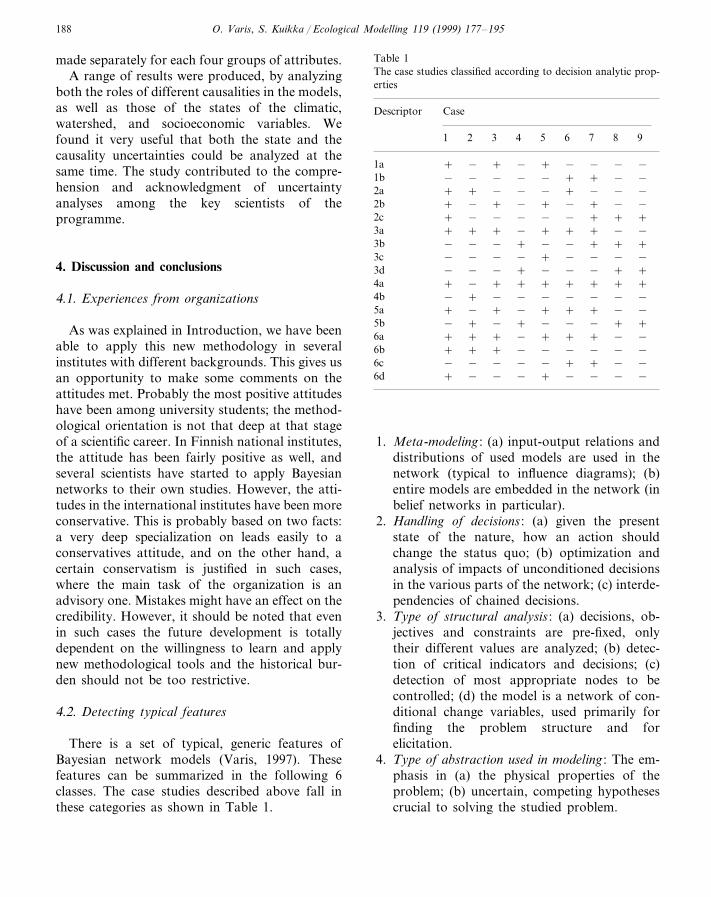
There is a set of typical, generic features ofBayesian network models (Varis, 1997). Thesefeatures can be summarized in the following 6classes. The case studies described above fall inthese categories as shown in Table 1.
Table 1The case studies classified according to decision analytic prop-erties
Descriptor Case
1 2 3 4 5 6 7 8 9
− −1a + − + − + − −+ + − −− − −1b −−
− −2a + + − − − + −2b −−+−+−+−+
++−− +−−−+2c+ + − −+ + −3a ++
− − − +3b − − + + +3c −−−−+−−−−
+−−− ++−−−3d4a ++ − + + + + ++
− − − −+4b −− − −+ − + −5a + + + − −
+− +5b −−−+−++ + + − −+ − + +6a
− −− −−6b −++++− −−6c −−− −+
−−−−+−+ −6d −
1. Meta-modeling : (a) input-output relations anddistributions of used models are used in thenetwork (typical to influence diagrams); (b)entire models are embedded in the network (inbelief networks in particular).
2. Handling of decisions : (a) given the presentstate of the nature, how an action shouldchange the status quo; (b) optimization andanalysis of impacts of unconditioned decisionsin the various parts of the network; (c) interde-pendencies of chained decisions.
3. Type of structural analysis : (a) decisions, ob-jectives and constraints are pre-fixed, onlytheir different values are analyzed; (b) detec-tion of critical indicators and decisions; (c)detection of most appropriate nodes to becontrolled; (d) the model is a network of con-ditional change variables, used primarily forfinding the problem structure and forelicitation.
4. Type of abstraction used in modeling: The em-phasis in (a) the physical properties of theproblem; (b) uncertain, competing hypothesescrucial to solving the studied problem.

O. Varis, S. Kuikka / Ecological Modelling 119 (1999) 177–195 189
5. Units used : (a) measured (absolute) units; (b)relative units.
6. Dealing with objecti6es : (a) minimize ormaximize expected values; (b) expectedvalue—variance trade-off; (c) otherapproaches to uncertainty; (d) value ofinformation analysis.
4.3. Methodological lessons
The most important lessons as presented in thetext are:� Starting with an unconventional approach re-
quires time, imagination and ability to seeanalogies
� Getting other people to understand and acceptthe idea is often still more demanding
� Risk averse manager acts while risk prone onekeeps studying
� Each modification of the model structure re-defines the problem
� Data collection is an investment to reduceuncertainty
� Sometimes just complex interconnections are ofinterest
� Structural uncertainty of a deterministic modelcan be modeled
� It is at the strategic level where the structuraluncertainties really matter
� We can even do parameter estimation and opti-mization with belief nets
� Experts should be able and be supported to seebeyond details
� Different experts have different and inconsis-tent judgments but a consensus is needed
� Analysis should be problem driven, not theother way round
� Bayesian decision analysis is not just parameterestimationWe try to avoid giving the message that
Bayesian decision analysis should be the onlyavailable tool to the problems we have described.Instead, in some other contexts, we have stronglyadvocated to the importance of a broad methodo-logical knowledge, and conscious choice of theused methodology (Varis, 1994, 1996). This is avery tough educational challenge.
As a final remark, we would again like to pointout that the methodology used should be in theservice of problem solving, and therefore, themethod and the domain must be deeply compre-hended, not just one of them. This induces achallenge and incentive to move towards interdis-ciplinarity: domain experts, methodology people,and decision makers should understand eachother and be able to work together.
Acknowledgements
The authors are most thankful to the co-opera-tion with a number of individuals and institutionsover the years. We want to acknowledge in partic-ular P. Vakkilainen, J. Kettunen, A. Salo, H.Sirvio, R.P. Hamalainen, L. Somlyody, K. Vei-tola, P. Lounamaa, and M.B. Beck.
Appendix A. The Approaches
Within environmental and resource manage-ment, the applications of Bayesian analysis havebeen dominated by classical Bayesian inference,i.e. parameter estimation, in which the Bayesiananalysis is restricted to the parameter space. Indecision theory, the idea of considering the entiremodel as a construct subject to uncertainty andsubjectivity stem from the game theory of the1930s and ‘40s (Shafer, 1990). At that time itbecame evident that costs and constraints must beexplicit, due to improved estimates, used confi-dence interval requirements or statistical testschosen (Shafer, 1990). Games evolved into se-quential games against uncontrolled ‘nature’, andabstractions such as decision trees were devel-oped. Bayesian decision theory gained increasingnotice and emphasis (Wald, 1950). The basic the-ory was developed into more applicable level to-wards the late 1960s (Howard, 1968; North, 1968;Raiffa, 1968).
Important topics in contemporary decisionanalysis include risk attitude analysis (Pratt,1964), value-of-information analysis (Merkhofer,1977), multiattribute and multicriteria issues(Keeney and Raiffa, 1976), several behavioral and
O. Varis, S. Kuikka / Ecological Modelling 119 (1999) 177–195190
cognitive issues (Kahnemann et al., 1973; vonWinterfeldt and Edwards, 1986), and computa-tional techniques. We have tried to contribute tothe diffusion of these all to applications in re-source and environmental management with vary-ing success. For more information on Bayesiandecision analysis, see Raiffa (1968), Bunn (1984),Howard and Matheson (1984), Baird (1989),Morgan and Henrion (1990), Oliver and Smith(1990), Clemen (1991), Marshall and Oliver(1995), and Russell and Norvig (1995).
Conventionally, one of the major bottlenecks topractical applications of Bayesian approaches hasbeen the high amount of computation required.Powerful numerical techniques have not beenavailable until mid-1980’s. According to Shaferand Pearl (1990), the recent developments in deci-sion analysis have been linked with advances inrelated computational mathematics. Artificial In-telligence has had a rapidly growing influencewithin the last 10 years.
The focal role has been taken by computationalschemes for local updating of probabilistic infor-mation in conditioned networks. The problem hasbeen approached both from the direction of theDempster–Shafer Theory of Evidence (e.g. Gor-don and Shortliffe, 1985; Shenoy and Shafer,1986), and from Bayesian statistics (e.g. Pearl,1986a,b, 1988). Yet, in the resulted methodolo-gies—known as belief networks, causal networks,Bayesian nets, qualitative Markov networks, orconstraint networks—this division is difficult orimpossible to distinguish. We call these techniquesbelief networks, as appears to be more and morethe convention.
Below, 3 practical approaches to Bayesian deci-sion analysis; decision trees, influence diagrams,and belief networks, are briefly reviewed. A con-ceptual introduction on each is given, with anillustrative example.
Decision trees have been the best known andused graphical abstraction used in Bayesian deci-sion theory over many decades. In historical per-spective, the roots of decision trees are even olderthan those of modern Bayesian decision theory.They can be seen as a special case of von Neu-mann and Morgenstern (1944) game tree. Thebasic idea is that the events, both controllable
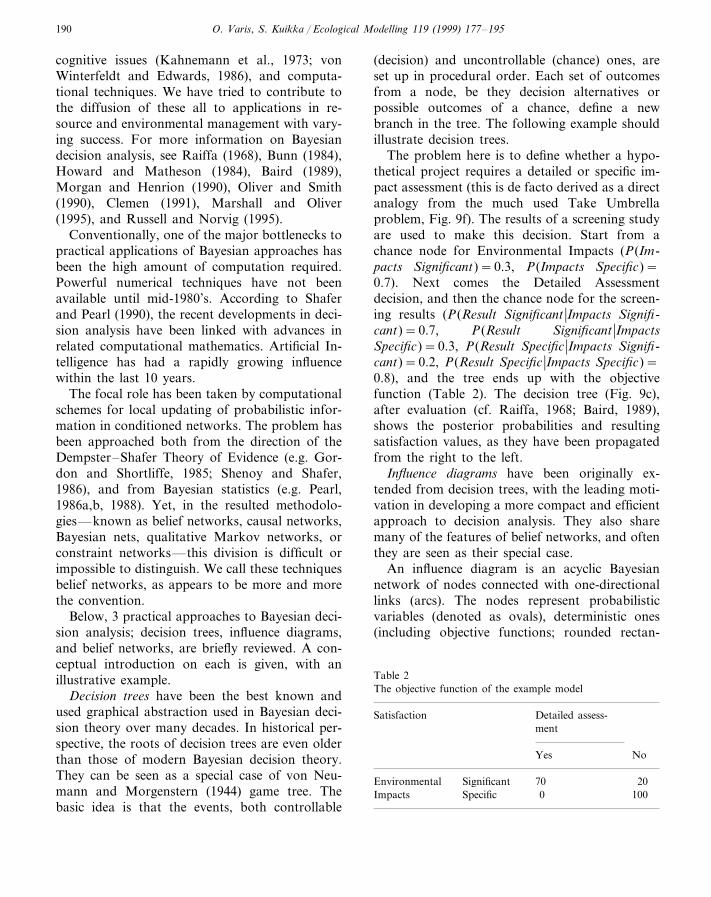
(decision) and uncontrollable (chance) ones, areset up in procedural order. Each set of outcomesfrom a node, be they decision alternatives orpossible outcomes of a chance, define a newbranch in the tree. The following example shouldillustrate decision trees.
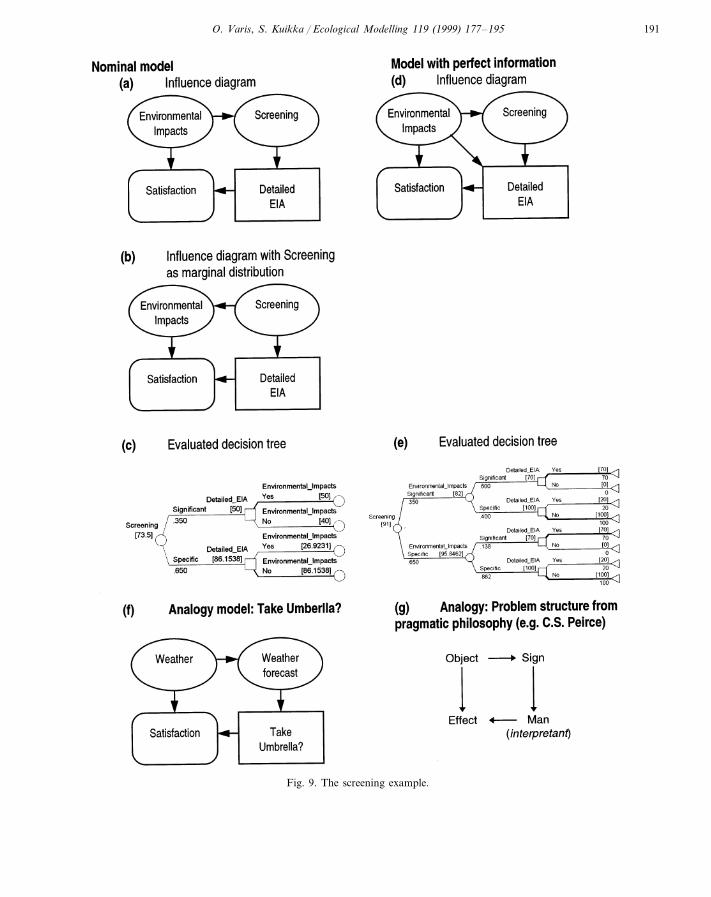
The problem here is to define whether a hypo-thetical project requires a detailed or specific im-pact assessment (this is de facto derived as a directanalogy from the much used Take Umbrellaproblem, Fig. 9f). The results of a screening studyare used to make this decision. Start from achance node for Environmental Impacts (P(Im-pacts Significant)=0.3, P(Impacts Specific)=0.7). Next comes the Detailed Assessmentdecision, and then the chance node for the screen-ing results (P(Result Significant �Impacts Signifi-cant)=0.7, P(Result Significant �ImpactsSpecific)=0.3, P(Result Specific �Impacts Signifi-cant)=0.2, P(Result Specific �Impacts Specific)=0.8), and the tree ends up with the objectivefunction (Table 2). The decision tree (Fig. 9c),after evaluation (cf. Raiffa, 1968; Baird, 1989),shows the posterior probabilities and resultingsatisfaction values, as they have been propagatedfrom the right to the left.
Influence diagrams have been originally ex-tended from decision trees, with the leading moti-vation in developing a more compact and efficientapproach to decision analysis. They also sharemany of the features of belief networks, and oftenthey are seen as their special case.
An influence diagram is an acyclic Bayesiannetwork of nodes connected with one-directionallinks (arcs). The nodes represent probabilisticvariables (denoted as ovals), deterministic ones(including objective functions; rounded rectan-
Table 2The objective function of the example model
Satisfaction Detailed assess-ment
Yes No
Environmental Significant 70 20Specific 1000Impacts
O. Varis, S. Kuikka / Ecological Modelling 119 (1999) 177–195 191
Fig. 9. The screening example.

O. Varis, S. Kuikka / Ecological Modelling 119 (1999) 177–195192
gles), and decisions (rectangles). Like a decisiontree, the diagram describes causality or the flow ofinformation and probabilistic dependencies in asystem. For details, see Howard and Matheson(1984), Shachter (1986), Oliver and Smith (1990)and Clemen (1991).
The influence diagram model for the exampleproblem has four nodes (Fig. 9a). The uncontrol-lable prior—the Environmental Impacts, or moregenerally, the state of the nature—is a quantitywhich is not yet known accurately. The Screeningnode contains a conditional probability distribu-tion, conditioned by the state of the nature. Thescreening results are known at the moment ofdecision on Detailed Assessment. The Satisfactionto the exercise depends on the state of the natureand on the decision. This model gives exactly thesame result as the decision tree model, the onlydifference being in the notation used.
The influence diagram notation provides theanalyst with some attractive and useful properties.One of them is the way to perform the value ofinformation analysis. It might be of interest toknow the maximum additional amount of moneythat one should spend on a screening analysis.Assume now that at the moment of decisionmaking the state of the nature is exactly known.In the influence diagram (Fig. 9d), this would bedenoted by drawing a direct link from En6iron-mental Impacts to Detailed Assessment. Evalua-tion of the model without this new link yields theexpected value of objective function to be 73.5,and with the new link, it becomes 91 (Fig. 9e).This difference, 17.5 units, is the expected value ofperfect information of screening, being the maxi-mum amount one should invest on it. Similarly,one can study the value of imperfect informationand the value of imperfect and perfect control(Clemen, 1991; Lapin, 1991).
Belief networks belong to the Bayesian family ofmodern computational techniques that haveemerged from Artificial Intelligence research.Among the many existing variations of the idea,we will concentrate on the generalized belief net-work approach by Varis (1998a) which has beenextended from Pearl (1988) methodology.
The network has n nodes that can arbitrarily beinterconnected. The prior probabilities assigned to
the outcomes are updated with the informationlinked from the net’s other parts, yielding theposterior distribution. The posteriors Belj are cal-culated using two independent messages (usuallyp and l). The updated belief is obtained as theproduct of them and the prior.
Some nodes may be understood as controllable,decision nodes. One or several nodes can act as acriterion or constraint for decision making, andconstitute one or more objective functions.
A link transfers information from a node toanother node. Links are in two layers. An uncer-tainty link is defined as the link matrix Mi � j be-tween nodes i and j. The matrix can be directionspecific: Mi � j"Mj �i. A state link presents a rela-tion between outcomes yi and yj of i and j. Be-cause the approach requires that each outcomehas one value, the propagation of outcome valuesis unidirectional, and a functional relationshipexists, yi= f(yj). Technically, the approach dividesthe model into two layers in communication withone another. These deterministic equations consti-tute the state layer, and the belief network consti-tutes the probabilistic layer.
Varis (1998a) developed the uncertainty balanceapproach to allow various optimization tasks us-ing belief networks. The key proposition is thatthe prior and posterior probability distributionsof the target variables (observations, managementgoals, constraints, etc.) should become equal. Thisimplies that the joint distributions of the externalinformation (prior) should equal to the modeleddistribution (posterior) and assures proper utiliza-tion of the prior information. This occurs byfinding optimal values for control variables (in-cluding parameters), and for link strengths (ex-pressing the structural uncertainty of the modelequations) by iteration (Fig. 10, see also Varis andKuikka, 1997b). The approach has been designedto be as interactive as possible and to be operatedon-line.
The two-directional uncertainty scheme is illus-trated with the following example. The modelused contains only the probabilistic layer. Forsimplicity, the state layer and the use of decisionvariables have been left out. The example comesfrom fish stock assessment and fisheries restric-tions. Data collection from nature is most often

O. Varis, S. Kuikka / Ecological Modelling 119 (1999) 177–195 193
Fig. 10. Outline of the uncertainty balance iteration (Varis,1998a).
Fig. 12. Propagation of fish stock information to fish catch (a)and v.v. (b) impacts of controversial information.
The following notation is used: estock is theinformation from returned taggings, ecatch is the onefrom taxation records, p is the likelihood messagefrom fish stock to fish catch, l is the one from fishcatch to fish stock, M is the link matrix equal inboth directions, and a and b are scaling parameters.We obtain the posteriors of the elements r ofvariables Belstock and Belcatch by
Belrstock=P(stockr�ercatch)=a P(stockr) lr
=a erstock lrBelrcatch=P(catchr�er
stock)
=b P(catch r) pr=b ercatch pr
The messages p and l are
p=M estockl=M ecatch
Examine now the propagation of information inthis model. First, assume that the link matrix is asgiven in Fig. 12, and information from returnedtaggings is estock= [0.1, 0.3, 0.6]T, implying that thestock is likely to grow. No other information isthere (Fig. 12a). Second, the information, insteadof stock, exists on catch only: ecatch= [0.8, 0.15,0.05]T (Fig. 12b). The state layer can be constructedby defining a deterministic relation between out-comes of the variables.
References
Baird, B.F., 1989. Managerial Decisions Under Uncertainty.Wiley, NY.
Bunn, D.W., 1984. Applied Decision Analysis. McGraw-Hill,New York.
Clemen, R.T., 1991. Making Hard Decisions. PWS Kent,Boston.
out of the question due to high costs, and indirectdata are typically used. This type of data tends tobe corrupted by many types of biases. Decisions onallowable catches are needed regularly, often on anannual basis.
The simplest possible model for the systemincludes two mutually dependent variables: fishstock and fish catch per fishing unit (e.g. one fishingnight; Figs. 11 and 12). This dependency is usuallyused in assessment of both variables. There areseveral ways of obtaining independent informationon them. Here, fish stock assessment is based oncatch estimates and the number of returned tag-gings, and the catch assessment on stock estimatesand taxation records of professional fishermen orenterprises. The outcomes of both variables are a30% decrease from the previous year, unchangedlevel, and a 30% increase from previous year.
In the scale under consideration, fish stock canbe seen as the cause and fish catch as the effect.Assessment from cause to effect and vice versa isa strength in any environmental and resourcemanagement task (cf. Shachter and Heckerman1987). In a longer time frame, over several years,there is also a feedback from fish catch to fish stock.
Fig. 11. The example model.

O. Varis, S. Kuikka / Ecological Modelling 119 (1999) 177–195194
Gordon, J., Shortliffe, E.H., 1985. A method of managingevidential reasoning in a hierarchical hypothesis space.Artif. Intellig. 26, 323–357.
Hilden, M., Rapport, D., 1993. Four centuries of cumulativeimpacts on a Finnish river and its estuary: an ecosystemhealth approach. J. Ecosyst. Health 2, 261–275.
Horwitz, E.J., Breese, J.S., Henrion, M., 1988. Decision theoryin expert systems and artificial intelligence. Int. J. Ap-proxim. Reasoning 2, 247–302.
Howard, R.A., 1968. The foundations of decision analysis.IEEE Trans. Syst. Man Cybern. 4, 211–219. Howard,R.A., 1990. From influence to relevance to knowledge. In:Oliver, R.M., Smith, J.Q. (Eds.), Influence Diagrams, Be-lief Nets and Decision Analysis. Wiley, Chichester.
Howard, R.A., Matheson, J.E. (Eds.), 1984. The Principlesand Applications of Decision Analysis. Vols. I and II.Strategic Decision Group, Menlo Park, CA.
Kahnemann, D., Slovic, P., Tversky A. (Eds.), 1973. Judge-ment Under Uncertainty, Heuristics and Biases. Cam-bridge University Press, Cambridge, MA.
Keeney, R.L., Raiffa, H. 1976. Decisions with Multiple Objec-tives: Preferences and Value Tradeoffs. Wiley, NY.
Kløve, B., Kettunen, J., Varis, O., Vakkilainen, P., Sirvio, H.,1993. A real-time monitoring system for Kerava riverquality. Environm. Monit. Assessm. 24, 167–180.
Kuikka, S., 1998. Uncertainty Analysis in Fisheries Manage-ment Science-Baltic Sea Applications. PhD Thesis. Univer-sity of Helsinki, Faculty of Agriculture and Forestry,Helsinki.
Kuikka, S., Varis, O., 1997. Uncertainties of climatic changeimpacts in Finnish watersheds: a Bayesian network analy-sis of expert knowledge. Boreal Environm. Res. 2, 109–128.
Kuikka, S., Gislason, H., Hansson, S., Hilden, M., Sparholt,H., Varis, O., 1999. Environmentally Driven Uncertaintiesin Baltic Cod Management-Modelling by Bayesian Influ-ence Diagrams. Can. J. Fish. Aquat. Sci. (in press)
Lapin, L.L., 1991. Quantitative Methods for Business Deci-sions. 5th Ed. HBJ-Dryden, Fort Worth.
Marshall, K.T., Oliver, R.M., 1995. Decision Making andForecasting. McGraw-Hill, NY.
Merkhofer, M.W., 1977. The value of information given deci-sion flexibility. Managem. Sci. 23, 716–727.
Morgan, M.G., Henrion, M., 1990. Uncertainty, A Guide toDealing with Uncertainty in Quantitative Risk and PolicyAnalysis. Cambridge University Press, Cambridge, MA.
North, D.W., 1968. A tutorial introduction to decision theory.IEEE Trans. Syst. Sci. Cybern. 4, 3.
Oliver, R.M., Smith, J.Q., 1990. Influence Diagrams, BeliefNets and Decision Analysis. Wiley, Chichester.
Pearl, J., 1986a. Fusion, propagation, and structuring in beliefnetworks. Artif. Intellig. 29, 241–288.
Pearl, J., 1986b. On evidential reasoning in a hierarchy ofhypotheses. Artif. Intellig. 28, 9–15.
Pearl, J., 1988. Probabilistic Reasoning in Intelligent Systems:Networks of Plausible Inference. Morgan-Kaufmann, Sanmateo, CA.
Pratt, J.W., 1964. Risk aversion in the small and in the large.Econometrica 32, 122–136.
Raiffa, H., 1968. Decision Analysis. Addison-Wesley, Read-ing, MA.
Russell, S., Norvig, P., 1995. Artificial Intelligence: A ModernApproach. Prentice Hall, Englewood Cliffs, NJ.
Schnute, J.T., Hilborn, R., 1993. Analysis of contradictorydata sources in fish stock assessment. Can. J. Fish. Aquat.Sci. 50, 1916–1923.
Shachter, R.D., 1986. Evaluation of influence diagrams. Oper.Res. 34, 871–882.
Shachter, R.D., Heckerman, D.E., 1987. Thinking backwardfor knowledge acquisition. AI Magazine Fall 1987, 55–61.
Shafer, G., 1990. Decision Making. In: Shafer, G., Pearl, J.(Eds.), Readings in Uncertain Reasoning. Morgan-Kauf-mann, San Mateo, CA.
Shafer, G., Pearl, J., 1990. Readings in Uncertain Reasoning.Morgan-Kaufmann, San Mateo, CA.
Shenoy, P.P., Shafer, G., 1986. Propagating belief functionswith local computations. IEEE Expert. Fall 1986, 43–52.
Sirvio, H. 1988. M.Sc. Thesis. Helsinki University of Technol-ogy, Laboratory of Hydrology and Water Resources Man-agement, Espoo, Finland.
Sistonen, K. 1995. M.Sc. Thesis, Helsinki University of Tech-nology, Laboratory of Water Resources, Espoo, Finland.
Somlyody, L., 1994. Quo vadis water quality management inCentral and Eastern Europe? Water Sci. Technol. 30 (5),1–14.
Szolovitz, P., Pauker, S.G., 1993. Categorical and probabilisticreasoning in medicine revisited. Artif. Intellig. 59, 167–180.
Varis, O., 1994. Water quality models: tools for the analysis ofdata, knowledge, and decisions. Water Sci. Technol. 30 (2),13–19.
Varis, O., 1995. Belief networks for modelling and assessmentof environmental change. Environmetrics 6, 439–444.
Varis, O., 1996. Water quality models: typologies for environ-mental impact assessment. Water Sci. Technol. 34 (12),109–117.
Varis, O., 1997. Bayesian decision analysis for environmentaland resource management. Environm. Modell. Softw. 12,177–185.
Varis, O., 1998a. A belief network approach to optimizationand parameter estimation: application to resource andenvironmental management. Artif. Intellig. 101, 135–163.
Varis, O. 1998b. F.C. BeNe (Fully Connected Belief Net-works): A Spreadsheet Toolkit for Problems with Several,Highly Uncertain and Interrelated Variables. Version 1.0User’s Guide. Helsinki University Press, Helsinki.
Varis, O., Kuikka, S. 1990. Analysis of sardine fisheries man-agement on Lake Kariba, Zimbabwe and Zambia—struc-turing a Bayesian influence diagram model. WP-90-48,International Institute for Applied Systems Analysis, Lax-enburg, Austria.
Varis, O., Kuikka, S., 1997a. BeNe-EIA: a Bayesian approachto expert judgment elicitation with case studies on climaticchange impacts on surface waters. Climatic Change 37,539–563.

O. Varis, S. Kuikka / Ecological Modelling 119 (1999) 177–195 195
Varis, O., Kuikka, S., 1997b. Joint use of multiple environ-mental assessment models by a Bayesian meta-model: theBaltic salmon case. Ecol. Model. 102, 341–351.
Varis, O., Kettunen, J., Sirvio, H., 1990. Bayesian influencediagram approach to complex environmental managementincluding observational design. Comp. Stat. Data Analysis9, 77–91.
Varis, O., Kløve, B., Kettunen, J., 1993. Evaluation of areal-time forecasting system for river water quality—atrade-off between risk attitudes, costs and uncertainty.Environm. Monit. Assessm. 28, 201–213.
Varis, O., Kuikka, S., Taskinen, A., 1994. Modeling for waterquality decisions: uncertainty and subjectivity in informa-tion, in objectives, and in model structure. Ecol. Modelling74, 91–101.
von Neumann, J., Morgenstern, O., 1944. Theory of Gamesand Economic Behavior. Princeton University Press,Princeton, NJ.
von Winterfeldt, D., Edwards, W., 1986. Decision Analysisand Behavioral Research. Cambridge University Press,Cambridge, MA.
Wald, A., 1950. Statistical Decision Functions. Wiley, NY.
..