LEAR BofA InvestmentConf 1831 cx
28
® September 16, 2008 September 16, 2008 Bank of America 38th Annual Investment Conference Bank of America 38th Annual Investment Conference San Francisco, CA San Francisco, CA
-
Upload
finance16 -
Category
Economy & Finance
-
view
199 -
download
4
Transcript of LEAR BofA InvestmentConf 1831 cx

®
September 16, 2008September 16, 2008
Bank of America 38th Annual Investment Conference
Bank of America 38th Annual Investment Conference
San Francisco, CASan Francisco, CA

2
Agenda
Company Overview and Strategic Direction
Financial Update and Outlook
Questions

3
Company Overview and Strategic Direction

4
Lear Profile
Lear is a leading, global automotive supplier. . .We have strong market positions in our core products:
Complete seating systems Electrical distribution systems Select electronics products
We serve all the world’s major automakersWe are recognized as a leader in product quality, customer service and innovationWe have a proven track record of sales growth and financial stability
5
Leading Global Automotive Supplier
More Than 90,000 Employees At 215 More Than 90,000 Employees At 215 Locations In 35 CountriesLocations In 35 Countries

6Sources: CSM Worldwide survey data / Lear estimates (based on independent suppliers)
Electrical Distribution Systems
• Annual sales of $2.2 billion• Among leaders in wire harnesses:
- #3 in North America and #4 in Europe• Proprietary terminals and connectors• Portfolio of hybrid electrical components
• Annual sales of $900 million• Leader in junction box technology• Niche player in electronic modules,
wireless products, premium audio/video systems and tire pressure monitoring systems
• Annual sales of $12.2 billion • #2 globally, in a market estimated
to be $45 to $50 billion in size:- #2 in North America- #3 in Europe- Leader in China and India
• Lear is the highest quality major seat manufacturer for 7 of the 8 last years, according to J.D. Power Seat Survey
• First to market SoyFoam™ and leader in whiplash protection with ProTecPLuS™
Electronic Products
Seating SystemsStrong Market Position In Core Products

7Lear Content On Over 300 Vehicles WorldwideLear Content On Over 300 Vehicles Worldwide
We Serve All The World’s Major Automakers
8
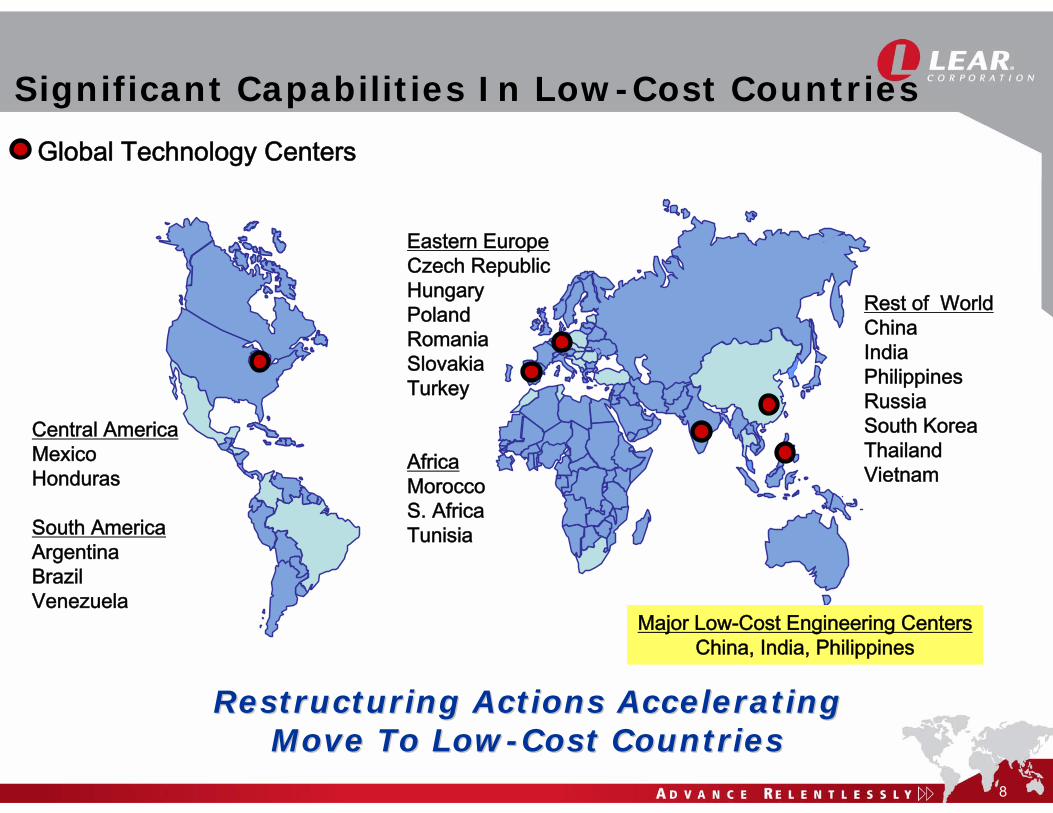
Significant Capabilities In Low-Cost Countries
Restructuring Actions AcceleratingRestructuring Actions AcceleratingMove To LowMove To Low--Cost CountriesCost Countries
Central AmericaMexicoHonduras
South AmericaArgentinaBrazilVenezuela
Eastern EuropeCzech RepublicHungaryPolandRomaniaSlovakiaTurkey
AfricaMoroccoS. AfricaTunisia
Rest of WorldChinaIndiaPhilippinesRussiaSouth KoreaThailandVietnam
Global Technology Centers
Major Low-Cost Engineering CentersChina, India, Philippines

9
“Supplier of the Year” for global Seating Systems
3 World Excellence Awards--•"Gold Award” at Genk, Belgium seating plant•"Silver Award” and "Recognition of Achievement for consumer-driven Six-Sigma”
at St. Thomas, Ontario Canada seating plant
“Superior Supplier Diversity” and “Excellence in Quality”
“Outstanding Performance – Quality and Delivery”at East London, South Africa
“Excellence in Performance” for Wire Harnesses
“Outstanding Supplier Performance Award” at Boeblingen, Germany
“Value Analysis / Value Engineering Performance Award” and“Value Analysis Award” for most cost saving ideas generated
“Supplier Award for Successful Partnership” in Brazil
“Supplier of the Year” at Liuzhou, China
“…Most Impressive Stereo Sound in the World”(from March 2007 review of Lear’s premium sound system in the BMW M5)
Environmental Innovation Award 2007 for SoyFoam™(Institute for Transport Management)
2007 Customer Awards2007 Customer Awards
Industry RecognitionIndustry Recognition
Recognized As An Industry Leader

10
Solid History Of Sales Growth*
* Excludes Interior business
$5.5
1997 1998 1999 2000 2001 2002 2003 2004 2005 2006 2007
Net Sales (Consolidated) ($ Billions)
10 Year CAGR = 11%
Over 90 years of automotive historyCustomer base includes all major automakers worldwideAble to maintain/grow sales even as traditional North American customers experience market share declinesAsian-related sales (consolidated and unconsolidated) have grown from $500 million in 2002 to $2.9 billion in 2007
Over 90 years of automotive historyCustomer base includes all major automakers worldwideAble to maintain/grow sales even as traditional North American customers experience market share declinesAsian-related sales (consolidated and unconsolidated) have grown from $500 million in 2002 to $2.9 billion in 2007
$15.3

11
Long-Term Outlook For Business*
Longer-Term Industry OutlookGlobal growth in automotive demand/further consolidation of supply baseCritical success factors are global capabilities, a low-cost footprint and superior qualityLeading technologies and innovation are key differentiating factors
Lear Well Positioned To SucceedAutomotive Seating
Global capability and scaleSales diversification increasingRestructuring strengthening long-term competitivenessIncreasing low-cost footprint – manufacturing and engineeringSelective vertical integration in key componentsAmong leaders in technology and innovationRecognized industry leader in quality
Electrical + ElectronicsElectrical and electronic content growingConsolidating segmentsSignificant growth opportunityGlobal presence and capabilitiesEvolving low-cost footprintInvesting in key technologies (e.g. Hybrid, electric vehicle)
* Please see slide titled “Forward-Looking Statements” at the end of this presentation for further information.

12
Strategic Objectives*
#1 market position in North America, Europe, China and IndiaWell-diversified sales mix – balanced customer, market and platform representationSelectively increased vertical integration in key componentsTechnology/technical solution leader in all key areas of seating development and manufacturing
* Please see slide titled “Forward-Looking Statements” at the end of this presentation for further information.
Among top-tier wire harness suppliers globallyDiversified customer mixLowest-cost footprintTechnical expertise in high-voltage/low-voltage power distribution architectures and system integration
Leadership Position in Seating
Achieve Critical Scale in Electrical Distribution
Grow Electronics
Leverage industry-leading junction box, wireless and related electronic technology to substantially increase global sales
13
Financial Review and Outlook

14
2008 Business Conditions Very Challenging*
North American industry production down sharply:
Full-year outlook lowest since the early 1990s
Dramatic shift away from full-size pickups and large SUVs in North America
Continued restructuring at major North American customers
High raw material and energy prices persist
Continued growth in emerging markets
* Please see slide titled “Forward-Looking Statements” at the end of this presentation for further information.
Challenging Conditions Likely To Continue Into 2009Challenging Conditions Likely To Continue Into 2009

15
Operating Priorities*
Business conditions in North America are likely to remain challenging into 2009In response, the Lear team is focused on:
Maintaining operational excellenceFurther diversifying our sales outside of North AmericaImplementing structural cost reduction actionsSelectively investing in growth opportunitiesProactively managing our liquidity position
We are well positioned to weather the downturn and to emerge as an even stronger competitor when external factors improve
Improving Our Business Structure Improving Our Business Structure For LongFor Long--Term Success Term Success
* Please see slide titled “Forward-Looking Statements” at the end of this presentation for further information.
16
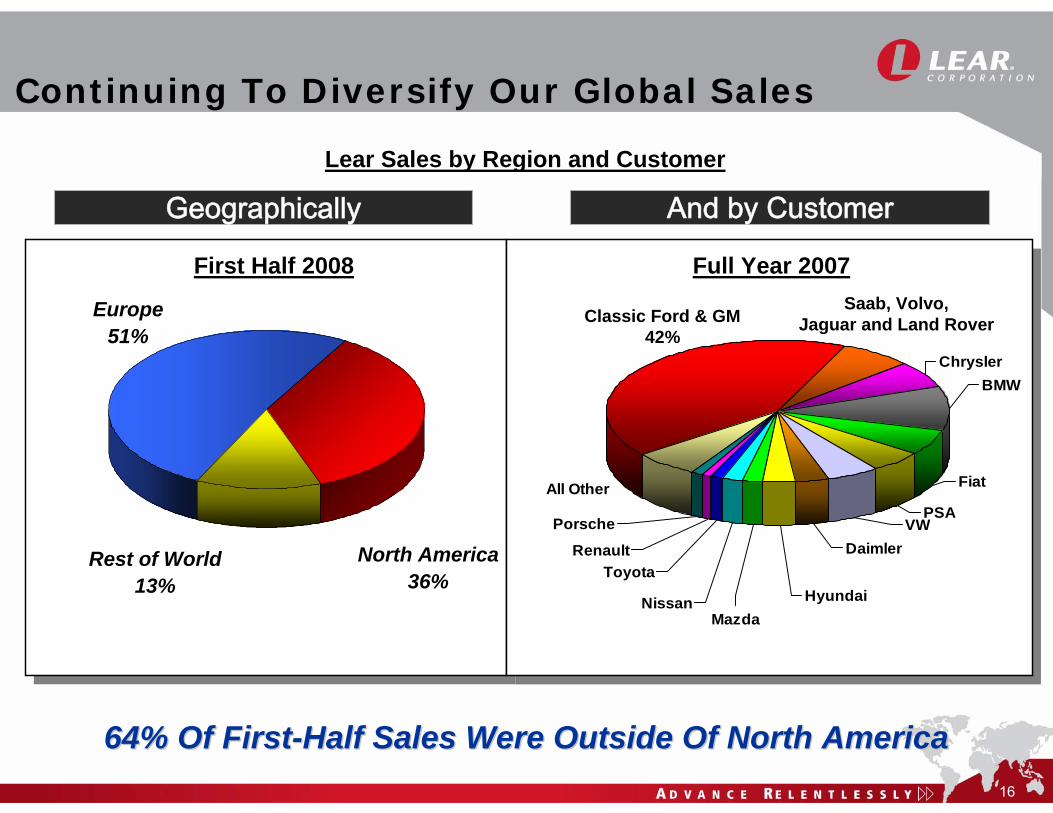
Continuing To Diversify Our Global Sales
Geographically And by Customer
North America36%
Europe51%
Rest of World 13%
64% Of First64% Of First--Half Sales Were Outside Of North AmericaHalf Sales Were Outside Of North America
Lear Sales by Region and Customer
Porsche
Nissan
Toyota
Mazda
Renault
Chrysler BMW
FiatAll OtherPSA
VWDaimler
Hyundai
First Half 2008 Full Year 2007Saab, Volvo,
Jaguar and Land RoverClassic Ford & GM42%
17
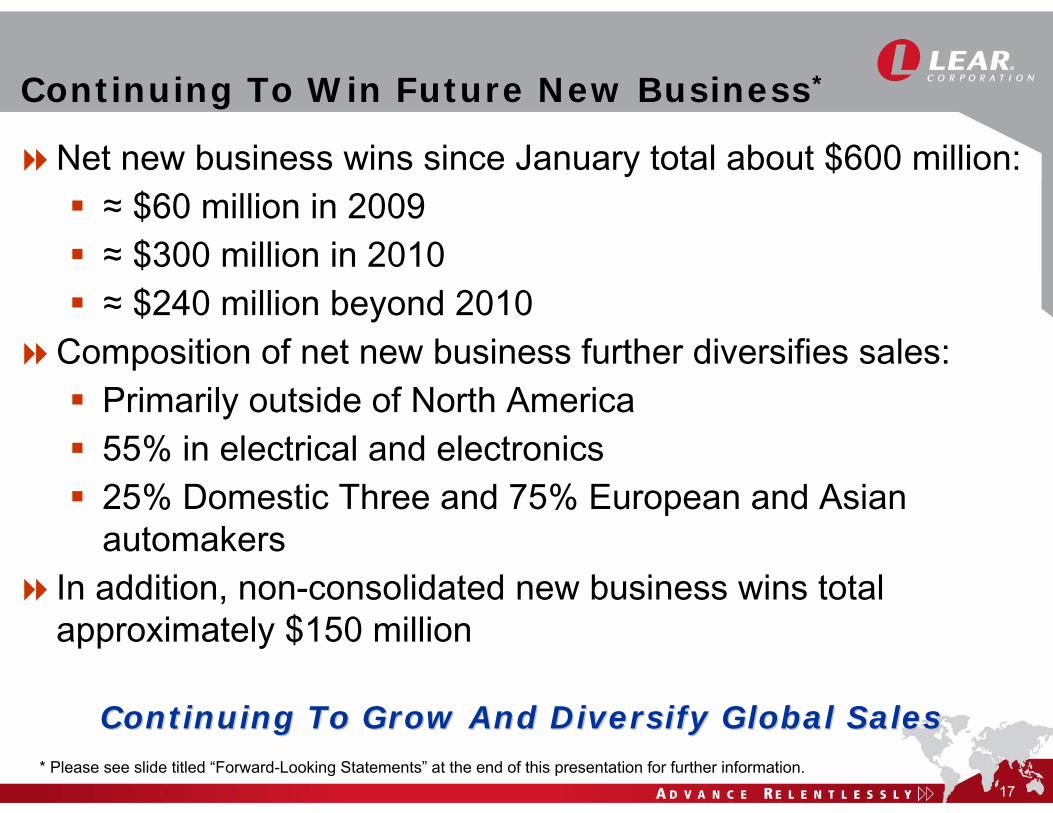
Continuing To Win Future New Business*
Net new business wins since January total about $600 million:≈ $60 million in 2009 ≈ $300 million in 2010≈ $240 million beyond 2010
Composition of net new business further diversifies sales:Primarily outside of North America55% in electrical and electronics25% Domestic Three and 75% European and Asian automakers
In addition, non-consolidated new business wins total approximately $150 million
Continuing To Grow And Diversify Global Sales Continuing To Grow And Diversify Global Sales * Please see slide titled “Forward-Looking Statements” at the end of this presentation for further information.

18
Committed Liquidity Until 2012*
($ in millions)
2 $1.0 billion term loan amortizes at $6.0 million per year, with $967 million due at maturity in 2012.3 Excludes $0.8 million of convertible notes that can be called by Lear at any time.
1 Revolving line of credit of $1.3 billion, $468 million of which matures on March 23, 2010 and $822 million of which matures on January 31, 2012.
Debt Maturities Following July 2008 Bank Amendment
$991$300 $400
$600 $468
$822
$0
$500
$1,000
$1,500
$2,000
2009 2010 2011 2012 2013 2014 2015 2016
Term Loan B Public Bonds Revolving Credit Facility
2
3
1
4
4 An irrevocable call notice for the remaining $41 million of outstanding bonds due 2009 was executed in connection with the July 2008 bank amendment. These bonds were retired on August 4, 2008 with cash.
1
* Please see slide titled “Forward-Looking Statements” at the end of this presentation for further information.

19
Net Sales*
$14.0$14.6
$15.3
2005 2006 2007* Excludes Interior business:
- 2005 -- $3.1 billion- 2006 -- $3.2 billion- 2007 -- $0.7 billion
(in billions)
$401
$558
$749
2005 2006 2007
(in millions)
Core Operating Earnings*
2007 Financial Results Improved For The Second Year In A Row**
* Excludes Interior business:- 2005 -- $(77) million- 2006 -- $(161) million- 2007 -- $16 million
** Core operating earnings represents income before interest, other expense, income taxes, restructuring costs and other special items, excluding thedivested Interior business. Pretax income (loss) was ($1,187.2) million, ($655.5) million and $331.4 million in 2005, 2006 and 2007, respectively. Please see slides titled “Non-GAAP Financial Information” at the end of this presentation for further information.

20
2007 Financial ResultsFree Cash Flow Returned To Historical Levels
2005 Unusual FactorsChange in customer payment terms (four-day delay resulted in full-month impact to reported cash flow)Historically large backlog / launch schedule and associated investmentCustomer production volatilityIncreasing commodity costs / supplier distress
*Free cash flow represents net cash provided by operating activities before net change in sold accounts receivable, less capital expenditures. Please see slides titled “Non-GAAP Financial Information” at the end of this presentation for further information.
(in millions)$434
$116
($419)
$317
$509
$395$318
2001 2002 2003 2004 2005 2006 2007
Free Cash Flow*

21
1993
1994
1995
1996
1997
1998
1999
2000
2001
2002
2003
2004
2005
2006
2007
2008 Forecast2008 Outlook Global Industry Production*
Major Market
2008 Industry Production Forecast**(in millions of vehicles)
B/(W) 2007
North American Production
13.8
17.2
13.5
North America 13.5 (10)%Europe 20.3 1%China 7.9 14%Brazil 3.0 15%India 2.4 27%Russia 1.7 11%
Global ≈ 70.0 up 2%
2008
(in millions)
* Please see slide titled “Forward-Looking Statements” at the end of this presentation for further information.Source: CSM Worldwide and Company estimates as of July 29, 2008.
** Presently, Lear is in the process of re-assessing all of Its full year 2008 forecast assumptions. The Company will provide a formal update to its 2008 outlook on October 23, 2008.
22
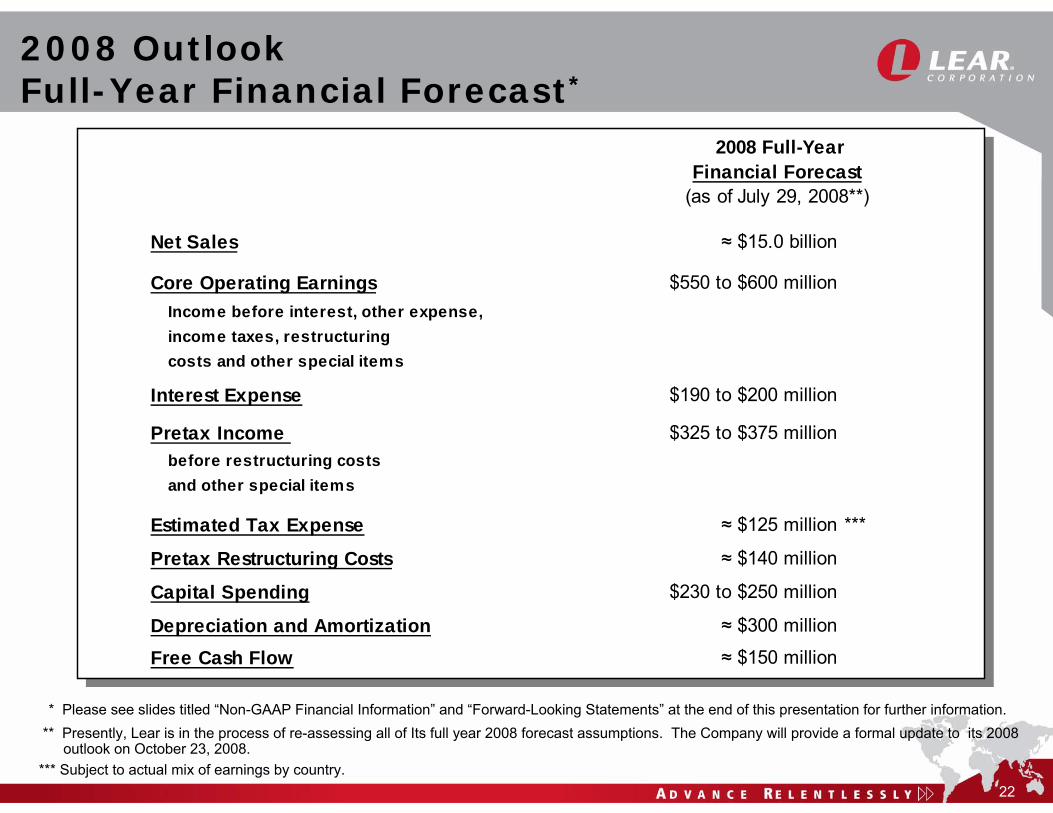
2008 OutlookFull-Year Financial Forecast*
2008 Full-Year Financial Forecast
(as of July 29, 2008**)
Net Sales ≈ $15.0 billion
Core Operating Earnings $550 to $600 millionIncome before interest, other expense,income taxes, restructuring costs and other special items
Interest Expense $190 to $200 million
Pretax Income $325 to $375 millionbefore restructuring costs and other special items
Estimated Tax Expense ≈ $125 million ***
Pretax Restructuring Costs ≈ $140 million
Capital Spending $230 to $250 million
Depreciation and Amortization ≈ $300 million
Free Cash Flow ≈ $150 million
** Presently, Lear is in the process of re-assessing all of Its full year 2008 forecast assumptions. The Company will provide a formal update to its 2008 outlook on October 23, 2008.
* Please see slides titled “Non-GAAP Financial Information” and “Forward-Looking Statements” at the end of this presentation for further information.
*** Subject to actual mix of earnings by country.

23
Summary And Outlook*
Business structure improvements being aggressively implemented to improve long-term competitiveness:
Aggressive actions to improve cost structureContinued sales diversificationFurther low-cost footprint expansionSelective vertical integrationAdopted global operating structure for business unitsImplementing improvement plan for electrical and electronics
Lear remains solidly profitable this year, despite significantlylower production in North AmericaRecent bank amendment provides committed liquidity until 2012 Longer-term financial outlook continues to be positive
* Please see slides titled “Non-GAAP Financial Information” and “Forward-Looking Statements” at the end of this presentation for further information.

24
Questions

25
In addition to the results reported in accordance with accounting principles generally accepted in the United States (“GAAP”) included throughout this presentation, the Company has provided information regarding “income before interest, other expense, income taxes, restructuring costs and other special items, excluding the divested Interior business” (core operating earnings), “pretax income before restructuring costs and other special items” and “free cash flow” (each, a non-GAAP financial measure). Other expense includes, among other things, non-income related taxes, foreign exchange gains and losses, discounts and expenses associated with the Company’s asset-backed securitization and factoring facilities, minority interests in consolidated subsidiaries, equity in net income of affiliates and gains and losses on the sale of assets. Free cash flow represents net cash provided by operating activities before the net change in sold accounts receivable, less capital expenditures. The Company believes it is appropriate to exclude the net change in sold accounts receivable in the calculation of free cash flow since the sale of receivables may be viewed as a substitute for borrowing activity.
Management believes the non-GAAP financial measures used in this presentation are useful to both management and investors in their analysis of the Company’s financial position and results of operations. In particular, management believes that core operating earnings and pretax income before restructuring costs and other special items are useful measures in assessing the Company’s financial performance by excluding certain items (including those items that are included in other expense) that are not indicative of the Company's core operating earnings or that may obscure trends useful in evaluating the Company’s continuing operating activities. Management also believes that these measures are useful to both management and investors in their analysis of the Company's results of operations and provide improved comparability between fiscal periods. Management believes that free cash flow is useful to both management and investors in their analysis of the Company’s ability to service and repay its debt. Further, management uses these non-GAAP financial measures for planning and forecasting in future periods.
Core operating earnings, pretax income before restructuring costs and other special items and free cash flow should not be considered in isolation or as a substitute for pretax income (loss), net income (loss), cash provided by operating activities or other income statement or cash flow statement data prepared in accordance with GAAP or as a measure of profitability or liquidity. In addition, the calculation of free cash flow does not reflect cash used to service debt and therefore, does not reflect funds available for investment or other discretionary uses. Also, these non-GAAP financial measures, as determined and presented by the Company, may not be comparable to related or similarly titled measures reported by other companies.
Set forth on the following slides are reconciliations of these non-GAAP financial measures to the most directly comparable financial measures calculated and presented in accordance with GAAP. Given the inherent uncertainty regarding special items, other expense and the net change in sold accounts receivable in any future period, a reconciliation of forward-looking financial measures to the most directly comparable financial measures calculated and presented in accordance with GAAP is not feasible. The magnitude of these items, however, may be significant.
Non-GAAP Financial Information

26
Non-GAAP Financial InformationCore Operating Earnings
(in millions) 2007 2006 2005
Pretax income (loss) $ 331.4 $ (655.5) $ (1,187.2)Divestiture of Interior business 10.7 636.0 - Interest expense 199.2 209.8 183.2 Other expense, net * 32.5 87.8 96.6
Income (loss) before interest, other expense and income taxes $ 573.8 $ 278.1 $ (907.4)
Restructuring costs and other special items - Costs related to interior divestiture (COS and SG&A) 10.0 - - Costs related to restructuring actions 181.8 105.6 106.3 Costs related to merger transaction 34.9 - - U.S. salaried pension plan curtailment gain (36.4) - - Goodwill and fixed asset impairment charges - 12.9 1,095.1 Litigation charges - - 30.5
Less: Interior business (15.6) 161.2 76.5
Income before interest, other expense, income taxes, restructuring costs and otherspecial items, excluding the divested Interior business $ 748.5 $ 557.8 $ 401.0 (core operating earnings)
* Includes minority interests in consolidated subsidiaries and equity in net income of affiliates.

27
Non-GAAP Financial InformationCash from Operations and Free Cash Flow
(in millions) 2007 2006 2005 2004 2003 2002 2001
Net cash provided by operating activities 466.9$ 285.3$ 560.8$ 675.9$ 586.3$ 545.1$ 829.8$ Net change in sold accounts receivable 168.9 178.0 (411.1) 70.4 298.1 122.2 (245.0)
Net cash provided by operating activities before net change in sold accounts receivable(cash from operations) 635.8 463.3 149.7 746.3 884.4 667.3 584.8
Capital expenditures (202.2) (347.6) (568.4) (429.0) (375.6) (272.6) (267.0) Free cash flow 433.6$ 115.7$ (418.7)$ 317.3$ 508.8$ 394.7$ 317.8$

28
Forward-Looking Statements
This presentation contains forward-looking statements within the meaning of the Private Securities Litigation Reform Act of 1995, including statements regarding anticipated financial results and liquidity. Conditions in the automotive industry are volatile and uncertain. The Company’s actual results may differ materially from anticipated results as a result of certain risks and uncertainties, including but not limited to, general economic conditions in the markets in which the Company operates, including changes in interest rates or currency exchange rates, the financial condition of the Company’s customers or suppliers, changes in actual industry vehicle production levels from the Company’s current estimates, fluctuations in the production of vehicles for which the Company is a supplier, the loss of business with respect to, or the lack of commercial success of, a vehicle model for which the Company is a significant supplier, including declines in sales of full-size pickup trucks and large sport utility vehicles, disruptions in the relationships with the Company’s suppliers, labor disputes involving the Company or its significant customers or suppliers or that otherwise affect the Company, the Company's ability to achieve cost reductions that offset or exceed customer-mandated selling price reductions, the outcome of customer productivity negotiations, the impact and timing of program launch costs, the costs, timing and success of restructuring actions, increases in the Company's warranty or product liability costs, risks associated with conducting business in foreign countries, competitive conditions impacting the Company's key customers and suppliers, the cost and availability of raw materials and energy, the Company's ability to mitigate increases in raw material, energy and commodity costs, the outcome of legal or regulatory proceedings to which the Company is or may become a party, unanticipated changes in cash flow, including the Company’s ability to align its vendor payment terms with those of its customers, Company’s ability to access capital markets on commercially reasonable terms and other risks described from time to time in the Company's Securities and Exchange Commission filings. In particular, the Company’s 2008 financial outlook issued on July 29, 2008 is based on several factors, including the Company’s industry vehicle production and raw material pricing assumptions as of the date issued. The Company’s actual financial results could differ materially as a result of significant changes in these factors.
The forward-looking statements in this presentation are made as of the date hereof, and the Company does not assume any obligation to update, amend or clarify them to reflect events, new information or circumstances occurring after the date hereof.