Leaping the chasm: moving from buzzwords to implementation of learning analytics
46
Leaping the chasm: moving from buzzwords to implementation of learning analytics George Siemens Technology Enhanced Knowledge Research Institute (TEKRI) Athabasca University February 1, 2012
-
Upload
travis-gentry -
Category
Documents
-
view
21 -
download
0
description
Leaping the chasm: moving from buzzwords to implementation of learning analytics. George Siemens Technology Enhanced Knowledge Research Institute (TEKRI) Athabasca University February 1, 2012. Slides (with citations and links) http://www.slideshare.net/gsiemens/educause2012. - PowerPoint PPT Presentation
Transcript of Leaping the chasm: moving from buzzwords to implementation of learning analytics

Leaping the chasm: moving from buzzwords to
implementation of learning analytics
George SiemensTechnology Enhanced Knowledge Research Institute (TEKRI)Athabasca UniversityFebruary 1, 2012

Slides (with citations and links)
http://www.slideshare.net/gsiemens/educause2012

1. Roots of learning analytics and context of deployment
2. Becoming at data-intensive university

1. Roots of learning analytics and context of deployment
2. Becoming at data-intensive university

Won’t make the argument for why analytics are growing

“Imagination no longer comes as cheaply as it did in the past. The slightest move in the virtual landscape has to be paid for in lines of code.”
Latour (2007)

What’s different today?
volume (apparently, there’s lots of data)velocity (processing capacity)variety (internet of things, social media)variability (meaning variance)

“Analytics, and the data and research that fuel it, offers the potential to identify broken models and promising practices, to explain them, and to propagate those practices.”
Grajek, 2011

http://www.dataqualitycampaign.org/
A different way of thinking and functioning

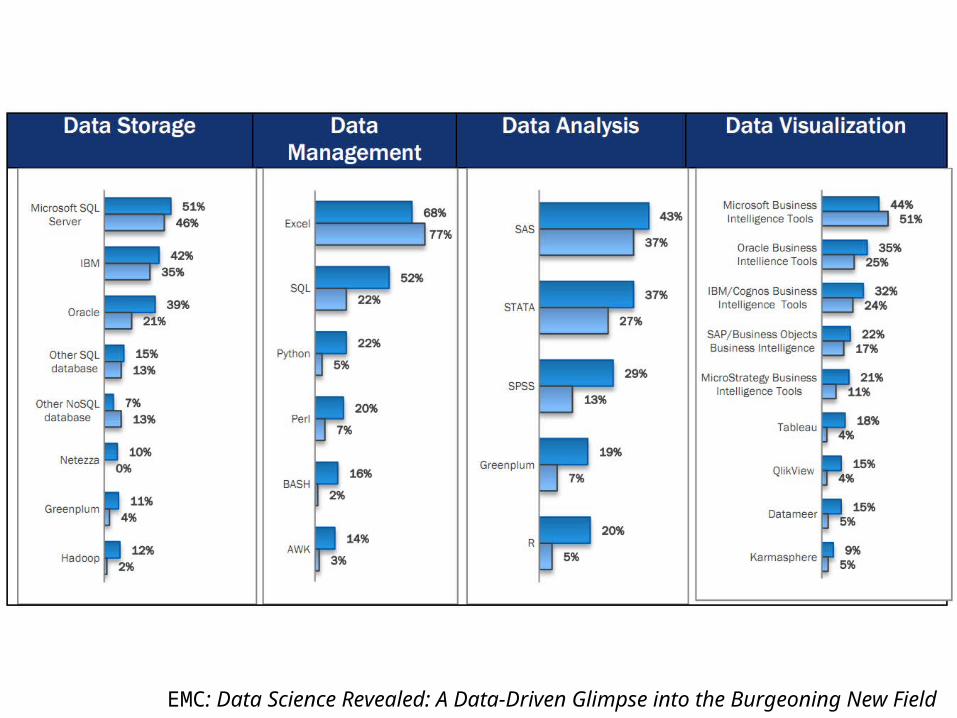
EMC: Data Science Revealed: A Data-Driven Glimpse into the Burgeoning New Field


Reading a book (or any interaction with data) is analytics


Predictive Analytics Reporting
Check my activity

Methods, techniques & evidence

Metrics, or analytics on analytics, are hard (and contextual)
What is the impact of effective use of data?Argument: “more precise and accurate information should facilitate greater use of information in decision making and therefore lead to higher firm performance.”
Brynjolfsson, Hitt, Kim (2011)

LA resources, publications, archive:

Student success/completionAstin (1996)Tinto (1993)

Distributed, multi-level analytics Suthers & Rosen (2011)

Attention metadataDuval (2011)
Learning networks, crowds, communitiesHaythornthwaite (2011)

Discourse analysis (automated and manual)De Liddo & Buckingham Shum (2011)

Social learning analyticsBuckingham Shum & Ferguson (2011)

Participatory learning and reputationClow & Makriyannis (2011)

Early warningMacfayden & Dawson (2010)
Campbell et al (2006)

Semantic Web to Social Machines
“People do the creative work and the machine does the administration”Web=unlimited scaling of infoWeb should=unlimited social interaction
Hendler & Berners-Lee (2010)

1. Roots of learning analytics and context of deployment
2. Becoming at data-intensive university

We collect enough data. We need to focus on connecting.
Multiple data sources:
Social mediaUniversity help resourcesLMSStudent information systemCourse progression, etc

Privacy as a transactional entity
Share my data to improve learning support from the university (school)

“All-embracing technique is in fact the consciousness of the mechanized world. Technique integrates everything. It avoids shock and sensational events”
Ellul, 1964

Analytics as a complex system: multiple interacting entities,
more meaningful when connected

Challenges: Broadening scope of data capture
- data outside of the current model of LMS - sociometer: Choudhury & Pentland (2002)
- classroom/library/support services,- quantified self
Timeliness of data (real-time analytics)

Three communities that don’t communicate
Systems/enterprise level
Researchers
Educators (cobbling)

What does a data-intensive university look like?

Kron, et al (2011)

Acquisition: how do we get the data – structured and unstructured?Storage: how do we store large quantities?Cleaning: how do we get the data in a working formatIntegration: How do we “harmonize” varying data sets togetherAnalysis: which tools and methods should be used?Representation/visualization: tools and methods to communicate important ideas

“A university where staff and students understand data and, regardless of its volume and diversity, can use it and reuse it, store and curate it, apply and develop the analytical tools to interpret it.”


43

Principles of a systems-wide analytics tool
1. Algorithms should be open, customizable for context2. Students should see what the organization sees3. Analytics engine as a platform: open for all researchers and organizations to build on4. Connect analytics strategies and tools: APIs5. Integrate with existing open tools6. Modularized and extensible

Learning Analytics & Knowledge 2012: Vancouver
http://lak12.sites.olt.ubc.ca/
Open online course: http://lak12.mooc.ca/

Twitter/randomly popular social media: gsiemens
www.learninganalytics.net
http://www.solaresearch.org/