LEAN SUPPLY CHAIN MANAGEMENT PRACTICES AND …2010). Supply chain has been viewed on every...
77
LEAN SUPPLY CHAIN MANAGEMENT PRACTICES AND ORGANIZATIONAL PERFORMANCE IN THE PUBLIC WATER SECTOR IN KENYA MOHAMED A. FARAH D61/65828/2013 SUPERVISOR: ONSERIO NYAMWANGE A Research Project Submitted In Partial Fulfillment Of The Requirements For Award Of The Degree of Master Of Business Administration In Procurement And Supply chain Management, University Of Nairobi 2015
Transcript of LEAN SUPPLY CHAIN MANAGEMENT PRACTICES AND …2010). Supply chain has been viewed on every...

LEAN SUPPLY CHAIN MANAGEMENT PRACTICES AND
ORGANIZATIONAL PERFORMANCE IN THE PUBLIC
WATER SECTOR IN KENYA
MOHAMED A. FARAH
D61/65828/2013
SUPERVISOR: ONSERIO NYAMWANGE
A Research Project Submitted In Partial Fulfillment Of The Requirements For
Award Of The Degree of Master Of Business Administration In Procurement And
Supply chain Management, University Of Nairobi
2015

ii
DECLARATION
This research project is my original work and as not been presented for a degree in any
other university.
Signed …………………………. Date…………………
MOHAMED A. FARAH
D61/65828/2013
This research project has been submitted for examination with my approval as a
University Supervisor.
Signed …………………………. Date…………………
ONSERIO NYAMWANGE
UNIVERSITY OF NAIROBI

iii
DEDICATION
This project is dedicated to my family who have been my key asset to success and
supported me both emotionally and financially during the time of the project. I sincerely
appreciate their support and prayers that led to the completion of this project within the
stipulated timeframe.

iv
ACKNOWLEDGEMENT
Above all, I thank God for His Grace, provision and seeing me through the project. My
special gratitude goes to my supervisor Onserio Nyamwange who tirelessly through his
effort and initiative guided me through the whole process. I would like to acknowledge
all the MBA students, colleagues, friends and my family especially for their moral and
material support for the completion of this project.

v
LIST OF ABBREVIATIONS AND ACRONYMS
CPFR Collaborative Planning, Forecasting, and Replenishment
MVA Market Value Added
ROI Return on Investment
SCM Supply Chain Management
TPS Toyota Production System
WSBs Water Service Boards
WSPs Water Service Providers
WSRB Water Services Regulatory Board

vi
ABSTRACT
In the competitive environment, most leading edge companies realized that by
transferring costs either upstream or downstream, they are actually not increasing their
competitiveness, since all costs ultimately make their way to consumers. Supply chain
management guides firms to co-operate with a common goal to increase the overall
channel sales and profitability, rather than competing for a bigger share of a fixed profit.
One strategy for coordinating within and between firms with a focus on achieving
efficiency, eliminating waste or overburden and creating value in products is the concept
of lean management. The purpose of the study was to assess the lean supply chain
management practices and organizational performance in the public water sector in
Kenya. The variables under study were demand management practices, Waste
management practices, Standardization practices and Behavioral practices. This study
adopted a descriptive survey research design and both qualitative and quantitative data
will be obtained for comparison purposes. The target population for the study was the
117 Water Service Providers (WSPs) which were linked to 8 regional Water Services
Boards (WSBs) in charge of asset management through Service Provision Agreements
(SPAs). In this study, primary data was collected by use of structured and closed ended
questionnaire. Questionnaires were sent through the email to majority of the respondents
and the researcher made phone calls to encourage the respondents to fill in the
questionnaire and email back. The study established that demand management was
concerned with balancing the requirement of internal and external customers with supply
chain capabilities. The study also found out that the firm has small specialized plants
rather than vertically integrated manufacturing facilities, the firm encourages doing the
right thing the first time, the firm produces what is needed and no more (JIT) and that the
firms production flow is smooth to dampen reaction waves that occur in response to
schedule variations. The study concluded that the lean supply chain practices used by the
public water companies in Kenya were demand management practices, waste
management practices, standardization practices, behavioral practices, inspection
activities and assurance activities. The study concluded that the companies have been
embracing lean supply chain management strategies despite the challenges experienced
form the internal and external environment. Lean supply chain management strategies
have assisted the water companies to enhance their performance.. To gain competitive
edge, public water companies in Kenya have no choice other than implementation of the
lean strategies for survival. The study recommends that the companies should invest in
time and money in collaborative demand planning, the firms should communicate its
demand forecasts to its supply chain partners. The study recommends that the companies should practice the philosophy of grouping similar parts in families to eliminate movement and
queue. The study recommends that the firm should have standardized and rationalized the range
of materials, parts and consumables.

vii
TABLE OF CONTENTS
DECLARATION ................................................................................................................ ii
DEDICATION ................................................................................................................... iii
ACKNOWLEDGEMENT ................................................................................................. iv
LIST OF ABBREVIATIONS AND ACRONYMS ........................................................... v
ABSTRACT ....................................................................................................................... vi
LIST OF TABLES .............................................................................................................. x
LIST OF FIGURES ........................................................................................................... xi
CHAPTER ONE: INTRODUCTION ................................................................................. 1
1.1 Background ............................................................................................................... 1
1.1.1 Lean Supply Chain Management Practices ....................................................... 3
1.1.2 Organizational Performance .............................................................................. 5
1.1.3 Public Water Companies in Kenya .................................................................... 5
1.2 Statement of the Problem .......................................................................................... 7
1.3 Objectives of the Study ............................................................................................. 9
1.4 Value of the Study .................................................................................................... 9
CHAPTER TWO: LITERATURE REVIEW ................................................................... 11
2.1 Introduction ............................................................................................................. 11
2.2 Theories................................................................................................................... 11
2.2.1 Institutional Theory .......................................................................................... 11
2.2.2 Resource Dependence Theory ......................................................................... 13
2.2.3 Transaction Cost Theory .................................................................................. 15
2.3 Lean Supply Chain Management Practices ........................................................ 16

viii
2.4 Organizational Performance ................................................................................... 21
2.5 Lean Supply Chain management Practices and Organizational Performance ........ 22
2.6 Summary of Empirical Studies ............................................................................... 24
2.7 Conceptual Framework ........................................................................................... 26
CHAPTER THREE: RESEARCH METHODOLOGY ................................................... 28
3.1 Introduction ............................................................................................................. 28
3.2 Research Design...................................................................................................... 28
3.3 Population ............................................................................................................... 28
3.4 Data Collection ....................................................................................................... 29
3.4 Data Analysis .......................................................................................................... 29
CHAPTER FOUR: DATA ANALYSIS AND INTERPRETATION .............................. 31
4.1 Introduction ............................................................................................................. 31
4.2 Response Rate ......................................................................................................... 31
4.3 Demand management practices .............................................................................. 31
4.4 Waste management practices .................................................................................. 33
4.5 Standardization Practices ........................................................................................ 34
4.5.1 Quality assurance practices .............................................................................. 35
4.5.2 Inspection Activities ........................................................................................ 36
4.6 Behavioral practices ................................................................................................ 37
4.7 Performance of the organization ............................................................................. 39
4.7.1 Operational performance measure ................................................................... 40
4.7.2 Challenges facing water sector in meeting customer requirement .................. 41
4.7.2 Mitigation of the Challenges ............................................................................ 41

ix
4.8 Relationship between Lean Supply Chain Management Practices and
Organizational Performance ......................................................................................... 42
4.8.2 ANOVA ............................................................................................................ 44
CHAPTER FIVE: SUMMARY, CONCLUSION AND RECOMMENDATIONS........ 46
5.1 Introduction ............................................................................................................. 46
5.2 Summary of Findings .............................................................................................. 46
5.3 Conclusions ............................................................................................................. 47
5.4 Recommendations ................................................................................................... 48
5.5 Limitations of the Study.......................................................................................... 48
5.6 Recommendation for Further Studies ..................................................................... 49
REFERENCES ................................................................................................................. 50
APPENDICES .................................................................................................................. 58
APPENDIX 1: QUESTIONAIRE .................................................................................... 58
APPENDIX 1I: ROLES AND RESPONSIBILITIES OF INSTITUTIONS IN THE
WATER SECTOR ............................................................................................................ 63
APPENDIX 1I: LIST OF WATER SERVICE PROVIDERS .......................................... 64

x
LIST OF TABLES
Table 4.1 Demand management practices .........................................................................32
Table 4.2 Waste management practices .............................................................................33
Table 4.3 Standardization Practices ...................................................................................35
Table 4.4 Quality assurance practices ................................................................................36
Table 4.5 Behavioural practices .........................................................................................38
Table 4.6 Performance of the organization ........................................................................39
Table 4.7 Operational Performance measure .....................................................................40
Table 4.8 Regression Coefficients .....................................................................................43
Table 4.9 Model Summary ................................................................................................44
Table 4.10 ANOVA (Analysis of Variance) ........................................................................ 44

xi
LIST OF FIGURES
Figure 2. 1 Conceptual Framework ...................................................................................26
Figure 4.2 Inspection Activities ........................................................................................ 37

1
CHAPTER ONE: INTRODUCTION
1.1 Background
Supply chain has become a vital entity to the organizations performance measurement
and metrics and has received much attention from researchers and practitioners. To
support this, Gunasekaran, Patel (2011) and McGaughy (2009) have discussed that the
role of these measures and metrics in the success of an organization cannot be overstated
because they affect strategic, tactical and operational planning and control. Some more,
the revolution of SCM in the last decade has testified that an increasing number of
companies seek to enhance performance beyond their own boundaries (Boyson et al.,
2010). Supply chain has been viewed on every perspective. According to Agarwal and
Shankar (2012), a supply chain is an inter-linked set of relationships connecting customer
to supplier, perhaps through a number of intermediate stages such as manufacturing,
warehousing and distribution processes.
In the competitive environment, most leading edge companies realized that by
transferring costs either upstream or downstream, they are actually not increasing their
competitiveness, since all costs ultimately make their way to consumers (Cozzi and
Perona, 2012). Hence, supply chain management guides firms to co-operate with a
common goal to increase the overall channel sales and profitability, rather than
competing for a bigger share of a fixed profit. One strategy for coordinating within and
between firms with a focus on achieving efficiency, eliminating waste or overburden and
creating value in products is the concept of lean management (Womack and Jones, 2009).
Consequently, Vonderembse et al., (2012), highlighted on the strategies and
methodologies for designing supply chains that meet specific customer expectations.

2
According to them, three different types of supply chains can be defined: A lean supply
chain, which employs continuous improvement efforts which focuses on eliminating
waste or non-value steps along the chain; an agile supply chain, which responds to
rapidly changing, continually fragmenting global markets by being dynamic, context-
specific, growth-oriented, and customer focused and a hybrid supply chain, which
combines the capabilities of lean and agile supply chains to create a supply network that,
meets the needs of complex products.
Lean thinking is focused on eliminating waste from all processes while enhancing
material and information flow along the supply chain (McManus, 2012). The impact of
lean thinking as a strategy for the supply chain and not just manufacturing is important
and has received a lot of interest from both industry (including service) and academia.
Hence, the purpose of this study is to explore the lean supply chain management practices
in the water sector in Kenya, and identifies the effects of these practices on organizational
performance.
Water companies in Kenya are facing challenges in the supply chain due to influence of
technology and globalization. Due to these challenges, the performance of the
organization has decreased tremendously due to inefficient and ineffective customer
relationship strategies, customer service management, and demand management and
supplier relationship (Lysons and Farrington, 2010). Generally, in terms of performance,
and improvements water companies are far behind and transferring lean management
concept from the services might offer opportunities for improvements. Many service
businesses have improved and profited by the use of lean management methods and tools.

3
Yet the benefits have not been as nearly as impressive for service industries applying lean
management principles (Agus, 2012).
1.1.1 Lean Supply Chain Management Practices
Lean is a systematic approach to identifying and eliminating waste (non-added activities)
through continuous improvement by following the product at the pull of the customer in
pursuit of perfection” (The National Institute of Science and Technology) Simply lean
means to create more value for customers with fewer resources, thus the fundamental
idea is to maximize customer value while minimizing waste. Wu and Wee (2009)
concluded that the term lean means a series of activities or solutions to eliminate waste
reduce non-value added operations and improve the value added operation. Supply chain
management (SCM) is the term used to describe the management of the flow of
materials, information, and funds across the entire supply chain, from suppliers to
component producers to final assemblers to distribution (warehouses and retailers), and
ultimately to the consumer (Jørgensen and Emmitt, 2009). Briefly, a supply chain is a
collaboration of network of retailers, distributors, transporters, storage facilities, and
suppliers that participate in the production, delivery, and sale of a product to the
consumer. It is essentially made up of multiple companies who coordinate activities to set
themselves apart from the competition (Kouvelis, 2011).
This value added and non-value added concept were derived mainly from Toyota
Production System (TPS) which highlighted eight forms of waste: Overproduction,
waiting, conveyance, over-processing, excess inventory, movement, defects and unused
employee creativity (Liker, 2014). A lean organization understands customer value and
focuses its key process to continuously increase it. The ultimate goal is to provide perfect

4
value to the customer through a perfect value creation process that has zero waste. To
make lean process success, level of thinking needs to be changed in order to focus on
management from optimizing separate technologies, assets and vertical department to
optimizing the flow of products and services through entire value streams that flow
horizontally across technologies, assets and departments to customers (Lee, 2014).
Eliminating whole along entire value steams, instead of at isolated points, creates
processes that need less human effort, less space, less capital and less time to make
products and services at far less cost and with fewer defects, compared with traditional
business systems. Companies are able to respond to changing customer desires with high
variety, high quality, lows cost and with very fast throughput times.
Agus and Hajinoor (2012) emphasized that the theory and principles of lean and its
associated tools, practices and procedures can be extended outside the boundaries of an
organization to its supply chains. However, the concept of lean supply chain was
proposed in 1994, when the proponents of lean manufacturing, Womack and Jones
(2012) envisioned the concept of “Lean enterprise”. Bodognz (2012) emphasized that the
success of lean supply chain management principles is derived from ten basic lean
principles : focus on the supplier network value stream, eliminate waste, synchronize
flow, minimize both transaction and production costs, established collaborative
relationships while balancing cooperation and competition, ensure visibility and
transparency, develop quick response capability, manage uncertainty and risk, align core
competencies and complementary capabilities and foster innovation and knowledge
sharing; building and maintaining a lean supply revolves around four key practices.
Mastering the four practices leads to a lean and effective supply chain (Norek, 2012).

5
They are demand management practices, waste management practices, standardization
practices and behavioral practices.
1.1.2 Organizational Performance
Organizational performance refers to how well an organization achieves its market-
oriented goals as well as its financial goals (Lysons and Farrington, 2006). The short-
term objectives of SCM are primarily to increase productivity and reduce inventory and
cycle time, while long-term objectives are to increase market share and profits for all
members of the supply chain (Ketchen & Hult, 2010). Financial metrics have served as a
tool for comparing organizations and evaluating an organization‟s behavior over time.
Any organizational initiative, including supply chain management, should ultimately lead
to enhanced organizational performance.
A number of prior studies have measured organizational performance using both
financial and market criteria, including return on investment (ROI), market share, profit
margin on sales, the growth of ROI, the growth of sales, the growth of market share, and
overall competitive position (Lambert, 2012). In line with the above literature, the same
items will be adopted to measure organizational performance in this study.
1.1.3 Public Water Companies in Kenya
Kenya‟s national policy on Water Resources Management and Development published in
1999 addresses the main principles of the IWRM approach and recommended the
drafting of a new Water Act. The new Water Act was promulgated in 2002 and provides
a legal basis for the reform of the water sector. An essential aspect of the reform in the
water sector outlined in the Water Act 2002 is the separation and decentralization of roles

6
and responsibilities of water services and water resources management, creation of new
institutions and stakeholder participation. The new governance structure was meant to
remove bottlenecks in the national water administration and improve efficiency in service
delivery.
The Water Act of 2002 established Water Service Boards (WSBs) to be responsible for
providing water and sanitation services. Seven regional WSBs have been established. The
Boards manage water services assets and ensure that they remain in the public realm.
Overall supervision of water services is consequently being carried out by the Water
Services Regulatory Board (WSRB), the organ responsible for regulating the services
supplied by the WSBs and their providers.
The Kenyan water sector underwent far-reaching reforms through the Water Act No. 8 of
2002. Previously service provision had been the responsibility of a single National Water
Conservation and Pipeline Corporation as well as of a few local utilities established since
1996. After the passage of the act service provision was gradually decentralized to 117
Water Service Providers (WSPs). These are linked to 8 regional Water Services Boards
(WSBs) in charge of asset management through Service Provision Agreements (SPAs).
The Act also created a national regulatory board (WASREB) that carries out performance
benchmarking and is in charge of approving SPAs and tariff adjustments. The Ministry of
Water and Irrigation is in charge of policies for water supply and the Ministry of Public
Health and Sanitation is in charge of policies for sanitation.
The established water sector institutions include: Water Services Regulatory Board
(WASREB) to set standards and regulate the sub-sector; Water Appeal Board (WAB) to
adjudicate on disputes; Seven Water Services Boards (WSBs) to be responsible for the

7
efficient and economical provision of water services; Water Services Trust Fund (WSTF)
to finance pro-poor investments. Water Services Providers (WSPs) to be agents in the
provision of water and sewerage services; Water Resources Management Authority
(WRMA) to manage and protect Kenya‟s resources; Catchment Area Advisory
Committees (CAAC) support the WRMAs at the regional Level and Water Resource
Users Associations (WRUA) established as a medium for cooperative management of
water resources and conflict resolution at sub-catchment level.
Water Resource Management Authority (WRMA) is the body responsible for sustainable
management of Kenya‟s water resources. It is expected to implement the policies and
strategies relating to water resource management and for developing guidelines and
procedures for allocation and monitoring of water catchment protection and management.
Water Services Regulatory Board (WSRB) is the body responsible, on behalf of the
government (MWI), for the regulation of water and sewerage services including
licensing, quality assurance, and issuance of guideline on tariffs, prices, and disputes
resolution. Water Service Boards are the implementing agencies of the directives of
WSRB as they are charged with the efficient and economical provision of water and
sewerage services in their respective areas of jurisdiction.
1.2 Statement of the Problem
There has been a drastic increase in the pressure on organizations to find new ways to
create and deliver value to customers with fewer resources or to maximize customer
value while minimizing waste for improvements in profitability and reduced costs in the
supply chain. Firms face an increasing pressure of customer requirements while at the
same time need to reduce cost, shorten lead times and lower inventory levels to ensure

8
profitability (Holweng, 2005). The need for lean supply chains to become responsive
arises from internal factors such as target costing, use of value engineering, use of cross
functional teams, just in time and zero defective products (Lysons and Farrington, 2013)
as well as external factors such as customer lead times, demand specification, product
variety, product life cycle, order to delivery time and distribution lead time (Reichhart
and Holweng, 2013). Supply chain responsiveness relates directly with business
performance, increases revenues, lower costs, leads to customer satisfaction and loyalty
hence increased profits in the long-run and thus motivates both researchers and
practitioners to explore the area (Mageto, 2009).
Several studies have been done on lean supply chain. Larson (2014) carried out a study
on the implementation of lean practices in the United States of America; Daud and
Zailani (2011) did a research on lean supply chain practices and performance in the
context of Malaysia and found out that lean supply chain practices are directly related to the
performance of the electrical, electronics and electronics manufacturing service companies in
Malaysia; Mageto (2009) studied on the relationship between supply chain performance
and supply chain responsiveness in supermarkets in Nairobi and found out that supply
chain performance and supply responsiveness, reliability, flexibility and timeliness
indicate very strong relationship with supply chain performance. While Karoki (2014) did
the application of lean thinking to business process management and found out that lean
management and application of related tools, equipment and techniques is a continuous
process at Kenya Revenue Authority highly driven by the need to improve service
delivery and tax collection while netting those evading taxes. Other local studies carried
out in Kenya by (Wainaina, 2009) and Ngonjo, (2014) on supply chain management

9
strategies and performance of commercial entities observed that organizations in Kenya
were yet to fully embrace the supply chain management strategies and most of the
practices used were borrowed from the procurement philosophy. The study sought to fill
the gap by answering the following questions; which supply chain management practices
are used in the water sector in Kenya and what is the relationship between lean supply
chain management practices and organizational performance in the water sector in Kenya?
1.3 Objectives of the Study
The objectives of the study were:-
i. To determine the extent of lean supply chain management practices in the water
sector in Kenya
ii. To determine the relationship between lean supply chain management practices and
organizational performance in the water sector in Kenya
1.4 Value of the Study
The findings of this research would enable the academicians/researchers in broadening of
syllabus with respect to the effects of lean supply chain in organization performance. The
results would also assist firms and their employees in improving their lean supply chain
practices with regard to demand management, inventory management, waste
management and continuous improvement on the performance of Water companies in
Kenya.
The research findings are expected to contribute to a better understanding of lean supply
chain management on the performance of Water companies in Kenya. It would help
various shareholders to make strategic lean decisions in procurement, marketing Human

10
Resource management and distribution in order to survive in the competitive industry.
Water companies in Kenya would gain an In-depth understanding on how to meet
customer needs cost effectively thus zero waste tolerance. Innovative ways of satisfying
customers would be established.
The Government would be in a position to formulate lean policies that are aimed at
increasing productivity and safeguarding the interests of organizations in Kenya based on
lean practices on customer satisfaction.

11
CHAPTER TWO: LITERATURE REVIEW
2.1 Introduction
This chapter introduces the review of the contextual and theoretical literatures relating to
lean supply chain on organization performance with the aim to document the critical
point knowledge; it further discusses the perspectives of supply chain performance and
attempt made in this line by other scholars.
2.2 Theories
The study will be guided by institutional theory, resource dependence theory and
transaction cost theory which is discussed below.
2.2.1 Institutional Theory
Institutional theory examines how external pressures influence a company (Hirsch, 1975).
Within institutional theory, there are three forms of isomorphic drivers namely, coercive,
normative, and mimetic (Dubois and Pedersen, 2004). Coercive isomorphic drivers occur
from influences exerted by those in power. Institutional theory can be used to study how
a company addresses green issues due to external pressures (Zhu and Sarkis, 2004), and
thus institutional theory has become a major research direction to explain environmental
related practices (Lummus, 1997). Government agencies are an example of powerful
institutions that may coercively influence the actions of an organization through, for
example, fines and trade barriers (Rivera, 2004). Normative isomorphic drivers cause
enterprises to conform in order to be perceived as having legitimate organizational
activities. Social normative pressures can explain environmental management practices
among enterprises (Ball and Craig, 2010). Mimetic isomorphic drivers occur when

12
enterprises imitate the actions of successful competitors in the industry, in an attempt to
replicate the path of their success (Awin, 2006).
Coercive pressures are key to drive environmental management (Dubois, 2002). Previous
studies show that governments are key groups to promote voluntary environmental
management practices (Rivera, 2004). In developed countries such as the U.S.A.,
coercive pressures through laws and regulations were demonstrated to improve
environmental awareness, and thus drive environmental management practices. Coercive
pressures by governments were shown to drive enterprises to adopt voluntary green
initiatives while such pressures become weaker for those rich in organizational resources
for environmental strategies (Clemens and Douglas, 2006). Regulations in developed
countries have also caused an increase in institutional pressures for improved
environmental management by enterprises in developing countries, many typically
surpassing local requirements. Developing countries such as China have enacted
increasingly strict environmental regulations which drive manufacturers to implement
GSCM practices (Zhu and Sarkis, 2004).
Socially related requirements such as those from the customer and market and their
increasing environmental expectation form the core normative pressure for manufacturers
to implement GSCM. In developed countries, consumers have increasing environmental
awareness. Thus, normative social pressures in developing countries such in Africa
continent are found to be mainly originated from consumers‟ ethical values and
ecological thinking (Bodognz, 2010). Previous studies show that consumers in
developing countries have increasingly heightened environmental awareness and are
starting to opt for green products (Hines, 2006). In addition to normative pressures from
13
consumers, exports and sales to foreign customers are two more important drivers that
prompt manufacturers to adopt GSCM practices for developing countries such as China
(Cigolini et al., 2014).
Organization may follow or „mimic‟ competitors merely because of their success, where
such behavior in operations and manufacturing is typically defined as competitive
benchmarking. The rationale is simply to follow the actions of successful competitors to
replicate their successful paths. Imitation plays a significant role for enterprises in
developed countries such as Canada, France, and Germany to implement GSCM related
practices (Agarwal, 2006). Globalization has created opportunities for manufacturers in
developing countries such as China to learn from their foreign competitors to implement
environmental management practices (Cozzi and Perona, 2012). Joint ventures in a
developing country may implement GSCM practices such as eco-design by imitating
their parent companies, and then diffuse their experiences to other enterprises in the
developing country (Zhu and Liu, 2010). Institutional theory, examining the causes of
isomorphism within organizations, provides an alternative viewpoint to the adoption of
strategies and practices in managing operations and supply chains. Applications have so
far been limited to few topics, such as quality management and adoption of electronic
tools. This study aims to contribute to an increased understanding of the theory's
explanatory value in the field by presenting central research avenues yet unexplored.
2.2.2 Resource Dependence Theory
Resource dependence theory (RDT) suggests that, in the supply chain, member firms
should be dependent and collaborate to seek higher performance gains in the long-run

14
instead of pursuing short-term benefits at the expense of others. In RDT, firms are
dependent on resources provided by others in order to sustain growth, as well as other
organizations who may be dependent on them (Prater, 2011). One important assumption
of the RDT is that firms cannot be fully self-sufficient with regards to strategically
critical resources for survival. In SCM, eco-design of products and materials recovery are
exemplary organizational resources requiring supply chain partnership to effectuate
performance benefits (Simone et al., 2010). These resources can also be converted to
relationship-specific assets, similar to those identified in transaction cost economics, on
which partner firms depend to generate sources of advantages. On the other hand, firms
need to control or access critical resources e.g., standards, procedures, enabling
technologies, materials sources, and distribution channels, to implement SCM practices
and fully realize the potential gains.
The interdependency of supply chain partners as well as the quality and effectiveness of
their collaboration that determine the success of implementing SCM should not be
ignored. One important insight from RDT is that firms lacking the required resources to
attain their goals are likely to develop relationships with others for acquisition of the
resources. This perspective considers customer and supplier relationships as important
linkages for firms to reduce the uncertainty surrounding their operating environment
(Togar and Ramaswami, 2014). In many instances, inter-organizational relationship is
essential for managing the internal and external coordination for SCM to gain the
performance outcomes (Zhu, 2004), where partner coordination and resources sharing are
beneficial for environmental and productivity improvements. The power development
aspect of resource dependence argues for the diffusion of environmental practices

15
through the supply chain. For example, it has been found that larger firms, given their
power over smaller firms, will require environmentally sound practices to be adopted by
small supplier firms (Rivera et al., 2004).
There is empirical evidence showing a positive relationship between resources
dependency and supply chain performance (Lysons, 2008). Though there is a void of
studies relating RDT to SCM, this theory is valuable for extending this line of research in
understanding inter-organizational behaviors in SCM implementation. For instance, it
helps to predict organizational responses for implementing SCM with respect to the level
and nature of dependence of partner firms and their relative power in the supply chain. In
adopting SCM practices, e.g., green purchasing and customer cooperation, this theory
provides insights on how to facilitate and improve the resources acquisition process
considering the dependency of upstream and downstream supply chain partners.
2.2.3 Transaction Cost Theory
Asset Specificity, Frequency of economic exchange and Uncertainty represent core
dimensions of a transaction. Composition of these dimensions is decisive for the way to
assign cost efficient governance modes to a transaction taking into consideration human
beings have bounded rationality and have opportunistic tendencies. What makes
managing any supply chain difficult is uncertainty. So firms assign specific governance
forms like conventional market contracts, inter-firm coordination or vertical integration
based on economizing transaction costs considering the core dimensions.
In these relationships amongst the firms, the complexity of transactions increases as
involved parties like ground handlers like amusement and recreation providers etc. make

16
more idiosyncratic investments that cannot be re-deployed easily for other purposes, such
as the training of personnel, customizing products, investing in inter-organization systems
etc.. The challenge for these inter-firm relationships is to design and implement a
governance structure that creates sufficient coordination in order to reach desired
outcomes at lowest possible cost (Buvik & Haugland 2005). In such a case, such an
organization's integration efforts need to be protected. Considering bounded rationality,
the hybrid mode (e.g. bilateral contracting) or internal organization (hierarchy) will
provide higher governance performance when asset specificity becomes substantial
(Buvik & Reve, 2002). When uncertainty is perceived as significant contracting hazards,
then hierarchies would be preferred via vertically integrating than inter-firm coordination.
Hybrid arrangements (e.g. cooperative arrangements) are likely to possess an insufficient
authority structure to vertically or horizontally coordinate (Buvik & Grønhaug, 2002).
Considering these uncertainties and level of asset specificity, the right governance
mechanism needs to be in place. What transaction cost theory does is to encourage firms
to “look ahead, perceive hazards and factor these back into the contractual relation”.
(Williamson, 1996)
2.3 Lean Supply Chain Management Practices
Implementing lean concepts means breaking old patterns and installing new ones. To
accomplish this, an organization needs a whole new set of tools and a framework for
applying them. Lean processes merge several elements to form an integrated whole,
which aligns the various parts of an organization to make a change of great magnitude
(Ketchen and Hult, 2010). Lean companies work cooperatively with their customers.
Creating high levels of value often requires close relationships with the customers. Value

17
is often added more by the additional services and close cooperation than by the attributes
of the products themselves (Ketchen and Hult, 2010).
Service quality is perceived by customers is the extent of discrepancy between
customer‟s expectations and their perceptions of actual service performance (Simchi-Lev
and Kaminsky, 2012). This implies that quality of a service is very subjective and cannot
be grasped in easy indicators like in manufacturing. However some dimensions of quality
in service operations can be described as tangibles, reliability, responsiveness, assurance
and empathy (Cooper, Lambert, and Pagh, 2012). In order know the dimensions
classification can help to organize and structure the different aspects, which need to be
considered for the management of services. There are many ways to structure the
manifold types of services offered in the market (Schonberger and Richard, 2007).
Services can be roughly categorized in personal services, infrastructure services,
distribution services, government services, business services, manufacturing services, and
value added services. Generally, Lean approach is a systematic approach to identify and
eliminate elements of a process that do not add value to the final outcome of the process
(Kallrath, and Maindl, 2006). Lean can be seen as a concept addressing the quality, cost
and delivery of a company‟s business processes by using an integrated set of principles,
methods and tools.
Furthermore, Lean is a philosophy of leadership, teamwork and problem solving,
resulting in a process of continuous improvement throughout the entire organization by
focusing on the needs of the customer, empowering employees. Thus lean centers the
process that delivers and is less about its final outcome, the actual product or delivery
respectively (Schonberger and Richard, 2007). Furthermore, services can be

18
distinguished according to the degree of customer involvement and repeatability of tasks
performed in service production. Schemmer proposed the service process matrix to
demonstrate that service management problems are common among different service
industries (Schemmer, 2013). Within this matrix, services are classified according to two
dimensions that significantly affect the character of the service production and delivery
process. The repeatability on the ordinate is considered from the service organization‟s
point of view and refers to similarity by stage rather than by individual customer
(Lavassani, Movahedi and Kumar, 2009).
While the broad stages may have high repeatability, the detailed tasks to be done may be
very dissimilar. On the abscissa customer involvement refers to the frequency with which
service providers get in contact with the actual (external) customers. It does not take into
account the length of contact between provider and customer; rather it describes the
ability of the customer to affect the nature of the service being delivered personally. The
boundaries in this figure are not as strict as displayed. In reality they are fuzzy and can be
considered as continuous spectrums (Simchi-Lev and Kaminsky, 2007). Service
organizations require special management approaches that go beyond simply adapting
management techniques prevailing in manufacturing organizations. The distinctive
characteristics discussed above enhance the view to managerial service approaches to a
systems view including the customer as a participant in the service process.
Thus the customer should be considered as an input that is being transformed by the
service process into an output with some degree of satisfaction (Locher, and Drew, 2007).
The position of a service operations manager includes both production and marketing in
an open system with the customer as a partner in the value creation process. The

19
traditional manufacturing separation of the production and marketing functions with
finished-goods inventory as an interface is neither possible nor appropriate in service
organizations. By necessity, the operations and marketing functions are integrated for
service organizations (Simchi-Lev and Kaminsky, 2007).
Lean supply chain management comprises various elements that are integrated for
efficiency and effectiveness of the organization. Both elements should be present for any
lean enterprise firm in the modern context. Competitive firms need to understand and
measure the extent to which each element adds value in the supply chain (Kallrath and
Maindl, 2010). Components of lean supply chain include; lean suppliers, lean
procurement, lean manufacturing, lean warehousing, lean transportation and lean
customers. According to Lambert, (2012) lean suppliers are able to respond to changes.
Their prices are generally lower due to the efficiencies of lean processes, and their quality
has improved to the point that incoming inspection at the next link is not needed.
Demand management is concerned with balancing the requirement of internal and
external customers with supply chain capabilities. It includes forecasting demand,
synchronizing supply and demand, increasing flexibility, reducing the variability of
demand by means of standardization and the control of inventory (Lysons and Farrington,
2006). Demand management practices include: planning demand, communicating
demand, influencing demand and managing and prioritizing demand. Planning demand
involves more than just forecasting. Proposed in 1995, Collaborative Planning,
Forecasting, and Replenishment (CPFR) has evolved into a Web based tool to coordinate
demand forecasting, production and purchase planning, and inventory replenishment

20
between supply chain partners. CPFR is used as a means of integrating all members of an
n-tier supply chain, including manufacturers, distributors and retailers.
Waste, as defined by Toyota's past President, Fujio Cho, is anything other than the
minimum amount of equipment, materials, parts and workers (working time) which are
absolutely essential to production, and the seven types if waste to be eliminated in the
supply chain are: waste from overproduction, waste of waiting time, transportation waste,
inventory waste, processing waste, waste of motion and waste from product defects.
Value chain mapping is a great way to analyze existing processes and the practice to
waste management include having focused factories networks, employing Group
Technology (GT), practicing quality at source. JIT production, uniform plant loading,
Kanban production control system and minimizing set-up times (Aquilano et al., 1995).
Standards are documents that stipulate or recommend minimum levels of performance
and quality of goods and services and operational conditions in a given environment.
They help clear specification, achieve reliability and reduce costs, accurate comparison of
quotation, less depended on specialist suppliers, reduce error and conflict and reduce cost
of material handling (Lysons and Farrington, 2006). Practices include variety reduction,
quality assurance and quality control. Variety reduction can make substantial saving in
inventory by standardizing and rationalizing the range of material, parts and consumables
and has the benefits of reducing of holding costs for stocks, release of money tied up in
stock, easier specification when ordering, narrows range of inventory and reduces
supplier base. Quality assurance refer to those planned and systematic activities
implemented within the quality systems and demonstrated as needed to produce adequate
confidence that an entity will fulfill requirements for quality and is concerned defects

21
prevention involves a number of approaches: quality systems (ISO 9000), new design
control, design for manufacturing processes, incoming material control and supplier
appraisal (BS EN ISO 8402, 1995).
Supply chain partners from upstream suppliers to downstream customers must
collaborate as a team to provide value to the end user. Organizational behavior is the
study of the structure, functioning and performance of the organization, and the behavior
of groups and individuals within them. Best in class behavioral practices include job
enrichment, multiple carrier ladders, high employee participation, many and flexible
incentives and quality of work life emphasis (Huczyski and Buchanan, 2002).
2.4 Organizational Performance
Performance involves the accomplishment of a given task measured against preset known
standards. It would be expected that overall performance determines an organizational
survival. It is a set of metrics used to quantify both the efficiency and effectiveness of
actions. Performance measurement framework proposed by Kallrath and Maindl (2010)
balanced scorecard which is based on the principle that a performance measurement
system should provide managers with sufficient information to address the questions:
how do we look to our shareholders (financial perspective)?, what must we excel at
(internal business perspective)?, how do our customers see us (customer perspective)?
and how can we continue to improve and create value (innovation and learning
perspective)? Lean supply chain performance measurement will be measured in terms of
minimal customer complaints, reduced costs of production, Just- In time customer
service, minimal paper work, minimal employee contact with customers, increased online

22
response, increased electronic transactions and continuous improvement of internal
processes (Mentzer, 2011).
Mentzer (2011) contends that, performance is measured by either subjective or objective
criteria; arguments for subjective measures include difficulties with collecting qualitative
performance data from small firms and with reliability of such data arising from
differences in accounting methods used by firms. Objective performance measures
include indicators such as profit growth, revenue growth, return on capital employed.
Financial consultants Stern Stewart and Co. created Market Value Added (MVA), a
measure of the excess value a company has provided to its shareholders over the total
amount of their investments. This ranking is based on eight more traditional aspects of
financial performance including: total return for one and three years, sales growth for one
and three years, profit growth for one and three years, net margin, and return on equity.
2.5 Lean Supply Chain management Practices and Organizational Performance
Lean is defined as a “Systematic approach to identifying and eliminating waste (non-
added activities) through continuous improvement by following the product at the pull of
the customer in pursuit of perfection” (The National Institute of Science and Technology,
2010). Simply lean means to create more value for customers with fewer resources, thus
the fundamental idea is to maximize customer value while minimizing waste. Wu and
Wee (2009) concluded that the term lean means a series of activities or solutions to
eliminate waste reduce non-value added operations and improve the value added
operation.
This value added and non-value added concept were derived mainly from Toyota
Production System (TPS) which highlighted eight forms of waste: Overproduction,

23
waiting, conveyance, over-processing, excess inventory, movement, defects and unused
employee creativity (Monden, 1998; Liker, 2004). A lean organization understands
customer value and focuses its key process to continuously increase it. The ultimate goal
is to provide perfect value to the customer through a perfect value creation process that
has zero waste.
Anand and Kodali (2008) emphasized that the theory and principles of lean and its
associated tools, practices and procedures can be extended outside the boundaries of an
organization to its supply chains. However, the concept of lean supply chain was
proposed in 1994, when the proponents of lean manufacturing, Womack and Jones
(1994) envisioned the concept of “Lean enterprise”. Bozdogan (2002) emphasized that
the success of lean supply chain management principles is derived from ten basic lean
principles : focus on the supplier network value stream, eliminate waste, synchronize
flow, minimize both transaction and production costs, established collaborative
relationships while balancing cooperation and competition, ensure visibility and
transparency, develop quick response capability, manage uncertainty and risk, align core
competencies and complementary capabilities and foster innovation and knowledge
sharing; building and maintaining a lean supply revolves around four key practices.
Mastering the four practices leads to a lean and effective supply chain (Norek, 2002).
They are demand management practices, waste management practices, standardization
practices and behavioral practices.
Organizational performance refers to how well an organization achieves its market-
oriented goals as well as its financial goals (Lysons and Farrington, 2006). The short-
term objectives of SCM are primarily to increase productivity and reduce inventory and

24
cycle time, while long-term objectives are to increase market share and profits for all
members of the supply chain (Ketchen and Hult, 2010). Financial metrics have served as
a tool for comparing organizations and evaluating an organization‟s behavior over time.
Any organizational initiative, including supply chain management, should ultimately lead
to enhanced organizational performance.
A number of prior studies have measured organizational performance using both
financial and market criteria, including return on investment (ROI), market share, profit
margin on sales, the growth of ROI, the growth of sales, the growth of market share, and
overall competitive position (Lambert, 2012). In line with the above literature, the same
items will be adopted to measure organizational performance in this study.
2.6 Summary of Empirical Studies
Author Study Findings Limitation/research
gap
Daud and
Zailani,
2011
Lean supply chain
practices and
performance in the
context of Malaysia
Lean supply chain practices are
directly related to the
performance of the electrical,
electronics and electronics
manufacturing service
companies in Malaysia
The study was done in
Malaysia and therefore
we need to do a study in
Kenya
Mageto
2009
Relationship between
supply chain
performance and
supply chain
responsiveness in
supermarkets in
Nairobi
Supply chain performance and
supply responsiveness,
reliability, flexibility and
timeliness indicate very strong
relationship with supply chain
performance
The study was done in
supermarkets and
therefore we need to do
a study in water sector
Karoki,
2014
Application of lean
thinking to business
Lean management and
application of related tools,
The study was done in
Kenya Revenue

25
process management equipment and techniques is a
continuous process at Kenya
Revenue Authority highly
driven by the need to improve
service delivery and tax
collection while netting those
evading taxes
Authority and therefore
we need to do a study in
water sector
Wainaina,
2009
Supply chain
management strategies
and performance of
commercial entities
Organizations in Kenya were
yet to fully embrace the supply
chain management strategies
and most of the practices used
were borrowed from the
procurement philosophy.
The study was done in
commercial banks and
therefore we need to do
a study in water sector
Awino,
2009
Supply chain
management in large
private manufacturing
firms in Kenya
Various challenge which
include; resistance to change by
management and inadequate
technology to support the
concept was key hindrances of
the practice.
The study was done in
private manufacturing
firms and therefore we
need to do a study in
water sector

26
2.7 Conceptual Framework
Figure 2. 1 Conceptual Framework
Independent Variables Dependent Variable
(Author, 2015)
Communicating demand involves communicating demand plan to the supply and finance
organization and increasingly, to supply chain partners. Influencing demand includes
marketing and selling tactics, product positioning, pricing, promotions and other
marketing and sales efforts, while managing and prioritizing demand includes managing
customer orders to match available supply (Shafer and Meredith, 2003). JIT means
producing what is needed and no more, anything over the minimum amount necessary is
viewed as waste, because effort and material expended for something not needed now
cannot be utilized now. The goal is to drive all inventory queues to zero, thus minimizing
inventory investment and shortening lead time (Aquilano et al., 2005). Quality control is
the technique and activities that are used to fulfill requirements for quality and the main
concern is defects detection and correction and relates to such activities as determining
Demand Management
Practices
Waste Management
Practices
Standardization Practices
Performance in the water
sector in terms of:
Minimal costs of operation
Customer satisfaction
Minimal wastage
Behavioral practices

27
where, how and at what intervals inspections should take place, the collection and
analysis of data relating to defects and determining what corrective action should be
taken (BS EN ISO 8402, 1995). Four inspection activities are receiving inspection,
classification inspection, control inspection and audit inspection.
Organizational behavior is the study of the structure, functioning and performance of the
organization, and the behavior of groups and individuals within them. Best in class
behavioral practices include job enrichment, multiple carrier ladders, high employee
participation, many and flexible incentives and quality of work life emphasis (Huczyski
and Buchanan, 2002).

28
CHAPTER THREE: RESEARCH METHODOLOGY
3.1 Introduction
This section outlined; research design target population, data collection methods and
techniques and data analysis method.
3.2 Research Design
This study adopted a descriptive survey research design aimed at establishing the effects
of lean supply chain on organization performance in water companies in Kenya. A
descriptive study is concerned with finding out the what, where and how of a
phenomenon and a cross-sectional survey design is chosen since in cross-sectional
surveys, data is collected at one point in time from sample selected to represent a larger
population (Mugenda, 2003). The descriptive study aimed at obtaining information that
could be analyzed, patterns extracted and comparison made for the purpose of
clarification and provision of basis for making decisions. Both qualitative and
quantitative data will be obtained for comparison purposes.
3.3 Population
The target population for the study was the 117 Water Service Providers (WSPs) which
were linked to 8 regional Water Services Boards (WSBs) in charge of asset management
through Service Provision Agreements (SPAs). Due to the small number of the water
service providers, a census was conducted to get the overall view in all the eight regions.
The purpose of census was to gather information about the general population, in order to
present a full and reliable picture of the study subject. This study used census in order to

29
get the overall view of lean supply chain management practices in the water sector in
Kenya.
3.4 Data Collection
Primary data was collected using structured questionnaires with both close-ended and
open-ended questions. The Primary data was collected from respondents by the use of
questionnaires as the main instruments of data collection. Questionnaires were sent
through the email to majority of the respondents and the researcher made phone calls to
encourage the respondents to fill in the questionnaire and email back. For the respondents
who were around Nairobi and its environs, the researcher visited the respondents and
administered the questionnaires to them.
3.4 Data Analysis
The data collected was edited to identify and remove errors made by respondents. Edited
data was then coded in order to translate responses into specific categories. Code
numbers were assigned to each answer of survey question and from this a coding list or
frame was obtained. Coding was expected to organize and reduce research data into
manageable summaries.
Descriptive statistics such as means, percentages and frequency distributions were used to
describe the responses as it was a better method of presenting the findings of the study.
Presentation of the results was done on tables, pie charts and bar graphs. The study also
employed inferential statistics to establish the relationship between lean supply chain
management and organizational performance in the water sector in Kenya. Specifically,
the study used Spearman correlation to establish this relationship.

30
The following regression equation was used;
Y = β0 + β1X1 + β2X2 + β3X3 β2X4+е
Where Y= Organizational performance
X1= Demand Management Practices
X2 = Waste Management Practices
X3 = Standardization Practices
X4 = Behavioral practices
℮ = Error
βo = The constant which is the value of dependent variable when all the
independent variables are 0.
Βᵢ = The regression coefficient or change induced by X1, X2, X3 and X4 on Y. It
determines how much each (X1, X2, X3 and X4) contributes to Y (Organizational
performance)

31
CHAPTER FOUR: DATA ANALYSIS AND INTERPRETATION
4.1 Introduction
This study was carried out to establish the lean supply chain management practices and
organizational performance in the public water sector in Kenya. Data was collected from
supply chain managers, procurement managers and operations managers who were in
charge of supply chain functions in their respective companies. The findings are
presented as follows;
4.2 Response Rate
A total of 117 questionnaires were distributed to the respondents. Out of the 117
questionnaires, 109 were returned to the researcher. This represents a response rate of
93%. This percentage was considered sufficient for this study. The high response rate
was achieved due to face to face administering of the questionnaires by the researcher
and frequent phone calls requesting the respondents to respond and email back the
questionnaires.
4.3 Demand management practices
The study sought to determine the extent to which the water companies implemented the
Demand management practices. . The responses were rated on a five point Likert scale
where: 5= to a very great extent, 4= great extent, 3- Moderate extent, 2= to a little extent
and 1 = to a very little extent. The mean and standard deviations were generated from
SPSS and are as illustrated in table below.

32
Table 4.1 Demand management practices
Demand management practices Mean Std.
Dev
The firm has invested time and money in collaborative demand
planning
4.4 1.29
The firm manages its customer orders to match available supply. 4.3 1.16
The firms always conducts annual demand forecasting 4.2 1.23
The firm always communicates its demand forecasts to its supply
chain partners.
4.2 1.12
The firm always conducts annual production and purchasing planning 4.1 1.22
The firm always does product positioning, pricing and promotion of its
products.
3.6 1.11
Source: Research Data (2015)
According to the study findings, it was established that the firm has invested time and
money in collaborative demand planning was to a great extent (mean of 4.4), the firms
always conducts annual demand forecasting was to a great extent (mean of 4.2), the firm
always conducts annual production and purchasing planning was to a great extent (mean
of 4.1), the firm always communicates its demand forecasts to its supply chain partners
was to a great extent (mean of 4.2), the firm always does product positioning, pricing and
promotion of its products was to a moderate extent (mean of 3.6) while the firm manages
its customer orders to match available supply was to a very great extent (mean of 4.3).
The study deduced that demand management is concerned with balancing the
requirement of internal and external customers with supply chain capabilities according
to Lysons and Farrington (2006).

33
4.4 Waste management practices
The study also sought to determine the extent to which the water companies implemented
the Waste management practices.. The responses were rated on a five point Likert scale
where: 5= to a very great extent, 4= great extent, 3- Moderate extent, 2= to a little extent
and 1 = to a very little extent. The mean and standard deviations were generated from
SPSS and are as illustrated in table below.
Table 4.2 Waste management practices
Waste management practices Mean Std.
Dev
The firm has small specialized plants rather than vertically
integrated manufacturing facilities.
4.6 1.19
The firm encourages doing the right thing the first time 4.3 1.12
The authority to produce or supply additional parts always comes
from the downstream
4.3 1.14
The firm produces what is needed and no more (JIT) 4.2 1.24
The firm practices the philosophy of grouping similar parts in
families to eliminate movement and queue
3.8 1.03
The firms production flow is smooth to dampen reaction waves that
occur in response to schedule variations
3.6 1.17
Source: Research Data (2015)
The study sought to find out the extent to which firms have implemented waste
management practices. According to the study findings, it was established that the firm
has small specialized plants rather than vertically integrated manufacturing facilities was
to a very great extent (mean of 4.6), that the firm practices the philosophy of grouping
similar parts in families to eliminate movement and queue was to a moderate extent
(mean of 3.8), that the firm encourages doing the right thing the first time was to a very

34
great extent (mean of 4.3), that the firm produces what is needed and no more (JIT) was
to a great extent (mean of 4.2), that the firms production flow is smooth to dampen
reaction waves that occur in response to schedule variations was to a moderate extent
(mean of 3.6) while that the authority to produce or supply additional parts always comes
from the downstream operations was to a very great extent (mean of 4.3).
The study deduced that waste management practices is anything other than the minimum
amount of equipment, materials, parts and workers (working time) which are absolutely
essential to production, and the seven types if waste to be eliminated in the supply chain
are: waste from overproduction, waste of waiting time, transportation waste, inventory
waste, processing waste, waste of motion and waste from product defects according to
Aquilano et al., (1995).
4.5 Standardization Practices
The study also sought to determine the extent to which the water companies implemented
the Standardization practices.. The responses were rated on a five point Likert scale
where: 5= to a very great extent, 4= great extent, 3- Moderate extent, 2= to a little extent
and 1 = to a very little extent. The mean and standard deviations were generated from
SPSS and are as illustrated in table below.

35
Table 4.3 Standardization Practices
Standardization Practices Mean Std. Dev
The firm always employs quality assurance at all times 4.6 1.13
The firm encourages quality control activities in all its production
stages
3.9 1.14
The firm has standardized and rationalized the range of materials,
parts and consumables
3.7 1.21
Source: Research Data (2015)
According to the study findings, it was established that the firm has standardized and
rationalized the range of materials, parts and consumables was rated to a moderate extent
(mean of 3.7), that the firms always employs quality assurance at all times was to a very
great extent (mean of 4.6) while that the firm encourages quality control activities in all
its production stages was to a moderate extent (mean of 3.9). The study deduced that
standardization practices help clear specification, achieve reliability and reduce costs,
accurate comparison of quotation, less depended on specialist suppliers, reduce error and
conflict and reduce cost of material handling (Lysons and Farrington, 2006). These
practices include variety reduction, quality assurance and quality control.
4.5.1 Quality assurance practices
The study sought to identify the quality assurance activities that the firm practices as an
approach to defect prevention. The findings are presented in the table below.

36
Table 4.4 Quality assurance practices
Frequency Percentage
Quality system (ISO 9000) 28 26
New design control 11 10
Incoming material control 21 19
Supplier appraisal 14 13
Design for manufacturing processes 17 16
All of the above 17 16
None of the above 0 0
Total 109 100
Source: Research Data (2015)
According to the study findings, majority of the respondents indicated that Quality
system (ISO 9000) was the quality assurance practice identified as an approach to defect
prevention accounting for 26%, incoming material control was the quality assurance
practice identified as an approach to defect prevention accounting for 19%, design for
manufacturing processes and all of the above quality assurance practice identified as an
approach to defect prevention accounted for 16% respectively, supplier appraisal was the
quality assurance practice identified as an approach to defect prevention accounted for
13% while new design control was the quality assurance practice identified as an
approach to defect prevention accounted for 10%. The study deduced that the quality
assurance practice used by the public water companies in Kenya was Quality system
(ISO 9000).
4.5.2 Inspection Activities
The respondents were requested to identify the inspection activities that are undertaken in
their firms to detect defects. The findings are presented in the figure below.
37
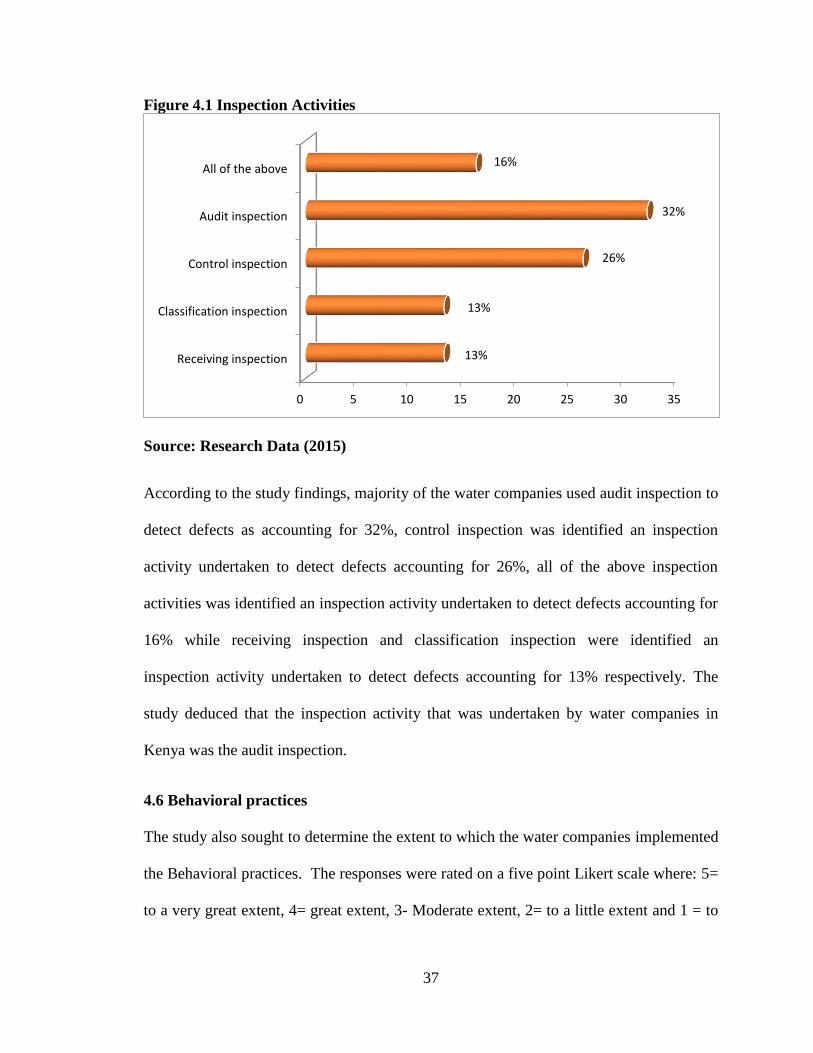
Figure 4.1 Inspection Activities
Source: Research Data (2015)
According to the study findings, majority of the water companies used audit inspection to
detect defects as accounting for 32%, control inspection was identified an inspection
activity undertaken to detect defects accounting for 26%, all of the above inspection
activities was identified an inspection activity undertaken to detect defects accounting for
16% while receiving inspection and classification inspection were identified an
inspection activity undertaken to detect defects accounting for 13% respectively. The
study deduced that the inspection activity that was undertaken by water companies in
Kenya was the audit inspection.
4.6 Behavioral practices
The study also sought to determine the extent to which the water companies implemented
the Behavioral practices. The responses were rated on a five point Likert scale where: 5=
to a very great extent, 4= great extent, 3- Moderate extent, 2= to a little extent and 1 = to
0 5 10 15 20 25 30 35
Receiving inspection
Classification inspection
Control inspection
Audit inspection
All of the above
13%
13%
26%
32%
16%

38
a very little extent. The mean and standard deviations were generated from SPSS and are
as illustrated in table below.
Table 4.5 Behavioural practices
Behavioral practices Mean Std. Dev
The firm has always broadened the experience of work to enhance
employee needs satisfaction
4.6 1.08
The firm always encourages high employee participation 4.6 1.21
The firm always encourages quality of working life emphasis 4.3 1.18
The firm has multiple carrier ladders for its staff 4.1 1.23
The firm has many and flexible employee incentives 3.4 1.03
Source: Research Data (2015)
According to the study findings, it established that the respondents rated the behavioral
practices on the firm has always broadened the experience of work to enhance employee
needs satisfaction to a very great extent (mean of 4.6). The behavioral practice on the firm
has multiple carrier ladders for its staff was rated to a great extent (mean of 4.1). The
behavioral practice on the firm has always encouraged high employee participation was rated
to a very great extent (mean of 4.6).
The behavioral practice on the firm has many and flexible employee incentives was rated to a
moderate extent (mean of 3.4) while the behavioral practice on the firm has always
encourages quality of working life emphasis was rated to a great extent (mean of 4.3). The
study deduced that the supply chain partners from upstream suppliers to downstream
customers collaborate as a team to provide value to the end user. According to Huczyski and
Buchanan, 2002 best in class behavioral practices include job enrichment, multiple carrier
ladders, high employee participation, many and flexible incentives and quality of work life
emphasis.

39
4.7 Performance of the organization
The study also sought to determine the extent to which the respondents agreed with the
following statement regarding the performance of their organizations The responses
were rated on a five point Likert scale where: 5= to a very great extent, 4= great extent,
3- Moderate extent, 2= to a little extent and 1 = to a very little extent. The mean and
standard deviations were generated from SPSS and are as illustrated in table below.
Table 4.6 Performance of the organization
Performance Mean Std. Dev
There is improved levels of professionalism 4.7 0.54
Services offered are good 4.6 0.48
Decision making is efficient 4.3 0.51
There has been an overall reduction in costs incurred 4.1 0.62
Customers‟ requirements are met in terms of quality 4.1 0.52
There is avoidance of product reject/return 3.7 0.48
There is real time delivery of goods and services 3.2 0.65
Source: Research Data (2015)
From the findings above, majority of the respondents agreed to a very great extent that
there were improved levels of professionalism; services offered were good; decision
making was efficient; there has been an overall reduction in costs incurred and
customers‟ requirements were met in terms of quality as indicated by the mean scores of
4.7, 4.6, 4.3 and 4.1. on the other hand, most of the respondents agreed to great extent
that there was avoidance of product reject/return and there were real time delivery of
goods and services as shown by the mean scores of 3.7 and 3.2 respectively.

40
4.7.1 Operational performance measure
Table 4.7 Operational Performance measure
2012 2013 2014
Year Mean Std. Dev Mean Std. Dev Mean Std. Dev
Quality
improvement
3.6 0.16 4.4 0.48 4.6 0.16
Customer
satisfaction
4.4 0.17 4.3 0.52 3.8 1.01
Efficiency levels 4.7 0.70 4.5 0.62 4.5 0.22
Productivity 3.4 0.62 4.6 0.54 3.4 1.49
Cost reduction 3.8 1.01 4.1 0.05 3.1 1.32
Source: Research Data (2015)
From the findings above, majority of the public water companies improved on their
quality over the last three years as indicated by the mean scores of 3.6, 4.4 and 4.6
respectively. On the other hand, the companies recorded low customer satisfaction over
the three years as shown by the mean scores of 4.4, 4.3 and 3.8 respectively. On
efficiency levels, the study established that the levels were high at 4.7 in 2012 but
remained constant in the next two years. On productivity, majority of the companies
reported high productivity in 2013 and lowest in 2012 while productivity went up in 2014
as shown in the table above. On cost reduction, the study established that majority of the
public water companies reduced their cost to a very high extent in 2013 with a mean
score of 4.1 and lowest in 2014 with a mean of 3.1 while in 2012 the level of cost
reduction was at a mean of 3.8.

41
4.7.2 Challenges facing water sector in meeting customer requirement
The study sought to find out the challenges that were facing water sector in meeting
customer requirement. According to the study findings, the following were found to be
challenges facing the water sector: Harmonization with other policies: Although the 1999
water policy is reasonably good, there will be need to update it in the near future to
harmonize it with the sanitation policy, irrigation policy, and the environment policy,
among others, which are at advanced stages of preparation.
Classification of water companies: Under the Companies Act, water companies are
registered as private, limited liability companies but majority are owned by local
authorities and are managing public assets to give an essential public service. Attracting
private investment capital where the funds available from the Government and
development partners are not enough to meet the MDGs with regard to WSS.
WSP change-over mechanism: It is generally held that if a WSP does not perform as
expected, another one will be appointed in its place. The mechanisms for effecting the
change are however unclear. They should be clearly stated in the law or WASREB rules.
Division of Assets: In some WSPs the ownership of assets is held by the LA and the
WSB. Valuation is sometimes difficult as utilities experience continuous rehabilitation
and expansion. Economic viability of schemes: Some WSPs are too small to be viable.
Credible criteria to determine viable WSPs is required
4.7.2 Mitigation of the Challenges
The study sought to find out how water companies mitigated the challenges they face.
According to the study findings, majority of the companies developed policies that

42
protected the company from government interference through training and seminars the
adoption of technological innovation and intensive strategies to improve value for the
customers.
4.8 Relationship between Lean Supply Chain Management Practices and
Organizational Performance
Further the researcher conducted a multiple regression analysis so as to analyze the lean
supply chain management practices and organizational performance in the public water
sector in Kenya. The researcher applied the statistical package for social sciences (SPSS)
to code, enter and compute the measurements of the multiple regressions for the study.
Coefficient of determination explains the extent to which changes in the dependent
variable can be explained by the change in the independent variables or the percentage of
variation in the dependent variable (Demand Management Practices, Waste Management
Practices, standardization Practices and Behavioral practices).
The four independent variables that were studied, explain only 83.4% of Organizational
performance as represented by the adjusted R2. This therefore means that other factors
not studied in this research contribute 16.6% of Organizational performance. Therefore,
further research should be conducted to investigate the other factors (16.6%) of
Organizational performance in the public water sector in Kenya.

43
Table 4.8 Regression Coefficients
Model
Unstandardized
Coefficients
Standardize
d
Coefficients
t Sig. B
Std.
Error Beta
(Constant) 1.308 1.342 1.623 0.357
Demand Management
Practices 0.558 0.310 0.172 4.342 .0276
Waste Management Practices 0.731 0.156 0.210 3.592 .0285
Standardization Practices 0.785 0.322 0.097 3.542 .0202
Behavioral practices 0.620 0.285 0.148 3.458 .0249
Source: Research Data (2015)
Multiple regression analysis was conducted as to determine the relationship between
Organizational performance and the four variables. As per the SPSS generated table 4.19,
the equation
(Y = β0 + β1X1 + β2X2 + β3X3 + β4X4+ + ε) becomes:
Y= 1.308+ 0.558X1+ 0.785X2+ 0.620X3+0.731X4
The regression equation above has established that taking all factors into account
(Demand Management Practices, Waste Management Practices, standardization Practices
and Behavioral practices) constant at zero, Organizational performance in the public
water sector in Kenya will be 1.308. The findings presented also shows that taking all
other independent variables at zero, a unit increase in Demand Management Practices
will lead to a 0.558 increase in Organizational performance; a unit increase in Waste
Management Practices will lead to a 0.731 increase in Organizational performance; a unit
increase in Standardization Practices will lead to a 0.785 increase in Organizational

44
performance and a unit increase in Behavioral practices will lead to a 0.620 increase in
Organizational performance in the public water sector in Kenya. This infers that use of
Demand Management Practices contributed most to Organizational performance in the
public water sector in Kenya followed by Waste Management Practices then
Standardization Practices while Behavioral practices contributed the little to
Organizational performance in the public water sector in Kenya.
At 5% level of significance and 95% confidence level, Waste Management Practices had
a significance level of 0.0285; Demand Management Practices had a significance level of
0.0276, Behavioral practices had a 0.0249 significance level while Standardization
Practices had a 0.0202 significant level. This implies that Standardization Practices was
the most significant factor influencing customer satisfaction.
Table 4.9 Model Summary
Model R R Square
Adjusted R
Square
Std. Error of
the Estimate
1 0.913 0.834 0.751 0.4538
Source: Research Data (2015)
4.8.2 ANOVA
Table 4.10 ANOVA (Analysis of Variance)
Model Sum of Squares df Mean Square F Sig.
1 Regression 1.424 9 .208 3.23 .002a
Residual 5.375 20 .232
Total 6.799
29

45
Source: Research Data (2015)
a. Predictors: (Constant), (Demand Management Practices, Waste Management Practices,
standardization Practices and Behavioral practices)
b. Dependent Variable: Organizational performance in the public water sector in Kenya
Analysis of Variance (ANOVA) consists of calculations that provide information about
levels of variability within a regression model and form a basis for tests of significance.
The "F" column provides a statistic for testing the hypothesis that all 0 against the
null hypothesis that = 0 (Weisberg, 2005). From the findings the significance value is
.002 which is less that 0.05 thus the model is statistically significance in predicting how
Demand Management Practices, Waste Management Practices, standardization Practices
and Behavioral practices affect E Organizational performance in the public water sector
in Kenya. The F critical at 5% level of significance was 3.23. Since F calculated is
greater than the F critical (value = 2.21), this shows that the overall model was
significant.

46
CHAPTER FIVE: SUMMARY, CONCLUSION AND
RECOMMENDATIONS
5.1 Introduction
This study was carried out to establish the lean supply chain management practices and
organizational performance in the public water sector in Kenya. This chapter presents the
summary of findings based on the objectives of this study, gives conclusions,
recommendations based on the findings of the study and the suggestions on areas that
need to be researched as far as this concept is concerned.
5.2 Summary of Findings
The study established that demand management was concerned with balancing the
requirement of internal and external customers with supply chain capabilities. Further,
the study found out that the firm had invested time and money in collaborative demand
planning, the firms always conducts annual demand forecasting, the firm always conducts
annual production and purchasing planning and that the firm always communicates its
demand forecasts to its supply chain partners.
On waste management practices, the study found out that waste management practices is
anything other than the minimum amount of equipment, materials, parts and workers
(working time) which are absolutely essential to production, and the seven types if waste
to be eliminated in the supply chain are: waste from overproduction, waste of waiting
time, transportation waste, inventory waste, processing waste, waste of motion and waste
from product defects. The study also found out that the firm has small specialized plants
rather than vertically integrated manufacturing facilities, the firm encourages doing the

47
right thing the first time, the firm produces what is needed and no more (JIT) and that the
firms production flow is smooth to dampen reaction waves that occur in response to
schedule variations.
The study also found out that standardization practices help clear specification, achieve
reliability and reduce costs, accurate comparison of quotation, less depended on specialist
suppliers, reduce error and conflict and reduce cost of material handling. Further, the
firms always employs quality assurance at all times and that Quality system (ISO 9000)
was the quality assurance practice identified as an approach to defect prevention in
majority of the water companies while control inspection was identified an inspection
activity undertaken to detect in the water companies.
The study found out that behavioral practices include job enrichment, multiple carrier
ladders, high employee participation, many and flexible incentives and quality of work
life emphasis. On the other hand, the study established that behavioral practices on the
firm has always broadened the experience of work to enhance employee needs satisfaction
and The behavioral practice on the firm has multiple carrier ladders for its staff. Lastly, the
study found out that there were improved levels of professionalism; services offered were
good; decision making was efficient; there has been an overall reduction in costs incurred
and customers‟ requirements were met in terms of quality.
5.3 Conclusions
The study concluded that the lean supply chain practices used by the public water
companies in Kenya were demand management practices, waste management practices,
standardization practices, behavioral practices, inspection activities and assurance
activities. The study concluded that the companies have been embracing lean supply

48
chain management strategies despite the challenges experienced form the internal and
external environment. Lean supply chain management strategies have assisted the water
companies to enhance their performance. This is supported by the results from a
regression analysis conducted that indicated that there is a strong relationship between
lean supply chain practices and performance of public water companies in Kenya. To
gain competitive edge, public water companies in Kenya have no choice other than
implementation of the lean strategies for survival.
5.4 Recommendations
On demand management practices, the study recommends that the companies should
invest in time and money in collaborative demand planning, the firms should
communicate its demand forecasts to its supply chain partners. On waste management
practices, the study recommends that the companies should practice the philosophy of
grouping similar parts in families to eliminate movement and queue. The study recommended that
the firm should have standardized and rationalized the range of materials, parts and consumables.
On behavioral practices, the study recommended that the firm should always broaden the
experience of work to enhance employee needs satisfaction. The study recommended that all
firms‟ business activities should be technologically driven in order to have a competitive
edge which is seen as path to better results given the quality of processes and procedures
that are enhanced by environmental force.
5.5 Limitations of the Study
It was such an uphill task for the researcher to convince the respondents to participate in
the study. Organizations are known to work under very strict confidentiality in order to
secure any unauthorized access to information. Most of the respondents agreed to

49
participate on condition that the information would not be divulged to any other party
other than for academic purposes only.
The findings of this study and application thereof are limited to water sector in Kenya.
They could not be applicable directly to other organizations operating outside the Kenyan
water sector. It was therefore important to note that they could only be used for
comparative purposes and not any direct application in another country.
5.6 Recommendation for Further Studies
The researcher recommends that a similar study should be embarked on different
companies in Kenya to verify the study results. Finally the researcher recommends that
future researchers should investigate on the influence of government policies on lean
supply chain practices and organization performance.

50
REFERENCES
Agarwal J. P. and Shankar D. T., “Lean Thinking: Banish Waste and Create Wealth in
your Corporation”, 2003, New York: Simon & Schuster.
Agus, A. & Hajinoor, M. S. (2012), “Lean production supply chain management as driver
towards enhancing product quality and business performance: Case study of
manufacturing companies in Malaysia”, International Journal of Quality &
Reliability Management, Vol. 29 No.1, pp.92–121.
Anond, G., and Kodali, R.,(2013), “A Conceptual Framework for lean supply chain and
its Implementation”, International Journal of Value chain Management, 2(3), 313
Aquilano, N.J., et al. (2014), Fundamentals if Operations management, Irwin, Chicago,
IL.
Awino H. Y. (2009). Selected Strategy Variables on Firm’s Performance: A Study of
Supply Chain Management in Large Private Manufacturing Firms in Kenya.
MBA Research Project. University of Nairobi
Bodognz, G. (2012) “Lean Supplier Networls, Massachusetts Institute of Technology,
ppt. slides.BS EN ISO 8402, 1995.
Boysons, S. et al. (2010), Logistics and the Extended Enterprise: Benchmarks and Best
Practices for the manufacturing professional, Wiley, New York, NY.
Chen, I.J. and Paulraj, A. (2014), “Towards a theory of supply chain management: the
constructs and measurements”, Journal of Operations Management, Vol. 22 No.
2, pp. 119-51

51
Cigolini, R. et al. (2014), “A new framework for supply chain management conceptual
model and empirical test”, International Journal of Operations and Production
Management, 24 (2) pp. 7-41
Clemens, C. and Douglas, S. (2006). Supply Chain Management in theory and Practice:
A passing fad or a fundamental change? Industrial Management and Data
Systems.
Cooper, M.C., Lambert, D.M., and Pagh, J. (2012) Supply Chain Management: More
Than a New Name for Logistics. The International Journal of Logistics
Management Vol 8, Iss 1, pp 1–14
Cozzi and Perona A. (2012). “Power, Value and SCM”. Supply Chain Management: An
International Journal. 4(4) 167-175.
Daudi, A and Zailani, S. (2011), “Lean supply Chain Practices and Performance in the
Context of Malaysia, Available at: www. Intechopen.com
Dubois A, Hulthén K and Pedersen A-Charlott (2004): “Supply chains and
interdependence: a theoretical analysis”. Journal of Purchasing & Supply
Management 10, pp. 3-9
Duclos, L.K et al. (2013), “A Conceptual Model of Supply Chain Flexibility”, Industrial
Management and Data Systems, 103 (6), pp. 446-456. 56
Frohlich, M.T., and Westbrook, R. (2011), “Arcs of integration: an international study of
supply chain strategy‟, Journal of Operations Management, 18, pp. 185-200

52
Goldsby et al.(2011). What is Agility”, Journal of Manufacturing Engineer, 76(1), pp.
28-31.
Gunasekaran, A et al. (2011),”Performance Measures and Metrics in a supply chain
environment‟, International Journal of Operations and production Management,
20(5), pp. 71-87
Harland, C.M. (2012) Supply Chain Management, Purchasing and Supply Management,
Logistics, Vertical Integration, Materials Management and Supply Chain
Dynamics. In: Slack, N (ed.) Blackwell Encyclopedic Dictionary of Operations
Management. UK: Blackwell.
Hines, P., Holweg, M. and Rich, N. (2014), “Learning to evolve: a review of
contemporary lean thinking”, International Journal of Operations and Production
Management, Vol. 24 No. 10, pp. 994-1012
Hirsch, L.L; Padmanabhan, V. and Whang, S. (1975). The bullwhip effect in Supply
chains.
Holweng, M. (2012), “The three dimensions for responsiveness”, International Journal
of Operations and Production Management, 25 (7), pp. 603-22.
Hucztski, A. and Buchanan, D. (2012). Organizational Behavior, An Introductory Text,
Pearson Education Ltd, 4th Edition.
Jørgensen, B., & Emmitt, S. (2009), “Investigating the integration of design and
construction from a „lean‟ perspective”, Construction Innovation: Information,
Process, Management, Vol. 9 No. 2, pp. 225–240.

53
Jusko, Jill. (2014). Accounting For Lean Tastes. Industry Week, 256(9), 3.
Kallrath, J., Maindl, T.I. (2010): Real Optimization with SAP® APO. Springer ISBN 3-
540- 22561-7.
Karoki (2014) did a survey of the extent of outsourcing of Human Resource management
functions Services by the Public Service in Kenya Unpublished MBA Project
University of Nairobi.
Kenya Association of Manufacturers (2011). Kenya manufacturers and exporters
directory. Nairobi, Kenya : Adric Communication.
Kenya National Bureau of Statistics (2010). Statistical Abstruct. Nairobi, Kenya
:Government Printers.
Kenya National Bureau of Statistics (2011). Economic Survey. Nairobi, Kenya :
Government Printers. 57
Kouvelis, P.; Chambers, C.; Wang, H. (2011): Supply Chain Management Research and
Production and Operations Management: Review, Trends, and Opportunities. In:
Production and Operations Management, Vol. 15, No. 3, pp. 449–469.
Larson, P.D. and Halldorsson, A. (2014). Logistics versus supply chain management: an
international survey. International Journal of Logistics: Research and
Application, Vol. 7, Issue 1, 17-31.
Lee, H.L. (2014), “Aligning Supply Chain Strategies with Production Uncertainties”,
California Management Review, 44(3), pp. 105.

54
Li, S. et al. (2009), “The Impact of Supply Chain Management Practices on Competitive
Advantage and Organizational Performance”, Omega, 34 (2). Pp. 107-124.
Liker, J.K., (2014),”The Toyota Way 14 Management Principles form the world Greatest
Manufacturers”, MC Graw Hill, ISBN 0-07139231-9
Lin, Z. et al. (2013), “Should Lean replace mass Organization systems?”, Journal of
International Business Studies, 30, pp. 2-16.
Lummus, R.R Alber, K.L., 1997, Supply Chain Management: Balancing the Supply
Chain with Customer demand, the Educational and Resource Foundation of
APICS, Falls Church, VA.
Lummus, R.R., et al. (2013), “Supply Chain Flexibility: building a new model”, Global
journal of Flexible Systems Management, 4 (4), pp.1-13.
Lysons, K. and Farrington, B. (2006), Purchasing and supply chain management,
pearsons Education Ltd, 7th Edition
Mageto, J.N., (2009), “Relationship between Supply Chain Performance and Supply
Chain Responsiveness: A case of Supermarkets in Nairobi, Kenya”, Unpublished
MBA thesis, University of Nairobi, Nairobi, Kenya. 58
McGaughy and Helper, (2009) “The Customization-responsiveness sqeeze”, Sloam
Management Review, 35 (2), pp. 89-99.
McManus, Kevin. (2012). The trouble with teams. Industrial Engineer, 39(10), 1.

55
Mentzer, J.T. et al (2011), “Defining Supply Chain Management”, Journal of Business
Logistics, 22(2), pp. 1-25
Ngonjo (2014) Supply Chain Management Practices at the University of Nairobi.
Unpublished MBA Project, University of Nairobi.
Norek, C.D., (2012), “Returns Management Making Order out or Chaos”, Supply Chain
Management Review, May/June 2002.
Omondi, B. (2012),”Strategic Response to Environmental changes by vegetable oil
processing and refining firms in Kenya”, Unpublished MBA thesis, University of
Nairobi, Nairobi, Kenya.
Power, D.J. and Sohal, A. (2011) “Critical Success Factors in Agile Supply Chain
Management, An Empirical Study”, International Journal of Physical
Distribution and Logistics, 31 (4), pp.247-265.
Prater, S. et al (2011), “Supply Chain Improvement Initiatives in the Textile, Clothing,
Footwear and Leather Industry; A Field Study”, International Journal of Logistics
Systems and Management, 3 (1), pp. 1-19. 59
Randall, T., Morgan, R. and Morton, A. (2013), “Efficient versus responsive supply chain
choice: an empirical examination of influential factors”, Journal of Product
Innovation Management, Vol. 20 No. 6, pp. 430-44
Reichhart, A. and Holweng, M. (2013), “Creating the Customer responsive Supply
Chain; a reconciliation of concepts”, Journal of Operations and Production
Management, 27(11), pp.1144-1172.

56
Rivera, T.H. (2004), Measuring performance in public and Non-Profit Organizations,
Jossey-Bass. San Francisco, A Wiley Imprint.
Saunders, M. et al (2013), Research Methods for Business Students, London, UK :
Prentice Hall, 4th Edition.
Simone, Andrew, Kleiner and Brian, S. (2014), A Study of the Toyota Production System
From an Industrial Engineering Viewpoint, Productivity Press, New York, NY.
Togar. M.s and Ramaswami, S. (2014), “A benchmarking scheme for supply chain
collaboration”, An International Journal, 11(1), pp. 9-30.
Veckery, S.K. et al (2013), “The Effect of an Integrative Supply Chain Strategy on
Customer Service and Financial Performance: An Analysis of Direct Versus
Indirect Relationship”, Journal of Operations Management, 21,523-539.
Vonderembse, Renee., & Carter, Erin. (2006). Fix the Process, Not the People. Strategic
Finance, 88(1), 8.
Wainaina (2009) Supply Chain Management Practices and Performance in Cement in
Cement Industry in Kenya. . Unpublished MBA Project University of Nairobi.
Womack, J. P. and Jones, D.T. (2012), Lean Thinking, Simon and Schuster, New York, NY.
Womack, J.P. and Jones, D.T. (2009), “From Lean Production to the lean enterprise”,
Harvard Business Review, March-April, pp.93-103.

57
Wu, S. and Wee, H.M. (2009), “lean supply chain and its effect on production cost and
quality; a case study on Ford Motor Company”, supply chain management: An
International Journal, 14 (5), pp. 335-341.
Zhu, Q. and Sarkis, J. (2004) Relationships between Operational practices and
performance among early adopters of green supply chain management practices in
Chinese Manufacturing enterprises. Journal of Operations Management, 22(3),
265-289.

58
APPENDICES
APPENDIX 1: QUESTIONAIRE
Part A: Organizational Profile
Name of company_______________________________________________________
How many years has your company been in operation?
Below 5 years [ ] 5 to 10 years [ ]
11 to 15 years [ ] 16 to 20 years [ ]
Above 20 years [ ]
Size of company (No. of employees) _______________________________
Part B: Relationship between lean supply chain practices and organization performance
Demand Management
To what extent has your firm implemented the following demand management practices
(please tick appropriately using a scale of 1-5, where 5= to a very great extent, 4= great
extent, 3- Moderate extent, 2= to a little extent and 1 = to a very little extent )
Demand management practices 5 4 3 2 1
The firm has invested time and money in
collaborative demand planning
The firms always conducts annual demand
forecasting
The firm always conducts annual production
and purchasing planning

59
The firm always communicates its demand
forecasts to its supply chain partners.
The firm always does product positioning,
pricing
and promotion of its products.
The firm manages its customer orders to match
available supply.
To what extent has your firm implemented the following waste management practices
(please tick appropriately using a scale of 1-5, where 5= to a very great extent and 1 = to
a very little extent)
Waste Management Practices 5 4 3 2 1
The firm has small specialized plants rather
than vertically integrated manufacturing
facilities.
The firm practices the philosophy of grouping
similar parts in families to eliminate movement
and queue
The firm encourages doing the right thing the
first time
The firm produces what is needed and no more
(JIT)
The firms production flow is smooth to dampen
reaction waves that occur in response to
schedule variations
The authority to produce or supply additional
parts always comes from the downstream
operations.
To what extent has your firm implemented the following standardization practices (please
tick appropriately using a scale of 1-5, where 5= to a very great extent and 1 = to a very
little extent)
Standardization Practices 5 4 3 2 1

60
The firm has standardized and rationalized the
range of materials, parts and consumables
The firm always employs quality assurance at
all times
The firm encourages quality control activities
in all its production stages
Which of the following quality assurance activities does your firm practice as an
approach to defects prevention?
Quality system (ISO 9000) [ ] New design control [ ]
Incoming material control [ ] Supplier appraisal [ ]
Design for manufacturing processes [ ] All of the above [ ]
None of the above [ ]
Which of the following inspection activities does your firm undertake to detect defects
Receiving inspection [ ] Classification inspection [ ]
Control inspection [ ] Audit inspection [ ]
All of the above [ ] None of the above [ ]
To what extent has your firm implemented the following behavioral practices (please tick
appropriately using a scale of 1-5, where 5= to a very great extent and 1 = to a very little
extent)
Behavioral Practices 5 4 3 2 1
The firm has always broadened the experience
of work to enhance employee needs satisfaction
The firm has multiple carrier ladders for its
staff

61
The firm always encourages high employee
participation
The firm has many and flexible employee
incentives
The firm always encourages quality of working
life emphasis
To what extent do you agree with the following statements regarding the performance of
your organization? (please tick appropriately using a scale of 1-5, where 5= to a very
great extent and 1 = to a very little extent)
Performance 5 4 3 2 1
Services offered are good
Decision making is efficient
There has been an overall reduction in costs
incurred
There is improved levels of professionalism
There is real time delivery of goods and
services
There is avoidance of product reject/return
Customers‟ requirements are met in terms of
quality
Kindly indicate the statistic of the following operational performance measure in the table
below
Performance measures 2012 2013 2014

62
Quality improvement
Customer satisfaction
Efficiency levels
Productivity
Cost reduction
What are some of the challenges facing water sector in meeting customer requirement
________________________________________________________________________
________________________________________________________________________
____________
How are these challenges mitigated?
________________________________________________________________________
________________________________________________________________________
________________________________________________________________________
__________________
Thank you very much for your time and cooperation.

63
APPENDIX 1I: ROLES AND RESPONSIBILITIES OF
INSTITUTIONS IN THE WATER SECTOR
Body Responsibilities
Ministry of Water and
Irrigation
Policy formulation, sector coordination, monitoring,
financing and supervision.
Water Resources
Management Authority
Regulation of water resources management
Catchment Areas Advisory
Committees
Advise the Water Resources Management Authority on
issues concerning management of water resources at the
catchment level
Water Services Boards
Responsible for the efficient and economical provision of
water services within their area of jurisdiction through
signing of service
provision agreements with Water Service Providers
Water Resources Users
Associations
Provides a forum for conflict resolution and cooperative
management of water resources in designated catchment
areas.
Water Service Providers Direct provision of water and sewerage services as agents
of Water Services Boards.
Water Appeal Board Handle disputes in the water sector.
Water Services Trust
Support
Financing of pro-poor water services in unserved areas.
National Water
Conservation and
Pipeline Corporation
Bulk water supply, dam construction, flood control, land
drainage, ground water development and Ministry of
Water and Irrigation reserve Water Service Provider
Kenya Water Institute Training and research
Source: adapted from MWI (2005) quoted in Owuor & Foeken (2009)

64
APPENDIX 1I: LIST OF WATER SERVICE PROVIDERS
1. Lake Victoria South Water Services
Board-
2. South Nyanza Water & Sewerage
Company
3. Mikutra Water & Sewerage
Company
4. Gusii Water & Sewerage Company
5. Tililbei Water & Sewerage Company
6. Lake Victoria North Water Services
Board
7. Nzoia Water & Sewerage Company
8. AMATSI Water Company
9. Athi Water Services Board
10. Kiambu Water & Sewerage
Company Ltd
11. Kikuyu Water Company Ltd
12. Nairobi Water & Sewerage
Company Ltd
13. Karuri Water & Sanitation Company
Ltd
14. Coast Water Services Board
15. Kilifi-Mariakani Water & Sewerage
Company Ltd
16. Tana Water and Sanitation Company
Limited
17. Kwale Water and sanitation
company
18. Rift Valley Water Services Board
19. Eldama Ravine Water & Sanitation
20. Iten Water & Sewerage Company
21. Kapenguria Water Company
22. Tana Water Services Board
23. Nyeri Water & Sewerage Company
24. Muranga South Water & Sewerage
Company
25. Kirinyaga Water & Sewerage
Company
26. Nithi Water & Sewerage Company
27. Naromoru Water Company
28. Imetha Water Company
29. Tanathi Water Services Board
30. Kiambere- Mwingi Water and
Sanitation Company
31. Yatta Water & Sewerage Company
32. Kibwezi-Makindu Water &
Sewerage Company
33. Mwala Water & Sanitation Company
34. Wote Water & Sewerage Company
35. Matungulu Kangundo Water &
Sewerage Company
36. Northern Water Services Board
37. Isiolo Water & Sewerage Company
38. Isiolo Water & Sewerage Company
39. Maralal Water & Sanitation
Company
40. Mandera Water & Sewerage
Company
41. Nakuru water and sanitation
company
42. Lake Victoria North Water Services
Board
43. Athi Water Services Board
44. Rift Valley Water Services Board
45. Tana Water Services Board
46. Tanathi water services board
47. Lake Victoria South Water Services
Board
48. Coast Water Services Board
49. Nairobi City Water and Sewerage
Company
50. Kisumu Water and Sewerage
Company
51. Kapenguria water and sanitation
company
52. Iten tambach water and sanitation
company

65
53. Matamaiyo water service providers
54. Njabiini Ngwataniro water service
providers
55. Turaga murauki water service
providers
56. Laigiri water service providers
57. Nakuru urban water supply
58. Greater nakuru east water supply
59. Greater nakuru west water supply
60. Greater stream rural water supply
61. West acre water supply
62. Kerma rural water supply
63. Bahati chania water supply
64. Naivasha urban water supply
65. Suswa rural water supply
66. Eldama ravine urban water supply
67. Lodwar urban water supply
68. Narok urban water supply
69. Makutano urban water supply
70. Kapengurai urban water supply
71. Chepereria rural water supply
72. Orkum rural water supply
73. Kura rural water supply
74. Sigor rural water supply
75. Kiringet – tarta rural water supply
76. Iten teruach rural water supply
77. Tabarch urban water supply
78. Enmo water rural water supply
79. Endao water rural water supply
80. Matamaiyo water rural water supply
81. Njambini ngwataniro water rural
water supply
82. Turaga maruaki water rural water
supply
83. Laigiri water rural water supply
84. Laigiri water rural water supply
85. Turaga water rural water supply
86. Mawingo water society
87. Upper chania water service
providers society
88. Engineer town water project
89. Ndaragwa water project
90. Oljororok kungui rural water supply
91. Kinangop ring main rural water
supply
92. Kirima rural water supply
93. Gatimu rural water supply
94. Olkarau rural water supply
95. Kabaranet urban water supply
96. Mugotio rural water supply
97. Marigat rural water supply
98. Chemolingot rural water supply
99. Timboroa rural water supply
100. Cheberan rural water supply
101. Kabarenjo rural water supply
102. Kepkong rural water supply
103. Tenges rural water supply
104. Seretamin rural water supply
105. Pemwai rural water supply
106. Rukawanin rural water
supply
107. Kipkaech rural water supply
108. Ngetmio rural water supply
109. Kaptarakwa rural water
supply
110. Chepkorio rural water supply
111. Kapkoi rural water supply
112. Lemek rural water supply
113. Mulot rural water supply
114. Alkurio rural water supply

66
115. Miriji-roria rural water
supply
116. Lanet rural water supply
117. Solai menengai rural water
supply
![[PPT]PowerPoint Presentation - Home - Northern California · Web viewDemantra : Brief Overview Shankar Saikia Senior Solutions Specialist (EBS Supply Chain Management – High Tech/Semiconductors,](https://static.fdocuments.us/doc/165x107/5aaff8007f8b9a07498e007e/pptpowerpoint-presentation-home-northern-california-viewdemantra-brief.jpg)