Lean Six Sigma, Root Cause Analysis to Enhance Patient ... · PDF fileSalem et al.; JAMPS,...
26
_____________________________________________________________________________________________________ *Corresponding author: E-mail: [email protected]; Journal of Advances in Medical and Pharmaceutical Sciences 12(1): 1-26, 2017; Article no.JAMPS.31541 ISSN: 2394-1111 SCIENCEDOMAIN international www.sciencedomain.org Lean Six Sigma, Root Cause Analysis to Enhance Patient Safety in Healthcare Organizations: A Narrative Review, 2000-2016 Sara O. Salem 1 , Dalal S. Al-Dossari 2 , Ibrahim A. Al-Zaagi 3 and Naseem Akhtar Qureshi 4* 1 Drug Poisoning and Information Center, King Saud Medical City, Ministry of Health, Riyadh, Saudi Arabia. 2 Medication Safety Coordinator, King Saud Medical City, Ministry of Health, Riyadh, Saudi Arabia. 3 Pharmaceutical Care and Medication Safety Unit, King Saud Medical City, Ministry of Health, Riyadh, Saudi Arabia. 4 National Center of Complementary and Alternative Medicine, Ministry of Health, Riyadh, Saudi Arabia. Authors’ contributions This work was carried out in collaboration between all authors. All authors contributed to the design of the study. Authors NAQ, SOS and IAZ wrote the protocol and author NAQ wrote the first draft of the manuscript. Authors NAQ and DSD managed the literature searches and also revised the paper. All authors read and approved the final manuscript. Article Information DOI: 10.9734/JAMPS/2017/31541 Editor(s): (1) Alexander E. Berezin, Department of Internal Medicine, Zaporozhye State Medical University, Ukraine. Reviewers: (1) Ibtissam Sabbah, Lebanese University, Lebanon. (2) Kumud Kumar Kafle, Tribhuvan University, Nepal. (3) Gaurav Sharma, University of Miami, USA. Complete Peer review History: http://www.sciencedomain.org/review-history/17694 Received 11 th January 2017 Accepted 27 th January 2017 Published 2 nd February 2017 ABSTRACT Background: Lean Six Sigma [LSS] and Root Cause Analysis [RCA] are powerful quality business tools that cost-effectively improve efficiency and effectiveness of and client satisfaction in healthcare, academia and other industries. RCA, an iterative process helps in the identification of the root cause of an adverse medical incident and injuries and consequently prevents its Mini-review Article
Transcript of Lean Six Sigma, Root Cause Analysis to Enhance Patient ... · PDF fileSalem et al.; JAMPS,...

_____________________________________________________________________________________________________ *Corresponding author: E-mail: [email protected];
Journal of Advances in Medical and Pharmaceutical Sciences
12(1): 1-26, 2017; Article no.JAMPS.31541 ISSN: 2394-1111
SCIENCEDOMAIN international
www.sciencedomain.org
Lean Six Sigma, Root Cause Analysis to Enhance Patient Safety in Healthcare Organizations: A
Narrative Review, 2000-2016
Sara O. Salem 1, Dalal S. Al-Dossari 2, Ibrahim A. Al-Zaagi 3 and Naseem Akhtar Qureshi 4*
1Drug Poisoning and Information Center, King Saud Medical City, Ministry of Health, Riyadh,
Saudi Arabia. 2Medication Safety Coordinator, King Saud Medical City, Ministry of Health, Riyadh, Saudi Arabia.
3Pharmaceutical Care and Medication Safety Unit, King Saud Medical City, Ministry of Health, Riyadh, Saudi Arabia.
4National Center of Complementary and Alternative Medicine, Ministry of Health, Riyadh, Saudi Arabia.
Authors’ contributions
This work was carried out in collaboration between all authors. All authors contributed to the design of
the study. Authors NAQ, SOS and IAZ wrote the protocol and author NAQ wrote the first draft of the manuscript. Authors NAQ and DSD managed the literature searches and also revised the paper. All
authors read and approved the final manuscript.
Article Information
DOI: 10.9734/JAMPS/2017/31541 Editor(s):
(1) Alexander E. Berezin, Department of Internal Medicine, Zaporozhye State Medical University, Ukraine. Reviewers:
(1) Ibtissam Sabbah, Lebanese University, Lebanon. (2) Kumud Kumar Kafle, Tribhuvan University, Nepal.
(3) Gaurav Sharma, University of Miami, USA. Complete Peer review History: http://www.sciencedomain.org/review-history/17694
Received 11 th January 2017 Accepted 27 th January 2017 Published 2 nd February 2017
ABSTRACT
Background: Lean Six Sigma [LSS] and Root Cause Analysis [RCA] are powerful quality business tools that cost-effectively improve efficiency and effectiveness of and client satisfaction in healthcare, academia and other industries. RCA, an iterative process helps in the identification of the root cause of an adverse medical incident and injuries and consequently prevents its
Mini-review Article

Salem et al.; JAMPS, 12(1): 1-26, 2017; Article no.JAMPS.31541
2
recurrence provided RCA recommendations are properly implemented in the healthcare industry. Objective: This narrative review aims to describe the principles and objectives of LSS and RCA tools with a special focus on their diverse roles in healthcare organizations. Methods: A computer searches of PubMed, OvidSP, and Google Scholar (2000-2016) were made using keywords such as Lean, or Six Sigma or lean six sigma or medication errors (MEs) or adverse drug events or RCA which retrieved thousands of references but only 110 articles were included in this paper. Results: Lean, Six Sigma, LSS, and RCA are powerful quality improvement tools that prevent adverse events, produce better quality services and result in enhancing patient satisfaction and safety. These quality tools also decrease costs, work performance variance, waste and increase customer satisfaction and the work performance of healthcare professionals. Conclusion: The use of the quality improvement tools produce better quality healthcare services with greater efficiency, and good outcome and also prevents adverse drug events linked with significant morbidity, mortality and financial burden on the public health around the world.
Keywords: Lean; six sigma; lean six sigma; root cause analysis tools; medical incidents; medication
errors; adverse drug events; client satisfaction. 1. INTRODUCTION The safe use of medications with efficacy and efficiency and patient safety are the two prioritized objectives of healthcare and academic organizations around the world [1]. To address the two interconnected concerns, some qualitative tools, policies and programs were developed to facilitate the safe management of medications, prevent the adverse drug events including adverse drug reactions and medical incidents and enhance patient safety with better healthcare services and outcome [2,3]. Regardless of types and severity of medical incidents (MEs and near misses) and adverse drug events, they are associated with substantial morbidity and mortality and increasing healthcare costs globally [4,5]. Nonetheless, most adverse drug events including ME are preventable [2,3,5]. Electronic health records, medication prescribing system, ME reporting systems, adverse drug reaction reporting system, pharmacovigilance, RCA and other quality improvement tools including Lean and Lean Six Sigma (LSS) have provided a platform for the reduction of occurrence of medical incidents and adverse events not only in healthcare and academic institutions but also in industrial organizations across the world [2,3,5-8]. Lean and lean six sigma methodologies are also used efficiently to reduce waste, time, and to increase production and customer satisfaction in non-health industries [6,8]. This narrative review will be supported by evidence-based data published in the relevant literature. The significance of this review is that it will disseminate important information about commonly used quality improvement tools among healthcare
professionals and public especially in Saudi Arabia and the Middle East region where the related research is minimal [2,3,9]. Furthermore, the adverse drug events including MEs are reported to be decreasing in the Western world but are rising in the Eastern world and, therefore, this study will familiarize the concerned health professionals to take appropriate, preventive measures to control rising prevalence of events in low- and middle-income countries. This is only possible if the main causes of adverse drug events are recognized and rectified to ensure safe use of medications linked with enhanced patients’ safety, good quality healthcare and better outcomes. Moreover, there is scanty literature on Lean, SS and LSS in Saudi Arabia [10]. The objective of this review is to describe the quality improvement tools including the lean, SS, LSS and root cause analysis that help efficiently to reduce waste, time, worker performance variance, to increase production and customer satisfaction and safety, and in the identification of root cause of adverse events. 2. METHODS 2.1 Search Computer searches were made using keywords such as Lean, Sigma Six, Lean Six Sigma, adverse events, medication error, and root cause analysis. These words were combined with patient safety, quality care, pharmacy care, medication error reporting, computerized physician order entry, adverse events, adverse drug reactions, and outcome. We used PubMed, Google Scholar, and OvidSP search engines and retrieved more than 38,088 articles published

Salem et al.; JAMPS, 12(1): 1-26, 2017; Article no.JAMPS.31541
3
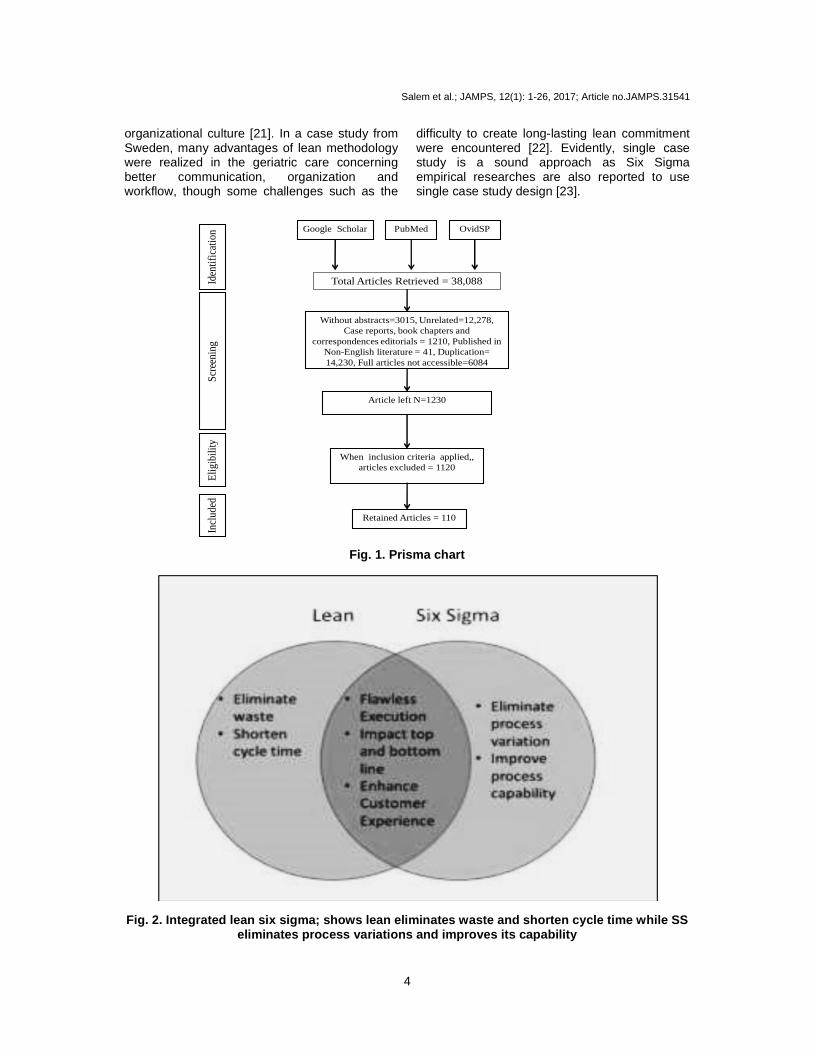
over a period of 17 years, from 2000 to 2016. Two authors [NAQ & DSD] reviewed these articles in light of the following exclusion criteria; duplication (similar articles were found in two or three databases, n=14,230), no abstract available (n=3015), full articles unavailable (n=6084), unrelated articles (when keyword “root cause analysis” was used in searches, articles having “Cause” were retrieved but not related to RCA, n=12278), case reports, unavailable book chapters and correspondences (n= 1210) and published in non-English literature (n=41). The total number of retained article (n=1230) were subjected for intensive review using the following inclusion criteria; articles published in local and international English literature, available abstract or full article or both, articles’ focus on tools of root cause analysis, lean, sigma six, LSS and medication safety, and patient safety in healthcare settings, editorials, systematic reviews, and meta-analysis and randomized clinical trials (RCTs). Furthermore, 1120 articles were excluded due to small case series, English abstracts of important non-English papers not accessible, and papers published before the year 2000. Thus, a total of 110 sources (Fig. 1. Prisma flow chart) were included for supporting the role of Lean, Sigma Six, LSS and RCA in the management of safe use of medication, and identification of root cause of MEs together with their prevention. In addition, the retained sources of information helped in the adaptation and development of policies, procedures, action plan and guidelines for conducting the root cause analysis in healthcare settings. 3. RESULTS 3.1 Lean and Lean Six Sigma Leanis defined as a process strategy that uses less of everything including less human effort, space, investment in tools or information, and reduces the number of steps in the process cycle. Furthermore, it removes waste, time, non-value added processes and complexity. Lean also drives speed and increases capacity and efficiency compared with the traditional process [11]. Lean Six Sigma, the combination of two processes (Lean and Six Sigma) is reportedly a better quality improvement methodology (Fig. 2) compared to standalone lean or six sigma [6] and also helps in good returns on the investment [12]. The two main tasks of lean are eliminate waste and shorten cycle time whereas SS eliminates variations in the process and improves its capability. When they combine, they produce
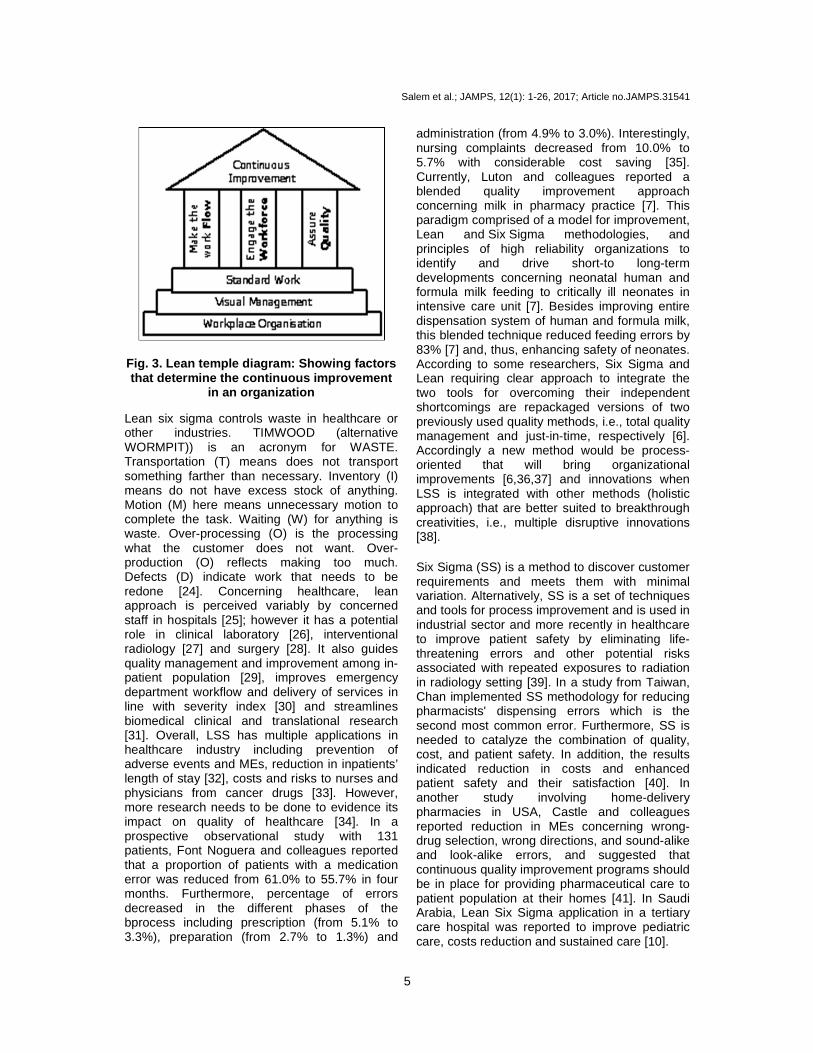
additional tasks including flawless execution of a project, and impact top and bottom line personnel together with enhanced client experience (Fig. 2). Lean temple diagram (Fig. 3) reflects how lean helps organizations to improve continuously their production line by reducing wastage. Lean main principal begins with customer, ends with customer and customer satisfaction which is the prime goal in healthcare. By checking and comparing, lean focuses on eliminating and controlling waste such as over processing, motion, transportation, waiting, inventory overproduction, and defects. Thus, lean is centered on making obvious what adds value by reducing everything else including time and errors [13] with sustained quality and smooth workflow. Notably, continuous improvement in healthcare organization is dependent on multiple factors including workplace organization, visual management, standard work, smooth work flow and better quality and proper engagement of the healthcare professionals (Fig. 3). From healthcare perspective, the hospital is an ideal setting for using the lean methodology that efficiently impacts quality of care delivered to patient population [14], and lean has several applications in health industry [15]. In a simulation study, Setijono and colleagues reported that decision support system (embedded in electronic prescribing system) and lean tend to achieve considerable reduction in a patients' non value added time and total patients' time by assigning three physicians and three surgeons in emergency ward. The combination of physicians and surgeons leads to 13 percent reduction of patients’ non-value-added time while maintaining the total time in system at approximately the same level [16]. Working from the view of client who consumes a product or service, value is any process or action that a customer would be willing to pay for the service [17]. Lean improves functioning of emergency departments (EDs) in terms of decrease in length of patients’ stay, waiting times, and proportion of patients leaving EDs without being seen [18]. Furthermore, lean reduces infection rate and increases efficiency of operation room and trauma care in surgical healthcare settings [19,20]. In a systematic review, Jadhav and colleagues have identified 24 barriers and lean success will not only depend on application of appropriate tools and techniques but also on the active participation of top management and leadership, workers' attitude, resources and the
Salem et al.; JAMPS, 12(1): 1-26, 2017; Article no.JAMPS.31541
4
organizational culture [21]. In a case study from Sweden, many advantages of lean methodology were realized in the geriatric care concerning better communication, organization and workflow, though some challenges such as the
difficulty to create long-lasting lean commitment were encountered [22]. Evidently, single case study is a sound approach as Six Sigma empirical researches are also reported to use single case study design [23].
Retained Articles = 110
When inclusion criteria applied,, articles excluded = 1120
Article left N=1230
Without abstracts=3015, Unrelated=12,278, Case reports, book chapters and
correspondences editorials = 1210, Published in Non-English literature = 41, Duplication= 14,230, Full articles not accessible=6084
Total Articles Retrieved = 38,088
Google Scholar PubMed
Iden
tific
atio
nSc
reen
ing
Elig
ibili
tyIn
clud
ed
OvidSP
Fig. 1. Prisma chart
Fig. 2. Integrated lean six sigma; shows lean elimi nates waste and shorten cycle time while SS eliminates process variations and improves its capa bility
Salem et al.; JAMPS, 12(1): 1-26, 2017; Article no.JAMPS.31541
5
Fig. 3. Lean temple diagram: Showing factors that determine the continuous improvement
in an organization
Lean six sigma controls waste in healthcare or other industries. TIMWOOD (alternative WORMPIT)) is an acronym for WASTE. Transportation (T) means does not transport something farther than necessary. Inventory (I) means do not have excess stock of anything. Motion (M) here means unnecessary motion to complete the task. Waiting (W) for anything is waste. Over-processing (O) is the processing what the customer does not want. Over-production (O) reflects making too much. Defects (D) indicate work that needs to be redone [24]. Concerning healthcare, lean approach is perceived variably by concerned staff in hospitals [25]; however it has a potential role in clinical laboratory [26], interventional radiology [27] and surgery [28]. It also guides quality management and improvement among in-patient population [29], improves emergency department workflow and delivery of services in line with severity index [30] and streamlines biomedical clinical and translational research [31]. Overall, LSS has multiple applications in healthcare industry including prevention of adverse events and MEs, reduction in inpatients’ length of stay [32], costs and risks to nurses and physicians from cancer drugs [33]. However, more research needs to be done to evidence its impact on quality of healthcare [34]. In a prospective observational study with 131 patients, Font Noguera and colleagues reported that a proportion of patients with a medication error was reduced from 61.0% to 55.7% in four months. Furthermore, percentage of errors decreased in the different phases of the bprocess including prescription (from 5.1% to 3.3%), preparation (from 2.7% to 1.3%) and
administration (from 4.9% to 3.0%). Interestingly, nursing complaints decreased from 10.0% to 5.7% with considerable cost saving [35]. Currently, Luton and colleagues reported a blended quality improvement approach concerning milk in pharmacy practice [7]. This paradigm comprised of a model for improvement, Lean and Six Sigma methodologies, and principles of high reliability organizations to identify and drive short-to long-term developments concerning neonatal human and formula milk feeding to critically ill neonates in intensive care unit [7]. Besides improving entire dispensation system of human and formula milk, this blended technique reduced feeding errors by 83% [7] and, thus, enhancing safety of neonates. According to some researchers, Six Sigma and Lean requiring clear approach to integrate the two tools for overcoming their independent shortcomings are repackaged versions of two previously used quality methods, i.e., total quality management and just-in-time, respectively [6]. Accordingly a new method would be process-oriented that will bring organizational improvements [6,36,37] and innovations when LSS is integrated with other methods (holistic approach) that are better suited to breakthrough creativities, i.e., multiple disruptive innovations [38]. Six Sigma (SS) is a method to discover customer requirements and meets them with minimal variation. Alternatively, SS is a set of techniques and tools for process improvement and is used in industrial sector and more recently in healthcare to improve patient safety by eliminating life-threatening errors and other potential risks associated with repeated exposures to radiation in radiology setting [39]. In a study from Taiwan, Chan implemented SS methodology for reducing pharmacists' dispensing errors which is the second most common error. Furthermore, SS is needed to catalyze the combination of quality, cost, and patient safety. In addition, the results indicated reduction in costs and enhanced patient safety and their satisfaction [40]. In another study involving home-delivery pharmacies in USA, Castle and colleagues reported reduction in MEs concerning wrong-drug selection, wrong directions, and sound-alike and look-alike errors, and suggested that continuous quality improvement programs should be in place for providing pharmaceutical care to patient population at their homes [41]. In Saudi Arabia, Lean Six Sigma application in a tertiary care hospital was reported to improve pediatric care, costs reduction and sustained care [10].

Salem et al.; JAMPS, 12(1): 1-26, 2017; Article no.JAMPS.31541
6
Notably, in several studies SS derived control charts demonstrated evidence of sustained process improvement and actual reduction in specific ME elements [42,43]. In addition, SS seeks to improve the quality of the output of a process by identifying and removing the causes of defects or errors and minimizing variability in manufacturing and business processes, and by extension in healthcare where a defect could reflect the difference between life and death. SS uses a set of quality management methods including empirical and statistical, and creates infrastructure of expert people within the organization. Overall, SS has a variety of interventions and applications in healthcare with effective outcome [42,43,44]. Like lean process, each Six Sigma project carried out within an organization follows a defined sequence of steps and both have specific objectives and value targets including costs reduction and enhancement of customer satisfaction and safety (Fig. 4). LSS organization structure has four belts including yellow belt responsible for lean six sigma awareness, green belt focuses on tools usage, DMAIC (definition, measurement, analysis, improvement and control) and lean principle application, black
belt signifies full time project leader and master black belt (MBB) means black belt trained with at least two years experience and teaches lean six sigma (Fig. 5). SS utilizes more than 18 established quality-management tools including 5 Whys, Fishbone diagram, Run Charts, Pareto chart, RCA, and SIPOC analysis (suppliers, inputs, process, outputs, and customers) [42]. The underlying concept of SS is Y = f(x1,x2,…) introduced to drive focus on improving critical process inputs rather than just outputs items of reports, services, deliveries, and sales, and determination of critical X’s [Y=f(x)] for finding out the output responses (Y). Critical X’s inputs (factors) include: operating and training budgets, system requirement, and number of people, operating hours, functional require ments, and customer interface and skills selection. These factors input into process (Info Systems Release) to know outputs responses (Y) related mainly to delivery time. LSS methodologies have diverse applications in healthcare and have five stages in terms of (Recognize) definition, measurement, analysis, improvement (design) and control (verify) [RDMAIC, DMAIC and DMADV/DFSS (design for Six Sigma)] and most commonly
Fig. 4. SS and lean individual and sharing objectiv es

Salem et al.; JAMPS, 12(1): 1-26, 2017; Article no.JAMPS.31541
7
focused on improving an existing process [44,45]. SS meets failure in case there is lack of benefit quantification and management buy-in, no tangible results, lack of resources, seems too complicated and weak coaching and skills of human resources [44,45]. In a study to enhance patient safety outcomes, continuous quality improvement (CQI) and lean management initiatives (LMI) were significant in intervening hospital error sources. Six sigma initiatives (SSI) were not significant after accounting for the other two process improvement (PI) types. CQI and SSI were significant concerning organizational effectiveness improvement whereas LMI was not significant compared with other two PI types. Notably, SSI was significant for superior sustainable competitive advantage [46]. Overall, integrating all three PI tools will significantly impact medical errors. More studies are needed as there are significant gaps in the LSS healthcare quality improvement data and also to strengthen evidence that LSS improve health care quality [47] and safety. 3.2 Approaches and Principles of Lean
Six Sigma The approaches and principles of Lean Six Sigma help in the process improvement [Table 1]. Lean Six Sigma is the integration of two
powerful business improvement approaches in production organizations as well as in health industry [48]. Lean focuses on fast speed of finishing work and elimination of waste. Meaning thereby, it reduces waste and increases process speed in manufacturing industry and healthcare settings. Its focus is on implementation of waste reduction tools. Lean uses methods of improving events value stream mapping. Overall, Lean speed enables six sigma quality by faster cycles of experimentation or learning, thus it increases efficiency and leadership role changes [49]. On the other hand, SS improves quality and cost. The goal of SS is to improve performance on items critical to customer quality (CTQs), and focus on to use DMAIC with total quality management (TQM) tools to eliminate variation and its methods include management engagement, infrastructure, and dedicated team effort [50]. The quality of SS enables Lean Speed in the form of fewer defects which means less time spent on rework. Thus, SS is closely linked with effectiveness and, in turn both efficiency and effectiveness as shown in healthcare setting [51]. Cycling operates simultaneously, and success is dependent upon the value of other inherent variables (data and data analysis and cause validation) in the function concerning the process and the quantifiable results are not readily apparent because the problem in using the SS
Table 1. Lean six sigma approaches and key principl e
Approaches Concept Remark Lean A culture using tools aimed at minimizing waste and creating more value
while doing less work Six sigma A data-driven approach to error reduction by improving processes and
reducing process variability Key principles of lean six sigma Focus on customer- Patients as well as physicians (may include caregivers) Identify and understand how work is get done in hospital settings (the value chain) Manage, improve and make workflow more efficient Remove non-value-added steps and waste Manage the hospital data to reduce workflow variations Empower the people in the process (by involving and equipping them) Systematically undertake improvements in all activities Differentiation between lean and six sigma Lean Six Sigma Requires a long term vision Requires only a short term vision Culture based Project based Requires input from all within the organization Requires input from very few Needs fact Needs data Is a system Is a tool Requires behaviors that demonstrate respect Demonstrate a lack of respect Accountability and engagement by all Hierarchical belt system Aims for flat organization structures Builds in levels of distinction

Salem et al.; JAMPS, 12(1): 1-26, 2017; Article no.JAMPS.31541
8
Fig. 5. Lean SS organization structure with four be lts: Yellow, green, black, and master black Improvement Cycle is the length of time required which is three to six months to realize any benefits. Unlike SS improvement cycle (Fig. 6a) of DMAIC, the cycle of LSS represented by Deming's Plan-Do-Check-Act Cycle (Fig. 6b, PDCA) is specifically associated with typical quality measures and continuous improvements. It differs from Plan-Do-Check-Act Cycle of value addition in which the difference between output and input prices and the critical roles of all functions in the process of value addition are evaluated and visualized [52]. More details of PDCA are available here [52,53]. However, PDCA briefly refers to a continuous and ongoing effort to achieve measurable improvements in the efficiency, effectiveness, performance, accountability, outcomes, and other indicators of quality in services or processes which achieve equity and improve the health of the community. Notably, this definition is approved by Accreditation Coalition [53]. Other fundamental principles of lean approach (Table 1) are equal involvement of and equal respect for all staff members, standardization of work processes with improvement of flow, use of visual cues to communicate and inform, and use of specific tools to perform targeted data collection and analysis for the implementation
and guide change [54,55]. Lean tools described in the literature facilitate a number of tasks including value stream mapping for visualizing the current state of a process and identifying activities that add no value. The RCA determines the fundamental cause of a problem or errors and team charters plan guide, and communicate about change in a specific process. Furthermore, the management dashboards monitor real-time developments and a balanced scorecard oversights strategic planning in the areas of finance, customer service, internal operations, and staff development [55,56]. Lean thinking and six sigma methodologies face some implementation challenges. The solutions include multidisciplinary team approach, involvement of all stakeholders, and the willingness of team members to change daily practice and to adapt new and innovative ways to deliver healthcare [57]. In another study of mid-sized hospitals, Esimai used lean six sigma strategies to change policy and practices as a solution for preventing MEs. Following implementation of solutions, there was a reduction in MEs, labor costs fell and patients were more satisfied and overall employees morale was high [58]. Using similar approach in a corporate hospital in India, Miglani reported a decrease in MEs, the complexity of the work flow simplified and systematized,

Salem et al.; JAMPS, 12(1): 1-26, 2017; Article no.JAMPS.31541
9
nurses’ work load was decreased, and the average time for drug administration was decreased by 55%. Thus LSS reduced MEs and
simplified the work of nurses in ward and delivered patient care with high quality and efficiency [59].
Fig. 6a. SS improvement cycle
Plan
DoCheck
Act
Evaluate resultsWhat did we learn?
Implement changes in small scale pilot
Determine the problems with the current condition, What is the primary
goal? What changes are necessaryWhat data is available? Are more
observations needed?Apply the knowledge gained to new process,
Standardize and stabilize the change
Deming’s
Continuous Cycle
Fig. 6b. Adapted deming’s plan-do-check-act cycle [ 26]

Salem et al.; JAMPS, 12(1): 1-26, 2017; Article no.JAMPS.31541
10
As mentioned earlier, Like DMADV, DMAIC is a problem solving methodology that helps in the prevention of MEs [60-64]. DMAIC has 5 steps, and D- defines the opportunity from both business and customer perspectives. Measure - means to understand the process and its performance. Analyze - is for searching the key factors (critical X’s) that have the biggest impact on process performance and determine the root causes. Improve - [Design related to DMADV] reflects to develop improvement solutions for the critical X’s. Lastly, Control-[Verify related to DMADV] signifies to implement the solutions and control plan (for related questions see Table-2) [44,45]. Six Sigma uses these two methodologies (DMAIC and DMADV) for projects aimed at improving an existing business process rather than developing new process and projects aimed at creating new product or process designs, respectively [44,45,62,64]. According to some studies on lean methodology, client (patients) value-added is used to describe any activity such as easy access to healthcare service that
contributes directly to satisfying the needs of the client, and non-value-added refers to any activity such as waiting in long queue that takes time, space or resources but does not contribute directly to satisfying client needs. Furthermore, new strategies such as successful engagement of staff and central focus on accessing services should strike a balance between value added and feeling valued [65]. In a study from Saudi Arabia, Almorsy and Khalifa analyzed the data derived from the Six Sigma DMAIC approach used to reduce over utilization of resources in healthcare. There was a decrease in the unnecessary quality control (QC) runs from 13% to 4%, a reduction in the failed QC runs from 14% to 7%, and a drop of the QC to patient testing ratio from 24/76 to 19/81 [66]. Thus, healthcare costs could be reduced if resources are used efficiently using six sigma DMAIC approaches and principles. More details of six sigma DMAIC tools, their roles, and as critical success factors are given here [67].
Table 2. Value add – From the customer perspective
Customer value add (CVA) questions
Business value add (BVA) questions
Non-value add (NVA)questions
Does the task add form, feature, or function to the process or service?
Does this task reduce owner financial risk?
If the customer knew we were doing this, would they request that we eliminate the activity so we could lower our prices?
Does the task enable a competitive advantage (reduced price, faster delivery, fewer defects)?
Does this task support financial reporting requirements?
Does the task fit into either of the other two categories?
Would the customer be willing to pay extra or prefer us over the competition if he or she knew we were doing this task?
Would the process of producing/selling the service break down if this task were removed?
Can I eliminate or reduce this activity?
Example CVA Activities: Improved Safety, Shorter Deliver Times, Fewer Errors and Accurate Reporting
Is this task required by law or regulation?
Typical NVA Activities: Over Inspecting, Transporting/Moving, Stocking/Storing, Rework Loops, Multiple Signoffs, and Document Handling
Overall solution– Optimization Typical BVA Activities: Reconciliations, Internal Audits Invoice Processing, IRS/OSHA/EPA Reporting, and Internal Financial Reporting
Overall result - elimination
Overall, action– minimization
IRS=Internal Revenue Service,OSHA= Occupational Safety and Health Administration,EPA=Environmental Protection Agency

Salem et al.; JAMPS, 12(1): 1-26, 2017; Article no.JAMPS.31541
11
3.3 Audit Audit is a function of a finding for example medication errors that allows stakeholders to fully understand what occurred, how significant the occurrence was, and how the personnel may be able to effectively protect against its reoccurrence in a blame free culture [68,69]. According to some researchers, audits in real time ensure safety of patients in critical care. Audits are a useful tool for modifying clinical practice in line with provided guidelines, care processes, actions and minimizing errors in critical settings with high care load and acute diseases with severe degree [70,71]. Besides failure mode and effects analysis (FMEA), RCA and other quality improvement tools such as LSS, random safety auditing with feedback is an important tool for system analysis and redesign focused on providing safe delivery of care not only in the complex neonatal intensive care unit system [72] but also other health care settings including infection control units and outpatient clinics with better outcomes [73,74]. More details of audit process in healthcare industry including end-of-life care are available here [75-78]. 3.4 Root Cause Analysis Root cause analysis is one of the elements of effective auditing and risk management strategies [79]. While conducting RCA [9], four questions need to be answered including what should be the criteria, what condition does exist, what effect related to the impact of the
difference, why the difference exist to know the cause, and what is a possible remedy (ies) should be included in the list of recommendations. RCA has several critical steps [Fig. 7] and is a process for identifying the most basic factor(s) underlying a variation in performance, such as detection and reporting of adverse drug reactions and events including medication errors by health professionals. Most importantly, RCT focus needs to be on systems and processes but not on individual healthcare workers [80-82]. In other words, RCA is a process of determining the causes of active and latent errors that led to a nonconformance, adverse event or undesirable condition [83]. RCT identifies corrective actions to prevent recurrence of events which, when solved restores the status quo or establishes a desired effect [83]. The Joint Commission Root Cause Analysis and Action Plan tool has 24 analysis questions that facilitate RCA in finding the main cause of the problem [84]. Furthermore, root cause analysis is a retrospective, structured method and involves thorough review of the problem in order to identify and verify the underlying prime cause of medication errors or symptoms and adverse drug events [83-85]. Thus, identified root causes are controlled by risk management team by specifying workable corrective measures, and allow for the generation of charts, recommendations and their implementation in healthcare industry. RCA is carried out in case of significant or consequential events, occurrence of repetitive human errors and system failures during a specific process, and low performance
1.Define the problem
2.Gather the evidence
3.Identify the causes
4. find the root causes
5.Identify the potential solutions
6. Implement the solutions
7. Assess the impact
Fig. 7. The adapted seven critical steps of RCA [81 ]

Salem et al.; JAMPS, 12(1): 1-26, 2017; Article no.JAMPS.31541
12
of workers contrary to desired quality standards. In addition, RCA prevents problems from recurring, reduces injury to healthcare personnel, increases competitiveness and efficiency, promotes patient safety and outcome, improves communication about patient care, team work and stability of profession, and reduces cost [86]. Moreover, a thorough understanding of RCA is a key component in promoting safety within the healthcare, and risk reduction strategies used by healthcare professionals make RCA meaningful and efficient that impact safety of healthcare system [87]. Furthermore, several RCA-related tools useful in healthcare industry are identified and those are; 1) "five whys" approach, 2) cause-and-effect diagrams (Ishikawa), 3) causal tree mapping, 4) affinity diagrams, 5) interrelationship diagram, and 6) Pareto charts and 7) other tools [80,82] which are briefly described in subsequent sections. 3.5 RCA- Root Cause Factor Root cause is a harmful factor that results in the production of problem or adverse outcome in business organizations including health industry. Root cause is usually used to describe the depth in the causal chain where an intervention could be implemented to improve performance or prevent an undesirable outcome or event [88]. These adverse events may include medicinal incidents (i.e., MEs or close calls), injuries and adverse drug reactions. Causes or causal factors determine a condition or event that results in an effect reflecting cause-effect relationship (i.e., temporal) [89].In RCA process, investigating team members should always see beyond obvious because the initial response surprisingly is usually the symptom, not the root cause of the problem [90].To fix the problem, causal factor must be clearly defined using evidence-based RCA toolbox and corrected by implementing recommended solutions. Doggett [88] compared 3 such tools, i.e., the cause-and-effect diagram, the interrelationship diagram, and the current reality tree to find out the differences but could not find the best tool for finding the underlying cause of the problem. Notably, most times root cause turns out to be much more in terms of process or program failure, system or organization failure, poorly written work instructions, and lack of training of healthcare professionals [91,92]. Furthermore, Vincent [92] criticized RCA based on its notion of single root cause and instead used the term system analysis.
3.6 Root Cause Analysis - Tools There are many quality improvement tools for determining the root cause of adverse drug events including adverse drug reactions and medication errors. These tools are; 1) the “5 Whys” relates to 5 questions that need to be asked while doing RCA [Fig. 8], 2) data collection and prioritization-Pareto statistical analysis identifies vital few (20%), and trivial many (80%), and the focus is mainly only critical few causes [Fig. 9], 3) brainstorming that allows team members to openly discuss comprehensively the cause and effect dimension, 4) flow charts or process mapping, 5) cause and effect diagram, 6) causal tree diagram, 7) affinity diagrams, 8) scattered diagrams, 9) event and causal factor analysis, 10) failure mode and effects analysis (FMEA), 11) change analysis, 12) barrier Analysis, and 13) management oversight and risk tree (MORT) analysis [93-95]. After root cause is found, benchmarking which is the process of identifying, understanding, and adapting outstanding practices and processes for improving the performance of healthcare organization including reduction in adverse events is followed by recommendation generation and their implementation [80,88,96, 97]. Finally, the effectiveness of RCA is based on anecdotal evidence, a limitation and, hence, researchers called for more sophisticated studies to demonstrate that it overall improves patient safety and saves costs in healthcare industry [98]. It is wise to know that all aforesaid tools are not required in root cause analysis for finding a causal factor (s). Furthermore, more details how RCA is conducted in hospital setting are available here [9]. 3.6.1 RCA- the 5 whys The “5 Whys” is an iterative question-asking technique (Fig. 8). Its primary goal is to explore the cause-and-effect relationships underlying a serious problem. The serious events (and serious medicinal errors) are seen not only in manufacturing industry but also in healthcare organizations worldwide. The "5" in the name derives from an empirical observation on the number of iterations typically required to resolve the problem, which needs to be considered from three perspectives, i.e., physical, detection and systemic (Fig. 10). However, RCA team may ask more than 5 questions to systematically organize and analyze data. The “5 Whys” help identify the root cause (s) of a problem, and determine a

Salem et al.; JAMPS, 12(1): 1-26, 2017; Article no.JAMPS.31541
13
relationship between different root causes of a problem. This process is simple and easy to complete without personal opinion and statistical analysis. It is relatively more effective when problems involve human factors or interactions. Moreover, implementation of corrective steps mostly stops recurrence of the same problem in future [93,99]. In addition to other quality management tools including flowchart, nominal group, matrix decision, decision table, the cause-effect diagram depicts visual display of possible causes, real causes and guesses, and cause categories which include materials, machines,
methods, and people, and reveals gaps in existing knowledge and systems [9,95]. After cause-effect diagram (Fig. 11), RCA multidisciplinary team members identify likely candidates for root cause(s) by one of the actions. They look for causes that appear repeatedly within or across major cause or process categories. Members focus changes or other sources of variation in the process or environment. Team members use consensus decision-making to select a cause (s) and collect data to confirm a potential root cause as real and finally recommend risk reduction strategies for preventing error recurrence [95]. Problem ranking is an objective way to rank
Fig. 8. The"5" whys
Fig. 9. Pareto charts 1(vital few) and 2-6 (trivial many)

Salem et al.; JAMPS, 12(1): 1-26, 2017; Article no.JAMPS.31541
14
problems or root causes rather than simply picking the favorite option (Fig. 12). Statistical process controls variations related to common cause and special cause. Process
needs to be stable, and if not, points outside lower control limit/upper control limit that warrant investigation and alert for problems (Fig. 13).
Fig. 10. "5 whys"
Fig. 11. Cause and effect (Fishbone)

3.6.2 RCA- decision table and
diagrams test The Decision Table considers the severity levels of events and reflects whether the event was potentially life threatening or involved a serious injury. Furthermore, decision table also looks for its (event) potential for minimal hartemporary injury, or no realistic potential for harm. The table also considers the probability of recurrence and the detectability of the event. Scatter diagrams test for possible cause and effect relationships with some variation.
Salem et al.; JAMPS, 12(1): 1-26, 2017; Article no.JAMPS.31541
15
Fig. 12. Problem ranking
Fig. 13. Control chart
decision table and scatter
The Decision Table considers the severity levels of events and reflects whether the event was potentially life threatening or involved a serious injury. Furthermore, decision table also looks for its (event) potential for minimal harm or temporary injury, or no realistic potential for harm. The table also considers the probability of recurrence and the detectability of the event. Scatter diagrams test for possible cause and effect relationships with some variation.
Relationships being tested must be logical and visually depicted (Fig. 14) [82]. 3.6.3 RCA-tree diagram Tree diagram (Fig. 15) states the problem and causes are listed as branches to the right of the problem with continuation to clarify causes, drawing additional branches to the right and repetition is continued until each branch reaches its logical end. In causal tree, the worst thing that happened or almost happened is placed at the top [82].
; Article no.JAMPS.31541
tested must be logical and
Tree diagram (Fig. 15) states the problem and causes are listed as branches to the right of the problem with continuation to clarify causes,
to the right and repetition is continued until each branch reaches its logical end. In causal tree, the worst thing that happened or almost happened is placed at the

3.6.4 RCA- Event and causal factor analysis Event and causal factor analysis is used for multi-faceted problems or long, complex causal factor chains and cause effect diagram usually describes time sequence (Fig. 16). Furthermore, anything that shapes the outcome is recorded. It identifies what questions to ask to follow path to root cause. The results are displayed in an events and causal factor chart that gives a picture of the relationships of the events and causal factors.
Salem et al.; JAMPS, 12(1): 1-26, 2017; Article no.JAMPS.31541
16
Fig. 14. Scattered plot
Fig. 15. RCA – Tree diagram
Event and causal factor analysis
Event and causal factor analysis is used faceted problems or long, complex
causal factor chains and cause effect diagram usually describes time sequence
. Furthermore, anything that shapes the outcome is recorded. It identifies what questions to ask to follow path to root cause. The results are displayed in an events and causal factor chart that gives a picture of the relationships of the events and causal
3.6.5 RCA- and change analysis Change analysis is used when problem is obscure and generally used for single occurrence. It focuses on things that have changed and compares trouble-free process with occurrence to identify differences, and the latter are evaluated for contribution to occurrence. Change analysis steps include answer to the following questions that is what causes change or event, when did happen, where did it occur, how it occurred and who contributed to the occurrence of the event.
; Article no.JAMPS.31541
and change analysis
Change analysis is used when problem is obscure and generally used for single
focuses on things that have free process with
occurrence to identify differences, and the latter are evaluated for contribution to occurrence. Change analysis steps include answer to the following questions that is what causes the change or event, when did happen, where did it occur, how it occurred and who contributed to the
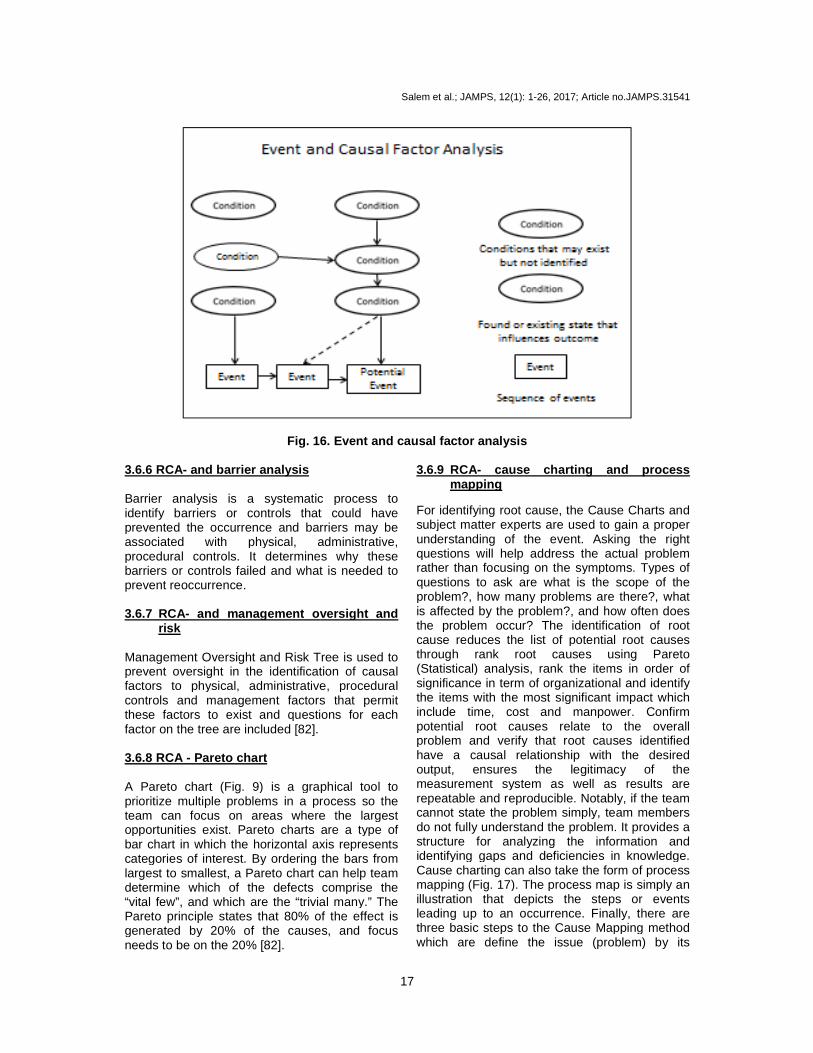
Fig. 16 3.6.6 RCA- and barrier analysis Barrier analysis is a systematic process to identify barriers or controls that could have prevented the occurrence and barriers may be associated with physical, administrative, procedural controls. It determines why these barriers or controls failed and what is needed to prevent reoccurrence. 3.6.7 RCA- and management oversight
risk Management Oversight and Risk Tree is used to prevent oversight in the identification of causal factors to physical, administrative, procedural controls and management factors that permit these factors to exist and questions for each factor on the tree are included [82]. 3.6.8 RCA - Pareto chart A Pareto chart (Fig. 9) is a graphical tool to prioritize multiple problems in a process so the team can focus on areas where the largest opportunities exist. Pareto charts are a type of bar chart in which the horizontal axis represents categories of interest. By ordering the blargest to smallest, a Pareto chart can help team determine which of the defects comprise the “vital few”, and which are the “trivial many.” The Pareto principle states that 80% of the effect is generated by 20% of the causes, and focus needs to be on the 20% [82].
Salem et al.; JAMPS, 12(1): 1-26, 2017; Article no.JAMPS.31541
17
6. Event and causal factor analysis
Barrier analysis is a systematic process to identify barriers or controls that could have prevented the occurrence and barriers may be associated with physical, administrative, procedural controls. It determines why these
at is needed to
management oversight and
Management Oversight and Risk Tree is used to prevent oversight in the identification of causal factors to physical, administrative, procedural
factors that permit these factors to exist and questions for each
) is a graphical tool to prioritize multiple problems in a process so the team can focus on areas where the largest opportunities exist. Pareto charts are a type of bar chart in which the horizontal axis represents categories of interest. By ordering the bars from largest to smallest, a Pareto chart can help team determine which of the defects comprise the “vital few”, and which are the “trivial many.” The Pareto principle states that 80% of the effect is generated by 20% of the causes, and focus
3.6.9 RCA- cause charting and mapping
For identifying root cause, the Cause Charts and subject matter experts are used to gain a proper understanding of the event. Asking the right questions will help address the actual problem rather than focusing on the symptoms. Types of questions to ask are what is the scope of the problem?, how many problems are there?, what is affected by the problem?, and how often does the problem occur? The identification of root cause reduces the list of potential root causes through rank root causes using Pareto (Statistical) analysis, rank the items in order of significance in term of organizational and identify the items with the most significant impact which include time, cost and manpower. Confirm potential root causes relate to the overall problem and verify that root causes identified have a causal relationship with the desired output, ensures the legitimacy of the measurement system as well as results are repeatable and reproducible. Notably, if tcannot state the problem simply, team members do not fully understand the problem. It provides a structure for analyzing the information and identifying gaps and deficiencies in knowledge. Cause charting can also take the form of process mapping (Fig. 17). The process map is simply an illustration that depicts the steps or events leading up to an occurrence. Finally, there are three basic steps to the Cause Mapping method which are define the issue (problem) by its
; Article no.JAMPS.31541
and process
For identifying root cause, the Cause Charts and subject matter experts are used to gain a proper understanding of the event. Asking the right questions will help address the actual problem rather than focusing on the symptoms. Types of questions to ask are what is the scope of the problem?, how many problems are there?, what is affected by the problem?, and how often does the problem occur? The identification of root
f potential root causes through rank root causes using Pareto (Statistical) analysis, rank the items in order of significance in term of organizational and identify the items with the most significant impact which include time, cost and manpower. Confirm
otential root causes relate to the overall problem and verify that root causes identified have a causal relationship with the desired output, ensures the legitimacy of the measurement system as well as results are repeatable and reproducible. Notably, if the team cannot state the problem simply, team members do not fully understand the problem. It provides a structure for analyzing the information and identifying gaps and deficiencies in knowledge. Cause charting can also take the form of process
). The process map is simply an illustration that depicts the steps or events leading up to an occurrence. Finally, there are three basic steps to the Cause Mapping method which are define the issue (problem) by its

impact to overall goals, analyze the causes by asking why did it happen in a visual map and prevent any negative impact on the goals by selecting the most effective solutions. 3.6.10 RCA-cause and effect diagram
(Fishbone diagram) It is a tool to represent the relationship between an effect (problem) and its potential causes by category type and is carried out when a root cause needs to be determined. It helps ensure that a balanced list of ideas have been generated during brainstorming. Cause and effect diagram (Fig. 11) determines the real cause of the
Step -1-goal-what is the
problem?
Step-2- Analyze causes- why did it
happen
Salem et al.; JAMPS, 12(1): 1-26, 2017; Article no.JAMPS.31541
18
the causes by asking why did it happen in a visual map and prevent any negative impact on the goals by selecting the most effective solutions.
cause and effect diagram
It is a tool to represent the relationship between fect (problem) and its potential causes by
category type and is carried out when a root cause needs to be determined. It helps ensure that a balanced list of ideas have been generated during brainstorming. Cause and effect diagram
real cause of the
problem versus a symptom and refines brain stormed ideas into more detailed causes. Cautionary note about cause and effect analysis is that it cannot get past existing knowledge must have either observed (or considered) that the cause produced the effect in the past (retrospectively). More details of RCA toolbox including RCA cycle (Fig. 18) and webtools including versions of BARCA based on the tenets of RCA for analyzing medical incidents are available here [82,100,101]. From etperspective, BARCA does not disclose the identity of medical incident report analyzer and relatively better technique as compared to other web-based tools.
Fig. 17. Cause mapping
Fig. 18. RCA cycle
-Define the what is the
problem?
Analyze why did it
happen
Step-3-Prevent -solutions - what will be
done?
; Article no.JAMPS.31541
problem versus a symptom and refines brain stormed ideas into more detailed causes. Cautionary note about cause and effect analysis is that it cannot get past existing knowledge - must have either observed (or considered) that
roduced the effect in the past (retrospectively). More details of RCA toolbox including RCA cycle (Fig. 18) and web-based tools including versions of BARCA based on the tenets of RCA for analyzing medical incidents are available here [82,100,101]. From ethical perspective, BARCA does not disclose the identity of medical incident report analyzer and relatively better technique as compared to other

3.6.11 RCA -additional tools Some additional RCA tools include fault tree analysis, current reality tree, Kepnertechnique or rational process with four phases including situation, problem, solution and potential problem analysis and rapid problem resolution [101,102,103,104], and all techniques including lean, lean sigma, SS and LSS help in finding the root cause of adverse events. 3.6.12 RCA-data collection Data collection is must as it provides information and an understanding of causal factorsdata collection techniques involve data types whether it is attribute or discrete and good or bad in terms of counts or percentages. The data should be collected in a planned way. For example about the event when it occurred and who reported it to incident reporting system. Furthermore, how the medical incident happened and how it is reported together with its stratification. In addition, recording sheets should be checked for consistency of data collection, and measurement system analysis ensures thdata collection process is repeatable and reproducible [103,105]. 3.6.13 RCA-addressing root cause (s)
added analysis It is advisable to conduct value add analysis (Fig. 19), a process in which a good or poor service is uncovered to its essential attributes or benefits. Those that contribute to the customer appeal are enhanced, and the others are reduced or eliminated. The investigating team must ensure that items identified will add value to
Salem et al.; JAMPS, 12(1): 1-26, 2017; Article no.JAMPS.31541
19
Some additional RCA tools include fault tree analysis, current reality tree, Kepner-Tregoe technique or rational process with four phases including situation, problem, solution and potential problem analysis and rapid problem resolution [101,102,103,104], and all techniques including lean, lean sigma, SS and LSS help in finding the root cause of adverse events.
Data collection is must as it provides information and an understanding of causal factors. Good data collection techniques involve data types whether it is attribute or discrete and good or bad in terms of counts or percentages. The data should be collected in a planned way. For example about the event when it occurred and
ncident reporting system. Furthermore, how the medical incident happened and how it is reported together with its stratification. In addition, recording sheets should be checked for consistency of data collection, and measurement system analysis ensures the data collection process is repeatable and
root cause (s) -value
It is advisable to conduct value add analysis ), a process in which a good or poor
service is uncovered to its essential attributes or benefits. Those that contribute to the customer appeal are enhanced, and the others are reduced or eliminated. The investigating team
will add value to
the organization or customers as well as the items are required by regulation or policy makers. Overall, the team members confirm that the item does not add value and is not needed or required. 3.6.14 RCA-common errors of root cause Notably the investigating team members look for a single cause but often 2 or 3 contribute and may be interacting. The team often ends at a symptomatic cause. Furthermore, a common error is thus assigning symptomatic cause as the cause of the problem. This is but the “why” event that preceded the real cause. Successful application of the analysis and determination of the root cause should result in elimination of the problem and all stakeholders, i.e., patient, physician, nurse, pharmacist, administrator and team members should be satisfied. Concerning this, regular effective collaboration among various committees including Medication Safety Committee, Pharmacy and Therapeutic Committee and Patient Safety Committee is mandatory for performing a number of medication safe management tasks, developing annual action plan, conducting root cause analysis, and recommendation implementation [2,5,6,7,9]. Although RCA is a promising incident investigation technique, it has multiple problems including its name implying a singular, linear causal factor, questionable quality of many RCAs, their tendency to produce poor risk controls, investigating team not comprising of experts, and poorly functioning feedback reports. Lessons learned from RCAs and their effectiveness needs to be disseminated within and across healthcare organizations [106].
Fig. 19. Value add analysis
; Article no.JAMPS.31541
the organization or customers as well as the items are required by regulation or policy makers. Overall, the team members confirm that the item does not add value and is not needed or
common errors of root cause
tably the investigating team members look for a single cause but often 2 or 3 contribute and may be interacting. The team often ends at a symptomatic cause. Furthermore, a common error is thus assigning symptomatic cause as the
s but the “why” event that preceded the real cause. Successful application of the analysis and determination of the root cause should result in elimination of the problem and all stakeholders, i.e., patient, physician, nurse, pharmacist, administrator and team members should be satisfied. Concerning this, regular effective collaboration among various committees including Medication Safety Committee, Pharmacy and Therapeutic Committee and Patient Safety Committee is mandatory for performing a number of
ation safe management tasks, developing annual action plan, conducting root cause analysis, and recommendation implementation [2,5,6,7,9]. Although RCA is a promising incident investigation technique, it has multiple problems
singular, linear causal factor, questionable quality of many RCAs, their tendency to produce poor risk controls, investigating team not comprising of experts, and poorly functioning feedback reports. Lessons learned from RCAs and their
to be disseminated within and across healthcare organizations [106].

Salem et al.; JAMPS, 12(1): 1-26, 2017; Article no.JAMPS.31541
20
3.6.15 RCA-recommendation implementation The team members should consider important things prior to implementation. First determine the impact the root causes will have on critical inputs (X) and estimate impact of the root cause on over-all output (Y).Second, from the perspective of management, implement recommendations based on significance to organizational goals and objectives, availability of personnel, finances or other essential resources, and complexity of the implementation. Finally, evaluate and monitor controls required to maintain corrective actions after implementation [103-105]. 4. DISCUSSION Lean and six sigma methodologies are the best tools that streamline the quality and work performance of business industries and healthcare organizations [10-15,26,29,30]. However, when the two methodologies are integrated, the end results in terms of efficiency, efficacy, production, customer satisfaction, waste and time management, costs, performance variance and inconsistency, patients’ safety and adverse drug events are reported to improve significantly [11,13-16,36, 66]. Furthermore, lean and LSS has multiple interventional applications in all departments of healthcare industry including pharmacy, medical incidents, adverse events and medication errors [40,41,58,59,63], laboratory, radiology, medicine and surgery, geriatrics, trauma, inpatient and ambulatory clinical practice, and clinical and translational research [10,12,19-20,23,26-33,39], helps in the identification of root cause of any defect or adverse events [45,53,60-62,67], improves healthcare outcome [46] and create innovations in industry [38].There are some barriers and challenges such as constrained budgets, training of novice professionals, resources and leadership, lack of strong evidence and cultural bottlenecks when lean, lean sigma and lean six sigma projects are introduced in business and healthcare organizations [21-23,34,37,50,55-57]. The two problem solving techniques DMAIC and DMADV also used in LSS help in the prevention of adverse events including medication errors [60-64]. Lean six sigma also uses these approaches to improve an existing business process and create new product or process designs [44,45,62,64]. Furthermore, the application of lean methodology contributes to patients' value-added activity such as easy access to healthcare service linked with client
satisfaction. Lean methodology also controls non-value-added activity such as long waiting time, space or resources but does not contribute directly to satisfying client needs [65]. However, successful engagement of staff and main focus on accessing services should strike a balance between value added to clients and feeling valued by healthcare staff [65]. LSS and SS mostly utilize a variety of quality improvement tools commonly employed in conducting root cause analysis of adverse events including medicinal incidents [45,53,60-62,67]. Root cause analysis, a retrospective, complex method uses a variety of quality and statistical tools to help in identifying the root cause of work performance variance and defects in business industry and adverse drug events in healthcare settings [107]. However, root cause analyses are reported to produce inconsistent benefits, negative responses, lack of strong evidence [85, 86] and, hence, needs further research. The "5 whys" technique commonly used in RCA for identifying root cause of adverse events including medicinal incidents is associated with multiple problems including investigating team comprising of inexperienced experts, focus on symptom rather than root cause, interactional issues, huge investment and looking for singular cause when the cause is more than one [86,108]. However, all above described powerful quality tools assist in improving a variety of health related issues such as waiting time, inconsistent performance of health workers, wastage, medical incidents, adverse events, never events, efficiency, efficacy, injury, appointment time, client satisfaction, quality of inpatient, outpatients, intensive care unit, and emergency services and outcomes together with research accomplishments [13,102,107]. A comprehensive guide for conducting RCA with performance improvement projects will assist multidisciplinary investigating team to identify the root factor of adverse event, MEs, injury and close calls [103,109]. Notably, like active errors, the root cause underlying latent errors more often embedded in institution and regulation bodies, management, work environment, team environment, health professionals, and task- and patient-related concerns [107]. The implication of these results is that while conducting RCA using a variety of quality improvement tools, investigating team must focus and explore these sources of medicinal errors or adverse drug events in healthcare industry. In a related development, RCA software tools are developed for finding out solutions of complex problems in

Salem et al.; JAMPS, 12(1): 1-26, 2017; Article no.JAMPS.31541
21
medical and other industries [110]. This narrative review has some limitations. Selection and publication biases are the two limitations because there is huge literature on quality improvement tools and programs in healthcare industry and some important publications might have escaped our attention. Another limitation is healthcare industry is largely wider and we might have not covered all relevant healthcare topics in this review. However, the strength of this paper is that it provides important windows into most quality improvement tools including lean, lean sigma, six sigma, lean six sigma, and root cause analysis and approximately 18 approaches they use in improving the quality of diverse health perspectives in healthcare industry [42]. 5. CONCLUSION Lean six sigma methodology and RCA are now widely used in healthcare industry to improve the quality of healthcare services, manage time and waste effectively, control and prevent defects, injuries, adverse events including medication errors, close calls and adverse drug reactions, improve patient safety, enhance patient satisfaction, reduces healthcare costs, and improve health outcome. Further research is needed to overcome several identified challenges and barriers for utilizing the full potential of these quality improvement methodologies in healthcare industry. CONSENT It is not applicable. ETHICAL APPROVAL It is not applicable. COMPETING INTERESTS Authors have declared that no competing interests exist. REFERENCES 1. Emslie S, Knox K, Pickstone M. (editors).
Improving patient safety: Insights form American, Australian and British Healthcare. Available:http://www.who.int/patientsafety/journals_library/Improving_Patient_Safety.pdf?ua=1 (Accessed on October 5, 2016)
2. Al-Zaagi IA, Al-Dossari DS, Salem SO, Qureshi NA. Medication safety unit programs in King Saud Medical City, 2012 – 2013: Safe Medication Management and Use with a Focus on Patient Safety 2015. British J Medicine Medical Research. 2015;8:384-407.
3. Qureshi NA, Al-Dossari DS, Al-Zaagi IA, Al-Bedah AM, Abudalli ANS, Koenig H. Electronic health records, electronic prescribing and medication errors: A systematic review of literature, 2000-2014. British J Medicine and Medical Research. 2015;5:672-704.
4. Makary MA, Daniel M. Medical error—the third leading cause of death in the US. British Medical Journal. 2016;353:i2139.
5. Errors in Health Care: A leading cause of death and injury. Available:https://www.ncbi.nlm.nih.gov/books/NBK225187/
6. Pepper MPJ, Spedding TA. The evolution of lean Six Sigma. International Journal of Quality & Reliability Management. 2010; 27(2):138–155.
7. Luton A, Bondurant PG, Campbell A, Conkin C, Hernandez J, Hurst N. Got (the Right) Milk? How a blended quality improvement approach catalyzed change. Advances Neonatal Care. 2015; 15(5):345-353.
8. Bakhsh TMA, Al Baloshi AH, Bakhsh HMA, Al-Dosaari DS, Qureshi NA. Adverse drug reactions and pharmacovigilance: A narrative mini-review of relevant literature. Journal of Advances Medical and Pharmaceutical Sciences. 2016:11(1):1-18. (Article no. JAMPS.30653).
9. Al-Dosaari DS, Al-Zaagi IA, Salem SO, Al-Bedah AM, Qureshi NA. Medication errors and root causes analysis: Emerging views and practices in King Saud Medical City, Riyadh, Saudi Arabia. British Journal Pharmaceutical Research. 2016;13(1):1-18. (Article no.BJPR.28742)
10. Lighter DE. The application of lean six sigma to provide high-quality, reliable pediatric care. International Journal of Pediatrics Adolescent Medicine. 2014; 1(1):8-10.
11. Call R. Lean approach gives greater efficiency. Health Estate. 2014;68(2):23-25.
12. Mayer T, Jensen K. Improving the return on investment in healthcare by applying lean management and six sigma principles. International Journal Six Sigma

Salem et al.; JAMPS, 12(1): 1-26, 2017; Article no.JAMPS.31541
22
Competitive Advantage. 2008;4(3):192-195.
13. Mazzocato P, Savage C, Brommels M, Aronsson H, Thor J. Lean thinking in healthcare: A realist review of the literature. Quality and Safety in Health Care. 2010;1;19(5):376-382.
14. Kim CS, Spahlinger DA, Kin JM, Billi JE. Lean health care: What can hospitals learn from a world‐class automaker?. Journal Hospital Medicine. 2006;1(3):191-199.
15. Brandao de Souza L. Trends and approaches in lean healthcare. Leadership Health Services. 2009;22(2):121-139.
16. Setijono D, Naraghi AM, Ravipati UP. Decision support system and the adoption of lean in a Swedish emergency ward: Balancing supply and demand towards improved value stream. International Journal Lean Six Sigma. 2010;1(3):234 – 248.
17. Lean manufacturing. Available:https://en.wikipedia.org/wiki/Lean manufacturing (Retrieved on October 9 2015)
18. Holden RJ. Lean thinking in emergency departments: A critical review. Annals Emergency Medicine. 2011;57(3):265–278.
19. Nicolay CR, Purkayastha S, Greenhalgh A, Benn J, Chaturvedi S, Phillips N, Darzi A. Systematic review of the application of quality improvement methodologies from the manufacturing industry to surgical healthcare. British Journal Surgery. 2012; 99:324-335.
20. Niemeijer GC, Trip A, Ahaus KT, Does RJMM, Wendt KW. Quality in trauma care: Improving the discharge procedure of patients by means of lean six sigma. Journal Trauma-Injury Infection & Critical Care. 2010;69(3):614-619.
21. Jadhav JE, Mantha SS, Rane SB. Exploring barriers in lean implementation. International Journal Lean Six Sigma. 2014;5(2):122-148.
22. Andersson R, Hilletofth P, Hilmola O-P. Lean implementation in the geriatric care sector in Sweden. International Journal Six Sigma Competitive Advantage. 2015;9(1):56-71.
23. Gamal Aboelmaged M. Six sigma quality: a structured review and implications for future research. International Journal Quality & Reliability Management. 2010; 27(3):268-317.
DOI: http://dx.doi.org/ 10.1108/ 026567110 11023294
24. Timwood 7 Wastes. Available:http://hubpages.com/business/Seven-Wastes (Retrieved on December 31, 2016)
25. Holden RJ, Eriksson A, Andreasson J, Williamsson A, Dellve L. Healthcare workers perceptions of lean: A context-sensitive, mixed methods study in three Swedish hospitals. Applied Ergonomics. 2015;0:181-192.
26. Samuel L, Novak-Weekley S. The role of the clinical laboratory in the future of health care: lean microbiology. Journal Clinical Microbiology. 2014;52(6):1812-1817.
27. Zhang L, Runzheimer K, Bonifer E, Keulers A, Piechowiak E, Mahnken A. Improving efficiency of interventional service by lean six sigma. Journal American College Radiology; 2015. pii: S1546-1440(15)00403-2 DOI: 10.1016/j. jacr.2015.05. 016
28. Mason SE, Nicolay CR, Darzi A. The use of Lean and Six Sigma methodologies in surgery: A systematic review. Surgeon. 2015;13(2):91-100.
29. Glasgow JM, Scott-Caziewell JR, Kaboli PJ. Guiding inpatient quality improvement: A systematic review of Lean and Six Sigma. Joint Commission Journal Quality Patient Safety. 2010;36(12):533-540.
30. Eitel DR, Rudkin SE, Malvehy MA, Killeen JP, Pines JM. Improving service quality by understanding emergency department flow: A White Paper and position statement prepared for the American Academy of Emergency Medicine. Journal Emergency Medicine. 2010;38(1):70-79.
31. Schweikhart SA, Dembe AE. The applicability of Lean and Six Sigma techniques to clinical and translational research. Journal Investigative Medicine. 2009;57(7):748-755.
32. Ahmed S, Manaf NH, Islam R. Effects of lean six sigma application in healthcare services: A literature review. Review Environmental Health. 2013;28(4):189-194.
33. Chiarini A. Risk management and cost reduction of cancer drugs using lean six sigma tools. Leadership Health Services. 2012;25(4):318-330.
34. Delli Fraine JL, Langabeer JR 2nd, Nembhard IM. Assessing the evidence of six sigma and lean in the health care

Salem et al.; JAMPS, 12(1): 1-26, 2017; Article no.JAMPS.31541
23
industry. Quality Management Health Care. 2010;19(3):211-225.
35. Font Noguera I, Fernández Megía MJ, Ferrer Riquelme AJ, Balasch I Parisi S, Edo Solsona MD, Poveda Andres JL. Improving inpatient pharmacotherapeutic process by lean six sigma methodology. Revista Calidad Asistencial. 2013;28(6): 370-380.
36. Arnheiter ED, Maleyeff J. The integration of lean management and six sigma. The TQM Magazine. 2005;17(1):5-18.
37. Näslund D. Lean, six sigma and lean sigma: fads or real process improvement methods? Business Process Management Journal. 2008;14(3):269-287.
38. Hoerl RW, Gardner MM. Lean six sigma, creativity, and innovation. International Journal Lean Six Sigma. 2010;1(1):30-38.
39. Tolga Taner M, Sezen B, Atwat KM. Application of six sigma methodology to a diagnostic imaging process. International Journal health care Quality Assurance. 2012;25(4):274-290.
40. Chan AL. Use of six sigma to improve pharmacist dispensing errors at an outpatient clinic. Joint Commission Journal Quality Patient Safety. 2005;31(6):319-324.
41. Castle L, Franzblau-Isaac E, Paulsen J. Using six sigma to reduce medication errors in a home-delivery pharmacy service. Joint Commission Journal Quality Patient Safety. 2005;31(6):319-324.
42. Benedetto AR. Six sigma: Not for the faint of heart. Radiology Management. 2003; 25(2):40-53.
43. Vest JR, Gamm LD. A critical review of the research literature on six sigma, lean and studer group's hardwiring excellence in the United States: The need to demonstrate and communicate the effectiveness of transformation strategies in healthcare. Implementation Science. 2009;4(1):1. DOI: 10.1186/1748-5908-4-35
44. Liberatore MJ. Six Sigma in healthcare delivery. International Journal HealthCare Quality Assurance. 2013;26(7):601-626.
45. Barry C. DMAIC vs. DMADV vs. DFSS. Available:http://blog.minitab.com/blog /real-world-quality-improvement/dmaic-vs-dmadv-vs-dfss (Retrieved on January 1, 2017)
46. Gowen III CR, McFadden KL, Settaluri S. Contrasting continuous quality improvement, six sigma, and lean management for enhanced outcomes in
US hospitals. American Journal Business. 2012;27(2):133-153.
47. Delli Fraine JL, Wang Z, McCaughey D, Langabeer JR 2nd, Erwin CO. The use of six sigma in health care management: Are we using it to its full potential? Quality Management Health Care. 2014;23(4): 240-253. DOI: 10.1097/QMH.000000000000 0039
48. Kinsman L, Rotter T, Stevenson K, Bath B, Goodridge D, Harrison L, Dobson R, Sari N, Jeffery C, Bourassa C, Westhorp G. The largest lean transformation in the world: The implementation and evaluation of lean in Saskatchewan healthcare. Healthcare Quality. 2014;17(2):29-32.
49. Goodridge D, Westhorp G, Rotter T, Dobson R, Bath B. Lean and leadership practices: Development of an initial realist program theory. BMC Health Services Research. 2015;15:362. DOI: 10.1186/s 12913-015-1030-x
50. Knapp S. Lean six sigma implementation and organizational culture. International Journal Health Care Quality Assurance. 2015;28(8):855-863.
51. Deckard GJ, Borkowski N, Diaz D, Sanchez C, Boisette SA. Improving timeliness and efficiency in the referral process for safety net providers: Application of the lean six sigma methodology. Journal Ambulatory Care Management. 2010;33(2):124-130. DOI: 10.1097/JAC.0b013e3181d91670
52. Gidey E, Jilcha K, Beshah B, Kitaw D. The plan-do-check-act cycle of value addition. Industrial Engineering Management. 2014; 3:124. DOI: 10.4172/ 2169-0316.1000124
53. Gorenflo G, Moran JW. The ABCs of PDCA. Available:http://www.phf.org/ resourcestools/Documents/ABCs_of_PDCA.pdf (Retrieved on November 20, 2016)
54. De Koning H, Verver JP, van den Heuvel J, Bisgaard S, Does RJ. Lean six sigma in Healthcare. Journal Healthcare Quality. 2006;28(2):4-11.
55. Snee RD. Lean six sigma – getting better all the time. International Journal Lean Six Sigma. 2010;1(1):9-29.
56. Kruskal JB, Reedy A, Pascal L, Rosen MP, Boiselle PM. Quality initiatives: Lean approach to improving performance and efficiency in a radiology department. Radiographics. 2012;32(2):573-587.

Salem et al.; JAMPS, 12(1): 1-26, 2017; Article no.JAMPS.31541
24
57. Pocha C. Lean six sigma in health care and the challenge of implementation of six sigma methodologies at a veterans affairs medical center. Quality Management in Health Care. 2010;19(4):312–318.
58. Esimai G. Lean six sigma reduces medication errors. Quality Progress. 2005;38:51-57.
59. Miglani P. Application of lean six sigma in reduction of medication errors. Journal Multidisciplinary Research Healthcare. 2015;2(1):55-72. DOI: 10.15415/jmrh. 2015. 21004
60. Bedi HS, Moon NJ, Bhatia V, Sidhu GK, Khan N. Evaluation of musculoskeletal disorders in dentists and application of DMAIC technique to improve the Ergonomics at dental clinics and meta-analysis of literature. Journal Clinical Diagnostic Research. 2015;9(6):ZC01-3. DOI: 10.7860/JCDR/2015/14041.6126
61. Kassardjian CD, Williamson ML, Van Buskirk DJ, Ernste FC, Hunderfund AN. Residency Training: Quality improvement projects in neurology residency and fellowship: Applying DMAIC methodology. Neurology. 2015;85(2):e7-e10. DOI: 10.1212/WNL.0000000000001732
62. Southard PB, Chandra C, Kumar S. RFID in healthcare: A Six Sigma DMAIC and simulation case study. International Journal Health Care Quality Assurance. 2012;25(4):291-321.
63. Kumar S, Steinbach M. Eliminating US hospital medical errors. International Journal Health Care Quality Assurance. 2008;21(5):444-471.
64. Dreachslin JL, Lee PD. Applying six sigma and DMAIC to diversity initiatives. Journal Healthcare Management. 2007;52(6):361-367.
65. Deans R, Wade S. Finding a balance between "value added" and feeling valued: Revising models of care. The human factor of implementing a quality improvement initiative using Lean methodology within the healthcare sector. Healthcare Quality. 2011;14(3):58-61.
66. Moheb L, Khalifa M. Lean six sigma in health care: Improving utilization and reducing waste. (Conference Paper) In Studies in Health Technology and Informatics. 2016;226:194-197. DOI: 10.3233/978-1-61499-664-4-194
67. Uluskan M. A comprehensive insight into the Six Sigma DMAIC toolbox.
International Journal Lean Six Sigma. 2016;7(4):406-429.
68. Ursprung R, Gray JE, Edwards WH, Horbar JD, Nickerson J, Plsek P, Shiono PH, Suresh GK, Goldmann DA. Real time patient safety audits: Improving safety every day. Quality Safe Health Care. 2005;14(4):284-289.
69. Connor M, Duncombe D, Barclay E, Bartel S, Borden C, Gross E, Miller C, Ponte PR. Creating a fair and just culture: One institution's pat toward organizational change. Joint Commission Journal Quality Patient Safety. 2007;33(10):617-624.
70. Sirgo Rodríguez G, Olona Cabases M, Martin Delgado MC, Esteban Reboll F, Pobo Peris A, BodíSaera M. Audits in real time for safety in critical care: Definition and pilot study. Medicina Intensiva. 2014; 38(8):473-482.
71. Bodí M, Olona M, Martín MC, Alceaga R, Rodríguez JC, Corral E, Pérez Villares JM, Sirgo G. Feasibility and utility of the use of real time random safety audits in adult ICU patients: A multi-centre study. Intensive Care Medicine. 2015;41(6): 1089-1098.
72. Ursprung R, Gray J. Random safety auditing, root cause analysis, failure mode and effects analysis. Clinics Perinatology. 2010;37(1):141-165. DOI: 10.1016/j.clp.2010. 01.008
73. Hay A. Audit in infection control. Journal Hospital Infection. 2006;62(3):270-277.
74. Ivers N, Jamtvedt G, Flottorp S, Young JM, Odgaard-Jensen J, French SD, O'Brien MA, Johansen M, Grimshaw J, Oxman AD. Audit and feedback: Effects on professional practice and healthcare outcomes. Cochrane Database of Systematic Reviews. 2012;(6). Art. No.: CD000259. DOI: 10.1002/14651858.CD000259.pub3
75. Stewart K, Bray B, Buckingham R. Improving quality of care through national clinical audit. Future Hospital Journal. 2016; 3(3):203-206.
76. Armitage S, McAnuff J, Kolehmainen N. Implementing better healthcare: Using audit and feedback to change therapists' practice. Association of Pediatric Physiotherapists Journal. 2016;7(1):72-77.
77. Levy J, Kinley J, Conway F. The challenges of implementing a multi-centre audit of end-of-life care in care homes. International Journal Palliative Nursing. 2016;22(11):534-540.
Salem et al.; JAMPS, 12(1): 1-26, 2017; Article no.JAMPS.31541
25
78. Firth J, Snowden N, Ledingham J, Rivett A, Galloway J, Dennison EM, MacPhie E, Ide Z, Rowe I, Kandala N, Jameson K. The first national clinical audit for rheumatoid arthritis. British Journal Nursing. 2016; 25(11):613-617.
79. Garcia-Hejl C, Chianéa D, Dedome E, Sanmartin N, Bugier S, Linard C, Foissaud V, Vest P. Internal audit in medical laboratory: what means of control for an effective audit process? Annals Biological Clinical (Paris) 2013;71(5):615-624. DOI: 10.1684/abc.2013.0881
80. Brook OR, Kruskal JB, Eisenberg RL, Larson DB. Root Cause Analysis: Learning from Adverse Safety Events. Radiographics. 2015;35(6):1655-1667.
81. Quraishi SA, Kimatian SJ, Murray WB, Sinz EH. High-fidelity simulation as an experiential model for teaching root cause analysis. Journal of Graduate Medical Education. 2011;3(4):529-534.
82. Williams PM. Techniques for root cause analysis. Proceedings (Baylor University Medical Center). 2001;14(2):154-157.
83. Root cause analysis. Available:https://psnet.ahrq.gov/primers/primer/10/root-cause-analysis (Retrieved on November 17 2016)
84. The joint commission. Framework for conducting a root cause analysis and action plan. Available:http://www.jointcommission.org/Framework_for_Conducting_a_Root_Cause_ Analysis _and_Action_Plan/ (Retrieved on October 8, 2016)
85. Hellebek A, Skjoet P. Aggregated review of route cause analyses related to medication. Studies Health Technology Informatics. 2010;157:15-17.
86. Braithwaite J, Westbrook MT, Mallock NA, Travaglia JF. Experiences of health professionals who conducted root cause analyses after undergoing a safety improvement programme. Quality Safety Health Care. 2006;15(6):393-399.
87. Boyer MM. Root cause analysis in perinatal care: Health care professionals creating safer health care systems. Journal Perinatal Neonatal Nursing. 2001;15(1): 40-54.
88. Doggett AM. A statistical comparison of three root cause analysis tools. Journal Industrial Technology. 2004;20(2):9.
89. Basic tools for process improvement. Available:http://saferpak.com/cause_ effect_articles/ howto_cause_effect.pdf (Retrieved on November 17 2016)
90. Chung KC, Kotsis SV. Complications in Surgery: Root cause analysis and preventive measures. Plastic Reconstructive Surgery. 2012;129(6): 1421-1427.
91. Uberoi RS, Gupta U, Sibal A. Root cause analysis in healthcare. Apollo Medicine. 2004;1(1):60-63.
92. Vincent CA. Analysis of clinical incidents: A window on the system not a search for root causes. Quality Safety Health Care. 2004; 13:242-243.
93. Crema M, Verbano C. Guidelines for overcoming hospital managerial challenges: A systematic literature review. Therapeutics Clinical Risk Management. 2013;9:427-441.
94. Delgado Silveira E, Alvarez Díaz A, Pérez Menéndez-Conde C, Serna Pérez J, Rodríguez Sagrado MA, Bermejo Vicedo T. Failure modes and effects analysis in the prescription, validation and dispensing process. Farmacia Hospitalaria. 2012; 36(1):24-32.
95. Salamano M, Palchik V, Botta C, Colautti M, Bianchi M, Traverso ML. Patient safety: use of quality management to prevent medication errors in the hospital medication use cycle [Spanish]. Revista de Calidad Asistencial. 2013;28(1):28-35.
96. Latino RJ, Flood A. Optimizing FMEA and RCA efforts in health care. Journal Healthcare Risk Management. 2004;24: 21-28.
97. Vélez-Díaz-Pallarés M, Delgado-Silveira E, Carretero-Accame ME, Bermejo-Vicedo T. Using Healthcare Failure Mode and Effect Analysis to reduce medication errors in the process of drug prescription, validation and dispensing in hospitalized patients. BMJ Quality Safety. 2013;22(1):42-52.
98. Percarpio KB, Watts BV,Weeks WB. The effectiveness of root cause analysis: What Does the literature tell us? The Joint Commission Journal Quality Patient Safety. 2008;34(7):391-398.
99. Connelly LM. Root Cause Analysis. Medicine Surgery Nursing. 2012; 21(5): 313-316.
100. Carrillo I, Mira JJ, Vicente MA, Fernandez C, Guilabert M, Ferrús L, Zavala E,

Salem et al.; JAMPS, 12(1): 1-26, 2017; Article no.JAMPS.31541
26
Silvestre C, Pérez-Pérez P. Design and testing of bacra, a Web-Based Tool for middle managers at health care facilities to lead the search for solutions to patient safety incidents. Journal Medical Internet Research. 2016;18(9):e257. Available:http://doi.org/10.2196/jmir.5942
101. Basic Root cause analysis techniques. ASQ. Available: http://www. brighthubpm.com/project-planning/57124-overview-of-root-cause-analysis- techniques/ (Retrieved on December 22, 2016)
102. Root cause analysis approaches & techniques – ASQ. Available:http://asq.org/learn-about-quality/root-cause-analysis/overview/root-cause-approaches.Html (Retrieved on December 2, 2016)
103. Mini guide to root cause analysis. Available:http://www.root-cause-analysis.co.uk/images/Green%20 RCA%20mini%20guide%20v5%20 small. pdf (Retrieved on December 7, 2016)
104. Secrets of root cause analysis. Available:http://www.taproot.com/ archives/24425 (Retrieved on December 14, 2016)
105. techniques for data quality root cause analysis-data quality pro. Available:https://www.dataqualitypro. com/10-techniques-for-data-quality-root-cause-analysis/ (Retrieved on December 18, 2016)
106. Peerally MF, Carr S, Waring J, Dixon-Woods M. The problem with root cause analysis.BMJ Quality Safety. 2016;0:6. DOI: 10.1136/bmjqs-2016-005511
107. Root cause analysis. Available:https://psnet.ahrq.gov /primers/primer /10/ root - cause- analysis (Retrieved on December 26,2016)
108. Card AJ. The problem with '5 whys'. BMJ Quality Safety; 2016. pii: bmjqs-2016-005849. DOI: 10.1136/bmjqs-2016-005849 [Epub ahead of print]
109. Root Cause analysis tools & learning resources (ASQ). Available:https://www.cms.gov/medicare/provider-enrollment-and-certification/qapi/ downloads/guidanceforrca.pdf (Retrieved on December 25, 2016)
110. Root cause analysis. Available:http:// open-tube.com/10-best-software-tools-to-conduct-root-cause-analysis-and-solve-complex-problems/ (Retrieved on December 28, 2016)
_________________________________________________________________________________ © 2016 Salem et al.; This is an Open Access article distributed under the terms of the Creative Commons Attribution License (http://creativecommons.org/licenses/by/4.0), which permits unrestricted use, distribution, and reproduction in any medium, provided the original work is properly cited.
Peer-review history: The peer review history for this paper can be accessed here:
http://sciencedomain.org/review-history/17694