Lean Management and Management Accounting System: An …
278
Graduate School Lean Management and Management Accounting System: An Actor-Network Conceptualisation Thesis submitted for the degree of Doctor of Philosophy at the University of Leicester by Sarah Gamal Abdallah Mohamed Department of Management University of Leicester December 2019
Transcript of Lean Management and Management Accounting System: An …

Graduate School Lean Management and Management Accounting System: An
Actor-Network Conceptualisation
Thesis submitted for the degree of
Doctor of Philosophy
at the University of Leicester
by
Sarah Gamal Abdallah Mohamed
Department of Management
University of Leicester
December 2019

ii
Abstract
Lean management is a philosophy that seeks the continuous improvement and
meeting customer demands, through the elimination of any and all types of wastes.
Initially rooted in Toyota corporation’s production system, lean management has
rapidly spread to various manufacturing and non-manufacturing sectors. Yet, even with
such spread of lean management implementation, our understanding of the
developments in organisations’ management accounting system (MAS) in the context of
lean is still ambiguous. The available literature either from the academic or the
consultancy domain problematises the traditional accounting system to work with lean
management and suggest either shedding traditional accounting practices at all or using
‘lean accounting’ as a ‘lean-tailored’ accounting system. However, neither the
academic nor the consultancy literature succeed in developing an overall theoretical
conceptualisation of how an organisation’s MAS works with lean. Nor do they provide
an in-depth investigation of the role played by the main lean accounting practice; Value
Stream Costing (VSC) and the factors affecting its acceptance or rejection.
Additionally, management accounting literature has not contributed much to our
academic knowledge on the MAS associated with lean management as a form of
horizontal organisation and process innovation. Hence, this research aims at developing
a theoretical conceptualisation of the developments in organisations’ management
accounting system (MAS) in the context of lean management. Additionally, the research
seeks to investigate the performative role of the lean accounting VSC practice and
explore the factors affecting managers’ willingness to accept or reject its
implementation.
A longitudinal case study informed by the use Actor Network Theory (ANT) and
Michel Callon’s (2007, 2010) performativity thesis, is conducted on one of the factories
of a multinational manufacturing organisation, adopting a lean management system.
ANT’s elements of the ‘sociology of translation’ (Callon, 1986; Latour, 1986; Latour,
2005) are used first to develop a literature driven conceptualisation of the current
discourse in both consultancy and academic literatures on the MAS associated with
lean. Empirically, various human and non-human actors are identified at both the
organisation’s local and global levels. Callon’s (1986) and Latour’s (1986, 1996) four
moments of translation are used to interpret actors’ interactions making up the

iii
developments in organisation’s MAS. Callon’s (1998a) concepts of framing and
overflow and performativity thesis (Callon, 2007, 2010) are then used to develop an
empirical driven theoretical conceptualisation of the developments in organisation’s
MAS in the context of lean. The research tested the performativity of VSC by tracing its
effects on product cost and analysed if, or to what extent, the organisation is willing to
implement it. The research contributes to both academics and practitioners through
providing new nuances on the operation and developments in organisation’s MAS and
practices in the context of lean. It also, responds to calls from both management
accounting and lean management literatures to the develop more context related
management accounting research and provide in depth empirical analysis on the
management accounting practices relevant to lean management.
The use of ANT unpacked new insights on the social and technical aspects of the
developments in an organisation’s MAS in the context of lean. Such aspects include; the
influential role of management accountants and consultants in lean organisations, the
performative role of operating structures in lean settings and the association between the
performativity of accounting calculations and management accounting relational
ontology. The literature driven theoretical conceptualisation shows that, more research
is needed on actors’ interactions forming the fabrics of organisations’ MAS and how its
calculations interact with other actors in a process innovation such as lean. In terms of
VSC, the practice performed in an opposite direction to the predictions made for it. In
the case study conducted, VSC was mobilised by the factory layout and intentions of the
organisation actors; both locally and globally, which may have distorted the
expectations from its implementation. Additionally, it was found that committing to a
lean accounting tool as VSC can be difficult in the context of headquarters’ pressures
and political unrest. Successful VSC implementation, requires organisations to review
their needs for product unit costs along with, the construction pattern of their value
streams. It is suggested that more case study research is required at the intersection
between both MAS and lean management research areas, to help expand academics’
and practitioners’ understanding of the operation and development in the MAS’s of
companies implementing a lean management system. Additionally, it would be helpful
to provide more empirical evidence on the conditions needed for VSC implementation
and continue to explore the role played by other management accounting or lean

iv
accounting practices in lean organisations. This strand of literature is still evolving and
lacks codification.

v
Acknowledgements First and foremost, I wish to thank my parents for their tremendous care and support
throughout my PhD journey. I am blessed that they are my little family and truly would
not have made it to this stage without their presence in my life. Second, I am truly
grateful to my supervisors; Dr Nicola Bateman and Dr Kenneth Weir, whose
understanding and unwavering support, both academically and emotionally, have kept
me going till the very end of this stage. They have both given me valuable guidance and
at the same time allowed me the freedom needed to develop an independent researcher.
I am truly thankful for all their effort, understanding and patience with me.
I also wish to give a special thanks to my first supervisor for this research, Professor
Will Seal. I am grateful for over three years of academic learning, guidance and support
that he has given me throughout this PhD journey.
Thanks to my examiners; Professor Liz Warren and Dr Rob Dekkers for the time and
effort which they have put into reading my work and for the useful comments and
feedback I have received from them.
I am grateful to University of Leicester, School of Business for providing me with
the opportunity to undertake this PhD and for funding this research project.
Additionally, I would like to thank all the participants in my case study at (LT)
organisation. They have given me a lot of their time to discuss many aspects of this
research. It would be fair to say that this thesis would not be complete without their help
and cooperation.
Further, I would like to thank many participants in the academic and management
accounting community for their time in giving me useful advice and feedback on my
research. Special thanks to: Professor Wai Fong Chua, Professor David Otley, Professor
Ed Vosselman, Professor John Burns, Dr Anna Raffoni and Dr Stephen Jollands. I am
also thankful to all the participants of the conferences and workshops I attended
throughout my PhD journey. Attending these events have provided me with
opportunities to rethink and develop my work through different presentations and
feedback discussions.
vi
Thanks to the participants of:
- Management Accounting Association workshop, 2015, in Nottingham, UK,
- European Accounting Association, 2016 in Maastricht, the Netherlands,
- Management Accounting Association workshop, 2016 in Manchester, UK,
- Research in Accounting, Accountability and Society (RASA) unit internal
seminar, November 2018, University of Leicester, UK,
- International Management Accounting Conference, June 2019, University of
Roehampton, UK.
Finally, I would make a special mention to my PhD companions and faithful friends;
Yasmine, Ingie and Rana. I am thankful for their support throughout all my ups and
down. They have always reminded me that, ‘one day will sit and celebrate this
together’. I think this day has finally come!

vii
Table of Contents
Abstract ......................................................................................................................... ii
Acknowledgements ....................................................................................................... v
Table of Contents ........................................................................................................ vii
List of Figures ............................................................................................................. vii
List of Tables ................................................................................................................ ix
List of Abbreviations ................................................................................................... xi
Chapter 1: Introduction ............................................................................................... 1
1.1 Lean Management – An Overview .......................................................................... 2
1.2 MAS, Lean Accounting and the Contribution of Innovation Literature – An
Overview ........................................................................................................................ 3
1.3 Research Questions .................................................................................................. 5
1.4 Overview of Research Method Used ........................................................................ 6
1.5 Overview of Actor-Network Theory ........................................................................ 8
1.6 Thesis Structure ...................................................................................................... 10
Chapter 2 Lean Management and Management Accounting System: A Review
of Literature ................................................................................................................ 12
2.1 Introduction ............................................................................................................ 12
2.2 Lean Management Definition ................................................................................. 14
2.2.1 Lean Defined as a Philosophy/ a Way of Thinking ........................................... 15
2.2.2 Lean defined as a “Tool-Box” .......................................................................... 17
2.3 Lean Management Principles ................................................................................. 20
2.3.1 Specify the Customer Value .............................................................................. 21
2.3.2 Identify the Value Stream .................................................................................. 21
2.3.3 Keep the Flow of Process .................................................................................. 24
2.3.4 The Pull principle .............................................................................................. 26
2.3.5 The Perfection Principle ................................................................................... 27
2.4 Toyota Production System and the Spread of Lean Management ......................... 28
2.5 Benefits versus Barriers of Applying Lean ............................................................ 30
2.6 Lean Management as a Process Innovation and a Horizontal Organization
Arrangement ................................................................................................................. 32
viii
2.7 Management Accounting and Management Control Systems: A discussion of
the Various Definitions ................................................................................................ 38
2.8 MCS Frameworks ................................................................................................... 42
2.9 Different Categorisations of Controls .................................................................... 45
2.10 MAS and MCS: From a progressive evolutionary story to an
‘incommensurate’ set of definitions ............................................................................. 46
2.11 Analysing the Literature on MAS and Innovation ............................................... 50
2.12 Lessons from a Production-line Approach, Services and Current
Manufacturing Industries ............................................................................................. 52
2.13 Lean Accounting Definition ................................................................................. 54
2.14 Reasons for the Need for a Lean Accounting System .......................................... 55
2.14.1 To Avoid the Traditional Costing Drawbacks ................................................ 55
2.14.2 To Provide Lean Tailored Information ........................................................... 56
2.15 Value Stream Costing Operation .......................................................................... 56
2.15.1 Product Unit Cost using VSC .......................................................................... 58
2.15.2 Value Stream Costing with Features and Characteristics Costing ................ 59
2.16 Chapter Summary ................................................................................................. 61
Chapter 3: Theoretical Underpinning ...................................................................... 63
3.1 Introduction ............................................................................................................ 63
3.2 Background on Actor-Network Theory (ANT) ...................................................... 63
3.3 Ontology of ANT and the Rational for Choosing it for this Research ................... 65
3.4 Defining Theoretical Concepts Used ..................................................................... 69
3.4.1 Actors ................................................................................................................ 69
3.4.2 Networks ............................................................................................................ 70
3.4.3 Translations ...................................................................................................... 71
3.5 Framing and Overflow ........................................................................................... 74
3.6 Socio-Technical Agencements and Callon's Performativity Thesis ....................... 77
3.7 Misconceptions and Critique to ANT and Performativity Thesis .......................... 82
3.8 Management Accounting Literature on Lean and Callon's four Moments of
Translation .................................................................................................................... 86
ix
3.7.1 Problematisation: problematising traditional management accounting and
control system ............................................................................................................ 86
3.7.2 Interessment: Constructing 'an interface' between literature key actors .......... 90
3.7.3 Enrolment: Trying to build an agreement between literature key actors ......... 94
Chapter 4: Research Methodology ......................................................................... 100
4.1 Introduction .......................................................................................................... 100
4.2 Research Paradigms and their Ontological and Epistemological Foundations .... 100
4.3 Research Design ................................................................................................... 106
4.4 Research Strategy and Method ............................................................................. 109
4.5 Data Collection ..................................................................................................... 114
4.6 Role of Researcher ............................................................................................... 117
4.7 Data Analysis ....................................................................................................... 119
4.8 Chapter Summary ................................................................................................. 121
Chapter 5: Case Study Background and Findings Part I ..................................... 123
5.1 Case Organisation Background ............................................................................ 123
5.2 Organisation Chart and Key Organisation Representatives ................................. 126
5.3 Managing Organisation's Management Accounting Information ........................ 131
5.4 Factory Lean Journey: An Overview ................................................................... 135
5.5 Factory Old Value Stream – 2004 till end of 2011 ............................................... 142
5.6 Factory New Value Streams - from year 2012 onwards ...................................... 144
5.7 Factory Management Accounting System ........................................................... 147
5.7.1 Start of lean management implementation till end of year 2013 .................... 147
5.7.2 From 2014 till end of year 2016 ..................................................................... 152
5.8 Chapter Summary ................................................................................................. 158
Chapter 6: Findings Part II and Analysis .............................................................. 159
6.1 Introduction .......................................................................................................... 159
6.2 Structure of Second Part of Findings and Analysis .............................................. 159
6.3 Plot 1: Who Drives Changes in Factory Performance Measures? ....................... 162
6.4 Summarising the Analysis of First Plot ................................................................ 169
6.5 Plot 2: Debates on Factory Costing Practices ...................................................... 169
6.6 Analysing Plot 2 ................................................................................................... 175

x
6.6.1 Situation with the Old Value Stream (2004 – till end of 2011) ....................... 175
6.6.2 Situation with Factory New Value Stream – (Costing Practices following
the use of ABC in 2014 onwards) ............................................................................. 179
6.7 Plot 3: On the Tension between Accounting Controllers and Factory
Engineers .................................................................................................................. 181
6.7.1 Factory lead Engineers and Reflections on Costing Calculations ................. 181
6.7.2 Analysing the First Tension Incident .............................................................. 182
6.7.3 Processing Sales Orders and Managing On-time Delivery in Full ................ 185
6.7.4 Analysing the Tension Incident ....................................................................... 186
6.8 Chapter Summary ................................................................................................. 189
Chapter 7: Discussion .............................................................................................. 191
7.1 Introduction .......................................................................................................... 191
7.2 A Timeline of Both Lean and MAS in Case Organisation ................................... 192
7.3 Actors Different Perceptions on Organisation’s Management Accounting
Practices and Controls ................................................................................................ 195
7.4 MAS between Framing and Overflow ................................................................. 201
7.5 On the Performativity of Operating Structures .................................................... 207
7.6 Horizontal Organisation Arrangements and the Desire to Control ...................... 209
7.7 On the Performativity of Calculative Practices and Management Accounting
Relational Ontology ................................................................................................... 210
7.8 On the Role of Management Accountants and Consultants ................................. 211
7.9 Between Literature driven and Empirical driven Theoretical Conceptualisation
– Developing answers to study research questions .................................................... 213
7.9.1 On the Developments in Organisations MAS in the Context of lean .............. 213
7.9.2 On the Performative Role of Value Stream Costing ....................................... 217
7.9.3 Factors Affecting VSC Acceptance or Rejection ............................................. 219
7.10 Chapter Summary ............................................................................................... 220
Chapter 8: Conclusion ............................................................................................. 222
8.1 Introduction .......................................................................................................... 222
8.2 Main Conclusions associated with Study Research Questions ............................ 224
8.3 Contributions ........................................................................................................ 227

xi
8.4 Research Limitations ............................................................................................ 230
8.5 Directions for Future Research ............................................................................. 231
Appendix A: List of Data Collection Activities ...................................................... 233
1: List of Interviews ................................................................................................. 233
2: List of Observations ............................................................................................. 234
3: List of Focus Groups ............................................................................................ 234
Appendix B: List of Data Collection Activities in Years 2009 and 2010
providing the Background for Case Study ............................................................. 236
1: List of Interviews ................................................................................................. 236
2: List of Observations ............................................................................................. 236
References ................................................................................................................. 237

vii
List of Figures Figure 2. 1: The Lean Iceberg Model ............................................................................ 19
Figure 2. 2: Typical Format of a Value Stream ............................................................. 23
Figure 2. 3: Comparison between the Mass Production and Lean Management .......... 53
Figure 2. 4: Costs included in the Value Stream Costing Calculations ......................... 57
Figure 3. 1: Raising the level of the unit of analysis in a management accounting
system for lean production .............................................................................................. 88
Figure 3. 2: The impetus for changing the management accounting system ................. 91
Figure 3. 3: Literature Driven Theoretical Conceptualisation – Putting ‘interessment’
arguments in context ....................................................................................................... 97
Figure 4. 1: Representation of where this research fits within the Philosophical Paradigms ..................................................................................................................... 108 Figure 4. 2: Timeline of the Duration of Longitudinal Case Study and Data Collection Years ............................................................................................................................. 116 Figure 4. 3: Summary of Research Design .................................................................. 122
Figure 5. 1: Organisation chart for the Transformers Product Group in Egypt ........... 127
Figure 5. 2: An illustration of how PGTR management accounting and control
information is reported .................................................................................................. 132
Figure 5. 3: Timeline of Progress in Lean Management Implementation in LT
transformers Factory ..................................................................................................... 136
Figure 5. 4: Value Stream Map (old value stream) for LT Transformers Factory ...... 143
Figure 5. 5: Transformers Factory New Value Stream ................................................ 146
Figure 5. 6: Factory analysis of percentage level of inventory during first two quarters
of 2014 .......................................................................................................................... 156
Figure 5. 7: Change in targets of inventory percentages following analysis of inventory
levels ............................................................................................................................. 156
Figure 5. 8: Results of 4Q analysis following an oil leakage problem ........................ 157

viii
Figure 6. 1: An Extraction from Organisation Chart showing Organisation’s
Representatives handling or having an impact on its MA information ........................ 161
Figure 6. 2: Pictures of some visual boards used inside the factory ............................ 166
Figure 6. 3: Proposed alternatives for case study organisation given its factory old
value stream .................................................................................................................. 178
Figure 7. 1: Timeline for Organisation’s MAS and Lean Management over the Study
Period ............................................................................................................................ 193
Figure 7. 2: Empirical driven Theoretical Conceptualisation of Developments in
Organisation’s MAS based on LT Case ....................................................................... 202

ix
List of Tables
Table 2. 1: The 5S Practice ............................................................................................ 25
Table 2. 2: Most common definitions for MCS – (from 1960’s to 2000) ..................... 39
Table 2. 3: Most common definitions for MCS – (from 2001 onwards) ....................... 40
Table 2. 4: Four of the most commonly Cited and Used Frameworks in MCS Literature
........................................................................................................................................ 43
Table 3. 1: Problem areas and ways of containing tensions found in the case companies
........................................................................................................................................ 93
Table 4. 1: Assumptions of the two main research paradigms .................................... 104
Table 4. 2: Features of the two main research paradigms ............................................ 105
Table 5. 1: Assessing LT’s progress with Lean Management Implementation in its
Transformers Factory – Aspects 1, 2 & 3 ..................................................................... 139
Table 5. 2: Assessing LT’s progress with Lean Management Implementation in its
Transformers Factory – Aspects 3 & 4 ......................................................................... 140
Table 5. 3: Assessing LT’s progress with Lean Management Implementation in its
Transformers Factory – Aspects 5 & 6 ......................................................................... 141
Table 5. 4: Total Manufacturing Costs for LT Transformers Factory for Year 2009 . 148
Table 5. 5: Total Costs for LT Transformers Factory for Year 2009 .......................... 149
Table 5. 6: An extraction of factory used KPIs in years 2009 and 2010 as reported on
OPEX analyser .............................................................................................................. 151
Table 5. 7: An example of MPC calculation for the 500 KVA transformer ................ 153
Table 5. 8: An example of newly added performance measures used by LT
transformers factory in year 2014 ................................................................................. 154
Table 6. 1: Comparison of KPIs used from year 2009 to 2015 as extracted from factory
OPEX analyser .............................................................................................................. 163
Table 6. 2: Comparison between Unit Cost of a 500 KVA Transformer using
Traditional Costing and VSC. ....................................................................................... 171
Table 6. 3: Value Stream Analysis by Capacity Category for LT Organisation
Transformers Factory. ................................................................................................... 172
x
Table 6. 4: Time needed to Process Different Power Transformers in the Bottleneck
Process .......................................................................................................................... 173
Table 6. 5: Comparison between Unit Cost of a 500 KVA Transformer using
Traditional Costing, VSC and Features and Characteristics Costing ........................... 174
Table 6. 6: Comparison between Unit Cost of a 500 KVA Transformer using
Traditional Costing, VSC, FCC and ABC .................................................................... 179
Table 7. 1: List of human actors chosen for the study, the accounting information
systems they handle and the key responsible actor for each system ............................ 196
Table 7. 2: Different Perceptions of Organisation Key responsible actors on Costing
Practices used during different Periods of the Study .................................................... 198
Table 7. 3: Different Perceptions of Organisation Key responsible actors on OPEX
KPIs used during different Periods of the Study .......................................................... 199
Table 7. 4: Different Perceptions of Organisation Key responsible actors on ABACUS
and Internal KPIs used during different Periods of the Study ...................................... 200

xi
List of Abbreviations
Abbreviation Meaning 4Q Four Quadrants (approach) 5S Sort, Straighten, Shine, Standardize, Sustain
ABC Activity-based costing ABM Activity-based management ANT Actor-Network Theory BSC Balanced Scorecard CI Continuous Improvement
C/O Changeover time COPQ Cost of Poor Quality
C/T Cycle Time DPO Days of Purchases Outstanding DSO Days of Sales Outstanding EGP Egyptian Pound
F&Acc Finance and Accounting FCC Features and Characteristics Costing FPY First Pass Yield GMT Global Managing Team HV High Voltage JIT Just-in-Time KPI Key Performance Indicator KVA Kilo-Volt-Ampere LBU Local Business Unit
LMDT Large Distribution Transformer/s LOC Levers of Control LV Low Voltage MA Management Accounting
MAS Management Accounting System MC Management Controls
MCS Management Control System MDT Medium Distribution Transformer/s MPC Manufacturing Process Cost OP Operating team
OPEX Operation Excellence OTD On-Time Delivery
PGTR Product Group Transformers PMS Performance Measurement System
ROTD Requested On-Time Delivery RQ Research Question SAS Shared Accounting Services SDT Small Distribution Transformer/s SPC Statistical Process Control TPS Toyota Production System
TQM Total quality Management VSC Value Stream Costing VSM Value Stream Mapping

1
Chapter 1: Introduction
This research aims at developing a theoretical conceptualisation of the developments
in organisations’ management accounting system (MAS) in the context of lean
management, as an example of process innovation. This aim is motivated by work from
management accounting literature highlighting the lack of attention to the development
of an overall conceptualisation of management accounting and control systems (van der
Stede, 2015), and the need to develop more context related management accounting
research (Otley, 2016). This research also, responds to calls from lean management
literature to provide in depth empirical analysis on the management accounting
practices relevant to lean management (Fullerton et al., 2013; Tillema and van der
Steen, 2015), such as Value Stream Costing (VSC); the most recommended
management accounting practice to support a lean management environment (Maskell
and Kennedy, 2007; Debusk and Debusk, 2012; Fullerton et al., 2013). Finally, the
research seeks to contribute to work calling for developing theoretical
conceptualisations that succeeds to treat the social as a construction, and hence,
establishes a middle ground between the ‘implicit’ predictability embedded in using
contingency theory and the freedom associated with some grounded theory research
(Otley, 2016). In doing so, Actor-Network Theory (ANT) is chosen as the theoretical
lens for this research, together with Michel Callon’s (2007, 2010) performativity thesis.
As will be explained later in this chapter, ANT is chosen for this research, to help
present such conceptualisation as the pure interaction between different actors
associated with both lean management environment and MAS as they naturally occur,
viewing reality as a construction of different human and non-human actors (Latour,
1998; Latour, 2005). Hence, the main objectives of this research are to:
§ Develop a theoretical conceptualisation of the developments in MAS in the
context of lean management.
§ Investigate the role played by management accounting practices recommended
for lean, namely the Value Stream Costing (VSC) practice.
This chapter in divided into six sections. Section 1.1 provides a brief overview of
lean management. Section 1.2 overviews the literature on MAS in lean organisations
2
and discusses the contribution of innovation literature to this body of work. Both
sections 1.1 and 1.2 highlight the reasons for the need to meet the two research
objectives mentioned above. Section 1.3 outlines the research questions of this study. A
brief discussion of the research method used in this study is presented in section 1.4.
Section 1.5 presents an overview of actor-network theory as the theoretical lens chosen
for this research. The chapter ends up with a description of the structure of this thesis,
outlined in section 1.6
1.1 Lean Management – An Overview
As initially introduced by Toyota motors corporation, the term ‘lean management’
was first known as the Toyota Production System (TPS) (Womack et al., 1990;
Womack and Jones, 1996; Shimokawa and Fujimoto, 2009). In general terms, TPS was
used to denote a production approach aiming at waste elimination and meeting customer
demands (Hines et al, 2004). To Toyota, lean represented the compilation of
innovations – [including just-in-time (JIT), the use of Kanbans to promote pull
production and high levels of employee empowerment] – done in the corporation’s
shop floor (Hines et al., 2004), in response to the severe competition in Japanese
automobile market in 1940s and to expel the corporation’s wasteful mass production
system (Maskell and Kennedy, 2007; Shimokawa and Fujimoto, 2009).
The success of TPS lead to the spread of the system outside Toyota and its emulation
by other organisations, even those working outside the manufacturing sector (Hines et
al., 2004; Holweg, 2007; Alves et al., 2012; Malmbrandt and Ahlstrom, 2013; Bateman
et al., 2014). With the release of Womack and Jones’s (1996) book, the approaches used
by Toyota were highlighted under the five principles of what the authors called the ‘lean
enterprise’. These principles are; define customer value, identify value streams, keep the
production flow, the pull principle and the perfection/ continuous improvement
principle. The TPS was then known as lean production (Liker, 2004; Alves et al. (2012),
lean manufacturing (Bicheno, 2004) and lean management (Ward and Graves, 2004;
Grasso, 2005; Kennedy and Widener, 2008). Yet, even with the success of
manufacturing and service industries to apply lean management, our understanding of
the developments in an organisation’s MAS in the context of lean, is still ambiguous
(Fullerton et al., 2013). The available literature either from the academic or the
3
consultancy domain problematises the traditional accounting system to work with lean
management (Ahlstrom and Karlsson, 1996; Maskell and Baggaley, 2004; Johnson,
2006; Kennedy and Widener, 2008; Fullerton et al. 2013; Fullerton et al., 2014; van der
Steen and Tillema, 2018). This literature suggests either shedding traditional accounting
practices at all (Johnson, 2006), or using a simplified accounting system (Fullerton et
al., 2013; Fullerton et al., 2014) known as ‘lean accounting’ (Maskell and Baggaley,
2004; Grasso 2005; Maskell and Kenney, 2007; Kennedy and Widener, 2008).
However, neither the academic nor the consultancy literature succeed in developing an
overall theoretical conceptualisation of the construction and developments in an
organisation’s MAS in the context of lean. Additionally, both literatures lack an in-
depth empirical investigation of the role played by the main lean accounting/
management accounting practice; Value Stream Costing (VSC). Albeit the most
recommended ‘lean-tailored’/ lean accounting practice, VSC is still receiving very low
implementation rates (Rao and Bargerstock, 2011, Ruiz-de-Arbulo-Lopez et al., 2013).
Empirical research focusing on the use of VSC and factors affecting its success is
heavily needed (Ruiz-de-Arbulo-Lopez et al., 2013, Fullerton et al., 2013).
The next section overviews the literature on MAS in lean organisations and discusses
the contribution of innovation literature to this body of work
1.2 MAS, Lean Accounting and the Contribution of Innovation Literature – An Overview
The term management accounting system (MAS) and management control system
(MCS) are usually used interchangeably (Malmi and Brown, 2008; Chenhall and Moers,
2015). This research uses the term MAS defined as the systematic use of management
accounting with its various practices to achieve some organisation goal (Chenhall 2003,
p. 129; Malmi and Brown, 2008). The various definitions of MCS, diversity in control
categorisations, together with the variety of frameworks associated with the term ‘MCS’
has over the time caused a lack of precision and inconsistencies in MCS research
(Chenhall, 2003; Bisbe et al., 2007; Malmi and Brown, 2008; Tessier and Otley, 2012a)
and eventually resulted in frameworks acting more as guidelines for each organisation,
based on its needs and circumstances (Willert and Otley, 2016). Hence, focusing on a
simple definition of MAS suits the nature of this research linking lean management,

4
MAS and lean accounting literatures, which represents a literature integration on which
our academic and consultancy knowledge is still evolving (Chopra, 2013).
A discussion of the contribution of MAS literature to lean management, invites an
understanding of the form of organisation arrangement which lean management
represents, and the type of innovation to which lean management relates. In doing so,
the researcher has the objective of grasping an understanding of whether MAS literature
has contributed to the form of organisation arrangement which lean represents or to the
type of innovation to which lean belongs, searching for some guidance which can be
brought about to facilitate the conceptualisation of MAS in the context of lean. Hence,
looking at the bigger picture, the characteristics of a lean management system is that of
a horizontal organization arrangement (Chenhall, 2008). Additionally, lean management
is an example of process innovations defined as: the innovations associated with the
modification of organisations’ operating system or processes (Meeus and Edquist, 2006)
used in producing goods or services for the organisation’s customers (Damanpour and
Gopalakrishnan, 2001), with the objectives of reducing delivery times, decreasing
production costs and increasing operational flexibility (Boer and During, 2001).
Looking at lean as a horizontal organisation arrangement; one cannot develop a
rigorous understanding, nor find a comprehensive empirical analysis of the MAS
associated with lean management. According to Chenhall; ‘there are no studies that
have addressed, directly, how management accounting practices have been employed to
help configure horizontal organisations to achieve lateral coordination focused on
customers’ (2008, p. 539). At the same time, looking at lean as an example of process
innovations, one cannot find a theoretical conceptualisation of the developments in
MAS in the context of lean that accounts for the interactions of both human and non-
human actors and for the various roles played by the MAS’s practices. The analysis of
the literature on MAS and innovation shows that, this literature has not contributed
much to the study of lean management. This strand of literature first started by viewing
MAS as a mere reflection of the innovation adopted (Kaplan, 1984). Later work moved
to discussing the effect of innovation adopted on changing organisations’ MAS and
practices (Ahlstrom and Karlsson, 1996, Kennedy and Widener, 2008). Finally, recent
work views MAS’s practices and calculations as influencing the innovation
implemented (Briers and Chua, 2001; Mouritsen et al., 2009; Revellino and Mouritsen,

5
2015; Themsen and Skærbæk, 2018), they mediate between different organisations
actors and the innovation adopted (Vosselman, 2014) and lure people into making
different decisions (Revellino and Mouritsen, 2015). This later stream of literature is the
one relevant for this research, given its focus on the role played by VSC practice and on
conceptualising the developments in MAS in the context of lean, where management
accounting calculations are one of the actors in such conceptualisation. However, most
of this recent literature is not contextually lean driven.
As mentioned earlier, from a lean specific view point, the available work on lean and
MAS fall into two streams; academic (Ahlstrom and Karlson, 1996; Johnson, 2006;
Kennedy and Widener, 2008; Chiarini, 2012; Fullerton et al.; 2013, Ruiz-de-Arbulo-
Lopez et al., 2013; Fullerton et al., 2014; Tillema and van der Steen, 2015) and
consultancy literature (Baggaley and Maskell 2003a; Baggaley and Maskell 2003b;
Maskell and Baggaley, 2004; Grasso, 2005; Baggaley, 2006), where both promote the
use of a ‘lean-tailored’ accounting system, i.e. ‘Lean accounting’ (Maskell and
Baggaley, 2006; Kennedy and Widener, 2008; Fullerton et al., 2013). However, both
streams of literature present a discourse that problematises the use of traditional
accounting practices with lean management (Johnson, 2006; Maskell and Kennedy,
2007; Kennedy and widener, 2008; van der steen and Tillema, 2018). Yet, none of the
two streams provides an overall theoretical conceptualisation of organisation’s MAS in
the context of lean, nor can we find a detailed empirical investigation of how alternative
management accounting or lean accounting practices, such as VSC, would perform in a
lean environment.
1.3 Research Questions
As briefly discussed in the previous sections, when looking at the lean and
management accounting specific literature i.e. lean accounting literature or at the bigger
umbrella in which lean belongs in relation with MAS i.e. lean as a horizontal
organisation arrangement and process innovation, one cannot find a rigor understanding
nor a theoretical conceptualisation of the developments and operation of MAS in the
context of lean. Nor can one find an in-depth empirical analysis or explanation of the
role played by the lean accounting practice suggested to work with lean; VSC. Hence,
as mentioned earlier in this chapter, this research aims at:
6
§ Developing a theoretical conceptualisation of the developments in MAS in the
context of lean management.
§ Investigating the role played by management accounting practices recommended
for lean, namely the Value Stream Costing (VSC) practice.
Driven by these research objectives, the research seeks to develop an answer to the
following first research question (RQ1) associated with the first research objective:
RQ 1: How can we conceptualise the developments in organisations’
management accounting system (MAS) in the context of lean management?
In association with the second research objective, this research seeks to develop an
answer to the following second and third research questions (RQ2 and RQ3):
RQ 2: In a specific lean management setting, what is the performative role, if any,
of VSC calculations?
RQ 3: In a specific lean management setting, what factors might affect the
acceptance/rejection of VSC?
The next sections present an overview of the research method used and the
theoretical lens chosen to help achieve the research objectives and develop answers to
study research questions.
1.4 Overview of Research Method Used
This section presents an overview of the research method chosen for this research in
order to meet the research objectives and develop answers for its three research
questions. The research uses a longitudinal case study covering twelve years of lean
implementation in one of the factories of a leading multinational organisation for
automation and supply of electrical power components, operating in Egypt. The
organisation’s headquarters is in Zurich, Switzerland and it has subsidiaries in more
than 90 countries across the world. The longitudinal case study covers the period from
the start of lean implementation – year 2004 till end of year 2016. A longitudinal case
study is best suited for this research as it enables ‘…the researcher to examine change

7
processes within social, economic and political context’ (Collis and Hussey 2009, p.
78). This specially fits with the first research objective and question of this research on
the conceptualisation of the MAS developments in the context of lean. The way a
longitudinal case study allows researchers to ‘investigate the dynamics of a research
problem’ over a long-time period (Collis and Hussey 2009: p. 78) is not only useful in
meeting the first research objective, but is also beneficial in meeting the second research
objective and its associated research questions. As will be elaborated in chapters six and
seven, studying the case organisation over a long period of time, brought about dynamic
and rich set of data on the role played by VSC in different organisation circumstances.
Analysing these data in different circumstances and over a long period of time has
proved to be helpful in examining different factors affecting the adoption of VSC as
intended by the third research question.
The case study organisation is chosen on basis of its suitability to develop rich data
which help achieve the research objectives and answer the research questions. As will
be discussed in detail in chapter five, the case study organisation has gone through
different progressive stages of lean implementation since its adoption in 2004. In most
of the twelve years of the study period – more specifically from 2009 to 2016 – the
organisation has been trying to grasp an understanding of how its MAS with its
practices can operate with lean. This presented an excellent chance for the researcher to
study the developments in MAS in context of lean, as sought by the first research
objective and its associated research question (i.e. RQ1). Also, being of a multinational
nature, the data for the case organisation are thought to present different views from
local organisational actors in Egypt and global actors in Zurich. As will be seen in
chapters 6 and 7, the data for the case organisation has revealed different views of both
local and global organisation actors on the organisation’s MAS and role played by VSC.
Additionally, the researcher has been previously involved with the case organisation in
developing possible frameworks of management accounting practices including VSC,
as will be detailed in chapter six. This has established some understanding of the term
‘lean accounting’ and VSC among a sizable group of organisation’s actors; something
that is rarely found in most lean firms1 (Chopra, 2013; Rao and Bargerstock, 2013). Yet,
1 In this research, the term ‘lean firms’ is used to mean companies/ organisations implementing a lean management system.
8
facilitates the analysis of the role played by VSC practice and the factors affecting its
acceptance or rejection. The understanding of VSC by a group of organisation actors
together with the different views of global and local organisation actors on VSC, has
presented rich and dynamic data set that immensely facilitated the investigation of the
role played by VSC as targeted by the second research objective and its associated
research questions (RQ2 and RQ3).
1.5 Overview of Actor-Network Theory
This section presents a brief overview of actor-network theory (ANT) (Callon, 1986;
Latour, 1986, 1987, 2005) and of the rational for choosing it as the theoretical lens for
this research. The main claim of ANT is that “it is utterly impossible to understand
what holds society together without reinjecting in its fabric the facts manufactured by
natural and social sciences and the artefacts designed by engineers” (Latour 1996, p.
370). ANT is used as the theoretical lens of this research in order to be able to trace the
associations between both human and non-human actors (Latour, 1998; Latour, 2005)
related to the case organisation’s MAS and its operating system using lean. ANT’s flat
ontology (Modell et al., 2017, p. 68) places objects at the centre of the research
(Justesen and Mouritsen, 2011, p. 161). Hence, using ANT, non-human actors are as
important in their study and analysis as human ones. This forms one of the main reasons
for choosing ANT, since given the research objectives and questions focusing on the
developments in MAS involving interactions of people and various management
accounting practices – such as VSC –, there is a need to use a theoretical lens which
facilitates the understanding of non-human interactions, as much as, it does with human
ones
Additionally, ANT’s relational ontology (Callon 1987, p. 93) involves a
constructivism aspect where, reality is not only seen as relational, but also as being
“continuously constructed” (Law, 1992, Modell et al., 2017). Such continual
constructivism aspect of ANT allows for exploring developments experienced in MAS
and the role played by VSC as actors’ interactions change over time. This is quite
helpful given the longitudinal nature of the case study conducted in this research. Using
ANT, the developments in the organisation’s MAS are treated as an indeterminate and
ongoing process (Modell et al., 2017), which can only be understood by delving into the

9
dynamics of the stories of organisation’s actors as they tell them, “without imposing on
them a priori definition of their world-building capacities” (Latour 1999, p. 20).
In addition to ANT, as the main theoretical lens chosen for this research, the research
uses Callon’s (2007, 2010) performativity thesis. The use of Callon’s (2007, 2010)
performativity thesis seeks to provide a rich understanding of data related to the second
and third research questions on the performative role of VSC practice and factors
affecting its acceptance or rejection. Combining ANT and performativity thesis allows
the researcher to move beyond the idea of how MAS’s reality is constructed, to
analysing the trails and fabrics making up this construction. In doing so, the research
applies Latour’s (2005, p. 165) approach to ‘slowciology’ i.e. ‘going slow’/ ‘don’t
jump’ (Latour, 2005, p. 190), to better understand the trail of events and interactions
forming a construction. This is thought to help bring about rich interpretations of the
organisation’s MAS and practices, especially given the ambiguity of our knowledge of
the developments and operation of MAS and lean accounting practices as VSC, in a
lean context (Fullerton et al., 2013).
In this research, ANT is used on two levels. On the literature analysis level, the
research first uses ANT’s four moments of translation (Callon, 1986; Latour, 1986;
Latour, 2005) to develop a conceptualisation of the current discourse in both
consultancy and academic literature on the MAS associated with lean. This literature
driven theoretical conceptualisation aims at putting such discourse in context to
demonstrate the messages which the current literature on lean management, MAS and
lean accounting seem to suggest to its users. On the empirical level, Callon’s (1986) and
Latour’s (1986, 1996) four moments of translation are used to interpret data collected
from the case study conducted in this research. The research then uses Callon’s (1998a)
concepts of framing and overflow, together with performativity thesis (Callon, 2007,
2010) to develop an empirical driven theoretical conceptualisation of the organisation’s
MAS in the context of lean. Implications driven from these conceptualisations are then
used to develop answers for this study’s research questions.
Having overviewed the main research aims, research questions, research method and
the theoretical lens chosen for this research, the last section of this chapter presents the
structure of this thesis.

10
1.6 Thesis Structure
This section outlines the structure of the remaining chapters of the thesis. This thesis
is composed of eight chapters which are organised as follows:
Chapter two presents a review of the literature on both lean management, management
accounting system and lean accounting with its associated value stream costing practice.
The chapter details the various definitions of lean management, its history in the Toyota
corporation and the difficulties it faces with the traditional accounting practices.
Chapter two also discusses the reasons for focusing on MAS rather than MCS, it also
details how the literature on MAS and innovation literature is relevant to this research,
as briefly outlined in this introduction chapter.
Chapter three introduces ANT as the theoretical lens of this research. In doing so, the
chapter starts with a brief background of ANT. The chapter then discusses the ontology
of ANT and the reasons why it is chosen for this research, in comparison to alternative
theories. Chapter three defines ANT theoretical concepts used in this research,
including; actors, network and translations, in addition to discussing Callon’s (1998a)
concepts of framing and overflow and Callon’s (2007, 2010) performativity thesis. The
chapter also discusses key misconceptions about and critique to ANT and
performativity thesis. Callon’s (1986) and Latour’s (1986, 1996) four moments of
translation are then used in chapter three, to develop a literature driven theoretical
conceptualisation of the current discourse in both consultancy and academic literature
on the MAS associated with lean.
Chapter four discusses the research methodology. The chapter lays out the ontological
and epistemological stands of the research and details the research approach and design.
Chapter four also explains the reasons for choosing case study as method for this
research and discusses the approaches used for data collection and data analysis and the
role of researcher. The chapter concludes with a chapter summary that includes an
overall illustration of the research design adopted and discussed throughout the chapter.
Chapter five presents the background of the case study organisation chosen for this
research. The chapter presents the organisation chart and discusses the responsibilities

11
of key actors involved in this research. Chapter five also, discusses the primary key
findings from the case study in terms of; how the organisation manages its management
accounting information and the accounting information systems used for this, the
organisation’s progress with lean management implementation and the changes
witnessed in its management accounting system throughout the twelve years of the
longitudinal study period.
Chapter six uses the findings explained in chapter five and ANT’s moments of
translation (Callon, 1986; Latour, 1986; Latour; 1996), to discuss and analyse the events
and interactions making up MAS in the case study organisation. In this discussion more
findings driven from case study data are also elaborated. Interactions constructing the
organisation’s MAS involve many human and non-human actors. These interactions are
presented in the form of three major story plots. Story plots revolve around the drivers
of change in organisation’s performance measures, negotiations on its costing practices
throughout the study period and tension events experienced between organisation’s
accounting representatives and engineers. Chapter six discusses these three plots and
analyses them. The stories are then used to tailor the discussion in chapter seven.
Chapter seven presents a discussion of the research findings presented in chapters 5 and
6 and how they are used to develop answers for the study research questions. Chapter
seven uses Callon’s (1998a, 2007) concepts of framing and overflow and the
performativity thesis (Callon, 2007, 2010), to develop an empirical driven theoretical
conceptualisation of the developments in the case organisation’s MAS. Various
implications are driven from this conceptualisation which are used in this chapter to
develop answers for the study research questions.
Chapter eight concludes the thesis with a summary of the main objectives of the
research and how they have been met together with how the research questions have
been answered. The chapter discusses the main contributions of this research, presents
the research limitations and provides a discussion of directions for future research.

12
Chapter 2
Lean Management and Management Accounting System: A Review of
Literature
2.1 Introduction
Driven by the severe competition in the Japanese automobile market in 1940s and to
expel the myths behind a mass production system (Maskell and Kennedy, 2007;
Shimokawa and Fujimoto, 2009), the Toyota motors corporation came to ideas of the
Toyota Production System (TPS) (Womack et al., 1990; Womack and Jones, 1996;
Shimokawa and Fujimoto, 2009), which has been emulated by both manufacturing and
service institutions (Hines et al., 2004) and is currently known as ‘lean management’
(Ward and Graves, 2004; Grasso, 2005; Kennedy and Widener, 2008). In general
terms, lean management represents a philosophy (Ohno 1988, Liker, 2004) that seeks
the continuous improvement (Emiliani and Stec, 2005) and meeting customer demands
(Liker, 1996; Pettersen, 2009; Alves et al., 2012) through the elimination of any/ all
types of wastes (Womack et al., 1990; Liker, 1996; Shah and Ward, 2003). Even with
the wide spread of lean management in both manufacturing and services organisations,
our understanding of the developments in the MAS in the context of lean is still
ambiguous. The available literature either from the academic or the consultancy domain
problematises the traditional accounting system to work with lean management
(Ahlstrom and Karlsson, 1996; Maskell and Baggaley, 2004; Johnson, 2006; Kennedy
and Widener, 2008; Fullerton et al. 2013, Fullerton et al., 2014) and suggest either
shedding traditional accounting practices at all (Johnson, 2006) or using lean accounting
(Maskell and Baggaley, 2004; Grasso 2005; Maskell and Kenney, 2007; Kennedy and
Widener, 2008) as a ‘lean tailored’ accounting system (Fullerton et al., 2013; Fullerton
et al., 2014). However, neither the academic nor the consultancy literature succeed in
developing an overall theoretical conceptualisation of how a firm’s MAS works with
lean. Nor do they provide an in-depth investigation of the role played by the main lean
accounting practice; Value Stream Costing (VSC) and the factors affecting its
acceptance or rejection. Additionally, the management accounting (MA) literature has
not contributed much to our academic knowledge of the management accounting system
(MAS) associated with lean.
13
This chapter discusses these literature gaps by presenting a detailed review of the
literature on lean management, management accounting system (MAS) and lean
accounting. The chapter is divided into sixteen sections, sections 2.2 to 2.6 are devoted
to the review of lean management literature. Section 2.2 identifies the two perspectives
of defining lean. Section 2.3 explains the five main principles of lean. Section 2.4
discusses the history of lean, the role of Toyota and how lean has gradually moved to
non-manufacturing institutions. Section 2.5 focuses on the benefits and briers associated
with lean implementation. Finally, section 2.6 analyses the form of organisation
arrangement that lean management represent and the types of innovation to which it
belongs.
Sections 2.7 to 2.11 focus on the review of the MAS literature. Section 2.7 explores the
various definitions of a management accounting and management control system.
Section 2.8 reviews management control frameworks that are most commonly discussed
in the literature and explain the pattern in which these frameworks will be used in this
research. Section 2.9 discuss the various categorisations of the term ‘control’. A
comparison between the term MAS and MCS is presented in section 2.10 which also
explains the reason why this research choses the term MAS rather MCS. Finally, section
2.11 presents an analysis of the MAS and innovation literature to explore how this body
of literature can contribute to the study of lean as on type of innovations.
A review of the lean accounting literature is discussed in sections 2.12 through to 2.15.
Section 2.12 first starts by discussing the lessons learnt from organisations move from a
mass production system to lean, emphasizing the need for the new ‘lean tailored’
system; lean accountings. Section 2.13 discusses the definition of lean accountings.
Section 2.14 details the reasons behind the need for lean accounting and section 2.15
introduces the lean accounting value stream costing tool and discusses its operation. The
chapter then concludes with a final section: 2.16 which summaries the chapter and
identifies its key take points.

14
2.2 Lean Management Definition
The available literature on lean comprises divergent ways to define it (Pettersen,
2009; Bhamu and Sangwan, 2014). Lean was presented in a variety of names starting
from the Toyota Production System (TPS) (Womack et al., 1990; Womack and Jones,
1996; Shimokawa and Fujimoto, 2009), to lean production (Holweg, 2007), lean
manufacturing (Shah and Ward, 2003) and finally lean management (Grasso, 2005;
Fullerton et al., 2014). In simple terms, some authors would view lean as an approach to
organisation improvement via waste elimination, for example; Moore and Scheinkopf
(1998, p. 2) defined lean manufacturing as; “an approach that guides practitioners to
improve their organizations by focusing on the elimination of any and all waste”. In
more detailed terms, Hines et al. (2004, p. 994) described lean as;
This lean operations management design approach focused on the elimination of
waste and excess from the tactical product flows at Toyota (the Toyota “seven
wastes”) and represented an alternative model to that of capital-intense mass
production (with its large batch sizes dedicated assets and “hidden wastes”).
The Toyota seven wastes were then identified by a broad number of authors to include:
overproduction, inappropriate processing, defects, inventory, waiting, transportation and
unnecessary motion (Liker, 1996; Oliver et al., 1996; Standard and Davis, 2000; Grasso,
2005; Bhasin and Burcher, 2006; Pepper and Spedding, 2010). Other authors would
view lean as a practice (Simpson and Power, 2005), a framework (Hopp and Spearman,
2004) or more of a manufacturing paradigm (Seth and Gupta, 2005). From a broader
perspective lean is generally defined according to two main perspectives, one that views
lean as a way of “thinking” or more of a philosophy and another that views lean as a
“toolbox” (Shah and Ward, 2007; Pettersen, 2009). The philosophical view defines
what lean in concept, goals and principles is (Womack and Jones, 1996; Spear and
Bowen, 1999), while the “tool box” view is concerned with defining the tools and
management practices associated with lean management implementation (Shah and
Ward, 2003; Li et at., 2005).

15
2.2.1 Lean Defined as a Philosophy/ a Way of Thinking
Various authors view lean as a whole philosophy, one of the earliest attempts can
be traced to Womack et al. (1990). Even though to them lean was still known as lean
production yet, they had the perception that it constitutes a dynamic process of change
that is backed up with a systematic set of principles and practices targeting continuous
improvement. To them, “the lean producer…combines the advantages of craft and
mass production, while avoiding the high cost of the former and rigidity of the latter”
(Womack et al. 1990, p. 13). Later, there have been different views on lean which can
fit within the philosophical perspective. These views include how lean was defined as a
model, a system and a whole philosophy.
Viewed as a model, Womack and Jones (1994, p. 1-2) introduced a new deployment of
the lean production system which they called the “Lean enterprise”. According to them;
Applying lean techniques to discrete activities is not the end of the road.
……value-creating activities can be joined, but this effort will require a new
organizational model: the lean enterprise.
……the lean enterprise is a group of individuals, functions, and legally separate
but operationally synchronized companies. The notion of the value stream defines
the lean enterprise. The group's mission is collectively to analyse and focus a
value stream so that it does everything involved in supplying a good or service
(from development and production to sales and maintenance) in a way that
provides maximum value to the customer.
More recently Alves et al. (2012) defined lean from the viewpoint of workers
engagement, in other words how the role of the workers contributes to the whole lean
model of individuals, functions and practices. According to Alves et al. (2012, p. 219-
220), lean production represents;
A work organization model where the worker assumes a position of thinker,
continuously looking for improvement and continuously looking for wastes, by
reducing wastes, the company will be prepared to accommodate changes and will
attain agility; the ability to quickly react to technical or environmental
unpredictable problems or difficulties.

16
Simultaneously there were authors who found defining lean as a system better serves
their holistic view about lean. For example, Cooper (1996, p. 28-29) define lean as;
Lean production is a system designed to compete on the assumption that sustained
product advantage is unlikely; rather than avoid competition, the lean producer
faces it head-on. Just as mass producers compete differently from craft producers,
lean producers compete differently from mass producers. Mass producers create
stove pipes; lean competitors develop overlapping systems (for cost, for quality,
for design, for production) that create intense pressure on all elements of cost.
Here Cooper’s (1996) perception of lean being a system is mainly driven by the holistic
way of how lean targets elements of cost, quality, design and production acting as an
enabler for organizations to face competition. On the other hand, Emiliani and Stec
(2005) would designate lean being a system owing to the holistic approach lean exhibits
in adding value to all its stakeholders. In this sense lean is defined as:
A management system designed to be responsive to the needs of humans in
business and deliver better outcomes for key stakeholders such as associates,
suppliers, customers, investors and communities. It is rooted in two key principles
– continuous improvement and respect for people (Emiliani and Stec, 2005, p.
371)
From a system’s viewpoint, Shah and Ward’s (2007, p. 791) defined lean as; ‘an
integrated socio-technical system’ with the objective of eliminating wastes through the
concurrent reduction or minimization of variability achieved at any of the internal,
customer or suppliers’ fronts. Such definition captures both premises i.e. a socio-system
that targets all organization stakeholders and a technical-system that encompasses the
tools enabling organization competition. Shah and Ward (2003, p. 130) comment that
some literature promoting the idea of lean targeting waste elimination and the respect
for all organization stakeholders would view lean as a whole philosophy defining it as
“a philosophy that focuses on avoiding seven cardinal wastes and on respecting
customers, employees and suppliers”. On the other hand, there have been authors who
defined lean as a whole philosophy almost about the time Womack and Jones (1996)
published their book on the lean enterprise. For example, Liker (1996, p. 481) defines
lean as a ‘philosophy’ that succeed to reduce the time a firm needs from customer order
17
to delivery through the elimination of the sources of wastes achieved in a production
flow.
Liker (1996) viewed lean as a philosophy from the perspective of how it eliminates
waste in the whole value chain i.e. from customer order to delivery, albeit not being
literally put in value chain terms. Comm and Mathaisel (2000, p. 122) then described
lean within such context as; ‘a philosophy intended to reduce cost and cycle time
significantly throughout the entire value chain while continuing to improve product
performance’. Detty and Yingling (2000, p. 429) then offered a holistic definition of
lean as a philosophy reporting that; “Lean manufacturing is a comprehensive
philosophy for structuring, operating, controlling, managing and continuously
improving industrial production systems”. Despite that, Detty and Yingling’s definition
tend to enclose lean application to industrial production systems at that time, their
definition mirrors the broad view of how lean spams various organization aspects as a
whole philosophy.
A common theme in all previously discussed lean definitions is that almost all of them
stress on lean being a philosophy that targets waste elimination in all its kinds and
achieving customer value to help improve the organizations wellbeing. Lean should be
regarded as a whole philosophy since the cooperation of all business units and
stakeholders including; workers, employees and suppliers committing to the change, is
needed for such lean targets to be achieved. In all these definitions, waste or “Muda” in
Japanese terms (Womack et al., 1990) represents; “anything other than the minimum
amount of equipment, materials, parts, space and time which are absolutely, essential to
add value to the product” (Russell and Taylor 2000, p. 737). In more general,
nonautomotive terms; waste includes everything or any activity that is perceived by
customers as non-value adding when compared to their needs and preferences (Emiliani
and Stec, 2005; Alves et al., 2012).
2.2.2 Lean defined as a “Tool-Box”
According to Shah and Ward (2003, p. 129) lean is defined as “a multi-
dimensional approach that encompasses a wide variety of management practices,
including just-in-time, quality systems, work teams, cellular manufacturing, supplier
18
management, etc., in an integrated system. The core thrust of lean production is that
these practices can work synergistically to create a streamlined, high quality system
that produces finished products at the pace of customer demand with little or no waste.”
Pettersen (2009, p. 133) also comment that to most practitioners lean manufacturing
tends to be defined as “a set of waste reduction tools”.
The most prevailing attempts to define the frequently used lean practices relate to the
work of Shah and Ward (2003) and Pettersen (2009). Shah and Ward (2003) concluded
22 practices among the frequently discussed lean practices used within a lean
management system. They found that JIT/continuous flow production, pull system,
Kanbans and quick changeover techniques come at the top of the most frequently used
lean practices, while safety improvement methods came among the least frequently used
ones. Later, Pettersen (2009) made a more detailed analysis of the common practices
constituting lean. To Pettersen, JIT, continuous improvement, setup time reduction, pull
system, failure prevention and production levelling represented the most frequently
mentioned lean practices.
Accordingly, there are commonly shared practices that are used by most companies
implementing lean management, like: JIT, pull system, the use of Kanbans and the
pursuit of continuous improvement efforts. Most of these practices re related to the
main five principles of the lean management system discussed later in this chapter. On
the other hand, while there might be a conceptual definition for lean which makes it a
separate concept identifiable from others like TQM for example, there are no agreed
upon set of practices that shall accompany lean implementation in all organizations
(Pettersen, 2009). This could be attributed to various reasons; first according to Hines et
al. (2004) lean as a concept is evolving and will still evolve as more companies and
different industries start applying it. Second, there should be a maturity path to lean in
which enterprises move steadily from mass production to lean thinking and the
approaches on how to move to lean and which practices to be adopted differ from one
company to another (Maskell and Baggaley, 2004). Third is the fact that Toyota’s
executives their own selves had no designed plan in mind when they arrived at the idea
of lean (Shimokawa and Fujimoto, 2009). They were just experimenting with ideas to
face Toyota’s financial crisis and achieve Toyota’s goals at that time. To Taichii Ohno,
one of the main founders of the TPS, the process of reaching the principles of the
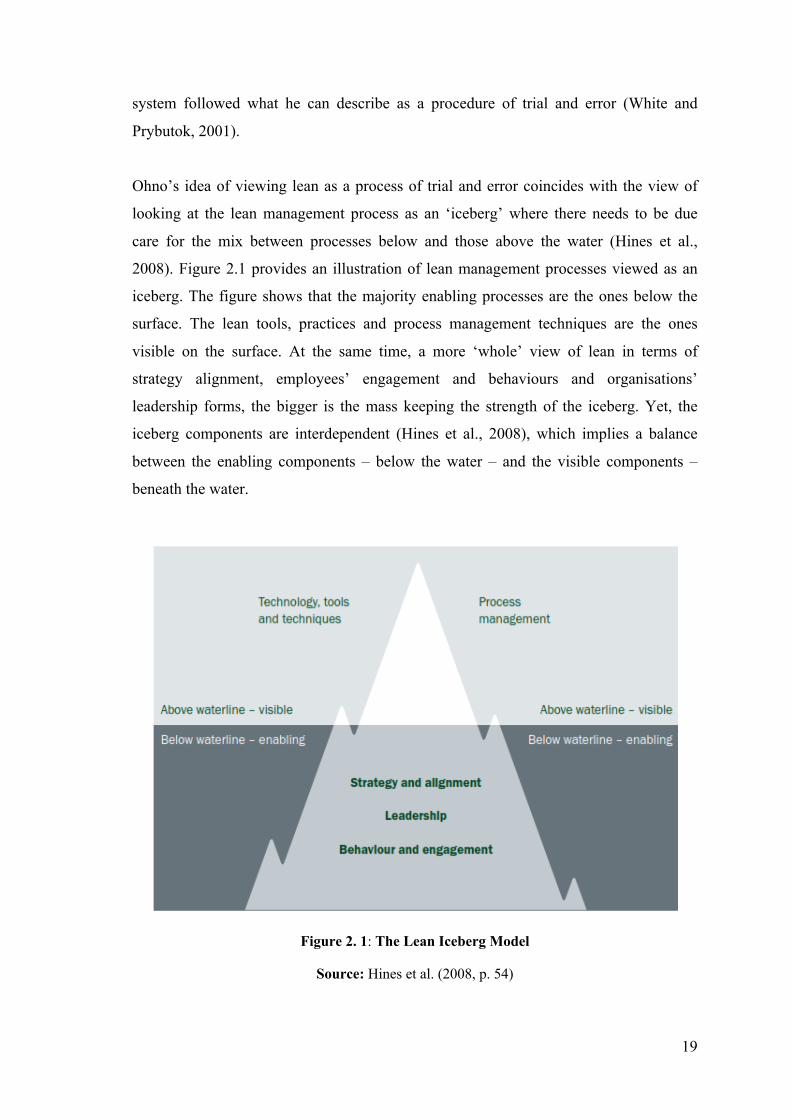
19
system followed what he can describe as a procedure of trial and error (White and
Prybutok, 2001).
Ohno’s idea of viewing lean as a process of trial and error coincides with the view of
looking at the lean management process as an ‘iceberg’ where there needs to be due
care for the mix between processes below and those above the water (Hines et al.,
2008). Figure 2.1 provides an illustration of lean management processes viewed as an
iceberg. The figure shows that the majority enabling processes are the ones below the
surface. The lean tools, practices and process management techniques are the ones
visible on the surface. At the same time, a more ‘whole’ view of lean in terms of
strategy alignment, employees’ engagement and behaviours and organisations’
leadership forms, the bigger is the mass keeping the strength of the iceberg. Yet, the
iceberg components are interdependent (Hines et al., 2008), which implies a balance
between the enabling components – below the water – and the visible components –
beneath the water.
Figure 2. 1: The Lean Iceberg Model
Source: Hines et al. (2008, p. 54)

20
Indeed, there is a plethoric number of lean definitions in literature with different
objectives and scopes and different practices and tools targeting waste elimination and a
variety of other objectives (Bhamu and Sangwan, 2014). A considerable number of lean
literature review papers tried to analyse these definitions (Hines et al. 2004; Shah and
Ward, 2007; Pettersen, 2009; Bhamu and Sangwan, 2014) and they would mostly admit
a real difficulty in capturing them all (Bhamu and Sangwan, 2014). Reaching a
conclusion that; even with the vast number of lean definitions there is no consensus on
one that fits all organization needs (Pettersen, 2009). Yet, most lean authors would
recommend that academics and practitioners view lean from the philosophical angle
(Ohno, 1988; Vasilash, 2000; Liker, 2004; Bhasin and Burcher, 2006) rather than the
toolbox one. Bhasin and Burcher (2006) literally trace some failures to lean
implementation to implementers default to treat lean as a philosophy not just another
tactic, process or strategy that one can use occasionally to target a group of end results.
Bhasin (2012, p. 454) demonstrates that; “every organisation’s Lean journey is unique
and to simply recommend replicating another organisation’s processes would be
imprudent since the cultures, organisational pressures and supporting infra-structures
vary. Evidently, by concentrating on the tangible outcomes, organisations lose sight of
the intangible aspects of change and culture and in particular that companies comprise
of people”. Liker (2004) also suggests that the way to a lean organisation should
involve the right mixture of people, processes, a long-term philosophy and approaches
to problem solving. This coincides with how Seddon et al. (2011, p. 42) describe the
means leading to lean implementation as something that should be “experimental, empirically-based and emergent (as change was for Taiichi Ohno) in contrast to ‘project
managed’ or predetermined change”. Hence, this research follows Ohno’s (1988;),
Vasilash’s (2000) and Liker’s (2004) view of lean management as a ‘philosophy’ that
has no simple rule guarded model (Maskell and Baggaley, 2004), but is mainly
dependent of each organisation journey which will typically take into account the
lessons learned from the Toyota corporation experience.
2.3 Lean Management Principles
In their Book, “Lean thinking” Womack and Jones (1996) identified five main
principles of a lean which are: (1) specify the customer value, (2) identify the value
stream, (3) keep the process flow, (4) the pull principle and (5) the perfection principles

21
(Womack and Jones, 1996; Haque and Moore, 2004, Alves et al., 2012). This section
presents a brief discussion on each of these principles.
2.3.1 Specify the Customer Value
The first lean principle targets defining what constitutes a value adding activity
from the perspective of the customers (Haque and Moore, 2004; Maskell and Baggaley,
2004). Traditionally this has always meant freeing the production process from any
activities that are perceived as “muda” or waste, i.e. reducing costs through waste
elimination (Hines et al., 2004; Bicheno, 2004). However, an evolution of lean did
strengthen the customer focused mind set. That is; even if an activity seemed wasteful
or costly from a shop-floor viewpoint, it is only the customer who shall define what
constitutes a wasteful activity and what does not. Even in cases where the buyer is not
the user of the product or service, a lean perspective defines value as perceived by both
the buyer and the end user (Emiliani and Stec, 2005).
Ward and Graves (2004, p. 4) quotes Womack and Jones comment on how lean
companies apply the first lean principle stating that lean companies;
Precisely define value in terms of specific products with specific capabilities
offered at specific prices through a dialogue with specific customers.
Hines et al. (2004) show that the lean value principle is not only about eliminating
wasteful activities and reducing costs from the shop floor viewpoint. Fulfilling the value
principle shall also include adding more activities and features that shall not be always
costly, yet they do increase the customer’s value proposition of the product or service
provided. Examples of these activities include; offering shorter delivery cycle times or
smaller delivery batches.
2.3.2 Identify the Value Stream
The second principle of lean focuses on aggregating all value adding activities
needed to produce a product or provide a service in one value stream. Such process
includes the removal of all wasteful and non-value adding activities included in offering
products or services (Bicheno,2004; Haque and Moore, 2004; Bicheno and Holweg,
2016). Kennedy and Brewer (2006, p. 66) define a value stream as;

22
A value stream represents all activities and resources consumed from the time a
customer order is received until the product is delivered to the customer. This
includes accounting, sales, purchasing, and receiving as well as all steps in
production including support areas such as maintenance and distribution.
To Maskell and Baggaley (2004, p. 105) the ideal value stream is the one including “…
all the steps required to create value for the company’s customer for a family of
products. These products are a family because they all require similar steps through the
value stream”. Figure 2.2 represents an illustration of how a value stream should mostly
look like. A typical format of a value stream shall start from sales or order entry till
product shipment or service delivery and shall even include after sales/delivery support
services. It is usually unadvisable to identify value streams revolving around operation
processes solely.
Companies matured with lean even extend their value streams to include customers and
suppliers (Maskell and Baggaley, 2004). Value Stream Mapping (VSM) represents the
lean tool most related to this second principle. Rother and Shook (2003) define VSM as
a tool used to help visualize the whole operating process including both material and
information flow. It is aimed at improving process operation through a three steps
approach of detecting sources of waste; 1) select a relevant product family for
improvement, 2) use actual operating process to extract information useful for mapping
the current product family value stream state and 3) construct a future potential map for
the targeted family value stream.
Mcdonald et al. (2002) used a dedicated product family line in a small company to
demonstrate how the use of some technological approaches like simulation can
complement VSM and help envisage more dynamic features of the product family
future state value stream. An idea also emphasized by Abdulmalek and Rajgopal
(2007). VSM not only provides a way for pinpointing waste sources subject to future
elimination, but also serves as an approach to improvement through the development of
product families future state maps. An operating way that highly matches the Japanese
concept of “Kaikaku”, which entails the continuous inspection and questioning of
production processes for purposes of discovering non-value adding activities and
improving the system’s value adding ones (Moore and Scheinkopf, 1998, Bicheno,

23
2004). However, Pepper and Spedding (2010) would view the idea of integrating
complex software such as simulation modelling with VSM a bit of time consuming
which can affect the validity of the mapped model to provide timely data for potential
change.
Figure 2. 2: Typical Format of a Value Stream
Source: adapted from (Maskell and Bagagely 2004, p. 95)
After sales support
Customer service
Schedule Configure
product Order entry
Sales Purchase materials
Production engineering
Quality Assurance
Cost accounting
Production Planning Material
handling Manufacture
product Ship
product to customer
Invoicing
Collect Cash Maintenance

24
A next step following mapping of the value streams should be the division of machinery
and equipment into cells included in each value stream so that people involved in each
value stream i.e. value stream teams can be identified (Kennedy and Brewer, 2006). An
ideal value stream shall include every person who aids in creating a customer value and
it is quite common that there are shared personnel across value streams as it perceived
that such condition will be eliminated through cross training programs whenever the
organization is short of skilled people and the more it gets acquainted with lean
implementation (Maskell and Baggaley, 2004).
At the same time, even with the benefits of VSM as a tool supporting the second lean
principle, Pepper and Spedding (2010) will not still qualify having a powerful set of
value stream maps as lean. A true implementation of lean for them is the one that has a
holistic understanding of the lean philosophy.
2.3.3 Keep the Flow of Process
The third principle of lean aims at sustaining a rapid smooth flow of the
production process. In other words; “Make the remaining value creating steps flow”
(Haque and Moore 2004, p. 1387). This lean principle seeks to optimize the three types
of flow within a value stream; the flow of information, the physical flow of materials
and other inventory and the flow of cash so that the whole pace of the process of
creating customer value is maintained effectively (Maskell and Baggaley, 2004). This is
done through replacing clusters of functional departments with cellular teams, where a
number of cells are responsible for the production of a certain product within the value
stream which shall motivate a smooth “Single Piece Flow” of the product within the
value stream (Bicheno, 2004). This means that whenever work is done over a product in
a certain cell, the product is moved to another cell when this cell is vacant, i.e. having
available space ready to complete working on the product. The idea of single piece flow
minimizes the effect of inventory queues consequently decreasing production time and
speeds up customer delivery time (Kennedy and Brewer, 2006).
A famous tool associated with the flow principle is the 5S practice. The 5S includes the
five key aspects explained in Table 2.1, which collectively aim at alleviating the
disorganization slack within lean firms. According to Eaton and Carpenter (2000) an
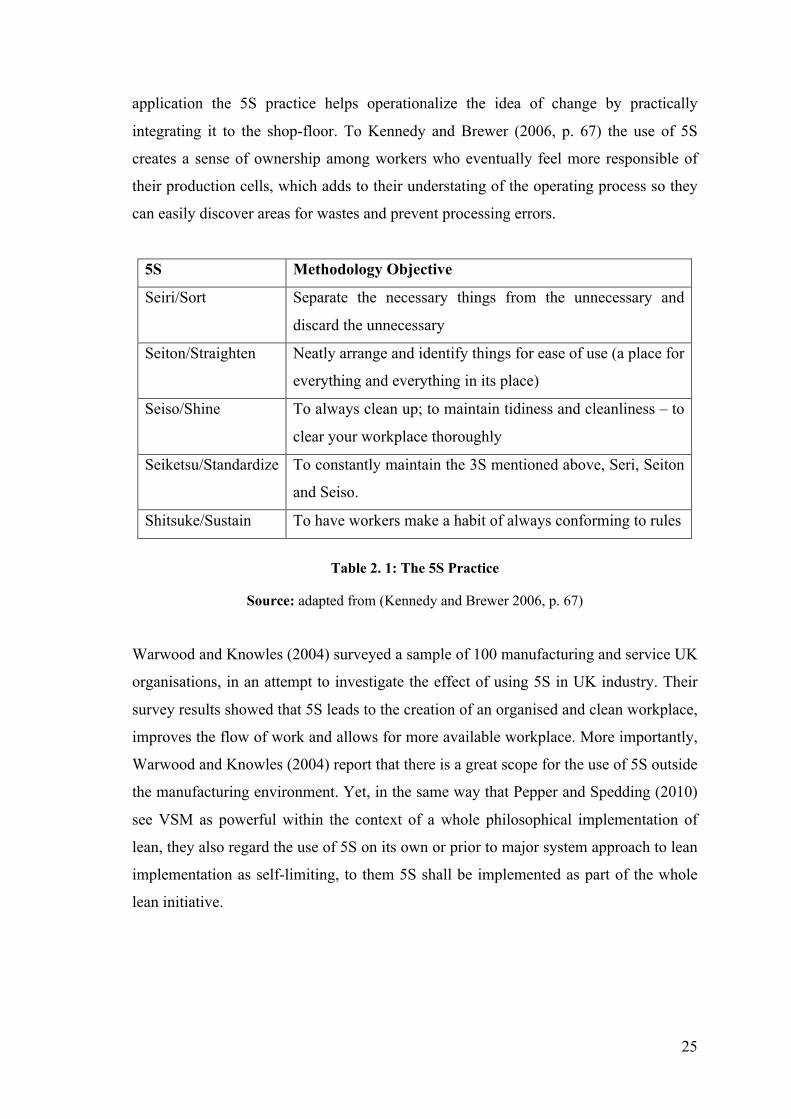
25
application the 5S practice helps operationalize the idea of change by practically
integrating it to the shop-floor. To Kennedy and Brewer (2006, p. 67) the use of 5S
creates a sense of ownership among workers who eventually feel more responsible of
their production cells, which adds to their understating of the operating process so they
can easily discover areas for wastes and prevent processing errors.
5S Methodology Objective
Seiri/Sort Separate the necessary things from the unnecessary and
discard the unnecessary
Seiton/Straighten Neatly arrange and identify things for ease of use (a place for
everything and everything in its place)
Seiso/Shine To always clean up; to maintain tidiness and cleanliness – to
clear your workplace thoroughly
Seiketsu/Standardize To constantly maintain the 3S mentioned above, Seri, Seiton
and Seiso.
Shitsuke/Sustain To have workers make a habit of always conforming to rules
Table 2. 1: The 5S Practice
Source: adapted from (Kennedy and Brewer 2006, p. 67)
Warwood and Knowles (2004) surveyed a sample of 100 manufacturing and service UK
organisations, in an attempt to investigate the effect of using 5S in UK industry. Their
survey results showed that 5S leads to the creation of an organised and clean workplace,
improves the flow of work and allows for more available workplace. More importantly,
Warwood and Knowles (2004) report that there is a great scope for the use of 5S outside
the manufacturing environment. Yet, in the same way that Pepper and Spedding (2010)
see VSM as powerful within the context of a whole philosophical implementation of
lean, they also regard the use of 5S on its own or prior to major system approach to lean
implementation as self-limiting, to them 5S shall be implemented as part of the whole
lean initiative.

26
2.3.4 The Pull principle
The pull principle of a lean means that customer orders shall pull the production
of products (Bicheno, 2004; Kennedy and Brewer, 2006, Alves et al., 2012; Bicheno
and Holweg, 2016). In other words, products and services are processed not only in the
way customers want them but also only when customers order them (Womack and
jones, 1996; Haque and Moore, 2004). Some authors define a system as being lean or
not on basis of the extent to which it succeeds in decreasing buffering costs associated
with the production of more goods and services (Hopp and Spearman, 2004). De
Treville and Antonakis (2006, p. 102) define lean as;
Lean production is an integrated manufacturing system that is intended to
maximize the capacity utilization and minimize the buffer inventories of a given
operation through minimizing system variability (related to arrival rates,
processing times, and process conformance to specifications).
Variability is regarded as the main cause of increasing buffering costs (Hopp and
Spearman, 2004; De Treville and Antonakis, 2006). Hopp and Spearman (2004) report
that variability can be present in anything that is not regular and predictable in the
system which can be caused by either internal factors (setups, rework, scheduled and
unscheduled downtime, production rates fluctuations caused by operators…etc.) or
external ones (customer change orders, producing variable products in response to
market needs…etc.). To them regardless of the sources of variability it shall be buffered
in some sort of a way. That is why the fourth lean principle of pull works effectively
after the flow principle. As Seddon (2003) reports; Ohno’s solution to the variability
problem in Toyota was to put variety in line with the process, a thing that cannot
feasibly be sustained without the cooperation of both the flow and pull principles.
“Takt time” and the use of “Kanban” systems represent the lean practices usually
associated with the pull principle. Takt time is computed using the available production
time divided by the rate of customer demand per day (Moore and Scheinkopf, 1998). In
other words, the takt time is the rate at which the customer demands a product, which
helps companies identify the pace of production. Kanbans represent “A signal from a
downstream process in the production line that indicates to an upstream process that it

27
needs to have parts replenished” (Maskell and Baggaley 2004, p. 100). Kanbans help
control inventories through the use Kanban cards restricting the quantity of inventory
moving and being processed on the shop floor.
At the same time, Hopp and Spearman (2004, p. 141-142) criticize the way
organizations tend to view the pull principle as equivalent to just the idea of “make-to-
order”, which they perceive as one of the reasons why various organizations would see
having a Kanban system as the exact operationalization of the lean pull principle.
Holweg (2007, p. 432) regard the lean concept as “the outcome of a dynamic learning
process that adapted practices”, which shall explain why Hopp and Spearman (2004)
tend to stick Ohno’s view of the pull principle as strategic rather than tactic, through
which Ohno meant that organizations shall generally “level” production and demand so
as to meet variety of demands.
2.3.5 The Perfection Principle
The fifth principle of lean seeks the pursuit of perfection through the continuous
removal of all forms of waste (Womack and Jones, 1996; Haque and Moore, 2004;
Hines at al., 2004). Since the preceding four principles will eventually make more
capacities available and potentially reduce effort, time, cost, space and processing errors
then new improvement opportunities can be offered. So, the perfection principle urges
lean adopters to always focus on continuous improvement activities in order to make the
best use out of available capacities and still offer value adding products and services to
their customers. Most lean firms seek continuous improvement “Kaizen” efforts to
sustain the perfection principle of lean (Bicheno, 2004). Kaizen is the Japanese word for
“continuous improvement” (Womack and Jones, 1996; Liker, 2004; Suarez-Barraza et
al., 2009) which represents a philosophy that targets the improvement of all the business
functions that support the conversion of inputs into final output products (Stevenson,
2005).
Lean firms use kaizen tools to continuously improve their operating processes,
eliminate wastes and achieve high profitability levels (Emiliani and Stec, 2005) and
thereby achieve better competitive positions. The lean perfection principle also seeks
the use of continuous improvement/kaizen efforts to empower employees and front-line

28
workers through cross-training programs. Such improvement efforts develop
opportunities for problem solving (Staats et al., 2011) and motivate employees to get
involved in quality related decisions that help improve the operating process
continuously (Baggaley, 2006). Continuous improvement and the development of
multifunctional teams are very crucial aspects of lean thinking (Baggaley, 2006), even
with regard to managing lean service institutions (Bowen and Youngdhal, 1998,
Ahlstrom, 2004; Liker and Morgan, 2006). As reported by Malmbrandt and Ahlstrom
(2013, p. 1150); “the participation of employees in improvement teams where problems
are brought up and systematically solved by the people that actually do the work is the
basis of this lean principle”.
2.4 Toyota Production System and the Spread of Lean Management
Reminiscing his experience with developing lean i.e. the then known as Toyota
Production System (TPS), Taiichi Ohno, Toyota’s executive and one of the main
founders of the TPS reports that it all began since the year 1943. It was during wartime
when Toyota gave more focus to its vehicles production and sought to catch up with the
U.S. automobile production (Shimokawa and Fujimoto, 2009). Productivity levels in the
U.S. automobile industry were almost ten times higher than that of the Japanese. That is
why Taiichi Ohno reckoned that such large productivity gap cannot be solely attributed
to equipment productivity factors. Consequently, Ohno focused on a whole
modification process for Toyota’s production system (Womack et al., 1990; Shimokawa
and Fujimoto, 2009).
Together with other mentors of the TPS, Taiichi Ohno paid several visits to American
automobile companies to learn more about the industry and through their journeys they
concluded that mass production system is not be able to manifest with their Japanese
market requiring a relatively high level of diversified products that come in low
volumes (Alves et al., 2012). As Kennedy and Brewer (2006) suggest, Toyota was
dispelling the myths behind a mass production system. From its financial crisis, during
the 1940’s (Shimokawa and Fujimoto, 2009), Toyota has learnt the essentiality of
leveling purchasing and production to only the amount of goods demanded by
customers and such goods should be produced at the time in which they are required to
be sold. That is why the TPS was first acknowledged as Just-in-Time (JIT) (Fullerton

29
and Kennedy, 2009; Kennedy and Widener, 2008). JIT represents “a manufacturing
program with the primary goal of continuously reducing, and ultimately eliminating all
forms of waste” (Shah and Ward 2003, p. 137). Waste elimination here means the
alleviation of those wastes accompanying the piling of unnecessary and un-demanded
inventory in all its forms (Shah and Ward, 2007). Toyota started to use JIT practices to
help level its production to the demands of customers. Then other practices including
kanbans, flexible workforce and automation (Monden, 1998) began to spread across
other western countries in what became known as the “Japanese system” (Womack et
al., 1990).
Toyota’s focus on implementing a JIT approach to manufacturing was coupled with the
application of a whole quality control system that made sure products were produced
just in the quantity, quality and time demanded by the customers. Consequently,
production emphasis shifted from producing huge volumes of a limited interval of
products to turning out small volumes of a multiple range of demanded products
(Shimokawa and Fujimoto, 2009). Womack, Jones and Roos (1990) then introduced the
TPS or as they called it: “lean production”, in their book “the Machine that Changed the
World”, followed by Womack and Jones’s (1996) “Lean Thinking” describing the main
five lean principles and introducing the idea of the lean enterprise. Noteworthily,
Taiichi Ohno was always reluctant to record some data explaining the tools Toyota
used, in fear that writing the tools down may lead to “crystallizing” the concept (Ohno,
1988). This is what was referred to as ‘codifying’ lean as a method (Seddon and
Caulkin, 2007; Seddon et al., 2011). To Ohno the TPS was more of a strategic journey
not just a toolkit. In developing the TPS he also focused on establishing a system that
secures the full respect of all employees through promoting their participation in
running the operation process as well as continuously improving it (Sugimori, 1977).
The TPS has evolved a lot since then. It integrated some of Henry Ford, Charles
Sorenson and Fredrick Taylor’s key practices and added its own experience to evolve
into a whole management strategy that’s not explicitly enclosed to manufacturing
operations (Emiliani and Stec, 2005). It was obvious to manufacturers that with
increasing global competition, a mass production system includes universal pitfalls that
are being faced everywhere, consequently most western manufacturers started to adopt
the lean thinking outside Japan and even outside the automotive industry (Hines et al.,
2004).
30
Even though the roots of lean thinking lie within manufacturing it has eventually been
adopted by various service institutions (Holweg, 2007; Alves et al., 2012; Malmbrandt
and Ahlstrom, 2013; Bateman et al., 2014). To Barrosso et al. (2010, p. 4-5), the same
lean production purposes of waste reduction and enhancing companies’ competitiveness
are easily be moved to services. Seddon and Caulkin (2007) also view the use of lean
thinking as one of the most suitable ways to resolve problems related to the
conventional way of managing services. Lean literature tackles several types of
applications and service institutions including; new product development (Salgado and
Dekkers, 2018), hospitals (Bowen and Youngdahl, 1998; Spear, 2005), Military services
(Bateman et al., 2014), health care services (Kolberg et al., 2007; Grove at al. 2011;
Robinson et al. 2012; Burgess and Radnor, 2013; Narayanamurthy and Gurumurthy,
2018), pharmaceutical industry (Rybski and Jochem, 2016), food industry (Bowen and
Youngdahl, 1998; Ming-Te at al., 2013), airline services (Bowen and Youngdahl,
1998), banking (Bortolotti and Romano, 2012) and financial services (Delgado et al.
2010), telecommunication (Psychogios at al., 2012), software services (Staats et al.,
2011) and higher education (Hines and Lethbridge, 2008; Cooper, 2009; Barrosso et al.,
2010). Even with call centres, Piercy and Rich (2009) tested the applicability of lean
thinking in a pure service environment through conducting a case study of call centres
related to three UK financial service institutions. They concluded that, the use of lean in
these call centres is able to resolve the cost-quality trade-off usually experienced in
managing the majority of service institutions. Various authors would agree that,
healthcare represents the major sector involved in lean service literature (Radnor and
Walley, 2008; Malmbrandt and Ahlstrom, 2013). Be it in services or manufacturing
organisations, most lean firms have reported similar benefits and major common
barriers to its implementation. The next section explores these benefits and barriers to
lean implementation.
2.5 Benefits versus Barriers of Applying Lean
The implementation of a lean management has contributed to a lot of benefits for its
adopters. From a manufacturing viewpoint, such benefits include producing fewer
defective products, reducing the probability of receiving defective parts from supplier
firms (Oliver et al., 2002; Emiliani and Stec, 2005) and improving labour productivity
(Shah and Ward, 2003; Oliver et al., 2002). As cited in Bhasin and Burcher (2006); to

31
Hanson and Voss (1998) the use of various practices of lean production can be directly
related to improving firms’ performance. More generally speaking, the use of lean has
been reported to help in creating a better understanding of the business processes for
labour workers, decreasing processes cycle time and better matching customers delivery
dates (Shah and Ward, 2003). In addition to cost reduction, increasing profitability rates
and developing new core competences for lean firms (Emiliani and Stec, 2005). The
real contribution of lean is in its ability to strengthen the overall system in which it is
being implemented, suggests Meier and Forrester (2002). To them, lean is able to
pinpoint any system short comings if it is to be applied properly. Detty and Yingling
(2000) also report that the use of lean contributes to employee empowerment,
developing organizational learning opportunities and aids in revising the way
management, roles and information systems are being structured. Various authors also
report that using lean helps improve organisations competitiveness (Liker, 1996; Oliver
et al., 1996; Standard and Davis, 2000; Vasilash, 2001; Liker, 2004).
On the other hand, there are still a lot of companies that have implemented lean and
accomplished just modest improvements which do not go beyond operating activities.
This has been attributed to a lack of lean implementation know-how and resistance to
change problems association with the adoption of lean principles (Emiliani and Stec,
2005). Willingness to implement lean practices can be related to the organisation size,
age and the industry it engages in, for example Shah and Ward (2003), found that older
plants are less willing to implement lean practices compared to new plants, while large
firms are more motivated to implement lean than small ones. Additionally, they found
that discrete industries are more likely to implement key lean practices, such as JIT,
compared to process industries, as the nature of small lots production in discrete
industries makes JIT practices and Kanban implementation easier than with process-
oriented industries. Hines et al. (2004) report that some organisations faced difficulties
implementing lean as result of being unable to apply a production levelling and
scheduling system such as Kanbans which to them a sort represented failure to adapt to
customers demand variability (Hines et al., 2004).
On the other hand, a considerable body of lean and accounting literature trace lean
implementation inefficiencies to failures to consider lean as a whole philosophy (Hines
at al., 2004; Liker, 2004; Bhasin and Burcher; 2006; Radnor and Walley, 2008; Bhasin,

32
2012), i.e. a whole new culture that shall be extended to every aspect within the
organisation in order to work effectively (Womack and Jones 1994; Warnecke and
Hüser, 1995). Other authors trace the inefficiencies in lean implementation to the
unsuitability of the traditional accounting system used to support lean behaviours
(Baggaley and Maskell, 2003a; Baggaley and Maskell, 2003b; Maskell and Baggaley,
2004, Baggaley, 2006; Johnson, 2006; Chiarini, 2012; Ruiz-de-Arbulo-Lopez, 2013;
Fullerton et al. 2013). The available literature either from the academic or the
consultancy domain problematises the traditional accounting system to work with lean
management (Ahlstrom and Karlsson, 1996; Maskell and Baggaley, 2004; Johnson,
2006; Kennedy and Widener, 2008; Fullerton et al. 2013, Fullerton et al., 2014) and
suggest either shedding traditional accounting practices at all (Johnson, 2006) or using a
simplified accounting system (Fullerton et al., 2013; Fullerton et al., 2014) which is
referred to as 'lean accounting' (Maskell and Baggaley, 2004; Grasso 2005; Maskell and
Kenney, 2007; Kennedy and Widener, 2008). However, as will demonstrated in detail
in the next chapter, our understanding of the MAS associated with lean is still
ambiguous. This research focuses on this later barrier to lean management
implementation given its two main aims of this research; 1) to develop a theoretical
conceptualisation of the development of MAS in the context of lean and 2) to
investigate the role played by management accounting practices suggested for lean firm
namely the use of the lean accounting Value Stream Costing (VSC) tool. In doing so,
the research first identifies the type of innovation to which lean management belongs
and the form of organisation arrangement it represents as discussed in the next section.
2.6 Lean Management as a Process Innovation and a Horizontal Organization
Arrangement
In general terms, innovation has been defined as the process of developing and/or
using new ideas or new behaviours (Zaltman et al., 1973; Daft, 1978; Walker, 2006).
Danampour and Gopalakrishann (2001), define innovation as the adoption of an idea or
behaviours which relate to a new organisation product, service, system, policy or
programme. Conceptually, the term innovation describes an idea or behaviour that can
be new to any of; the whole organisational, an individual adopter, an organisational
department/ sector, a whole industry or an organisational population (Damanpour and
Evan, 1984; Bantel and Jackson, 1989; Walker, 2006; Danampour et al., 2009). To
33
Chenhall and Moers (2015, p. 2) innovation is defined as; ‘the creation and
implementation of new products, services and processes which result in significant
improvement in outcomes.’ The term innovation has mostly been linked to the concept
of creativity however, the adoption procedure is what differentiate between the two
concepts (Chenhall and Moers, 2015). In other words; creativity is associated with the
production of new ideas while, innovation is the ‘successful implementation’/
‘adoption’ of these new/creative ideas (Amabile et al., 1996, p. 1154-1155; Chenhall
and Moers 2015, p. 2). In explaining the various reasons why organisations innovate,
Damanpour et al. (2009) noted that this could be attributed to external environment
pressures such as change in customer demands, lack of resources, competition,
isomorphism or deregulation or an organisational choice made internally for purposes of
achieving a remarkable competitive advantage or a higher level of aspiration. They
conclude that in either cases; ‘the adoption of innovation is intended to ensure adaptive
behaviour, changing the organization to maintain or improve its performance’
(Damanpour et al., 2009, p. 653).
The innovation literature has been consistent in the way authors have defined the term.
In other words, one can conclude that there is an overall agreement between innovation
authors that the term is used to denote the process of adopting new ideas or behaviours.
Authors only varied in the way they had defined the different typologies of innovations.
Zaltman et al. (1973) identified 20 types innovations that they then categorised into the
three groups of; innovations related to the organisation’s status, group of innovation that
differ according to main innovation focus and a third category that includes innovations
that differ according to the outcome expected from the adoption of each innovation
type. However, the two most widely discussed types of innovation are product and
process innovations (Abernathy and Utterback, 1978; Kotabe and Murray, 1990; Light,
1998). Elaborating the distinction between those types of innovations Kotabe and
Murray (1990, p.389) stated that;
----innovation may be defined as know how composed of product technology (the
set of ideas embodied in the product) and process technology (the set of ideas
involved in the manufacture of the product or the steps necessary to combine new
materials to produce a finished product) [Abernathy and Utterback 1978; Capon
and Glazer 1987; Acs and Audretsch 1988].

34
Innovation literature views both products and service innovations as a type of
innovation that is characterised by an external focus, is market driven and leads to a
differentiation in organisations output supplied to the market (Damanpour and
Gopalakrishnan, 2001). Accordingly, the innovation literature makes no distinction
between the conceptualisation of an innovation implemented in a service offered or in a
product manufactured (Miles, 2001). If a difference is to be noticed between both
innovations, it would only be the one associated with the external factor to which the
product or service innovation is offered, i.e. the type of customer or client and his/her
specific demands (Damanpour et al., 2009). According to Boer and During (2001),
process innovations come in contrast to product or service innovations in terms of
having a rather internal focus. Process innovations seek to enhance the efficiency and
effectiveness of organisations’ internal processes for purposes of facilitating the
production and delivery of organisations’ outputs (be it products or services)
(Abernathy and Utterback, 1978; Boer and During, 2001, Damanpour et al., 2009).
Innovation research distinguished between two types of process innovations namely;
technological/ technical process innovation and administrative process innovations
(Damanpour and Evan, 1984; Edquist et al., 2001; Meeus and Edquist, 2006).
Technological process innovations are those process innovations associated with the
modification of organisations’ operating system or processes (Meeus and Edquist,
2006). Technological process innovations are defined as; the new elements adopted by
an organisation’s production or operating system used in producing goods or services
for the organisation’s customers (Damanpour and Gopalakrishnan, 2001). The main
objectives of this type of process innovation is to reduce delivery times, lower
production costs and increase operational flexibility (Boer and During, 2001).
Administrative process innovations are those having a more social or managerial core
(Meeus and Edquist, 2006; Damanpour et al., 2009). They are the new practices and
approaches used in modifying the organisation’s managerial processes, structuring
functional units and tasks, devising strategy and establishing organisational reward
system (Light, 1998; Birkinshaw et al., 2008). They are defined as;
Administrative process innovations pertain to changes in the organization's
structure and processes, administrative systems, knowledge used in performing

35
the work of management, and managerial skills that enable an organization to
function and succeed by using its resources effectively (Damanpour et al., 2009,
p. 655).
For this research, lean management is viewed as one form of a process innovation.
More specifically a technological process innovation that seeks to modify an
organisation’s operating system and processes to achieve various organisational
objectives (Boer and During, 2001; Damanpour and Gopalakrishnan, 2001; Meeus and
Edquist, 2006; Damanpour et al., 2009) including waste elimination, increasing
customers value added, enhancing delivery times and various other organisation specific
objective which can be association with lean management adoption.
Lean management is not only viewed as a technological process innovation but also
with its lateral process view, lean is an example of a horizontal form of organisations
arrangements (Chenhall, 2008). As Chenhall (2008, p. 538) put it;
An important aspect of horizontal organisations is the application of advanced
manufacturing practices in ways that integrate best practice operations with
customer focused strategies and structures that are designed laterally with
supporting HR and IT initiatives.
Elaborating his quote, Chenhall (2008) notes that aspects of such advanced
manufacturing practices that are viewed as a form of horizontal organisation
arrangement, can be found in practices as JIT and later in the application of what we
now know as the lean manufacturing/ management system. According to him, the
distinctive characteristics of a horizontal organisation related to two main categories; 1)
the strategy to implement/ adopt this type of organisation arrangement and 2) the
consequent orientation of organisation processes, structures and human resources. These
characteristics can be easily traced in the lean management definition a philosophy and
in its 5 principles. According to Schonberger (2001) horizontal forms of organisations
are primarily centred around meeting customer demands. Chenhall (2008) identifies that
such customer centric view entails that products, teams and performance objectives are
focused on integrating customers preferences to the production process and develop an
36
overall organisational culture the promotes ‘customer value adding activities.’ More
specifically, Ostroff (1999) explains that;
--- the decision to develop a horizontal organisation (HO)---requires senior
managers to identify the company’s ‘winning value proposition’ and then to
assess whether a HO should be implemented and, if so, what type of HO should
be developed. Value propositions indicate what the organization can do to create
and deliver value to its customers and are often encapsulated by specific mission
statements and credos.
The previous description of the strategic characteristic associated with the adoption of
horizontal form of an organisation is almost the same description of how lean
organisations shall identify their value preposition as defined by the first lean
management principle (Haque and Moore, 2004; Maskell and Baggaley, 2004)
discussed earlier in this chapter. The second characteristic of a horizontal organisation
stresses that approaches to organising organisational production processes,
organisational HR initiatives and over all structure should also be revolving around
customers (Chenhall, 2008; Kastberg, 2014). These approaches include continuous
improvement aspects, improving response and delivery time, removing wasteful
activities, quality improvement, producing at the customer’s average demand and
enhancing flexibility of production processes and between work teams (Schonberger,
2001). All of which are approaches included in the lean management’s 5 principles and
its definition as a whole philosophy targeting almost all organisational aspects (Emiliani
and Stec, 2005).
At the same time, the available management accounting and lean management
literatures do not provide a rigor understanding, nor a comprehensive empirical analysis
of the MAS associated with lean as one form of a horizontal organisational
arrangement. As Hansen and Mouritsen (2007) reports, when it comes to management
accounting and control practices needed in a lateral form of an organisation such as the
one seen in lean companies, operations management and management accounting
researchers confront and the argument in mainly on which field of research should be
responsible of developing controls. As mentioned earlier, there is a considerable body
of accounting literature that points to the need for a simplified accounting system with

37
horizontal organisation arrangements such as lean (Fullerton and Mcwatters, 2002;
Anderson, 2007; Fullerton et al., 2010) for example increasing the dependency on non-
financial performance measures (Ittner and Larker, 1995; Chenhall, 1997; Fullerton and
Mcwatters, 2002). There is another stream of literature that would suggest shedding
most of traditional accounting practices (Johnson, 2006) and another explaining how the
use of operating controls can eventually substitute the need of accounting in horizontal
organisation arrangements such as lean (Hoque and James, 2000; Davila and Wouters,
2006). However, it has been reported that insights into the management accounting
practices - especially those related to costing - needed in a horizontal organisation were
more frequently found in operation management, finance, strategy and even information
technology literature rather than in accounting (Anderson, 2007). Chenhall reports that;
There are no studies that have addressed, directly, how management accounting
practices have been employed to help configure HO to achieve lateral
coordination focused on customers, or how they are implicated in decisions within
HO (2008, p. 539).
Following from Chenhall’s comment on the connection between lean as a form of
horizontal organisation and management accounting literature, the coming sections
present a detailed discussion of the various definitions of the management accounting
and control system, the control frameworks commonly discussed in MA literature, the
different categorisations of the term ‘control’ together and provide an explanation of
why this research choses to focus on the term MAS rather than MCS. The review of
literature presented in this chapter then explores the literature on MAS and innovations
to analyse how this literature can contribute to the study of MAS in the context of lean
as one type of innovations. The literature review then concludes by exploring the new
management accounting system suggested for lean ‘lean accounting’ to identify its
different definitions, the lean accounting principles and present an explanation of the
operation of its value stream costing tool.
38
2.7 Management Accounting and Management Control Systems: A discussion of
the Various Definitions
The literature on management accounting (MA) and management controls (MC)
have presented different approaches in which a management control system (MCS) can
be defined. Over time this literature has also offered various ways of categorizing and
developing frameworks for such management controls (Otley, 1999; Tessier and Otley,
2012). At the same time, various authors (Chenhall, 2003; Bisbe et al., 2007; Malmi and
Brown, 2008; Tessier and Otley, 2012) point out to how the research on MCS lacks
consistency and precision on which control practices are to be included in defining a
MCS and this was attributed to the various approaches used to define the system. This
section presents a discussion of the various ways used to define it.
According to Chenhall and Moers (2015), old literature on MC started by the simple
term management accounting (MA) that was then expanded to include more
management accounting practices and was then referred to as the management
accounting system (MAS). A global market with a variety of uncertainties lead
researchers to think of MA as more than just the calculative practices of budgeting and
standard costing that are used to implement organisation’s strategies (Anthony,1965).
Managing in uncertain conditions together with the advancements achieved with
innovations meant expanding the notion of control. Hence, expanding on what
constitutes MA and better refer to it as MC which constitutes different groupings of
controls. For example, Anthony (1965) divided management actions into planning and
control actions and accordingly there would be planning controls and other performance
measures controls in place. Controls were also then grouped according to their
purposes, for example beliefs, boundary, diagnostic and interactive systems (Simon,
1995b). Chenhall (2003) grouped management controls into organic and bureaucratic
controls.
The term MA has also evolved to include the classic practices as well as the newer ones
such as activity-based costing and the BSC (Chenhall and Moers, 2015). Overtime, even
the term MC and the technologies used in defining its groups of controls, have
developed to include further complexities in organisation’s business models (Nixon and
Burns, 2005). Accordingly, the notion of controls has expanded and brought various

39
aspects of controls; operational controls, management controls and strategic planning
controls, closer (Otley, 1994) in an integrated term which we now refer to as the
management control system (MCS). MCS has been referred to as a ‘package’, a
‘system’ or a ‘collection of control mechanisms’ (Grabner and Moers, 2013).
As mentioned earlier the definition of what constitutes an MCS has developed overtime
to become broader and more inclusive. Tables 2.2 and 2.3 provides a presentation of the
most commonly used definitions of an MCS in academic literature (Willert and Otley,
2016, p. 18). From the definitions presented in table 2.2, Anthony (1965) presents a
narrow definition of MCS that related to the old view of MA as a ‘process’ used by
managers to make sure resources are used in an efficient and effective way. Fisher
(1995) definition does not depart much from Anthony’s (1965) view of MCS as a
process but it strictly restricts the definition to the control managers exerts over each
other.
Author MCS Definition
Anthony (1965, p. 17) “Management control is the process by which managers assure
that resources are obtained and used efficiently and effectively in
the accomplishment of the organisation’s objectives.”
Fisher (1995, p. 25) “Management control is defined as the control managers excise
over other managers. It is the process by which corporate-level
managers ensure that midlevel managers carry out organizational
objectives and strategies.”
Simon (1995b, p. 5) “Management control systems are the formal, information-based
routines and procedures managers use to maintain or alter patterns
in organizational activities.”
Otley (1999, p. 364) “Management control systems provide information that is
intended to be useful to managers in performing their jobs and to
assist organizations in developing and maintaining viable patterns
of behaviour. Any assessment of the role of such information
therefore requires consideration of how managers make use of the
information being provided to them.”
Table 2. 2: Most common definitions for MCS – (from 1960’s to 2000)

40
Table 2. 3: Most common definitions for MCS – (from 2001 onwards)
Author MCS Definition
Bisbe and Otley
(2004, p. 709)
“The term Management Control Systems (MCS) refers to the set of
procedures and processes that managers and other organizational
participants use in order to help ensure the achievement of their goals
and the goals of their organizations (Otley & Berry, 1994), and it
encompasses formal control systems as well as informal personal and
social controls”
Merchant and
Otley (2007, p.
785)
“In broad terms, a management control system is designed to help an
organization adapt to the environment in which it is set and to deliver the
key results desired by stakeholder groups, most frequently concentrating
upon shareholders in commercial enterprises. Managers implement
controls, or sets of controls, to help attain these results and to protect
against the threats to the achievement of good performance.”
Malmi and
Brown (2008, p.
290)
“Our suggestion to clarify these issues is to start with the managerial
problem of directing employee behaviour. Those systems, rules,
practices, values and other activities management put in place in order to
direct employee behaviour should be called management controls. ---
management controls include all the devices and systems managers use
to ensure that the behaviours and decisions of their employees are
consistent with the organisation’s objectives and strategies but exclude
pure decision-support systems.”
Ferriera and
Otley (2009, p.
264)
“---we prefer to use the more general descriptor of performance
management systems (PMSs) to capture a holistic approach to the
management and control of organizational performance. We see this
term as including all aspects of organizational control, including those
included under the heading of management control systems. ----we view
PMSs as the evolving formal and informal mechanisms, processes,
systems, and networks used by organizations for conveying the key
objectives and goals elicited by management, for assisting the strategic
process and ongoing management through analysis, planning,
measurement, control, rewarding, and broadly managing performance,
and for supporting and facilitating organizational learning and change.”
Merchant and
Van der Stede
(2012, p. 6)
“The term management control--separates the management functions
along a process involving objective setting, strategy formulation, and
management. Control, then is the back end of the management process.”

41
Even though Simon (1995b) seems broader that the previous two definitions in the
sense that the definition expand to include; ‘formal, information-based routines and
procedures’ used by managers, the definition failed to include informal controls
discussed later in other definitions. Otley’s (1999) also does not depart much from
Anthony’s (1965) other than providing more elaboration on the MCS role ‘to assist
organisations in developing and maintaining viable patterns of behaviour. Otely (1999)
then expanded on Anthony’s (1965) definition to include strategy planning and informal
controls. Albeit it being regarded as a broad definition of MCS which unpacks the
pillars of MCS as a process of, ‘objective setting, strategy formulation and
management’, Merchant and Van der Stede definition in 2012 can still be regarded as
one of the definitions stemming from Anthony’s (1965) view of MCS as a process.
As displayed in table 2.3, A relatively new way of looking at what constitutes an MCS
is the one offered by Merchant and Otely (2007), where the definition the definition
links MCS to the environment in which an organisation is set and to the objectives
required by stakeholder groups. The definition also goes on to elaborate of the idea of
what does it for an organisation to be ‘in control’. Another way of looking at the MCS
definition was the one proposed by Malimi and Brown (2008), where the definition
refers MCS to the ‘systems, rules, practices, values…put in place in order to direct
employee behaviour’ and also to ‘support decision making’. Unlike the rest of the
definitions extending from the old MCS set by Anthony (1965), Ferriera and Otley
(2009) view such definition as being of a ‘restrictive’ nature. They prefer to use the
term Performance Management Systems (PMS) in an attempt to capture a ‘holistic
approach’ that encompasses both ‘management and control of organisational
performance’. Ferriera and Otley’s (2009) definition integrates a second level to readers
perceptions about MCS to include ‘systems, networks, information flows and
facilitating organisation learning and change’.
As it can be seen from the previous discussion on various ways of defining MCS, as
time goes, MCS become broader and more inclusive to cope with today’s complex,
uncertain and dynamic environment and help best serve organisations future
development (Bisbe and Otley, 2004; Merchant and Otley, 2007). However, a common
trend in the more recent definitions is that they are usually tailored to ‘reflect authors
research questions…and are consequently difficult to compare across studies’ (Willert

42
and Otley, 2016, p. 4). For example, a recent study by Chenhall and Moers (2015) on
the integration of innovation into management control, uses a definition the serves the
purpose of their paper by stating that;
We define MCS as a set of many formal and informal input, process and output
controls that are used by management to achieve organisational goals; the controls
are connected by many complementary relationships. MCS become more complex
when they have many controls that are connected by many relationships that
depend on their environmental and organisational context. (2015, p. 1).
In their definition of an MCS, Chenhall and Moers coincide with many earlier authors
in viewing management controls as formal and informal controls (Simon 1995b; Otley,
1999). Yet, they keep on emphasizing the ‘connection’ between controls and how this is
crucially related to ‘environmental and organisational context’. The emphasis on
environmental and organisational context here served the authors research question on
the role of innovation in the evolution of MCSs. They then explain that they have
chosen this definition given the nature of their study integrating innovation into
management control context were they ‘see MCS acting as a calculative practice
focused on innovation’ (Chenhall and Moers 2015, p. 2). For this research, a detailed
discussion of the various ways of defining an MCS, its frameworks and the different
control categorisations is presented in this section and the next two sections. A
discussion of the definition chosen for this research is presented in section 2.11
following an analysis of the multiple control aspects available in management
accounting literature.
2.8 MCS Frameworks
The literature on MCS has developed various frameworks that seek to assist in
categorising and analysing organizational used management controls. Table 2.4 displays
the most commonly used frameworks in the literature on MCS (Willert and Otley 2016,
p. 18) with an explanation of the purpose of each framework.

43
Authors Purpose of the framework
Simon
(1995)
The levers of control (LOC) framework was proposed as a method to
control and implement business strategies.
“A new theory of control that recognizes the need to balance competing
demands is required. Inherent tensions must be controlled, tensions between
freedom and constraint, between empowerment and accountability, between
top-down direction and bottom-up creativity, between experimentation and
efficiency. These tensions are not managed by choosing, for example,
empowerment over accountability – increasingly, managers must have both
in their organizations.”
Otley (1999)
“This paper proposes a framework for analysing the operation of
management control systems structured around five central issues. These
issues relate to objectives, strategies and plans for their attainment, target-
setting, incentive and reward structures and information feedback loops.”
“The intention of this paper is to provide a perspective more focused on the
operation of overall control systems, and to do so by looking beyond the
measurement of performance to the management of performance.”
Malmi and
Brown
(2008)
“This analytical conception of MCS as a package provides a sufficiently
broad, yet parsimonious, approach for studying the phenomenon
empirically. Its aim is to facilitate and simulate discussion and research in
this area, rather than suggesting a final solution to all related conceptual
problems.”
“The purpose of this editorial is to enlighten the above-mentioned issues
and lay a foundation to enable researchers to continue developing research
on MCS.”
Ferreira
and Otley
(2009)
“this paper puts forward the performance management systems framework
as a research tool for describing the structure and operation of performance
management systems (PMSs) in a more holistic manner.”
“Anecdotal evidence suggests that the extended framework provides a
useful research tool for those wishing to study the design and operation of
performance management systems by providing a template to help describe
the key aspects of such systems. It allows a holistic overview to be taken
while making this a feasible task.”
Table 2. 4: Four of the most commonly Cited and Used Frameworks in MCS Literature
44
An initial step to discussing MCS frameworks is to mentions Anthony (1965)
framework defining an MCS. Anthony’s paper is almost the most cited paper when
discussing MCS since his definition is one of the first definitions to specify what is an
MCS and most frameworks followed on after referring to his definition. Anthony
developed the term MCS and defined it and by this he made a distinction between
operational control, controls for strategic planning and controls for management. Of the
four listed frameworks in table 2.4, Simon (1995b) levers of control (LOC) framework
is the one which has been used by most authors (Bisbes and Otley, 2004; Widener,
2007; Mundy, 2010; Tessier and Otley, 2012) in management accounting literature.
In his book, ‘Levers of Control’, Simon (1995b) aimed at developing an analytical tool
that managers can use for controlling and implementing their organisational strategies.
In this context, Simon identified controls into four groups based on control purposes:
beliefs, boundary, interactive control and diagnostic control systems. However, Simon
(1995b) received some criticism from other academic researcher including Bisbe et al.
(2007). According to Bisbe et al. (2007) the framework failed to relate the four LOC to
specific theory. Ahrens and Chapman (2004) also criticized the framework for its
operationalisation difficulty.
With the aim of developing a simple framework that is intended to be used in analysing
the operation of management controls, Otley (1999) develop his 5 dimensions
framework which related analysed controls in terms of objectives, strategies and plans,
target, reward and feedback loops. At that time, Otley’s (1999) framework was
distinguished in being simple, holistic and dynamic in the sense that the dimension-
based analysis of management controls would change with the change in organisation
settings in order to ensure the effectiveness of the controls used over different periods of
time. Malmi and Brown (2008) presented a management control framework that treats
management controls as a package. They divided controls into the 5 types of: cultural
controls, planning controls, cybernetic controls, controls for reward and compensations
and administrative controls. In their framework, Malmi and Brown (2008) were trying
to strengthen readers understanding of the parameters of controls. For example; they
built on Flamhotz (1983) definition of organisation’s culture to explain three types of
cultural controls; value-based controls, symbol-based controls and clan controls.
45
In 2009, Ferreira and Otley extended Otley’s (1999) simple framework to a more
comprehensive management control framework that added the elements of: vision and
mission, organisation structure, key performance measures, information flow, changes
in performance measurement systems, performance evaluation and strength and
coherence, to the previous five control dimensions propose by Otley in 1999. Both
Malmi and Brown (2008) and Ferriera and Otley (2009) frameworks are similar in
terms of seeking to expand and enhance users understanding of the different parameters
of an MCS, in being a broad and holistic MCS frameworks and in including the idea of
interdependency between controls for their effective implementation.
The MCS frameworks discussed in section are the four most commonly cited control
frameworks in management accounting literature. The frameworks represent different
patterns of designing and analysing management controls or management control
system. However, the effectiveness of these frameworks depends on how managers
practically use them (Simon 1995a, p. 5).
2.9 Different Categorisations of Controls
The literature on MCS have categorised controls into various categories depending
on the controls’ objectives. According to Hopwood (1976) controls are categorised into
administrative controls which involve the standard rules governing operating procedures
and social controls which include personal controls affecting people’s behaviour such as
employees shared values and norms together with organisations’ formal agreements and
hierarchal structures. Merchant (1985) categorised controls into action, result and
personnel controls, where action controls are those used to manage employees’
behaviour and make sure they act in accordance with the organisation’s guidelines.
Result controls are those controls related to organisation target results, they are used to
keep employees accountable for their work outcomes and are sometimes tied with
organisational rewards. Finally, personnel controls are controls used to trigger
employees’ self-development and control through the creation of a common
organisation culture of employees shared norms and values. Personal controls are also
referred to as clan or cultural controls and they can include employee trainings, job
design and employee recruitment and promotion controls (Merchant 1985, 1998).
Anthony et al. (1989) categorised controls into the two broad categorisations currently

46
used in most of the management control literature; formal and informal controls.
According to Anthony et al. (1989), formal controls constitute the visible and objective
types of controls, they include the organisational set regulations together with the
established standards for operation and accounting systems procedures. They consist of
the explicit sets of procedures, processes, routines and structures which are purposefully
designed to assist managers in making sure organisation’s strategies are being
implemented (Maciarello and Kirby, 1994; Simon, 1995a; Merchant, 1998). Langfield-
Smith (2006) notes that formal controls consist of the typically top-down organisational
controls that form its written reports such as organisations budget reports and its
performance and rewards systems. Whereas informal controls include the unwritten and
unconsciously designed organisational controls, these can include organisation culture,
employees’ norms and values and their leadership styles (Anthony et al., 1989). They
are the more social controls (Ouchi, 1977; Otley, 1980) driven from the organisation
culture and might sometimes be developed in a bottom-up pattern (Das and Teng,
1998).
The terms formal and informal controls were used extensively in management control
literature following Anthony et al.’s (1989) identification of those control categories.
The different categorisations included in each type of controls together form the
‘package’ of what constitutes an MCS (Malmi and Brown, 2008; Ferreira and Otley,
2009; Grabner and Moers, 2013; Strauss et al., 2013). As much as these different
categorisations and the different control frameworks have contributed to our
understanding of the variety of organisational controls, such diversity of controls and
control frameworks have been reported to cause a lack of precision and inconsistencies
in MCS research (Chenhall, 2003; Bisbe et al., 2007; Malmi and Brown, 2008; Tessier
and Otley, 2012).
2.10 MAS and MCS: From a progressive evolutionary story to an
‘incommensurate’ set of definitions
The management accounting literature has generally used the terms management
accounting system (MAS) and management control system (MCS) – and sometimes
performance measurement system (PMS) as well - interchangeably to signify the
various practices, routines, procedures and controls used to make sure an organisation

47
achieves its goals (Chenhall, 2003; Malmi and Brown, 2008; Ferriera and Otley, 2009;
Chenhall and Moers, 2015). Old literature started by the simple term management
accounting (MA) (Chenhall and Moers, 2015). The term was mainly used to indicate a
focus on the budgeting processes (Hopwood, 1976) and on operations efficiency which
was reasonably predictable given the clear hierarchical operating setting then used
(Chenhall and Moers, 2015). This was also associated with the use of the term ‘cost
accounting’ to signify the costing practices needed for product valuation following the
industrial revolution (Horngren et al., 2015). Overtime the move from operating settings
with hierarchical structure to more flat and horizontal organizational settings (Kastberg,
2014) - for e.g. the use of JIT and lean production (Chenhall, 2008) - meant more
complexities driven by the need to direct employees efforts to value-added activities in
order to achieve organisations’ goals and create new organisations’ opportunities
(Malmi and Brown, 2008). A global market with a variety of uncertainties lead
researchers to think of MA as more than just the budgeting and costing practices used to
implement organisation’s strategies (Anthony,1965). Overtime, this meant expanding
what constitutes MA and better refer to it as a management accounting system.
According to Chenhall (2003, p. 129), ‘MA refers to a collection of practices such as
budgeting or product costing’. The term MAS refers to the ‘systematic’ use of
management accounting with its various practices to achieve some organisation goal
(Chenhall 2003, p. 129; Malmi and Brown, 2008). Researchers then expanded the
notion of ‘control’ to go beyond the management accounting practices and include
almost all types of controls; formal, environmental and personal controls. According to
Anthony et al. (1989);
Control is the process of guiding a set of variables to attain a preconceived goal or
objective. It is a broad concept applicable to people, things, situations and
organizations. In organizations, it includes various planning and controlling
processes.
In his definition of the term ‘control’ Anthony tried to hint to how the concept can
almost include every organisation aspect i.e. people, things and situations and this what
was then established by the latter literature that referred to the control. Puxty and Chua
(1989) then identified three meanings of the control concept, the first one is a tool to
regulate based on cybernetic meaning. Second; a mean of dominating people through

48
sociologic and political power and finally as of controlling management procedures.
Merchant and Otley (2007) then emphasized that, the concept of control for purposes of
achieving an organisational goal or objective is a comprehensive and complex function.
Accordingly, various management accounting literature started to use the term MCS
(Simon, 1995; Otley, 1999; Chenhall, 2003, Malmi and Brown, 2008; Ferriera and
Otley, 2009; Chenhall and Moers, 2015) to signify “..a broader term that encompasses
MAS and also includes other controls such as personal or clan controls” Chenhall
(2003, p. 129).
MCS has been defined in multiple ways, almost a plethora of frameworks have been
developed to identify the different types of organisational controls. However, as much
as the various definitions have massively contributed to academics’ and practitioners’
understanding of the complex and different categorisations of controls and their
operation, the multiple definitions with the variety of frameworks result in a status of
incommensurate sets of definitions. Eventually recent management control literature
had confirmed that the multiple frameworks with the various definitions act as a
guidance for each organisation based on its needs and circumstances (Willert and Otley,
2016). This research uses Chenhall’s definition of MAS as ‘the systematic use of
management accounting with its various practices to achieve some organisation goal’
(2003, p. 129). The research chooses to focus on the MAS rather than MCS since this
matches the first research objective of: Developing a theoretical conceptualisation of
the development of MAS in the context of lean management. The focus on a simple
definition of a MAS is also helpful in avoiding the complexity embedded in the
different definitions and frameworks of MCS together with the different categorisations
of the term ‘control’. This suits the nature of this research linking lean management,
MAS and lean accounting which represents a literature integration in which our
academic and consultancy knowledge is still evolving (Chopra, 2013).
A choice of a simple definition of MAS also matches the ontology of actor-network
theory (ANT) as the theoretical lens for this research with its focus on human and non-
human actors (Latour 1998; 1999; 2005) and helps in avoiding the drawbacks
associated with previous MCS contingency based research. According to Emmanuel et
al. (2004) no set of controls is able to achieve the same outcome nor the same objectives
in all settings in which these controls were used. Unfortunately, the use of contingency
49
theory in management accounting and management control research has a lot to do with
Emmanuel et al. (2004) conclusion. As much as the use of contingency theory has
contributed to our understanding of controls, it has also locked in this understanding to
certain contextual fit factors that in many ways have ignored the interaction between
human and non-human actors in the operation and development of management
accounting systems used. In 2004, Gerdin and Greve analysed the use of contingency
theory in strategy-MAS research area. According to them, the excessive and different
uses of the concept of fit associated with contingency theory initiate the need for
reinterpreting research results whether they are contradictory or supportive. Other
studies report that while the use of contingency theory directs research and practice to
certain expectations about the control results, the other left out contingent variables can
be the real reason for these results (Fisher, 1998; Chenhall, 2003). Previous literature
has also reported that the variability in the definitions of chosen variables in this stream
of research have affected theory building, testing and developed fragmented theoretical
conceptualisations (Otley, 1980; Fisher, 1995; Langfield-Smith, 1997). In a recent
review of the use of contingency theory in the development of MCS frameworks, Otley
(2016) argues that the ‘mechanistic’ approach of using contingency theory supported by
the regular use of applicable questionnaires have developed a misguided approach of
what has been sought to become a ‘predictive mechanism’ for MCS design (p. 45).
Otley reports that additions or amendments to management accounting practices or
MCS currently occur at a very fast rate compared to the results that the coordination
efforts done on the various MCS frameworks can develop. According to him, this is in
addition to the rapidly changing organisations’ environments has eventually precluded
the full coordination of the variety of control system elements especially given the
unpredictable nature of how new control elements can be developed by different actors
at different organisation’s times. Otley recommends that such narrow view of the
concept of contingency has to be substituted by ‘a more tailored approach that takes
into account the context of specific organisations’ (2016, p. 45), which is what this
research tries to do by focusing on lean management and adopting an ANT theoretical
approach.

50
2.11 Analysing the Literature on MAS and Innovation
The literature on MAS and innovation first started by viewing management
accounting practices as the mere reflection of the strategy or innovation implemented
(Kaplan, 1984, 1988, 1989). Management accounting practices are mainly designed for
cybernetic purposes (McSweeny, 1997). Eventually, working in more and more
uncertain environments initiated the need for more interactive controls, i.e. enabling
controls that are supportive of innovative effort (Chenhall and Moers, 2015, p. 10),
Hence, later work viewed the innovation adopted as having an effect on the
organisation’s management accounting and control system (Ahlstrom and Karlsson,
1996). According to Chenhall and Moers (2015, p.10);
It is the evolution of openness, flexibility and comprehensiveness in the design
and implementation of MCS that has provided a basis upon which efforts for
innovation can be motivated and sustained.
This literature shows that new innovations and working in an environment of
uncertainty have led to more complex concepts about management accounting practices
and controls used (Langfield-Smith, 1997; Lillis and Mundy, 2005; Henri, 2006) and
accordingly has led to the development of the term MAS and then the broader term of
MCS. Chenhall and Moers (2015) view innovation as a key factor affecting the
evolution of management accounting system and the reason for including more complex
control practices leading to the creation of what we now know as the MCS. For
example, they report that developments in management accounting system including the
introduction of Activity-based costing (ABC) and Activity-based management (ABM)
and the inclusion of performance measurements such as the Balanced Scorecard (BSC),
have been the management accounting research response to advance in technological
innovations in order to be able to ‘capture costs and value along the value chain’
(Chenhall and Moers, 2015, p. 8).
More recent work on MAS and innovation focuses on the role played by management
accounting practices and calculations. This work can be divided into two research
strands; one that focuses on the diffusion of management accounting practices (Otley,
1999; Alcouffe et al., 2008) and a second strand - which is the one associated with this

51
research - focusing on the role of calculative practices in relation to the strategy or
innovation adopted. This strand of research regards calculative practices as calculations
that ‘do things’ (MacKenzie, 2006; Mouritsen et al., 2009; Revellino and Mouritsen,
2015; Themsen and Skærbæk, 2018) and mediate between actors’ interactions and the
innovation adopted (Vosselman, 2014). In a longitudinal case study, Briers and Chua
(2001) traced the consecutive procedures leading to the adoption of ABC. Albeit, not
deliberately focusing on the role of ABC calculations in organisation environment or
strategy used, their empirical data shows that, the use of ABC calculations stimulated an
identification of organisational boundaries. As will be discussed in further details in the
next chapter, Mouristen et al. (2009) report that accounting calculations affect the
innovation adopted in short and long translations processes.
Revellino and Mouritsen (2015) view management accounting calculations as engines
that lure people into taking certain actions. In their study on the interaction between
management accounting practices and innovation, they conclude that calculations affect
innovation adopted leaving other calculative traces. These traces create a trajectory
which continues to influence the innovation in place and can initiate the need for new
calculations. Hence, innovation drifts with changes in management accounting
practices. Grottke and Obermaier (2016) analysed the role of calculative practices in
two process tracing studies of two German firms using industry 4.0 innovations. They
conclude that the interaction between calculative practices and different actors in the
two firms developed new layers of meanings to the calculative practices leading them to
have an ‘iridescent’ role in the context of complex innovations (Grottke and Obermaier,
2016, p. 1). Grotek and Obermaier (2016) show that MAS practices can have
interchanging roles between cameras, brakes and engines. This strand of literature is the
one relevant to this research, given its focus on the role played by VSC practice and on
conceptualising the developments in MAS in the context of lean, where management
accounting calculations can have an influential role in such conceptualisation. Yet, most
of this recent literature is not contextually lean driven. There is still no agreement nor a
theoretical conceptualisation that discusses the developments in organisation’s MAS
associated with a process innovation or a horizontal organisation arrangement as lean.
What we have now is a compilation of consultants and academic literature that give
guidelines on a so called ‘lean accounting system’ as shall be discussed in the following
sections.

52
2.12 Lessons from a Production-line Approach, Services and Current
Manufacturing Industries
The earlier sections of this chapter discussed the development of lean thinking and
the history of how it became an operational necessity to manufacturing sectors and have
sequentially moved to services as well. Historically, the need to compete on fulfilling
customer demands and the necessity to exhibit an operating culture of employee
empowerment formed the main reasons behind the failure of mass production in the
production-line approach and in services and consequently the need to move to lean.
What can be driven from this previous historical discussion is that the main mass
production practices are almost the opposite to the five principles of lean management.
Kennedy and Brewer (2006, p. 66) shows this in a comparison between the mass
production and the lean management, in terms of the goal of each system, the way
resources are organized, the flow of production, what triggers production and the
definition of the human element. Figure 2.3 presents an adaptation of Kennedy and
Brewer’s (2006) illustration with an integration of the lean principles to show how each
comes in contrast to the five lean management principles.
Figure 2.3 shows that the main objective of a mass production system is to achieve the
lowest possible cost through maximizing the productivity of people and machinery.
While lean focuses on adding more customer value and eliminating wastes from
companies’ processes. Maskell and Baggely (2004, p. 11) comment that:
We recognize that an important part of the cultural shift to a lean enterprise is
the transition from thinking cost to thinking value. Mass production companies
have focused on cost reduction for years. An essential tenet of mass production
is to "pile it high and make it cheap". The essential tenet of lean thinking is to
maximize customer value and eliminate waste.
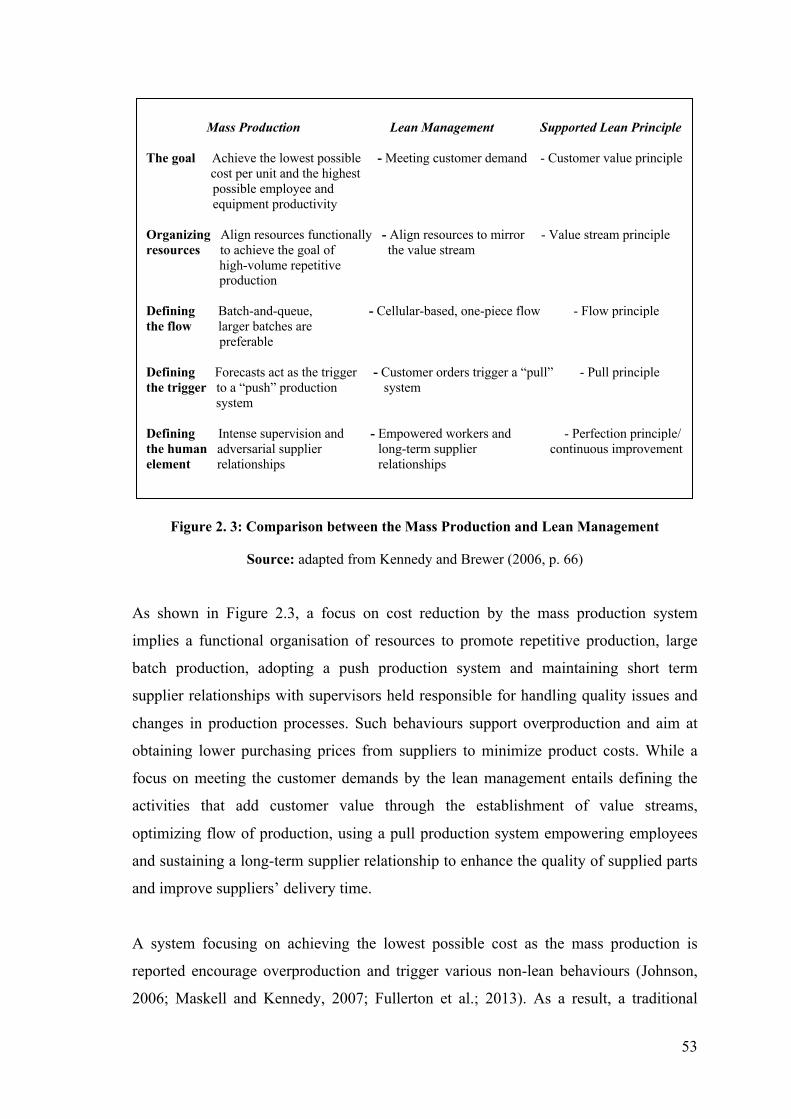
53
Figure 2. 3: Comparison between the Mass Production and Lean Management
Source: adapted from Kennedy and Brewer (2006, p. 66)
As shown in Figure 2.3, a focus on cost reduction by the mass production system
implies a functional organisation of resources to promote repetitive production, large
batch production, adopting a push production system and maintaining short term
supplier relationships with supervisors held responsible for handling quality issues and
changes in production processes. Such behaviours support overproduction and aim at
obtaining lower purchasing prices from suppliers to minimize product costs. While a
focus on meeting the customer demands by the lean management entails defining the
activities that add customer value through the establishment of value streams,
optimizing flow of production, using a pull production system empowering employees
and sustaining a long-term supplier relationship to enhance the quality of supplied parts
and improve suppliers’ delivery time.
A system focusing on achieving the lowest possible cost as the mass production is
reported encourage overproduction and trigger various non-lean behaviours (Johnson,
2006; Maskell and Kennedy, 2007; Fullerton et al.; 2013). As a result, a traditional
Mass Production Lean Management Supported Lean Principle
The goal Achieve the lowest possible - Meeting customer demand - Customer value principle
cost per unit and the highest possible employee and equipment productivity Organizing Align resources functionally - Align resources to mirror - Value stream principle resources to achieve the goal of the value stream high-volume repetitive production Defining Batch-and-queue, - Cellular-based, one-piece flow - Flow principle the flow larger batches are preferable Defining Forecasts act as the trigger - Customer orders trigger a “pull” - Pull principle the trigger to a “push” production system system Defining Intense supervision and - Empowered workers and - Perfection principle/ the human adversarial supplier long-term supplier continuous improvement element relationships relationships

54
accounting system is thought to act against lean principles and a new accounting system
is called for to better reflect a lean environment and support lean behaviours (Kennedy
and Widener, 2008; Kroll, 2004). Such new accounting system is what is now known as
the “Lean Accounting System”. The coming section discusses the definition of a lean
accounting system, why it is needed and how it operates.
2.13 Lean Accounting Definition
A lean accounting system is defined as “A new method of managing a business that
is built upon lean principles and lean methods” (Kennedy and Widener, 2008, p. 302,
Maskell and Baggaley, 2004, p. ix). Lean accounting definition has two perspectives;
(1) accounting for lean and (2) lean accounting (Grasso, 2005). The accounting for lean
perspective focuses on how the reported financial information shall support a lean
management system (Grasso, 2005). This perspective relates to providing relevant lean
information for decision making, how financial reporting can serve lean needs and can
be easily understood by everyone. Also, how internal costing information and reports
shall be developed in a lean management system and how the accounting information
provided shall represent a strategy that focuses on adding customer value, using a pull
system, empowering labour and exerting continuous improvement efforts (Crandall and
Main, 2007), i.e. how the accounting information represents the current condition in
lean firms.
The lean accounting perspective deals with integrating the lean concepts to the
accounting process. In other words; how the lean thinking in terms of focusing on the
customer’s value adding activities and eliminating wastes can be applied to the
accounting system of a lean firm (Crandall and Main, 2007). This entails the changes
that shall be applied to the accounting system and tools in order to obtain simplified
lean tailored information and reports (Grasso, 2005). This includes efforts to simplify
the accounting process, eliminate non-value adding transaction records as well as
developing a good costing system for lean firms.

55
2.14 Reasons for the Need for a Lean Accounting System
Lean accounting is needed for lean firms owing to two main reasons, first; to help
avoid the drawbacks of the traditional costing system and second; to provide relevant
lean tailored accounting information. These two main reasons are explained in this
section.
2.14.1 To Avoid the Traditional Costing Drawbacks
The traditional costing system uses variance analysis to evaluate the company’s
performance. The problem with traditional costing performance measurement tools like
variance analysis is that they mostly represent financial measures and are too
complicated, which makes them understandable only by finance people (Kennedy and
Brewer, 2006; Kroll, 2004). Also, the dependency on variance analysis as an indicator
of work progress creates the notion of considering the time during which workers are
not producing as an inefficient use of time (Kennedy and Brewer, 2006). In such a
condition, a typical decision to resolve the problem and decrease product unit cost will
be to increase production even if no customer orders are requested. Another solution
may even include holding more inventories or accepting poor quality output units in
order to absorb overhead costs. All of which represent non-lean behaviours that
excessively use workers and create an atmosphere of de-motivation for continuous
improvement efforts (Ward and Graves, 2004).
Additionally, the way a traditional costing system allocates overhead on basis of output
level, direct labour hours or direct labour dollars, always links lower costs with high
volume production associated with mass production (Johnson, 2006). Lean management
system seeks to optimise the flow of production so to accelerate the pace of production
and produce exactly what the customer demands. Consequently, applying traditional
overhead allocation methods is reported to produce higher costs at a condition were
batch production is reduced (Maskell and Baggaley, 2004). Moreover, overhead costs
are not always linked to such commonly used allocation basis (Kroll, 2004; Ward and
Graves, 2004). Consequently, allocating overhead this way distorts product costs and
eventually leads most companies to lose their competitive positions.

56
2.14.2 To Provide Lean Tailored Information
Lean management implementation seeks to streamline the operating process and
eliminate any/all wasteful activities (Shah and Ward, 2003). Consequently, in a lean
firm, tracking of financial transactions related to such activities shall also be eliminated.
This will free accounting and finance people to engage in continuous improvement
efforts and work as agents for prospective developments in their companies (Crandall
and Main, 2007).
The application of lean pull principle is associated with lower inventory levels
(Kennedy and Brewer, 2006). Such decrease in inventory balances at the beginning of
lean implementation is expected to show negative impact on the organisation’s income
(Kroll, 2004). Hence, lean firms will report lower profits even though they are
achieving progress with decreasing inventory balances (Debusk and Debusk, 2012).
Hence, the traditional accounting system especially with its absorption income
statement is reported to give results that contradict the improvements achieved through
lean implementation (Brosnohan, 2008; Crandall and Main, 2007).
Finally, costing in a lean firm is expected to differ from a mass production system since
in the focus because the whole value stream rather than the individual product units
(Maskell and Baggaley, 2003a; 2003b). Accountants shall focus on the whole costs
incurred in a value stream, which can include quality costs, design costs, maintenance
and even administrative costs (Maynard, 2008). Lean accounting proponents report that
this can be achieved using the lean accounting “Value Stream Costing” (VSC) tool in
which provides costing information tailored to the whole value stream activities
(Maskell and Kennedy, 2007). The next section provides an explanation of the
operation of VSC.
2.15 Value Stream Costing Operation
Maskell and Baggaley (2004, p.17) describe VSC as;
VSC is used to eliminate most of the wasteful transactions associated with
production control, materials, and product costing. VSC eliminates the need for

57
standard costing and overhead allocations and creates a simple and effective cost
accounting method.
As shown in Figure 2.4, using value stream costing all costs incurred to operate one
value stream shall be included in computing the total value stream costs. Such costs
include production labour costs, materials costs, machinery and equipment costs,
production and operating support costs, facilities and maintenance costs as well as any
other costs paid to help the value stream deliver a customer value. Therefore, upon
using VSC, there is no difference between direct or indirect costs as common overhead
costs are traced directly to the value stream. As a result, computing costs using VSC
requires little or approximately no overhead allocation practices and the total value
stream costs are to be calculated weekly including all costs incurred to deliver a
customer value (Maskell and Baggaley, 2006).
Production Production Production Machines &
Labour materials support Equipment
Operation Facilities & All other
Support maintenance VS costs
Figure 2. 4: Costs included in the Value Stream Costing Calculations
Source: adapted from Maskell and Baggaley (2004, p. 136)
A minor allocation process occurs that involves the allocation of facility costs to the
value streams. VSC allocates facility costs including plant security costs, plant rent,
depreciation of the building, utility costs and plant maintenance on basis of the square
footage occupied by each value stream (Kennedy and Brewer, 2006; Maskell and
Baggaley, 2004). However, the problem remains with how companies define what
Value Stream

58
constitutes utility costs, since if utility costs include costs for electricity then, allocating
electricity on bases of square footage may distort the total value stream costs, especially
in capital and energy intensive organizations. In such organizations, value streams
occupying small space but producing products that need more power energy will be
allocated less utility costs than those value streams occupying more space and
producing less power intensive product families. Maskell and Baggaley (2004) coincide
with this idea commenting that, utility cost is significant and is considered a cost that
makes much variability among value streams.
2.15.1 Product Unit Cost using VSC
Using VSC, when all costs incurred to operate a certain value stream are assigned
to its value stream in the manner explained in the previous section. An average cost per
unit for all products made by the value stream, is then determined by dividing the total
value stream costs with the total number of products shipped (Kennedy and Brewer,
2006).
At the same time, lean accounting advocates view the idea of computing an individual
product unit cost for each product within the product family as unnecessary for lean
firms (Fullerton and Kennedy, 2009; Debusk, 2008). This is because, using value
stream costing, product prices are market driven (Brosnahan, 2008). Additionally, the
standard product cost has always been needed for pricing decisions, make or buy
decisions, new product introduction, product and customer rationalization decisions,
measuring profitability, inventory valuation and performance measurement using
variance analysis. Whereas in lean firms the focus is on adding customer value,
consequently the concern is on the whole process, then profitability for example; is
judged on basis of the total value stream profitability not the individual product profit
margin (Maskell and Baggaley, 2004). Also, decisions like make or buy, removing a
certain targeted customer or a certain product from the product family or introducing a
new product can be made on basis of the whole value stream available capacity and
profitability under this decision (Brosnahan, 2008). Also developing lean tailored
performance measures that everyone can understand and react to makes variance
analysis based on single product unit cost unnecessary (Maskell and Baggaley, 2004).

59
In the same sense, lean accounting adopters see that maintaining an effective control
over inventory minimizes the need for computing product unit cost to be used in
inventory valuation (Kroll, 2004). This constitutes a debatable part in the value stream
costing postulations about the need for individual product unit costs for pricing
decisions. This is because lean accounting advocates also admit that product unit cost is
still needed for transfer pricing decisions and for exporting purposes. Also, if customer
orders cover a long production execution period that might exceed three months for
example, then individual product unit cost will be needed for inventory valuation
purposes (Maskell and Kennedy, 2007). Such idea necessitates a more detailed
information technique than the average product cost per unit developed by VSC, in such
cases Maskell and Baggaley (2004, p. 156) comment that:
“We need an understanding of what causes cost in a value stream”
2.15.2 Value Stream Costing with Features and Characteristics Costing
In conditions where individual product unit costs are needed, lean accounting
proposes the use of “Features and Characteristics Costing”, a method used to resolve
costing distortions that may occur due to the dependency on the average value stream
cost per unit, that is computed for all products produced in one value stream. Costing
distortions may occur as a result of having products that take different time to be
processed within the same value stream. Consequently, features and characteristics
costing is used to normalize the average cost per unit computed using VSC (Maskell
and Baggaley, 2004).
Features and characteristics costing postulates that in lean firms, “flow” is the main
driver for product cost. As a result, having bottlenecks slows down the operation’s rate
of flow, which leads to turning out a lower number of shipped products which results in
computing higher average unit cost (Maskell and Baggaley, 2004). According to
Maynard (2008), controlling the flow helps control the cost. Accordingly, using features
and characteristics costing, the cell which constitutes a bottleneck to the value stream
operations shall be identified. A lean firm shall then define the products features and
characteristics that make products use different processing time in this cell. Then a per
unit conversion cost for each product is adapted based on the different cycle time taken

60
by products having different features and characteristics. Finally, the cost of direct
materials paid over each product is added to its conversion unit cost to compute the new
product’s unit cost (Maskell and Baggaley, 2004).
The lean accounting suggestion to use features and characteristics costing represents a
way to eliminate the need for establishing any cost allocation method and at the same
time compute accurate product costs through the average unit cost computed using
VSC. On the other hand, the use of features and characteristics costing still does not
guarantee zero distorted product costs. This is because, features and characteristics
costing considers the costing distortions initiated due to using different processing time
in the bottleneck operation only. In fact, there may be cases in which the value stream
products use different processing time in other value stream operating cells, which
imply that products shipped do not use the production resources equally. Consequently,
costing distortions may still be present due to having products that take different
processing time in other operating cells which do not represent bottlenecks to the value
stream operations. This may explain why Maskell and Kennedy (2007) comment that
even though features and characteristics costing represents a simple and more accurate
allocation method compared to traditional costing, it does suffer some similar problems
regarding its accuracy and validity concerns. Maskell and Baggaley (2004) also
recommend that lean firms shall better avoid such normalization of average product unit
cost because it includes some complexity and subjectively in computing product costs.
The previous discussion of the VSC tool aimed to explain how the tool should operate
with lean. However, VSC as a ‘lean tailored’ accounting practice is receiving very low
implementation rates (Ruiz-de-Arbulo-Lopez et al., 2013). It is not known as to whether
the tool does support lean or not or what role does it have in a lean organisation. Rao
and Bargerstock (2011) report that, majority of lean firms are still depending on
standard costs. There are no in-depth empirical investigations offered by the lean
accounting literature on the role played by VSC nor the factors affecting its acceptance
or rejection by lean firms. For example, Chiarini (2012) discusses the problems of using
a traditional accounting practices in a lean SME and then attempts to compare this to the
use of VSC and ABC. Yet, given how short his study was in addition to the early stage
of lean implementation at which the SME was, Chiarini (2012) concludes that the study
cannot be classified as one that fully demonstrates the process of VSC implementation.

61
Similar conclusion was reached by Ruiz-de-Arbulo-Lopez et al. (2013) for a different
reason. Ruiz-de-Arbulo-Lopez et al. (2013) discussed the application of VSC in a case
study organisation yet they only utilized VSC as a reflective calculation to visualize the
improvements achieved from lean operations. Accordingly, the full implementation and
success of a lean accounting and VSC as its main practice is still questionable (Tillema
and van der Steen, 2015). The available literature only problematise the traditional
accounting system to work with lean and fails to provide alternative conceptualisations
of MAS or to investigate other suggestions from the lean accounting literature such as
VSC.
2.16 Chapter Summary
This chapter presented a review of the literature associated with the three research
strands associated with this research; lean management, MAS and lean accounting. The
objective was to show how the lean thinking represented an innovation to the operating
process at the Toyota manufacturing corporation that aimed at meeting customer
demands and expelling the mass production system. The literature review then followed
to demonstrate why lean management should be viewed as a philosophy and how the
traditional accounting system presents a barrier to lean implementation. From the
review of the lean management literature it was noted that lean represents a horizontal
form of organisation arrangement and is an example of a technological process
innovation. An exploration of the management accounting literature tackling horizontal
form of organisation arrangements showed that here are no studies addressing how MA
practices are used to support or affect the lateral view of a horizontal organisation
arrangement focusing customers’ needs (Chenhall, 2008) such as lean management.
Additionally, a review of the literature on MAS and innovation showed that the its
mostly not lean driven and fails to provide an overall conceptualisation of the MAS
development in the context of lean. It is only the recent body of this literature viewing
accounting calculations as actors that do things/ affect the innovation adopted, that is
relevant to this research given its research aims. Finally, the chapter explored lean
accounting literature in terms of the its definition, the reasons for its initiation and the
operation of its main practice; value stream costings (VSC). The objective of this
review was to provide an elaboration of why this literature proposes new and simpler
accounting practices and to demonstrate how its main VSC operates. The key take point

62
from the review of lean accounting literature is to show that the use of lean accounting
and VSC is still questionable and that VSC is receiving very low implementation rates,
albeit perceived as the main lean ‘tailored’ accounting practice. The next chapter
introduces the theoretical lens chosen for this research; Actor-Network Theory (ANT)
and uses it to develop a literature driven theoretical conceptualisation, which presents
the current discourse in the management accounting literature on the operation of MAS
in the context of lean.

63
Chapter 3: Theoretical Underpinning
3.1 Introduction
Following the research questions identified in chapter one, Actor-network theory
(ANT) is chosen as the theoretical underpinning for this research. ANT together with
Callon’s (2007, 2010) performativity thesis are used in this research, first to develop a
literature driven theoretical conceptualisation on lean and MAS. Second, an empirical
driven theoretical conceptualisation is then developed on basis of the case study data
discussed in chapter 5 and 6. This chapter explains ANT as the theoretical lens chosen
for this research. The chapter is divided into seven sections. Section 3.2 introduces ANT
with a brief discussion on its background. Section 3.3 discusses the ontology of ANT
and reasons why it has been chosen as the theoretical lens for this research. The core
concepts of ANT which are used in this thesis, are illustrated in section 3.4. Section 3.5
explains Callon’s (1998a) concepts of framing and overflow and section 3.6 discusses
‘socio-technical agencements’ and Callon’s (2007, 2010) performativity thesis. These
concepts are used later in the thesis to develop the empirical driven theoretical
conceptualisation. Finally, section 3.7 utilises the literature introduced in chapter 2 on
lean management, MAS in lean organisations and lean accounting, to develop the
literature driven theoretical conceptualisation, which puts the discourse between actors
involved in those literatures in context.
3.2 Background on Actor-Network Theory (ANT)
Actor-network theory relates to the work of Von Bruno Latour, Michel Callon and
John Law with other colleagues on the sociology of science during the 1980s (Latour,
1987; Callon, 1986). ANT aims at providing an interpretation of social and
technological developments using a balanced combination of both a socially and
technically focused view of change (Lewis, 2007). According to Bruno Latour;
As a first approximation, ANT claims that modern societies cannot be described
without recognizing them as having a fibrous, thread-like, wiry, stringy, ropy,
capillary character that is never captured by the notions of levels, layers,
territories, spheres, categories, structures, systems. It aims at explaining the

64
effects accounted for by those traditional words without having to buy the
ontology, topology and politics that go with them. ANT has been developed by
students of science and technology, and its claim is that it is utterly impossible to
understand what holds society together without reinjecting in its fabric the facts
manufactured by natural and social sciences and the artefacts designed by
engineers. As a second approximation, ANT is thus the claim that the only way to
achieve this reinjection of things into our understanding of social fabrics is
through a network-like ontology and social theory (Latour 1996, p. 370).
As elaborated in Latour's definition, from an ANT’s perspective, understanding a social
or a technological development is not possible without analysing the natural, social and
technical artefacts fabricating it. These artefacts can potentially develop a 'network'
which can be relatively stable for some time. Yet, it is also necessarily changeable
through the continuous alliances between the network’s contributors (Lewis, 2007).
Those contributors are known as “actors” or “actants”– as Latour prefers to call them
(Latour 1987, 1996). To Latour (2005), anything that is able to make a difference to the
network is regarded as an actor. Accordingly, network actors can be human or non-
human i.e. 'non-individual entities' (Latour 1996, p. 369) such as technical artefacts,
procedural arrangements (Lewis, 2007; Alcouffe et al., 2008), structures (Modell et al.,
2017) and accounting calculations (Callon, 1998a; Briers and Chua, 2001; Makenzie,
2006; Mouritsen et al., 2009). Actors interactions with one another can form alliances
which can then develop a relatively stable network of common goals through a process
of “translation” (Callon, 1986; Chua, 1995). Latour defines a translation process as “a
displacement, drift, invention, mediation, the creation of a link that did not exist before
and that to a degree modifies the original design” (1999, p.179). ANT is mostly
concerned about the relationships and processes established in this translation process
through the coming together of all human and non-human actors to form alliances that
add to the network 'relative stability' (Law, 1999). The next section expands on the
ontology of ANT and the reasons why it is chosen as the theoretical lens for this
research.

65
3.3 Ontology of ANT and the Rational for Choosing it for this Research
Latour (1991, p. 128) explains that ANT is “relationist”. The ontology of ANT
assumes that; “..society is not what holds us together, it is what is held together”
(Latour 1986, p. 276). As discussed in the previous section, to Latour (1996, p. 370), the
only way to understand what holds society together is to analyse the fabrics formed
through the several interactions involving human and non-human actors. Explaining
ANT’s relationist ontology, Callon (1987, p. 93) views actor-network as
“simultaneously an actor whose activity is networking heterogeneous elements and a
network that is able to redefine and transform what it is made of”. Hence, actors’
interactions attempt to stabilize what we perceive as a network and the dynamics of this
network also form and/or reshape the characteristics of actors, each time they participate
in those interactions. Accordingly, this ontology also involves a constructivism aspect
where, reality is not only seen as relational, but also as being “constructed” (Modell et
al., 2017). Moreover, such construction process is endless (Law, 1992). Callon and
Latour (1981, p. 283) explain that reaching a stabilized network requires actors “...to
bring into play associations that last longer than the interactions that formed them”.
Latour considers this as a situation that requires explanation and results under some
“unusual circumstances” (Latour 1986, p. 268)
A distinguishing feature of ANT is that it helps researchers place objects at the centre of
their research (Justesen and Mouritsen, 2011, p. 161). Using ANT, non-human actors
are as important in their study and analysis as human ones. Modell et al. (2017, p.68)
explain that ANT has a “flat ontology” where “…All actors are on the same level”. In
this sense, ANT does not set a priori for pre-existing structures or agencies. Actors are
analysed not because of their agency, but only based on the connections they establish
with their interactions. Justesen and Mouritsen (2011, p. 177) note that ANT:
---Rejects traditional sociological dichotomies, such as micro/macro,
subject/object, structure/agency and technical/social. Instead of reducing the
explanation to either side of such dualisms, ANT rehabilitates the detailed
description of processes and actions at the empirical level.
66
This forms one of the main reasons why ANT is chosen as the theoretical lens for this
thesis. With a focus on the developments in MAS involving interactions among people,
calculations and perhaps technical systems, there is a need to use a theoretical lens
which facilitates the understanding of non-human interactions as much as it does with
human ones. A second reason is that, ANT’s ontology of continual constructivism
allows for exploring developments experienced in MAS and the role played by VSC as
interactions change over time. This is quite helpful given the longitudinal nature of the
case study conducted in this research. Using ANT, developments in an organisation’s
MAS are regarded as an ongoing process (Modell et al., 2017) that can only be
understood by delving into the dynamics of the organisation actants’ stories as they tell
them, ‘without imposing on them a priori definition of their world-building capacities'
(Latour 1999, p. 20). The research uses ANT together with Callon’s (2007, 2010)
performativity thesis to move beyond the idea of how MAS’s reality is constructed, to
analysing the trails and fabrics making up this construction. In doing so, the research
applies Latour’s (2005, p. 165) approach to ‘slowciology’ i.e. ‘going slow’/ ‘don’t
jump’ (Latour, 2005, p. 190), to better understand the trail of events and interactions
forming a construction. This is thought to help bring about rich interpretations of the
organisation’s MAS and practices, especially given the ambiguity of our knowledge of
the developments and operation of MAS and lean accounting practices as VSC in a lean
context (Fullerton et al., 2013).
Prior to settling on ANT as the theoretical lens for this research, considerations were
given for other possible theoretical approaches; namely institutional theory, contingency
theory and systems theory. However, they were found unsuitable for this research, given
its objectives and research questions. Institutional theory focuses on the processes by
which structures are infused to derive social behaviour (Scott, 2004). Structures within
institutional theory include routines, rules, schemes, practices and norms (Scott, 1987).
However, the theory does not pay any consideration to the roles played by non-human
actors (Modell et al., 2017). Institulisation of practices, norms or rules are interpreted
only via analysing humans’ roles in this process (for a detailed discussion on
institutional theory see: Meyer and Rowan, 1977; Scott, 1987; Scott, 2001). Hence, for
its ignorance of the role played by non-human actors, institutional theory (Modell et al.,
2017) was not suitable for this research, especially considering the second research aim
67
which focuses on the role of VSC calculations in a lean environment. Additionally, both
the second and third research questions of this study do not seek to understand how
VSC as a management accounting practice is infused. Yet, they mainly seek to
understand the role played by VSC in a lean management environment, whether VSC
accepted or not and what factors affect its acceptance or rejection.
Contingency theory2 postulates that, the optimal approach to organise any organisation
is dependent (contingent) on the nature of the organisation’s surrounding internal and
external environment (Scott, 1981). Even though this theoretical lens was extensively
used to develop various management control frameworks which did enhance
academics’ understanding of the different types of controls, recent literature reports that
contingency related frameworks were done in isolation from other contextual elements
surrounding organisations’ management accounting and control systems (Otley, 2016).
Whereas, other left out contingent variables can be the real reason behind the
development and operation of organisation’s MAS’s (Fisher, 1998; Chenhall, 2003).
This has over the time created fragmented theoretical conceptualisations and affected
theory building (Otley, 1980; Fisher, 1995; Langfield-Smith, 1997).
Recent management accounting literature has called for more context driven research
(van der Stede, 2015) that also fleshes out the social associations and interactions
affecting a MAS (Chenhall et al., 2011). Hence, treats accounting as ‘interpretively’
(Otley, 2016, p. 45) constructed (Justesen and Mouritsen, 2011) and achieves a ‘middle
ground between taking a firm initial theoretical position - as a rule governed - and the
attempt to build interpretations uncontaminated by prior beliefs, as is sometimes
suggested by the proponents of grounded theory’ (Otley 2016, p. 55). Hence,
considering the first research objective and its associated research question, contingency
theory was not suitable for this research, since its narrow view of the concept of fit
(Gerdin and Greve, 2004) fails to include specific organisations contexts as is the case
with lean management in this research. More importantly, the predictive nature of
2 For a thorough discussion on contingency theory, please see Otley (1980); Donaldson (2001) and Otley (2016).
68
contingency theory (Otley, 2016) does not allow for an interpretive understanding of the
social interactions experienced within an organisation’s MAS.
Finally, a consideration was also given to systems theory at the start of this research.
Systems theory claims that; “a system can be defined as any object of study that,
although consisting of different elements mutually interconnected and interacting with
each other or the external environment, reacts or evolves as a whole with its own
general rules. The constituent elements of a system, the subsystems, are said to interact
when the behavior of one of them influences the others. The reciprocal influence occurs
through exchanges of energy, matter, or information.” (Andretta 2014, p. 1186).
An application of systems theory involves a system’s modelling process. Such process
depends predominantly on the description of the model’s constituting elements. These
elements are mainly: system’s input/s, output/s, state variables, random variables,
control variables and uncertain and exogenous variables (Laszlo and Kripnner, 1998).
This system’s modelling process with its elements was one of the main reasons for the
unsuitability of applying systems theory in this research. This is because, the
requirement to define the system’s input/s, output/s and different variables technically
means approaching the research field with predefined themes. This comes in absolute
contrast to ANT’s continual constructivism ontology, which allows for exploring the
developments in lean organisations MAS as an ongoing process (Modell et al., 2017), as
discussed earlier in this section.
In this research, viewing an MAS in a lean firm as a system where the researcher is
expected to mainly identify its elements – as stated earlier – acts against understanding
reality via actants’ stories as they tell them, i.e.; ‘without imposing on them a priori
definition of their world-building capacities' (Latour 1999, p. 20). Additionally, viewing
lean firms within the context of a system’s model comes in contrast with how lean
management implementation shall be viewed as a philosophy (Comm and Mathaisle,
2000; Detty and Yingling, 2000) and a journey, which differs from one organisation to

69
another and can only be understood via comprehending the organisation’s lean
approaches used and interactions made (Shimokawa and Fujimoto, 2009)3.
Having discussed the ontology of ANT and reasons why it is chosen as the theoretical
lens for this research, the next section defines ANT concepts used in this research.
3.4 Defining Theoretical Concepts Used
This section provides a detailed discussion of three main concepts grounded in ANT.
The section starts with a discussion of the term ‘Actors’, then follows in discussing the
concept of Networks. The final subsection presents a discussion of Callon (1986, 1991)
and Latour’s (1996) concept of translations.
3.4.1 Actors
To Latour, '(A)nything that modifies a state of affairs by making a difference is an
actor' (2005, p. 71) i.e. anything that has the ability to make a difference to the
surrounding world is regarded as an actor. A distinctive feature of Actor-network theory
is its emphasis on the ‘radical indeterminacy’ of the term actor (Callon, 1999, p. 181).
As explained in earlier sections of this chapter, actors can be anything: human or non-
human (Latour 1996). Callon explains that actors:
―may but need not be collectives. They may take the form of companies,
associations between humans, and associations between non-humans. In this
ontology actors have both variable content and variable geometry (1991, p. 140).
Hence, the term ‘actant’ is commonly used in association with ANT to denote the
inclusion of both human and non-human actors (Latour, 1987; 1996; 1999b). More
importantly, ANT sets no priority to human actors over any type of non-human actors
3 It is important to note that, some systems theory’s experts may view Ashby’s (1956) model of regulation and Beer’s (1959) viable system model useful for this research. This is because these models could be claimed to help explain the ‘literature driven theoretical conceptualisation’ explained later in this chapter (See figure 3.3). However, it is crucial to highlight that, as the name implies, figure 3.3 is a conceptualisation of the current literature on MAS in lean organisations using ANT as the theoretical lens. Hence, the figure only serves the purpose of providing a theoretical conceptualisation of this literature to date. This conceptualisation does not serve as a ‘research framework’ whose building blocks are meant to be tested using the empirics of this research, as is the case with most positivistic type of research.
70
(Callon and Latour, 1981). No privilege is given to any actor over another. Actors are
designated as such, only based on their ability to act i.e. their ability to make a
difference to their surrounding world (Latour, 1987). Though ANT identifies micro and
macro actors (Callon and Latour,1981), when it comes to their study and/or analysis,
ANT makes no difference, nor prioritises any of the actors. The ontology of ANT is flat
in the sense that, structures – (as an example of a macro actor) – takes no ‘priori’ to any
other micro actors such as; accounting practices or organisation employees (Latour,
1996a). The only distinction between a micro and macro actor is the number of
associations each actor can make. According to Callon and Latour (1981, p. 299), a
macro actor should have once been micro. Yet, this actor was capable of building many
associations with the surrounding world which eventually established a ‘long lasting
force’ to this actor. Hence, in the earlier example, organisation structures are viewed as
a macro actor, while accounting practices and individuals are micro ones. Finally, it is
important to note that in ANT terms, whatever is designated as an actor, is always
viewed as being in a process of continuous construction (Latour, 1987). Actors
characteristics are dynamic and continually evolving with different events, contexts and
interactions. Modell et al. (2017, p. 66) note that;
Instead of forming a pre-existing, immutable context for dynamic agency,
structures are viewed analogously to any other actors: they are momentarily
stabilised aggregates of local negotiations, controversies and other interactions
involving humans and non-humans (Callon and Latour, 1981).
3.4.2 Networks
The concept of networks in ANT allows for studying large connections involving
human and non-human actors. Briers and Chua report that, ANT’s concept of networks
‘emphasizes how borderless organisational life is’ (2001, p. 240). Such concept has a
sound insinuation in the study of economics and analysing coordination in different
economies (Callon, 2007). In defining the term ‘network’, Latour explains that:
―The word network indicates that resources are concentrated in a few places –
the knots and the nodes – which are connected with one another – the links and
the mesh: these connections transform the scattered resources into a net that may
seem to extend everywhere (1987, p. 180).
71
Hence, a network constitutes a collection of heterogonous elements that are kept
together and translated by various types of associations (Callon, 1986a), these elements
evolve and are crucial to the existence of the network in which they are all part of (Law,
1992). Callon explains that, in studying different economies, the focus is not simply on
viewing any market as a network so as to allow for its analysis. Yet, Callon perceives
markets as a type of borderless network which is explicitly organised in this manner to
allow for ‘the coordination of a large number of heterogeneous actors who define one
another through the circulation of intermediaries’ (2007, p. 150). Callon’s approach to
viewing markets reinforces ANT’s relational ontology promoting a continuous
construction of objects and realities. Explaining this, Modell et al. (2017) comment that:
‘An actor emerges from relational interactions and its characteristics are (re)defined
each time it is involved in the dynamics of a network’ (p. 66).
3.4.3 Translations
“--The process of associations through which an entity emerges and acquires its
characteristics is known as translation or construction, depending on which aspect of
the process is emphasized” (Modell et al., 2017, p. 66). Callon (1991) views the
translation process as a 'displacement', in other words, the process of capturing the
various associations preceding an outcome that seemingly give the impression that not
much has changed when change was actually witnessed to reach this outcome (Law,
1999). Hence, a translation process is viewed as a displacement in the sense that, an
actor be it human or non-human (Latour, 1996) displaces others, acting or speaking on
their behalf, with an intention in mind which the actors may or may not reach (Callon,
1986). According to Callon and Latour (1981, p. 279):
By translation we understand all the negotiations, intrigues, calculations, acts of
persuasion and violence, thanks to which an actor or force takes or causes to be
conferred on itself, authority to speak or act on behalf of another actor or
force....Whenever an actor speaks of 'us', s/he is translating other actors into a
single will, of which s/he becomes spirit and spokesperson.
72
Modell et al. (2017, p. 66) note that ANT’s notion of translation “stresses the idea that
a fact or an innovation does not emerge as a result of a linear development path but is
transformed and modified along its unpredictable trajectory”. Callon (1986) explains
that translations involve tests of strengths, where objects and/or entities which persist
against other actors are the ones that become real. However, as explained earlier; ‘---not
only the emerging entity that is modified during such a process, but the properties and
interests of the actors connected to it are (re)defined as well’ (Modell et al. 2017, p.
66).
A translation process involves the four moments of: problematisation, interessment,
enrolment and mobilisation (Callon, 1986). These four moments of translation are
usually referred to as elements of the ‘sociology of translation’ (Callon, 1986). Ezzamel
(1994, p. 219) defines problematisation as;
problematisation refers to agents’ efforts to make other agents subscribe to their
own conceptions by demonstrating that they have the right solutions to, or
definitions of, the others’ problems. This is achieved by channelling the target
agency through a set of unique and well-defined practices (obligatory passage
points) that are under the control of the enrolling agency.
Alcouffe et al. (2008, p. 3) refers to the same definition in a slightly more elaborative
way, replacing the word ‘agents’ by ‘actors.’ They also explain such ‘obligatory
passage points’ to include other artefacts for example; ‘external elements such as
cultural and discursive resources.’ Interessement involves the process of constructing
an interface between the interests of key network actors and efforts done to strengthen
the links between these interests (Lowe, 1997). Enrolment involves the formation of
alliances, through building agreements among key actors on their interests (Alcouffe et
al., 2008). The monitoring of how actors’ interests remain stable or change over time is
then done through the final translation process of ‘Mobilisation’ (Mouritsen et al.,
2001).
73
Within the concept of translations, Mouritsen et al. (2009) defines two forms of
translations which relate to interactions between accounting calculations and an
organisation’s adopted innovation. Those forms of translations go through the same four
moments of a translation process, yet the translation process can sometimes be called
‘short translation’ and in other times called, ‘long translation’. Mouritsen et al. (2009, p.
749) defines short and long translations as:
A short translation relates the calculation with changes in innovators’ conduct,
but it does not question the innovation strategy. It is short when it economises
innovation through influencing the time, resources and orientation of innovators.
It bends the innovation to its context by presentation of financial effects in
revenues, in contribution margins and gross margin.
--In addition to the short translation, there are also long translations generated
by competing calculations. These translations become longer because they
develop complex problematisation of the role of innovation in the firm strategic
consequences beyond the firm by taking many more entities into account.
In Mouritsen et al.'s (2009) paper short translations are witnessed in situations
associated with the use of a single accounting calculation. The translation process is
“short” as it does not include complexities and mediates4 between organisation's
concerns and the innovation implemented i.e. it affects how the innovation is managed
but, does not question it strategically. Whereas translation processes that are described
as “long”, involve more complexities, for example, the use of multiple competing
calculations as in Mouritsen et al.'s three case studies. Complexities affect the length of
the translation process and initiate a more profound effect than is the case with short
4 The research is using Miller and Power’s (2013, p. 557) definition of accounting practices mediating role; i.e. “--that much of what accounting instruments and ideas do--to link up distinct actors, aspiration, and arenas”. Yet, it is important to note that with a focus on performativity thesis and the analysis of the performative role of VSC, this research does not primary focus on how VSC mediates interactions between various actors in the case study conducted in this research. Yet, it focuses on how VSC performs or counter-performs in association with various interactions inside and outside the organisation.
74
translations. In Mouritsen et al.'s case studies, this is seen in terms of having competing
calculations which lead to questioning the innovation used.
As mentioned earlier, management accounting calculations can be treated as an actor
within an organisation’s MAS. The research builds on Mouritsen et al.'s (2009, p. 740)
view that, calculations do not only reflect the innovation adopted yet, by making things
visible, “Calculations influence how ‘different spaces and different times may be
produced inside the networks built to mobilise, cumulate and combine the world’
(Latour, 1987)”. Accordingly, when discussing the developments in MAS following
lean implementation the research is also concerned about how the accounting
calculations affect/ create new interactions within the organisation.
3.5 Framing and Overflow
Callon defines the concept of framing as the development of “…a boundary within
which interactions – the significance and content of which are self-evident to the
protagonists – take place more or less independently of their surrounding context”
(1998a, p249). Framing has been mostly used in association with the idea of
“economization”, more precisely “marketization” (Çaliskan & Callon, 2009, 2010;
Callon, 2007, 2010). According to Callon (1998a), a frame of action should be in place
for organisations to perform economic transactions effectively. In this sense, framing
includes the coming together of all elements needed for time and space to form “a set of
stable assumptions, conventions, mechanisms and settings” (Skaerbaek and Tryggestad,
2010, p. 110), that then allow for an economic transaction to occur (Boedker et al.,
2019). The framing process is of dual nature (Callon, 1998a). That is, a frame “--
presupposes actors who are bringing to bear cognitive resources as well as forms of
behaviour and strategies which have been shaped and structured by previous
experience” (Callon 1998a, p. 249). At the same time, interactions are not only
dependant on actors, but are also mobilised by other organisational and physical or even
virtual devices in our world which have been captured “within an institutional
framework…which helps to ensure their preservation and reproduction” (Callon 1998a,
p. 249).

75
Yet, the establishment of a frame is viewed as a reductionist process, more precisely an
incomplete one (Callon, 1998a). Frames include some elements, assumptions,
conventions and mechanisms associated with actants – (human and non-human) – in a
given space and time and does not necessarily account for other interactions with the
outside world. As Callon explains: “--framing puts the outside world in brackets, as it
were, but does not actually abolish all links with it” (1998a, p. 249). That which was
left out or put in bracket will always give rise to ‘overflows.’ Relationships, events,
links or connections – (with the outside world i.e. beyond the frame) – that transgress
the boundaries of the frame are what Callon defines as ‘overflows’ (1998a, p.251).
Connections defying the boundaries of a frame are what economists would have
previously bracketed when a frame was constructed. In a sense, these are the
‘externalities’ which economists are supposed to analyse ways of containing them
(Themsen and Skaerbaek, 2018). Callon (1998a) explains that, the approach of taking
frames as the norm would always view overflows as the exception, which needs a pre-
exerted effort to control and absorb, in the hope of avoiding any future ‘reverse
engineering’ activities on a constructed frame of interaction. Such approach to dealing
with frames directs our attention to the ‘success or failure’ of a frame (Themsen and
Skaerbaek, 2018). However, Callon (1998a) reports that it makes more sense to focus
on the ‘existence or non-existence’ of a frame. Callon explains that it is impossible to
assume that actors’ interactions with the outside world would have no bearing on the
organisational frames which they are part of. Additionally, though instruments and
devices might have a standardised way of work, they can still perform differently being
in different hands, locations or contexts. Hence, Callon (1998a, p. 256) would suggest a
focus on the ‘omnipresence’ of overflows, as he explains;
“…By focusing on the omnipresence of overflows, on their usefulness, but also on
the cost of actions intended (partially) to contain them, constructivist sociology
highlights the importance of the operations required to identify and measure these
overflows. It also encourages us to question the mechanisms used to create frames
by suggesting ways in which the social sciences might help to develop or to
confine such spaces of calculability.” (1998a, p.256)
76
Hence, frames are always perceived as fragile (Callon, 1998a; Themsen and Skaerbaek,
2018) whose formation presupposes ‘substantial investments’ by various human and
non-human actors associated with a frame (Callon 1998a, p.252). The framing process
has always been discussed in conjunction with ‘overflowing’. Overflows are viewed as
the norm (Jollands et al., 2018; Themsen and Skaerbaek, 2018), in Callon words they
are the ‘rule’, “framing is expensive and always imperfect…. in short, is very costly to
set up” (1998a, p. 252). Accordingly, to Callon the term ‘overflow’ is usually preferred
over ‘externalities’. An overflow is a broader concept that goes beyond external
organisational effects and how they are being quantified to include other matters of
concerns (Callon, 2007) such as values and ethics and encourages us to further analyse
these matters.
As Callon (1998a) explains in his quote above, understanding overflows requires their
identification and measurement. In this process actors can have different views on how
overflows are identified, quantified and dealt with. The extent of divergence in actors’
views and approaches regarding overflows tells whether these overflows are 'hot' or
'cold' (Callon, 1998a). Hot overflows are those where “...everything becomes
controversial: the identification of intermediaries and overflows, the distribution of
source and target agents, the way effects are measured” (Callon 1998a, p. 260). Hence,
actors’ negotiations of their different approaches to identify and quantify overflows can
create a disperse knowledge platform in which actors’ interactions develop and extend
affecting not only the overflow negotiated, but also the identities of actors involved.
In such situations of many controversies, framing becomes more difficult. Callon
explains that: “an agreement regarding the reality and scope of the overflows” needs to
be reached by actors to achieve a framing (Callon, 1998a, p261). Contrary to this
situation, cold overflows are those in which the divergence between actors' views on
quantifying and dealing with the overflow is small. In such case, actors’ views and
approaches lay down an almost similar knowledge platform from which they can move
to an agreement regarding 'the reality and scope of the overflow' (Callon, 1998a).
Explaining cold overflows, Callon notes that: “Actors are identified, interests are
stabilized, preferences can be expressed, responsibilities are acknowledged and
accepted” (1998a, p. 261). Hence, reframing becomes easier and there is a high

77
likelihood that experts from actors involved can arrive at an agreement on appropriate
way/s to measure overflows (Callon, 1998a). Unlike cold overflows, hot situations
invite the participation of more actors, perhaps non specialists, to help with developing
the measurements needed “to map out the externalities” Callon (1998a, p. 262). As
Callon (1998a, p. 262) defines the difference between hot and cold overflows:
―The distinction invites us to differentiate between two different types of
negotiations: (a) negotiations aimed at identifying overflows, or 'hot' negotiations
and (b) negotiations aimed at framing them, or 'cold' negotiations. The creation of
commercial relationships presupposes that both kinds of negotiations take place,
one after the other.
Accordingly, the dichotomy of hot and cold overflows always begs for an understanding
of the performance effects of these overflows. This explains why Callon has usually
linked his discussion of the intertwined concepts of framing and overflow with the
discussion of the concept of “performativity” (Callon, 2007).
3.6 Socio-Technical Agencements and Callon's Performativity Thesis
Early discussions of the term 'performativity' relates the concept to the study of
linguistics of performative utterances (Austin, 1962) and the social-cultural contexts
associated with them (Bourdieu, 1998; Butler, 2010). To Austin (1962), the statement 'I
pronounce you husband and wife' is a performative statement; i.e. an example of
performative utterances, as it “does” something. It “acts on the world to which it refers
and helps to make this world exist” (Callon, 2007, p. 9); i.e. it shows a change of
marital status of two people. Yet, the statement 'It is sunny today' is an example of
constative utterances, since it simply reports the fact that it is sunny on that day.
Statements here are seen as actors or actants as defined earlier in this chapter. Hence,
performativity is defined as actants’ ability to “act upon” or “actively engage in the
constitution of the reality that they describe” (Callon, 2007, p.12).
In his book “How to do things with words” Austin (1962, p. 5) introduced a framework
of three levels to explain how most statements can have an enacting role. Austin
explains that statements include:

78
1) “a locution”, which constitutes the actual words used by the speaker
2) “an illocutionary force”, which signifies what the speaker is trying to imply by
his uttered locution
3) “a perlocutionary effect”, which is the actual impact that the speaker has on the
interlocutor by using his locution
To demonstrate this, Callon (2007, p. 9-10) gives the example of telling someone that
they have lied. According to him:
---“If we say to someone that they have lied, and we consider only the main
meaning of the phrase, it is as if we told them that they knew the opposite of what
they had said. But apart from the main meaning, these words convey an
(accessory) idea of contempt, which makes them, insulting.” (Arnauld and Nicole
1970 {1662}).
In this extract the notion of an accessory idea denotes that which, along with the
propositional content of a discourse, constitutes what was later called its
illocutionary force – in this case its value as an insult. The mere fact of saying:
"You have lied" is at once a statement, a description of the state of the world
(which may be true or false) and an act through which the enunciator acts on the
enunciatee (the receiver) of the statement (by insulting him or her)
In Callon’s example, the perlocutionary effect relates to studying the actual effect that
the locution ‘you have lied’ have had on the receiver i.e. has he felt insulted? Or what
other effects/ feelings did the locution have on him? Austin reports that, perlocutionary
acts constitute the “consequences” even when they are “unintentional”’ (Austin, 1962,
p. 106)
Callon (1998b) builds on Austin’s (1962) framework to introduce the performativity
thesis considering the idea of material assemblages (Callon, 2005; 2007; 2010) or what
he prefers to call socio-technical agencements (Callon 1998b; 2007; 2010; Themsen and
Skærbæk, 2018). Callon’s performativity thesis maintains that the collective
contributions of theories, frameworks, technologies, human and other non-human actors
produce the reality they are trying to describe. Caliskan and Callon (2010, p. 9) define

79
socio-technical agencements as “…hybrid collectives…comprised of human beings
(bodies) as well as material, technical and textual devices”. Callon (2007, p. 13)
explains that, he is using the French term ‘agencement’ which – in his view – does not
have an exact alternative in English. To him the term can be somewhat close to the term
‘assemblages’, where he is using it to “…convey the idea of a combination of
heterogeneous elements that have been carefully adjusted one another. Agencements
are arrangements endowed with the capacity of acting in different ways depending on
their configuration.”
With the idea of socio-technical agencement in mind, Callon (2007) explains that
performation involves a pragmatic turn, a semiotic term and an ANT turn. The
pragmatic turn involves studying the illocutionary force associated with whichever is
performing, be it a statement or any other actor. The ANT turn relates to the analysis of
all the contributions made by other actors in their interactions with the performer.
Finally, the semiotic turn constitutes the study of the effect i.e. the perlocutionary effect
which the actor actually had on the network in which they are interacting. Hence, unlike
Judith Butler’s use of Austin’s (1962) ideas on performativity, where it is assumed that
illocutionary forces can be analysed in separation from perlocutionary effects, Callon
(2007, p. 13) argues that:
---there is nothing left outside agencements: there is no need for further
explanation, because the construction of its meaning is part of an agencement. A
socio-technical agencement includes the statement[s] pointing to it, and it is
because the former includes the latter that the agencement acts in line with the
statement, just as the operating instructions are part of the device and participate
in making it work.
Callon (2010) argues that it is very difficult to separate illocutionary forces from
perlocutionary effects, since if something did not act as intended, this means that an
overflow had a high degree of divergency, i.e. it is a hot overflow. Accordingly, that
thing has misfired. The dynamics and making up of such misfire form the semiotic turn
of studying performation or what constitutes the perlocutionary effect.

80
In the ‘I pronounce you husband and wife’ example, Callon (2010) argues that
conditions of felicity should be there for the statement to actually enact a successful
marriage. Hence, an analysis of the marriage enacted here, cannot be done in separation
from studying the effect/s it had on the actors involved. Given Callon’s ideas on socio-
technical agencements, these effects are the contributions of “heterogeneous elements
that have been carefully adjusted one another and are endowed with the capacity of
acting in different ways depending on their configuration” Callon (2007, p. 13). Since
conditions of felicity might not always be there, misfires/ overflow or ‘counter-
performativity’ effects can occur (Callon, 2010).
Bamford and Mackenzie5 (2018, p. 99) define counter-performativity as;
“--- a very particular form of misfire, of unsuccessful framing, when the use of a
mathematical model does not simply fail to produce a reality (e.g. market
results) that is consistent with the model, but actively undermines the postulates
of the model. The use of a model, in other words, can itself create phenomena at
odds with the model.”
Studying the performative role of financial models, Mackenzie (2007) views calculative
practices as engines with both an upstream that is formed of financial market data and a
downstream that is formed by the calculative practice used. Cumulatively, these
practices can be performative by luring people into taking actions to serve the purpose
for which the practice is used. In a more recent study, Boedker, Chong and Mourtisen
(2019) divide the accounting literature discussing accounting performation into two
strands. A first strand which the authors call the ‘performativity’ strand, focuses on
accounting transformative power, i.e. its ability to act as an engine trigging dialogues,
affecting space and time, luring people into taking actions (Dambrin and Robson, 2011;
Miller and Power, 2013; Vosselman, 2014; Revellino and Mouritsen, 2015; Themsen
and Skaerbaek, 2018) and constructing reality rather than just representing it (Hines,
1988). The second strand includes the emerging literature on accounting
5 They build on Mackenzie (2007, p. 55) and Callon’s (2007) work defining counter-performativty as the process by which the “practical use of a calculative model makes economic or organisational processes less like their depiction”

81
‘incompleteness’. This strand focuses on the power of accounting driven by the
incompleteness of its calculative practices. It builds on the inherent ambiguity of
accounting (McSweeny, 1997) and the fact that it does not capture all performance
aspects needed by an organisation (Jordan and Messener, 2012; Busco and Quattrone,
2018). Boedker et al. (2019) explain that, in such situation managers will have to ‘make
do’ of the outcome/s of an accounting practice given how divergent this outcome can be
from the practice intended or promised outcome. Mackenzie and Spears (2014) note
that, there are multiple ways in which the actual use of a model can challenge their
empirical assumptions. The engine can be performative in a counter-active manner i.e.
“only by degrees and with caveats. --The engine still produces steam so that action
happens, although not necessarily according to the precise prediction made by the
engine, but instead by the fate of the engine in the hands of the many, each of whom
may distort it a little bit” (Revellino and Mouritsen, 2015, p. 34). Accordingly, there
exists more than one form of counter-performativity, the identification of which
involves a lot of uncertainty and needs further investigation (Boedker et al., 2019). This
is because, such identification mainly depends on the actual (in other words;
perlocutionary/ semiotic) effect models have on organisations or networks in which they
are interacting. To give an example; upon discussing the attitude of modellers towards
the Gausian coupla models, Mackenzie and Spears (2014, p. 436-437) explain that:
It could be that here we have the beginnings of a typology of mechanisms of
counter-performativity: models used for governance are undermined by being
gamed; models used to hedge derivatives are undermined by the effects of that
hedging on the market for the underlying asset.
Also, as Revellino and Mouritsen (2015, p. 34) explain:
Sometimes models and calculative practices may not work partly because people
are not effectively lured by them and partly because sometimes others also
produce and mobilise calculative practices that may be stronger than the one in
question; laboratories compete (Latour, 1987), just as calculations compete
(Mouritsen et al., 2009), for attention.

82
Boedker et al. (2019) submit that neither the accounting performativity nor the
incompleteness literature focuses on the counter-performativtiy of accounting practices
and how powerful this can be. In case of Mackenzie’s (2007) Black Scholes model, or
in the example of Gausian coupla models (Mackenzie and Spears, 2014), other
situations, or contexts along with investigating other finance and accounting models,
can give rise to other counter-performative effects. The analysis of these effects and
their making can be insightful in studying the power of accounting created via the
counter-performativity of its practices. As Callon (2007, p. 11) notes; “what is at stake
is the success or failure of the performation, what is at stake is the realization of the
socio-technical agencement inscribed in the statement”. Callon (2010) expects the
struggle between performation and co-performation (i.e. counter-performative effects)
to always exist. To him, maintaining the illocutionary force of an actor or arriving at a
successful performation where, all ‘…the (material and institutional) conditions
required for its success are met, --implies the active presence of appropriate socio-
technical agencements’; i.e. “--A successful illocution, [is] like a successful
performation” Callon (2010, p. 164). According to Callon:
As such an adjustment is always fragile and rare, the general rule is a misfire. We
can choose to call this misfire overflowing, when we equate perlocutionary
performativity (i.e. performation) with a framing that, like any other, produces or,
rather, ends up producing, its own overflowings. Illocutionary performativity is a
successful performation because it is able to make inactive and invisible the
overflowings or misfires that comprise any illocution but that will (perhaps) be
discovered only later (2010, p. 164).
3.7 Misconceptions and Critique to ANT and Performativity Thesis
In his article ‘On recalling ANT’, Latour pinpoints some of the misconceptions
associated with the use of some ANT terminology. Latour (1999) explains that creators
of ANT should have been cautious in choosing to use a “technical metaphor” as the
word network. According to him with the spread of using the term “network”,
especially after the creation of the world wide web, there seems to be a common
understanding of what the term means. However, that is not what Latour and colleagues
intended to designate by the word ‘network’ in their earlier work. Latour argues that:

83
What is the difference between the older and the new usage? At the time the
word network, like Deleuze's and Guattari's term rhizome, clearly meant a series
of transformations--translations, transductions--which could not be captured by
any of the traditional terms of social theory. With the new popularization of the
word network, it now means transport without deformation, an instanteous,
unmediated access to every piece of information. That is exactly the opposite of
what we meant. What I would like to call 'double click information' has killed
the last bit of the critical cutting edge of the notion of network. I don't think we
should use it anymore at least not to mean the type of transformations and
translations that we want now to explore (1999, p. 15-16).
Latour tried to explain that, by the time the word ‘network’ was chosen for ANT, it
intended to mean the “series of transformations” or “translations” as defined earlier in
sub-section 3.4.3 of this chapter. The intention was to settle on a word to convey the
meaning of a “series of translations” and take such meaning away from others grounded
in traditional social theory. Later on, this formed one of the critiques addressed to
researchers using ANT, especially those employing Callon’s four moments of
translation (Callon et al., 1983; Callon, 1986; Latour, 1987). Whittle and Spicer (2008,
p. 618) explain that;
The un-reflexive application of the four-stage model to other settings belies a
positivistic attempt to verify the universality of Callon’s original account
(Cordella and Shaikh, 2006). The danger is that studies of organization are
reduced to a series of deductive tests that confirm or refute the four-stage model
of translation, as opposed to being a process of inductive theory generation,
theory that is grounded in and emergent from the empirical data.
This research take care of this by applying Latour’s (2005, p. 165) approach to
‘slowciology’ i.e. ‘going slow’/ ‘don’t jump’ (Latour, 2005, p. 190), to understand the
trail of events and interactions forming an organisation’s MAS as a construction. As
will be discussed in chapter 6, section 6.2, translation moments experienced in the case
study conducted in this research are discussed and analysed in a non-mechanical way to
show the “series of transformations” experienced in the organisation as they occurred.

84
In most of their work, Latour and Callon tried to emphasize that ANT adopts a
constructivism research ontology, not a social constructivist one (Latour, 2005; Callon,
2007). Unlike the use of social scientists, the word ‘network’ as used in ANT is not
meant to designate “Society” as the “big animal making sense of local interactions” nor
is it intended to refer to “an anonymous field” of macro powers or forces such as
cultures, structures, values and norms (Latour 1999, p. 17). According to Latour, saying
that society is not “socially” constructed does not limit the work of social scientists, but
it does open new venues of understanding the social (Latour, 2005). As Latour put it;
ANT might have hit on one of the very phenomena of the social order: may be
the social possess the bizarre property of not being made of agency and structure
at all, but rather of being a circulating entity (1999, p. 17).
Hence, Latour would sometimes refer to the word network as a circulation (Latour,
1999; Latour 2005). To Latour, ANT is inspired by insights from ethnomethodology
and semiotics, he had mostly used the word ‘textual account’ to refer to the process of
understanding the social (Latour, 2005). Albeit, not literally mentioned in almost all
management accounting literature using ANT, readers of this literature can sense that
there are some usages of ANT in that literature which tend to treat reality as “socially
constructed” not simply “constructed”. According to Latour, perceiving reality as
socially constructed implicitly means that a researcher has the social means or laws by
which he/she can explore/ interpret this reality (Latour, 1996, 1999, 2005). Yet, saying
that reality is just constructed – as ANT claims – means liberating researchers from any
laws or pre-assumptions about this reality, which reinforces ANT’s ontology of
continual constructivism (Modell at al., 2017). ANT represents a way of ‘delegitimating
the incredible pretensions of sociologists who, to use Bauman's forceful expression
(Bauman, 1992), want to act as legislators and to open yet another space for
interpretive sociology’ (Latour 1999; p. 19). In Latour's terms, such definition has the
notion of “unique adequacy” used in ethnomethodology (Latour, 2005), that is; in ANT
terms, actors possess the knowledge of what they do, in addition to how and why they
do it, ‘…It is us, the social scientists, who lack knowledge of what they do, and not they
who are missing the explanation of why they are unwittingly manipulated by forces
exterior to themselves and known to the social scientist's powerful gaze and methods’

85
(Latour 1999; p. 20). Accordingly, in this research a constructivism ontological stance is
adopted to reinforce ANT’s continual constructivism ontology. It also allows for
understanding the interactions forming the developments in an organisation’s MAS in
the context of lean and the interactions identifying the role played by VSC, as they
develop over the longitudinal period of the case study. This is discussed thoroughly in
section 4.3 of the next chapter (chapter 4) on research methodology.
Most critique of ANT is based on the claim that it embraces a relativistic epistemology
(Law, 1991). ANT’s flat ontology presuming no agency for structures, cultures or any
other actants – except via their own interactions/ associations with other actants – has
resulted in describing ANT’s ontology as “naïve realism” (Elder-Vass, 2008; Yang and
Modell, 2015; Modell et al., 2017). With a believe that ‘--may be the social possess the
bizarre property of not being made of agency and structure at all, but rather of being a
circulating entity’ (Latour 1999, p. 17), Latour (2005) does accept such description.
Modell, Vinnari and Lukka (2017) responds to this critique by emphasizing that ANT
embraces a mix of relationist, realist and constructivist ontology and that is what Latour
and colleagues intended for the use of this theory. According to them:
----ANT deviates from classical realism by arguing that actors cannot be divided
into permanent essential features and accidental superficial properties; an actor
is simply the sum of all the properties that it has at a particular moment
(Harman, 2009) (Modell et al. 2017, p. 66).
In response to this critique, this research embraces Callon and Latour’s (1981) ontology
that structures, norms or agencies are constructed and stabilised overtime, only on basis
of local negotiations and interactions of both human and non-human actors.
Finally, the main critique to performativity thesis is based on the claim that “not all
theories can be performative”, this argument is quite common in economics literature
(Brisset, 2016). This is what Vosselman and De Loo (2020) refer to as: working with
performativity embracing an ontology of “becoming” instead of an ontology of “being”.
Basically, this critique directs researchers to the importance of considering the potential
of the enlightening effect of counter-performativity. This is also what Boedker et al.
(2019) perceive as the gains from the accounting “incompleteness literature”. In other

86
words, when theories or models counter-perform, they can still develop useful insights,
even if the model deviates from its expected prediction. This research strongly supports
this notion of the benefits from counter-performative models. Accordingly, as discussed
in section 3.3 of this chapter, in analysing the data related to the second research
question on the performative role of VSC, the focus is not on how it is diffused. Yet, it
is mainly on exploring and understanding the role played by this management
accounting practice, whether it has been performative or even when it counter-performs.
3.8 Management Accounting Literature on Lean and Callon's four Moments of
Translation
As discussed earlier, this research first provides a literature driven theoretical
conceptualisation of the MAS in the context of lean using ANT as the theoretical lens of
this thesis. In doing so, the following subsections utilise Callon's four moments of
translation (Callon et al., 1983; Callon, 1986; Latour, 1987) to conceptualise how
academic and consultancy literature discuss developments in MAS during and
following lean management implementation. Key actors in such conceptualisation
mainly include academics, consultants and management accounting practices and/ or
controls.
3.7.1 Problematisation: problematising traditional management accounting and control system
Early academic efforts addressing the incompatibility of traditional management
accounting and control system to work with process innovations such as lean, are
attributed to the work of Kaplan (1984; 1986), followed by his book with Johnson
(Johnson and Kaplan, 1987) to confirm the loss of relevance of such system to work
with those innovations. Other academic work then followed (Kaplan, 1989; Ittner and
Larcker, 1995) to support the same arguments Johnson and Kaplan (1987) put to
problematise traditional control systems. Those authors built their arguments on the
grounds that these systems fail to support and recognize payoffs from new production
innovations (Kaplan, 1989; Berliner and Brimson, 1998). They argued that, because of
their extensive focus on overhead allocation and end of period performance measures
such as variance analysis, traditional accounting practices and controls provide
aggregate (Ittner and Larcker, 1995) and distorted information, which are likely to drive
87
organizations to make decisions counter to the new innovation objectives (Johnson and
Kaplan, 1987). Johnson and Kaplan have then concluded that a new management
accounting and control system should be developed to work with JIT and process
innovations such as lean (Johnson and Kaplan, 1987; Kaplan, 1988).
Other academic literature; (Ahlström and Karlsson, 1996; Ward and Graves, 2004;
Johnson, 2006) also adds to the problematisation process in a lean-specific context. For
example, discussing the role of management accounting and control system in lean
organisations, Ahlström and Karlsson (1996) confirm the need for a more “lean-
tailored” control system. Moreover, they report that, failure to do so can impede the
process of lean management implementation. As shown in figure 3.1, Ahlström and
Karlsson (1996) demonstrate that as organisations move away from managing single
operators and functional machines to managing via multifunctional teams and flow lines
or what is now well known as “value streams” (Fullerton et al., 2013), they will need to
raise their accounting unit of analysis for example, from managing by individual
product unit costs to handling total value stream costs. The same thing is expected to
happen as lean implementation moves to higher organisation levels i.e. from the lower
operating level to the whole production system and further up to top managerial levels
as illustrated by the vertical arrow in figure 3.1.
Figure 3.1 does not only serve as a first indicator for the progression towards a value
stream-oriented accounting and control system that we now know as 'lean accounting'
(Tillema and van der Steen, 2015). Yet, from an ANT perspective on problematisation,
figure 3.1 shows other factors used by actors of both academics and consultants to
convince readers and managers “to subscribe to their own conceptions/ view” (Ezzamel
1994, p. 219; Alcouffe et al., 2008, p.3).
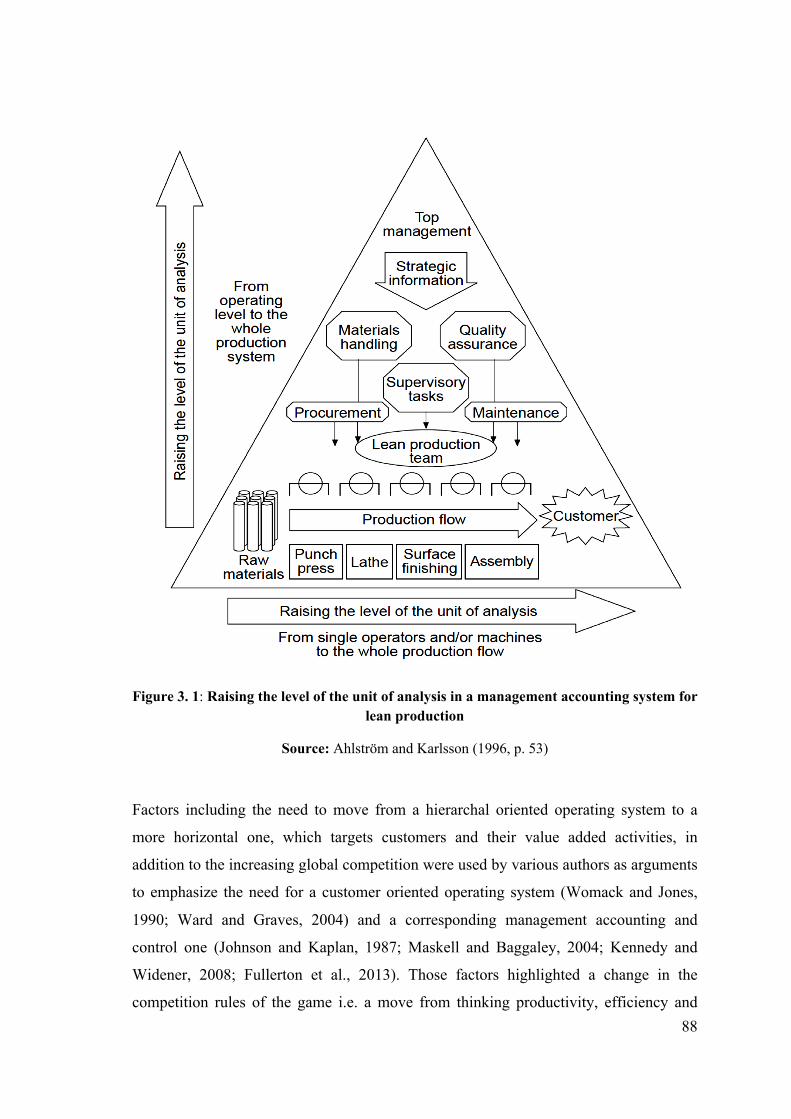
88
Figure 3. 1: Raising the level of the unit of analysis in a management accounting system for lean production
Source: Ahlström and Karlsson (1996, p. 53)
Factors including the need to move from a hierarchal oriented operating system to a
more horizontal one, which targets customers and their value added activities, in
addition to the increasing global competition were used by various authors as arguments
to emphasize the need for a customer oriented operating system (Womack and Jones,
1990; Ward and Graves, 2004) and a corresponding management accounting and
control one (Johnson and Kaplan, 1987; Maskell and Baggaley, 2004; Kennedy and
Widener, 2008; Fullerton et al., 2013). Those factors highlighted a change in the
competition rules of the game i.e. a move from thinking productivity, efficiency and

89
cost reduction to thinking in terms of customer demand variability and global
competition as elaborated by Johnson and Kaplan (1987) and Womack and Jones,
(1990). Such factors add more to problematising the relevance of the 'cost driven' and
‘accounting-based’ traditional management accounting and control system (Hansen and
Mouritsen, 2007; Maskell and Kennedy, 2007; van der Steen and Tillema, 2018) to
work with lean.
Consultants also played a key role in problematising the ability of traditional accounting
and control system to work with new process innovations, mainly through introducing
the lean accounting system (Baggaley and Maskell, 2003a; Maskell and Baggaley,
2004) or other consulting solutions similar to it (Darlington6, 2013; Darlington et al.,
2016) and drawing on some aspects from the Theory of Contraints (TOC) (Goldratt and
Cox, 1986). This was followed by various texts explaining the traditional control
system’s drawbacks (For example: Maskell and Baggaley, 2004; Baggaley, 2006;
Maskell and Kennedy, 2007; Brosnahan, 2008). In their book, Maskell and Baggaley
(2004) provide a whole chapter explaining the reasons for the need for a lean
accounting system. As explained in section 2.14 of chapter 2, many of these reasons are
attributed to various pitfalls in the traditional management accounting system. Grasso
(2005) questioned the ability of activity-based costing and resources-consumption
accounting practices to work in a lean management environment. Other consulting
literature (Baggaley and Maskell, 2003a; Baggaley and Maskell, 2003b; Baggaley,
2006; Debusk and Debusk, 2012) used numerical examples of lean accounting practices
and controls as compared to traditional control ones not only to show lean accounting
merits, but also to draw readers’ attention to how a traditional management accounting
and control system will default with new innovations as lean.
6 John Darlington is a consultant who created ‘flow accounting’; a suggested accounting solution to the drawbacks of traditional accounting and control system in a lean environment. Flow accounting builds on lean management principles and theory of constraints (TOC). Some ideas in flow accounting resemble those suggested by a lean accounting system, especially in costing, decision making and performance measurement.

90
3.7.2 Interessment: Constructing 'an interface' between literature key actors
Even though Ahlström and Karlsson (1996) did not use any theoretical
approaches to try to conceptualise the role of management accounting controls in a lean
environment, they did put such role in some context given their description in Figure
3.2. According to Ahlström and Karlsson (1996), a threshold of positive achievements
on the performance measurements level is needed first, in order to justify lean
implementation efforts and give a green light for more management accounting
developments to take place. In their case study such green light was achieved using a
productivity measure. Once productivity gives positive results to justify pay offs from
lean implementation, more lean tailored management accounting practices can be
triggered. If more congruence of management accounting system to the process
innovation adopted is achieved, more performance enhancements are driven.
Consequently, performance measures and management accounting practices act in a
loop which supports the adopted innovation or as Ahlström and Karlsson put it;
“By measuring in a new way, the manufacturing strategy and the management
accounting system can become increasingly congruent. This can be likened to a
self-reinforcing loop: better results point to the appropriateness of the changes,
which further leads to changes in the management accounting system, which
now is able to detect more positive results and so on” (1996, p. 51).
So, the overall message is that a green light from performance measures on the
innovation used should be achieved first for more changes in management accounting
system to occur. It is interesting how Ahlström and Karlsson's ideas can be further
interpreted using Mouritsen et al. (2009) paper on management accounting calculations.
In Mouritsen et al.'s (2009) terms, Ahlström and Karlsson (1996) idea on achieving a
performance measurement threshold first can be explained via the view of management
accounting calculations as short translations; i.e., the usefulness of management
accounting calculations can only be appreciated through mediation.
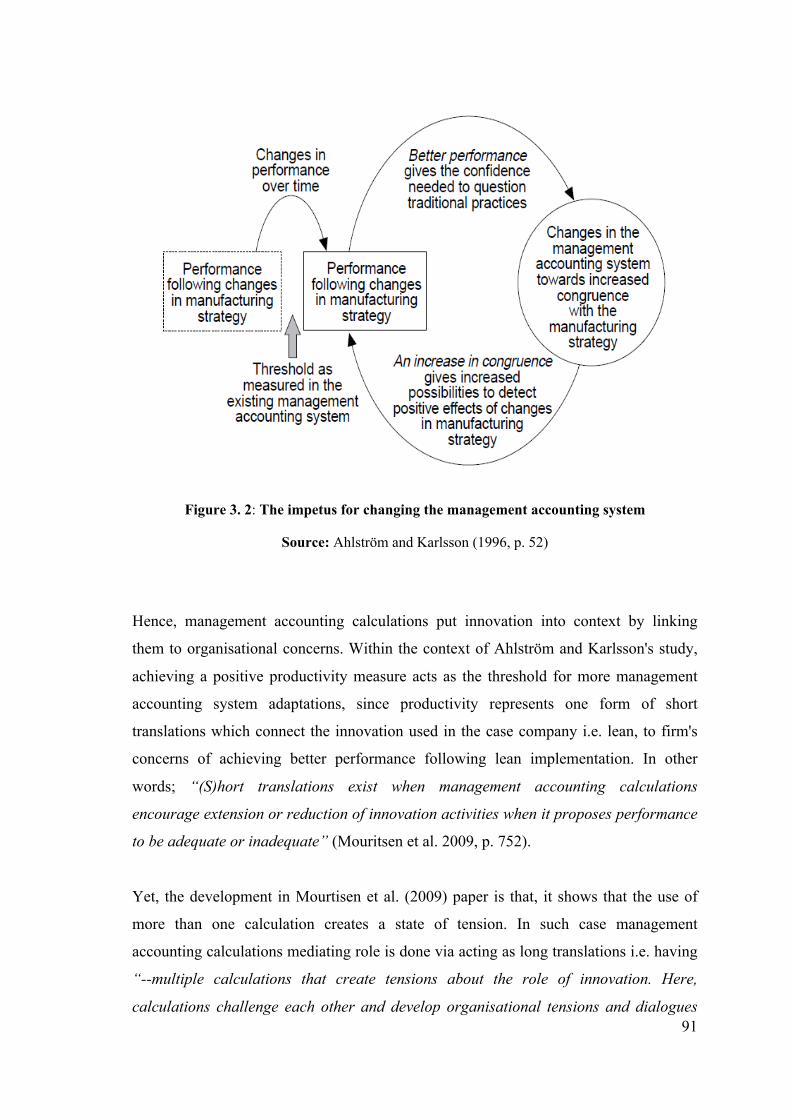
91
Figure 3. 2: The impetus for changing the management accounting system
Source: Ahlström and Karlsson (1996, p. 52)
Hence, management accounting calculations put innovation into context by linking
them to organisational concerns. Within the context of Ahlström and Karlsson's study,
achieving a positive productivity measure acts as the threshold for more management
accounting system adaptations, since productivity represents one form of short
translations which connect the innovation used in the case company i.e. lean, to firm's
concerns of achieving better performance following lean implementation. In other
words; “(S)hort translations exist when management accounting calculations
encourage extension or reduction of innovation activities when it proposes performance
to be adequate or inadequate” (Mouritsen et al. 2009, p. 752).
Yet, the development in Mourtisen et al. (2009) paper is that, it shows that the use of
more than one calculation creates a state of tension. In such case management
accounting calculations mediating role is done via acting as long translations i.e. having
“--multiple calculations that create tensions about the role of innovation. Here,
calculations challenge each other and develop organisational tensions and dialogues

92
beyond innovation activities” (p. 739). Accordingly, unlike Ahlström and Karlsson
(1996) findings, congruence is not always assumed as a consequence of a performance
measure driving the use of another management accounting calculation. As Mourtisen
et al., (2009) conclude in their study, tension can exist extending or hindering
innovation activities through affecting other technological artefacts and inter-
organisation relationships. Hence, if a performance measure can drive the use of further
management accounting calculations, these calculations are expected to create tension,
which is either absorbed or is likely to obstacle innovation activities. Additionally,
going back to Callon’s performativity thesis, “what is at stake is the success or failure
of the performation” (Callon, 2007, p. 11). Accordingly, how this tension is handled, its
effect/s and which calculation/s are stabilised, depend on actors’ interactions and the
performativity or counter-performative effects of calculations or other actors involved.
Tillema and van der Steen (2015) discuss ways to absorb the tension created in lean
organisations due to the use of lean accounting controls whilst having traditional
accounting controls in place. The main contributions of their paper are that, they
provide empirical evidence that traditional and lean controls can work together. More
importantly, that the concept of 'decoupling' as suggested by Johnson and Kaplan
(1987) is not the only possible way to absorb tension arising from the inconsistencies
between lean and traditional management accounting controls. As shown in table 3.1,
Tillema and van der Steen (2015) suggest that, in their case studies, the five
mechanisms of: colonising, decoupling, compromising, implement incrementally and
obscuring are used as non-mutual exclusive ways to absorb tension between controls.
The appropriate mechanism to contain tension is determined on basis of the problem
area created by the tension. These problem areas involved: a need to justify investments
over lean implementation, an internal need from operating system to use more lean
tailored performance measures and a need to validate the reliability of financial
information.

93
Colonising Decoupling Compromising Implementing
incrementally
Obscuring
• Investments X X X
• Operations X X
• Financial
information X X
Table 3. 1: Problem areas and ways of containing tensions found in the case companies
Source: Adapted from Tillema and van der Steen (2015, p. 80)
However, in the four case studies discussed by Tillema and van der Steen (2015), most
of the efforts done to absorb controls’ tension were mainly done on the performance
measurement level. The paper merely tackles how management accounting practices for
example; costing practices, are being handled in the case companies, whether these
practices are lean tailored or following a traditional control system and whether this
adds to or reduces the tension between traditional and lean controls. Organisations in
the four case studies conducted by the authors, were always alarmed by the fact that top
management are detached from local internal operations compared to lean proponents in
operating activities. Accordingly, managers at upper hierarchal levels, either had less
faith in lean success or were more bound to the use of traditional controls to measure
performance and provide reliable financial information to comply with auditors’
guidelines (Tillema and van der Steen, 2015). A situation which lead Tillema and van
der Steen to conclude that with respect to the problem area handled; “(T)he lean
proponents in the case companies preferred the mechanisms which involve a higher
degree of support from organisational levels” (2015, p. 81).
Even though the studies by Ahlström and Karlsson (1996) and Tillema and van der
Steen (2015) differ in whether the use of more accounting calculations creates tension
or more accounting congruence to the process innovation adopted, both studies seem to
agree on the idea that performance measures do give first green light or motivation for
further management control adaptations. Yet, if more allies from academic and
consultancy domains are to be integrated to this discussion, this idea would come in
contrast to the work of other authors from both domains. For example, other academic

94
literature using contingency theory to determine factors affecting lean implementation
and the use of a lean tailored accounting system (Kennedy and Widener, 2008;
Fullerton et al., 2013; Fullerton et al., 2014), regards the use of a simplified accounting
system and the lean accounting value stream costing tool as having a mediating role
between lean implementation and the use of more lean tailored and visual oriented
performance measures.
From a consulting viewpoint, Ahlström and Karlsson's (1996) and Tillema and van der
Steen's (2015) findings also come in contrast to Maskell and Baggaley's (2004)
description of the maturity path to the use of lean accounting. Value stream costing as a
core lean accounting costing and decision-making practice (Kennedy and Widener,
2008; Fullerton et al., 2013) is regarded as a companion to lean firms managing by
value streams and a pre-step to using the suggested lean accounting performance
measures (Maskell and Baggaley, 2004).
3.7.3 Enrolment: Trying to build an agreement between literature key actors
Given Tillema and van der Steen’s (2015) findings, if it is acceptable that both
traditional and lean accounting controls work together and that decoupling is not the
only available mechanism used to keep the use of both controls going, then what is the
role played by other management accounting practices, for example VSC, in this lean
environment? Previous academic work suggests that; “accounting practices is an
important intervening variable in the relation between the lean manufacturing strategic
initiative and control components. Thus, studies that investigate the relation between
lean manufacturing and use of non-traditional performance measures, or other social
and behavioural controls, may leave out an important mediating variable” (Kennedy
and Widener, 2008, p. 320). More importantly, and perhaps looking at the bigger
picture, how can we establish an understanding of the overall construction and
developments in organisations’ MAS in the context of lean?

95
Discussing the debates around centralisation and decentralisation, Quattrone and
Hopper (2005, p. 736) comment that;
“Divisional performance measurements and delegated budgets enable senior
management to exercise 'decentralised centralisation'. General managers at HQ,
assisted by staff specialists, can concentrate on strategy whilst retaining central
control through periodic accounting representations of scattered units'
performance and plans in budgets. Segments are treated as black boxes: line
managers make operational decisions with little central intervention providing
financial targets are attained”
Reflecting on Quattrone and Hopper's (2005) and findings from Tillema and van der
Steen’s (2015) paper on the relation between top management and internal lean
proponents at the operational level, suggests that, we might be having a situation of two
control networks in lean firms. One network revolving around operating activities with
key actors of; lean proponents, lean tailored controls and other traditional accounting
controls such as standard costing (Tillema and van der Steen, 2015). According to Rao
and Bargerstock (2011), standard costing is still being used in most lean firms as a
result of their inventory levels, extent of JIT implementation and number of monuments
used. Chances are that, the second control network revolves around meeting top
managers’ and auditors’ financial needs and includes actors of top-level managers,
auditors and traditional accounting controls, as is the case in Tillema and van der
Steen’s (2015) four case studies. In a later paper focusing on the case of multidivisional
lean organisations, van der Steen and Tillema (2018) report that, tension between
accounting-based i.e. traditional and lean controls can even be detrimental to the
progress with lean implementation. They suggest that multidivisional organisations take
lean management implementation one step at a time and regard it as a piecemeal, rather
than a whole project.
However, we are not sure whether the two control networks will be the case or not. All
we have are the interpretations we can get from the very few detailed case studies
available on lean and MAS, such as those discussed in Tillema and van der Steen’s
(2015) paper. Also, more details are needed on what happens after the tension – as
Tillema and van der Steen (2015) calls it – or the competing calculations as described

96
by Mouritsen et al. (2009). If we move beyond the five suggestions for containing
tension, the question then becomes: how do managers, operators, accountants and other
human and non-human actors - (for e.g. accounting calculations, accounting information
systems…etc) interact to make use of or move from the tension created. Additionally, is
it still one management accounting and control network? In ANT terms, what actors'
interactions form the fabrics of a MAS and developments it experiences in this context
of lean. Additionally, what does this say about the performativity or counter-
performativity of calculations or other actors involved.
In an attempt to develop a theoretical driven conceptualisation, which puts the
previously mentioned views in context, figure 3.3, proposes that; current literature
implies that there could be a chance that further progress with lean leads to having two
sets of control networks one that is related to organisations’ operating system and
another one related to top managers and auditors’ needs. Figure 3.3 represents a
restructure of Ahlström and Karlsson's (1996) ideas on the role of management controls
in lean environments shown in figure (3.2). It also integrates Mouritsen et al.'s (2009, p.
749) ideas on ‘management accounting calculations in long term translation’ and
Tillema and van der Steen's (2015) results on the mechanisms to contain control
tension, to show how both networks can be expected to interrelate. The upper part of
figure 3.3 tries to integrate what is known from lean accounting studies using
contingency theory (Kennedy and Widener, 2008; Fullerton et al., 2010; Fullerton et al.,
2013), with both the findings of the case studies done by Ahlström and Karlsson's
(1996) and Tillema and van der Steen (2015). Studies using contingency theory
classifies top management support as a primary factor needed for initial implementation
and progress with lean management (Kennedy and Widener, 2008; Fullerton et al.,
2010; Fullerton et al., 2013). Tillema and van der Steen (2015) affirm this idea by
concluding that maintaining support from top organisation’s managers is a crucial
element for the success of any of the mechanisms an organisation decides to use to
contain the tension between traditional and lean controls.

97
Figure 3. 3: Literature Driven Theoretical Conceptualisation – Putting ‘interessment’ arguments in context
Source: Developed by the author
Competing Calculations' Effects
Competing Calculations
Top Management Support, Performance Measures and Progress in Lean
Z Y X
Top Management
Support
Company used Performance
measures (Mostly Traditional PM)
Confidence needed for further
Implementation of Lean Management and congruential changes in MAS
Innovation strategy 'Continue Lean'
Alternative Innovation strategy 'Discontinue Lean'
Dom
inan
t Cal
cula
tion
New
/Com
peting Calculation
Operating System Control Network
Lean controls/
lean performanc
Lean proponent
s
Traditional control
practices
Top Management Control Network
Top level
manage
Traditional control
practices
Auditors
Threshold

98
Top management support establishes a level of confidence within top level managers
about prospective lean improvements, helping them to accept and be motivated about
further progress with lean implementation (Tillema and van der Steen, 2015; van der
Steen and Tillema, 2018). Revisiting Ahlstrom and Karlsson's (1996) ideas on the
impetus for management accounting change in figure 3.2, having top managers support
can be preceding changes in company used performance measures following lean.
According, to Ahlstrom and Karlsson (1996) positive changes in one of the
organisation’s performance measures is then regarded as the threshold for more
progress with lean implementation and further congruential changes in organisation’s
MAS to support lean.
Following Mouritsen et al.'s (2009) ideas on short and long translations, more progress
with lean can trigger more calculations which are expected to create tension affecting
the innovation adopted; i.e. Lean management. Hence, in figure 3.3, the two
overlapping arrows are used to signify the expected tension between calculations. The
bold arrow is used to point to the ‘dominant calculation’ and the dotted one shows the
new or ‘competing calculation’ (Mouritsen et al., 2009, p. 749). Given the high
percentage of lean firms still depending on traditional accounting practices (Rao and
Bargerstock, 2011), the very low rate of lean accounting implementation (Fullerton et
al., 2010; Rao and Bargerstock, 2013) and the limited likelihood to find an organisation
that fully adopts lean tailored controls (Tillema and van der Steen, 2015), such
dominant calculation/s is presumed to be the traditional accounting ones, while lean-
tailored/ lean accounting practices and controls, are the new competing ones.
According to Mouritsen et al. (2009) competing calculations interact in long translations
that influence the innovation strategy, leading an organisation to question the innovation
strategy or propose an alternative one. This is shown in figure 3.3 through a proposition
that tension between calculations developed from both control networks can either lead
organisations to continue to use lean or it can impede lean implementation. Obviously,
there can be a continuum of other alternatives in between. Yet, as mentioned earlier in
this section this needs further investigation from both the academic and consultancy
sides. Moreover, Mourtisen et al. (2009) report that the tension created by using
multiple calculations is expected to affect the two elements of: other technological
99
artefacts within the organisation and inter-organisational relationships. The authors
reached this conclusion on basis of the three case studies they conducted. However, in
the literature driven theoretical conceptualisation shown in figure (3.3), those elements
are denoted by three bold circles (X, Y and Z), since they can be are left for further
exploration of more lean based case studies.
This section aimed at developing an agreement between literature key actors discussing
the operation of MAS in the context of lean, following Callon's (1986) third translation
stage of enrolment. Yet, as discussed earlier, the available literature fails to provide an
agreed upon view on how MAS is constructed or reconstructed following lean
management implementation. So, what this section tried to do is to put the arguments
discussed in the ‘interessement’ translation stage in context, using the ideas
demonstrated in figure 3.3 to develop a literature driven theoretical conceptualisation.
The empirics to the research hope to contribute to both knowledge and practice in
demonstrating how MAS is constructed and develops following the move to lean
management and the role played by lean accounting practices such as VSC. The next
chapter introduces the path to the empirical analysis of this research through discussing
the research methodology adopted.

100
Chapter 4: Research Methodology
4.1 Introduction
This chapter lays out the foundation for the research methodology adopted in this
study. Identifying the methodology adopted requires an understanding of the different
research paradigms, their ontological and epistemological assumptions and the available
research approaches, strategies and methods with which this research can be associated
(Shah and Corley, 2006). This is also consistent with the three aspects of good quality
qualitative research as explained by Tong et al. (2007); i.e., explaining the research
design, discussing research team/s and how data are analysed and reported. This chapter
is divided into 8 sections, section 4.2 presents a summary of the main research
paradigms and discusses their ontological and epistemological assumptions. Section 4.3
discusses the research design for this study and provides the rational for choosing its
research paradigm and research approach. Research strategies are discussed in section
4.4, highlighting the strategy adopted in this study, together with the research method
espoused and the reasons for its adoption. Section 4.5 identifies the data collection
methods used in this research. Section 4.6 discusses the role of the researcher. Section
4.7 provides a discussion of the data analysis approach chosen for this research. Finally,
section 4.8 concludes the chapter by providing a summary of its main ideas.
4.2 Research Paradigms and their Ontological and Epistemological Foundations
An initial step to discussing how this research is designed, is to go through some
basic ontological and epistemological foundations to which this research design is
related. A researcher's ontological stance is associated with their views about the nature
of reality (Guba and Lincoln, 1994; Collis and Hussey, 2009). According to Creswell
(2007), ontology relates to what constitutes reality. Crotty (2003) identifies objectivism,
subjectivism and constructivism as the three different ontological positions. From an
objectivist ontological stance, reality meanings can be explored as the objective truth
about the world (Bryman and Bell, 2007). Whereas, following a subjectivism
ontological position, reality constitutes the subjective meanings imposed on objects that
the researcher studies (Bryman and Bell, 2007; Gibbs, 2007). As will be explained in
detail in section 4.3 on research design, this research adopts a constructivism
101
ontological position. A constructivism ontological stance emphasizes that “social
phenomena and their meanings are continually being accomplished by social factors”
(Bryman, 2004, p.17). Constructivists view reality as multiple and constructed by
individuals or groups who are continuously trying to make sense of their formed reality
constructions (Guba and Lincoln, 1994). In other words, from a constructivism position,
an interaction between the objective and the subjective bring reality to existence
(Crotty, 2003). In this sense, a researcher is assumed to actively take part in
understanding and presenting certain reality constructions (Delanty, 2005) which are
related to the areas of his/her study. As Guba and Lincoln (1994, p.111) put it;
Constructions are not more or less "true," in any absolute sense, but simply more
or less informed and/or sophisticated. Constructions are alterable, as are their
associated "realities".
--The variable and personal nature of social constructions suggests that individual
constructions can be elicited and refined only through interaction between and
among investigator and respondents.
--The final aim is to distil a consensus construction that is more informed and
sophisticated than any of the predecessor constructions (including, of course, the
etic construction of the investigator).
A researcher's epistemological assumption is “--concerned with what we accept as valid
knowledge” (Collis and Hussey, 2009, p. 59). Epistemology relates to the nature of
knowledge and “attempt[s] to explain how we know what we know” (Crotty, 1998, p.
18). According to Bryman (2004, p.11), the primary dispute around epistemological
assumptions has to do with “whether the social world can and should be studied
according to the same principles [and/or] procedures”. Historically, positivism and
interpretivism formed the two major extremes of research paradigms for researchers'
epistemological stances (Crotty, 2003; Bryman, 2004; Bryman and Bell, 2007). Yet,
according to Collis and Hussey (2009, p. 57), there is “a continuous line of paradigms
that can exist simultaneously” in a ‘continuum’ of paradigms between the two
‘extremities’ of positivism and interpretivism. As one moves along the line of the
paradigms’ continuum, the features of a paradigm are relaxed from the extreme
positivism to interpretivism. New paradigms emerge in between the extremities and are

102
distinguished in accordance with their philosophical assumptions (Collis and Hussey,
2009).
Prior to discussing the differences in the philosophical assumptions underlying
positivism and interpretivism research paradigms, it is necessary to go through the
definition of a paradigm. In simple terms Collis and Hussey (2009, p. 55) define a
research paradigm as: “a philosophical framework that guides how scientific research
should be conducted”. Guba and Lincoln (1994, p. 108) refer to research paradigms as
the 'inquiry paradigms', according to them:
Inquiry paradigms define for inquirers what it is they are about, and what falls
within and outside the limits of legitimate inquiry. The basic beliefs that define
inquiry paradigms can be summarised by the responses given by proponents of
any given paradigm to three fundamental questions, which are interconnected in
such a way that the answer given to any one question, taken in any order,
constrains how the others may be answered.
Guba and Lincoln then named those three questions as: 1. the ontological question, 2.
the epistemological question and 3. the methodological question (1994, p. 108). Their
definition of what constitutes a research/inquiry paradigm can be described as more
informative in the sense that, they highlight how an inquirer's i.e. researcher's
ontological stance shall shape his/her views on what constitutes knowledge and the
approach in which he/she shall go about in generating it. Likewise, an inquirer's view on
what constitutes knowledge will imply his/her ontological stance, together with the
methodological approach he/she intends to use. Collis and Hussey (2009) report that the
word ‘paradigm’ has been used in different philosophical contexts and could imply
different meanings. However, they quote Morgan (1979) who suggested three levels in
which the word paradigm can be used;
• At the philosophical level, where the term is used to reflect basic beliefs about
the world.
• At the social level, where the term is used to provide guidelines about how the
researcher should conduct his or her endeavours.
103
• At the technical level, where the term is used to specify the methods and
techniques, which ideally should be adopted when conducting research. (Collis
and Hussey 2009, p. 57)
For this chapter, the first two levels are used in relation to the word ‘paradigm’, first at a
philosophical level in order to identify the philosophical assumptions underpinning the
positivism and interpretivism research paradigms. Secondly, at a social level in order to
provide guidance on the design and methods of this specific research. Tables 4.1 and 4.2
represent the assumptions of the positivism and interpretivism research paradigms, as
well as the main features of each paradigm as described by Collis and Hussey (2009, p.
58-62).
Bryman and Bell (2007, p. 16) report that, positivism is “...an epistemological position
that advocates the application of the methods of natural sciences to the study of social
reality and beyond”. As shown in tables 4.1 and 4.2, the positivism paradigm views
social reality as objective and external (Easterby-Smith et al., 2002; Collis and Hussey,
2009). For positivists, there is only one reality (Collis and Hussey, 2009), whose
properties are to be measured via objective, empirical and analytical methods (Smith,
2003). Knowledge constitutes the facts gathered by the researcher and which layout the
foundations of laws and principles (Bryman and Bell, 2007). Hence, for positivists,
theories are mainly used to develop testable hypotheses (Bryman and Bell, 2007; Collis
and Hussey, 2009; Saundres et al. 2009). Positivists claim to be value-free/unbiased
researchers, who are mostly detached from the subject matter being researched
(Bryman, 2004). Proponents of the positivism paradigm seek to achieve generalisable
and reliable results using large samples (Collis and Hussey, 2009) to increase the
generalisability, reliability and replicability of their results (Gill and Johnson, 2002).
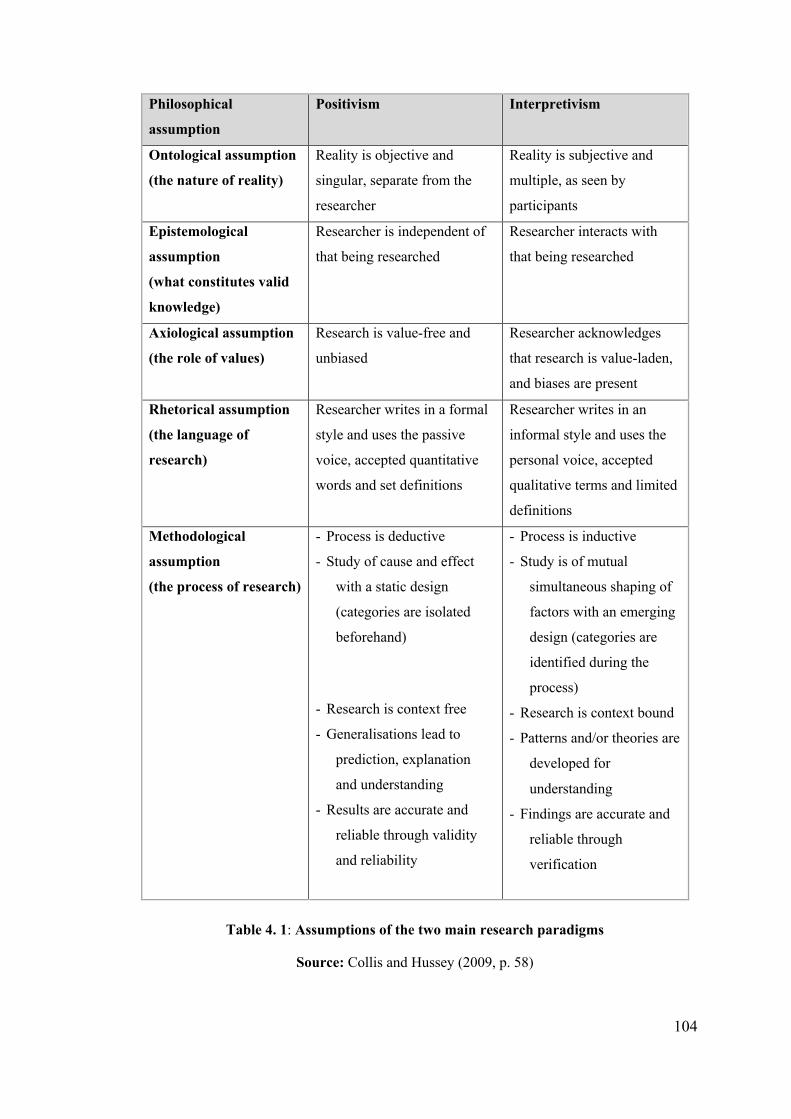
104
Philosophical
assumption
Positivism Interpretivism
Ontological assumption
(the nature of reality)
Reality is objective and
singular, separate from the
researcher
Reality is subjective and
multiple, as seen by
participants
Epistemological
assumption
(what constitutes valid
knowledge)
Researcher is independent of
that being researched
Researcher interacts with
that being researched
Axiological assumption
(the role of values)
Research is value-free and
unbiased
Researcher acknowledges
that research is value-laden,
and biases are present
Rhetorical assumption
(the language of
research)
Researcher writes in a formal
style and uses the passive
voice, accepted quantitative
words and set definitions
Researcher writes in an
informal style and uses the
personal voice, accepted
qualitative terms and limited
definitions
Methodological
assumption
(the process of research)
- Process is deductive
- Study of cause and effect
with a static design
(categories are isolated
beforehand)
- Research is context free
- Generalisations lead to
prediction, explanation
and understanding
- Results are accurate and
reliable through validity
and reliability
- Process is inductive
- Study is of mutual
simultaneous shaping of
factors with an emerging
design (categories are
identified during the
process)
- Research is context bound
- Patterns and/or theories are
developed for
understanding
- Findings are accurate and
reliable through
verification
Table 4. 1: Assumptions of the two main research paradigms
Source: Collis and Hussey (2009, p. 58)

105
Positivism tends to: Interpretivism tends to:
Use large samples Use small samples
Have an artificial location Have a natural location
Be concerned with hypothesis testing Be concerned with generating theories
Produce precise, objective, qualitative data Produce 'rich', subjective, qualitative data
Produce results with high reliability, but low
validity
Produce findings with low reliability, but
high validity
Allow results to be generalised from the
sample to the population
Allow findings to be generalised from one
setting to another similar setting
Table 4. 2: Features of the two main research paradigms Source: Collis and Hussey (2009, p. 62)
On the other hand, proponents of the interpretivism paradigm view that, “the world we
experience arises from multiple, socially constructed realities” (Gibbs, 2007, p. 7). For
interpretivists meanings “...are constructed by human beings as they engage with the
world they are interpreting” (Crotty, 1998, p. 43). Accordingly, interpretivists would
question the applicability of natural science research methods to social studies,
suggesting that having multiple realities in the world should necessitate a different logic
of doing research (Bryman and Bell, 2007). Interpretivism requires researchers to
understand that reality is subjective and could have multiple meanings as individuals
and institutions are different from one another (Collis and Hussey, 2009; Saunders et
al., 2009).
Interpretivism acknowledges the variation between individuals and objects in natural
sciences and suggests that, such difference should be respected, so that social sciences
are able to grasp the subjective meanings of social actions (Saunders et al., 2009).
Hence, there is a high chance that an interpretivist research is value-laden and include
some research biases as researchers interact with that being researched (Collis and
Hussey, 2009, p. 58). Interpretivism view that the purpose of structures, patterns or
theories developed through research, is to serve the understanding of social actions
(Creswell, 2003). Interpretivists’ research is “context bound” (Collis and Hussey, 2009,
p. 58) in the sense that; the realities are “culturally derived and historically situated
interpretations of the social life world” (Crotty, 1998, p. 67). Accordingly, replicability

106
of interpretivists’ research could be difficult in many cases, as Johnson and Duberley
(2000, p.9) point out;
There are a multitude of truths each of which vies for attention but none of
which has more validity than any other.
To sum up, ontological positions lie between the two extremities of positivism and
interpretivism (Collis and Hussey, 2009). Other authors can also refer to these
paradigms as the extreme objectivism versus the extreme subjectivism (Easterby-Smith
et al., 2002; Creswell, 2003) where, constructivism lie between the two extremes and
more towards the an interpretivism paradigm (Lincoln and Guba, 1985; Tashakkori and
Teddlie, 1998; Easterby-Smith et al., 2002; Creswell, 2003; Collis and Hussey, 2009).
Having defined the two main philosophical research paradigms, the next section
presents a detailed discussion of the research design adopted in this study.
4.3 Research Design
Given the research’s main objectives to conceptualise the developments of
organisations’ MAS in the context of lean and investigate the role played by the lean
VSC practice, this research adopts a constructivism paradigm. As mentioned earlier,
constructivists predicate that meanings and objects create knowledge (Maines, 2000).
Accordingly, objects are merely found, but are rather made (Fisher, 1973) and hence
meanings are not a researcher's discovery, but are a social construction (Crotty, 2003).
In this sense, a MAS following lean implementation is regarded as a construction which
involves various interactions between human and non-human actors, as explained in
chapter 3. According to Guba and Lincoln (1994, p.113), within the constructivism
paradigm;
The aim of inquiry is understanding and reconstruction of the constructions that
people (including the inquirer) initially hold, aiming towards consensus but still
open to new interpretations as information and sophistication improve. The
criterion for progress is that over time, everyone formulates more informed and
sophisticated constructions and becomes more aware of the content and meaning
of competing constructions.

107
Guba and Lincoln’s comment on the aim of inquiry under a constructivism paradigm
reinforces Latour’s (2005) ideas on ‘slowciology’ promoting not only a study of how
reality is constructed, but also, the trails forming this reality fabrications. A
constructivism stance matches the use of ANT as the theoretical lens for this research
with its continual constructivism ontology (Law, 1992; Modell et al., 2017). This allows
for understanding the interactions forming the developments in an organisation’s MAS
in the context of lean and the interactions identifying the role played by VSC, especially
given the longitudinal nature of the case conducted in this research, where several
interactions are expected to occur over the study period.
Another reason forming the rational for choosing a constructivism paradigm for this
research has to do with perceived role of the researcher in this specific type of research.
Within a constructivism paradigm “--The inquirer is cast in the role of participant and
facilitator in this process” (Guba and Lincoln, 1994, p. 113). ‘Activism’ forms one of
the key concepts of constructivism (Guba and Lincoln, 1994). Hence, with most of the
available lean literature reporting the need to change organisations’ MAS following the
use of lean (Åhlström and Karlsson, 1996; Ward and Graves, 2004; Maskell and
Baggaley, 2004; Grasso, 2005; Fullerton et al., 2013; Tillema and van der Steen, 2015)
and with the new lean tailored accounting system i.e. lean accounting receiving very
low implementation rates (Fullerton et al., 2010; Rao and Bargerstock, 2011), it is very
much expected that the researcher will have a role in explaining some lean tailored
accounting practices such as VSC. A constructivism stance allows for such participative
role by the researcher and hence facilitates their job in understanding the dynamics
forming developments in lean organisations’ MAS and investigating the role played
VSC. This also matches Latour (1999, p. 18) views on ANT commenting that;
This is already an important contribution of ANT since it means that when one
explores the structures of the social, one is not led away from the local sites—as
it was the case with the dissatisfied social scientist— but closer to them.
Figure 4.1 provides a diagram representation of where this research fits within different
ontological and epistemological stances. The epistemology dimension is represented on
the vertical axis and the horizontal axis represents the ontology dimension.

108
Figure 4. 1: Representation of where this research fits within the Philosophical Paradigms
Source: Adapted from Johnson and Duberly (2000)
A second step following the choice of the research paradigm adopted is to decide on the
research approach to be used (Saunders et al., 2009). The deductive and inductive
approaches form the two main research approaches used by researchers (Bryman and
Bell, 2007; Collis and Hussey, 2009). According to Gibbs (2002), a deductive approach
usually starts with the general and ends with the specific, using large sets of data to
describe the logic behind objective realities. As a result, deduction begins with
hypotheses formulation on basis of theories and general ideas. It then gathers data to test
and assert these hypotheses to be able to come up with general conclusions (Cavana et
al., 2001). In contrast, an inductive approach traces the logic behind arguments, leading
to the move from the specific to the development of general statements, which relate to
a certain phenomenon (Gibbs, 2002). Accordingly, induction requires an initial
detection and analysis of patterns and meanings based on observations, with the aim of
Positivism (researcher is 'detached' from that being researched)
Interpretivism (researcher has an 'involved' role)
Subjectivism (Ontology)
Objectivism (Ontology) Constructivism
(Epistemology)
This Research
109
formulating links and relationships for the development of general ideas/statements or
theories (Cavana et al., 2001).
While the logical reasoning in research can be deductive or inductive or a combination
of both (Dewey, 2011), this research adopts an inductive approach of paradigm of
inquiry i.e. “...it attempts to establish patterns, consistencies, and meanings.” (Gray,
2014, p. 18). More specifically, the research adopts an exploratory inductive approach
in which general inferences and findings shall be driven by real life observations (Collis
and Hussey, 2009). Because management accounting and control system takes different
styles with respect to the used innovation (Bisbe and Otley, 2004) and lean management
implementation takes various patterns depending on age, size, industry and other
organisational factors (Shah and Ward, 2003), researcher is expected to identify patterns
of the developments in organisations’ MAS as relevant to the nature and degree of lean
implementation to come up with her inferences on how MAS is constructed following
the use of lean. This explains the reason for adopting an inductive research approach.
This approach also fits with the chosen constructivism paradigm (Guba and Lincoln
1994, p. 110) suggesting that ‘reality is not fixed or given’ (Ravn 1991, p. 97), but takes
various formats (Guba and Lincoln 1994) requiring researchers to make their own
inferences about it, based on their observations (Collis and Hussey, 2009).
4.4 Research Strategy and Method
Research strategy represents a general plan of how the researcher will go about
developing answers to his/her research questions (Bryman and Bell, 2007; Saunders et
al., 2009). The two main strategies for doing research in social science are namely:
quantitative and qualitative research (Saunders et al., 2009). Research strategies and
their associated methods are usually influenced by the chosen research paradigm (Collis
and Hussey, 2009). Quantitative research mainly seeks to identify universal laws of
nature so that they can be used to explain and predict different phenomena (Cavana et
al., 2001). Consequently, it is usually associated with positivist and deductive research
(Crotty, 2003), which mostly relies on large samples and the use of numerical data to
produce findings by means of quantification or employing certain statistical procedures
(Bryman, 1998).
110
Whereas qualtative research is mostly used for studies focusing on the in-depth analysis
of single cases or small samples to develop interpretations of people's experiences
through the researcher's interaction with that being researched (Flick, 2002; Gill and
Johnson, 2002). For its focus on making inferences about people's understandings and
developing meanings of different social contexts (Miles and Huberman, 1994; Heath,
1997), qualitative research is usually used by proponents of constructivism and
interpretivism research paradigms (Guba and Lincoln, 1994; Ticehurst and Veal, 2000).
Qualitative research using case study methods has also been used in various studies on
the role of management controls in organisation learning (Kloot, 1997; Batac and
Carassus, 2009), knowledge management (Ditillo, 2004), strategic change (Marginson,
2002), innovation (Chiesa et al., 2009, Mouritsen et al., 2009) and in research on the
tension created between the different organisational controls (Frow et al., 2005; Mundy,
2010; Tillema and van der Steen, 2015). Qualitative research is found to be more
approperiate for this research as a lean tailored MAS or what we now know as the lean
accounting system is still regarded as an emerging concept (Chopra, 2013). There are
various calls for empirical research clarifying researchers’ and practitioners’
understanding of the system’s practices (van der Merwe and Thomson, 2007; Kennedy
and Widener, 2008). Tillema and van der Steen (2015) call for more research on the
operation of MAS following lean. Fullerton et al. (2013) also recognise the need for
detailed empirical studies explaining the operation and role played by lean tailored
accounting practices such as VSC. Generally, detailed empirical evidence on
management accounting practices has often been missing from research on companies
using advanced manufacturing techniques (Fullerton and McWatters, 2002), such as
lean management. In this sense, trying to conceptualise the development in MAS in the
context of lean implementation together with investigating the role played by VSC and
factors affecting its acceptance or rejection, can be regarded as an attempt to gain
understanding of a phenomenon that not much is known about, which justifies the
adoption of a qualitative research approach in this research (Ghauri, 2004; Marshan-
Piekkari and Welch, 2004).
Crotty (2003) explains that, research methods are the techniques used by the researcher
to collect and analyse data related to his/her area of inquiry. According to Silverman
(2009, p. 121), “the choice of the method should reflect an overall research strategy.”

111
Additionally, the choice of a research method is highly associated with a researcher's
philosophical stance (Long and Johnson, 2000). Reflecting on the philosophical stance
of this research viewing MAS as constructed and following a qualitative research
strategy that seeks to gain in-depth understanding of MAS construction or
reconstruction in the context of lean, a case study research method is identified as most
suitable for this research. Collis and Hussey (2009, p. 82) define a case study as: “a
methodology that is used to explore a single phenomenon (the case) in a natural setting
using a variety of methods to obtain in-depth knowledge.” According to Yin (2003), a
case study is best used when the objective of the research is not solely to explore a
specific phenomenon, but also when the aim is to understand such phenomenon within a
certain context i.e. obtain a rich understanding within a real life context using various
sources of evidence (Morris and Wood, 1991; Robson, 2002).
A case study strategy is regarded as most appropriate for this research, since the focus is
not only on obtaining an in-depth understanding of the development in MAS, but the
research mainly aims at gaining such understanding within the context of a lean
management environment. Also, looking at the available literature on MAS, case study
method is reported as one of the best ways to bring more insights on the use MAS’s
practices (Ferreira and Merchant, 1992; Langfield-Smith, 1997; Otley, 2016). Jönsson
(1998, p. 411) reports that, there is a lack of rich empirical evidence in management
accounting research and that available research is “limited to quick survey studies which
fit into the publication requirements of mainstream”. Hence, more case study designed
research is encouraged to grasp the details of actual situations and provide deeper
explanations of the complex accounting and control system in organisational contexts
(Lillis and Mundy, 2005; Henri, 2006; Davila, 2009; Otley, 2016). Case study research
method is favoured in management accounting research as it is mostly social, highly
contextualised and malleable in a way that frequently reflects different changes over
time (Chapman, 1997; Ittner and Larcker, 2001; Chenhall, 2003). Also, from a wider
perspective, since the research is of an interdisciplinary nature between management
accounting and operations management, both fields perceive case study research as
useful to their development. According to Scapens (1990) case study research shall
provide richer understandings of the management accounting practice and offer ways of
thinking about hidden problems, which represents an essential tool for management

112
accounting researchers. From an operations management stand, case-study is considered
as an important research method in the field of operations management, especially in
the process of developing new general or theoretical ideas (Voss et al., 2002).
Yin (2003) reports that a case study is generally preferred when researchers are trying to
address ‘how’ and ‘why’ questions. However, it does not preclude researchers to pose
‘what’ questions when conducting an exploratory case study on a phenomenon that not
much is known about, as is the case with this research. Ghauri and Gronhaug (2005)
assert this commenting that, case studies can be used to develop answers for ‘what’
questions in cases where an exploratory study is justified. Exploratory case studies are
mostly chosen to tackle largely ‘how’ questions such as the first research question of
this research, since they aim at gaining rich understanding of individuals experiences,
rather than using random samples to derive statistically significant results (Norman,
2001). Concerns associated with conducting case studies include; difficulty to
generalise from a single case study and that case study results can sometimes be driven
by a researcher’s bias to verifying his/her own assumptions or postulations. However, in
his study on the misunderstandings about case study research, Flyvberg (2006) outlines
that generalisation from a single case study is still possible. This depends on how
carefully a study is chosen and conducted, in addition to how crucial it is to the field
studied. Scapens (1990) also comments that, a focus on generalisation issues will only
lead researchers to lose various potentials of gaining more useful insights from case
study research.
On the possibility for researcher’s bias in case study research, Flyvberg (2006)
concludes that a researcher bias towards verifying his prepositions is a humanistic
character which is possible to be found in any type of research strategies. On contrary,
according to Flyvberg (2006, p. 237); ‘experience indicates that the case study contains
a greater bias towards falsification of preconceived notions than towards verification’.
Concerning this specific research, having a participating/active researcher type of
research should not be perceived as a problem. As discussed in the previous section,
having the researcher as one of the active participants sharing in the construction of the
phenomenon being researched constitutes one of the assumptions of a constructivism
research paradigm (Collis and Hussey, 2009). Additionally, this research uses a

113
triangulation approach to data collection in which various data collection methods are
used in one study to help ensure the researcher of what the data are actually telling
(Saunders et al., 2009).
There are four types of case study designs which include: 1. Holistic single case study
covering one unit of study, 2. Embedded single case, which investigates more than one
unit within the same case study, 3. Holistic multiple case studies, which involve more
than one case study analysing the same unit but in different cases and 4. Embedded
multiple case studies which tackle several cases of a number of unites within each case
(Yin, 1994). Ghauri et al. (1995, p. 93) report that;
A single case study is appropriate when a particular case is critical case and when
we want to use it for testing an established theory (and)...when a single case is an
extreme or unique case (or)...when is revelatory.
According to Lillis and Mundy (2005), holistic single case studies provide more in-
depth insights compared to the other types of case study designs. Also, reflecting on the
available management accounting and control literature, single case study method has
been reported as a useful method facilitating the understanding of the various roles and
uses of management accounting practices in single organisations (Ahrens and Dent,
1998; Birnberg, 1998; Otley, 1999, Otley, 2016). Given the complex nature of
management accounting and control system as a social phenomenon/construction,
holistic single case study is regarded as an effective method of studying the operation of
organisations’ MASs (Langfield-Smith, 1997; Chenhall, 2003; Ferriera and Otley,
2009). Given the previously mentioned reasons for adopting a qualitative research
strategy and using a case study method together with the inherent complex nature of
organisations’ MAS, this research uses a holistic single case study design in order to
gain in-depth details on the operation and developments of an organisation’s MAS in
the context of lean and on the role of played by VSC practice. The case study conducted
is of a longitudinal nature covering a period of twelve years of lean implementation.
The study is conducted on one of the factories of leading multinational organisation
(LT), specialising in automation and supply of electrical power components. LT’s
headquarters is in Zurich, Switzerland. The organisation has subsidiaries in more than
90 countries across the world. The case study is conducted on one of factories of LT’s

114
subsidiary operating in Egypt. The longitudinal case study covers the period from the
start of lean implementation (year 2004) till end of year 2016. The next section provides
a detailed discussion of the data collection process used in this research.
4.5 Data Collection
The data collection process for this research follows a triangulation technique by
using a mixed data collection approaches of; semi-structured interviews, observation,
focus groups7 and a review of some documents of the case organisation (Yin, 2003;
Creswell and Clark, 2011). Such use of mixed methods seeks to match the use of ANT,
as the theoretical underpinning of this research, in:
――Following the actor but also recognition of the value of different forms of
data, such as interviews, observations, document studies, etc. both represent
resources that the researcher can exploit in terms of bringing translations /
enactments of theoretical abstractions /conceptualizations into focus. More data
– more resources. (Hansen, 2011, p. 120)
Semi-structured interviews are used to help probe answers on various aspects of the
research and to allow the researcher to amend, omit or add some interview questions
whenever needed (Saunders et al., 2009). Interview participants include key
organisation actors associated with the organisation’s management accounting and lean
management systems. Using ANT as the theoretical lens of this research, organisation’s
actors include human actors who are identified in figure 5.1 of the next chapter on the
background of the case organisation chosen for this research. Organisation’s actors also
include non-human actors (Latour, 1999; 2005), which involve management accounting
calculations and controls used and other technical, procedural and/ or structural
arrangements (Lewis, 2007; Alcouffe et al., 2008) which can be identified in the case
organisation.
7 Lists of all interviews, observations and focus groups conducted including data collection hours, are available in thesis appendices A and B.

115
Interviews as a data collection method is argued to be more beneficial the richer are the
insights an interviewer can collect on the interviewee’s knowledge, experiences and
impressions (Fontana and Frey, 1994; Holstein and Gubrium, 1997). Additionally,
Alvesson (2003, p. 31) report that;
A theoretical understanding of the research interview means conceptualising
what goes on in the situation and how the outcomes can be understood. It means
a "thicker" understanding than the one provided by the interview as technique
forgetting data or the interview as a human encounter leading to in-depth shared
understanding.
Accordingly, in order to develop richer insights from interview data collected, and in
consistence with the constructivism research paradigm chosen for this research, the
researcher exhibited a participant role during the process of data collection and analysis
(Guba and Lincoln, 1994; Collis and Hussy, 2009). This was done especially when
handling the data related to the second research question, owing to the low
implementation rates of lean accounting practices (such as VSC) (Rao and Bargerstock,
2011; Tillema and van der Steen) and the lack of its implementation knowhow (Debusk
and Debusk, 2012). This was also needed given the research objectives, which required
the researcher to interpret the data collected in reference to the situation and context in
which they are gathered i.e. a certain pattern and maturity level of lean management
implementation. In other words, to help the researcher adopt a “reflexive” approach to
the interview i.e. “address the broader contextual issues affecting interviews”
(Alvesson 2003, p. 30-31).
For this research interviews are regarded as the main data collection method. However,
other supplementary methods including observations, focus groups and review of case
organisation documents, are also used in the data collection process. Observations are
used to obtain direct information on the organisation layout and the overall operation of
its operating and accounting departments in the natural setting; i.e., within a lean
management operating environment (Ghauri and Gronhaug, 2005). Such information is
beneficial in understanding the level of advancement of the case organisation with lean
implementation and the distribution of roles and technologies/ software used in its
MAS. A review of organisation’s documents including its costing and performance

116
measurement reports, is beneficial in gaining insights on its management accounting
practices and controls used over time. This has the aim of facilitating the inferences
made on the developments in organisation’s MAS and on the traditional accounting
practices used compared to the lean tailored ones. Finally, three focus group sessions
are conducted. Two focus group sessions are conducted to discuss management
accounting and control practices for LT transformers’ factory. These two sessions
aimed at discussing the organisation’s management accounting practices in place in
comparison to other possible alternatives for LT, such as VSC. The third focus group
session aimed at discussing and updating data collected from accounting and finance
representatives and sources, compared to data collected from operational team and
sources. This has the objective of making sure different organisation representatives
have shared all their views on the developments in LT’s MAS throughout the study
period.
A timeline for the duration of the longitudinal case study and data collection activities
conducted are presented in figure 4.2. It is important to note that, the researcher has
been engaged with the case study organisation in previous research that mainly aimed at
testing the applicability of activity-based costing (ABC) in the organisation’s
transformers factory. This occurred in the period between year 2009 and the beginning
of year 2010. Previous work with the case study organisation provided an understanding
of the background of the organisation’s costing system and the factory’s layout during
this period. The timeline presented in figure 4.2 shows the period covered in the case
study from the start of lean management implementation in year 2004 till end of year
2016. The red circles in the timeline show the years in which data was collected.
Majority of data collection activities in terms of interviews, observations, focus groups
and document analysis were conducted in the period from end of year 2014 till the
beginning of year 2017.
Figure 4. 2: Timeline of the Duration of Longitudinal Case Study and Data Collection Years
2004 2016 2009 2010 2014 2015

117
Data collected in years 2009 and 2010, were only used in this research to reflect on the
organisation’s costing system and the layout of its transformers’ factory during this
period. Appendices A and B of this thesis show the data collection activities done.
Appendix A shows data collection activities done during the period of this research, i.e.
from the end of year 2014 till beginning of year 2017. Data collected in years 2009 and
2010 and are reflected upon in this research, are included in appendix B of this thesis. It
is worth mentioning, that information of the organisation’s progress with lean
management implementation from the start of its implementation in 2004, was
discussed during the interviews with key participants included in the case study. As will
be discussed in sections 5.5 and 5.7 of the coming chapter, interview participants were
able to provide the researcher with documents related to this period in terms of factory
first value stream, costing data and an extract of the performance measurements used.
This is how an understanding of earlier periods of lean implementation was formed by
the researcher. The next section discusses the data analysis approach used in this
research.
4.6 Role of Researcher
Section 4.3 explains that, adopting a constructivism stance allows for ‘activism’,
i.e. researcher is accepted to have a participatory and facilitating role in in the research
process (Guba and Lincoln, 1994). This also matches Latour’s (1999) view that unlike
social scientists, ANT researchers are not perceived as interpreters of the pre-existing
social structures. Yet, the contribution of ANT is that, researchers get closer to the
reality they are exploring and can form one of actors in this reality. Hence, this section
clarifies the role done by the researcher in exploring this longitudinal case study. As
discussed in section 4.3, a low understanding and implementation of lean accounting
and its core practice, VSC, meant that there is a high chance that the researcher will
need to facilitate the understanding of VSC and procedures for its implementation. This
is important specially in tackling the second and third research questions on the
performative role of VSC and the factors affecting its implementation.
The researcher introduced VSC as a possible costing practice for the organisation in her
earlier engagement with case organisation in 2009. This only served the purpose of the
research done then, which mainly focused on evaluating the possibility of adopting

118
activity-based costing in the organisation’s transformer’s factory as compared to other
possible costing practices. At that time, the role of the researcher mainly involved
explaining how VSC works and doing the calculations for VSC. This is discussed
thoroughly in section 6.5 of chapter 6.
As discussed in section 4.5, further calculations involving VSC, for example using VSC
with features and characteristics costing, are done in the period from end of year 2014
till beginning of 2017. During this period, calculations and analysis of the role of VSC
are done on basis of the demand from the organisation’s finance and accounting
controllers, given their earlier understanding of how the practice operates. During this
period, the researcher participatory role was seen in doing the calculations for VSC with
features and characteristics costing and comparing those calculations and facilitating the
focus groups conducted and included in Appendix A of the thesis. In terms of
interviews conducted during this period, observations and documents reviews and
analysis, the researcher role was mainly to report actors’ interpretations, feelings and
inferences about their MAS system in the context of a lean management system.
It is worth mentioning that with the role played by the researcher in working out VSC
calculations, an action research method might have been viewed as appropriate for this
research. However, as Susman and Evered explain, an action research method involves;
“a cyclic process with five phases: diagnosing, action planning, action taking,
evaluating and specifying learning.” (1978, p. 588). An implementation of those five
steps technically means approaching organisation’s actors with a deliberate plan of
action to implement VSC as a management accounting practice. Yet, this contradicts
with ANT’s constructivist ontology, as discussed in section 3.3 of chapter 3. Champion
and Stowell (2003) argue that, such five steps process seeks to promote the creation of
“appropriate structures”. However, as discussed in section 3.7 of chapter 3, with ANT,
reality is constructed and interpreted only via an understanding of actors’ interactions
(Latour, 2005; Modell et al., 2017). Hence, with the use of ANT, a case study is
perceived as most suitable for this research, given that the researcher did not have a
major role in all data collected. More importantly, to keep ANT’s promise to understand
reality from actors’ own stories without imposing on them a priori definition of their
world (Latour, 1999).

119
4.7 Data Analysis
This research uses a constructivist form of a narrative analysis approach to develop
‘a plot, as well as coherence’ (Myers, 2013, p. 173) between the ‘spoken or written
account of connected events’ driven from the data collected to form ‘a story’ (Soanes
and Stevenson, 2004). Data collected via interviews and focus groups are transcribed
and used with observation and documents’ review and evaluation, to construct stories
about the series of translation moments (Callon, 1998b; Latour, 1999; Latour; 2005)
experienced in the case organisation. By using a constructivist type of narrative
analysis, the narrator is assumed to construct narratives that represent the reality which
he/she has seen whilst conducting their research, emphasising the uniqueness of each
narrative (Myers, 2013). This approach matches Latour’s (1998) views that in contrast
to sociologists, actor-network theory does not assume to know how society is
constructed or provide a prior tool to interpret it. Yet, ANT considers each network as
unique and that only the network actors are able to describe how their networks are
formed and/ or reformed.
A narrative analysis approach is used to develop three major plots of stories about the
case organisation. These plots are discussed in chapter 6. Themes of these three plots
were not set by the researcher beforehand. Fitting data within a predefined set of themes
is perceived as counter to ANT’s ontological and epistemological stances of having ‘no-
priori definition’ of actors’ world (Latour 1999, p. 20). Arriving at these three plots
followed a long iterative process given the large volume of data analysed. These plots
were developed only on basis of the various actors’ narratives, constructed using the
different data collection sources used in this research (interviews, focus groups,
document analysis and observations). This aimed at preserving the authenticity of ANT
to not go and analyse a field with predefined themes or expectations of how it should
look like or how actors are expected to behave.
It is worth mentioning that, codes are also developed for data collected through
interviews and focus groups. Yet, unlike the use of coding in grounded theory, codes
developed in this research do not seek to develop a theory (Collis and Hussey, 2009;
Myers, 2013), nor are used to fit data into definite themes as is the case with the use of
contingency theory in management accounting research (Otley, 1999; Chenhall and

120
Chapman, 2006; Otley, 2016). Codes developed here are only used to help simplify the
large volumes of data collected, given the time span of this longitudinal case study.
Coding was done manually and mainly aimed at facilitating the distribution of large
volume of data collected across a number of organisation story plots as discussed in
chapter 6, sections 6.3 to 6.7.
The three plots of stories are interpreted using ANT as the theoretical underpinning of
this research with the aim of probing findings that develop answers to its research
questions. Following ANT;
―The aim of analysis is to produce interesting descriptions of practice that
illustrate the heterogeneous, performative, and relational character of theoretical
abstractions and conceptualizations. The aim is to unlock established views on a
phenomenon’s significance and to illustrate ―the power of practice (Hansen,
2011, p. 120)
Hence, the translation moments traced in the stories are used to develop an
understanding of how actors and organisational practices, structures and technologies,
construct the organisation’s MAS in context of lean management. The research then
uses Callon’s (1998a, 2007) concepts of framing and overflow to develop an empirical
driven theoretical conceptualisation of the developments experienced in the
organisation’s MAS throughout the study period. Such conceptualisation together with
the literature driven conceptualisation discussed in subsection 3.7.3 of chapter 3, are
useful in developing an answer to the first research question of this research.
Throughout the analysis of translation moments, together with framing and overflows
experienced in the organisation’s stories, Callon’s (2007, 2010) performativity thesis is
used to develop inferences on the performative role of VSC as required by this
research’s second research question. The overall empirical conceptualisation of the
construction and developments in LT’s MAS, together with the analysis of the role
played VSC, give various insights on factors affecting VSC’s acceptance or rejection,
necessary for developing an answer to the third research question in this research.
Chapter 7 presents a through discussion of the empirical driven theoretical
conceptualisation and how it is used to develop answers for this study’s research
questions, in section 7.4 through to section 7.9.

121
4.8 Chapter Summary
This chapter discussed the research methodology adopted in this research. The
chapter first provided a summary of the alternative research paradigms, research
approaches, strategies and methods relevant to the study of social sciences. Sections 4.2
through to section 4.7 sought to layout the three aspects of a good quality qualitative
research (Tong et al., 2007) in terms of discussing; research team/s and reflexivity
(participants and key actors involved in the case study and how their interactions are
discussed and analysed in later chapter), study design (research ontological and
epistemological stances, research and data collection methods used) and finally, how
data will be analysed and presented in this thesis. A summary of the research design
discussed in this chapter is presented in Figure 4.3.
As shown in figure 4.3, this research adopts a constructivism philosophical stance with
an inductive research approach. After defining the research objectives and questions, the
research uses ANT as its theoretical underpinning together with Callon’s (2007, 2010)
performativity thesis. The research first uses ANT to develop a literature driven
theoretical conceptualisation on the developments in MAS in context of lean as tackled
by literature actors of both; academics and consultants. On the empirical side, a
qualitative research strategy using holistic single case study method of a longitudinal
nature, is found appropriate for this research, given its context and research questions
focusing on a phenomenon – i.e. MAS in lean context and the role of VSC practice –
that not much is known about.
Semi-structured interviews, observations, focus groups and documents review/ analysis
are chosen as suitable triangulation techniques for data collection. Figure 4.3 provides
examples of different types of information derived from each method of data collection,
which were discussed throughout the chapter. For data analysis, the researcher uses a
constructivist form of narrative analysis to construct three story plots driven from case
study data. The analysis of these plots is used to develop an empirical driven theoretical
conceptualisation on the developments in MAS in the context of lean, based on the
conducted case study. This conceptualisation together with the literature driven
theoretical conceptualisation developed in chapter 3, are then used to develop answers
for this study’s research questions.
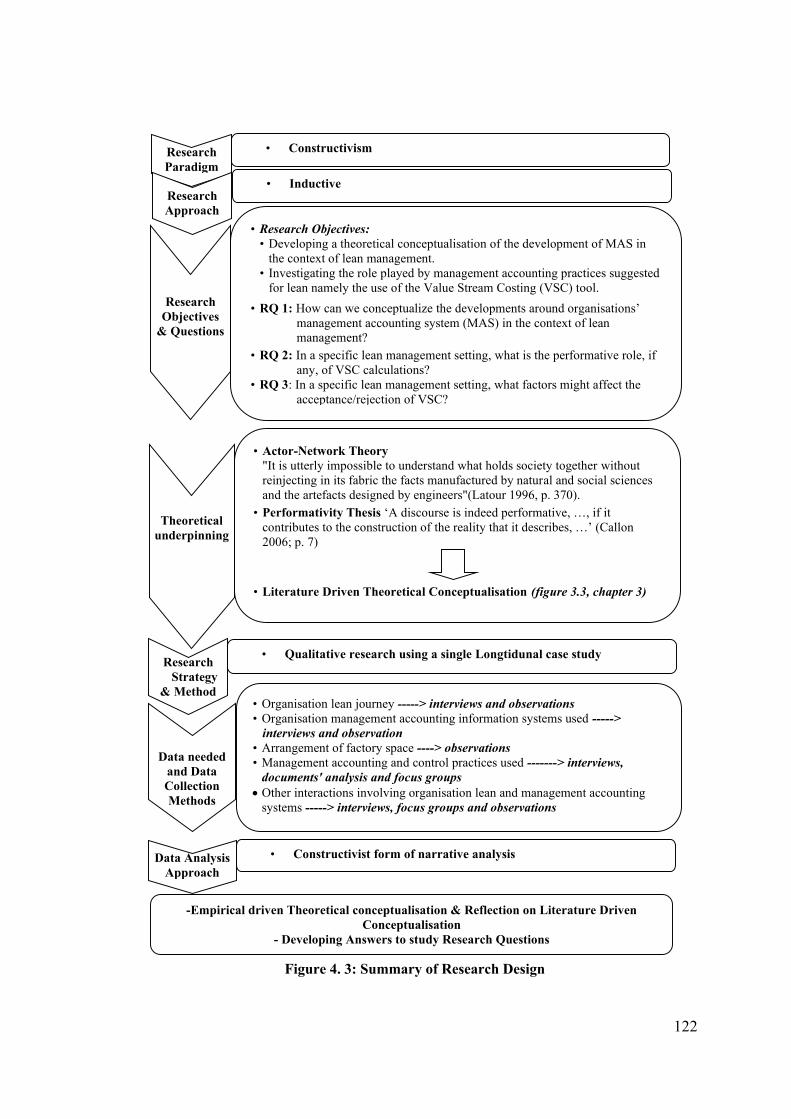
122
Figure 4. 3: Summary of Research Design
113
Figure 4. 2: Summary of Research Design
Research Paradigm
• Constructivism
Research Approach
• Inductive
Research Objectives
& Questions
• Research Objectives: • Developing a theoretical conceptualisation of the development of MAS in
the context of lean management. • Investigating the role played by management accounting practices suggested
for lean namely the use of the Value Stream Costing (VSC) tool.
• RQ 1: How can we conceptualize the developments around organisations’ management accounting system (MAS) in the context of lean management?
• RQ 2: In a specific lean management setting, what is the performative role, if any, of VSC calculations?
• RQ 3: In a specific lean management setting, what factors might affect the acceptance/rejection of VSC?
• Actor-Network Theory "It is utterly impossible to understand what holds society together without reinjecting in its fabric the facts manufactured by natural and social sciences and the artefacts designed by engineers"(Latour 1996, p. 370).
• Performativity Thesis ‘A discourse is indeed performative, …, if it contributes to the construction of the reality that it describes, …’ (Callon 2006; p. 7)
• Literature Driven Theoretical Conceptualisation (figure 3.3, chapter 3)
Theoretical underpinning
Research Strategy & Method
Research Strategy
• Qualitative research using a single Longtidunal case study
Data needed and Data Collection Methods
• Organisation lean journey -----> interviews and observations • Organisation management accounting information systems used -----> interviews and observation • Arrangement of factory space ----> observations • Management accounting and control practices used -------> interviews,
documents' analysis and focus groups • Other interactions involving organisation lean and management accounting
systems -----> interviews, focus groups and observations
Data Analysis Approach
• Constructivist form of narrative analysis
-Empirical driven Theoretical conceptualisation & Reflection on Literature Driven Conceptualisation
- Developing Answers to study Research Questions

123
Chapter 5: Case Study Background and Findings Part I
As discussed in the chapter 4, this research adopts a qualitative research strategy,
which uses a longitudinal single case study method covering a period of twelve years;
from year 2004 till end of year 2016. This chapter discusses the details of the case
organisation chosen for this research, in terms of; organisation’s background,
organisation chart and responsibilities of key actors involved in this study. Additionally,
the chapter aims at discussing the primary key findings in terms of; how the
organisation manages its management accounting information and the accounting
information systems used for this, the organisation’s progress with lean management
implementation and the changes witnessed in its management accounting system
throughout the study period. The chapter starts with the background of the case
organisation discussed in section 5.1. Section 5.2 discusses the organisation chart and
key organisation representatives with which this research is concerned. The chapter then
presents the primary key findings in terms of how the organisation manages its
accounting data, its lean journey and progress experienced with both the operating and
management accounting system. Section 5.3 provides an explanation of the accounting
information systems used in the organisation and the pattern in which its management
accounting information is reported. Section 5.4 outlines the organisation’s journey with
lean management implementation. Sections 5.5 and 5.6 presents the developments
experienced in the organisation’s operating system throughout the study period, in terms
of; the defined value streams, their layout and the lean practices used. A discussion of
the organisation's management accounting system then follows in section 5.7. Finally, a
chapter summary is presented in section 5.8. The discussion of the details of the case
study organisation and primary findings presented in this chapter, seeks to set the scene
for the analysis of the organisation’s data that then follows in chapter 6.
5.1 Case Organisation Background
The organisation chosen for this study is a leading multinational organisation for
automation and supply of electrical power components. Organisation's headquarters is
in Zurich, Switzerland and it is responsible for supplying automation, electric safety and
power components including; motors, generators, semiconductors, transformers,
generators circuit breakers, power capacitors, sensors, insulation components, cables
124
and cables accessories as well as establishing safety control systems. The organisation's
name is kept anonymous, as per agreement with its management to keep the
confidentiality of its accounting and operating data. Accordingly, the organisation is
referred to as LT. The case study is conducted on one of the organisation's factories
operating in Egypt and is responsible for producing distribution transformers. LT’s
Egyptian plant started to supply its products to the Egyptian market in the beginning of
the 1980’s. The organisation has six factories in Egypt, producing and assembling
power components. LT transformers factory started to implement lean management in
its operation in year 2004.
The Transformers factory was established during 1998 and is responsible for producing
distribution transformers ranging from 50 Kilo-Volt-Ampere (KVA) to 5000 KVA. A
distribution transformer is used to distribute electric energy from high voltage power
stations to low voltage substations to be supplied to different users. The factory
produces transformers used for utility needs, contracting companies, Egyptian local
industries, also to be exported to various countries outside Egypt. Transformers factory
is currently supplying the Egyptian and foreign markets with more than three thousand
transformers per year and has a market share of 41%.
The factory has the vision of becoming a major supplier of distribution transformers in
Egypt and internationally. In order to reach this vision, the Transformers plant has the
goal of always meeting customer demand preferences in the quality level and timely
manner requested. Accordingly, the plant managers exert all efforts to sustain high
quality levels on both the operational and the personnel’s human aspects, in order to
reach a good competitive marketplace and a high rate of employee empowerment.
The factory produces three main types of distribution transformers: small distribution
transformers (SDT), medium distribution transformers (MDT) and large distribution
transformers (LMDT). All transformer types are used to step down high voltage
electrical energy to low voltage electrical energy, but the three types differ according to
their power. The SDT group includes distribution transformers ranging from 50 to 300
KVA. These transformers are used in the countryside or in areas of low population
densities. MDTs include transformers ranging from 400 to 1250 KVA. They are used in

125
cities and in various industrial applications. Finally, the LMDT group includes
transformers ranging from 1500 KVA to 5000 KVA, which are used to supply electrical
power from high voltage stations to low voltage ones or from high voltage stations to
large industries and large cities directly.
LT transformers factory is chosen for this study, because it is the only manufacturing
factory that has moved to lean management. The longitudinal case study covers the
period from start of lean management implementation in 2004 till end of year 2016. As
discussed in chapter 1 (section 1.4), LT is chosen for this study because of its suitability
to develop rich data to help achieve the research objectives and answer the research
questions. As will be seen in this chapter, LT’s transformers factory has gone through
different progressive stages of lean management implementation since its first adoption
in 2004. Additionally, in most of the twelve years of the study period – more
specifically from 2009 to 2016 – the organisation has been trying to grasp an
understanding of how its MAS can operate with lean. This presented an excellent
chance for the researcher to study the developments in MAS in context of lean, along
with the role played by VSC as a key lean-tailored management accounting practice.
Additionally, as will be explained in chapter 6, the researcher has been previously
involved with the case organisation in analysing possible management accounting
practices for LT factory, including VSC. This has established some understanding of the
term ‘lean accounting’ and VSC among a sizable group of the organisation’s actors.
Such understanding is rarely found in most lean firms (Chopra, 2013; Rao and
Bargerstock, 2013), yet it does facilitate the analysis of the role played by VSC practice
and the factors affecting its acceptance or rejection. Also, being of a multinational
nature, the data for the case organisation are thought to present different views from
local organisational actors in Egypt and global actors in Zurich. All of this is sought to
present a dynamic data set and enrich the findings of the study in order to facilitate the
exploration of the study’s research questions. The next section presents the organisation
chart and discusses the responsibilities of organisation’s representatives with a focus on
the key actors chosen for this study.

126
5.2 Organisation Chart and Key Organisation Representatives
LT organisation has six divisions producing and assembling electric power
components in the Egyptian market. Transformers represent a product group in the
‘power grid’ division, which includes the three product groups of; transformers, high
voltage distribution panels and distribution panels’ components. Hence, transformer
products are denoted by ‘PGTR’ as an abbreviation for; Product Group: Transformers.
In the organisation, the words ‘product group’ and ‘business unit’ are used
interchangeably to signify a group of similar product types produced within a certain
division. Figure 5.1 presents the organisation chart for the transformers’ product group
in Egypt. The country managing director (Mr NJ) manages all the six divisions of the
organisation. Each division has a division manager. Mr NN is the manager for the
power grid division, and he is also the manager for the transformers product group
(PGTR) in this division. Hence, as shown in figure 5.1, Mr NN is also known as the
Local Business Unit (LBU) manager for the PGTR in Egypt.
As the division manager, Mr NN has an executive assistant and a health, safety and
environmental manager who is responsible for handling health, safety and
environmental risk issues related to all product groups in the division. Also, at the
division level, a front-end sales team managed by a front-end sales manager (Mr M SH)
is responsible for developing price lists for the division products, preparing offers to
customers and receiving orders made in any of the divisions’ product groups. At the
local business unit level i.e. the transformers product group (PGTR), an HR business
partner with a small HR team handles the HR issues related to the product group
employees.
In figure 5.1 the frame outlined in black includes the organisation managers and
employees who are responsible for or are having a direct or indirect impact on the
PGTR operating and management accounting and control processes and data.
Accordingly, all organisation representatives included in this frame form the interview
participants in this research, except for the technical lead engineer and factory team of
design engineers. Technical lead engineer and his team of design engineers are not
included in the interviews conducted in this research, since they are mainly responsible
for handling the development, graphing and execution of the transformers special

127
designs requested by the customers, as will be explained later in this section. Any
costing or accounting issues experienced by the factory lead engineer and his team of
designers, is handled by factory engineering and operations advisor (MR MF), who is
one of the interview participants in this research (see full interview participants in the
list of interviews available in the appendix of this thesis). Because of their
responsibilities handling or affecting organisation operating and management
accounting and control data and processes, those representatives form the key human
actors chosen for this research.
Figure 5. 1: Organisation chart for the Transformers Product Group in Egypt
Source: Local Business Unit Executive Assistant (Mrs NS) as per organisation guidelines on
October 11th, 2016

128
All managers and employees included in black frame shown in figure 5.1 are located
between the head office in Cairo and the Transformers factory in the City of 10th of
Ramadan, which is located about 55 kilometres from the Egyptian capital. At the
operating level the factory head is based in the transformers factory outside Cairo, he
leads the factory with a team of: an operation manager, Quality-Operation Excellence
(OPEX) manager, supply chain manager, some representatives from engineering and
design department-(mostly based in Cairo head office), a group of factory lead
engineers and factory workers.
The factory head together with the factory operation manager lead the main production
processes in the factory, they follow up on progress with lean management, monitor
factory key performance indicators (KPIs), develop and follow up on continuous
improvement initiatives done in the factory. The factory head is also responsible for
reviewing and implementing any new guidelines sent from the organisation’s Swiss
headquarters. Additionally, he reviews KPIs received from various sectors in the factory
and the organisation head office in Cairo and confirms them on an organisation's
internal information system known as the Operation Excellence (OPEX) analyser. A
detailed explanation of how factory KPIs and other management accounting and control
data are reported is presented in the next section.
The factory operation manager works with a team of three lead engineers who monitor
the work of several employees on the factory production floor. Lead engineers report
factory KPIs monthly on the visual management boards, available in the factory shop
floor. They handle any production problems on the shop floor with guidance from the
factory operation manager, if needed. They are also responsible for handling any issues
related to the application of the 5S methodology. They monitor progress of shop floor
workers with 5S and report results monthly on another board used to evaluate the use of
5S. Selected lead engineers receive trainings on annual basis from the Swiss
headquarters, either online or if needed at the organisation headquarters in Zurich.
Trainings are usually on the factory ‘current state’ of development versus how
improvements can be integrated to factory’s ‘future state’.

129
The factory quality manager is responsible for handling quality issues such as; testing
material quality and checking quality of produced transformers after certain production
processes, before packing and before delivery to customers. In LT, the factory quality
manager is also referred to as the operation excellence (OPEX) manager, as he is
responsible for handling KPIs received from various organisation’s sectors on the
OPEX analyser. The KPIs are then available for review and confirmation from the
factory head. As a quality manager, he is in charge of reporting those KPIs related to
quality measures, for example; number of units tested, number of units shipped
complete, total Cost of Poor Quality (COPQ) and number of test failures.
Factory supply chain manager is handles LT’s relationships and deals with factory
suppliers, who are mostly material suppliers. Supply chain manager handles price offers
made by material suppliers, discusses factory material quality constraints set by factory
quality manager and agrees with suppliers on material delivery dates. From a
management accounting and control perspective, he reports supply chain KPIs to the
Quality-OPEX manager to be reported on the OPEX analyser. Examples of supply
chain KPIs include; number of supplier’s deliveries and total number of supplier’s on-
time deliveries. Supply chain manager also provides the final agreed upon prices of
material purchases made to the organisation finance and accounting controllers, these
prices are then used for budgeting and costing transformer products.
A technical lead engineer is the head of the designers’ team in charge of the
transformers’ product group. The design engineers are mainly handling the
development, graphing and execution of the transformers special designs as requested
by the customers. The technical lead engineer works closely with an engineering and
operation advisor (Mr MF), who used to work as a technical lead engineer and then a
factory operation manager for 17 years. For several years, Mr MF handled the reporting
of KPIs data on the OPEX analyser as a previous operation manager to the factory, long
before this data where handled by factory quality manager. The designers’ team is
mainly based in the organisation head office in Cairo, however some representatives
from the PGTR design engineers are located at the factory.
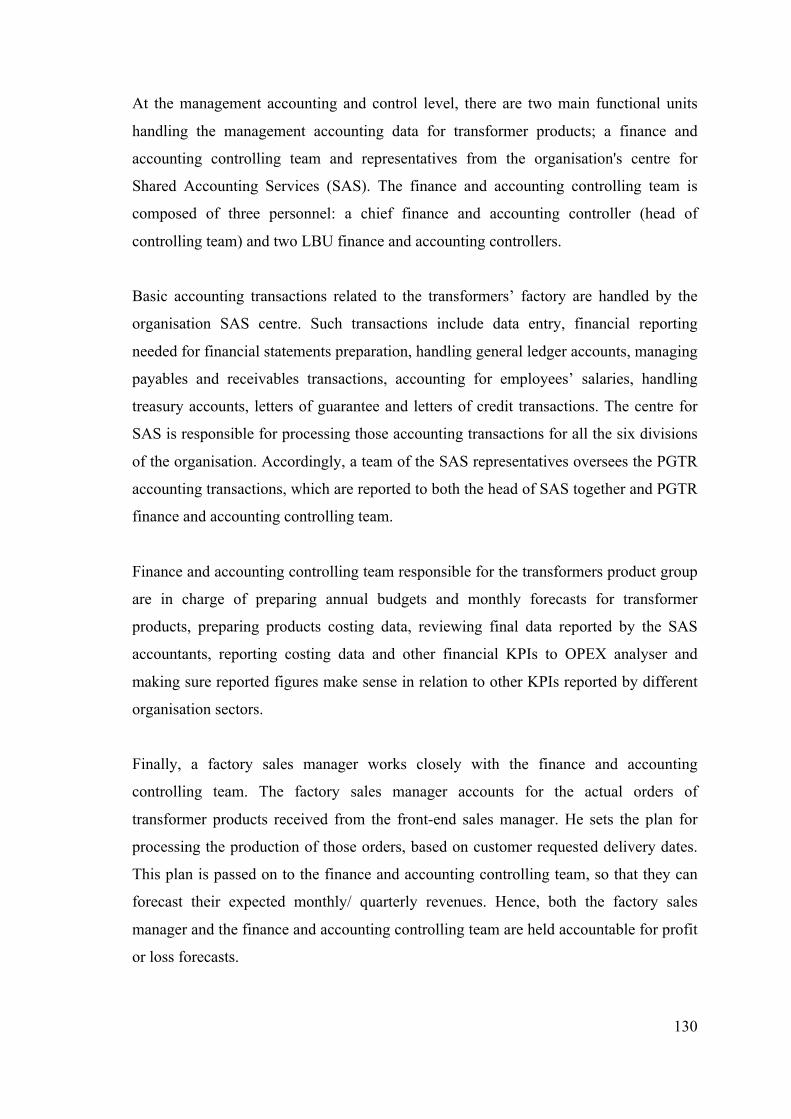
130
At the management accounting and control level, there are two main functional units
handling the management accounting data for transformer products; a finance and
accounting controlling team and representatives from the organisation's centre for
Shared Accounting Services (SAS). The finance and accounting controlling team is
composed of three personnel: a chief finance and accounting controller (head of
controlling team) and two LBU finance and accounting controllers.
Basic accounting transactions related to the transformers’ factory are handled by the
organisation SAS centre. Such transactions include data entry, financial reporting
needed for financial statements preparation, handling general ledger accounts, managing
payables and receivables transactions, accounting for employees’ salaries, handling
treasury accounts, letters of guarantee and letters of credit transactions. The centre for
SAS is responsible for processing those accounting transactions for all the six divisions
of the organisation. Accordingly, a team of the SAS representatives oversees the PGTR
accounting transactions, which are reported to both the head of SAS together and PGTR
finance and accounting controlling team.
Finance and accounting controlling team responsible for the transformers product group
are in charge of preparing annual budgets and monthly forecasts for transformer
products, preparing products costing data, reviewing final data reported by the SAS
accountants, reporting costing data and other financial KPIs to OPEX analyser and
making sure reported figures make sense in relation to other KPIs reported by different
organisation sectors.
Finally, a factory sales manager works closely with the finance and accounting
controlling team. The factory sales manager accounts for the actual orders of
transformer products received from the front-end sales manager. He sets the plan for
processing the production of those orders, based on customer requested delivery dates.
This plan is passed on to the finance and accounting controlling team, so that they can
forecast their expected monthly/ quarterly revenues. Hence, both the factory sales
manager and the finance and accounting controlling team are held accountable for profit
or loss forecasts.

131
The previous two sections (5.1 and 5.2) discussed the background for the case study
organisation and discussed its organisational chart. Section 5.2 presented the
organisation’s representatives dealing with the PGTR operating and management
accounting data and who also represent the key human actors involved in this research.
Sections 5.3 through to the 5.6 provide a detailed discussion of the case study key
findings in terms of: how the organisation manages its management accounting
information and the accounting information systems used for this, the transformers
factory journey with lean management implementation, a detailed discussion of the
factory’s operating data findings and finally, a thorough discussion of the changes done
in the organisation’s management accounting system.
5.3 Managing Organisation's Management Accounting Information
The previous section provided a thorough explanation of the organisation chart along
with the responsibilities of organisation representatives affecting the factory operating
and management accounting and control data and processes. Throughout this
explanation a reference was only made to the internal system used in reporting factory
KPIs; the OPEX analyser. However, other software/ accounting information systems are
also being used by the PGTR finance and controlling team and the SAS centre.
Therefore, this section is devoted to explaining how the reporting process is structured
around organisation representatives and how management accounting and control
information is finally reported to organisation headquarters in Zurich. Figure 5.2
presents an illustration of how management accounting and control information related
to the transformers product group flows and is reported across different organisation
representatives in Egypt and Switzerland.
As mentioned earlier OPEX analyser is the software/ accounting information system,
where final figures of KPIs used by LT’s transformers factory appear. The factory head
receives raw data on these KPIs from supply chain manager, factory operation manager,
representatives from the engineering department and quality manager located in the
factory. Additional KPI data are also gathered from factory sales manager and finance
and accounting controlling team. This data is checked by both the quality-OPEX
manager and the factory head and are then processed by the factory head into required
KPIs ratios, percentages and measurements. Once data are posted on OPEX analyser, it

132
is also available for review by the LBU PGTR manager in Cairo head office and the
global product group manager and his team in Zurich.
Figure 5. 2: An illustration of how PGTR management accounting and control information is reported
Source: Interviews conducted with factory head, head of SAS and LBU finance and accounting
controllers in April, September and October 2016
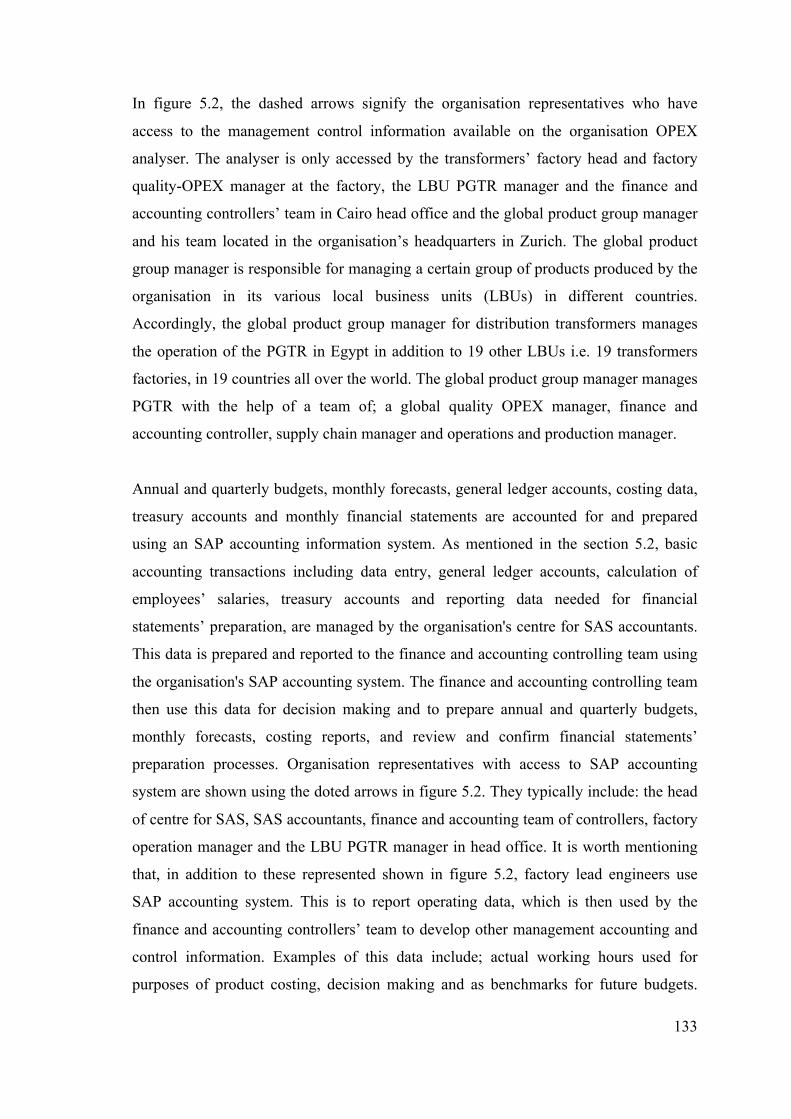
133
In figure 5.2, the dashed arrows signify the organisation representatives who have
access to the management control information available on the organisation OPEX
analyser. The analyser is only accessed by the transformers’ factory head and factory
quality-OPEX manager at the factory, the LBU PGTR manager and the finance and
accounting controllers’ team in Cairo head office and the global product group manager
and his team located in the organisation’s headquarters in Zurich. The global product
group manager is responsible for managing a certain group of products produced by the
organisation in its various local business units (LBUs) in different countries.
Accordingly, the global product group manager for distribution transformers manages
the operation of the PGTR in Egypt in addition to 19 other LBUs i.e. 19 transformers
factories, in 19 countries all over the world. The global product group manager manages
PGTR with the help of a team of; a global quality OPEX manager, finance and
accounting controller, supply chain manager and operations and production manager.
Annual and quarterly budgets, monthly forecasts, general ledger accounts, costing data,
treasury accounts and monthly financial statements are accounted for and prepared
using an SAP accounting information system. As mentioned in the section 5.2, basic
accounting transactions including data entry, general ledger accounts, calculation of
employees’ salaries, treasury accounts and reporting data needed for financial
statements’ preparation, are managed by the organisation's centre for SAS accountants.
This data is prepared and reported to the finance and accounting controlling team using
the organisation's SAP accounting system. The finance and accounting controlling team
then use this data for decision making and to prepare annual and quarterly budgets,
monthly forecasts, costing reports, and review and confirm financial statements’
preparation processes. Organisation representatives with access to SAP accounting
system are shown using the doted arrows in figure 5.2. They typically include: the head
of centre for SAS, SAS accountants, finance and accounting team of controllers, factory
operation manager and the LBU PGTR manager in head office. It is worth mentioning
that, in addition to these represented shown in figure 5.2, factory lead engineers use
SAP accounting system. This is to report operating data, which is then used by the
finance and accounting controllers’ team to develop other management accounting and
control information. Examples of this data include; actual working hours used for
purposes of product costing, decision making and as benchmarks for future budgets.
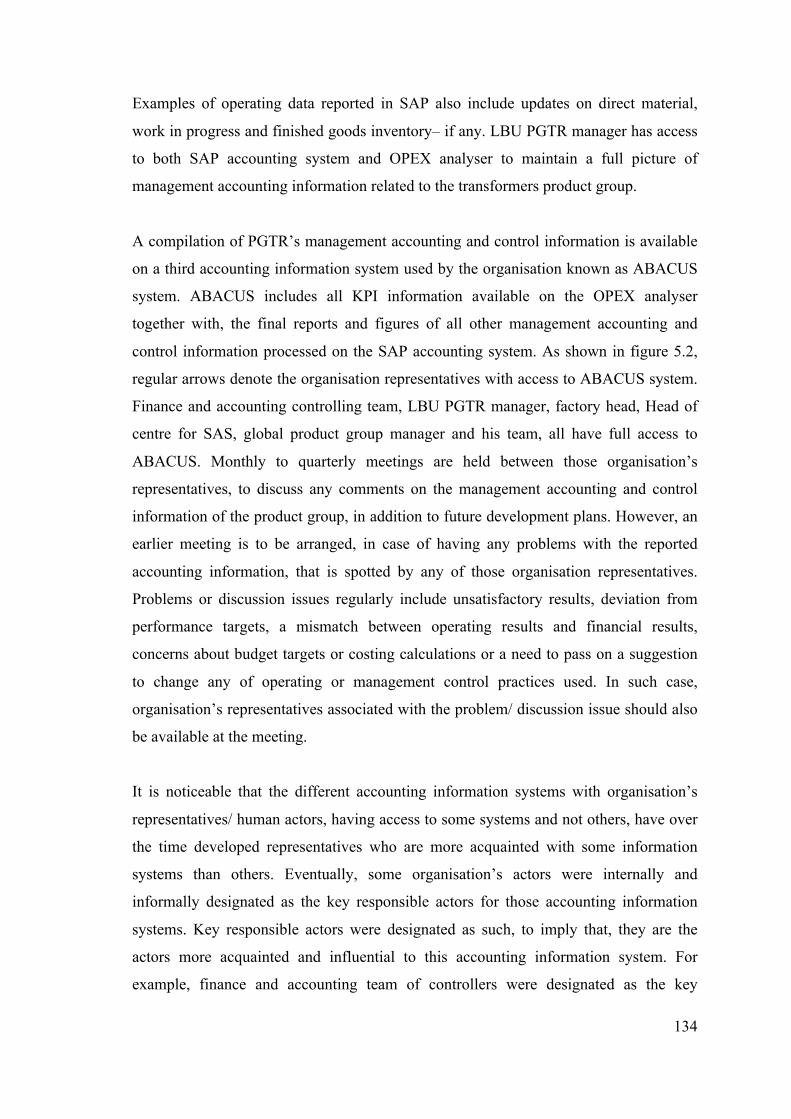
134
Examples of operating data reported in SAP also include updates on direct material,
work in progress and finished goods inventory– if any. LBU PGTR manager has access
to both SAP accounting system and OPEX analyser to maintain a full picture of
management accounting information related to the transformers product group.
A compilation of PGTR’s management accounting and control information is available
on a third accounting information system used by the organisation known as ABACUS
system. ABACUS includes all KPI information available on the OPEX analyser
together with, the final reports and figures of all other management accounting and
control information processed on the SAP accounting system. As shown in figure 5.2,
regular arrows denote the organisation representatives with access to ABACUS system.
Finance and accounting controlling team, LBU PGTR manager, factory head, Head of
centre for SAS, global product group manager and his team, all have full access to
ABACUS. Monthly to quarterly meetings are held between those organisation’s
representatives, to discuss any comments on the management accounting and control
information of the product group, in addition to future development plans. However, an
earlier meeting is to be arranged, in case of having any problems with the reported
accounting information, that is spotted by any of those organisation representatives.
Problems or discussion issues regularly include unsatisfactory results, deviation from
performance targets, a mismatch between operating results and financial results,
concerns about budget targets or costing calculations or a need to pass on a suggestion
to change any of operating or management control practices used. In such case,
organisation’s representatives associated with the problem/ discussion issue should also
be available at the meeting.
It is noticeable that the different accounting information systems with organisation’s
representatives/ human actors, having access to some systems and not others, have over
the time developed representatives who are more acquainted with some information
systems than others. Eventually, some organisation’s actors were internally and
informally designated as the key responsible actors for those accounting information
systems. Key responsible actors were designated as such, to imply that, they are the
actors more acquainted and influential to this accounting information system. For
example, finance and accounting team of controllers were designated as the key

135
responsible actors for SAP, Factory head and factory operation manager were internally
perceived as the key responsible actors for OPEX. At the same time, LBU manager and
LT’s global managing team were viewed as the key actors, influencing ABACUS. Over
the time, those designated key responsible actors have developed different perceptions
on the objectives and strategies for management accounting information processed by
the three accounting information systems. As will discussed in detail in chapter 7, those
perceptions have influenced actors’ interactions with other human and non-human
actors in the organisation and had their implications on the developments experienced in
LT’s MAS.
5.4 Factory Lean Journey: An Overview
A timeline of progress in lean management implementation in LT transformers
factory is presented in figure 5.3. Stages of progress with lean demonstrated in figure
5.3 are discussed in this section along with sections 5.5 and 5.6. Lean implementation
started in September 2004. Prior to this, the operating system in LT transformers factory
followed a mass production system. Products were produced annually and pushed to the
market in order to introduce factory’s products to market. More importantly, to cover
the factory’s start-up and establishment costs.
Eventually, LT transformer products achieved a considerable demand in the market.
Factory executives sensed that a mass production system cannot cope with the plant
objectives to meet customer demands effectively and maintain a good competitive
position. The transformers factory head reports that;
Towards the end of year 2004, the transformers factory executives together with the
Swiss headquarters started to think to apply some of Toyota’s manufacturing system
practices – the Lean management system. To apply lean, LT transformers factory did
the following steps in sequential order:
September and October 2004:
§ The factory managers and lead engineers studied customers’ preferences in
order to identify the customer product value requested.
§ LT mapped the value stream for its transformers plant.

136
§ The value stream includes all processes needed to supply the market with a
value adding transformer from order entry till order shipment.
November 2004:
§ The transformers factory started to apply a JIT/pull production system so that
products produced are only those demanded by the customers.
§ The plant integrated the 5S methodology to help optimize production flow and
enhance workers movement between operating processes.
Figure 5. 3: Timeline of Progress in Lean Management Implementation in LT transformers Factory
Time
April 2005 • Introduction and use
of visual boards in factory shop floor
• Encouraging workers’ representatives to participate in internal decision-making processes
Start of Lean Management Implementation • Identifying
customer value
• Analysing activities to define factory value stream/s
• Defining factory value stream
February 2012 • Need to enhance production
lead time and machines waiting time
• Defining factory new value streams
November 2004 • Movement to a pull
production system using JIT
• Use of 5S methodology in factory shop floor
• Batch production still in use in some orders
January 2006 • Using Statistical
Process Control (SPC)
• Encouraging factory line-workers and employees to have more role in decisions related to operating performance
March 2014 • single-piece flow
for all MDT and LMDT products
• Very small batch production on some SDT orders
April 2016 • Swiss
headquarters plans to implement lean management in organisation’s SAS
Sept. 2004 Old Value Stream New Value Stream

137
As mentioned by LT’s factory head, the above steps took place between September to
November 2004. In April 2005, the factory introduced the use of visual boards in its
shop floor. With the introduction of visual boards, workers were encouraged to take part
in internal decision-making processes related to factory operation and to communicate
any problems, ideas or recommendations to factory lead engineers. Early in 2006, the
factory established a Statistical Process Control (SPC) program to be used for
continuous improvement purposes. SPC inspects products at each production process to
make sure they match LT’s quality levels.
At the beginning of data collection processes, the researcher assessed the progress of LT
with lean, to gain an understanding of how advanced the organisation is with lean
management implementation. Literature discussing how progress with lean operations is
assessed; i.e., how degree of companies’ maturity with lean is evaluated, usually base
such assessment on the degree of companies implementation of the five principles of
lean and on the use of a number of key lean practices to support these principles
(Ahlström and Karlsson, 1996; Sanchez and Perez, 2001; Soriano-Meier and Forrester,
2002; Staats et al., 2011). Most of this literature uses surveys to assess the degree of
“leanness” or maturity with lean (Wan and Chen, 2008). However, since this assessment
forms one of the steps towards reaching the objectives of this research, a simpler
assessment method which matches the research needs was used. Maskell and Baggaley
(2004) describe a three-stage lean management maturity path; the first stage starts with
having successful lean production cells, a flow, pull and Kanban systems in place. The
second stage focuses on maintaining visual systems, established continuous
improvement teams, managing via value streams and having considerably low inventory
levels. The final stage is having an entirely lean organisation, where lean philosophy is
implemented as a whole organisation culture and is used with all organisation partners.
A recent study by Rao and Bargerstock (2013) uses Womack and Jones’s (1996)
literature on lean thinking and Maskell and Baggaley’s (2004) lean maturity path to
develop 6 key aspects, which are used to measure the degree of enterprises’ leanness.
According to Rao and Bargerstock (2013, p. 13) these 6 aspects revolve around the
extent to which a manufacturing company adopting lean, has done the following:
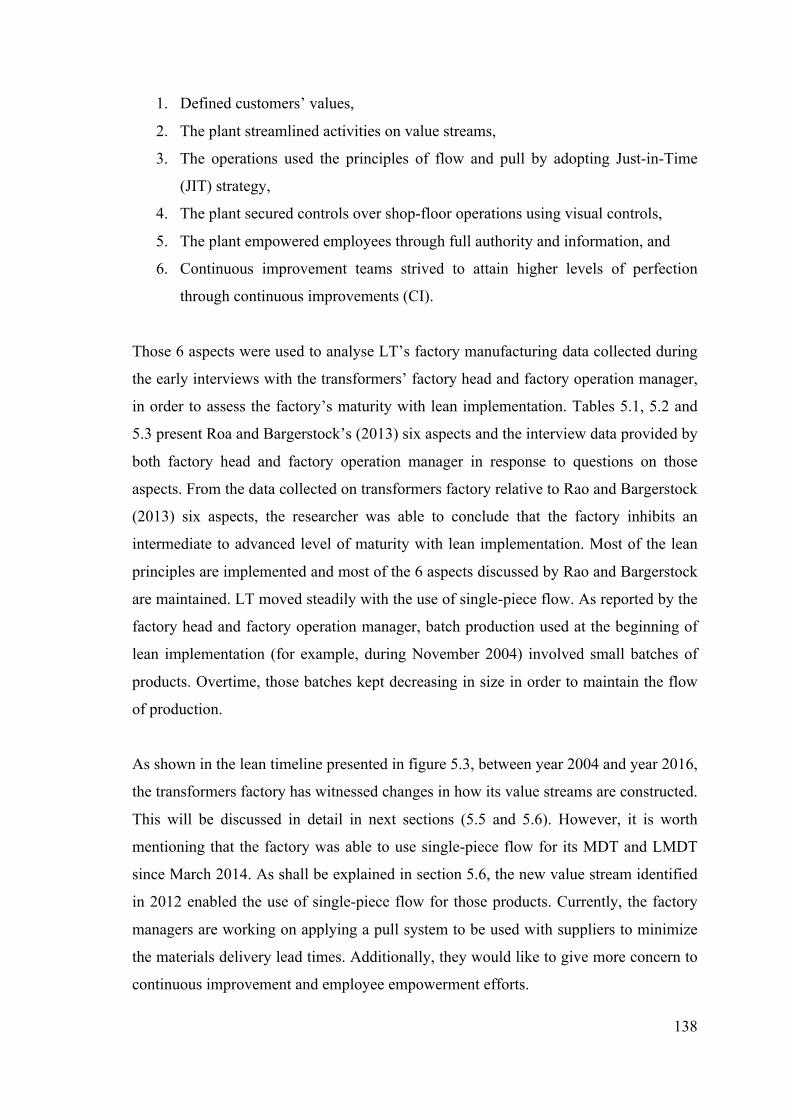
138
1. Defined customers’ values,
2. The plant streamlined activities on value streams,
3. The operations used the principles of flow and pull by adopting Just-in-Time
(JIT) strategy,
4. The plant secured controls over shop-floor operations using visual controls,
5. The plant empowered employees through full authority and information, and
6. Continuous improvement teams strived to attain higher levels of perfection
through continuous improvements (CI).
Those 6 aspects were used to analyse LT’s factory manufacturing data collected during
the early interviews with the transformers’ factory head and factory operation manager,
in order to assess the factory’s maturity with lean implementation. Tables 5.1, 5.2 and
5.3 present Roa and Bargerstock’s (2013) six aspects and the interview data provided by
both factory head and factory operation manager in response to questions on those
aspects. From the data collected on transformers factory relative to Rao and Bargerstock
(2013) six aspects, the researcher was able to conclude that the factory inhibits an
intermediate to advanced level of maturity with lean implementation. Most of the lean
principles are implemented and most of the 6 aspects discussed by Rao and Bargerstock
are maintained. LT moved steadily with the use of single-piece flow. As reported by the
factory head and factory operation manager, batch production used at the beginning of
lean implementation (for example, during November 2004) involved small batches of
products. Overtime, those batches kept decreasing in size in order to maintain the flow
of production.
As shown in the lean timeline presented in figure 5.3, between year 2004 and year 2016,
the transformers factory has witnessed changes in how its value streams are constructed.
This will be discussed in detail in next sections (5.5 and 5.6). However, it is worth
mentioning that the factory was able to use single-piece flow for its MDT and LMDT
since March 2014. As shall be explained in section 5.6, the new value stream identified
in 2012 enabled the use of single-piece flow for those products. Currently, the factory
managers are working on applying a pull system to be used with suppliers to minimize
the materials delivery lead times. Additionally, they would like to give more concern to
continuous improvement and employee empowerment efforts.

139
Rao and Bargerstock (2013) Aspects
for evaluating Company’s Maturity
with Lean Implementation
Interview data provided by Transformers
Factory Head and Factory Operation Manager
1. Company defined customers’ values
Int. Q8: What were the first aspects
you focused on in your way to
implementing a lean management
system?
“At the early stages of lean implementation,
customer value was our main focus, the factory
managers and executives studied customers
preferences in order to identify the customer’s key
product values before moving to any further
steps.”
2. Plant streamlined activities on value
streams
Int. Q: Is the factory currently
managed via value streams?
“Yes, a next step to adopting a lean management
system was that, LT maps the value stream for its
Transformers plant. The value stream currently
includes all the steps needed to supply the market
with a value adding transformer from order entry
till order shipment.”
3.Operations used the principles of
flow and pull by adopting JIT strategy
Int. Q: How is the factory managing
the flow of operations?
“At the beginning of lean implementation, we
were not operating in a 100% single-piece flow
production system. We were still producing some
transformers together, but our production process
includes very small batch sizes. Batches kept
decreasing overtime to maintain production flow.
This is considered a huge advancement to our
previous mass production and large to medium
batch production system. In 2014, with the new
value streams, we were able to have a single-
piece flow production MDT and LMDT products.
Also, the plant currently uses a 5S methodology in
order to help optimize the flow of production and
enhance workers movement between operations.”
Table 5. 1: Assessing LT’s progress with Lean Management Implementation in its Transformers Factory – Aspects 1, 2 & 3
8 Interview Question

140
Rao and Bargerstock (2013) Aspects for
evaluating Company’s Maturity with
Lean Implementation
Interview data provided by
Transformers Factory Head and Factory
Operation Manager 3.Operations used the principles of flow
and pull by adopting JIT strategy
Int. Q: How are you maintaining a pull
production system?
“Our Transformers plant applies the
JIT/pull production system so that products
produced are only those demanded by the
customer. We are working more on our
planning and scheduling efforts since in
some cases we have to plan for our
material needs ahead, in order to
supplement orders that are to be delivered
in a long interval of time.
4. Plant secured controls over shop-floor
operations using visual controls
Int. Q: Do factory workers and supervisors
maintain any visual controls in operating
shop-floor?
“Yes, LT transformers factory is using
visual measures that are displayed on the
production floor for employees’ and
supervisors’ control over the production
process.”
Table 5. 2: Assessing LT’s progress with Lean Management Implementation in its Transformers Factory – Aspects 3 & 4
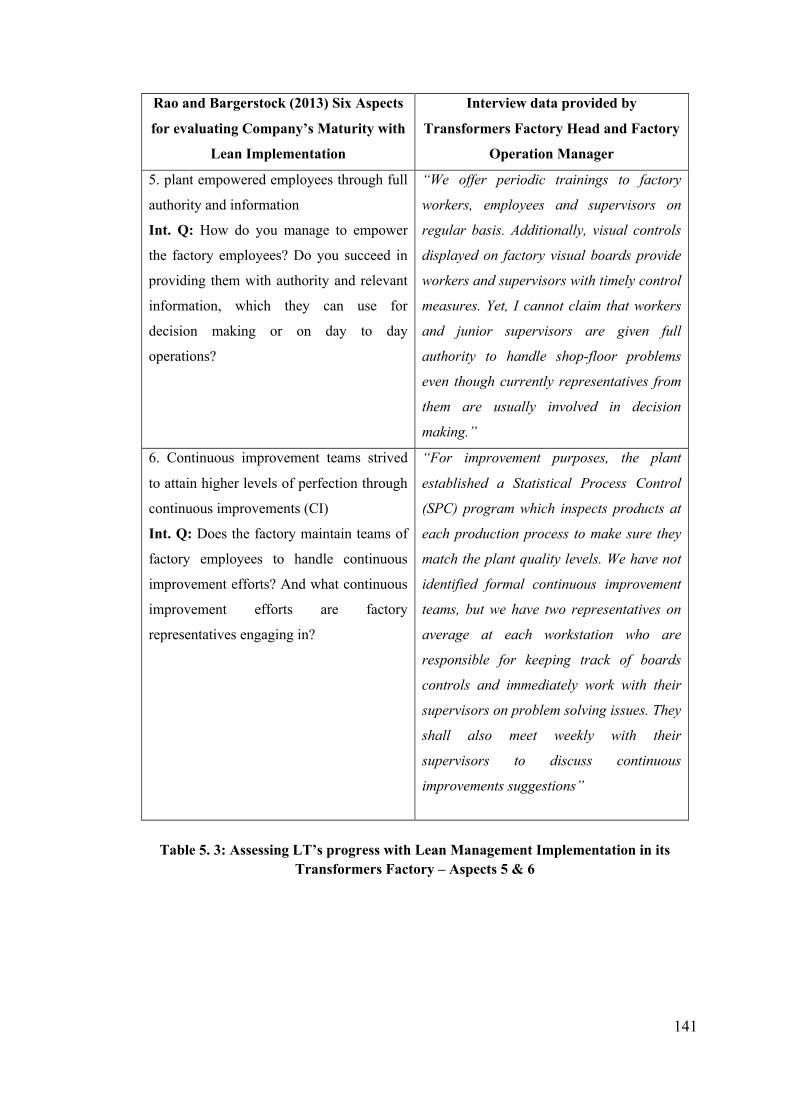
141
Rao and Bargerstock (2013) Six Aspects
for evaluating Company’s Maturity with
Lean Implementation
Interview data provided by
Transformers Factory Head and Factory
Operation Manager 5. plant empowered employees through full
authority and information
Int. Q: How do you manage to empower
the factory employees? Do you succeed in
providing them with authority and relevant
information, which they can use for
decision making or on day to day
operations?
“We offer periodic trainings to factory
workers, employees and supervisors on
regular basis. Additionally, visual controls
displayed on factory visual boards provide
workers and supervisors with timely control
measures. Yet, I cannot claim that workers
and junior supervisors are given full
authority to handle shop-floor problems
even though currently representatives from
them are usually involved in decision
making.” 6. Continuous improvement teams strived
to attain higher levels of perfection through
continuous improvements (CI)
Int. Q: Does the factory maintain teams of
factory employees to handle continuous
improvement efforts? And what continuous
improvement efforts are factory
representatives engaging in?
“For improvement purposes, the plant
established a Statistical Process Control
(SPC) program which inspects products at
each production process to make sure they
match the plant quality levels. We have not
identified formal continuous improvement
teams, but we have two representatives on
average at each workstation who are
responsible for keeping track of boards
controls and immediately work with their
supervisors on problem solving issues. They
shall also meet weekly with their
supervisors to discuss continuous
improvements suggestions”
Table 5. 3: Assessing LT’s progress with Lean Management Implementation in its Transformers Factory – Aspects 5 & 6

142
5.5 Factory Old Value Stream – 2004 till end of 2011
Following lean management implementation in 2004, the transformers factory
identified its value stream map as illustrated in Figure 5.4. In 2004, the construction of
factory first value stream was done in isolation from any finance and accounting
representatives of the organisation. LT’s global managing team and factory operating
people, (factory head, factory operation manager, quality-OPEX manager, factory lead
engineers and factory workers), were the main actors involved in constructing the value
stream map for factory first/old value stream.
The map starts with the receipt of a customer order by the sales and marketing
department. Engineering, planning and purchasing department develops the design for
the order, sets its quotation and requests materials needed from suppliers. All materials
are inspected before going into the production process which includes the production of
the transformers’ main component parts as well as the transformers tanks. The
production process for the transformers main components includes the processes of;
core slitting, core cutting, core stacking, low voltage winding, high voltage winding,
active part assembly and connections. At the same time, the tanks production processes
of; folding, welding, final assembly and leakage testing, shall also be running.
Finally, both the transformers components and tanks go through a painting and drying
process. Then, they are passed through their final testing process. An order is finally
shipped to customers after being completely tested for any defects. In this value stream
map, managers in the Transformers factory identify production processes as: machine
intensive/machine-based, labour-based and quality control production processes.
All power transformers from 50 KVA to 5000 KVA go through the same production
process. Accordingly, factory managers and production line workers treat the three main
transformer types (SDT, MDT and LMDT) as one product family. Only one value
stream is identified for all transformer types. However, as reported by the transformers’
factory head, the different power and size of the transformers produced entails that they
do take different processing time in various production processes.

143
Figu
re 5
. 4: V
alue
Str
eam
Map
(old
val
ue st
ream
) for
LT
Tran
sfor
mer
s Fac
tory
Sour
ce: F
acto
ry o
pera
ting
docu
men
ts pr
ovid
ed b
y fa
ctor
y he
ad a
nd fa
ctor
y op
erat
ion
man
ager

144
In figure 5.4, shaded production processes are the ones in which different power
transformers take different processing time. Additionally, the sales and engineering
departments as well as any general and administrative departments involved in the
execution of an order are located outside the factory in LT’s head office and operate to
support the production of all transformer types. Accordingly, the researcher was able to
conclude that; even though the three transformer types take the same steps in the value
stream and accordingly are considered one product family, such construction of the
value stream creates a condition in which resources are being interrelated between
products in the same value stream. In other words; all types of transformers are being
supervised with the same production supervisors, inspected with the same quality
controllers and are being processed through the same machines. However, they are
using different processing time in most of the value stream processes.
5.6 Factory New Value Streams - from year 2012 onwards
As shown in the lean timeline presented in figure 5.3, the beginning of year 2012
witnessed a change in the factory value stream construction. During the interviews
conducted with the factory operation manager in September 2016, he commented that:
At the start of 2012, we figured out that an immense enhancement in production
lead time and machine waiting time can be achieved if a separate line of
production cells is devoted to the production of the SDT transformers. An
investment of around five million Euros was made for the acquisition of new
machines, which has proved to be an investment worthwhile during the past
couple of years.
Figure 5.5 shows an illustration of LT’s new value stream for its transformers’ factory.
All organisation actors affecting its operating and accounting data, (shown in the frame
outlined in black in figure 5.1), took part in constructing the new value stream. As
shown in figure 5.5, a new line of the production processes of; core cutting, core
stacking, LV welding, HV welding, active part assembly and connections is currently
developed to produce SDT types of transformers. Not only is the new line developed to
achieve progress in production lead times and machine waiting times, but also
according to the factory lead production engineer;

145
Some of the machines used to process the three transformers types needed
replacement. At that time, we analysed the appropriate ways to undertake these
replacements and a separation of the SDT production cells meant an expansion in
the factory's capacity to produce this transformer type. We have perfectly reaped
the fruits of this decision as we currently have a capacity to produce up to 3,600
of all transformers types a year, previously our maximum capacity has never
exceeded 1,600 transformers. I can say that the development of the new line
perfectly resonates with the increasing demands over SDTs that we are receiving
since the beginning of 2014.
Currently the remaining line of production cells from core cutting to connections is used
to produce the other two types of transformers; MDT and LMDT. This facilitated the
use of single-piece flow production for both MDT and LMDT.
The new line for SDT, only produces this product in small batches. Figure 5.5 also
shows that having a separate line of production cells for SDTs contributes to the
decrease in the production processes in which different transformers types shared the
factory resources. However, since all transformers types go through the parallel
processes of folding to tanking, the transformer products still share factory resources in
production cells such as: final assembly, leakage test, painting and drying and tanking,
together with other production activities as material inspection and preparation as well
as the administrative activities of sales and marketing and engineering, planning and
purchasing. This new value streams’ construction is still currently in use. Additionally,
in April 2016, LT’s global managing steam announced its plan to use lean in its centre
for SAS and hopefully extend its use in other administrative departments in year 2017.
Plans of lean implementation were not enacted till end of study period in year 2016.
However, the decision was very welcomed by LT’s finance and accounting controllers
and SAS representatives. The next section discusses the impact of factory value stream
identification, and its change in 2012 on the factory MAS.

146
Figu
re 5
. 5: T
rans
form
ers F
acto
ry N
ew V
alue
Str
eam
So
urce
: Fac
tory
ope
ratin
g do
cum
ents
prov
ided
by
the
fact
ory
oper
atio
n m
anag
er a
nd th
e fa
ctor
y en
gine
erin
g an
d op
erat
ion
advi
sor
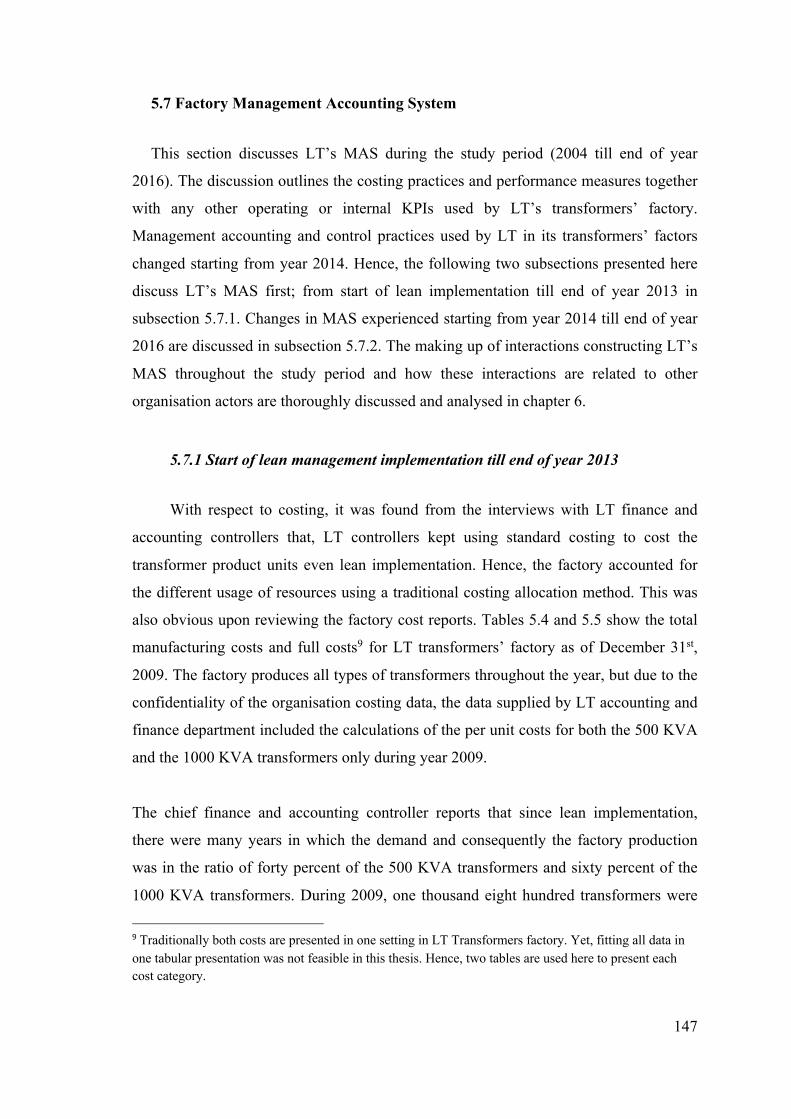
147
5.7 Factory Management Accounting System
This section discusses LT’s MAS during the study period (2004 till end of year
2016). The discussion outlines the costing practices and performance measures together
with any other operating or internal KPIs used by LT’s transformers’ factory.
Management accounting and control practices used by LT in its transformers’ factors
changed starting from year 2014. Hence, the following two subsections presented here
discuss LT’s MAS first; from start of lean implementation till end of year 2013 in
subsection 5.7.1. Changes in MAS experienced starting from year 2014 till end of year
2016 are discussed in subsection 5.7.2. The making up of interactions constructing LT’s
MAS throughout the study period and how these interactions are related to other
organisation actors are thoroughly discussed and analysed in chapter 6.
5.7.1 Start of lean management implementation till end of year 2013
With respect to costing, it was found from the interviews with LT finance and
accounting controllers that, LT controllers kept using standard costing to cost the
transformer product units even lean implementation. Hence, the factory accounted for
the different usage of resources using a traditional costing allocation method. This was
also obvious upon reviewing the factory cost reports. Tables 5.4 and 5.5 show the total
manufacturing costs and full costs9 for LT transformers’ factory as of December 31st,
2009. The factory produces all types of transformers throughout the year, but due to the
confidentiality of the organisation costing data, the data supplied by LT accounting and
finance department included the calculations of the per unit costs for both the 500 KVA
and the 1000 KVA transformers only during year 2009.
The chief finance and accounting controller reports that since lean implementation,
there were many years in which the demand and consequently the factory production
was in the ratio of forty percent of the 500 KVA transformers and sixty percent of the
1000 KVA transformers. During 2009, one thousand eight hundred transformers were
9 Traditionally both costs are presented in one setting in LT Transformers factory. Yet, fitting all data in one tabular presentation was not feasible in this thesis. Hence, two tables are used here to present each cost category.

148
produced. Consequently, due to the restrictions on the costing data supplied for only
two transformers, the same demand and production percentages were assumed for year
2009.
Cost Item Basis Total Cost in EGP10
1 Material
1.1 Direct Material costs
154,872,426
1.2 Material Overhead % of DM cost 1,471,289
Total Material Costs
156,343,715
2 Direct Manufacturing Cost
2.1 Manufacturing Process Cost (MPC)11 No. of
production units 4,875,099
Total Direct Manufacturing Cost
4,875,099
3 Manufacturing Overheads
3.1 Engineering and Design % of MPC 902,870
3.2 Quality Cost % of MPC 407,069
3.3 Maintenance % of MPC 1,247,060
3.4 Other Production OH12 % of MPC 4,704,956
Total Manufacturing Overhead Costs
7,261,955
Total Manufacturing Costs/TMC (1+2+3) 168,480,769
Table 5. 4: Total Manufacturing Costs for LT Transformers Factory for Year 2009
Source: Factory costing data provided by chief finance and accounting controller
10 EGP stands for Egyptian Pound
11 Includes salaries of workers in labor-based and machine-based production processes as well as depreciation of machines in machine-based production processes.
12 Costs for production supervision, factory energy and water, factory depreciation as well as costs for machines and factory insurance.
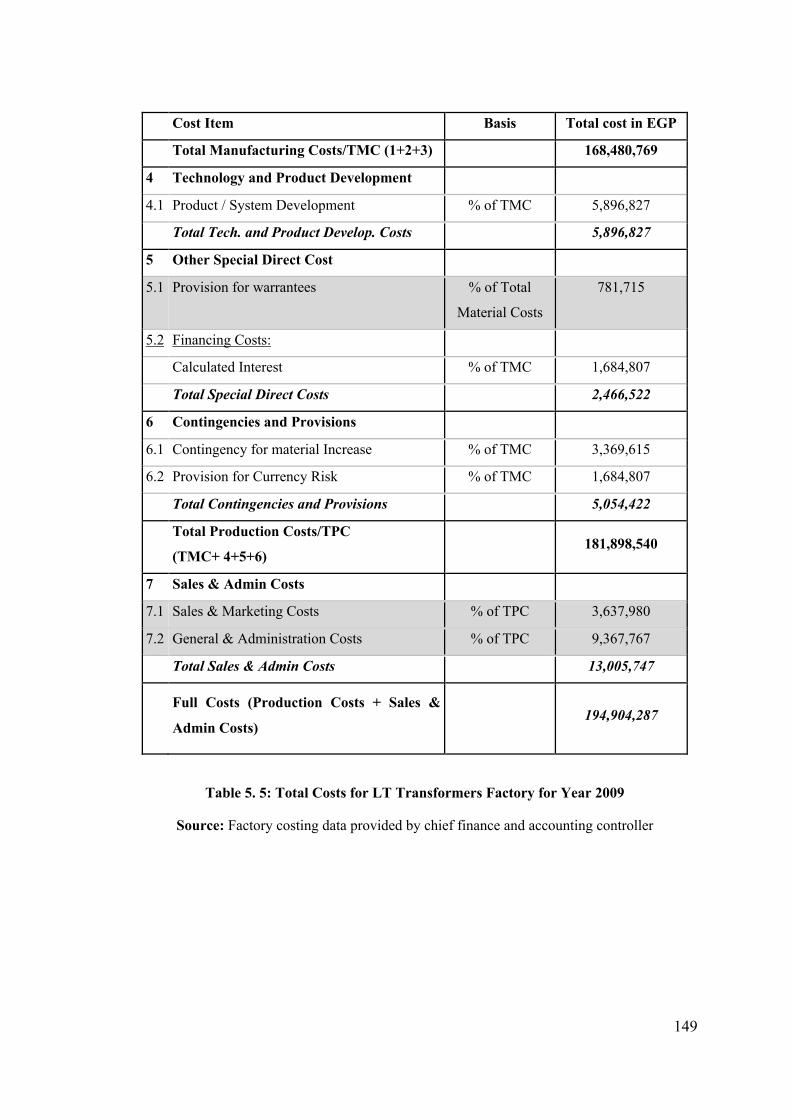
149
Cost Item Basis Total cost in EGP
Total Manufacturing Costs/TMC (1+2+3)
168,480,769
4 Technology and Product Development
4.1 Product / System Development % of TMC 5,896,827
Total Tech. and Product Develop. Costs
5,896,827
5 Other Special Direct Cost
5.1 Provision for warrantees % of Total
Material Costs
781,715
5.2 Financing Costs:
Calculated Interest % of TMC 1,684,807
Total Special Direct Costs
2,466,522
6 Contingencies and Provisions
6.1 Contingency for material Increase % of TMC 3,369,615
6.2 Provision for Currency Risk % of TMC 1,684,807
Total Contingencies and Provisions
5,054,422
Total Production Costs/TPC
(TMC+ 4+5+6)
181,898,540
7 Sales & Admin Costs
7.1 Sales & Marketing Costs % of TPC 3,637,980
7.2 General & Administration Costs % of TPC 9,367,767
Total Sales & Admin Costs
13,005,747
Full Costs (Production Costs + Sales &
Admin Costs) 194,904,287
Table 5. 5: Total Costs for LT Transformers Factory for Year 2009
Source: Factory costing data provided by chief finance and accounting controller

150
The cost items highlighted in Tables 5.4 and 5.5 represent the overhead costs for the
factory. The “basis” column shows the criteria by which each cost is allocated to a
transformer unit. Material cost constitutes around 74 to 75% of total costs, total labour
and overhead costs constitute between 15 to 18 % of total costs and the rest could be
categorized under selling and administrative costs. The main Manufacturing Process
Cost (MPC) is computed on basis of the output units produced and the remaining
overhead costs are allocated to individual transformer units as a percentage of the MPC.
Consequently, it can be concluded that almost all the overhead costs are allocated on
basis of the production units implying that the company uses a traditional costing
overhead allocation method to cost its transformer products.
Factory used performance measures are reported from departments of sales, quality,
supply chain management, operations (technical), production and finance and
accounting to the quality OPEX manager and reviewed by factory head using the OPEX
analyser. Table 5.6 shows an extraction of the KPIs used by the factory during years
2009 and 2010 as reported on the analyser. The different colours of each group of KPIs
shown in Table 5.6 are the exact highlighting colours used by the factory on its OPEX
analyser. These colours are meant to designate which department is responsible for
reporting this group of KPIs, for example; light yellow is for KPIs handled/reported by
sales department, light green is for KPIs reported by quality department and so on.
A review of KPIs in table 5.6 shows that, very few of them are driven from the lean
accounting literature such as the first pass yield and accounting for value added.
However, starting from year 2014, other performance indicators were used by the
factory and would appear on the ABACUS system with the other KPIs on the OPEX
analyser. Further internal performance measures were also used only inside the factory.
More details on the changes done in the factory performance measures used are
discussed in the next section.

151
Department KPI
Sale
s
Order Received and Order Received no. of units
Order Received MVA
Quotation backlog (value)
Number of units delivered on-Time
No. of units delivered to customers
Qua
lity
CCRP no of complaints
Number of Emergency repair and Number of Scheduled repair
Field Failures and Total COPQ per month in LE
FPY (First Pass Yield)
Number of units tested and Test Failures
No of rejected deliveries and Number of units shipped complete
Number of incoming consignments passed inspection
Number of incoming consignments inspected
Supp
ly
Number of Supplier Deliveries
No. of Suppliers on time Deliveries
Tec
hnic
al
TTPT
Inventory %
Installed Capacity [hours] and Available manned capacity [hours]
Workload from firm orders [hours]
Workload from hot tenders [hours]
Number of units in WIP
Fina
nce
& A
ccou
ntin
g Revenues and EBIT in KLE
Personnel Expenses
Material Stock, Direct Material Cost, Work in Progress and Finished Goods
Sales in Excess of Invoicing
Direct Material Cost
Value Added
Prod
uctio
n Units
Hours
TPT
Table 5. 6: An extraction of factory used KPIs in years 2009 and 2010 as reported on OPEX analyser
Source: Factory management accounting documents provided by the factory head and factory
engineering and operation advisor
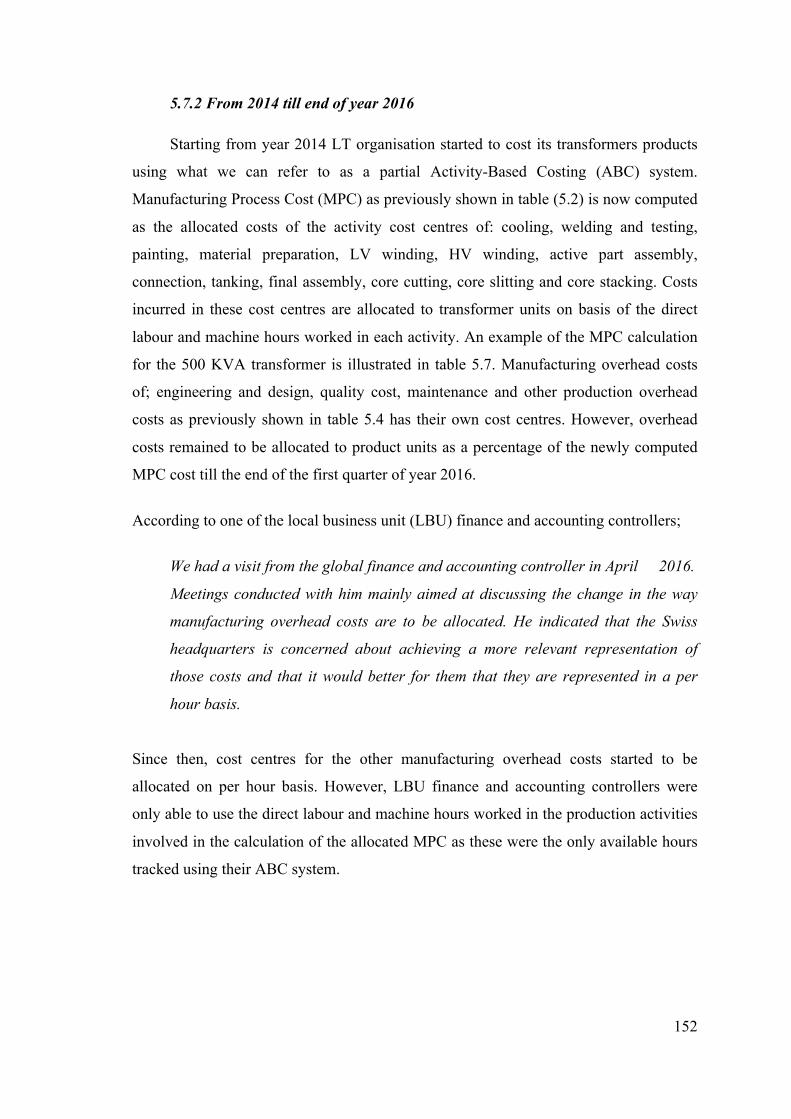
152
5.7.2 From 2014 till end of year 2016
Starting from year 2014 LT organisation started to cost its transformers products
using what we can refer to as a partial Activity-Based Costing (ABC) system.
Manufacturing Process Cost (MPC) as previously shown in table (5.2) is now computed
as the allocated costs of the activity cost centres of: cooling, welding and testing,
painting, material preparation, LV winding, HV winding, active part assembly,
connection, tanking, final assembly, core cutting, core slitting and core stacking. Costs
incurred in these cost centres are allocated to transformer units on basis of the direct
labour and machine hours worked in each activity. An example of the MPC calculation
for the 500 KVA transformer is illustrated in table 5.7. Manufacturing overhead costs
of; engineering and design, quality cost, maintenance and other production overhead
costs as previously shown in table 5.4 has their own cost centres. However, overhead
costs remained to be allocated to product units as a percentage of the newly computed
MPC cost till the end of the first quarter of year 2016.
According to one of the local business unit (LBU) finance and accounting controllers;
We had a visit from the global finance and accounting controller in April 2016.
Meetings conducted with him mainly aimed at discussing the change in the way
manufacturing overhead costs are to be allocated. He indicated that the Swiss
headquarters is concerned about achieving a more relevant representation of
those costs and that it would better for them that they are represented in a per
hour basis.
Since then, cost centres for the other manufacturing overhead costs started to be
allocated on per hour basis. However, LBU finance and accounting controllers were
only able to use the direct labour and machine hours worked in the production activities
involved in the calculation of the allocated MPC as these were the only available hours
tracked using their ABC system.
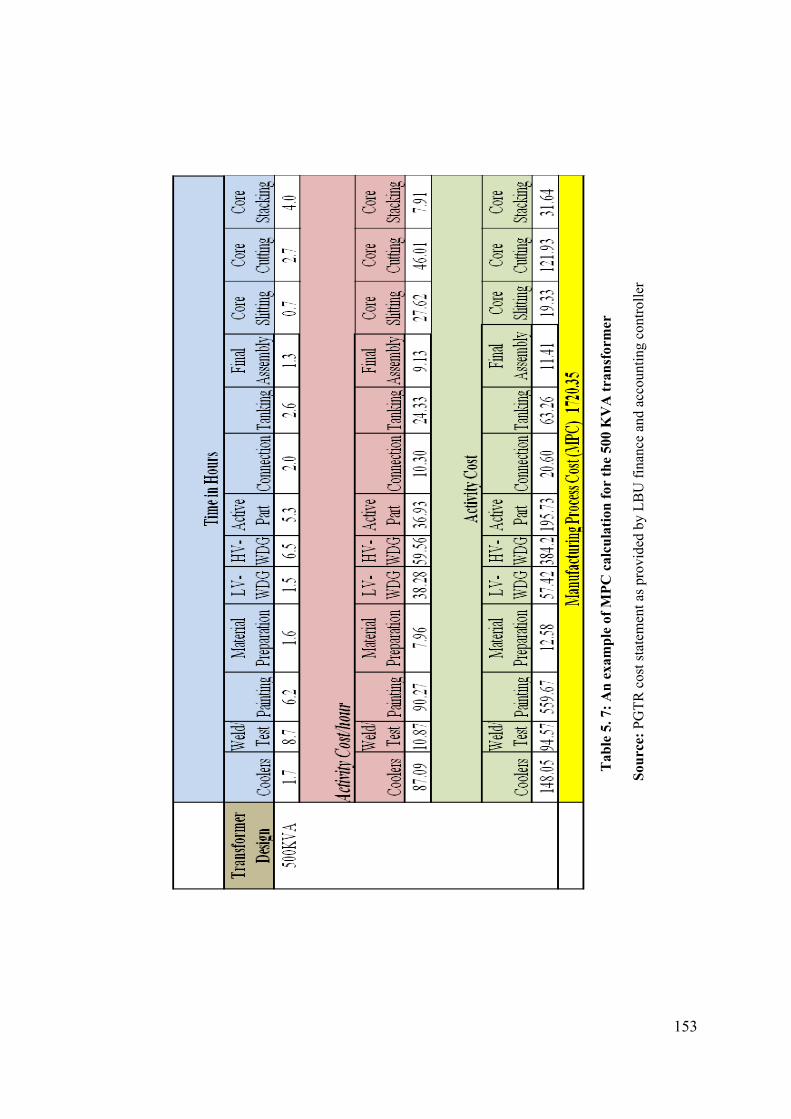
153
Tab
le 5
. 7: A
n ex
ampl
e of
MPC
cal
cula
tion
for
the
500
KV
A tr
ansf
orm
er
Sour
ce: P
GTR
cos
t sta
tem
ent a
s pro
vide
d by
LB
U fi
nanc
e an
d ac
coun
ting
cont
rolle
r

154
Table 5.8 shows an example of a recent representation of some of different performance
measures used by the Transformers factory in LT organisation from the beginning of
2014.
Type of Performance Measure Name Unit
Financial EBIT Margin %
Orders Received Gross Margin %
Revenues Gross Margin %
Operational $/kVA (Orders) USD
(%) of Root Cause Analyses done
within 1 week
%
AOTD % %
Capacity utilization %
Direct Material Cost % %
Employee turnover %
Finished Goods % %
Hours/Unit Hour
Inventory Days Day
MTT (Material Throughput Time) No#
On Time Delivery %
OTD % (Shipments/Milestones) %
Productivity
Revenues/Employees USD
ROTD %: non stocked items %
Value Added Productivity No#
Table 5. 8: An example of newly added performance measures used by LT transformers factory in year 2014
Source: MAS documents provided by the factory head

155
An analysis of these performance measures shows that more measures are driven from
the lean accounting literature, for example; measures for on-time delivery (OTD),
requested on-time delivery (ROTD), Inventory days, revenues per employee (Maskell
and Baggaley, 2004; Baggaley, 2006) and the other highlighted performance measures
shown in Table 5.8.
Other controls used by the case organisation can be classified as traditional/non-lean
controls, for example; productivity measurement, earnings before interest and taxes
(EBIT) and the measures for capacity utilization and employee turnover. The list of
performance measures shown in Table 5.8 includes an example of the newly added
controls reported to the Swiss headquarters annually. Since KPIs on the analyser, as
well as the newly added controls are available/published to the global product group
managing team, they are treated as ‘published’ controls. On the other hand, the factory
can use additional controls which the factory head refer to as ‘internal’ controls. Such
controls are developed by engineers, operation and production teams within the factory
whenever an action is needed to resolve a deviation in any of the targeted 'published'
performance measures or to keep track of improvements achieved from implementing a
new or updated operating process. For example; figures 5.6 and 5.7 show how an
analysis done on inventory levels in year 2014 resulted in factory managers
dissatisfaction about the achieved inventory levels. Such analysis is done internally
using an organisation known approach called the ‘4Q’ which stands for the ‘Four
Quadrants’ of; measure, analyse, improve and sustain.
The 4Q approach directs managers at the factory to take an appropriate measurement of
any area of problem, analyse the root causes of the problem, suggest ways of its
improvement, prepare an improvement implementation plan and then suggest
techniques to be used to sustain these improvements so as to avoid problem recurrence.
Hence, an application of the organisation 4Q approach in updating new targets of
inventory percentages suggested its decrease to 19% as shown in figure 5.7. An
improvement action plan was then put forward to achieve the new figure for inventory
percentage and help sustain it during year 2015 and the last two quarters of 2014.
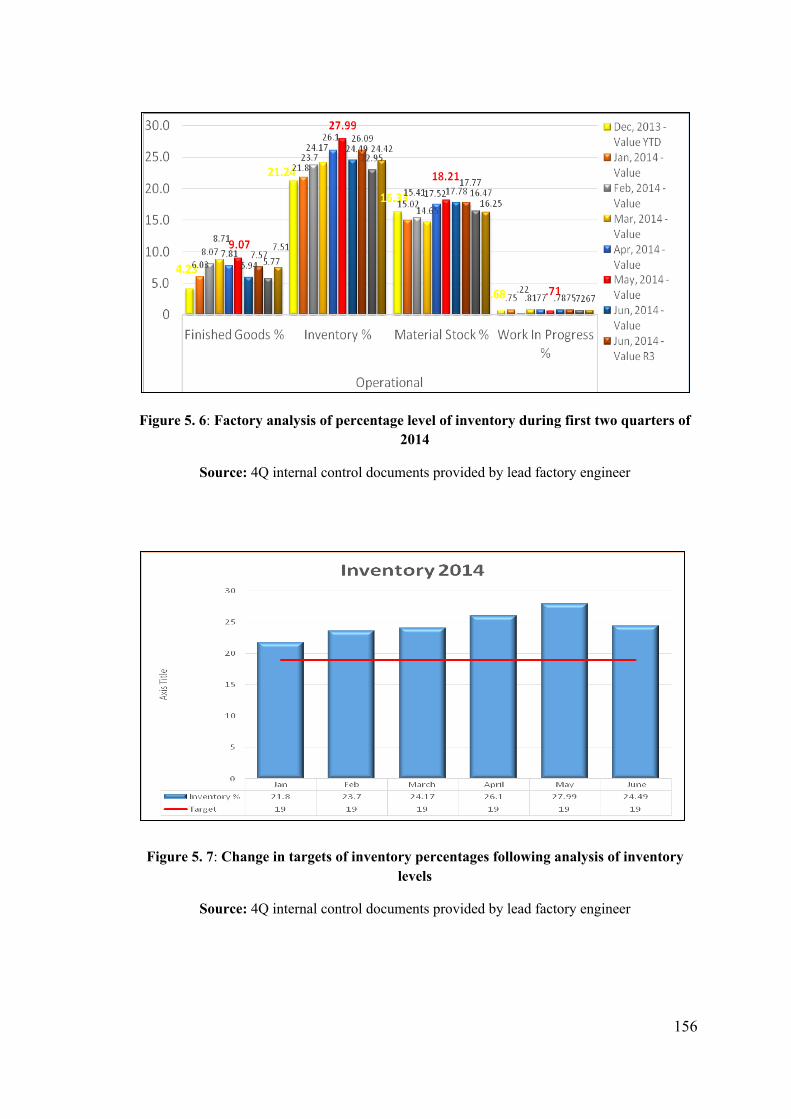
156
Figure 5. 6: Factory analysis of percentage level of inventory during first two quarters of 2014
Source: 4Q internal control documents provided by lead factory engineer
Figure 5. 7: Change in targets of inventory percentages following analysis of inventory
levels
Source: 4Q internal control documents provided by lead factory engineer

157
Figure 5.8 also shows results of another 4Q analysis done by the end of the first quarter
of year 2014, following the receipt of 13 customer complaints on oil leakage incidents
from transformer products. Action plan includes a follow up on changing inventory
levels and OTD delivery targets following the process of resolving oil leakage problem.
Figure 5. 8: Results of 4Q analysis following an oil leakage problem
Source: 4Q internal control documents provided by factory engineering and operation advisor
and lead factory engineer
Figures 5.6, 5.7 and 5.8 serve to show how some internal controls can be developed
within the factory following a reported problem. However not all ‘internal’ performance
measures used affect the ‘published’ performance measures or are reported to the
product group managing team at the Swiss headquarters. Transformers factory head
report that;
Internal and published performance measures should work in a loop, but they
actually do not. For example; improvements in cost of poor quality shall improve
the overall cost savings, yet we treat cost of poor quality computed after an

158
internal 4Q analysis as an internal performance measure that we keep for
ourselves at the factory such as the cost of resolving the oil leakage problem.
Overall cost savings are accounted for irrespective of indicators of progress
achieved in costs of poor quality.
5.8 Chapter Summary
This chapter presented the background of LT organisation and its transformers
factory as the chosen case study for this research. The chapter also presented the
organisation representatives who are considered the key human actors and interview
participants involved in this research. The chapter then detailed the primary key
findings in terms of; how the organisation manages its management accounting
information and the accounting information systems used for that. Primary findings also
presented a timeline for LT’s progress with lean implementation, with an overview of
its transformers’ factory journey with lean management. Primary findings show that
early lean management implementation procedures were done in isolation from any
finance and accounting representatives of LT. An assessment to factory progress with
lean management implementation shows that, it inhibits an intermediate to advance
level of progress with lean. Yet, the factory witnessed changes in its value stream
construction throughout the study period. Although its first value stream used from
2004 till 2011 included some resources which are shared among products of the same
product family, its new value stream constructed in 2012 do not seem to entirely solve
this issue. The chapter then followed with a detailed discussion of the organisation’s
MAS throughout the study period. This discussion tackled the costing practices used
and changes in the factory published (external) and non-published (internal)
performance measures/KPIs. LT mainly depended on the use of standard costing to cost
its transformer products from the start of lean implementation till end of year 2013.
During this period LT also used some lean-tailored/ lean accounting performance
measures. Starting from year 2014, LT moved to using activity-based costing mainly to
manage the allocation of its manufacturing overhead costs. More lean accounting
performance measures also started to be used. The data presented in this chapter are
used in the next chapter to discuss and analyse the various events and interactions
making up LT’s MAS and how they are related to many organisation’s actors. More
findings from the case study are also elaborated in this discussion.
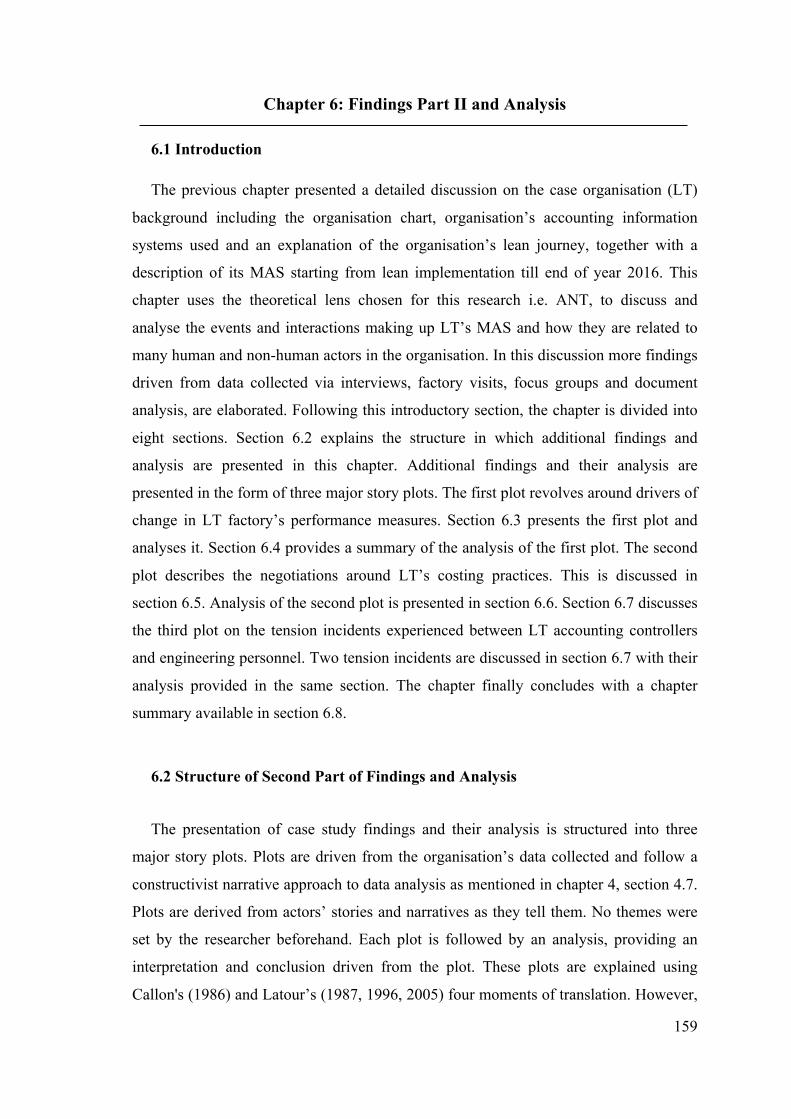
159
Chapter 6: Findings Part II and Analysis
6.1 Introduction
The previous chapter presented a detailed discussion on the case organisation (LT)
background including the organisation chart, organisation’s accounting information
systems used and an explanation of the organisation’s lean journey, together with a
description of its MAS starting from lean implementation till end of year 2016. This
chapter uses the theoretical lens chosen for this research i.e. ANT, to discuss and
analyse the events and interactions making up LT’s MAS and how they are related to
many human and non-human actors in the organisation. In this discussion more findings
driven from data collected via interviews, factory visits, focus groups and document
analysis, are elaborated. Following this introductory section, the chapter is divided into
eight sections. Section 6.2 explains the structure in which additional findings and
analysis are presented in this chapter. Additional findings and their analysis are
presented in the form of three major story plots. The first plot revolves around drivers of
change in LT factory’s performance measures. Section 6.3 presents the first plot and
analyses it. Section 6.4 provides a summary of the analysis of the first plot. The second
plot describes the negotiations around LT’s costing practices. This is discussed in
section 6.5. Analysis of the second plot is presented in section 6.6. Section 6.7 discusses
the third plot on the tension incidents experienced between LT accounting controllers
and engineering personnel. Two tension incidents are discussed in section 6.7 with their
analysis provided in the same section. The chapter finally concludes with a chapter
summary available in section 6.8.
6.2 Structure of Second Part of Findings and Analysis
The presentation of case study findings and their analysis is structured into three
major story plots. Plots are driven from the organisation’s data collected and follow a
constructivist narrative approach to data analysis as mentioned in chapter 4, section 4.7.
Plots are derived from actors’ stories and narratives as they tell them. No themes were
set by the researcher beforehand. Each plot is followed by an analysis, providing an
interpretation and conclusion driven from the plot. These plots are explained using
Callon's (1986) and Latour’s (1987, 1996, 2005) four moments of translation. However,

160
as shall be seen in the next sections, these stories are not narrated in a way to show a
distinct movement between one moment to another in what looks more like a technical
manner of presenting the story plots. The reason behind this, is an attempt to follow
Latour's (1999, p. 20) view on ANT as; ‘a very crude method to learn from the actors
without imposing on them a priori definition of their world-building capacities’.
Accordingly, the discussion referring to the four moments of translation is not headed or
categorized as per the name of each translation moment. The description of the
translation moments experienced in each story plot is interpreted via the flow of each
story and the quotes used by its key actors to add to the story telling. In this way, the
research is trying to match Latour's (1999) perspective on the restrictive effect of using
specific vocabulary with ANT when he noted that;
The ridiculous poverty of the ANT vocabulary--association, translation, alliance,
obligatory passage point, etc.-- was a clear signal that none of these words could
replace the rich vocabulary of the actor's practice, but was a simple way to
systematically avoid replacing their sociology, their metaphysics and their
ontology with those of social scientists who were connecting with them through
some research protocol....I use this cumbersome circumlocution to avoid the
loaded term ‘studying’, because ANT researchers cannot exactly be said to ‘study’
the other social actors.
As discussed in chapter 4, section 4.7, even though codes were developed from data
collected through interviews and focus groups, coding did not aim at fitting the findings
within a set of pre-defined themes. Codes developed were only used to help simplify the
large volumes of data collected, given the time span of LT’s longitudinal case study.
Coding mainly aimed at facilitating the distribution of large volume of data collected
across the 3 story plots discussed sections 6.3 to 6.7. In doing so, the researcher chooses
to follow Latour's (1999, p. 19-20) ideas on how actors are the ones entitled to tell their
stories, since they are the only ones who know them best or as he put it;
For us, ANT was simply another way of being faithful to the insights of
ethnomethodology: actors know what they do, and we have to learn from them not
only what they do, but how and why they do it. It is us, the social scientists, who
lack knowledge of what they do, and not they who are missing the explanation of
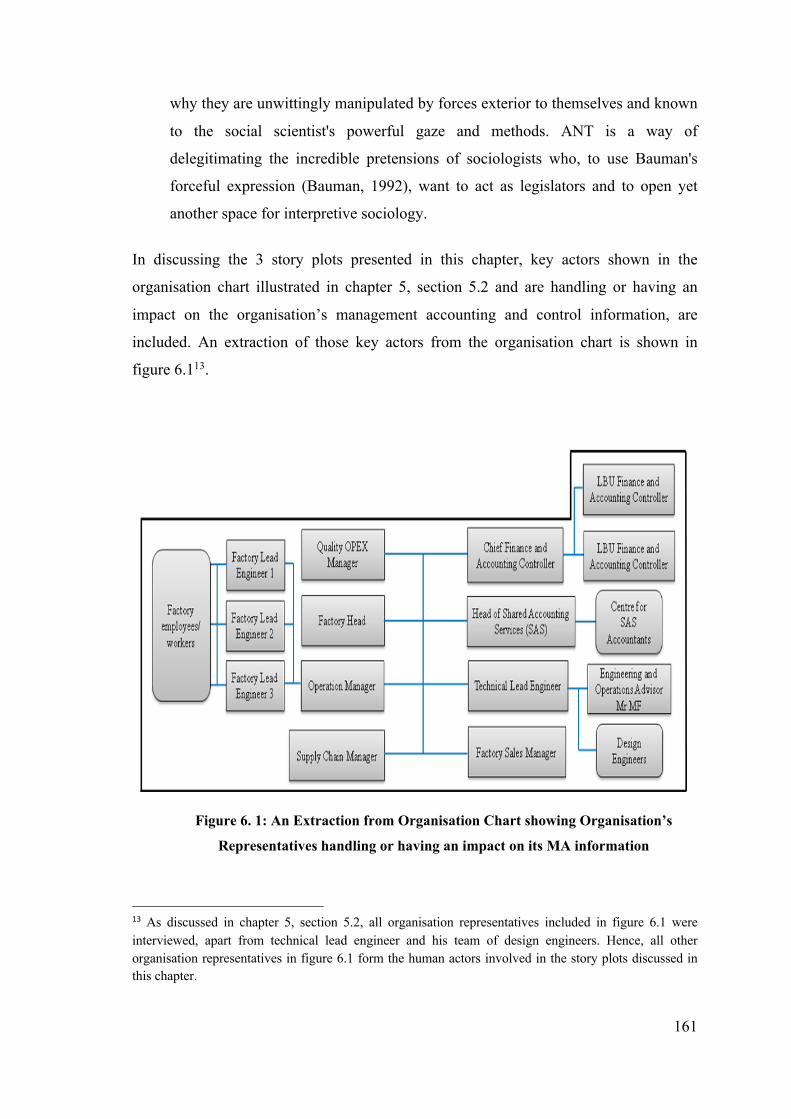
161
why they are unwittingly manipulated by forces exterior to themselves and known
to the social scientist's powerful gaze and methods. ANT is a way of
delegitimating the incredible pretensions of sociologists who, to use Bauman's
forceful expression (Bauman, 1992), want to act as legislators and to open yet
another space for interpretive sociology.
In discussing the 3 story plots presented in this chapter, key actors shown in the
organisation chart illustrated in chapter 5, section 5.2 and are handling or having an
impact on the organisation’s management accounting and control information, are
included. An extraction of those key actors from the organisation chart is shown in
figure 6.113.
Figure 6. 1: An Extraction from Organisation Chart showing Organisation’s
Representatives handling or having an impact on its MA information
13 As discussed in chapter 5, section 5.2, all organisation representatives included in figure 6.1 were interviewed, apart from technical lead engineer and his team of design engineers. Hence, all other organisation representatives in figure 6.1 form the human actors involved in the story plots discussed in this chapter.

162
Each plot of story discussed below has its key actors. Accordingly, not all organisation
representatives shown in figure 6.1 are involved in every story. Additionally, for each
individual story non-human actors are also identified, for example; management
accounting practices, operating structures in place and technical or operating practices
used. Finally, as discussed in chapter 4, section 4.3, following the constructivism
paradigm adopted in this research, the researcher as ‘an inquirer’ is “cast in the role of
participant and facilitator” (Guba and Lincoln, 1994, p. 113). Hence, the researcher is
also considered as one of the actors, involved in some of the story plots discussed in the
coming sections of this chapter.
6.3 Plot 1: Who Drives Changes in Factory Performance Measures?
As discussed in chapter 5, section 5.3, LT’s factory performance measures are
reported in the OPEX analyser and the ABACUS system. However, ABACUS includes
detailed calculations of how OPEX performance measures are reported, in addition to
other performance measures such as those shown in table 5.8 of the previous chapter.
More specifically, as reported by head of LT factory;
The OPEX includes key factory KPIs that the global product group manager and
his team would usually look at before the regular monthly meeting. If they would
like to check further details on how these KPIs were calculated or would like to
check more details on the factory performance in terms of other performance
indicators, then the ABACUS is the source of such detailed information.
This section discusses the changes that have occurred over the factory performance
measures in both the OPEX and ABACUS and the key actors involved in and driving
this change process. Starting with the factory OPEX, table 6.1 shows a comparison of
KPIs used from year 2009 to year 2015 and till end of study period in year 2016, as
extracted from factory OPEX analyser. An analysis of these KPIs shows that, two
changes occurred during this period. The first change has to do with personnel handling
the calculation of one of the KPIs, and the second change relates to the integration of
new KPIs to the analyser.
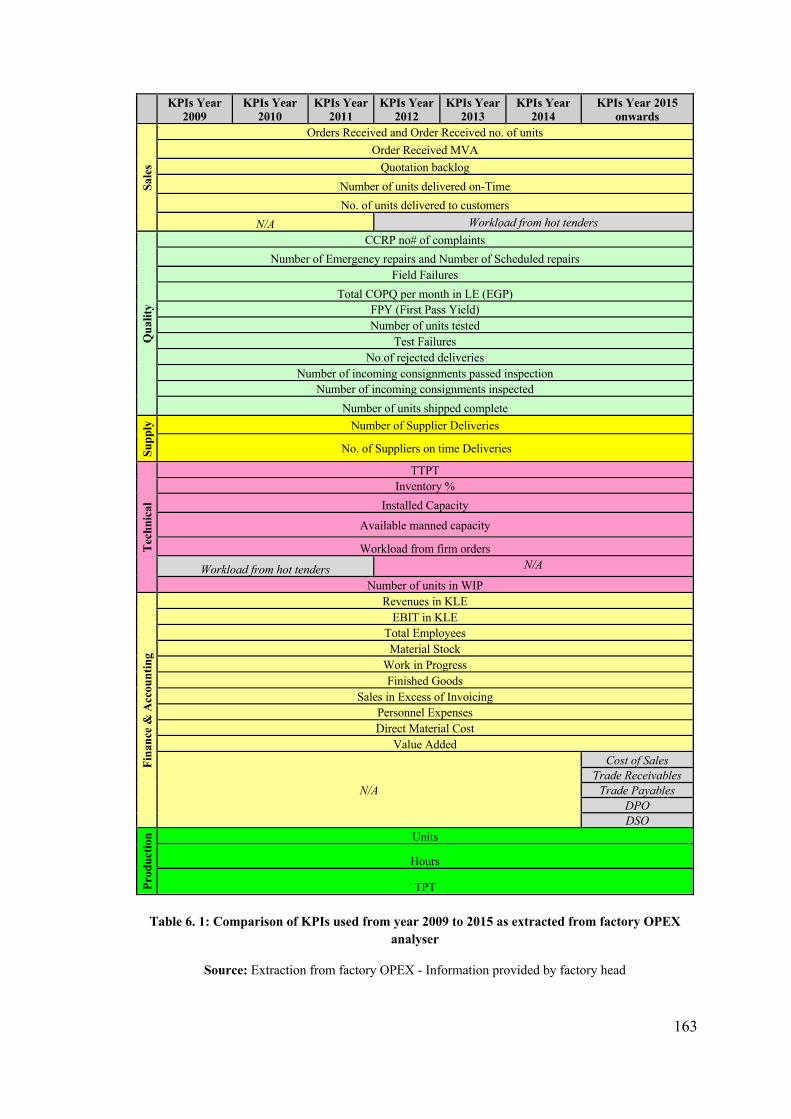
163
KPIs Year 2009
KPIs Year 2010
KPIs Year 2011
KPIs Year 2012
KPIs Year 2013
KPIs Year 2014
KPIs Year 2015 onwards
Sale
s Orders Received and Order Received no. of units
Order Received MVA Quotation backlog
Number of units delivered on-Time No. of units delivered to customers
N/A Workload from hot tenders
Qua
lity
CCRP no# of complaints Number of Emergency repairs and Number of Scheduled repairs
Field Failures Total COPQ per month in LE (EGP)
FPY (First Pass Yield) Number of units tested
Test Failures No of rejected deliveries
Number of incoming consignments passed inspection Number of incoming consignments inspected
Number of units shipped complete
Supp
ly
Number of Supplier Deliveries
No. of Suppliers on time Deliveries
Tech
nica
l
TTPT
Inventory % Installed Capacity
Available manned capacity
Workload from firm orders
Workload from hot tenders N/A
Number of units in WIP
Fina
nce
& A
ccou
n ti n
g
Revenues in KLE EBIT in KLE
Total Employees Material Stock
Work in Progress Finished Goods
Sales in Excess of Invoicing Personnel Expenses Direct Material Cost
Value Added
N/A
Cost of Sales Trade Receivables
Trade Payables DPO DSO
Prod
uctio
n Units
Hours
TPT
Table 6. 1: Comparison of KPIs used from year 2009 to 2015 as extracted from factory OPEX
analyser
Source: Extraction from factory OPEX - Information provided by factory head

164
As shown in table 6.1, starting from year 2012, calculation of the KPI named ‘workload
from hot tenders’ started to be done by sales, instead of factory engineers. Factory
operation manager and one of factory’s lead engineers mobilised this change. During
the interview with factory lead engineer involved in this change, he explained how the
problematisation of having this KPI reported by factory engineers started;
This KPI indicates the capacity needed for hot tenders which is calculated on
basis of "the potential workload from outstanding quotes and orders", which is
received by the sales representatives. Traditionally this was calculated by us as
factory engineers, after obtaining the information on the number of received
orders from sales. However, there were cases in which we encountered errors in
calculating this KPI due to failure to keep up with latest updates or changes in
orders received.
Key actors moving the change here are mainly the factory lead engineers, factory
operation manager and the KPI calculation itself as a non-human actor. It was reported
that, when the KPI was handled by engineers, the KPI calculation showed unrealistic
figures and did not match with the actual orders received. In ANT terms, one can say
that an enrolment of these key actors was reached once the management of this KPI was
moved to sales. As reported by one of factory’s lead engineers;
When the responsibility of calculating this KPI was moved to sales, we were able
to decrease, and sometimes avoid, the risk of having errors in the reported figures
of this KPI. For us, it was a way to optimise the flow of information and get more
reliable calculation of the workload needed from hot tenders.
The second change in the performance measures reported using OPEX included the
integration of five KPIs to be handled by the finance and accounting team, starting from
year 2015 onwards. As illustrated in table 6.1, these KPIs are; cost of sales, trade
receivables, trade payables, Days of Purchases Outstanding (DPO) and Days of Sales
Outstanding (DSO). Cost of sales, trade receivables and trade payables were already
being used by the factory but were only reported on the ABACUS.
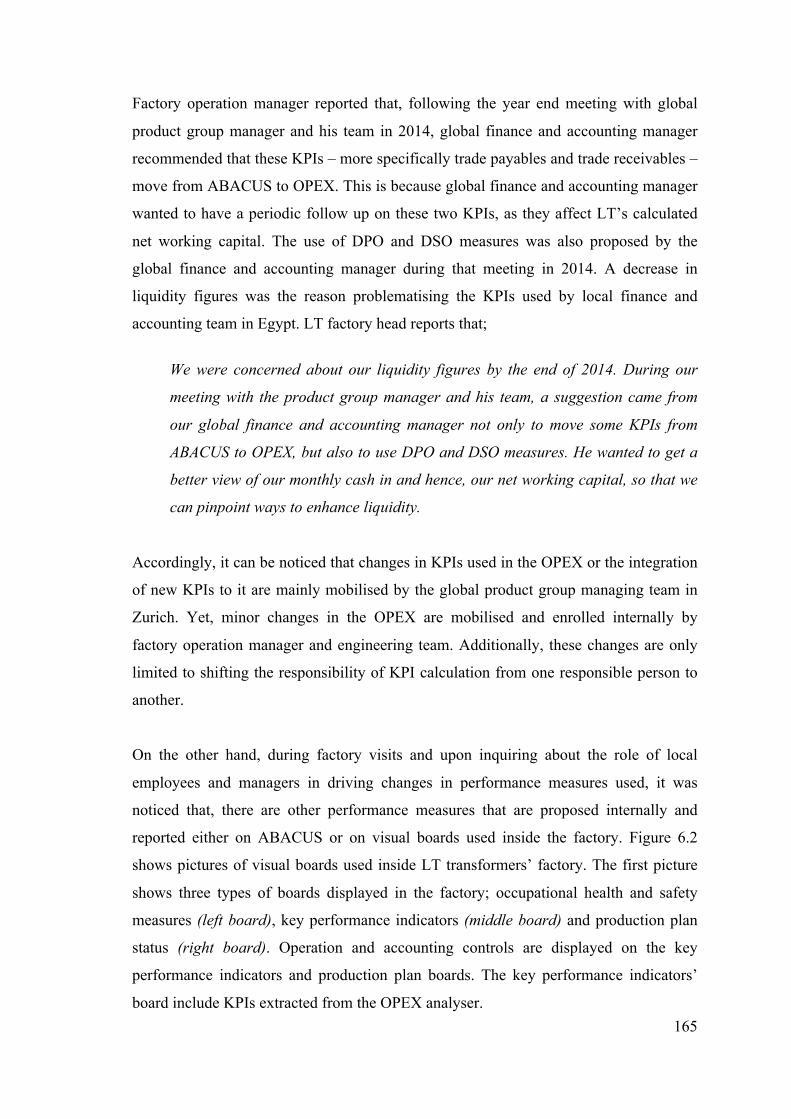
165
Factory operation manager reported that, following the year end meeting with global
product group manager and his team in 2014, global finance and accounting manager
recommended that these KPIs – more specifically trade payables and trade receivables –
move from ABACUS to OPEX. This is because global finance and accounting manager
wanted to have a periodic follow up on these two KPIs, as they affect LT’s calculated
net working capital. The use of DPO and DSO measures was also proposed by the
global finance and accounting manager during that meeting in 2014. A decrease in
liquidity figures was the reason problematising the KPIs used by local finance and
accounting team in Egypt. LT factory head reports that;
We were concerned about our liquidity figures by the end of 2014. During our
meeting with the product group manager and his team, a suggestion came from
our global finance and accounting manager not only to move some KPIs from
ABACUS to OPEX, but also to use DPO and DSO measures. He wanted to get a
better view of our monthly cash in and hence, our net working capital, so that we
can pinpoint ways to enhance liquidity.
Accordingly, it can be noticed that changes in KPIs used in the OPEX or the integration
of new KPIs to it are mainly mobilised by the global product group managing team in
Zurich. Yet, minor changes in the OPEX are mobilised and enrolled internally by
factory operation manager and engineering team. Additionally, these changes are only
limited to shifting the responsibility of KPI calculation from one responsible person to
another.
On the other hand, during factory visits and upon inquiring about the role of local
employees and managers in driving changes in performance measures used, it was
noticed that, there are other performance measures that are proposed internally and
reported either on ABACUS or on visual boards used inside the factory. Figure 6.2
shows pictures of visual boards used inside LT transformers’ factory. The first picture
shows three types of boards displayed in the factory; occupational health and safety
measures (left board), key performance indicators (middle board) and production plan
status (right board). Operation and accounting controls are displayed on the key
performance indicators and production plan boards. The key performance indicators’
board include KPIs extracted from the OPEX analyser.
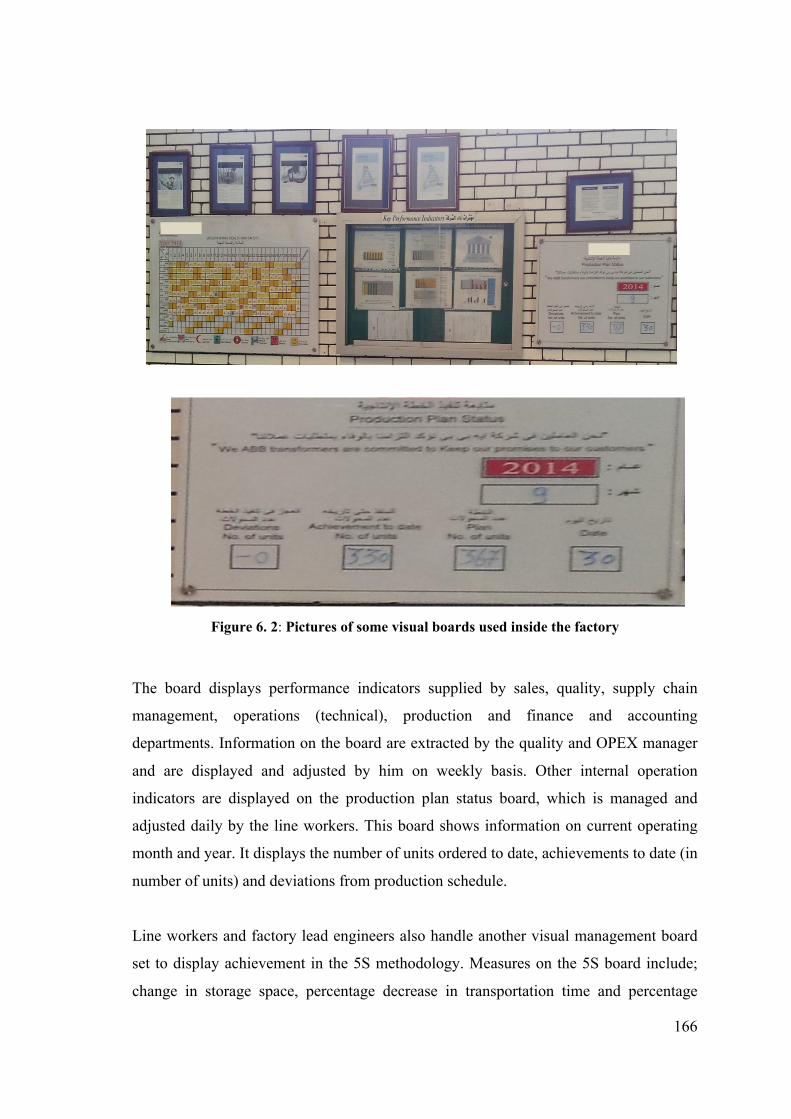
166
Figure 6. 2: Pictures of some visual boards used inside the factory
The board displays performance indicators supplied by sales, quality, supply chain
management, operations (technical), production and finance and accounting
departments. Information on the board are extracted by the quality and OPEX manager
and are displayed and adjusted by him on weekly basis. Other internal operation
indicators are displayed on the production plan status board, which is managed and
adjusted daily by the line workers. This board shows information on current operating
month and year. It displays the number of units ordered to date, achievements to date (in
number of units) and deviations from production schedule.
Line workers and factory lead engineers also handle another visual management board
set to display achievement in the 5S methodology. Measures on the 5S board include;
change in storage space, percentage decrease in transportation time and percentage

167
decrease in motion. These measures are set by factory engineers and monitored by
operation manager and quality-OPEX manager and they can change from time to time,
depending on updates in factory layout.
An example of internal performance measures that proposed by local employees and
reported on the ABACUS system is the 'First Pass Yield (FPY) for tanks'. As per the
interview with the factory engineering and operations advisor;
FPY is the measure for the number of transformers produced first time, with no
scrap or rework. The FPY KPI on OPEX measures the first pass yield for the
transformer product as whole. However, in 2009 we started using the FPY
measure for transformer tanks, which are produced simultaneously with
transformer products. The difference between both measures is that instead of
waiting till the production of the whole transformer is completed and assembled
to measure the number of transformer products produced first time with no
scrap or rework, we stop after tanks’ production to measure the FPY for tanks,
before transformer components are inserted in their tanks.
FPY for tanks measures the number of tanks produced first time without defects.
Defects in tanks mainly relate to oil leakage, requiring further rework or additional
welding efforts. FPY is reported on the factory ABACUS. Upon inquiring about actors
and events driving the use of FPY, it was noticed that a non-human actor in the form of
an operating problem of oil leakage problematised the factory tank welding processes.
According to one of the factory’s lead engineers;
In 2009, we had an oil leakage problem in transformers’ tanks, not among the
transformers’ main components. When such product defects happen, we would
gather line workers in the factory shop floor and report the defects and start
listening to their suggestions on what might be the root cause of the problem.
An interface between actors’ different interests (interessment) occurred when factory
engineers reported the oil leakage problem to factory line workers. The quality-OPEX
manager in LT factory reports that;

168
Usually workers handling the tank's welding and testing processes would blame
tank errors on the workers responsible for tank’s production, so we usually look
for production errors. However, this time one of the production line workers
commented that; “the blame should not always be on us, oil leakage could be
because of defects in welding”. We usually have an acceptable number of faulty
welding points, those that would normally occur but will not lead to oil leakage in
tanks. Yet, with that worker's comment, the engineering team and I started to think
that it is either that welding workers are not sticking to this acceptable number or
that the number itself needs to be adjusted.
LT’s factory head reports that, a meeting was then held between the factory engineers,
quality-OPEX manager and factory head, to revise the acceptable number for faulty
welding points. According to the factory head;
Acceptable number for tanks faulty welding points was then adjusted and it has
been revised since then till it reached a maximum of 4 points in 2014. At that
time, we then used the lean SPC - statistical process control - approach to help
us set targets for an FPY measure for tanks. This measure has been designed
since this incident, is still in use and is currently reported on the ABACUS.
Hence, the new FPY measure was mainly derived by oil leakage problem. Yet,
interessment translation moment was experienced through allowing the interface
between different interests of line workers and listening to their suggestions about the
possible route cause of the problem. Key factory actors of line workers, factory head,
factory lead engineers and quality-OPEX manager driven by the oil leakage problem,
were then able to reach alliances on their interests (enrolment in ANT terms), by
investigating tanks welding processes and taking the decision to minimise the number
of acceptable welding points.
According to the factory head the FPY for tanks is not reported among the OPEX KPIs.
This is because, global product managing team are more interested in reviewing the
figure for FPY for the whole transformer products. However, the factory key actors
involved in setting the FPY for tanks mobilised the use of this internal performance
measure over time and continuously revised it to meet their operating requirements and

169
welding processes’ needs. Updates in FPY for tanks figures can sometimes be reported
to the global product managing team during the video conference meetings held
monthly.
6.4 Summarising the Analysis of First Plot
It can be concluded that key performance indicators used in the factory OPEX are
usually decided by the global product managing team in Zurich. Minor changes in the
OPEX are mobilised and enrolled internally by the operations and engineering team.
Such changes are only limited to shifting the responsibility of KPI calculation from one
responsible person to another. However, factory representatives involving line workers,
factory lead engineers, operation manager, quality-OPEX manager and the factory head,
can still propose other KPIs. Some of these KPIs are reported internally using the visual
management boards displayed in factory shop floor. Other KPIs are available on the
company ABACUS system to be accessed by local finance and accounting controllers,
local business unit manager, as well as the global product managing team. On the other
hand, it was obvious that other than preparing the finance and accounting KPIs reported
on the OPEX and shown in table 6.1, local finance and accounting controllers cannot be
seen as having much of a participative role in deciding on or changing the type of
accounting performance measures used specially those on OPEX. However as shall be
seen in the coming sections they are more engaged in discussions on costing and
reporting decisions.
6.5 Plot 2: Debates on Factory Costing Practices
During the period from year 2004 till end of 2011, the factory old value stream
construction pattern problematised the costing practice used by LT. As discussed in
chapter 5, section 5.5, the factory old one value stream was responsible for producing
all transformer types as they formed one product family. Yet, different transformers’
types took different processing time and varied in their use of the value stream
resources. Such value stream construction problematised the factory used traditional
costing system and questioned its ability to provide the costing information or even the
lean supporting information required by the factory. As discussed in section 4.5 of
chapter 4, the researcher has engaged with the case study organisation in previous

170
research in years 2009 and 2010. In 2009, the researcher discussed the possibility of a
better construction of the factory value stream with the factory head, to account for the
different use of resources among products of the same value stream. Creating more than
one value stream can be a possible alternative that enables the use of a simpler costing
tool to the factory used traditional costing allocation method, such as VSC. More
precisely, constructing three value streams for the three transformer types can be an
alternative to the factory old value stream. However, according to LT’s factory head,
the idea of identifying three value streams so that each value stream handles the
production of one transformer type, is deemed quite impractical. LT factory head
mentioned that;
It would be too costly to invest over space acquisition, equipment and machines
purchases, cross training efforts and on recruitments, when all transformer types
go through the same processing steps in the value stream!
Given the situation with factory old value stream, a second step forward was to gain
more details on how the factory costs its products compared to other possible costing
alternatives, which the factory can used. Comparing other possible alternatives to the
factory used costing practice, (mainly standard costing), showed how the old value
stream problematised the traditional costing system in place. The comparison was then
used to construct an interface between interests of key actors involved in handling LT’s
costing practices.
Given LT’s level of advancement with lean implementation, the researcher first
computed the average transformer unit cost using VSC. The use of VSC to compute
product unit cost resulted in an average cost per unit of EGP 139,217.3514. This average
product unit cost is based on 1,400 shipped units during year 2009. As per the lean
accounting literature of VSC application (Maskell and Baggaley, 2004; Maskell and
Kennedy, 2007; Fullerton et al. 2013), this average unit cost shall apply for all products
within the transformers’ product family transformer, i.e.; SDT, MDT or LMDT).
14 Computed as value stream full costs (EGP 194,904,287 from table 5.5 in chapter 5), divided by the number of units shipped in 2009 (Maskell and Baggely, 2004; Maskell and Kennedy, 2007).

171
The researcher used the cost for one transformer type; 500 KVA transformer, to
construct a comparison between possible costing practices for the transformer products.
Using standard costing with a traditional overhead allocation method, the cost of the
500 KVA transformer totalled EGP 87,100 per unit at that time. Table 6.2 shows a
comparison between LT current cost for a 500 KVA transformer and the average
product cost computed using VSC and that should apply for the 500 KVA transformer
as well. The cost computed using VSC exceeded the one computed by LT Transformer
factory using the traditional standard costing by EGP 52,117.35. This represented
almost 60% increase in the transformer’s unit cost.
Traditional
Costing
Value Stream
Costing (VSC)
Difference
Cost/one 500 KVA
Transformer
EGP 87,100 EGP 139,217.35 EGP 52,117.35
(60%) increase
Table 6. 2: Comparison between Unit Cost of a 500 KVA Transformer using Traditional Costing and VSC.
The huge increase in the average unit cost of the 500 KVA transformer following the
use of VSC, lead the researcher to investigate whether amendments are required over
this cost, as suggested by the features and characteristics costing (FCC) tool
(Huntzinger, 2007). As discussed in chapter 2 (section 2.15.2), FCC is the practice used
to normalise the average VSC cost. FCC uses simple allocation techniques to account
for the different use of resources among product units (Maskell and Kennedy, 2007).
The methodology explained by Maskell and Baggaley (2004, p. 158-166) on how to
apply FCC was used, since their explanation is found to be the most – or almost the
only – elaborative description of the operation of FCC. Following this methodology, the
researcher conducted a capacity analysis for the value stream processes of LT
transformers factory. This capacity analysis aimed at identifying the factory bottleneck
process/pacemaker cell prior to using FCC. Researcher used data in the factory old
value stream shown in figure 5.4 of chapter 5, to develop the value stream capacity
analysis. Data used includes the number of workers and machines, as well as cycle time
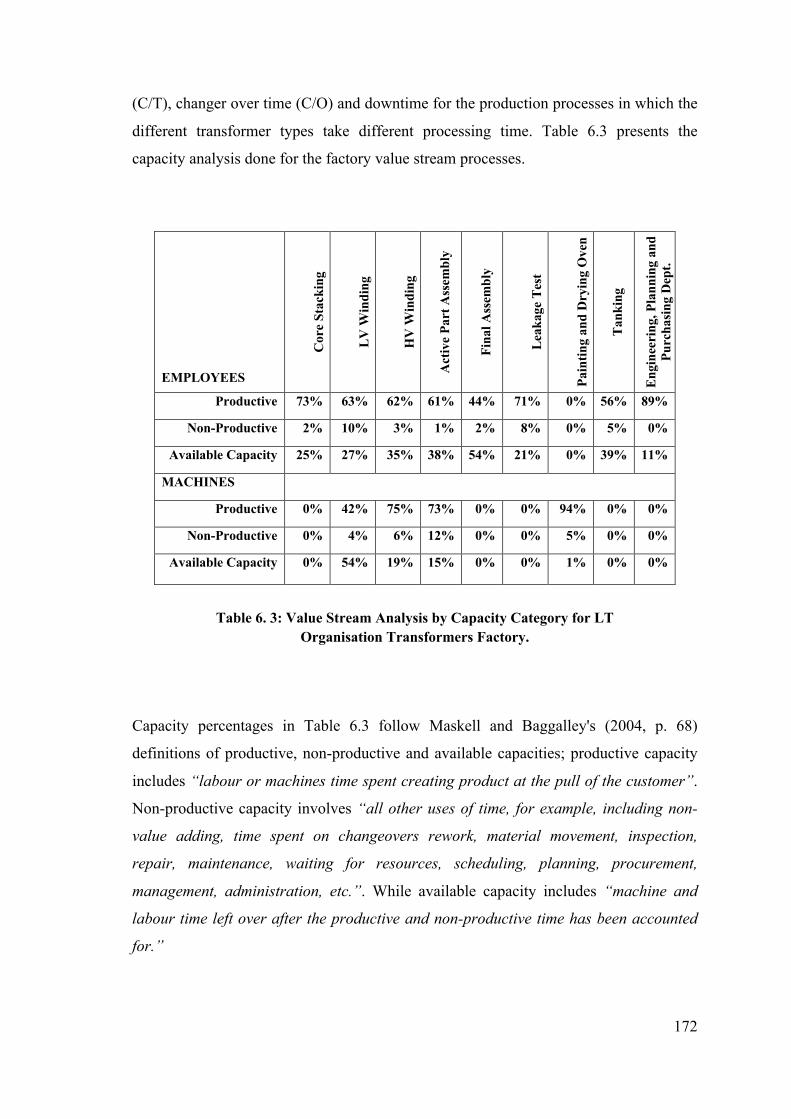
172
(C/T), changer over time (C/O) and downtime for the production processes in which the
different transformer types take different processing time. Table 6.3 presents the
capacity analysis done for the factory value stream processes.
EMPLOYEES
C
ore
Stac
king
LV
Win
ding
H
V W
indi
ng
Act
ive
Part
Ass
embl
y
Fina
l Ass
embl
y
Le
akag
e Te
st
Pa
intin
g an
d D
ryin
g O
ven
Tank
ing
Engi
neer
ing,
Pla
nnin
g an
d Pu
rcha
sing
Dep
t.
Productive 73% 63% 62% 61% 44% 71% 0% 56% 89%
Non-Productive 2% 10% 3% 1% 2% 8% 0% 5% 0%
Available Capacity 25% 27% 35% 38% 54% 21% 0% 39% 11%
MACHINES
Productive 0% 42% 75% 73% 0% 0% 94% 0% 0%
Non-Productive 0% 4% 6% 12% 0% 0% 5% 0% 0%
Available Capacity 0% 54% 19% 15% 0% 0% 1% 0% 0%
Table 6. 3: Value Stream Analysis by Capacity Category for LT Organisation Transformers Factory.
Capacity percentages in Table 6.3 follow Maskell and Baggalley's (2004, p. 68)
definitions of productive, non-productive and available capacities; productive capacity
includes “labour or machines time spent creating product at the pull of the customer”.
Non-productive capacity involves “all other uses of time, for example, including non-
value adding, time spent on changeovers rework, material movement, inspection,
repair, maintenance, waiting for resources, scheduling, planning, procurement,
management, administration, etc.”. While available capacity includes “machine and
labour time left over after the productive and non-productive time has been accounted
for.”

173
In Table 6.3, percentages of non-productive capacity were developed using the data for
changeover time, downtime and waiting time available for these processes in the factory
old value stream map. However, these percentages do not include the time for
inspection, administration and planning as estimates for such time were not provided by
the factory representatives. Only the time needed for machines maintenance and
movement of materials and component parts was estimated based on the nature of the
production process, and the data collected on the wellbeing of the factory machines. A
capacity analysis for the sales and marketing department could not be performed due to
insufficient data on the average time spent on scheduling, receipt of orders, time spent
during bids and in various activities conducted by this department.
From the capacity analysis presented in Table 6.3, it was noticed that the “Painting and
Drying Oven” process represented the primary bottleneck of the value stream, being the
process with the least available capacity (1%). As a second step to applying FCC, the
researcher started identifying the features of the product, which made transformers take
different processing time in the bottleneck process. It was found that the size of
transformer product units is the feature leading them to take different processing time in
the painting and drying process. A transformer size is determined by its power; the
higher the power of the transformer the bigger its size is. Therefore, the average time
needed for different transformers in the painting and drying process was categorised
according to the transformers power and size in the pattern shown in Table 6.4.
Table 6. 4: Time needed to Process Different Power Transformers in the Bottleneck
Process
Transformers Size Intervals
based on Transformers Power
Average Time needed in the Painting
and Drying Process
< 750 KVA 23 Hours 40 min (for 9 units)
750 – 1400 KVA 25 Hours 40 min (for 9 units)
> 1400 KVA 27 Hours 40 min (for 7 to 8 units)

174
The 500 KVA transformer fell in the first interval identified in Table (6.4), where
processing an average of 9 units of this transformer type requires an average time of 23
hours and 40 minutes. Given the capacity of machines – (approximately 4,160 hours per
year – 2 machines working for 1 shift of 8 hours per day) – in the bottleneck process,
1,581 units of the 500 KVA transformer could be produced, if cycle time of 23 hours
and 40 minutes was needed to produce the 500 KVA products. Total conversion cost for
LT factory totalled EGP 40,031,861 (full cost EGP 194,904,287 minus direct materials
cost 154,872,426 EGP). Accordingly, a unit conversion cost for the 500 KVA
transformer is EGP 25,320.59 (40,031,861/1,581). Adding the transformer material unit
cost (EGP 67,881.63) gave a total cost of EGP 93,202.22.
The average product unit cost computed using VSC totalled EGP 139,217.35 based on
1,400 shipped units. Table 6.5 provides a comparison between this average product
cost, the cost developed using standard costing (traditional costing) and FCC product
unit cost. It was noticed that the use of FCC incurred substantial amendments to the
average product unit cost computed using VSC. Considering the time taken by different
types of transformers in the bottleneck process shall create different unit costs for each
transformer type. Also, from Table 6.5 it could be seen that, FCC provided a lower
product unit cost for the 500 KVA transformer which is almost 33% below the average
VSC unit cost.
Traditional
Costing
Value Stream Costing
(VSC)
Features & Characteristics
Costing (FCC)
Cost/one 500
KVA
Transformer
EGP 87,100 EGP 139,217.35
60% above traditional
costing
EGP 93,202.22
7% above traditional costing
33% below the average VSC
Table 6. 5: Comparison between Unit Cost of a 500 KVA Transformer using Traditional Costing, VSC and Features and Characteristics Costing

175
6.6 Analysing Plot 2
The analysis of the second plot discusses the interactions between different actors
involved in deciding on the relevant costing practices for LT factory, given its old value
stream. However, this analysis cannot ignore other actors’ interactions affecting factory
costing practices after the construction of new value streams in 2012. Hence, this
section is divided into two subsections. Subsection 6.6.1 analyses the data in plot 2
relevant to the factory old value stream used from 2004 till end of 2011. Subsection
6.6.2 builds on this earlier analysis to explain actors’ interactions involving factory
costing practices after the construction of new value streams.
6.6.1 Situation with the Old Value Stream (2004 – till end of 2011)
During that period, key actors involved in handling and negotiating the
organisation’s costing practices were; the factory used costing calculation (standard
costing using traditional allocation method), the researcher, LT factory head, factory
operation manager, finance and accounting controllers team, representatives from the
centre for shared accounting services (SAS) and global managing team in headquarters
in Zurich. The calculations of transformer products unit costs using VSC and FCC were
passed on to these key actors and discussed with them in subsequent interviews and a
focus group session. This was done in the context of a third translation moment of
enrolment aiming at building agreements among key actors on their interests. Upon
discussing the results from the VSC calculations with key actors mentioned above, they
argued that the average cost was unacceptably high and seemingly distorted or
inaccurate. Additionally, factory head and finance and accounting controllers team
commented that:
It will be illogic and financially inaccurate to set the same product unit cost for
all types of transformers when they actually use LT resources differently, even if
they form one product family.
Factory head and the chief finance and accounting controller also reported that, more
consideration of how resources were being used in processes other than the bottleneck
was needed. It was found that the factory still depended on product unit costs mainly for
pricing decisions, some inventory valuation, detailed profitability analysis, and for cost
176
reduction purposes. Unit costs were expected to be needed for transfer pricing decisions
at some stage after updating organisation’s policies in line with Egyptian taxation law.
A dependency on unit costs for such a variety of purposes indicated that the factory
would, to some extent, rely on unit costs. One of the comments received from LT’s
chief finance and accounting controller was;
At a management level, we tend to use total costs and total profitability figures. At
an operations level, we need to analyse decisions on basis of the breakdown of
costs. We currently use a pull production approach, nevertheless we still need
product unit costs for some ending inventory valuation purposes. The factory
receives large orders some of which require a long production execution period
that may reach one year. As a result, computing an accurate product unit cost is
of much importance to the factory operations and to ensure accurate product
pricing decisions.
A focus group session with the factory head, factory operation manager, chief finance
and accounting controller and two factory lead engineers highlighted how LT’s
European headquarters exhibited a strategy of cost reduction following the uprising
political and economic conditions in Egypt in 2011. More specifically in late 2012, LT
sales decreased drastically in Egypt. The European headquarters were forced to focus on
cost cutting solutions. This did not involve a change in LT’s costing system, but it
implied a strategic focus on cost reduction more than cost accuracy. During this time,
the chief finance and accounting controller reported that:
We will usually focus on adopting a costing practice that gives a lower unit cost.
An accurate cost is good, but we understand how our global headquarters
currently weigh cost reduction objectives.
Hence, with the old value stream, the factory’s need for more consideration of how
resources were used in non-bottleneck processes and the headquarters’ focus on
achieving lower product unit costs, the researcher suggested activity-based costing
(ABC) as another costing alternative for LT products. The ABC suggestion illustrated
in figure 6.3 aimed to convey to key actors involved that, given their level of progress
with lean management and their old value stream identification, a possible solution to
use a simple costing practice as VSC (Maskell and Kennedy, 2007; Fullerton et al.,
177
2013) would be to identify more than one value stream. In such case there will be three
value streams; one for each transformer type. LT can then depend on an average VSC
calculation, since the separate value streams would resolve the need to account for
resources shared in the old value stream. Yet, creating three value streams was not
feasible as discussed earlier. Hence, the use of ABC was suggested to help account for
resources shared in all value stream processes, not just those shared in the bottleneck/
pacemaker cell as suggested by FCC. In this sense, ABC can be used with the
organisation’s old value stream. Additionally, it can develop what the key actors
perceived as a ‘more accurate’ cost calculation for their transformers given their
dependency on product unit costs.
The ABC suggestion in figure 6.3, projected that old value stream cells/ processes are
divided into value stream activities to which value stream resources are distributed. Cost
of value stream resources in each activity were then allocated to transformer product
units (cost object) on basis of cost drivers, which are relevant to each type of value
stream activity. A comparison between the cost calculations of the 500 KVA
transformer product using ABC, VSC, FCC and standard costing using a traditional
allocation method, is shown in table 6.6.
Given the cost reductions achieved using ABC compared to other costing practices in
table 6.6 and the key actors’ perception about its accuracy, they were quite motivated to
move to ABC. ABC was viewed as the costing practice which can succeed on both
objectives of cost reduction and accuracy. Yet, even with such motivation from
different human actors to adopt ABC, the researcher came to realise that they do not
have the authority nor the freedom to enact this practice. In this respect, LT’s chief
finance and accounting controller mentioned that;
We follow certain global guidelines regarding our cost calculations. We call
them the 'LT guidelines'. Our transformers factory head can pass the
calculations of a new costing tool to our accounting shared service centre for
their feedback. However, enacting a new costing practice or changing a costing
system requires a committee meeting between global division controllers. If a
global approval came to us to change our regional costing practices, then we
can enact the new costing tool other than this it's out of LT Egypt controller’s
hand!

178
Figure 6. 3: Proposed alternatives for case study organisation given its factory old value
stream Source: Adapted from Gamal et al. (2012, p. 104)
170
Figure 6. 3: Proposed alternatives for case study organisation given its factory old value stream
Source: Adapted from Gamal et al. (2012, p. 104)
Proposed use of Activity-Based Costing (ABC) for Case Organisation
Value Stream Activity II
Value Stream Activity III
Resources
Value Stream Activity I
Cost Object
Cost Drivers
Given current factory costing needs and VS identification
Suggesting another value stream identification - enabling the use of Value Stream Costing (VSC)
Value Stream I
Production labour, materials and production and operation support costs
Equipment and machines cost, facilities and maintenance plus all other VS costs
Value Stream II
Production labour, materials and production and operation support costs
Equipment and machines cost, facilities and maintenance plus all other VS costs
Costing and
decision making
using total VS
cost
&
Average
cost/unit = Total
VSC ÷ No. of
units shipped
Case organisation using a lean management
Specify customer Value
Identify Value Streams
Keep Process Flow
The Pull Principle
The Perfection Principle

179
Traditional
Costing
Value Stream
Costing (VSC)
Features
&Characteristics
Costing (FCC)
Activity-Based
Costing
Cost/one 500
KVA
Transformer
EGP 87,100 EGP 139,217.35
60% above
traditional
costing
EGP 93,202.22
7% above
traditional costing
33% below the
average VSC
EGP 85,211.4
2% below
traditional costing
38.8% below
VSC
8.6% below FCC
Table 6. 6: Comparison between Unit Cost of a 500 KVA Transformer using Traditional Costing, VSC, FCC and ABC
As mentioned earlier, the uprising political events happening in Egypt in 2011 promoted
a focus on cost reduction from LT global managing team. Accordingly, local actors in
Egypt were not able to implement ABC, albeit their most preferred costing practice. A
costing system depending on standard costs using a traditional allocation method was
mobilised by key actors to continue being in use. Enrolling standard costing meant
ruling out other alternative calculations including VSC, VSC with FCC and ABC. This
was attributed to reasons associated with the old value stream construction pattern, the
organisation’s dependency on product unit costs and local managers lacking power and
authority to enact new costing practices. Yet, it is worth mentioning that, the debates on
LT’s costing practices discussed here, form one of the first incidents where finance and
accounting personnel were actively involved in discussing organisation’s accounting
practices relevant to its needs and operating layout. Such findings will be used in the
discussion on the performativity of VSC as a costing practice and the factors affecting
managers willingness to implement it, covered in the next chapter.
6.6.2 Situation with Factory New Value Stream – (Costing Practices following the use of ABC in 2014 onwards)
As discussed in chapter 5 (section 5.7.2), a partial use of ABC was in place in
2014 and this followed the new value streams created in 2012. More identification of
cost centres and more efforts on using relevant cost drivers was then made in 2016.
Having two value streams gave more room for simplifying the costing practices used,

180
applying principles of eliminating wastes from the costing transactions as aspired by the
lean accounting definition (Crandall and Main, 2007). Hence, once again one of LT’s
finance and accounting controllers discussed with the researcher the possibility of
implementing VSC as a costing practice. This time key actors involved included; the
researcher, VSC calculations, ABC calculations used by the factory, LBU finance and
accounting controllers, head of SAS, representatives from SAS centre, factory operation
manager and chief finance and accounting controller. ABC calculations in place
problematised VSC calculations. VSC calculations showed how after the new value
stream identification, ABC calculation of the per unit cost of an SDT transformer is the
same as the VSC calculation. Yet, applying VSC is simpler, given the effort needed to
deal with multiple cost centres associated with the use of ABC. However, upon
constructing an interface between key actors via a focus group session, they ended up
refusing the move to VSC albeit it the simpler costing practice.
Factory operation manager reported that the factory still needs a ‘reliable’ figure of
product unit cost for the other transformer types (MDT and LMDT) sharing the second
value stream. As reported by the one of the LBU finance and accounting controller;
Now that we have our activity-based costing system in place, a logical use for
VSC will only be applicable to one type of transformers; SDT. However, we will
still need to go back to our activity cost centres to determine the costs for the
other two transformers types.
Head of SAS and SAS representatives reported that;
It is obvious that VSC is a simpler practice and more time saving than ABC. Yet,
perhaps when we as an accounting shared service centre move to lean by the
beginning of 2017, lean management will be more perceived as a culture. Then,
we might be able to initiate the move to less wasteful costing practices such as
VSC.

181
Hence, ABC remained as the costing calculation enrolled by the key actors identified
earlier. For the second time, VSC calculations were rejected but this time it was the
effect of another calculation (ABC), that stopped VSC from luring actors into taking
any action towards its implementation.
6.7 Plot 3: On the Tension between Accounting Controllers and Factory Engineers
As mentioned in chapter 5 section 5.3, information on the SAP is handled by both
SAS employees and finance and accounting controllers in Cairo head office and the
operation manager and lead engineers at the factory. Hence, incidents of having
tensions or conflicts between accounting personnel and factory engineers were
discussed during the interviews conducted with them. Both parties - (accountants and
engineers) - confirm that most incidents of conflict of interest/ tension were resolved.
However, perception of each actor on how the other reacted varied immensely,
especially upon comparing comments from the accounting versus the engineering side
on the same incident. This section presents two incidents in which tensions between
those actors was sensed. The section aims at showing how incidents of conflict of
interests/tension were handled, how different parties had different opinions on the same
incident and areas where LT’s MAS was affected by the tension and others where the
management accounting calculations initiated the conflict.
6.7.1 Factory lead Engineers and Reflections on Costing Calculations
The organisation depends on a budgeted allocation rate to apply its indirect costs
either after the move to ABC in 2014 or before that. For the organisation the use of
ABC meant multiple budgeted rates to account for the various cost pools/ centres
identified. Yet, in the past, a budgeted rate was still developed to allocate indirect costs
using the traditional allocation method. Accordingly, as costing calculations are done
over SAP, the system includes the annual budgeted rates for each activity cost centre
and two columns: one displaying budgeted hours per production activity and another
blank column where, actual hours should be reported. The tension incident discussed
here relates to a problem experienced when LT was using the traditional overhead

182
allocation method. However, such problem was brought to the surface with the various
calculations associated with the use of ABC.
Problematisation started when two LBU finance and accounting controllers began to
find difficulty computing total production costs for each of the transformer types. At
first, one of the LBU finance and accounting controllers noticed that, when lead
engineers at the factory use more or less hours in any of the production cells, instead of
filling in the actual hours they used in the SAP column designed for that, they update
the ‘budgeted hours’ column with the actual hours consumed. Hence, the LBU
controller finds it quite hectic to compute ‘total manufacturing costing’ on every
quarter. This is because, she does not have a reliable figure for ‘under’ or ‘over’ applied
overhead costs, given that she is unable to have an appropriate representation of the
actual hours worked versus the budgeted ones. The issue exaggerated with the use of
ABC, having to deal with the same problem occurring for various allocation bases.
According to the LBU finance and accounting controller:
By the end of each quarter, the budgeted column I have for the expected
allocation bases almost disappears. Factory engineers post their actual labour,
machine hours and other actual cost drivers in the column designed to include the
budgeted drivers. So, in the end of the period, total cost figures I get appear as if
they are distorted. I cannot guarantee that the update I do over production costs
did really include a comparison between actual drivers and budgeted ones. I still
urge factory lead engineers to report their actual hours consumed in the SAP
column designed for that. To me this shall provide a more reliable representation
of the actual resources used in the factory. It is not only about costing, having
actual figures of resources consumed even mid of the quarter, will be of major
help to me to take other decisions which are related to capacity utilisation.
6.7.2 Analysing the First Tension Incident
With the use of ABC such problem was noticed by the two LBU finance and
accounting controller who reported this to the chief controller. An interface between
actors’ different interests was done when a meeting was conducted between the three
controllers, the factory operation manager and factory lead engineers. Factory lead
183
engineers turned out to have a different reasoning for reporting actual cost drivers in the
way they did. Additionally, they did not have the full understanding of how drivers
were then used either for total costs computation or for decision making. As reported by
the factory operation manager:
We leave the budgeted column unchanged for production cells in which we had
used the exact figure of the budgeted working hours or the estimated cost driver.
In cases where the actual resources used differ from the budgeted ones, it usually
has to do with reasons that go beyond the line workers control, for example; cases
in which machines took more time to load.
Hence, from the engineering viewpoint, updating the column for budgeted cost drivers
was acceptable, since changes in expected use of cost drivers also acceptable because it
had to do with non-controllable factors. However, at the accounting controllers’ end,
updating the budgeted column for actual results meant receiving vague data on the
actual consumption of production resources. Additionally, controllers were not
convinced that a ‘non-controllable’ factor is deemed responsible for all cases in which
an update in the ‘budgeted hours’ column was made. According to the second LBU
finance and accounting controller:
The chief finance and accounting controller, my LBU controlling colleague and I
find it illogic to trust that line workers either stick to the expected working hours/
resources set to be used in each cell or only deviate from them for reasons that go
beyond their control. We are not engineers, but we have some understanding about
lean management principles. In my view, managing with actual data not only
facilitates our work as management accountants, but also, I understand that having
prompt real data provides a more reliable basis for any of our improvement
initiatives, which matches the lean principle of continuous improvement.
Upon interviewing three of the line workers working in different production cells and
inquiring about how used resources are reported, they all confirmed that in many cases a
deviation for set budgeted cost drivers was for reasons beyond their control such as; an
increase in machine down time or loading time. Yet, in one of the discussions on the

184
implementation of lean 5S methodology with one of these line workers, he commented
that:
The implementation of 5S methodology changes frequently. The objective is that
we continuously try to improve our organisation skills, production structure and
motion to save effort and time. As we moved from one implementation plan to
another, we were able to decrease the gap between the actual processing hours
worked in our cell and the budgeted hours on the SAP.
Consequently, it was understood that some deviations from the planned working hours
could be related to reasons related to line workers for example; the way they organised
their tasks and how they moved between production cells. Additionally, one of the line
workers reported that, in some cases, increase in machine down time had to do with
delay in periodic machine maintenance, which the line workers deemed as something
beyond their control. However, accounting controllers mentioned that delay in machine
maintenance should not be regarded as an acceptable reason to allow for deviations
from expected hours needed. Instead, it should be treated as a waste, which in lean
terms; requires elimination.
As reported by one of LBU finance and accounting controllers, alliances between
controllers, factory operation manager and lead engineers occurred when they went
through the details of various cases in which the deviations occurred. Inclusion of
comments from line workers proved influential in enrolling an action plan between
controllers and engineers. Even though engineers remained reluctant to change the way
they report the actual cost drivers used, they agreed to report actual resources used in
cases where deviations are related to wasteful activities. However, controllers are still
urging factory lead engineers to report actual used resources in their designated SAP
column, for all the production cells. In spite mobilised to be handled this way, the
reporting of information affecting costing calculations is still undergoing negotiation
trials from the controllers’ side to emphasise to engineers the benefit of managing via
actual data. A final comment made by the LBU finance and controller was:
At least we made some progress reaching this agreement with lead engineers, but
I will keep on urging them to report in the SAP column for actual drivers used.
185
Also, I cannot guarantee that they do account for all variations subsequent to a
wasteful activity, as I still witness very few entries on the actual column even after
we made this agreement. What I am currently negotiating with the LBU manager
is having some of the SAP accounting experts who currently work at the SAS,
moved to the factory. I think the presence of 3 to 4 SAP accountant at the factory
and having them paying visit to the shop floor can bridge the gap between our
perception on the need for actual data and the engineers’ perception on it.
Potentially, I do expect this to help reach a situation where all actual data are
reported in the right SAP column.
6.7.3 Processing Sales Orders and Managing On-time Delivery in Full
During the last quarter of 2016, one of the finance and accounting controllers at
LT Cairo head office received a lot of complaints from customers, who had paid various
instalments for their orders and did not received any. According to this finance and
accounting controller copies of instalment payments were sent to the factory head to
confirm cash collection and direct orders production accordingly. At the same time, the
head of SAS notified finance and accounting controllers that, he has been noticing a
decrease in the figures for on-time delivery KPIs reported on both OPEX and ABACUS
during October till end of November. Traditionally, finance and accounting controllers
do not keep track of the developments in on-time delivery (OTD) figures, but an
increase in customers complains together with the reported decrease in OTD did
problematise the case, at least for them. Explaining this incident, one of finance and
accounting controllers reported that:
We are usually concerned with the OPEX KPI information that we are
responsible of reporting. As finance and accounting controllers, the number of
units delivered on-time is a KPI that is reported via the sales department.
Calculation of delivery KPIs, for example; AOTD and ROTD percentages, is then
done by the factory quality-OPEX manager and reported on the ABACUS. So
initially I was more concerned about the non-processed orders, whose customers
had already paid the instalments. Yet, a decrease in the figures for on-time
delivery witnessed at the same time, pushed me to investigate with the factory
operation manager, the reasons why both were happening simultaneously.

186
Finance and accounting controller noted that, upon discussing this with factory
operation manager, he informed her that production is delayed because of delays in the
shipment of other orders. To the finance and accounting controller, this explained the
decline in on-time delivery figures. However, to her surprise, the factory operation
manager informed her that delays in orders’ shipment should be blamed on sales
department and supply chain management. He requested that she contacts the supply
chain manager to request a speed up in the delivery of material, so that he can process
new orders for which instalments were paid. As described by the finance and
accounting controller;
It was surprising to me that he did not want to release the finished goods he had
at the factory until he receives the requested material. Our finished goods
warehouse is not this big and the fact that he is not releasing the finished goods
meant that some transformer products are actually stored on the shop floor. When
he told me to check with sales, I thought that our retailers are the ones who are
late in picking up their goods. However, I discovered that the operation manager
was the one instructing employees to delay the release of orders, so that we push
material shipment from our end. Not only did this bothered me as well as the head
of SAS and created many distractions, but it was also quite strange that, the
operation manager is directing employees to trigger ‘wasteful’ activities and
behaviours, by delaying production and storing finished goods around the value
stream! The factory health, safety and environmental manager also confirmed on
me that such situation is contra-lean and accordingly value stream operations
were stopped to safeguard line workers, given that finished goods are displayed
on the shop floor!
6.7.4 Analysing the Tension Incident
Hearing about this specific incident first from the finance and accounting
controller was a process that did put various pits that the researcher witnessed into
perspective. The researcher made an earlier visit to the factory on the 3rd of October
2016 and no goods were seen during the researcher's tour in the factory shop floor i.e.
going through the value stream production cells. However, many finished and packed
transformer units were lined up alongside the door leading to the production shop floor.

187
When the researcher inquired about these transformers with one of the factory’s lead
engineers, he replied that they are just about to be out for delivery to their customers.
Nothing was mentioned about delivery delays or late production processing then.
Additionally, the researcher found it sensible to hear from other key actors involved in
negotiating this incident, after hearing about it from the finance and accounting
controller. Those key actors are; head of SAS centre, factory sales manager, factory
operation manager, some representatives from line workers and supply chain manager.
Three of the line workers interviewed confirmed that some goods were placed in the
shop floor as the factory warehouse was full and factory retailers were late in picking up
their orders. Factory operation manager also confirmed that the reason for calling off
production during some periods is that, value stream cells cannot proceed with the
production process when finished good are on the shop floor. He also noted that they
are experiencing delays in materials delivery from the supply chain management end, in
addition to retailers’ delay in collecting their finished orders. On the other side,
according to factory sales manager:
It is not a retailers’ problem! it did not turn out to be the case when I contacted
factory retailers, whose delivery dates were due around that time of the year.
Because I am based at the factory, it is always forgotten that I have to work
directly with the finance and accounting controllers, since they plan their
quarterly budgeted cost rates on basis of the number of orders I receive and notify
them about. It was quite contradictory to me to observe finished goods being
moved to the shop floor more than once for two consecutive months and at the
same time, being informed about customers delivery complains received by the
controllers at the head office. The factory retailers who I contacted reported that,
when they called the factory few days before their delivery date to check on their
orders completion, employees at the factory warehouse informed them that not all
orders were complete. However, when the finance and accounting controllers
informed me about the details of some of the customers complaining from late
delivery, I discovered that those customers goods were among the ones finished
and moved to the shop floor. I then became suspicious that it was an engineering
balloon intended to push materials delivery dates, even though a substantial delay

188
in materials delivery was already discussed and expected by lead engineers and
our operation manager for this quarter of 2016 as a result of the increase in
exchange rates!
At the supply management end, the factory supply chain manager noted that:
The government policy related to currency evaluation has raised exchange rate
between the Egyptian pound (EGP) and the US dollar. Accordingly, we cannot
currently import the same quantities of material that we used to import all at
once, as we need to do some checks on our foreign currency reserves since our
liquidity situation and savings are mostly in EGP. Hence, at the beginning of the
last quarter of 2016, it was agreed in a meeting held among factory operation
manager, LT engineering and operations advisor, finance and accounting
controller and factory sales manager, that material needs will arrive in batches of
small amounts to compensate for the time needed to manage currency needs. So,
some effect on production processing was expected and should be understood
given that the situation we are in this quarter had to do with an overall
governmental policy
An interview with LT’s engineering and operations advisor confirmed the information
provided by the factory supply chain manager. Engineering and operations advisor also
added that, when he was notified about customer complaints received by finance and
accounting controllers, he reckoned that a ‘late delivery’ problem was made up by
factory operating team to force supply chain to speed up delivery of materials.
According to him;
This is a strange protocol to handle such situation. I am now regarded as one of
the factory consultants and in my view such reaction from factory operating team
can be described as an anti-lean one. To be more precise what happened is the
real definition of a ‘wasteful’ activity. The factory health, safety and environment
manager share this same opinion with me, and I had already notified the finance
and accounting controllers about it in case they do not see it like that, being non-
engineers.
189
A meeting was then held between the engineering and operations advisor, factory
operating manager, supply chain manager and the finance and accounting controllers.
Different interests and expectations of these people were put forward as highlighted in
some of their quotes mentioned above. Alliances between interests were achieved when
the finance and accounting controllers drove the operation manager attention to the
deteriorating figures OTD. Additionally, as reported by the enterprise head of SAS, LT
started to receive warnings on these figures from the global finance and accounting
manager. Operation manager blamed controllers for not being cooperative enough to
manage currency issues, while controllers blamed the factory operating team lead by the
operation manager, for trying to take advantage of the controllers’ lack of full
comprehension of lean principles to encounter non lean behaviours. As reported by one
of finance and accounting controllers:
For this last quarter of the year, we reached an agreement on how to handle this
situation on basis of cooperation and compromise from both ends and I do hope
they stick to it in similar situations. I agreed to do more efforts on managing
currency issues and to follow up with supply management on materials delivery.
However, I had to include the global finance and accounting manager to make
sure delivery of finished goods and future processing of customer orders are not
to be handled this way again. In the presence of the global finance and
accounting manager we have agreed that, till lean is being implemented as a
whole culture and its implementation includes us in addition to the SAS centre,
factory operating team should not undermine the effect of their behaviours in the
shop floor on the organisation’s accounting system. What we all learnt from this
issue was that a wasteful activity at the shop floor can be wasteful at many and
various other ends.
6.8 Chapter Summary
This chapter discussed and analysed the events and interactions making up LT’s
MAS and how they are related to many human and non-human actors in the
organisation. In this discussion more case study findings were elaborated. The chapter is
mainly structured around three major story plots in which Callan’s (1986) and Latour’s
(1987, 1996, 2005) four moments of translations were experienced. The three plots
190
detailed the stories related to changes in organisation’s performance measures, debates
associated with the choice of organisation’s costing practices and the tension incidents
experienced between organisation’s accountants and engineers. Analysis of these stories
showed that major changes in organisation’s performance measures are mostly driven
by the organisation’s global managing team in Zurich. At the same time, internal KPIs
can also be developed as a result of operating issues experienced at the factory. These
internal KPIs are mobilised only by the effort of organisation’s actors identified in this
chapter. Analysis also showed situations in which the organisation’s operating shop
floor, more specifically its value streams, affected the choice of its costing practices and
was able to rule out a ‘lean tailored’ practice such as VSC. Other incidents showed how
competing calculations such as ABC and VSC can enrol one calculation at the expense
of the other and affect managers acceptance of its implementation. Finally, stories about
tension experienced between organisation’s accountants and engineers provide evidence
on how the organisation’s finance and accounting controllers can understand lean needs
and take actions that not only facilitate their work as accountants, but also supports a
lean management environment. The next chapter builds on the details of actors’
interactions discussed in those story plots and uses Callon’s (1998a, 2007) concepts of
framing and overflow to develop an empirical driven theoretical conceptualisation of
the developments in LT’s MAS. Various implications are driven for this
conceptualisation and are then used to develop answers for the study research questions.

191
Chapter 7: Discussion
7.1 Introduction
The previous chapter analysed the details of three major stories revolving around
drivers of change in case organisation’s performance measures, the choice of
organisation's costing practices and the management of tension situations between
accountants and engineers. Throughout the discussion of these stories, Callon's (1986)
and Latour’s (1998, 2005) four moments of translation were experienced. The
discussion in this chapter uses Callon’s (1998a, 2007) concepts of framing and overflow
to develop an empirical driven theoretical conceptualisation of the developments in
LT’s MAS. Various implications are driven from this conceptualisation and then used to
develop answers for the study research questions. This chapter constitutes ten sections.
Section 7.2 presents a timeline of both LT’s progress with lean implementation and
changes in MAS witnessed throughout the study period. The timeline summarises lean
and MAS changes presented in chapter 5 and discussed in the three plots in chapter 6.
The timeline seeks to show how organisation’s MAS influences and is influenced by
progress in lean implementation and change in LT factory space. The empirical
conceptualisation developed in this chapter builds on LT’s timeline and on the use of
different accounting information systems (OPEX, SAP and ABACUS) and actors’
different perceptions on management accounting practices and controls reported using
each information system. Actors’ different perceptions on LT’s management accounting
practices and controls are presented in section 7.3. Section 7.4 then discusses the
empirical driven theoretical conceptualisation using concepts of framing and overflow.
Implications driven from the conceptualisation are discussed in sections 7.5, 7.6, 7.7
and 7.8. Section 7.9 reflects on the both the empirical conceptualisation developed in
this chapter and the literature driven conceptualisation developed in chapter 3 to
develops answers for this study’s research questions. The chapter then concludes with a
chapter summary in section 7.10.

192
7.2 A Timeline of Both Lean and MAS in Case Organisation
Figure 7.1 builds on the timeline of LT’s progress in lean management
implementation presented in chapter 5 (section 5.4), to present a cumulative timeline of
both progress in lean and changes in organisation’s management accounting system
throughout the study period.
The two dark black horizontal arrows show the timeline for the period during which,
organisation’s operating and accounting data are analysed (from 2004 to 2016). The
descriptions and boxes below the bottom arrow pertain to the changes experienced in
the organisation's MAS. Data above the top arrow relate to actions affecting progress
with lean implementation. The statement 'old value stream' is meant to indicate changes
experienced in lean management implementation and MAS during the use of factory old
value stream as illustrated in figure 5.4 of chapter 5 (section 5.5). Changes experienced
from beginning of 2012 till 2016, occurred after identifying the new value stream
shown in figure 5.5 of chapter 5 (section 5.6). Figure 7.1 tries to link developments in
MAS to the new design of factory space (Miller and O'leary, 1994), where the factory is
regarded as 'a veritable laboratory' in which “...accounting exerts an influence on, and
is influenced by, a multiplicity of agents, agencies, institutions, and processes” (Miller,
2001, p. 392).
Beginning with the period during which the organisation was managing using its old
value stream, i.e. from the start of lean implementation (2004) till end of 2011, one can
say that organisation's MAS did not show much changes with lean management
implementation. Before a suggestion of alternative costing practices – (VSC and ABC)
– was put forward by the researcher in 2009, LT depended on a traditional accounting
system, using standard costing. Regular budgeting data were prepared on quarterly and
annual basis. Almost all performance measures were traditional or non-lean, except for
a couple of lean-tailored KPIs namely: FPY for products and cost of value added15.
15 Examples of KPIs used during this period are shown in Table (5.6) of Chapter 5.

193
Figure 7. 1: Timeline for Organisation’s MAS and Lean Management over the Study
Period
Time
April 2005 • Introduction and use
of visual boards in factory shop floor
• Encouraging workers’ representatives to participate in internal decision-making processes
Start of Lean Management Implementation • Identifying
customer value
• Analysing activities to define factory value stream/s
• Defining factory value stream
February 2012 • Need to enhance production
lead time and machines waiting time
• Defining factory new value streams
November 2004 • Movement to a
pull production system using JIT
• Use of 5S methodology in factory shop floor
• Batch production still in use in some orders
January 2006 • Using Statistical
Process Control (SPC)
• Encouraging factory line-workers and employees to have more role in decisions related to operating performance
March 2014 • Single-piece flow
for all MDT and LMDT products
• Very small batch production on some SDT orders
April 2016 • Swiss
headquarters plans to implement lean management in organisation’s SAS
2005 2006 Time
Movement of some
KPIs from ABACUS to OPEX and integration
of new performance
measures because of
low liquidity figures
Finance and
accounting controllers interfering to resolve decline in OTD and
production suspension problems
Sept. 2004 2012 2016
• Suggesting VSC
• Comparing VSC to standard costing, VSC with FCC and ABC
• Calculating FPY for tanks
2009 2014 2015
Old Value Stream New Value Stream
• Partial use of ABC
• Rejecting VSC for the second time
• Using more lean-tailored KPIs together with new internal controls
• Standard costing
• Mostly traditional accounting/ 'Non-lean' performance measures
• Annual and quarterly budgets

194
Looking at the progress in lean during the same period shows that, actors involved
mainly focused on a achieving a speedy progress with lean implementation. LT
successfully moved to a pull production system before the end of 2004 and moved
ahead with using visual boards, continuous improvement methods as SPC, and
empowering employees by encouraging them to have a role in decision making. The
two lean-tailored KPIs were mainly mobilised by an operating need to show progress
with lean, in terms of products’ quality and the cost of value added. Construction of the
value stream was done in isolation from any finance and accounting member of the
organisation. During this period organisation's MAS with its calculations can be viewed
as a neutral 'Camera' i.e. a mere representation of the world activities (Mouritsen, 1999;
Revellino and Mouritsen, 2015) or according to Vosselman (2014, p. 182), 'a
representation of something' and 're-presentation for someone'.
It was only in 2009, that finance and accounting people become aware of possible
costing alternatives that can work with LT’s level of progress with lean. Comparing
VSC and ABC to standard costing calculations broadened the understanding of finance
and accounting people of the relationship between what is happening at the factory and
how it can be calculated. As discussed in plot 2 of chapter 6 (section 6.5), almost all
organisation actors – human and non-human – were involved in negotiations on
possible costing systems for the factory. As will be discussed later in this chapter, this
marked one of the first incidents where finance and accounting representatives as well
as management accounting calculations had a role in reaching an agreement on the way
forward. Finally, in 2009, organisation's MAS was influenced by the way lean
implementation has progressed in the factory to empower line workers and consider
their suggestion to develop FPY KPI for tanks and report it in the organisation's
ABACUS.
As discussed in chapter 5, section 5.6, a need to enhance production lead time and
machines’ waiting time pushed for identifying a new value stream in 2012. The use of
ABC - even partially - was triggered by global finance and accounting manager in 2014.
ABC was viewed as a more suitable costing system after the change in factory value
stream, also after a move to a single-piece flow for production of both MDT and LMDT
products. Though initially mobilised by Swiss finance and accounting managers,
195
management accounting calculations in the form of ABC, continued to play a key role
in deciding the way forward for factory’s costing system. As will be discussed later in
this chapter, ABC calculations were the main reason why VSC was rejected for the
second time. The period from 2012 to 2016, witnessed more developments in MAS than
in lean management. The main advancement in lean implementation following the
construction of new value stream and use of single piece flow, was a plan to extend lean
implementation to organisation’s centre for SAS. However, advancements in MAS
continued in conjunction with finance and accounting controllers’ enhanced
understanding of lean as a whole culture/philosophy. This was seen in the use of
internal lean tailored controls in 2014 and finance and accounting controllers resolving
tension issues experienced with engineers in 2016.
7.3 Actors Different Perceptions on Organisation’s Management Accounting
Practices and Controls
As discussed in chapter 5, section 5.3, LT manages its management accounting
information using three information systems; SAP, OPEX and ABACUS. Though
organisation actors can have access to more than one information system or to all of
them – for some actors –, each information system still had an informally designated
key responsible person/s. Over the time, this has made some human actors more
acquainted with some systems and their practices than others. Eventually, those key
responsible persons developed different perceptions about the organisation’s
management accounting practices and controls. This section discusses the different
perceptions that organisation’s human actors have on MAS practices and controls used
during the longitudinal study period. Table 7.1 lists the organisation actors handling
LT’s accounting information systems, the accounting information systems they manage,
together with, the accounting calculations processed by each system.
Table 7.1 shows that, each group of human actors handling a certain accounting
information system, has a key responsible person. For example; finance and accounting
controllers are the key responsible people managing SAP, factory head and quality and
operations excellence manager are the key persons handling information on OPEX
analyser, while LBU manager and the global managing team form the key persons

196
managing the ABACUS. As will be seen in the next section, different perceptions of
key responsible persons on organisation’s management accounting practices and
controls, affected their interactions with other organisation’s actors– human or non-
human. This also had a bearing on the developments experienced in organisation’s
MAS.
Information
Systems Used SAP OPEX Analyser ABACUS
Human actors • Finance and
accounting
controllers
• Head of SAS
• Centre for SAS
employees
• LBU manager
• Factory operation
manager
• Line workers
from factory
operations
• Factory head
• Quality and OPEX
manager
• Factory operation
manager
• Finance and
Accounting
Controllers
• LBU manager
• Global managing
team
• Global managing
team
• Head of SAS
• Factory head
• Finance and
Accounting
controllers
• LBU manager
Management
accounting
calculations
Costing calculations
Budgeting data
Published (external)
KPIs
Internal KPIs and
lean accounting KPIs
Key
responsible
human actor
Finance and
Accounting controllers
Factory head and factory
operation manager
LBU manager and
Global managing
team
Table 7. 1: List of human actors chosen for the study, the accounting information systems they handle and the key responsible actor for each system
A representation of different perceptions of key responsible persons over different years
of the study period is shown in tables 7.2, 7.3 and 7.4. Each table shows a representation
of these different perceptions with respect to a type of management accounting
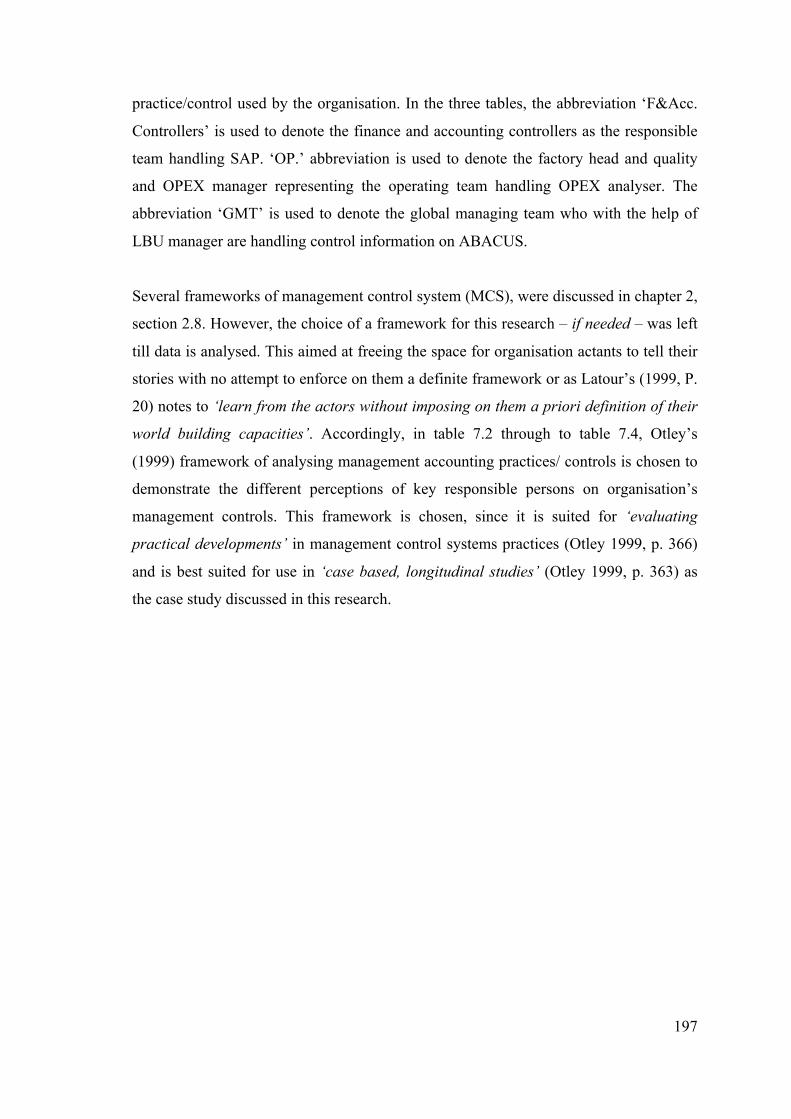
197
practice/control used by the organisation. In the three tables, the abbreviation ‘F&Acc.
Controllers’ is used to denote the finance and accounting controllers as the responsible
team handling SAP. ‘OP.’ abbreviation is used to denote the factory head and quality
and OPEX manager representing the operating team handling OPEX analyser. The
abbreviation ‘GMT’ is used to denote the global managing team who with the help of
LBU manager are handling control information on ABACUS.
Several frameworks of management control system (MCS), were discussed in chapter 2,
section 2.8. However, the choice of a framework for this research – if needed – was left
till data is analysed. This aimed at freeing the space for organisation actants to tell their
stories with no attempt to enforce on them a definite framework or as Latour’s (1999, P.
20) notes to ‘learn from the actors without imposing on them a priori definition of their
world building capacities’. Accordingly, in table 7.2 through to table 7.4, Otley’s
(1999) framework of analysing management accounting practices/ controls is chosen to
demonstrate the different perceptions of key responsible persons on organisation’s
management controls. This framework is chosen, since it is suited for ‘evaluating
practical developments’ in management control systems practices (Otley 1999, p. 366)
and is best suited for use in ‘case based, longitudinal studies’ (Otley 1999, p. 363) as
the case study discussed in this research.

198
Tabl
e 7.
2: D
iffer
ent P
erce
ptio
ns o
f Org
anisa
tion
Key
res
pons
ible
act
ors o
n C
ostin
g Pr
actic
es u
sed
duri
ng d
iffer
ent P
erio
ds o
f the
Stu
dy

199
Tabl
e 7.
3: D
iffer
ent P
erce
ptio
ns o
f Org
anisa
tion
Key
res
pons
ible
act
ors o
n O
PEX
KPI
s us
ed d
urin
g di
ffere
nt P
erio
ds o
f the
Stu
dy
200
Tabl
e 7.
4: D
iffer
ent P
erce
ptio
ns o
f Org
anisa
tion
Key
res
pons
ible
act
ors o
n A
BAC
US
and
Inte
rnal
KPI
s use
d du
ring
diff
eren
t Per
iod s
of t
he S
tudy

201
Table 7.2 illustrates the different perceptions responsible persons had on the costing
practices used throughout the study period. Table 7.3 shows the different views of these
responsible persons on the organisation’s published KPIs via OPEX. As can be seen
from both tables the three teams of responsible human actors share the same views on
the targets, rewards and information feedback loops used for both costing practices and
KPIs on OPEX. In Table 7.4, an illustration of the different perceptions of key
responsible persons on both ABACUS and internally reported KPIs is presented. It can
be noticed that with this type of controls different responsible teams had different views
on the controls’ objectives, strategies, targets and rewards across different study
periods. Illustrations of different perceptions by key responsible persons are discussed
in detail in the next section in conjunction with the changes in MAS presented in figure
7.1, to show how both can be used to conceptualise the developments around LT’s
MAS in the context of lean.
7.4 MAS between Framing and Overflow
The previous section introduced the different perceptions which key responsible
persons handling organisation’s accounting information systems, had on the
organisation’s management accounting practices used, throughout the study period. In
this section, Callon’s (1998a, 1998b, 2010) ideas on framing and overflow are used to
conceptualise the developments around MAS in the context of lean using LT empirical
data. Figure 7.2 represents an illustration of this conceptualisation, which will be
discussed in this section and in relation to the literature driven theoretical
conceptualisation discussed in chapter 3– (see figure 3.3, section 3.7.3).
As shown in figure (7.1) representing the timeline of lean and MAS, in LT, a positive
progress on the performance measurement level was not needed to trigger more efforts
to enhance the implementation of lean. Unlike Ahlstrom and Karlsson's (1996)
framework, a positive result on the accounting performance measures side – (for
example; 'productivity' in their paper) – did not trigger adaptations or simplifications in
the organisation's MAS. Findings would agree with Ahlstrom and Karlsson's (1996)
case study on the idea that, a level of confidence is needed for top management to
embark on lean management implementation in the first place. As figure 7.2 shows, in

202
LT, support from global managing team, transformers factory head and operation
manager and their conviction of the benefits from lean, were the main drivers for its
implementation and further advancements with it. This also coincided with Fullerton et
al.'s (2013) findings confirming the importance of top management support to motivate
lean management implementation.
Figure 7. 2: Empirical driven Theoretical Conceptualisation of Developments in Organisation’s MAS based on LT Case

203
In the period between year 2004 – (the start of lean implementation) – till end of year
2011, organisation actants have mostly succeeded to stabilize a frame of interactions
that in many cases was able to keep “a set of stable mechanisms and settings”
(Skaerbaek and Tryggestad, 2010, p. 110) for the organisation’s MAS and channel
successive ‘cold’ overflows experienced during this period. ‘Cold’ overflows contained
during this period included; the operating team not having definite strategy or objectives
for developing internal KPIs when tanks oil leakage problem occurred, initiating the
need for internal KPIs to measure oil leakages in tanks. As shown in table 7.4, between
2004 and 2011, both finance and accounting controllers and operating teams did not
have a definite view on the objective of using internal KPIs. At the same time, global
managing team in Zurich, perceived internal and ABACUS KPIs as used to support lean
initiatives and the operating team’s work. Divergence in actors’ perceptions on the
development of internal KPIs was easily channelled then, since global managing team
has consistently encouraged participation of factory workers and employees in decision
making. Swiss managing team oversaw a potential need to use internal KPIs and has set
objectives and strategies for them. The global team has usually motivated a socialising
form of relationships and accountability (Roberts, 1991) among factory and local
business unit personals. Hence, factory workers were encouraged to actively participate
in designing FPY KPI for tanks.
A second ‘cold’ overflow was contained when operating team felt the need to move the
responsibility of handling some OPEX KPIs from technical team to sales. As shown in
table 7.3, finance and accounting controllers perceived OPEX KPIs to solely have a
financial objective. Yet, operating team as well as LBU manager and global managing
team used these KPIs for both financial and operating objectives. Agreement was easily
reached since operating and managing team had a common understanding of the
objective and strategy for using OPEX KPIs.
In both overflow incidents, the finance and accounting controllers lack of knowledge of
the objective of using internal KPIs and the operational objective of using OPEX KPIs,
did not obstacle the containment of overflows whenever they were experienced. As
mentioned earlier, at these early stages of lean implementation, the finance an
accounting team had no established knowledge of the management control practices
204
associated with lean or of any lean accounting practices. As discussed in section 7.2, the
construction of factory value stream was done without consulting the finance and
accounting team. Their first incident of being involved in discussions about LT
management accounting practices only started in 2009.
On the other hand, competing calculations of standards costing, VSC, ABC and VSC
with features and characteristics costing, towards the end of year 2009, have created a
situation in which negotiations between interacting actors to decide on a way forward
became quite controversial. As shown in figure 7.2, this situation ended in identifying –
without containment – a ‘hot’ overflow, where divergence in actants views and
mechanisms of treating different costing calculations created a discrete understanding of
what needs to be measured or done (Callon, 1998a). As discussed earlier, prior to 2009,
finance and accounting team was not involved in discussions on lean and management
accounting and control practices. At that time, finance and accounting controllers had
different objectives and strategies for using costing practices than those adopted by
operating team and LBU and Global managing team as can be seen in table 7.2. While
the former group aimed at using accurate costing practices, which considers how
resources are being used, the latter group mostly focused on inventory valuation and
then cost reduction strategies, especially after the uprising political events in Egypt in
the beginning of 2011.
As discussed in plot 2 of chapter 6 (section 6.5), the researcher calculated possible
costing alternatives which can suite the organisation. However, standard costing kept
being used and was mainly regarded as a ‘mere reflection of the innovation in use’
(Revellino and Mouritsen, 2015) i.e. a camera, reflecting accounting calculations after a
move to lean. The overflow caused by competing calculations in 2009, was not
resolved. Accounting controllers favoured activity-based costing as the accurate costing
calculation. Yet, they needed approval from global managing team to mobilise it. On
the other hand, the operating team were happy to continue using standard costing, as
long as it achieved their inventory valuation and cost reduction objectives. At the same
time, as Callon notes; what is kept in brackets will always tend to give rise to matters of
concern (Callon, 2007, p. 139). The unresolved hot overflow had brought the problem
of identifying a single value stream of transformer types to the surface. This then
205
implied that, given LT’s old value stream, the organisation has only two alternatives:
either to construct three value streams or to use a costing practice that does a good deal
of cost allocations. No agreement was reached on a practical solution to this problem
when it was discussed in 2009.
A common knowledge base was only established between actants, when the global
managing team prioritized cost reduction over cost accuracy in 2011, after the uprising
political events in Egypt. Accordingly, standard costing continued to be used – or was
indeed enforced – even after the discussions of other possible alternatives that are more
capable of considering how resources are being used in organisation’s value stream.
Standard costing was chosen not because it was the calculation with “higher levels of
representation faithfulness”, but more importantly it was the calculation which was able
to “hold diverse facts and interests together that these facts will become true” Briers
and Chua (2001, p. 267).
Hence, during the period from 2004 till end of 2011, organisation key actors were able
to identify overflows, agree on ways to measure them and reach a common
understanding of current and future statuses in many overflow incidents. Yet,
controversies and divergence between actors’ opinions regarding alternative costing
practices for LT, were quite big to be channelled without a top-down decision from
global managing team. In all of these overflows, the global managing team focus on
cost reduction objectives, their support of the lean management implementation
initiative together, the identification pattern of factory value stream, together with the
uprising political events experienced in the beginning of 2011 were the main
instruments allowing actors to frame negotiations on the MAS’s practices used.
As illustrated in figure 7.2, an identification of two operating value streams in the
period starting year 2012 created a new frame of interaction between organisation’s
actants in the period from year 2012 till end of year 2015. A new frame was gradually
established in this period, since actors’ identities and their pattern of measuring
overflows have developed in accordance with the change in their knowledge and
perceptions about the management accounting and control practices to be used in the

206
organisation. Also, the new layout of value streams had its influence on LT’s
management accounting practices, specially the costing ones.
A change in the perception of finance and accounting controllers about the strategy for
using costing practices, from just focusing on computing accurate product costs to
encouraging the use of costing practices which simplifies accounting calculations, has
enabled the channelling of cold overflows experienced in this period. Cold overflows
included suggesting the use of VSC again in 2014 and comparing VSC calculations to
those of ABC. A second cold overflow was experienced when operation line workers
updated budgeted labour and machine hours for the actual hours worked as discussed in
plot 3 of chapter 6 (section 6.7). In these overflow incidents, channelling was mainly
facilitated through a better understanding by finance and accounting team of lean and
the possible management accounting practices working with it and with their
organisation’s constructed value streams. The new layout of the operating floor
including two value streams still prioritised the use of a costing practice that does some
allocation. Though finance and accounting controllers preferred and suggested VSC as a
possible costing tool, ABC calculations acted as an engine which lured organisation’s
actors into rejecting VSC implementation for the second time (Revellino and Mouritsen,
2015). Finance and accounting controllers’ understanding of the organisation progress
with lean, helped contain any divergence between their opinion to use VSC and the
operating and global team preference to use ABC. Such understanding also facilitated
the agreement on how hours are reported by factory workers on SAP. Also, as shown in
table 7.3, an agreement between the operating team and the LBU manager and global
managing team that the objective of the OPEX KPIs is to measure progress with lean,
has facilitated the integration of new KPIs driven from the lean accounting literature in
the end of 2014.
Hence, though a new value streams layout created a new frame for actors’ interaction,
more inclusion to finance and accounting team created a better understanding of the
operating environment and of relevant management accounting and control practices.
This understanding helped contain overflows and kept a steady state around interactions
related to organisation’s MAS in which actants were usually capable of reaching ‘…an
agreement regarding the reality and scope of the overflows’ (Callon, 1998b, p. 261).
207
Finally, the announcement of the global managing team the move of lean management
implementation to the organisation’s Shared Accounting Service (SAS) centre in 2016,
represented a second hot overflow experienced by the organisation actors as can be seen
in figure 7.2. The beginning of 2016 witnessed a large divergence between
organisation’s actors on the consequences of lean implementation in the SAS centre.
While the operating team did not regard this as making a difference in their role, the
finance and accounting controllers believed that they can have a more lean-related role
given the understanding of lean and MAS’s needs. The change in finance and
accounting understanding of management accounting needs in a lean environment,
together with the amendments they integrated on the ABC calculations in the beginning
of 2017, reframed the actors’ interactions around the organisation’s MAS. That is not to
say that, controversial issues around the use of lean principles in SAS has been fully
contained. Yet, a reframing of actors’ interactions was once again experienced from the
last quarter of 2016. The new frame implied more influential role played by finance and
accounting controllers even in lean related concerns. Examples included, finance and
accounting controllers resolving issues related to negative OTD figures and suspension
of production problems in 2016. As shown in figure 7.2, it was difficult to identify
overflows from year 2016 onwards, since interactions between actors is currently more
or less stabilised on having a more participative role in the move of lean to centre for
SAS and the enactment of lean related management controls if needed.
As can be seen from the discussion of figure 7.2, throughout the study period, LT’s
MAS experienced episodes of framing and overflow. Those framing and overflow
incidents gave rise to various implications on the relationship between MAS and lean as
a process innovation and horizontal organisation arrangement, and on the performative
role of operating structures and management accounting calculations. Those
implications are discussed in the coming sections.
7.5 On the Performativity of Operating Structures
The case of LT’s transformers factory provides evidence on how operating structures
can be performative. While the study of performativity has been used in many areas
including linguistics (Austin, 1962), economics (Mackenzie, 2006), the study of
financial models (Mackenzie and Millo, 2003; Makenzie and Spears, 2014), role of

208
technologies (Revellino and Mouritsen, 2015; Themsen and Skærbæk, 2018), we can
rarely find a detailed study highlighting the performative role of operating structures.
Using Callon’s (2007) ideas on performation, when LT factory identified its old value
stream the ‘illocutionary force’ they implied or the ‘pragmatic turn’ they took in this
action, was to construct a value stream which accounts for all value adding activities
(Kennedy and Brewer, 2006) and includes products that form one product family
(Maskell and Baggaely, 2004, Fullerton et al., 2013). However, the ‘perlocutionary
effect’ or the ‘semiotic turn’ that this value stream did had, is emphasizing the need for
a costing practice which does some allocation, i.e. accounts for how resources are used
differently among the three transformer product types. The way the factory old value
stream is identified, has consistently mobilised the use of standard costing or activity-
based costing– (perceived as a more accurate allocation method by factory finance and
accounting controllers). This means that such value stream identification can effectively
mobilise the use of some costing practices and limit others, irrespective of how these
practices might be ‘theoretically’ compatible with the organisation’s progress with lean
management.
A complete study of the performative role of factory’s old value stream, also entails
taking an ANT turn in understanding all the contributions made by actors involved in
this socio-technical agencement (Caliskan and Callon, 2010). As discussed in earlier
sections, the construction of such value stream involved many organisation actors, yet,
it involved no consultation from any finance and accounting member of the
organisation. Additionally, as shown in table 7.2, from the start of lean implementation
till the beginning of year 2011, key responsible actors from operation perceived the use
of a costing practice as a tool for mainly managing inventory valuation. Finally, the lack
of knowledge about alternative costing tools suitable for lean by the accounting and
finance team and an OPEX which mainly reports traditional accounting controls,
supported the continuous use of standard costing without discovering any problems with
value stream identification. Hence, this structure of old value stream has been quite
performative to stabilise a frame of interaction (Skaerbaek and Tryggestad, 2010),
between all actors around lean and factory management accounting practises used
between years 2004 and 2011. Operating structures in the form of the newly constructed
value streams, have also proven to be quite performative in establishing a new frame of

209
interactions around the new value streams and their supporting KPIs and management
accounting practices from year 2012 to 2015.
7.6 Horizontal Organisation Arrangements and the Desire to Control
The translation processes mainly shaping plot 1 discussed in chapter 6 (section 6.3)
and witnessed during the negotiations on factory suitable costing practices, show a
continuous desire from Swiss global managing team to be full hands-on the control
practices enacted at the headquarters in Egypt. In a horizontal organisation arrangement
such as lean, one would expect an inclination towards more lateral co-ordinations
between actors at the headquarters in Egypt and the Swiss global managing team, in
addition to the lateral relations between the local actors themselves (Chenhall, 2008).
Throughout the study period, global managing team has encouraged lateral
accountabilities in LT Egyptian factory, emphasizing socialising relationships, where all
actors are motivated to take part in decision making (Roberts, 1991). However, the team
has mostly exhibited a hierarchal (top-down) form of accountability in their dealings
with representatives from the Egyptian factory. Accounting calculations reported and
easily accessed by global team via OPEX and ABACUS, have consistently enabled the
team to maintain a very good control of what is happening in the Egyptian headquarters.
Though this has to do with the role of calculations acting as inscriptions – which will be
discussed later in this chapter – it facilitated the global team’s control at a distance
(Robson, 1992). As discussed in plot 1 of chapter 6, the global team directs which KPIs
are to be published on OPEX and which remain internal. They also enact new KPIs to
be used, for example; DPO, DSO and cost of sales following the liquidity problem in
2014. Yet, this form of top-down control has its consequences, in terms of limiting
global team’s ability to make use of the contribution of lateral arrangements at the
factory shop floor, for example; the cost savings achieved after using FPY for tanks. In
case of LT, this type of maintaining control did not only inhibit progress with lean
management implementation (van der Steen and Tillema, 2018). However, the case
study shows that it can inhibit progress with management accounting. In LT, standard
costing was enforced by global managing team after turning down VSC and then ABC
in 2011, as both did not achieve their cost reductions objectives, though ABC was
favoured by the organisations controllers and was viewed as suitable with the factory
old value stream.

210
7.7 On the Performativity of Calculative Practices and Management Accounting
Relational Ontology
As much as LT’s old value stream was performative enough to stabilise actors’ frame
of interaction between 2004 and 2011, VSC calculations were counter-performative to
unravel the problems associated with the construction of such value stream. The
pragmatic turn VSC calculations intended to have in 2009 (Callon, 2007), was to
provide a simple costing tool (Maskell and Kennedy, 2007; Fullterton et al., 2013),
which can compute an average cost that serves a family of products (Maskell and
Baggaley, 2004) represented by LT’s value stream. Yet, the semiotic turn that the
calculation had, was the creation of an extremely high cost which cannot be used as an
average cost for all types of transformers. As much as VSC did not perform in the same
direction in which it was expected, the calculation – alone and with features and
characteristics costing – highlighted the problem LT had with its value stream
identification pattern. Such problem with value stream construction then questioned
whether standard costing is the best costing practice to continue with and motivated
actors to investigate other possible costing alternatives. VSC counter-performed in the
sense that, its own calculations did not encourage anyone to use it and acted against its
own merits. Yet, VSC calculations created ‘traces’ which invited more interactions
among actors and disentangled further costing and operating issues which needed to be
assessed (Revellino and Mouritsen, 2015). VSC calculations were inscriptions that did
not “--stand as representations of a distant reality but rather act[ed] as the instauration
of their reference” (Busco and Quattrone, 2018, p. 16). Though the intention from using
VSC was not attained, the calculation formed a trajectory (Revellino and Mouritsen et
al., 2015) for questioning and testing possible costing practices, also for investigating
alternative ways of constructing LT value streams. This trajectory expanded in both
space and time. VSC calculations have broadened the cognitive boundary (Latour,
1986) for LT’s finance and accounting team. Prior to its calculation, finance and
accounting team had no idea about the link between the way factory value stream is
constructed and relevant costing practices and they were not involved in any decisions
regarding the factory operating structure. Calculating product costs using VSC in 2009,
pushed finance and accounting team to have a role in analysing factory space and
suggesting suitable management accounting practices. This role extended over time,
211
where the finance and accounting team suggested the use of VSC once again in 2014
with an understanding that VSC can be more compatible with the new factory space.
This time, ABC calculations were performative enough to rule out the possibility of
adopting VSC. ABC’s pragmatic and semiotic effects were the same, i.e. ABC intended
to provide a cost calculation which considers how resources are used among different
transformer types and it effectively did so. ABC achieved high level of ‘representation
faithfulness’ (Briers and Chua, 2001) and was performative because it considered the
new factory layout composed of two value streams, where one is devoted for SDT and
another for both MDT and LMDT. ABC was able to achieve the global managing
team’s objective of providing more understanding of how resources are used – specially
in hours – in both value streams. VSC calculations represented a computation of an
average product unit cost which LT could not depend on to cost all its products even
when it can used to effectively cost SDT product.
In his description of the ‘performativity of accounting’ Vosselman (2014, p. 183) notes
that; ‘accounting is active and has an impact in a collective of humans and other-than-
humans. It is made to act by others in a relational network, that is; it performs’. VSC
calculations did not only accumulate traces that developed a trajectory for future
developments in LT’s MAS, but they have also brought up management accounting
relational ontology (Vosselman, 2014). With more understanding of lean and
management accounting needs, LT’s finance and accounting team had more influential
role in interactions involving LT MAS. Additionally, they have used controls – for
example; OTD – to understand relationships and behaviours exhibited by other
organisation’s actors from sales, to supply chain to line workers. This has then helped
the team to actively participate in decisions affecting the elimination of non-lean
(wasteful) behaviours in the factory shop floor.
7.8 On the Role of Management Accountants and Consultants
The case of LT emphasises the role of management accountants, not only in
understanding control practices suitable for a level of progress with lean, but also in
positively contributing to lean environment through eliminating non-lean behaviours.
Agreements on solutions to the two major tension problems discussed in plot 3 of

212
chapter 6 – (see section 6.7), were mobilised by the organisation finance and accounting
controllers’ team. In the two tension stories, finance and accounting controllers had
influential 'lean roles' in both enacting the use of actual hours - at least partially - and
stopping a wasteful non-lean behaviour in the form of suspending production and
stocking finished goods around the production value stream. More involvement from
finance and accounting controllers as well as LT’s SAS members is also expected
following lean implementation in the organisation’s SAS centre. This actually comes in
contrast with some of Seal and Herbert’s (2013) findings showing that developing
accounting shared service centres can marginalise the role played by management
accountants. Unlike what some operation management literature would suggest (see
Hassen and Moruitsen, 2007), LT case shows that a space which is mostly managed by
operation managers is not necessarily better than one managed by management
accountants. In those tension cases, non-lean behaviours encountered by factory
engineers and line workers were not attributed to the use of the traditional management
accounting practices be it standard costing or ABC (Johnson, 2006; Kennedy and
Widener, 2008; Fullerton et al., 2013). However, as discussed in chapter 6, section 6.7,
such tension cases were experienced as a result of operating actors’ participation in
wasteful activities grounded in mass production (Emiliani and Stec, 2005) - such as
stocking finished goods around production value stream - and more importantly due to
their inability actors exhibit a 'no blame' environment (Hines et al., 2004; Maskell and
Baggaley, 2004) in the way tension was handled. The role played by LT’s finance and
accounting team came in contrast to the findings of Tillema and van der Steen (2015)
case studies in which 'lean tailored' controls were mostly driven by 'lean advocates' i.e.
lean experts and operators on the shop floor.
The case also emphasised the role played by consultants/ academics. In LT, the
researcher had an influential role in bringing the attention of finance and accounting
team of possible costing alternatives, which may be suited for their operating space.
This was seen in how the finance and accounting team were happy with VSC
calculations with features and characteristic costing and were motivated towards ABC
implementation as they were not aware that there might be other suitable costing
calculations for their level of progress with lean management. As Callon (1998a) notes,
dealing with externalities in hot overflows – competing VSC, standard costing and ABC

213
calculations in this case – invites participations from more actors even non specialists.
In LT case seeking help from the researcher opened venues for new management
accounting possibilities for LT and better understanding from finance and accounting
team.
7.9 Between Literature driven and Empirical driven Theoretical
Conceptualisation – Developing answers to study research questions
The literature driven theoretical conceptualisation in figure 3.3 of chapter three
attempted to put arguments made by both academic and consultancy literature on lean
management and the developments in MAS, in context. In doing so, the
conceptualisation used Callon’s (1998b) and Latour’s (1998, 2005) four moments of
translation. Using those four moment of translation and Callon’s (1998a, 2007, 2010)
ideas on framing and overflow, this research development an empirical driven
conceptualisation presented in figure 7.2 of this chapter, based on the LT case. A
second look at the theoretical framework developed in chapter three and the
conceptualisation of interactions between actants associated with the organisation’s
MAS presented in figure 7.2 can help develop answer for this study’s research
questions.
7.9.1 On the Developments in Organisations MAS in the Context of lean
The first research question asked: How can we conceptualize the developments
in organisations’ management accounting system (MAS) in the context of lean
management?
Concerning the conceptualisation of the developments in MAS in light of the use of a
process innovation as lean management, first it can be concluded that; lean management
as a form of horizontal organizational arrangement (Kastberg, 2014) involves various
interactions and relationships that are not expected to have a stabilised or definite entity
that actants will tend to agree upon (Quattrone and Hopper, 2006). These interactions
also become less specific when they include those interactions related to the MAS used.
Hence, reframing chances are not only expected to be high in a lean environment being
a horizontal form of organisation arrangement (Chua and Mahama, 2007), but more

214
overflow and reframing efforts can also be expected in the interactions related to that
organisation’s MAS.
Unlike studies reporting on the role of innovation used in affecting MAS directly or
even indirectly through multiple contextual variables (Chenhall and Moers, 2015),
results of the case study shows that determinants of change or developments in the
organisation’s MAS were mainly the interactions between human and non-human
actants handling management accounting and control information, and how they were
able to deal with overflows experienced.
In contrast to some lean and management accounting literature (Ahlstrom and Karlsson,
1996, Van der Steen and Tillema, 2018), a positive result on the accounting
performance measurement side did not necessarily trigger adaptations or simplifications
in the organisation's MAS. Only top management support is needed for an organisation
to embark on lean management implementation and continue progressing with it. In LT
change in MAS were mainly triggered by more inclusion of the finance and accounting
actors, both human and non-human. Such inclusion, if guided by some help from
consultants or academics, can enhance accountants’ cognitive awareness of lean as a
process innovation and open venues to explore possible management accounting
practices which can be more relevant to lean organisation.
A change in cognitive awareness of some actors affects their identities and accordingly
their interactions with other actors. Such enhanced awareness and knowledge of
accountants can lead to them having more influential role not just in discussing suitable
management accounting practices, but also in enacting more lean-tailored operating
decisions. At the same time, with more knowledge of possible management accounting
practices suitable for lean, comes more overflows. The case of LT shows that not only
management accounting practices compete for existence (Mouritsen et al., 2009), but
also competition can evolve between the performative power of organisation’s
operating structure and that of the management accounting practices used. As discussed
earlier in this chapter, in LT, the organisation old value stream construction implied that
some costing practices can only be used while others are inhibited.

215
Additionally, more inclusion and a broadened cognitive knowledge of accounting
actors, both human and non-human – (for example accounting calculations) – bring
about the relational ontology of management accounting practices and controls.
The empirical conceptualisation developed using LT data also shows that, as much as a
lateral form of accountability motivating socialising relationships, is encouraged in lean
organisations, benefits of such lateral accountability can be limited by a continuous
desire to control from top managing teams especially, in multinational organisations. A
hierarchal form of accountability adopted by top managing team and local headquarters
does not only limit chances of understanding further developments with lean but, it can
also inhibit possible chances of improving organisation’s management accounting
practices. As discussed earlier, in LT, the global managing team desire to control have
limited the possibility for implementing ABC in year 2009. The case of LT also shows
that such desire to control can also be driven by political situations which together with
an organisation’s production layout can be quite performative to stabilise actors frame
of interaction around some management accounting practices, even if they are not the
most relevant ones.
One of the unique things about LT’s data and the empirical conceptualisation developed
based on it, is that the conceptualisation does not only show the misfires/overflows
affecting MAS in lean, but it also highlights the reasons for such misfires. As mentioned
earlier overflows affecting interactions on lean and MAS are caused by increased
cognitive awareness and more inclusion of accounting actors. Additionally, a change in
organisation operating structure also has its effect on the identities of interacting actors,
especially when those actors – human and non-human, accountants and operators – have
more understanding of lean management and the type of controls it may need. A change
in organisation’s operating structure coupled with better understanding of lean and
MAS, specially from accounting actors, help channel possible overflows and easily
develop common interests between various organisation actors. This was seen in how
LT channelled most of cold overflows experiences between 2012 and 2015. Finally,
spread of lean implementation to more non-operating units specially finance and
accounting ones – for example SAS centre in LT – re-shapes actors’ identities and can
be a reason to develop a new frame of interaction. Spread of lean to more finance and

216
accounting organisational units emphasizes the relational ontology of management
accounting. With more understanding of lean, controls used my management
accountants – for example OTD in LT – do not only act as indicators of what is
happening in factory shop floor but also, push accountants to relate those controls to
different behaviours adopted by other organisation actors. Creating this relation,
develops a better coordination between accountants and other organisation actors in
which managements accountants can have an active role in eliminating wasteful non-
lean behaviours.
Linking the empirical driven conceptualisation to the literature driven one in chapter
three, shows that in LT, organisation’s actors involved in lean management and MAS
were mostly working as one network. It was only when finance and accounting team
were excluded from discussions on lean implementation and construction of factory old
value stream, that Swiss managing team and operating team in Egypt formed one
network of lean proponents (Tillema and van der Steen, 2015). Yet, inclusion of finance
and accounting team in the discussion on possible costing practices for LT, gradually
developed one organisation network around lean and MAS. Also, in contrast to the
literature driven theoretical conceptualisation, competing accounting calculations were
not triggered by operating actors versus top management actors. Competing calculations
were witnessed within the same MAS network. In some incidents one calculation ruled
out another calculation and in other incidents the competition itself created a
controversial knowledge base making it difficult for actants to reach an agreement on a
course of action to be taken. As discussed earlier, tension was always between
management accounting calculation. Yet, competition also rose between operating
structures and accounting calculations. There was no case in which such competition
meant a discontinuation of lean implementation. However, in case of LT, tension
between operating structures and accounting calculations and between accounting
calculations themselves was enlightening in the sense that; it emphasised the need for
consultants, enhanced the cognitive awareness of organisation’s actors and facilitated
interaction between them.
217
7.9.2 On the Performative Role of Value Stream Costing
The second research question asked: In a specific lean management setting,
what is the performative role, if any, of VSC calculations?
Based on the actors’ assessment of the performativity of VSC and in response to the
second research question concerning the performative role of VSC; the use of VSC
either alone or with FCC in the old set up of the factory value stream in the period from
2004 till year 2011 does not yield the accurate costs that the organisation required.
Additionally, at that time the organisation’s need for an accurate product unit costs
decreased the urgency to shift to a costing tool that places less emphasis on product unit
costs or computes an average unit cost applied to most of the products. When VSC was
suggested again 2014, ABC calculations ruled out the new VSC calculations, since
ABC calculations were able to consider how resources are being used even in the newly
identified value stream. At the same time, VSC calculations still represented an average
calculation of product types sharing one value stream (MDTs and LDTs). In conclusion,
LT transformers factory could not depend on VSC to cost its products. However, one
cannot say the VSC calculations were not performative at all. In Revellino and
Mouritsen's (2015, p. 34) terminology, VSC being one of the accounting calculations
can be viewed as an engine that in this case study, had performed in some way, albeit in
an opposite direction to 'the precise prediction made by the engine, but instead by the
fate of the engine in the hands of the many, each of whom may distort it a little bit'. As
Revellino and Mouritsen put it:
Sometimes models and calculative practices may not work partly because people
are not effectively lured by them and partly because sometimes others also
produce and mobilise calculative practices that may be stronger than the one in
question; laboratories compete (Latour, 1987), just as calculations compete
(Mouritsen et al., 2009), for attention. Therefore, there can be counter
performativity or misfire (Callon, 2010). Consequently, the engine is performative
only by degrees and with caveats. (2015, p. 34).
This coincides with calculative practices being of ‘variable geometry’ nature (Latour
1991, p. 153). In case of the LT factory, it was VSC ‘fate’ with the organisation’s old

218
value stream construction pattern and the way it continues to depend on unit costs
calculations even with their level of advancement with lean management, that made
VSC counter-performative. Even with a new value stream, some traces of shared
production resources remained in place in one of the value streams, making it also
difficult for organisation’s actors to accept VSC and made ABC more appealing. VSC
was performative in a counteractive manner in 2009, when its calculations showed that
there are other possible venues for the organisation costing practices which can be more
suited to lean. More importantly, it helped to show that the old value stream
construction has problems that act against finance and accounting controllers’ desire to
account for how production resources are being used. Hence, even though VSC has not
acted in the expected direction pertained to it, it mobilised other operating opportunities
i.e. the possibility of a better construction for factory value streams and stimulated the
use of alternative management accounting practices; for example, ABC.
Hence, with respect to the second research question, one cannot conclude that VSC
calculations were not performative or did nothing just because it was not able to lure
people into taking an action to change their costing system. Calculative practices can
'...become iridescent that is, they can be either ally or antiprogram' (Grottke and
Obermaier 2016, p. 12). Even though being lured towards an opposite direction to the
one suggested by most lean accounting literature, the calculations pushed most
accounting actors in LT to re-consider the way they constructed their value stream. VSC
calculations even pushed the researcher to consider possible costing alternatives to
provide to the organisation, (such as identifying more than value stream), and triggered
the computation of the approximate cost of doing so. More importantly, if one is to say
that VSC calculations lured people into any new action, it would be that its calculations
with FCC – as much it acted against its adoption – did work to develop actors’ interests
towards other costing calculation such as ABC. VSC calculations accumulated traces
that developed a trajectory for analysing LT possible costing practices and enhancing
accountants understanding of accounting lean needs.
Unlike Maskell and Baggaley's (2004, p. 14) description of the maturity path to lean
accounting practices, in LT, advancement with lean management implementation did
not lead to a simplified accounting system or to one that is managed by simple

219
accounting practices such as VSC. Also, a move to single flow production system does
not necessary imply of a simply cost calculation such as VSC. Organisation’s operating
structures can be quite performative to stabilise interactions and interest around
alternative calculations. Yet, experimenting with VSC calculations would still be
advisable even if the tool failed to achieve its expected pragmatic effect. Based on LT
case, the semiotic effect that VSC calculations have on actors’ identities, knowledge
and understanding can be quite enlightening to build a trajectory for future lean and
management accounting changes and/or improvements.
7.9.3 Factors Affecting VSC Acceptance or Rejection
The third research question asked: In a specific lean management setting, what
factors might affect the acceptance/rejection of VSC?
One could not say that VSC represented the best practice to mediate between actors
(Vosselman, 2014), in a lean management network. Analysing the role of discounted
cashflow models in analysing investment appraisals, Warren and Seal (2018)
emphasized the role played by the presence of ‘conditions of felicity’ in supporting an
accounting calculation to perform as predicted. However, in LT’s case, conditions of
felicity were not there for VSC to provide a simple costing practice which managers can
depend on for their costing decisions. Quoting Boedker et al. (2019, p. 18); “Felicity
conditions may prompt attention to who, what and how resistance is performed”. For
LT factory managers could not use VSC calculations for decision making processes
because, first; it did not provide the detailed cost break down that the company needs. A
tool which treats all items equally may not be as effective in view of long-term
decisions (Ruiz-de-Arbulo-Lopez et al., 2013). Second; it did not meet company cost
reduction objectives. Even after year 2011, the acceptance of VSC as a costing practice
was also affected by the new constructed value stream and the use of ABC, perceived as
better costing practice to meet finance and accounting controllers need for accurate
costs.
220
Accordingly, for LT transformers factory, the set-up of its value streams either before or
after year 2011 resulting in products using resources differently, has demotivated
managers and accountants from using VSC or any other costing tool that computes costs
the same way. This was also coupled by the organisation’s continuous dependency on
product unit costs computations to evaluate its products. Additionally, the global team’s
desire for control, gave no authority for finance and accounting team to enact a new
costing practice. Finally, a broader reason for managers’ reluctance to use VSC, which
is beyond the tool's performativity, is the European headquarters prioritising a strategy
of cost reduction following the uprising political and economic conditions in Egypt in
2011, implying a strategic focus on cost reduction rather than cost accuracy.
Hence, factors affecting managers willingness to accept VSC in LT included; the
construction pattern of the factory value streams, even if they succeed to mirror the
production for one product family. Also, LT’s dependency on product unit cost even
with low levels of inventory and many enhancements on single-piece flow production.
Additionally, the findings of LT case study highlight other variables affecting VSC
acceptance, like the cost of defining new value streams and external political conditions
prioritising one costing strategy over another coupled with lack of local authority and
top management desire to control.
7.10 Chapter Summary
This chapter used Callon’s (1998a) concepts of framing and overflow to develop a
conceptualisation of the developments in MAS that is based on the longitudinal case
study findings discussed in chapter six. The chapter first started by presenting a timeline
for both progress in lean management implementation and changes in organisation’s
MAS. The timeline showed how MAS influenced and was influenced by organisation’s
progress with lean management. Callon’s (1998a, 2007, 2010) concepts of framing and
overflow were then used to develop an empirical driven theoretical conceptualisation
which explains the development in MAS in the context of lean. This conceptualisation
showed that LT’s MAS witnessed episodes of framing and overflow which has given
rise to various implications. These implications emphasized the performative role of
organisation’s operating structures and the performative role of accounting calculations
and how it highlights the relational ontology of management accounting. Discussion of
221
empirical driven theoretical conceptualisation also highlighted the relation between
horizontal organisation arrangements and managers desire to control. Finally, the
discussion explained the role played by management accountants and consultants in
MAS of lean organisations. Empirical driven theoretical conceptualisation was then
used to develop answers for this study’s research question. Discussion of answers to
study research questions was also done in relation to the literature driven theoretical
conceptualisation developed in chapter three to show how analysis of empirical data
have sometimes varied from conceptualisations available in current lean and
management accounting literature. The next chapter presents the overall conclusion of
the thesis, together with the research limitations and direction for future research.

222
Chapter 8: Conclusion
8.1 Introduction
The starting point of this research was to achieve two main objectives; (1) develop
a theoretical conceptualisation of the developments in management accounting system
(MAS) in the context of lean management and (2) to investigate the role played by VSC
as the main management accounting practice suggested for lean management
organisations. The objectives of this research are motivated by management accounting
literature calling for the development of an overall conceptualisation of MAS that is
more context driven and places more emphasis on the social aspects of accounting and
succeeds to treat it as a construction. Research objectives are also motivated by lean
management literature calling for developing in-depth empirical and theoretical
investigation of; (a) the operation of MAS in the context of lean and, (b) of the role
played by key lean accounting practices as VSC and the reasons for its acceptance or
rejection. A longitudinal case study with a timespan of twelve years was conducted on
one of the factories of a leading multinational organisation (named LT), for automation
and supplying electrical power components operating in Egypt. LT is of Swiss origin
with its main headquarters in Zurich and has other subsidiaries in Africa, Asia, Europe
and North America. The longitudinal case study on the Egyptian headquarters, covers
the period from year 2004 (the start of lean implementation) till end of year 2016. The
organisation was chosen for its suitability to meet the research objectives. LT has been
trying to grasp an understanding of how its MAS can operate with lean for most of the
twelve years of the study period. This presented a suitable environment to conduct this
research and help achieve its first research objective. LT’s multinational nature resulted
in having dynamic views from both global and local actors associated with its MAS.
Also, there has been a strong desire from some of LT’s representatives to learn about
‘lean accounting’ and VSC, which was found quite useful in meeting the second
objective of this research.
Actor-network theory (ANT) was used as the theoretical lens for this research in
order to trace the associations between both human and non-human actors (Latour,
1998; Latour, 2005) related to the case organisation MAS and its operating system
using lean. Using ANT, the developments in the organisation’s MAS were viewed as an

223
ongoing process (Modell et al., 2017) that only became understood by delving into the
dynamics of the organisation actants stories as they tell them, without having any prior
rules or theoretical understandings imposed on them (Latour, 1999). The research also
used Callon’s (2007, 2010) performatively thesis, to help understand the performative
role of VSC as intended by the second research question. Also, to help interpretive other
performative effects influencing or are influenced by the organisation’s MAS.
ANT was first used to develop a conceptualisation of the current discourse in both
consultancy and academic literature on the MAS associated with lean. More
importantly, this literature driven theoretical conceptualisation aimed to put such
discourse in context to demonstrate what messages the current literature on lean
management, MAS and lean accounting seem to suggest to its users.
On the empirical side, organisation’s key actants including human actors – (local
and global) – handling the organisation’s MAS and non-human actors – (accounting
calculations, accounting information systems, organisation structures and any other
technical or procedural arrangements) – were identified. Data collection used semi-
structured interviews, observation, documents evaluation and focus groups with the
semi-structured interviews being the primary source of data collection. Data analysis
followed a constructivist form of narrative analysis. Narrative analysis was used to
develop ‘a plot, as well as coherence’ (Myers 2013, p. 173) between the ‘spoken or
written account of connected events’ derived from organisation’s data collected to form
three main plots of ‘stories’ (Soanes and Stevenson, 2004). Three plots were
constructed by the narratives of the organisation key actors representing their unique
view of the reality of their MAS (Myers, 2013). Themes of those plots were not
predefined by the researcher in order to keep the ANT’s authenticity of letting actors
tell their own stories without imposing on them any priori definition of their world
(Latour, 1999). Plots were then interpreted and analysed using Callon’s (1986) and
Latour’s (1986, 1996) four moments of translation. Callon’s (1998a) concepts of
framing and overflow together with performativity thesis (Callon, 2007, 2010) were
then used to develop an empirical driven theoretical conceptualisation of the
organisation’s MAS in the context of lean. Various implications were driven from this

224
conceptualisation which were discussed in chapter 7 and used to develop answers for
this study’s research questions.
This chapter summarises those implications and concludes the thesis. The chapter is
divided into five sections; following this introduction section, section 8.2 discusses the
main conclusions reached from answering the study research questions. Section 8.3
discusses the research contributions. Research limitations and directions for future
research are finally presented in sections 8.4 and 8.5 respectively.
8.2 Main Conclusions associated with Study Research Questions
This section summaries the main conclusions driven from answering the three study
research questions identified in the introduction to the thesis and discussed thoroughly
in section 7.9 of chapter 7. First in terms of conceptualising the developments around
MAS in the context of lean management. The literature driven theoretical
conceptualisation developed in chapter 3, demonstrated that the current state of lean
management, MAS and lean accounting literatures seems to suggest that when it comes
to organisation’s MAS, lean organisations can have two networks of management
accounting practices and controls: an operating system’s control network and a top
management’s control network. The first network revolves around operating personnel
who have the understanding of lean i.e. the lean proponents (Tillema and van der Steen,
2015) and the accounting calculations they use. This network includes a mix of lean
tailored/ lean accounting and traditional accounting practices that match their lean
needs. The second network mainly revolves around meeting top management’s and
auditors’ financial reporting needs and would mainly include those organisational
personnel and the traditional accounting calculations they use. The conceptualisation
shows that, we need to understand the fabrics developing those networks – if they
existed. Additionally, if we are currently well aware that tensions may occur between
traditional and lean controls (Mouritsen et al., 2009; Tillema and van der Steen, 2015)
then, there is a need for empirical analyses showing the effects of those tensions, not
just on lean implementation, but also on the development in organisations’ MAS. The
literature driven theoretical conceptualisation shows that, as much as the previous
literature have contributed to our knowledge on the contingency factors supporting lean
implementation (Kennedy and Widener, 2008), ways to contain tension between
225
different controls (Tillema and van der Steen, 2015; van der Steen and Tillema, 2018),
and the effect of lean management on firms’ financial performance (Fullerton et al.,
2013), we do not know much about the actors' interactions forming the fabrics of the
MAS and how its calculations interact with each other and with other actors in a process
innovation, with a horizontal organisation arrangement, such as lean.
The use of ANT to develop the empirical driven theoretical conceptualisation in
chapter 7, unpacked new insights on the social and technical aspects of the
developments in an organisation’s MAS in the context of lean. This conceptualisation
showed that, lean management as a form of horizontal organizational arrangement
involves various interactions and relationships that are not expected to have a stabilised
or definite entity, which the organisation’s actors would agree upon. Those lean
interactions become less specific and more complex when they include other
interactions associated with the organisation’s MAS. In the case organisation, MAS
experienced several episodes of framing and overflow. Unlike previous research
reporting on the role of technological innovations – such as lean – in affecting
organisations MAS’s through multiple contextual variables (Chenhall and Moers,
2015), results of the case study show that determinants of developments in the
organisation’s MAS were mainly the interactions between human and non-human
actants associated with both the operating and MA system used. The findings of the
case study showed that, a lean organisation’s MAS will not succeed in supporting the
ontology of lean unless various organisation human actors have a common
understanding of the objectives and strategies for the use of the organisation’s
management accounting practices. Different perceptions between human actors
associated with lean implementation and the organisation’s MAS will always create
overflows, whose degree of divergence will determine whether the lean organisation
succeeds or fails to channel them. Also, the adoption of lean tailored practices or those
mobilised by a lean accounting system such as VSC do not only require an
understanding of the nature of the MAS that suits lean, but also prominently requires the
exertion of effort from operating actors with respect to the pattern in which they define
the organisation value streams, even if each defined value stream serves one product
family. In a horizontal form of organisation arrangement as the one in a lean
organisation, more interactions are expected to develop including human and non-

226
human actors associated with the organisation value streams and MAS. In these
interactions not only calculations will compete for existence, but also competition
between management accounting calculations and operating structures will affect the
number and degree of divergence in the MAS overflows. Finally, the more is the spread
of lean management as a philosophy among various organisation departments, the more
influential is the role of organisation’s management accountants and the more is their
responsibility towards adopting management accounting practices that meet their lean
needs.
According to the case study conducted, VSC was performative even though it acted
as an engine that had performed in an opposite direction to the predictions made for it.
Instead, the tool’s role was mobilised by the factory layout and intentions of the
organisation actors; both locally and globally, which may have distorted the
expectations (Revellino and Mouritsen, 2015) from VSC implementation. However, in
the case organisation, VSC was still performative in a counteractive manner, first when
its calculations pushed organisation’s actors to re-think the way they identified their
value stream and a second time when the calculation was able to mobilise other costing
calculations such as activity-based costing (ABC). As per the results of the case study
conducted, VSC can be viewed as a calculating practice that does support lean as a
philosophy. However, it would always be a question as to whether the conditions of
‘felicity’ (Callon, 2007, Warren and Seal, 2018) are available for it to be accepted for
implementation. Committing to a lean accounting tool as VSC may be difficult in the
context of headquarter pressures and political unrest. Additionally, prior to a move to
VSC implementation, considerations should be given to reviewing the reasons why lean
organisations use product unit cost. Successful implementation of VSC requires
organisations to become ready to manage mainly by total costs or to depend on an
average calculation of product costs. Finally, the use of VSC requires companies to
revise their value stream identification even if such identification include products that
do form one product family.

227
8.3 Contributions
Being of interdisciplinary nature between management accounting and operations
management and using ANT and Callon’s (2007, 2010) performativity thesis, this study
contributes to lean management, management accounting and ANT literature in number
of ways. First; the research contributes to ANT literature through combining both the
sociology of translation from ANT and Callon’s performativity thesis in one study. This
study is one of the very few – if not the first – to use Latour’s (1981) four moments of
translations together with Callon’s concepts of framing and overflow and ideas on
performation. Combining these concepts have enabled this research to move beyond the
idea of how reality is constructed, i.e. ANT’s 'background/ foreground reversal’
(Latour, 1996, p. 370) and idea of 'the order out of disorder' (Latour 1996, p. 370), to
understanding the trails forming this reality fabrications i.e. applying Latour’s (2005,
p.165) approach to ‘slowciology’. By doing so, the research also successfully avoided
critiques to the use of ANT’s four moments of translation in a positivistic and/ or
mechanical way (Whittle and Spicer, 2008). Also, as discussed in section 3.7 of chapter
3, the research adopted a constructivism ontological stance instead of a ‘social’
constructivism one. Using a constructivism ontological stance, actors are believed to
possess the knowledge of what they do, in addition to how and why they do it (Latour,
1999; 2005). Such use of ANT reinforces the theory’s embracement of the mix of
relationist, realist and constructivist ontologies and helps avoid critique to ANT’s
ontology being perceived as that of “naïve realism” (Elder-Vass, 2008; Yang and
Modell, 2015; Modell et al., 2017).
Using the four moments of translations to discuss and analyse the three plots in LT
organisation was useful in demonstrating how LT’s reality in terms of lean management
operation and its MAS is constructed over the study period. Yet, interpreting those
construction plots using concepts of framing and overflow and Callon’s performativity
thesis has allowed for a ‘go slow’, ‘don’t jump’ ontology (Latour, 2005, p. 190) in
understanding the details of incidents, tensions, matters of concerns and stabilisation
efforts forming this construction. It is expected that more research combining those
concepts can help provide a better understanding of the making up of process
innovations, MAS and related actors’ interactions. Second; this research contributes to
ANT and performativity thesis by developing reader’s understanding of the

228
performative role played by consultants/ academics. A recent, study by Themsen and
Skærbæk (2018) uses ANT to demonstrate the power of consultants in containing hot
overflows experienced in risk construction. This research contributes to this stream of
literature by developing our understanding of the role of consultants/ academics in
enhancing cognitive awareness of various actors in lean organisations.
Third, the research contributes to both lean management and management accounting
literatures, through developing a literature driven theoretical conceptualisation which
accounts for how different actors from both lean management and management
accounting literatures have constructed the current view which readers have on the
relation between both systems. Previous literature has mainly focused on one or two
aspects of the relationship between lean management and MAS, – [(for example;
containment of tension among different controls (Tillema and van der Steen, 2015),
contingent operating and accounting factors to lean implementation (Kenney and
Widener, 2008), effect of lean implementation on firm performance (Fullerton et ,
2014)] – without providing a conceptualisation of the current understanding of the link
between lean and MAS. Reflections on this literature driven conceptualisation and
revisiting it several times in the future, can give directions to future researchers on what
needs to be investigated in relation to lean as a process innovation and management
accounting practices and controls. Additionally, the empirical driven theoretical
conceptualisation in chapter 7 is the first to theoretically conceptualise the
developments in MAS in the context of lean. Further investigation of other case studies
and using different theoretical lenses can also contribute to our understanding of
changes in MAS in a process innovation such as lean.
Fourth, specific to lean management literature, findings of this study contribute to
this literature in showing the performative role of operating structures. The use of ANT
enabled the treatment of structures as actants whose agency is constructed. This helped
in understanding the role played by different LT’s operating structures moving from its
old value stream construction from 2004 to 2011 to the newly constructed value streams
in 2012. Findings of this study also contribute to both academic and consultancy
literature on lean management, through providing one of the first detailed empirical
analysis of the use of value-stream costing (VSC). Findings also contribute to this

229
literature via exploring the factors affecting VSC implementation. Previous consultancy
literature has only provided guidance on the path to using VSC and some conditions for
its implementation (see Maskell and Baggaley, 2004). Academic literature has mainly
suggested VSC as a more lean-tailored accounting practice (see Kennedy and Widener,
2008 and Fullerton et al., 2013), yet there are no empirical analysis of the actual factors
affecting its acceptance or rejection.
In terms of management accounting literature, findings of this study contribute to the
literature on management accounting and innovation through explaining the relational
ontology of management accounting calculations. While Miller and Power (2013)
discuss the mediating role of accounting and how its practices come with different
ontologies, this study contributes to the emerging literature exploring the relational
ontology of management accounting (Vosselman, 2014). Findings of this study, showed
that in a process innovation such as lean management, management accounting
calculations can create new understandings and roles for management accountants that
not only influence the accounting system in place, but also extends to affect relations
and behaviours in the organisation’s operating shop floor.
Findings of this study also contributes to practitioners in many ways. First, the
empirical driven theoretical conceptualisation provides practitioners with real life data
on the actual developments experienced in an organisation’s MAS using lean
management. This data is essential in developing practitioners’ understanding of the
role played by management accounting calculations, consultants, management
accountants and organisation’s operating structures. In addition to, the different forms
of controls used locally and globally and their effects on both lean management and the
MAS in place. Second, with the low implementation rates of VSC that is mainly
attributed to lack of knowledge of the practice and lack of implementation know how
(Rao and Bargerstock, 2013), this study provides first-hand detailed empirical data on
the use of VSC for costing purposes. This provides practitioners with a rich
understanding of the mechanics of using this practice, together with the factors affecting
managers willingness to implement it. In addition to the available ‘lean accounting’
literature, which is mainly driven by consultancy literature, practitioners can make
fruitful use of the findings of this study to benchmark the appropriate management

230
accounting practices for their operating structures and interpret the different interactions
affecting their actors, together with their MAS-lean network. Finally, the literature
driven theoretical conceptualisation developed in chapter 3, provides practitioners with
a thorough analysis of the contributions of both academic and consultancy literature to
our understanding of MAS in the context of lean. This understanding is crucial for
organisations implementing lean and those experiencing problems with their MAS, also
to help practitioners provide more real-life examples on how to move forward with this
understanding.
8.4 Research Limitations
This section discusses the limitations associated with the research conducted in this
study. First, as is the case with most qualitative research using a case study method, the
generalization of the research findings should be taken in consideration given that they
were driven from a case study of one factory of the multinational organisation studied.
A second empirical limitation relates to the difficulty in getting access to conduct
interviews with the case organisation’s global managing team in Zurich. It should be
noted that most of the data relating to the global managing team views and perceptions
about their MAS, were driven from the review done on the organisation global policy
and guidelines documents and the PowerPoint presentations of its accounting and
operating training sessions conducted quarterly in the Swiss headquarters. Additional
data were also obtained from the semi-structured interviews conducted with top
management organisation actors (for example, factory head, head of centre for shared
accounting services (SAS) and chief finance and accounting controller) on basis of their
monthly meetings with the global managing team.
Also, as mentioned in chapter 4 section 4.7, the three plots discussed in this research
were mainly driven from actors’ own stories, as they tell them. Working with no
predefined themes was needed to keep the authenticity of ANT, where data is analysed
without imposing on actors ‘a priori definition of their world-building capacities’
(Latour 1999, p. 20). For this research actors’ data told stories that shaped three plots
on; “who drives changes in factory performance measures”, “debates on factory costing
practices” and “the tension between accounting controllers and factory engineers”.
Different case studies adopting ANT as a theoretical lens can produce different stories
231
and tailor new plots, which are worth exploring in future research. Additionally, action
research as a research method is deemed not suitable to the current theoretical
underpinning of this research. However, future research adopting an action research
approach to explore the role played by VSC, can arrive at different outcomes.
The last two limitations for this research relate to the second research aim to
investigate the role played by VSC in the case organisation and its respective research
questions (i.e. RQ2 and RQ3). Even though the VSC calculations proposed to the
organisation in 2009 and later in 2014, provided rich details that were enough to
develop answers for the second and third research questions, the organisation’s failure
to implement VSC places some limitation on the findings achieved. Different
conclusions might have been achieved in terms of the performative role of VSC and the
factors affecting its acceptance or rejection in case the lean organisation has succeeded
to adopt VSC. However, finding an organisation that understands VSC or have adopted
it was a very difficult target to meet at the time of conducting this research. Finally, the
analysis of the propositions to use VSC were done with the objective of using the tool
only for costing purposes. This was viewed as being suitable for the case organisation
given its previous struggles to cost its products in light of the construction pattern of its
value stream/s. Hence, the conclusions made with respect to the second research aim
and its associated research questions are limited to the use of VSC as a costing tool. The
use of VSC for decision making or profitability analysis was deemed beyond the scope
of this research.
8.5 Directions for Future Research
The findings of this research highlight various possible venues for future research in
both management accounting and lean management research areas. The theoretical
conceptualisation developed in figure (7.2) of chapter seven using ANT and a case
study method has generated in-depth empirical data and unpacked new insights on the
social and technical aspects of the developments in an organisation’s MAS in the
context of lean. From a lean specific perspective, more case study research is required at
the intersection between both research areas (MAS and lean management) to help
expand academics’ and practitioners’ understanding of the operation and development
in the MAS’s of lean firms. From a management accounting research perspective,
232
similar context specific conceptualisations - preferably of qualitative nature - are also
called for to provide more realistic view (Vosselman, 2014; Modell et al., 2017) of the
MAS developments in other process innovation contexts. If this type of research is to
use ANT, it is suggested that obtaining more data from various organisation actors –
representing different organisational units, both locally and globally if applicable – will
provide more real stories of how actors view their MAS and enrich the research
contribution.
Unlike the majority of lean literature promoting abandoning accounting practices
(Johnson, 2006) or using new lean ‘tailored’ accounting practices (Kennedy and
Widener, 2008; Fullerton et al., 2013; Fullerton et al., 2014), this study findings showed
that lean ‘tailored’ KPIs were used with traditional accounting performance measures.
Additionally, all costing practises adopted by the case study organisation were
traditional accounting ones. Hence, more understanding is needed on the nature of the
MAS’s practices that are actually being used by lean firms. Moreover, more empirical
analysis is required on why lean firms still depend on individual product costs, together
with whether this is related to the pattern in which those firms define their value
streams. It would also be beneficial if future case studies can explore the way
organisations define their value streams and analyse whether this continue to have
implications on the accounting practices used or not. Finally, from a lean accounting
perspective, the literature on lean accounting is still evolving and future research in this
research strand needs to seek consensus or develop a certain codification of what
management accounting practices are to be included in a lean accounting ‘system’. Also
given the findings of this research, the conditions for VSC implementation as suggested
in some consultancy literature (Baggaley and Maskell, 2003a; 2003b; Maskell and
Baggaley, 2004) may need to be revised. Additionally, future research shall also revise
some of the claims problematising traditional accounting system to work with lean.

233
Appendix A: List of Data Collection Activities
1: List of Interviews
Date Organisation Actor/Actors Location Duration 13-09-2014 Factory operation manager Factory 1 hour 23-09-2014 Factory lead engineers (3
engineers) Factory 2 hours and 15
minutes (approx. 45 each)
18-12-2014 Factory head and Chief accounting controller
Head office 3 Hours
30-07-2016 Factory head Factory 2 hours 31-07-2016 Head of SAS Head office 45 minutes 04-08-2016 Chief accounting controller Head office 1.5 hours 08-08-2016 1st LBU finance and accounting
controller Head office 1 hour
11-08-2016 Head of Shared Accounting Services (SAS)
Head office 2 hours
19-09-2016 Factory operation manager Factory 1 hour 20-09-2016 Factory head Head office 1 hour 29-09-2016 Engineering and operations
advisor Head office 1 hour 40 minutes
05-10-2016 2nd LBU finance and accounting controller
Head office 1 hour 30 minutes
11-10-2016 2nd LBU finance and accounting controller
Head office 1 hour 40 minutes
19-10-2016 Factory lead engineers (3 engineers)
Factory 1 hour and 30 minutes (30 minutes
per interview) 25-10-2016 Factory controlling SAP
consultant Head office 1 hour
26-10-2016 Factory Quality and OPEX manager
Factory 1 hour
05-01-2017 Representatives from SAS centre (5 members of the SAS
centre)
Head office 3 hours (average of half an hour per
employee) 15-01-2017
Representatives from factory
line workers (3 workers) Factory 2 hours 15
minutes (average of 45 minutes line worker)
15-01-2017 Factory operation manager Factory 1 hour 15-01-2017 Supply chain manager Factory 45 minutes 06-02-2017 Factory sales manager Head office 45 minutes Total interview hours 33 hours and 15
minutes

234
2: List of Observations
Date Nature of factory visit Duration 11-03-2015 Investigating layout and operation of factory value
stream 2 hours
07-09-2016 Factory tour and introductory presentation of factory new value streams lead by factory operation manager
3 hours
19-10-2016 Exploring the operation of new factory value streams versus the old one – factory visit lead by factory lead
engineers
2 hours
Total hours 7 hours
3: List of Focus Groups
Date Actors Involved Location Duration 25-02-201516 - Factory head
- Factory operation manager - Two factory lead engineers - Chief finance and accounting
controller - Researcher (Sarah Mohamed)
Head office
2 hours
31-01-2017 - Head of Centre for Shared Accounting Services (SAS)
- The 2 Local Business Unit (LBU) finance and accounting controller
- Organisation’s engineering and operations advisor
- Researcher (Sarah Mohamed)
Head office
1 hour and 30 minutes
16 Following this focus group, the researcher lead a presentation session on the 18th of April, 2015 at the organisation head office which involved factory Head, factory operation manager, two factory lead engineers, the chief finance and accounting controller and one of local business unit (LBU) finance and accounting controllers. The presentation explained the possible costing practices available for the organisation given its old value stream. The presentation included the VSC calculations alone and with features and characteristics costing together with the activity-based costing framework which were discussed in detail in chapter five. The session took two hours; 45 minutes for the presentation and one hour and fifteen minutes for discussion and feedback.

235
15-02-201717 - Head of Centre for Shared Accounting Services (SAS)
- Local Business Unit (LBU) finance and accounting controller
- Factory head - factory Co (controlling) SAP
consultant - Researcher (Sarah Mohamed)
Head office
2 hours
Total hours 5 hours and 30 minutes
17 Following this focus group, the researcher lead a presentation session on the 20th of February 2017, at the organisation head office which involved the factory head, Head of Centre for Shared Accounting Services (SAS), Five representative from the SAS employees, Chief finance and accounting controller, the two local business unit (LBU) finance and accounting controllers, in order to communicate and validate the full study findings. The session took one hour and thirty minutes; thirty minutes devoted to the research presentation and an hour for the receipt and discussion of audience feedback.

236
Appendix B: List of Data Collection Activities in Years 2009 and 2010 providing the Background for Case Study
1: List of Interviews
Date Organisation Actor/Actors Location Duration 15-01-2009 Factory head and Chief finance
and accounting controller Head office
in Cairo 1 hour
23-01-2009 Chief finance and accounting controller
Head office 2 hours
08-02-2009 Factory head Head office 1 hour 24-02-2009 Factory operation manager Factory -
outside Cairo
45 minutes
02-03-2009 1st LBU finance and accounting controller
Head office 1.5 hours
02-03-2009 2nd LBU finance and accounting controller
Head office 1.5 hours
12-03-2010 Chief accounting controller Head office 1 hours Total interview hours 8 hours and 45
minutes
2: List of Observations
Date Nature of factory visit Duration 28-11-2009 Production tour in factory shop floor 1.5 hours
237
References Abernathy, W. J. and Utterback, J. M. (1978). Patterns of industrial innovation.
Technology Review, 80 (7), pp. 40-47.
Ahlstrom, P., and Karlsson, C. (1996). Change processes towards lean production: The
role of the management accounting system. International Journal of Operations &
Production Management, 16 (1), pp. 42-56.
Ahlstrom, P. (2004). Lean service operations: translating Lean production principles to
service operations. International Journal of Services Technology and
Management, 5 (5/6), pp. 545-564.
Ahrens, T. and Chapman, C.S. (2004). Accounting for Flexibility and Efficiency: A
Field Study of Management Control Systems in a Restaurant Chain.
Contemporary Accounting Research, 21 (2), pp. 271-301.
Ahrens, T. and Dent, J. F. (1998). Accounting and organizations: realizing the richness
of field research. Journal of Management Accounting Research, 10, pp. 1-40.
Alcouffe, S., Berland, N. and Levant, Y. (2008). Actor-networks and the diffusion of
management innovations: A comparative study. Management Accounting
Research, Vol. 19, pp. 1-17.
Alves, A. C., Dinis-Carvalho, J. and Sousa, R. M. (2012). Lean production as promoter
of thinkers to achieve companies' agility. The Learning Organization, 19 (3), pp.
219-223.
Alvesson, M. (2003). Beyond neopositivists, romantics, and localists: a reflexive
approach to interviews in organizational research. The Academy of Management
Review, 28 (1), pp. 13-33.
Amabile, T. M., Conti, R., Coon, H., Lazenby, J. and Herron, M. (1996). Assessing the
work environment for creativity. Academy of Management Journal, 39 (5), pp.
1154-1184.
Anderson, S. W. (2006). Managing costs and cost structure throughout the value chain:
research on strategic cost management. Handbooks of Management Accounting
Research, Vol. 2, pp. 481-506.
Andretta, M. (2014). Some considerations on the definition of risk based on concepts of
systems theory and probability. Risk Analysis, 34 (7), pp. 1184-1195.
Anthony, R. N., (1965). Planning and control systems: framework for analysis. Boston,
MA: Graduate School of business Administration, Harvard University.

238
Ashby, W. R. (1956). An Introduction to Cybernetics. New York: J. Willey.
Austin, J. L. (1962). How to Do Things with Words. Clarendon Press, Oxford, UK.
Baggaley, B. (2006). Using strategic performance measurements to accelerate lean
performance. Journal of Cost Management, 20 (1), pp. 36-44.
Baggaley, B., and Maskell, B. (2003a). Value stream management for lean companies,
part I. Journal of Cost Management, 17 (2), pp. 23-27.
Baggaley, B., and Maskell, B. (2003b). Value stream management for lean companies,
part II. Journal of Cost Management, 17 (3), pp. 24-30.
Bamford, A. and Mackenzie, D. A. (2018). Counter performativity. New Left
Review, 113 (sept/oct), pp. 97-121.
Bantel, K. A. and Jackson, S. E. (1989). Top management and innovations in banking:
Does the composition of the top team make a difference?. Strategic management
journal, 10 (S1), pp. 107-124.
Barroso, I. P. M., Santos, S. M. F. and Carravilla, M. A. (2010). Beyond classroom
boundaries: How higher education institutions apply lean. 1st Brazilian
Symposium on Services Science, pp. 1-11.
Batac, J. and Carassus, D. (2009). Interactions between control and organizational
learning in the case of a municipality: A comparative study with Kloot (1997).
Management Accounting Research, 20 (2), pp. 102-116.
Bateman, N., Hines, P. and Davidson, P. (2014). Wider applications for Lean.
International Journal of Productivity and Performance Management, 63 (5), pp.
550-568.
Beer, S. (1959). Cybernetics and Management. New York: Willey.
Berliner, C. and Brimson, J.A. (1998). Cost management for today's advanced
manufacturing: The CAM-I conceptual design. Harvard Business School
Press, Boston
Bhamu, J. and Sangwan, K.S., (2014). Lean manufacturing: literature review and
research Issues. International Journal of Operations & Production Management,
34 (7), pp. 876-940.
Bhasin, S. and Burcher, P. (2006). Lean viewed as a philosophy. Journal of
Manufacturing Technology Management, 17 (1), pp. 56 – 72.
Bhasin, S. (2012). An appropriate change strategy for lean success. Management
Decision, 50 (3), pp. 439-458.

239
Bicheno, J. (2004). The New Lean Toolbox. ISBN: 978-0954124410, PICSIE
Books, Buckingham.
Bicheno, J. and Holweg, M. (2016). The Lean Toolbox: A Handbook for Lean
Transformation, 5th edition. ISBN: 9780956830753, PICSIE Books, Buckingham.
Birkinshaw, J., Hamel, G. and Mol, M. J. (2008). Management innovation. Academy of
management Review, 33 (4), pp. 825-845.
Birnberg, J. G. (1998). Control in interfirm co-operation relationships. Journal of
Management Studies, 35, pp. 421-428.
Bisbe, J., Bastita-Foguet, J. M. and Chenhall, R.H. (2007). Defining management
accounting constructs: a methodological note on the risks of conceptual
misspecification. Accounting, Organizations and Society, Vol. 32, pp. 789–820.
Bisbe, J. and Otley, D., (2004). The effects of the interactive use of management control
systems on product innovation. Accounting Organizations and Society, 29 (8), pp.
709-737.
Boedker, C., Chong, K. M. and Mouritsen, J. (2019). The counter-performativity of
calculative practices: Mobilising rankings of intellectual capital. Critical
Perspectives on Accounting, (in press), p. 102100.
Boer, H. and During, W. E. (2001). Innovation, what innovation? A comparison
between product, process and organizational innovation. International Journal of
Technology Management, 22 (1-3), pp. 83-107.
Bortolotti, T. and Romano, P. (2012). Lean first, then automate: a framework for
process improvement in pure service companies. A case study. Production
Planning and Control: The Management of Operations, 23 (7), pp. 513-522.
Bourdieu, P. (1998). Practical reason. Polity Press, Cambridge, UK.
Bowen, D. E. and Youngdahl, W. E. (1998). Lean service: in defense of a production-
line approach. International Journal of Service Industry Management, 9 (3) pp.
207 – 225.
Briers, M., & Chua, W.F. (2001). The role of actor-networks and boundary objects in
management accounting change: A field study of an implementation of activity-
based costing. Accounting, Organizations and Society, Vol. 26, pp. 237-269.
Brisset, N. (2016). Economics is not always performative: some limits for
performativity. Journal of Economic Methodology, 23 (2), pp. 160-184.
240
Brosnahan, J. B. (2008). Unleash the power of lean accounting. Journal of
Accountancy, July. Retrieved on 5th November, 2017 from
http://www.journalofaccountancy.com/Issues/2008/Jul/UnleashthePowerofLeanA
ccounting.html
Bryman, A. (1998). Quantitative and Qualitative Research Strategies in Knowing the
Social World. In: May, T., and Williams, M (Ed.), Knowing the Social world.
Buckingham and Philadelphia: Open University Press.
Bryman, A. (2004). Social Research Methods, 2nd edition. Oxford: Oxford university
press.
Bryman, A. and Bell, E. (2007). Business Research Methods. USA: Oxford University
Press.
Burgess, N. and Radnor, Z. (2013). Evaluating Lean in healthcare. International
Journal of Health Care Quality Assurance, 26 (3), pp. 220-235.
Busco, C. and Quattrone, P. (2018). In search of the “Perfect One”: How accounting as
a maieutic machine sustains inventions through generative “in-tensions”.
Management Accounting Research, Vol. 39, pp. 1-16.
Butler, J. (2010). Performative agency. Journal of Cultural Economy, Vol. 3, pp. 147-
161.
Caliskan, K. and Callon, M. (2010). Economization, part 2: a research programme for
the study of markets. Economy and Society, Vol. 39, pp. 1-32.
Callon, M. (1986). Some elements of sociology of translation: Domestication of the
scallops and the fishermen on St. Brieuc Bay. In: J. Law (Ed.), Power, action and
belief. A new sociology of knowledge? (pp. 196-233). London: Routledge and
Kegan Paul.
Callon, M. (1991). Techno-economic networks and irreversibility. In: J. Law, A
Sociology of Monsters: essays on power, technology, and domination. London:
Routledge, pp. 132-161.
Callon, M. (1998a). An essay on framing and overflowing: economic externalities
revisited by sociology. In: M. Callon, The Laws of the markets. Oxford: Blackwell
Publishers, pp. 244-269.
Callon, M., (1998b). The embeddedness of economic markets in economics. In: Callon,
M. (Ed.), The Laws of the Markets. Blackwell Publishers/The Sociological
Review, Oxford, pp. 1–57.

241
Callon, M. (1999). Actor-network theory—the market test. The Sociological Review, 47
(1_suppl), 181-195.
Callon, M. (2005). Why virtualism paves the way to political impotence: A reply to
Daniel Miller's critique of the laws of the markets. Economic Sociology: European
Electronic Newsletter, Vol. 6, pp. 3-20.
Callon, M. (2007). What does it mean to say that economics is performative?. In: D.A.
MacKenzie, F. Muniesa and L. Siu, Do economists make markets? On the
performativity of economics. Princeton: Princeton University Press, pp. 311-357.
Callon, M., (2010). Performativity, misfires and politics. Journal of Cultural Economy,
3 (July 2nd), pp. 163–169.
Callon, M., and Latour, B. (1981). Unscrewing the Big Leviathan: How Actors
Macro‐Structure Reality and How Sociologists Help Them to Do So. In: K.
Knorr‐Cetina and A. Cicourel (eds), Advances in Social Theory and Methodology.
Routledge & Keegan Paul.
Callon, M., Courtial, J.P., Turner, W.A. and Bauin, S. (1983). From translations to
problematic networks: an introduction to co-word analysis. Social Science
Information, Vol. 22, pp. 191-235.
Carnes, K., and Hedin, S. (2005). Accounting for lean manufacturing: another missed
opportunity?. Management Accounting Quarterly, Fall, 7 (1), pp. 28-35.
Cavana, R.Y., Delahaye, B. L. and Sekaran, U. (2001). Applied business research:
Qualitative and quantitative methods. Wiley and Sons.
Champion, D. and Stowell, F. A. (2003). Validating action research field studies:
PEArL. Systemic Practice and Action Research, 16 (1), pp. 21-36.
Chapman, C. S. (1997). Reflections on a contingent view of accounting. Accounting,
Organizations and Society, 22 (2), pp. 189-205.
Chenhall, R. H. (2003). Management control systems design within its organizational
context: findings from contingency-based research and directions for the future.
Accounting, Organizations and Society, 28 (2-3), pp. 127-168.
Chenhall, R. H. (2008). Accounting for the horizontal organization: A review essay.
Accounting, Organizations and Society, 33 (4-5), pp. 517-550.
Chenhall, R. H. and Chapman, C.S. (2006). Theorising and testing in contingency
research on management control systems. In: Z. Hoque (Ed.), Methodological
Issues in Accounting Research. Spiramus, London, pp. 35-54.

242
Chenhall, R. H., Kallunki, J.P. and Silvola, H. (2011). Exploring the relationships
between strategy, innovation, and management control systems: The roles of
social networking, organic innovative culture, and formal controls. Journal of
Management Accounting Research, 23 (1), pp. 99–128.
Chenhall, R. H. and Moers, F. (2015). The role of innovation in the evolution of
management accounting and its integration into management control. Accounting,
Organizations and Society, Vol. 47, pp. 1-13.
Chiesa, V., Frattini, F., Lazzarotti, V. and Manzini, R. (2009). Performance
measurement of research and development activities. European Journal of
Innovation Management, 12 (1), pp. 25-61.
Chiarini, A. (2012). Lean production: mistakes and limitations of accounting systems
inside the SME sector. Journal of Manufacturing Technology Management, 25
(5), pp. 681-700.
Chopra, A. (2013). Lean accounting - an emerging concept. International Journal of
Marketing, Financial Services and Management Research, 2 (8), pp. 79-84.
Chua, W.F. (1995). Experts, networks and inscriptions in the fabrication of accounting
images: A story of the representation of three public hospitals. Accounting,
Organizations and Society, 20 (2-3), pp. 111–145.
Chua, W.F and Mahama, H. (2007). The Effect of Network Ties on Accounting
Controls in a Supply Alliance: Field Study Evidence. Contemporary Accounting
Research, Vol. 24, pp. 47-86.
Collis, J. and Hussey, R. (2009). Business Research: A Practical Guide for
Undergraduates and Postgraduate Students, 3rd edition. Basingstoke: Palgrave
Macmillan.
Comm, C. L. and Mathaisel, D.F.X. (2000). A paradigm for benchmarking lean
initiatives for quality improvement. Benchmarking: An International Journal, 7
(2), pp. 118 – 128.
Cooper, J. J. (2009). The integration of lean manufacturing competency-based training
course into university curriculum. Online Journal of Workforce Education and
Development, 4 (1), pp. 1-12.
Cooper, R. (1996). Lean Enterprises and the Confrontation Strategy. The Academy of
Management Executive, 10 (3), pp. 28-39.
243
Corbett, S. (2007). Beyond manufacturing: the evolution of lean production. The
McKinsey Quarterly, August, No. 3, pp. 1-2.
Coupland, C. (2007). Identities and interviews. In: Pullen, A., Beech, N. and Sims, D.
(eds) Exploring Identity: Concepts and Methods. Basingstoke: Palgrave
Macmillan, pp. 274-287.
Crandall, R. E., and Main. K. (2007). Lean Accounting – Fad or Fashion?. Working
paper series of College of Business, Appalachian State University, Boone, NC.
Creswell, J. (2003). Research Design Qualitative, Quantitative, and Mixed Methods
Approaches. Thousand Oaks, CA: Sage
Creswell, J. W. (2007). Qualitative inquiry & research design: Choosing among five
approaches. California: Sage Publications.
Creswell, J. W. and Clark, V. L. P. (2011). Designing and Conducting Mixed Methods
Research, 2nd edition, California: Sage Publications.
Crotty, M. (1998). The foundations of social research: meaning and perspective in the
research process. London: Sage.
Crotty, M. (2003). The foundations of social research: meaning and perspective in the
research process, 2nd edition. London: Sage.
Daft, R. L. (1978). A dual-core model of organizational innovation. Academy of
Management Journal, 21 (2), pp. 193-210.
Dahlgaard, J. J. and Dahlgaard-Park, S. M. (2006). Lean production, six sigma quality,
TQM and company culture. The TQM Magazine, 18 (3), pp. 263-281.
Damanpour, F. and Evan, W. M. (1984). Organizational innovation and performance:
the problem of organizational lag. Administrative Science Quarterly, pp. 392-409.
Damanpour, F. and Gopalakrishnan, S. (2001). The dynamics of the adoption of product
and process innovations in organizations. Journal of Management Studies, 38 (1),
pp. 45-65.
Damanpour, F., Walker, R. M. and Avellaneda, C. N. (2009). Combinative effects of
innovation types and organizational performance: A longitudinal study of service
organizations. Journal of Management Studies, 46 (4), pp. 650-675.
Dambrin, C. and Robson, K. (2011). Tracing performance in the pharmaceutical
industry: Ambivalence, opacity and the performativity of flawed measures.
Accounting, Organizations and Society, 36 (7), pp. 428-455.

244
Darlington, J. (2013). Big Picture Financial Mapping using T, I, and OE. Proceedings
of: The 4th International Theory of Constraints Practitioners Alliance (TOCPA)
Conference, Tallinn (Estonia), 9-10 February.
Darlington, J., Francis, M., Found, P. and Thomas, A. (2016). Targeting lean process
improvement projects for maximum financial impact. Production Planning and
Control, 27 (2), pp.114-132.
Das, T. and Teng, B.S. (1998). Between trust and control: developing confidence in
partner cooperation in alliances. Academy of Management Review, 23 (3), pp. 491-
512.
Davila, A. (2009). Performance measurement and management control Systems:
Current research and ideas going forward. In: Epstein M. J., Manzoni, J. (eds)
Performance Measurement and Management Control: Measuring and Rewarding
Performance, Studies in Managerial and Financial Accounting, (18), pp.43-69.
Davila, T. and Wouters, M. (2006). Management accounting in the manufacturing
sector: Managing costs at the design and production stages. Handbooks of
Management Accounting Research, Vol. 2, pp. 831-858.
Debusk, G. K., and Debusk. C (2012). The Case for Management Accounting: Part II-
Value Stream Costing. Cost Management, 26 (4), pp. 22-30.
Delanty, G. (2005). Social science: philosophical and methodological foundations.
Open University Press.
Delgado, C., Ferreira, M. and Branco, M. C. (2010). The implementation of lean six
sigma in financial services organizations. Journal of Manufacturing Technology
Management, 21 (4), pp. 512-523.
De Treville, S. and Antonakis, J. (2006). Could lean production job design be
intrinsically motivating? Contextual, configurational, and levels-of-analysis
issues. Journal of Operations Management, 24 (2), pp. 99-123.
Detty, R.B. and Yingling, J.C. (2000). Quantifying benefits of conversion to lean
manufacturing with discrete event simulation: a case study. International Journal
of Production Research, 38 (2), pp. 429-225.
Dewey, J. (2011), ‘How we think’. Retrieved on 26th May 2016. Available at:
http://www.gutenberg.org/files/37423/37423-h/37423-h.htm#CHAPTER_SEVEN

245
Ditillo, A. (2004). Dealing with uncertainty in knowledge-intensive firms: the role of
management control systems as knowledge integration mechanisms. Accounting,
Organizations and Society, 29 (3-4), pp. 401-421.
Donaldson, L. (2001). The contingency theory of organizations. Sage Publications.
Easterby-Smith, M., Thorpe, R. and Lowe, A. (2002). Management Research: An
Introduction. Sage Publications.
Eaton, M. and Carpenter, K. (2000). 5S for everyone. Control, October, pp. 17-19.
Edquist, C., Hommen, L. and McKelvey, M. D. (2001). Innovation and employment:
Process versus product innovation. Edward Elgar Publishing.
Elder-Vass, D. (2008). Searching for realism, structure and agency in actor network
theory. British Journal of Sociology, 59 (3), pp. 455-473.
Emmanuel, C., Otley, D. and Merchant, K. (2004). Accounting for Management
Control, 2nd edition. TJ International, Padstow, Cornwall, UK.
Emiliani, M. L., and Stec, D. J. (2005), ‘Leaders lost in transformation. Leadership &
Organization Development Journal. 26 (5), pp. 370-387.
Ezzamel, M. (1994). Organizational change and accounting: understanding the budget
system in its organizational context. Organization Studies, 15 (2), pp. 213–240.
Ferreira, L. D. and Merchant, K. A. (1992). Field research in management accounting
and control: a review and evaluation. Accounting, Auditing and Accountability
Journal, 5 (4), pp. 3-34.
Ferreira, A. and Otley D. T. (2009). The design and use of performance management
systems: An extended framework for analysis. Management Accounting Research,
20 (4), pp. 263-282.
Fisher, J.G. (1995). Contingency-based research on management control systems:
categorisation by level of complexity. Journal of Accounting Literature, Vol. 14,
pp. 24–53.
Fisher, J.G. (1998). Contingency theory, management control systems and firm
outcomes: past results and future directions. Behavioral Research in Accounting,
Vol. 10 (Supplement), pp. 47–57.
Fisher, R. A. (1973). Statistical Methods and Scientific Inference, 3rd edition. London:
Macmillan.

246
Flamholtz, E.G., (1983). Accounting, budgeting and control systems in their
organizational context: theoretical and empirical and empirical perspectives.
Accounting, Organizations and Society, 8 (2/3), pp. 153–169.
Flick, U. (2002). An introduction to qualitative research. London: SAGE.
Flyvberg, B. (2006). Five misunderstandings about case-study research. Qualitative
Inquiry, 12 (4), pp. 219-245.
Fontana, A. and Frey, J. H. (2000). The interview: From structured questions to
negotiated text. Handbook of qualitative research, Vol. 2, pp. 645-672.
Frow, N., Marginson, D.and Ogden, S. (2005). Encouraging strategic behaviour while
maintaining management control: Multi-functional project teams, budgets, and the
negotiation of shared accountabilities in contemporary enterprises. Management
Accounting Research, 16(3), pp. 269-292.
Fullerton, R. R., Kennedy, F. A. and Widener, S. K. (2010). Accounting for a Lean
Environment. Retrieved on 6th August 2016, Available at SSRN:
http://ssrn.com/abstract=1659386
Fullerton, R., Kennedy, F., and Widener, S. (2013). Management accounting and
control practices in lean manufacturing environment. Accounting, Organizations
and Society, Vol. 38, pp. 50-71.
Fullerton, R., Kennedy, F., and Widener, S. (2014). Lean manufacturing and firm
performance: The incremental contribution of lean management accounting
practices. Journal of Operations Management, 32 (7-8), pp. 414-428.
Fullerton, R. R., and Mc Watters, C. S. (2002). The role of Performance Measures and
Incentive Systems in relation to the Degree of JIT Implementation. Accounting
Organizations and Society, Vol. 27, pp. 711-735.
Gamal, S., Mohamed, E. and Ibrahim, M. (2012). Activity-Based Costing in a Lean
Context for Better Competitive Stand: An Egyptian Case Study. Saarbrücken,
Germany: LAP LAMBERT Academic Publishing.
Gerdin, J. and Greve, J. (2004). Forms of contingency fit in managerial accounting
research—a critical review. Accounting, Organizations and Society, 29 (3–4),
pp. 303-326.
247
Ghauri, P. N. (2004). Designing and conducting case studies in international business
research. In: Marshan-Piekkari, R. and Welch, C. (eds), A Handbook of
Qualitative Research Methods for International Business. Cheltenham: Edward
Elgar, pp. 109-124.
Ghauri, P. and Gronhaug, K. (2005). Research Methods in Business Studies: A Practical
Guide, 3rd edition. Essex: Pearson Education Ltd.
Ghauri, P., Gronhaug, K. And Kristianslund, I. (1995). Research Methods in Business
Studies. Hemel Hempstead: Prentice Hall.
Gibbs, G. R. (2002). Qualitative Data Analysis: Explorations with NVivo. Maidenhead:
Open University Press.
Gibbs, G. (2007). Analyzing Qualitative Data. London: Sage.
Gill, J. and Johnson, P. (2002). Research Methods for Managers. Sage Publications.
Goldratt, E. M. and Cox, J. (1986). The goal: a process of ongoing improvement, 2nd
edition. Croton-on-Hudson, New York: North River Press.
Grabner, I. and Moers, F. (2013). Management Control as a System or a Package?
Conceptual and Empirical Issues. Retrieved on 10th August 2018, Available at
SSRN: https://ssrn.com/abstract=2250062
Grasso, L. (2005). Are ABC and RCA Accounting Systems Compatible with lean
management?. Management Accounting Quarterly, Fall, 7 (1), pp. 12-27.
Gray, D. (2014). Doing Research in Real World, 3rd edition. London: Sage Publications,
Ltd.
Grottke, M. and Obermaier, R. (2016). Engines, Brakes, or Cameras? Towards an
understanding of the iridescent role of Calculative practice. Proceedings of: The
52nd British Accounting and Finance Association (BAFA) Annual Conference,
Bath, UK, 21-23 March.
Grove, A. L., Meredith, J. O., Macintyre, M., Angellis, J. and Neailey, K. (2011). Lean
implementation in primary care health visiting services in National Health Service
UK. Quality Safety Health Care, 19 (1), pp. 1-5.
Guba, E. G. and Lincoln, Y. S. (1994). Competing paradigms in qualitative research. In:
Denzin K. and Lincoln, Y. S (Eds), Handbook of Qualitative Research, pp. 105-
117.

248
Hansen, A. (2011). Relating performative and ostensive management accounting
research: Reflections on case study methodology. Qualitative Research in
Accounting and Management, Vol. 8, pp. 108-138.
Hansen, A. and Mouritsen, J. (2007). Management accounting and changing operations
management. In: Hopper, T., Northcott, D. and Scapens, R. (Eds), Issues in
Management Accounting, 3rd edition. Prentice Hall, Harlow, pp. 3-25.
Haque, B. and Moore, M.J. (2004). Measures of performance for lean product
introduction in the aerospace industry. Proceedings of: The Institution of
Mechanical Engineers, Part B: Engineering Manufacture, 218 (10), pp. 1387-
1398.
Heath, A. W. (1997). The proposal in qualitative research. The Qualitative Report, 3
(1), pp. 147-151.
Henri, J. F. (2006). Organizational culture and performance measurement systems.
Accounting, Organizations and Society, 31 (1), pp. 77-103.
Hines, R. D. (1998). Financial Accounting: In Communicating Reality, We Construct
Reality. Accounting, Organizations and Society, 13 (3), pp. 251-261.
Hines, P., Holweg, M., and Rich, N., (2004). Learning to evolve. A review of
contemporary lean thinking. International Journal of Operations and Production
Management, 24 (10), pp. 994-1011.
Hines, P., Found, P. and Harrison, R. (2008). Staying Lean: Thriving, Not Just
Surviving. Cardiff: Lean Enterprise Research Centre, Cardiff University.
Hines, P. and Lethbridge, S. (2008). New Development: Creating a Lean University.
Public Money & Management, 28 (1), pp. 53-56.
Holstein, J. A. and Gubrium, J. F. (1997). Active interviewing. Sage Publications.
Holweg, M. (2007). The genealogy of lean production. Journal of Operations
Management, 25 (2), pp.420-437.
Hopp, W. P. and Spearman, M.L. (2004). To pull or not to pull: what is the question?.
Manufacturing and Service Operations Management, 6 (2), pp. 133-148.
Hopwood, A. G. (1967). Editorial: the path ahead. Accounting, Organizations and
Society, Vol. 1, pp. 1-4.
Hoque, Z. and James, W. (2000). Linking balanced scorecard measures to size and
market factors: impact on organizational performance. Journal of Management
Accounting Research, 12 (1), pp. 1-17.

249
Horngren, C. T., Datar, S. M., and Rajan, M. V. (2015). Cost Accounting A Managerial
Emphasis, 15th edition. Edisi.
Huntzinger, J. R. (2007). Lean Cost Management: Accounting for Lean by Establishing
Flow. Florida: J. Ross Publishing.
Ittner, C.D. and Larcker, D.F. (1995). Total quality management and the choice of
information and reward systems. Journal of Accounting Research, Vol. 33, pp. 1-
34.
Ittner, C. D., and Larcker, D. F. (2001). Assessing empirical research in managerial
accounting: A value-based management perspective. Journal of Accounting and
Economics, Vol. 32, pp. 349-410.
Johnson, H.T. (2006). Lean accounting: to become lean, shed accounting. Cost
Management, 20 (1), pp. 6-17.
Johnson, P. and Duberley, J. (2000). Understanding Management Research: An
introduction to epistemology. Sage Publications Ltd.
Johnson, H.T. and Kaplan, R.S., (1987). Relevance Lost: The Rise and Fall of
Management Accounting. Harvard Business School Press, Boston.
Jollands, S., Akroyd, C. and Sawabe, N. (2018). Management controls and pressure
groups: the mediation of overflows. Accounting, Auditing and Accountability
Journal, 31 (6), pp. 1644-1667
Jönsson, S. (1998). Relate Management Accounting Research to Managerial Work.
Accounting, Organizations and Society, 24 (3), pp. 411-434.
Jordan, S. and Messner, M. (2012). Enabling control and the problem of incomplete
performance indicators. Accounting, Organizations and Society, 37 (8), pp. 544-
564.
Justesen, L. and Mouritsen, J. (2011). Effects of actor-network theory in accounting re-
search. Accounting, Auditing and Accountability Journal, 24 (2), pp. 161–193.
Kaplan, R.S. (1984). Yesterday's accounting undermines production. Harvard Business
Review, 62 (4), pp. 95-102.
Kaplan, R.S. (1986). Must CIM be justified by faith alone. Harvard Business Review,
64 (2), pp. 87-95.
Kaplan, R.S. (1988). One cost system isn’t enough. Harvard Business Review, 66 (1),
pp. 61–66.
250
Kaplan, R.S. (1989). Management accounting for advanced technological environments.
Science, 245 (4920), pp. 819–823.
Kastberg, G. (2014). Framing shared services: Accounting, control and overflows.
Critical Perspectives on Accounting, Vol. 25, pp. 743–756.
Kennedy, F. A., and Brewer, P.C. (2006). The Lean enterprise and traditional
accounting - Is the honeymoon over?. Journal of Corporate Accounting &
Finance, Vol. 17, pp. 63-74.
Kennedy, F. A., and Widener, S. K. (2008). A control framework: Insights from
evidence on lean accounting. Management Accounting Research, Vol. 19, pp.
301-323.
Kloot, L. (1997). Organizational learning and management control systems: responding
to environmental change. Management Accounting Research, 8 (1), pp. 47-73.
Kollberg, B., Dahlgaard, J. J. and Brehmer, P. (2007). Measuring lean initiatives in
health care services: issues and findings. International Journal of Productivity and
Performance Management, 56 (1), pp. 7 – 24.
Kotabe, M. and Murray, J. Y. (1990). Linking product and process innovations and
modes of international sourcing in global competition: A case of foreign
multinational firms. Journal of International Business Studies, 21 (3), pp. 383-
408.
Langfield-Smith, K. (1997). Management control systems and strategy: A critical
review. Accounting, Organizations and Society, 22 (2), pp. 207-232.
Langfield-Smith, K. (2006). A review of quantitative research in management control
systems and strategy. Handbooks of Management Accounting Research, Vol. 2,
pp. 753-783.
Laszlo, A. and Krippner S. (1998). Systems theories: Their origins, foundations, and
development. In: Jordan, J. S. (Eds), Systems Theories and a Priori Aspects of
Perception. Amsterdam: Elsevier Science.
Latour, B. (1987). Science in Action. Cambridge, Mass: Harvard University Press.
Latour. B. (1996). On actor-network theory—a few clarifications. Soziale Welt-
Zeitschrift fur Sozialwissenschaftliche forschung und praxis, 47 (4), pp. 369-381.
Also available on: http://www.nettime.org/Lists-Archives/nettime-l-
9801/msg00019.html (accessed 19/04/2016).

251
Latour, B. (1998). To modernise or Ecologise? That is the question. In: Braun, B. and
Castree, N., Remaking reality: nature at the millenium. London; New York
Routledge, pp. 220-241.
Latour, B. (1999). On recalling ANT. In: Law, J. and Hassard, J. (Eds.), Actor Network
Theory and After. Blackwell Sociological Review, Oxford.
Latour, B. (2005). Reassembling the Social. Oxford University Press, Oxford, UK.
Law, J. (1991). Introduction: Monsters, Machines and Sociotechnical Relations. In: A
sociology of monsters: Essays on power, technology and domination. J. Law (ed.),
1–25. Routledge: London.
Law, J. (1992). Notes on the theory of the actor-network: Ordering, strategy, and
heterogeneity. Systemic Practice and Action Research, Vol.5, pp. 379-393.
Law, J. (1999). After ANT: complexity, naming and topology. In: Law, J. and Hassard,
J. (eds.) Actor Network Theory and After. Blackwell publishing, Oxford.
Lewis, P. (2007). Using ANT ideas in the Managing of Systemic Action Research.
Systems Research and Behavioural Science, Vol. 24, pp. 589-598.
Li, S., Subba Rao, S., Ragu-Nathan, T. S. and Ragu-Nathan, B. (2005). Development
and validation of a measurement instrument for studying supply chain
management practices. Journal of Operations Management, 23 (6), pp. 618-641.
Light, P. C. (1998). Sustaining Innovation. Creating Nonprofit and Government
Organizations that Innovate Naturally. San Francisco, CA: Jossey‐Bass.
Liker, J.K. (1996). Becoming Lean. New York, NY: Free Press.
Liker, J.K. (2004). The Toyota Way – 14 Management Principles from the World’s
Greatest Manufacturer. New York, NY: McGraw-Hill.
Liker, J.K. and Morgan, J.M. (2006). The Toyota Way in Services: The Case of Lean
Product Development. Academy of Management Perspectives, 20 (2), pp. 5-20.
Lillis, A. and Mundy, J. (2005). Cross-sectional field studies in management accounting
research-closing the gaps between surveys and case studies. Journal of
Management Accounting Research, Vol. 17, pp.119-141.
Lincoln, Y. S. and Guba, E. G. (1985). Naturalistic Inquiry. Sage Publications.
Long, T. and Johnson, M. (2000). Rigour, reliability and validity in qualitative research.
Clinical Effectiveness in Nursing, 4 (1), pp. 30-37.

252
Lowe, A. (1997). The role of accounting in the process of health reform: providing a
“black box” in the costing of blood products. Management Accounting Research,
Vol. 8, pp. 439–458.
Maciarello, J. A. and Kirby, C. J. (1994). Management Control Systems. Englewood
Cliffs: Prentice Hall.
MacKenzie, D. A. (2006). An engine not a camera: How financial models shape
markets. Cambridge, Massachusetts, London, England: MIT Press.
MacKenzie, D. A. (2007). Is economics performative? In: D. MacKenzie, F. Muniesa,
& L. Siu (Eds.), Do Economists Make Markets? On the Performativity of
Economics (pp. 54–86). Princeton, N.J: Princeton University Press.
MacKenzie, D. A., and Millo, Y. (2003). Constructing a market, performing a theory:
The historical sociology of a financial derivatives exchange. American Review of
Sociology, 109 (1), pp. 107–145.
MacKenzie, D. and Spears, T. (2014). A device for being able to book P&L’: The
organizational embedding of the Gaussian copula. Social Studies of Science, 44
(3), pp. 418–440.
Maines, D.R. (2000). The Social Construction of Meaning. Contemporary Sociology, 29
(4), pp. 577-584.
Malmbrandt, M. and Ahlstrom, P. (2013). An instrument for assessing lean service
adoption. International Journal of Operations & Production Management, 33 (9),
pp. 1131 – 1165.
Malmi, T., Brown D.A., (2008). Management control systems as a package –
Opportunities, challenges and research directions. Management Accounting
Research, Vol. 19, pp. 287-300.
Marshan-Piekkari, R. and Welch, C. (2004). A Handbook of Qualitative Research
Methods for International Business. Cheltenham: Edward Elgar.
Marginson, D. E. W. (2002). Management control systems and their effects on strategy
formation at middle management levels: evidence from a UK organization.
Strategic Management Journal, 23 (11), pp. 1019-1031.
Maskell, B. H., and Baggaley, B. L. (2004). Practical Lean Accounting: A Proven
System for Measuring and Managing the Lean Enterprise. Productivity Press,
New York.

253
Maskell, B. H., and Kennedy, F. A. (2007). Why do we need lean accounting and how
does it work? Journal of Corporate Accounting & Finance, Vol. 18, pp. 59-73.
McDonald, T., Van Aken, E. M. and Rentes, A. F. (2002). Utilising simulation to
enhance value stream mapping: a manufacturing case application. International
Journal of Logistics, 5 (2), pp. 213-232.
McSweeney, B. (1997). The Unbearable Ambiguity of Accounting. Accounting,
Organizations and Society, 22 (7), pp. 691-712.
Meeus, M. T. and Edquist, C. (2006). Introduction product en process innovation.
In: Innovation, science and institutional change (pp. 24-37). Oxford University
Press.
Meier, H. and Forrester, P. (2002). A model for evaluating the degree of leanness of
manufacturing firms. Integrated Manufacturing Systems, 13 (2), pp. 1-7.
Merchant, K. A. (1985). Control in Business Organization. Financial Times/Prentice
Hall.
Merchant, K.A. (1998). Modern Management Control Systems. Upper Saddle River:
Prentice Hall.
Merchant, K. A. and Otley, D. T. (2007). A Review of the Literature on Control and
Accountability. In: Chapman, S., Hopwood, A.G. and Shields, M.D. (eds.),
Handbook of Management Accounting Research, Vol. 2, pp. 785-802.
Merchant K.A. and Van der Stede, W. (2012). Management Control Systems,
Performance Measurement, Evaluation and Incentives, 3rd edition. Prentice Hall.
Meyer, J. W. and Rowan, B. (1977). Institutionalized organizations: Formal structure as
myth and ceremony. American Journal of Sociology, Vol. 83, pp. 440-463.
Miles, I. (2001). Services innovation: A reconfiguration of innovation studies (pp. 01-
05). PREST, University of Manchester.
Miles, M. and Huberman, A. (1994). Qualitative Data Analysis: An expanded
Sourcebook, 2nd edition. London: Sage.
Miller, P. and O'leary, T. (1994). Accounting, 'economic citizenship' and the spatial
reordering of manufacture. Accounting, Organizations and Society, 19 (1), pp. 15-
43.
Miller, P. (2001). Governing by numbers: Why calculative practices matter. Social
Research, 68 (2), pp. 379–396.
254
Miller, P. and Power, M. (2013). Accounting, organizing, and economizing. The
Academy of Management Annals, 7 (1), pp. 557-605.
Ming-Te, L., Kuo-Chung, M. A. and Pan, W. T. (2013). Using data mining technique to
perform the performance assessment of lean service. Neural Computing and
Application, 22 (7-8), pp. 1433-1445.
Modell, S., Vinnari, E. and Lukka, K. (2017). On the virtues and vices of combining
theories: The case of institutional and actor-network theories in accounting
research. Accounting, Organisations and Society, Vol. 60, pp. 62-78.
Monden, Y., (1998). Toyota Production System—An Integrated Approach to Just-In-
Time, 3rd edition. Norcross, Georgia: Engineering & Management Press.
Moore, R. and Scheinkopf, L. (1998). Theory of Constraints and Lean Manufacturing:
Friends or Foes? Chesapeake Consulting, Severna Park, MD, retrieved on 4th
April, 2015, Available at:
http://www.tocca.com.au/uploaded/documents/Lean%20and%20TOC.pdf
Morris, T., and Wood, S. (1991). Testing the survey method: continuity and change in
British industrial relations. Work, Employment and Society, 5 (22), pp. 259–282.
Mouritsen, J., Hansen, A. and Hansen, C.Ø. (2009). Short and long translations:
management accounting calculations and innovation management. Accounting,
Organizations and Society, 34 (6-7), pp. 738-54.
Mouritsen, J., Larsen, H.T. and Bukh, P.N.D. (2001). Intellectual capital and the
“capable firm”: Narrating, visualizing and numbering for managing knowledge.
Accounting, Organizations and Society, 26 (7 and 8), pp. 735–762.
Mundy, J. (2010). Creating dynamic tensions through a balanced use of management
control systems. Accounting, Organizations and Society, 35(5), pp. 499-523.
Myers, M.D. (2009). Qualitative Research in Business and Management, 1st edition.
Sage Publications, Thousand Oaks, CA.
Myers, M.D. (2013). Qualitative Research in Business & Management, 2nd edition.
Sage Publications, London.
Narayanamurthy, G. and Gurumurthy, A. (2018). Is the hospital lean? A mathematical
model for assessing the implementation of lean thinking in healthcare
institutions. Operations Research for Health Care, Vol. 18, pp. 84-98.
Nixon, W.A.J. and Burns, J. (2005). Management control in the 21st century.
Management Accounting Research, Vol. 16, pp. 260-268.

255
Norman, R. (2001). Letting and making managers manage: the effect of control systems
on management action in New Zealand's central government. International Public
Management Journal, 4 (1), pp. 65-89.
Ohno, T. (1988). Toyota Production System: Beyond Large-scale Production. New
York, NY: Productivity Press.
Oliver, N., Delbridge, R. and Lowe, J. (1996). Lean production practices: international
Comparisons in the Auto Components Industry. British Journal of Management,
Vol. 7, pp. 29-44.
Oliver, N., Delbridge, R., and Barton, H. (2002). Lean production and manufacturing
performance improvement in Japan, The UK and US 1994-2001. Working Paper
Series of ESRC Center for Business Research, University of Cambridge, Working
paper No. 232.
Ostroff, F. (1999). The horizontal organization: What the organization of the future
actually looks like and how it delivers value to customers. Oxford University
Press.
Otley, D., (1980). The contingency theory of management accounting: Achievement
and prognosis. Accounting, Organizations and Society, 5 (4), pp. 413-428.
Otley, D. (1994). Management control in contemporary organizations: towards a wider
framework. Management Accounting Research, 5 (3/4), pp. 289-299.
Otley, D. (1999). Performance management: a framework for management control
systems research. Management Accounting Research, 10 (4), pp. 363-382.
Otley, D. (2016). The contingency theory of management accounting and control:
1980–2014. Management Accounting Research, Vol. 31, pp. 45-62.
Ouchi, W.G. (1977). The relationship between organizational structure and
organizational control. Administrative Science Quarterly, Vol. 22, pp. 95–113.
Paul, S. (2011, February). Shared Service 2020: Is lean programme management the
answer to building an enhanced shared service?. Capgemini Consulting, Presented
at: CIMA/ Loughborough University SSC Forum, Loughborough, UK.
Pepper, M.P.J. and Spedding, T.A. (2010). The evolution of lean Six Sigma.
International Journal of Quality & Reliability Management, 27 (2), pp. 138-155.
Pettersen, J. (2009). Defining lean production: some conceptual and practical issues.
The TQM Journal, 21 (2), pp. 127-142.

256
Piercy, N. and Rich, N. (2009). High quality and low cost: the lean service centre.
European Journal of Marketing, 43 (11/12), pp. 1477-1497.
Pilkington, A. and Fitzgerald, R. (2006). Operations management themes, concepts and
relationships: a forward retrospective of IJOPM. International Journal of
Operations and Production Management, 26 (11), p. 1255-1275.
Psychogios, A. G., Atanasovski, J. and Tsironis, L. K. (2012). Lean Six Sigma in a
service context: a multi-factor application approach in the telecommunications
industry. International Journal of Quality and Reliability Management, 29 (1), pp.
122-139.
Puxty, T. and Chua, W. F. (1989). Ideology, rationality and the management control
process. In: Critical Perspectives in Management Control (pp. 115-139). Palgrave
Macmillan, London.
Quattrone, P. and Hopper, I. (2005). A 'time-space odyssey': management control
systems in two multinational organisations. Accounting, Organizations and
Society, Vol. 30, pp. 735-764.
Radnor, Z. and Walley, P. (2008). Learning to walk before we try to run: Adapting lean
for the public sector. Public Money & Management, 28 (1), pp.13-20.
Radnor, Z. (2010). Transferring Lean into government. Journal of Manufacturing
Technology Management, 21 (3), pp.411-428.
Rao, M. H. S., and Bargerstock, A. S. (2011). Exploring the Role of Standard Costing in
Lean Manufacturing Enterprises: A Structuration Theory Approach. Management
Accounting Quarterly, 13 (1), pp. 47-60.
Rao, M. H. S., and Bargerstock, A. S. (2013). Do lean implementation initiatives have
adequate accounting Support? The debate of duality. Management Accounting
Quarterly, 14 (4), pp. 12-21.
Ravn, L. (1991). What should guide reality construction?. In: F. Steir (ed), Research
and Reflexivity. Sage Publications, London.
Revellino, S. and Mouritsen, J. (2015). Accounting as an engine: The performativity of
calculative practices and the dynamics of innovation. Management Accounting
Research, Vol. 28, pp. 31–49.
Roberts, J. (1991). The possibilities of accountability. Accounting, organizations and
society, 16 (4), pp. 355-368.

257
Robinson, S., Radnor, Z. J., Burgess, N. and Worthington, C. (2012). Simlean: utilising
simulation in the implementation of lean in healthcare. European Journal of
Operational Research, 219 (1), pp. 188-197.
Robson, C. (2002). Real World Research, 2nd edition. Oxford: Blackwell Publishers.
Robson, K. (1992). Accounting Numbers as "Inscription": Action at a Distance and the
Development of Accounting. Accounting, Organizations and Society, Vol. 17, pp.
685-708.
Rother, M. and Shook, J. (2003). Learning to See: Value Stream Mapping to Add Value
and Eliminate Muda. Cambridge, MA, USA: The Lean Enterprise Institute.
Ruiz-de-Arbulo-Lopez, P., Fortuny-Santos, J., and Cuatrecascas-ArbÓs, L. (2013).
Lean manufacturing: costing the value stream. Industrial Management and Data
Systems, 113 (5), pp. 647-668.
Russell, R.S. and Taylor, B.W. (2000). Operations Management. Englewood Cliffs,
New Jersey: Prentice-Hall.
Rybski, C. and Jochem, R. (2016). Benefits of a Learning Factory in the Context of
Lean Management for the Pharmaceutical Industry. Procedia CIRP, Vol. 54,
pp.31-34.
Salgado, E. G. and Dekkers, R. (2018). Lean product development: nothing new under
the sun?. International Journal of Management Review, 20 (4), pp. 903-933.
Sanchez, A. M. and Pérez, M. P. (2001). Lean indicators and manufacturing strategies.
International Journal of Operations and Production Management, 21 (11), pp.
1433-1452.
Saunders, M., Lewis, P. and Thornhill, A. (2009). Research Methods for Business
Students, 5th edition. Essex: Pearson Education Ltd.
Scapens, R. W. (1990). Researching management accounting practice: the role of case
study methods. British Accounting Review, 22 (3), pp. 259-281.
Schonberger, R. J. (2001). Let's Fix It!: Overcoming the Crisis in Manufacturing.
Simon and Schuster.
Scott, W. R. (1981). Organizations: Rational, natural and open systems. Englewood
Cliffs NJ: Prentice Hall Inc.
Scott, W. R. (1987). The Adolescence of Institutional Theory. Administrative Science
Quarterly, 32(4), pp. 493-511.

258
Scott, W. R. (2001). Institutions and Organizations, 2nd edition. Thousand Oaks, CA:
Sage Publications.
Scott, W. R. (2004). Institutional theory. In: Encyclopedia of Social Theory, George
Ritzer, ed. Thousand Oaks, CA: Sage. Pp. 408-14
Seal, W. and Herbert, I. (2013). Shared service centres and the role of the finance
function. Journal of Accounting and Organizational Change, 9 (2), pp. 188 – 205.
Seddon, J. (2003). Freedom from Command and Control: a better way to make the work
work. Buckinghamshire, England: Vanguard Consulting Ltd.
Seddon, J., and Caulkin, S. (2007). Systems thinking, lean production and action
learning. Action Learning: Research and Practice, Vol. 4, pp. 9-24.
Seddon, J., O’Donovan, B. and Zokaei, K. (2011). Rethinking lean service. In:
Macintyre, M., Parry, G., and Angelis, J (eds.), Service Design and Delivery (pp.
41-60). Springer, Boston, MA.
Seddon, J. (2014). The Whitehall Effect: How Whitehall Became the Enemy of Great
Public Services - and What We Can Do About it. England: Triarchy Press.
Seth, D. and Gupta, V. (2005). Application of value stream mapping for lean operations
and cycle time reduction: an Indian case study. Production Planning & Control,
16 (1), pp. 44-59.
Shah, S. K. and Corley, K. G. (2006). Building better theory by bridging the
quantitative -qualitative divide. Journal of Management Studies, 43(8), pp. 1821-
1835.
Shah, R. and Ward, P.T. (2003). Lean manufacturing: context, practice bundles, and
performance. Journal of Operations Management, 21 (2), pp. 129-149.
Shah, R. and Ward, P.T. (2007). Defining and developing measures of lean production.
Journal of Operations Management, Vol. 25, pp. 785–805.
Shimokawa, K., and Fujimoto, T. (2009). The Birth of Lean. Cambridge, MA: The Lean
Enterprise Institute, Inc.
Silverman, D. (2009). Doing Qualitative Research. Sage Publications Ltd.
Simon, R., (1995a). Control in an Age of Empowerment. Harvard Business Review.
March-April, pp. 80-88.
Simon, R., (1995b). Levers of control: how managers use innovative control systems to
drive strategic renewal. Boston: Harvard Business School Press.

259
Skærbæk, P. and Tryggestad, K. (2010). The role of accounting devices in performing
corporate strategy. Accounting, Organizations and Society, Vol. 35, pp. 108-124.
Simpson, D. F. and Power, D. J. (2005). Use the supply relationship to develop lean and
green suppliers. Supply Chain Management: An International Journal, 10 (1), pp.
60-68.
Smith, R. (2003). Research and revelation: What really works. Beyond empiricism: On
criteria for educational research, pp. 129-140.
Soanes, C. and Stevenson, A. (2004). Concise Oxford English dictionary, 11th edition,
pp. (1462, 1095). Oxford: Oxford University Press.
Soriano-Meier, H. and Forrester, P. L. (2002). A model for evaluating the degree of
leanness of manufacturing firms. Integrated Manufacturing Systems, 13 (2), pp.
104-109.
Spear, S. and Bowen, H. K. (1999). Decoding the DNA of the Toyota Production
System. Harvard Business Review, 77 (9/10), pp. 97-106.
Spear, S. J. (2005). Fixing healthcare from the inside, today. Harvard Business Review
(September), pp. 78–91.
Staats, B. R., Brunner, D. J. and Upton, D. M. (2011). Lean principles, learning, and
knowledge work: evidence from a software service provider. Journal of
Operations Management, 29 (1), pp. 376-390.
Standard, C. and Davis, D. (2000). Lean thinking for competitive advantage.
Automotive Manufacturing and Production, December, pp. 1-2.
Stevenson, W. J. (2005). Operations Management. New York: McGraw-Hill, Inc.
Strauss, E.R., Nevries, P. and Weber, J. (2013). The development of MCS packages –
balancing constituents’ demands. Journal of Accounting and Organizational
Change, 9 (2), pp. 155-187.
Suarez-Barraza, M. F., Smith, T. and Dahlgaard-Park, S. M. (2009). Lean-kaizen public
service: an empirical approach in Spanish local governments. The TQM Journal,
21 (2), pp.143-167.
Suárez-Barraza, M. F., Smith, T. and Dahlgaard-Park, S. M. (2012). Lean Service: A
literature analysis and classification. Total Quality Management & Business
Excellence, 23 (3-4), pp. 359-380.
260
Sugimori, Y., Kusunoki, K., Cho, F. and Uchikawa, S. (1977). Toyota production
system and Kanban system: materialization of just-in-time and respect-for-human
system. International Journal of Production Research, 15 (6), pp. 553-64.
Susman, G. I., and Evered, R. D. (1978). An assessment of the scientific merits of
action research. Administrative Science Quarterly, 23(4), pp. 582–603.
Tashakkori, A. and Teddlie, C. (1998). Mixed methodology: Combining qualitative and
quantitative approaches. Thousand Oaks, CA: Sage.
Tessier, S. and Otley, D. (2012). A conceptual development of Simon’s Lever of
Control framework. Management Accounting Research, Vol. 23, pp. 171-185.
Themsen, T. N. and Skaerbaek, P. (2018). The performativity of risk management
frameworks and technologies: The translation of uncertainties into pure and
impure risks. Accounting, Organizations and Society, Vol. 67, pp. 20-33.
Ticehurst, G. and Veal, A. (2000). Business Research Methods. Australia, Frenchs
Forest: Longman.
Tillema, S. and van der Steen, M. (2015). Co-existing concepts of management control:
The containment of tensions due to the implementation of lean production.
Management Accounting Research, Vol. 27, pp. 67–83.
Tong, A., Sainsbury, P. and Craig, J., (2007). Consolidated criteria for reporting
qualitative research (COREQ): a 32-item checklist for interviews and focus
groups. International Journal for Quality in Health Care, 19 (6), pp. 349-357.
Van der Merwe, A., and Thomson, J. (2007). The Lowdown on Lean Accounting.
Strategic Finance, (February), pp. 26-33.
Van der Stede, W.A. (2015). Management accounting: where from, where now where
to?. Journal of Management Accounting Research, Vol. 26, pp. 171-176.
Van der Steen, M. and Tillema, S. (2018). Controlling lean manufacturing in
multidivisional organisations: Highlighting local interests and constraints.
International Journal of Operations and Production Management, 38 (11), pp.
2149-2168.
Vasilash, G. (2000). How Toyota does it. Automotive Manufacturing and Production,
August, pp. 1-8.
Vasilash, G. (2001). Lean: a silver lining. Automotive Design and Production,
November, pp. 1-3.

261
Voss, C., Tsikriktsis, N. and Frohlich, M. (2002). Case research in operations
management. International Journal of Operations & Production Management, 22
(2), pp. 195-219.
Vosselman, E. (2014). The ‘performativity thesis’ and its critics: Towards a relational
ontology of management accounting. Accounting and Business Research, 44 (2),
pp. 181-203.
Vosselman, E. and De Loo, I. (2020). Performance measurement framed through
representationalism vis-à-vis performativism: the consequences for accounting
research. Proceedings of: The 2nd Alternative Accounts Europe Annual
Conference, Leicester, UK, 9 January.
Walker, R. M. (2006). Innovation type and diffusion: An empirical analysis of local
government. Public Administration, 84 (2), pp. 311-335.
Wan, H., and Chen, F. F. (2008). A leanness measure of manufacturing systems for
quantifying impacts of lean initiatives. International Journal of Production
Research, 46 (23), pp. 6567-6584.
Ward, Y., and Graves, A. (2004). A New Cost Management & Accounting Approach
for Lean Enterprises. Working paper series of University of BATH, School of
Management.
Warnecke, H. J., and Hüser, M. (1995). Lean production. International Journal of
Production Economics, 41 (1-3), pp. 37-43.
Warren, L. and Seal, W. (2018). Using investment appraisal models in strategic
negotiation: The cultural political economy of electricity generation. Accounting,
organizations and society, Vol. 70, pp. 16-32.
Warwood, S. J. and Knowles, G. (2004). An investigation into Japanese 5-S practice in
UK industry. The TQM Magazine, 16 (5), pp. 347-53.
White, R.E. and Prybutok, V. (2001). The relationship between JIT practices and type
of production system. Omega: The International Journal of Management Science,
29 (2), pp. 113-124.
Whittle, A. and Spicer, A. (2008). Is actor network theory critique?. Organization
Studies, 29 (4), pp. 611-629.

262
Willert, J. and Otley, D. (2016). Management Control Systems & Performance
Management Systems: A Comparative Analysis of Frameworks. Proceeding of:
Management Control Association Workshop, Salford University, Manchester, UK,
19th February.
Womack, J., Roos, D., and Jones, D. (1990). The Machine that Changed the World.
Rawson Associates, New York.
Womack, J. P. and Jones, D. T (1994). From Lean Production to the Lean Enterprise.
Harvard Business Review, (March-April), pp. 94-103.
Womack, J. P., and Jones, D.T. (1996). Lean thinking: Banish Waste and Create Wealth
in your Corporation. Simon & Schuster, New York, NY.
Yang, C., and Modell, S. (2015). Shareholder orientation and the framing of
management control practices: A field study in a Chinese state-owned enterprise.
Accounting, Organizations and Society, 45, pp. 1-23.
Yin, R. (1994). Case study research: Design and methods, 2nd edition. CA, Thousand
Oaks: Sage Publications.
Yin, R. K., (2003). Case Study Research: Design and Methods, 3rd edition. CA,
Thousand Oaks: Sage Publications.
Zaltman, G., Duncan, R. and Holbek, J. (1973). Organizational change; Diffusion of
innovations. New York: Willey.