Lean Enterprise System - wyrickenterprises.com
40
QUALITY AND TIMELINESS OF SERVICE CUSTOMER DELIVERY COST CONTROL AND IMPROVEMENT C U S T O M E R S A T I S F A C T I O N P R O F I T A B L E S A L E S G R O W T H T.E.I. BENCHMARK CELLULARIZATION FLOW PRODUCTION 5S TAKT TIME PROBLEM SOLVING VISUAL MGMT. STANDARD WORK CEDAC MEASUREMENTS SMED KAIZEN STRATEGIC DEPLOYMENT Lean Enterprise System CONCURRENT DEVELOPMENT DEVELOPMENT SYSTEM DFM QFD TPM JIDOKA POKA-YOKE TARGET COSTING LEVELED SCHEDULE KANBAN SUPPLIER DEVELOPMENT MULTI-SKILLED WORK FORCE CHAKU-CHAKU ONE-PIECE FLOW V.O.C. Lean Enterprise Systems Lean Six Sigma Integration Specialists It’s all about Time ● Quality ● Results
Transcript of Lean Enterprise System - wyrickenterprises.com

QUALITY AND TIMELINESS OF SERVICE
CUSTOMER DELIVERY
COST CONTROL AND IMPROVEMENT
CUSTOMER
SATISFACTION
PROFITABLE
SALES
GROWTH
T.E.I.
BENCHMARK CELLULARIZATIONFLOW
PRODUCTION5S TAKT TIME
PROBLEM
SOLVING
VISUAL
MGMT.
STANDARD
WORK CEDACMEASUREMENTS SMED KAIZEN
STRATEGIC DEPLOYMENT
Lean
Enterprise System
CONCURRENT
DEVELOPMENT
DEVELOPMENT
SYSTEMDFM QFD TPMJIDOKA POKA-YOKE
TARGET
COSTING
LEVELED
SCHEDULE
KANBANSUPPLIER
DEVELOPMENT
MULTI-SKILLED
WORK FORCECHAKU-CHAKU
ONE-PIECE
FLOW
V.O.C.
Lean Enterprise Systems
Lean Six Sigma Integration Specialists
It’s all about Time ● Quality ● Results

WYRICK ENTERPRISES
It is all about Reliability, Sustainability, & Repeatability

Toyota Production SystemBest Quality - Lowest Cost - Shortest Lead Time
Through shortening the Production Flow by Eliminating Waste
Just in Time“The right part
at the right time
in the right amount”
• Continuous Flow
• Pull System
• Level Production
Jidoka“Built in Quality”
• Manual / Automatic
Line Stop
• Labor-Machine
Efficiency
• Error Proofing
• Visual ControlFlexible, Capable,
Highly Motivated
People
Standardized Work
Total Productive Maintenance
Robust Products & Processes
Supplier Involvement
Operational
Stability

The workplace issafe, orderly, and
immaculatelyclean
Products are built“Just In Time”,only to customerdemand
Six Sigma qualityis built into theproduct and theprocess
There is arelentless pursuitof perfection
Lean Strategy
Workplace
safety, order,
cleanliness
JIT
ProductionSix Sigma
QualityEmpowered
Teams
Visual
Management
Pursuit of
Perfection
Shop floor teams
are empowered
to make key
decision
Visual
Management to
track performance
and open the
company to all
people
6LeanP
DC
A
Act Plan
Check Do
P
DC
A
Act Plan
Check Do
P
DC
A
Act Plan
Check Do
P
DC
A
Act Plan
Check Do

Lean Enterprise Office
General Manager
Value Stream Manager
Lean Practitioner Master Black Belt
Lean Facilitators Black/Green Belts
Lean Project Teams
5S-Visual Mgmt-SMED
Cellular Flow-TPM
Kanban-TAKT Time
Six Sigma Teams
SPC-DOE-FMEA
CP/CPK-Variation
Regression-Quality
Process Mapping
Cycle/Lead Time
Visual Mgmt
Poka-Yoke
Std Work
6LeanP
DC
A
Act Plan
Check Do
P
DC
A
Act Plan
Check Do
P
DC
A
Act Plan
Check Do
P
DC
A
Act Plan
Check Do
6LeanP
DC
A
Act Plan
Check Do
Lean Six Sigma Practitioners
Customize and Integrate the LSS ToolBox
for Optimum Performance.
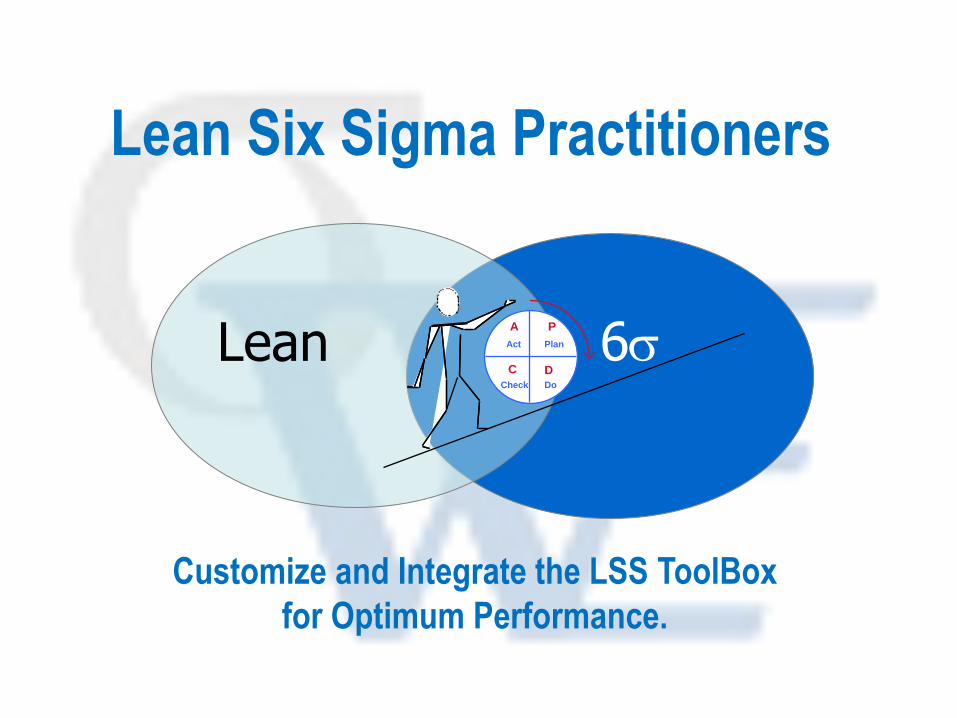
The Building Blocks
A Complete Portfolio Of Tools
Technical
Excellence
High
Performing
Work
Organization
Customer
Excellence
Operational
Excellence
Learning
Organization
Lean
Principles
The Six Sigma Lean Enterprise
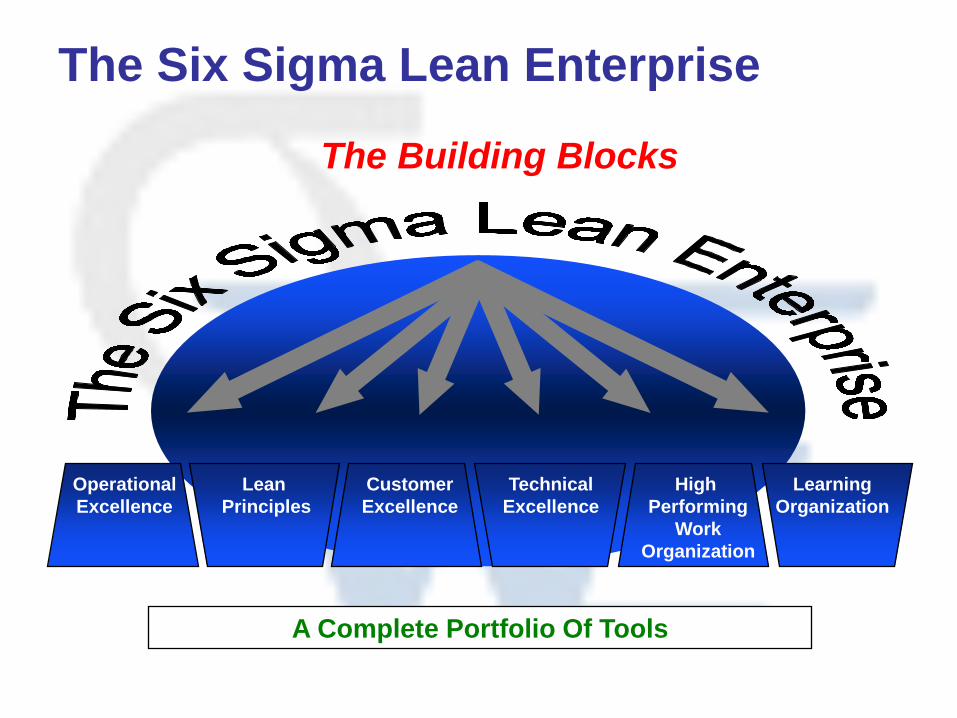
The workplace issafe, orderly, and
immaculatelyclean
Products are built“Just In Time”,only to customerdemand
Six Sigma qualityis built into theproduct and theprocess
There is arelentless pursuitof perfection
Lean Sigma Enterprise
Workplace
safety, order,
cleanliness
JIT
ProductionSix Sigma
QualityEmpowered
Teams
Visual
Management
Pursuit of
Perfection
Shop floor
teams are
empowered to
make key
decision
Visual
Management to
track performance
and open the
company to all
people
Lean Sigma Enterprise Systems Begin With A Basic Strategy
Develop a “Lean Sigma Strategy”
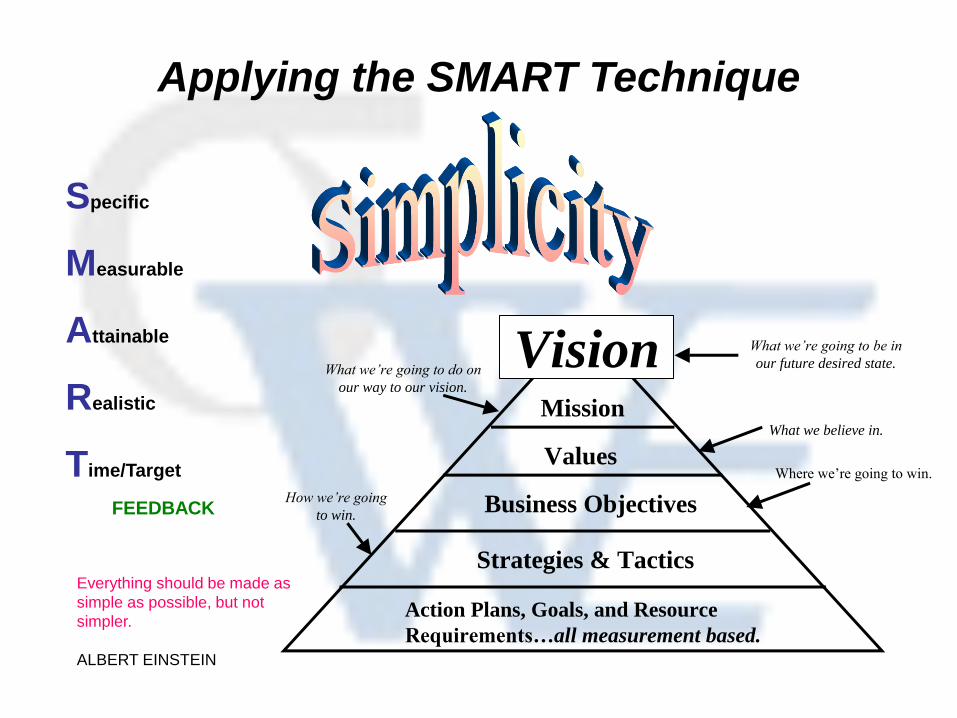
Applying the SMART Technique
Everything should be made as
simple as possible, but not
simpler.
ALBERT EINSTEIN
Mission
Values
Business Objectives
Strategies & Tactics
Action Plans, Goals, and Resource
Requirements…all measurement based.
VisionWhat we’re going to do on
our way to our vision.
What we’re going to be in
our future desired state.
What we believe in.
How we’re going
to win.
Where we’re going to win.
Specific
Measurable
Attainable
Realistic
Time/Target
FEEDBACK
Lean & Six Sigma Integration Specialistswww.wyrickenterprises.com [email protected]
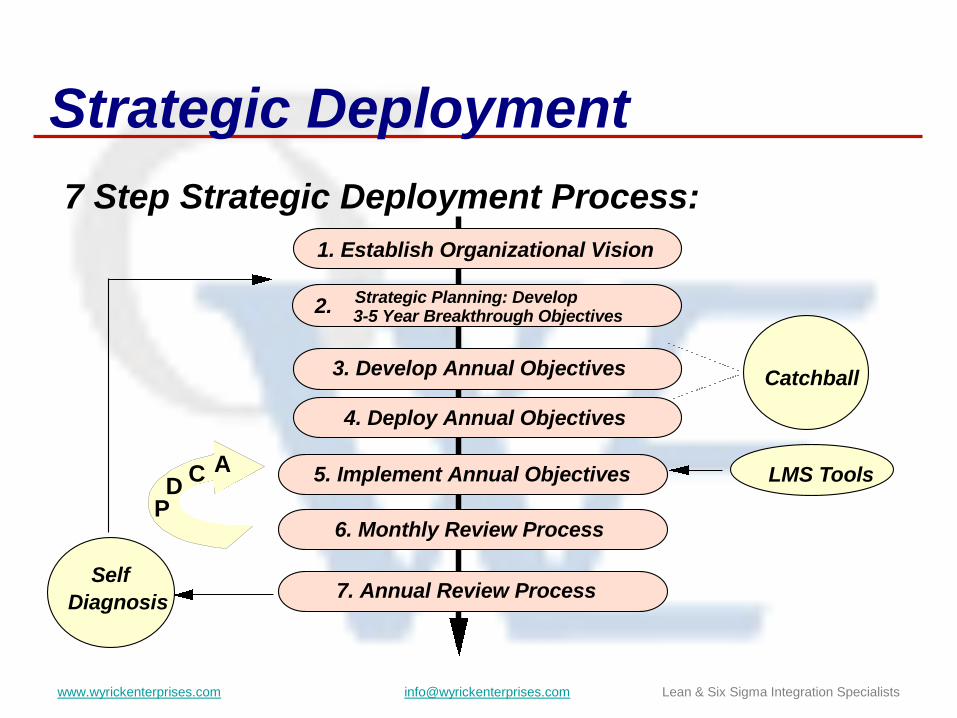
Strategic Deployment
1. Establish Organizational Vision
3. Develop Annual Objectives
4. Deploy Annual Objectives
5. Implement Annual Objectives
6. Monthly Review Process
7. Annual Review Process
7 Step Strategic Deployment Process:
Self
Diagnosis
Catchball
Strategic Planning: Develop 3-5 Year Breakthrough Objectives
2.
LMS Tools
PD
C A

Keys to Success
Accountability + Continuous Improvement
➢ Without clearly defined, assigned, focused, and accountableresponsibilities… clearlydefined objectives are almost impossible
➢ Any company can make a list of what they want. But to really succeed… you need to geteveryone on the samepage
➢ You need a plan… you need to follow it. “No plan survives first contact with the enemy”…so you need to constantly measure and improve it. But most of all, we need to finish thingswe start. A 75% solution now is better than a 100% solution never. The rest should beaccomplished through continuous improvement activities
What,
How,
Who,
When
Adherence
Plan Doct
Act Check

The Business Renewal Process
Phase I:
Focus
The Strategic Improvement Cycle
Phase II:
Standardization
Phase III:
Adherence
Phase IV:
Reflection
Phase I:
FocusOutside
Stakeholders
Top
Management
Business
Renewal Team
Vision1. Envision the
future
2. Analyze the vision
3. Revise the vision
4. Deploy the vision
Development plan
5. Conduct Corporate
Diagnosis
6. Review strategic
information
7. Define strategic keys
8. Produce
Development Plan
Focus Team Focus Team
1. Select theme
and set an overall
target
2. Define critical keys
3. Define critical
control points
4. Write proposed
deployment plans
5. Estimate financial
impacts
6. Summarize
Operators
and Staff
Focus TeamFocus TeamFocus Team
1. Organize
deployment teams
2. Announce
annual policy and
transmit
Deployment Plans
(After deploy-
ment teams finish
their first two
steps:)
3. Play catchball
4. Finalize budgets
5. Summarize
Deployment
Teams1. Collect, analyze,
evaluate data
2. Determine critical
checkpoints
3. Play catchball
4. Write Action Plans
Action Teams
1. Draw up
workcenter plans
2. Assign workteam
targets
3. Set personal targets
4. Apply reliable
methods
• Target/
Means
Diagram
• X-Type
Matrix
•Action
Plans
1. Complete Plan
Summary
2. Conduct Corporate
Diagnosis
• Create a visual
information system
• Maintain a reporting
system
• Support continuous
learning in the
workplace
Action Teams
Deployment
Teams
1. Create a monthly
analysis system
Middle
Management
Team
Leaders and
Supervisors
Documents
and
Forms
•Vision Statement
•Lean Management Scoreboard
•Lean Radar Chart
•Product/Mrkt. Matrix
•Key Factor Matrix
•Development Plan
•Target/Means Diagram
•X-Type Matrix
•Proposed Deployment
Plans
•Plan Summary (initial)
•Target/Means
Diagram
•X-Type Matrix
•Deployment
Plans
(confirmed)
•Plan Summary
(revised)
•Planning Sheets
•Control Boards
•Team Action Plans
•Monthly Planner
•Daily Planner
•Control Boards
•Daily and Monthly
Self-Reports
•Monthly
Analysis
•Periodic
Status
Reports
•Plan Summary
(completed)
•Scoreboard
•Radar Chart
•Analysis Summary
1. Collect information
2. Identify critical
performance gaps
3. Identify emergent
gaps and barriers
4. Analyze gaps
and barriers
5. Summarize
1. Select theme
and set an overall
target
2. Define critical
keys
3. Define critical
control points
4. Write proposed
deployment plans
5. Estimate
financial impacts
6. Summarize
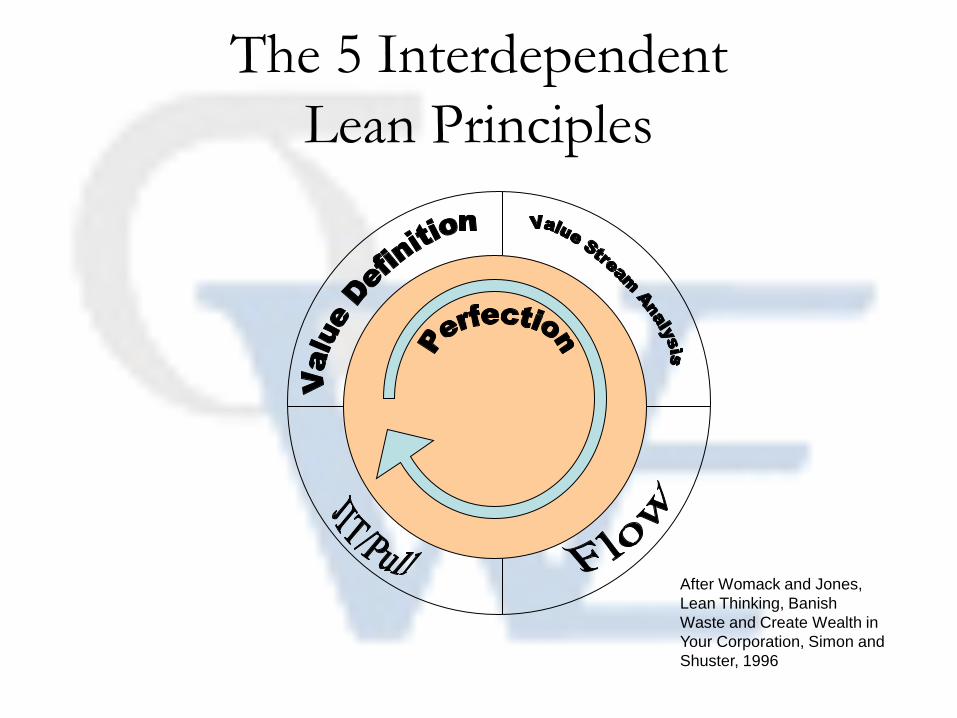
The 5 Interdependent
Lean Principles
After Womack and Jones,
Lean Thinking, Banish
Waste and Create Wealth in
Your Corporation, Simon and
Shuster, 1996

5 Key Elements of Lean5 Key Elements of Lean The 5 Interdependent
Lean Principles
After Womack and Jones,
Lean Thinking, Banish
Waste and Create Wealth in
Your Corporation, Simon and
Shuster, 1996
Value Value
Stream Flow Pull Perfection
Ensure WASTEdoes not creep back
into my VALUE
STREAM.
Determine what my Customer Values and what my Customer considers WASTE.
Ensure that only those
products and services that my customers immediately
want are FLOWINGthrough my VALUE
STREAM.
Determine the Steps I go through to
design, make, and/or deliver my product or service to my Customer and
where VALUEis created in these steps.
Reduce the WASTEand shorten the
cycle-time in the steps of my VALUESTREAM.
Tools and Techniques to Eliminate WasteTools and Techniques to Eliminate Waste
•Customer
Value
Definition
•Processing Mapping -
Cycle-Times Customer
Needs
•JIT - Work Cells
•PokaYoke -Visual Control
•TPM - Setup Reduction
•TTAKT -Batch Sizes of 1
•Kaizen -Empowerment
•Kanban•Customer
Value
Definition
•Processing Mapping -
Cycle-Times Customer
Needs
•JIT - Work Cells
•PokaYoke -Visual Control
•TPM - Setup Reduction
•TTAKT -Batch Sizes of 1
•Kaizen -Empowerment
•Kanban•Customer
Value
Definition
•Customer
Value
Definition
•Processing Mapping -
Cycle-Times Customer
Needs
•Processing Mapping -
Cycle-Times Customer
Needs
•JIT - Work Cells
•PokaYoke -Visual Control
•TPM - Setup Reduction
•TTAKT -Batch Sizes of 1
•JIT - Work Cells
•PokaYoke -Visual Control
•TPM - Setup Reduction
•TAKT -Batch Sizes of 1
•Kaizen -Empowerment•Kaizen -
Empowerment
•Kanban•Kanban
Stream Flow Pull PerfectionValue
Value Stream
Flow Pull Perfection
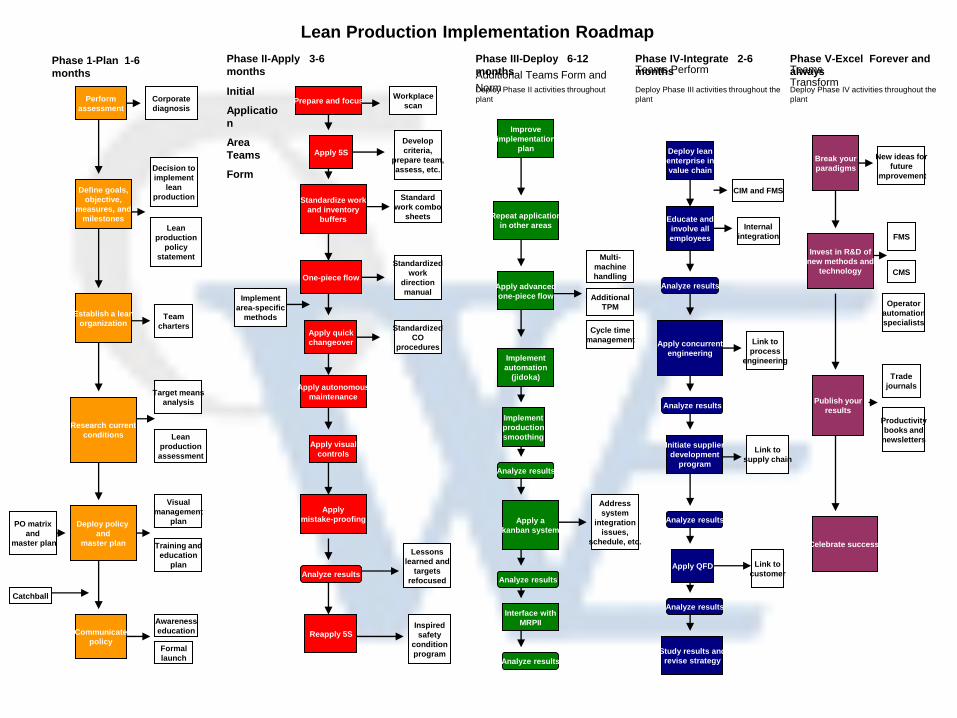
Lean Production Implementation Roadmap
Phase 1-Plan 1-6
months
Perform
assessment
Define goals,
objective,
measures, and
milestones
Establish a lean
organization
Research current
conditions
Deploy policy
and
master plan
Communicate
policy
PO matrix
and
master plan
Catchball
Corporate
diagnosis
Decision to
implement
lean
production
Lean
production
policy
statement
Team
charters
Target means
analysis
Lean
production
assessment
Visual
management
plan
Training and
education
plan
Awareness
education
Formal
launch
Phase II-Apply 3-6
months
Initial
Applicatio
n
Area
Teams
Form
Prepare and focus
Apply 5S
Standardize work
and inventory
buffers
One-piece flow
Apply quick
changeover
Apply autonomous
maintenance
Apply visual
controls
Apply
mistake-proofing
Reapply 5S
Implement
area-specific
methods
Workplace
scan
Develop
criteria,
prepare team,
assess, etc.
Standard
work combo
sheets
Standardized
work
direction
manual
Standardized
CO
procedures
Lessons
learned and
targets
refocused
Inspired
safety
condition
program
Phase III-Deploy 6-12
monthsAdditional Teams Form and
NormDeploy Phase II activities throughout
plant
Improve
implementation
plan
Repeat application
in other areas
Apply advanced
one-piece flow
Implement
automation
(jidoka)
Implement
production
smoothing
Apply a
kanban system
Analyze results
Analyze results
Interface with
MRPII
Analyze results
Multi-
machine
handling
Additional
TPM
Cycle time
management
Address
system
integration
issues,
schedule, etc.
Phase IV-Integrate 2-6
monthsTeams Perform
Deploy Phase III activities throughout the
plant
Deploy lean
enterprise in
value chain
Educate and
involve all
employees
Analyze results
Analyze results
Apply concurrent
engineering
Analyze results
Initiate supplier
development
program
Analyze results
Apply QFD
Analyze results
Study results and
revise strategy
CIM and FMS
Internal
integration
Link to
process
engineering
Link to
supply chain
Link to
customer
Phase V-Excel Forever and
alwaysTeams
TransformDeploy Phase IV activities throughout the
plant
Break your
paradigms
New ideas for
future
improvement
Invest in R&D of
new methods and
technology
FMS
CMS
Operator
automation
specialists
Publish your
results
Trade
journals
Productivity
books and
newsletters
Celebrate success!

Transition-To-Lean Roadmap
Prepare
• Select initial
implementation
scope
• Define
customer
• Define value -
Quality,
Schedule, and
Target Cost
• Record current
state value
stream
• Chart product
and
information
flow
• Chart operator
movement
• Chart tool
movement
• Collect
baseline data
• Standardize
operations
• Mistake proof
processes
• Achieve process
control
• Implement TPM
• Implement self-
inspection
• Eliminate/
reduce waste
• Cross train
workforce
• Reduce set-up
times
• Implement cell
layout
• Implement visual
controls
• Select
appropriate
production
system control
mechanism
• Strive for single
item flow
• Level and
balance
production flow
• Link with
suppliers
• Draw down
inventories
• Reassign people
• Re-deploy/
dispose assets
Define
Value
Identify
Value Stream Implement FlowImplement Total
System Pull
IMPROVED
COMPETITIVE
POSITION
• Develop a future
state value
stream map
• Identify takt time
requirements
• Review
make/buy
decisions
• Plan new layout
• Integrate
suppliers
• Design visual
control system
• Estimate and
justify costs
• Plan TPM
system
Design
Production System
ENTRY
• Integrate with
Enterprise Level
• Establish an
Operations
Lean
Implementation
Team(s)
• Develop
implementation
strategy
• Develop a plan
to address
workforce
changes
• Address Site
Specific Cultural
Issues
• Train key
people
• Establish target
objectives
(metrics)
• Build vision
• Establish need
• Foster lean
learning
• Make the
commitment
• Obtain Sr.
Mgmt. buy-in
Phase 5 Phase 6Phase 1 Phase 2 Phase 3 Phase 4Phase 0
Adopt Lean
Paradigm
Phase 7
Strive for Perfection
Expand
Internally/Externally
Enterprise / Production System Interface
• Financial
• Information
• Quality
• Safety
• Training and Human Resources
• Workforce/Management Partnership
+
• Institutionalize 5S
• Institute Kaizen events
• Remove system barriers
• Expand TPM
• Evaluate against
target metrics
• Evaluate progress
using lean maturity
matrices
• Team development
• Optimize quality
Top
LeadershipLean
Roadmap
Supply Chain/External Environment• Legal
• Environmental
Commitment
• Procurement
• Engineering
• Government Reqd. Systems
(MMAS, EVMS, etc.)
+
+
++

The Transition to a Lean Enterprise...
…Is Tightly Integrated Into the Formal Planning Cycle
Lean Enterprise Planning Strategic/Business Planning
Results
Long Range
Plan
Business
Plan
Performance
Mgt Process
+
++
Enterprise RoadmapEntry
• Build Vision
• Establish Need
• Foster Lean
Learning
• Make the
Commitment
• Obtain Senior
Mgmt Buy-in
Adopt Lean
Paradigm
Decision to
Pursue
Enterprise
Transformation
• Map Value Stream
• Internalize Vision
• Set Goals & Metrics
• Identify & Involve
Key Stakeholders
Focus on the
Value Stream
• Organize for Lean
Implementation
• Identify & Empower Change
Agents
• Align Incentives
• Adapt Structure & Systems
Develop Lean Structure &
Behavior
Initial
Lean
Vision
Detailed
Lean
Vision
++
Short Term CycleEnvironmentalCorrective
Action IndicatorsDetailed
Corrective
Action
Indicators
Lean
Implementation
Framework
• Monitor Lean Progress
• Nurture the Process
• Refine the Plan
• Capture & Adopt New
Knowledge
Focus on Continuous
Improvement
Outcomes on
Enterprise
Metrics• Develop Detail Plans
• Implement Lean Activities
Implement Lean InitiativesEnterprise
Level
Implementation
Plan
• Identify & Prioritize Activities
• Commit Resources
• Provide Education & Training
Provide Enterprise
Level Focus
+
Long Term Cycle
Enterprise
Strategic
Planning
Lean Practices Lean Measures

Process Management Overview
Mobilization and Deployment
⚫ Who are the customers?
⚫ What are our products and
services?
⚫ What are the requirements?
⚫ What is the process map?
⚫ How is our process
performing?
⚫Does the standardized process
continuously perform as expected?
⚫What action is warranted by careful
checking of process data?
◼ Continue with the next SDCA
◼ Initiate PDCA to find and
remove root cause of special
variability
⚫What actions are needed to
improve my process?
⚫ Identify the largest source of
variation in standard process.
⚫ Find and eliminate a root cause
of variation.
⚫Define new standard process.
PROCESS
CONTROL
ASSESSING PROCESS
PERFORMANCE
*
*
PROCESS
DISCOVERY
UNDERSTAND THE
CUSTOMER AND THE
PROCESS
REACTIVE
IMPROVEMENT
1. Theme selection
2. Data collection & analysis
3. Causal analysis
4. Solution planning &
implementation
5. Evaluation of effects
6. Standardization
7. Reflection and next
problem
7 STEPS / Q.I.T.
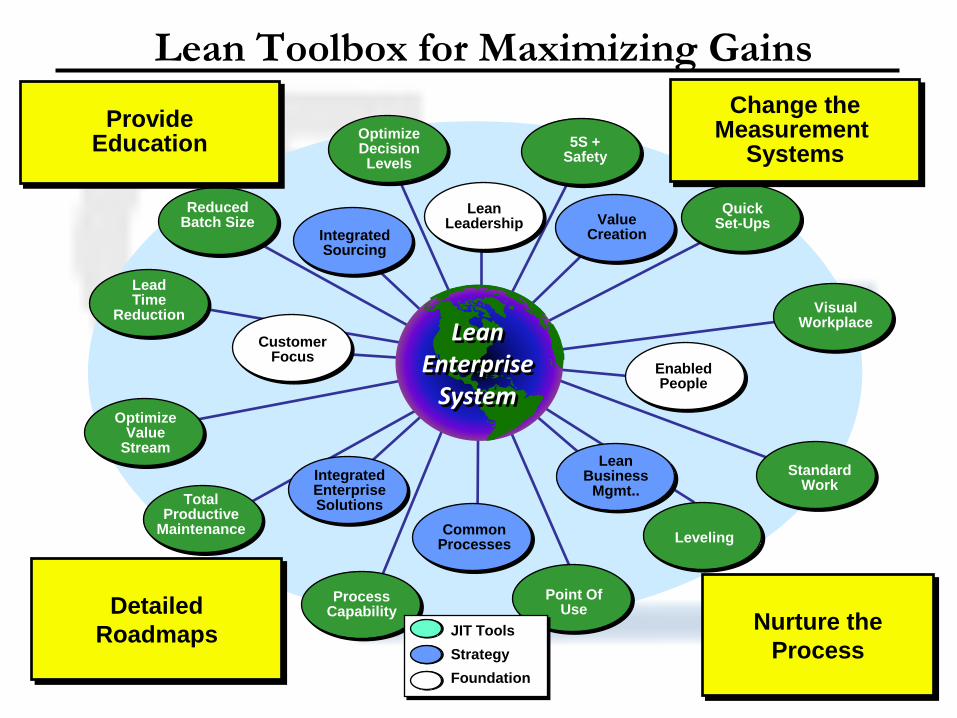
Point Of Use
5S + Safety
Quick Set-Ups
Visual Workplace
Leveling
LeadTime
Reduction
Standard Work
Reduced Batch Size
Total Productive
Maintenance
Integrated Sourcing
OptimizeValue
Stream
Enabled People
LeanLeadership
Optimize Decision Levels
Common Processes
Process Capability
Customer Focus
Integrated Enterprise Solutions
ValueCreation
Lean Business
Mgmt..
JIT Tools
Strategy
Foundation
Detailed
Roadmaps
Change theMeasurement
Systems
ProvideEducation
Nurture the
Process
Lean Enterprise
System
Lean Toolbox for Maximizing Gains

Lean & Six Sigma Integration Specialistswww.wyrickenterprises.com [email protected]

• High Performance Teams
– Empowerment Chartered
– Line-Of-Sight
– Cross-Trained
• 5S
– Sort, Shine, Standardize
– Stabilize, Sustain
• Visual Controls
• Team Scoreboards
– Safety, Cycle Time
– Quality, Cost
– Customer[s] Satisfaction
• Pull - Demand Based
• Sequential Flow Without Queues
• One Piece/Small Batch Flow
• Mixed Rate Scheduling
• Rapid Set-Up
• Mistake Proofing
• Statistical Control Methodologies
• Point Of Use Inventory
• Work Standardization
• TAKT Time
• VOC/Value Migration
• Supply Base Integration
Tools That Are Proven To Deliver Value
LEAN
Lean… A Strategy And Way Of Thinking

• Waste Elimination
• Work Concentration
• Flow
• At the Pull Of The Customer
• CI
• Variation Reduction
• Scrap / Rework Elimination
• Process Control
• CI
Speed Accuracy = Performance+
Lean Six Sigma
{
Focused Prioritization To Optimize Results
• Lean Exposes NVA/VA And Makes Value Added Flow
• Six Sigma Reduces Variation Of Value Added
Lean + Six Sigma . . . a Powerful Marriage
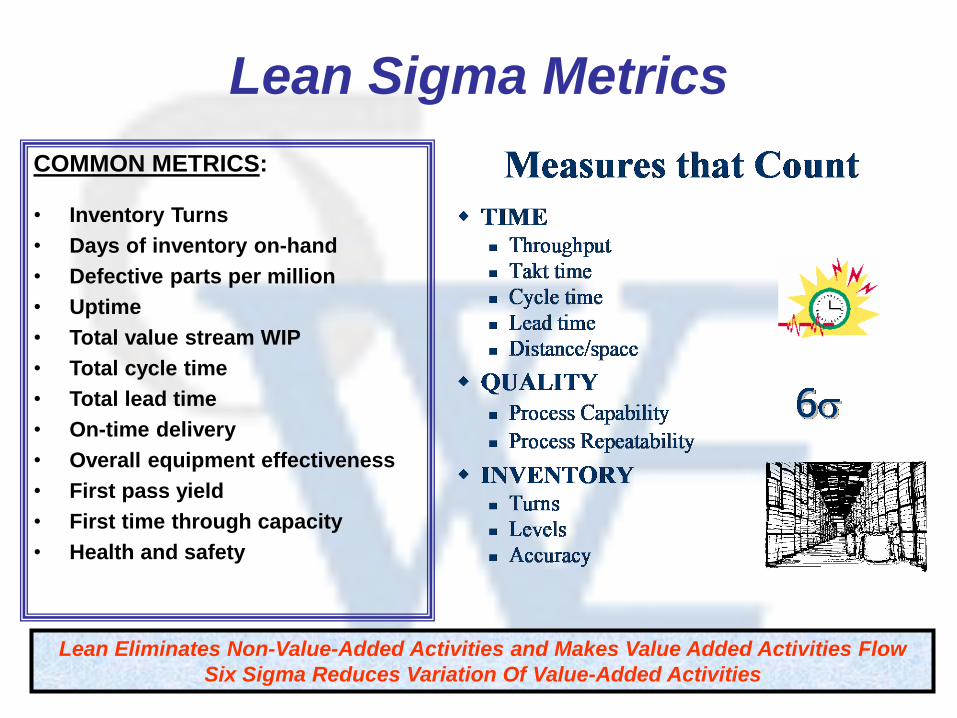
Lean Sigma Metrics
COMMON METRICS:
• Inventory Turns
• Days of inventory on-hand
• Defective parts per million
• Uptime
• Total value stream WIP
• Total cycle time
• Total lead time
• On-time delivery
• Overall equipment effectiveness
• First pass yield
• First time through capacity
• Health and safety
Lean Eliminates Non-Value-Added Activities and Makes Value Added Activities Flow
Six Sigma Reduces Variation Of Value-Added Activities

Major CPI
Tools (6) Lean Description
Cp/Cpk Process capability assessmentDOE √ Design of experiments
SPC Process control based on statistics and data analysisFMEA √ Risk assessment tool
Regression Correlate effect one variable has on anotherProcess Map √ √ Map process steps to communicate and identify opportunities
5 whys /2 hows Determination methods for root cause discoveryPareto √ √ Column chart ranking items highest to lowest
Fishbone Cause / Effect Diagram
5S Elimination wasteVisual Mgmt √ √ Emphasis on visual techniques to manage process
Poka-Yoke √ Error proofing techniques
Spaghetti Chart √ Time, distance, space and movement analysis
Kanban √ Material storage technique used to control process
Takt Time √ Determine pace or beat of a process
Std Work Evaluate tasks done during a process
SMED Single minute exchange of dies - Quick machine set upTPM √ Integrate maintenance strategy with process
Cellular Flow Reduce inventory & cycle time thru process layout and pull
production techniques
The process and desired end-result will determine which tools to use
Integrating Lean & Six Sigma Tools
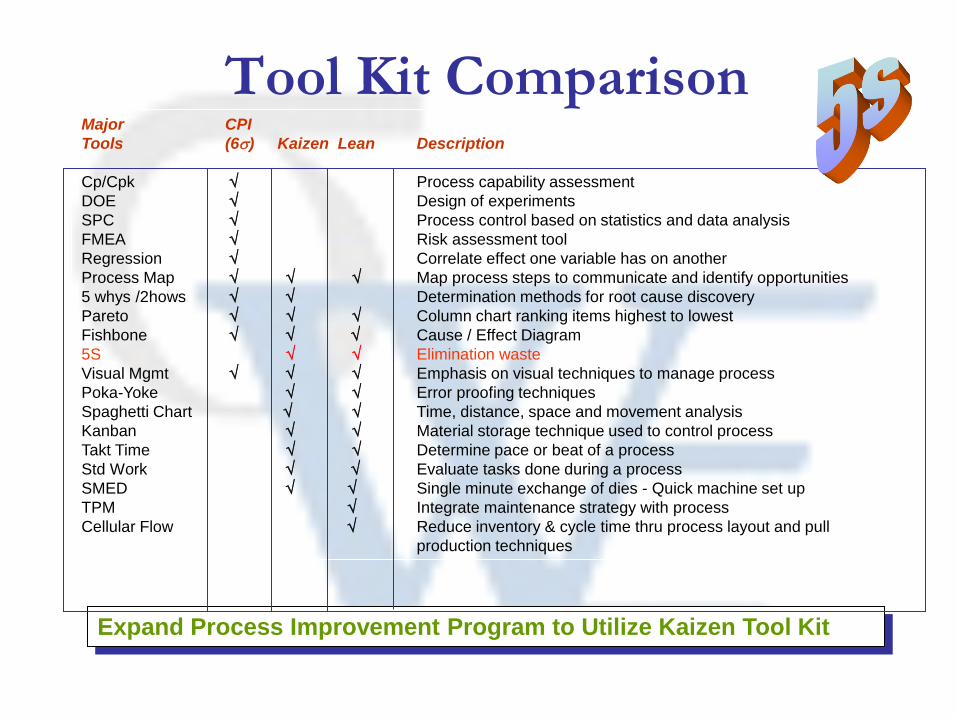
Major CPI
Tools (6) Kaizen Lean Description
Cp/Cpk Process capability assessment
DOE Design of experiments
SPC Process control based on statistics and data analysis
FMEA Risk assessment tool
Regression Correlate effect one variable has on another
Process Map Map process steps to communicate and identify opportunities
5 whys /2hows Determination methods for root cause discovery
Pareto Column chart ranking items highest to lowest
Fishbone Cause / Effect Diagram
5S Elimination waste
Visual Mgmt Emphasis on visual techniques to manage process
Poka-Yoke Error proofing techniques
Spaghetti Chart Time, distance, space and movement analysis
Kanban Material storage technique used to control process
Takt Time Determine pace or beat of a process
Std Work Evaluate tasks done during a process
SMED Single minute exchange of dies - Quick machine set up
TPM Integrate maintenance strategy with process
Cellular Flow Reduce inventory & cycle time thru process layout and pull
production techniques
Expand Process Improvement Program to Utilize Kaizen Tool Kit
Tool Kit Comparison

Lean & Six Sigma Integration Specialistswww.wyrickenterprises.com [email protected]

$
A Transition
We had a Threat — and responded to negate the threat
We saw the Opportunity — and are responding to the opportunity
We now have an Obligation —as leaders we do not have a choice
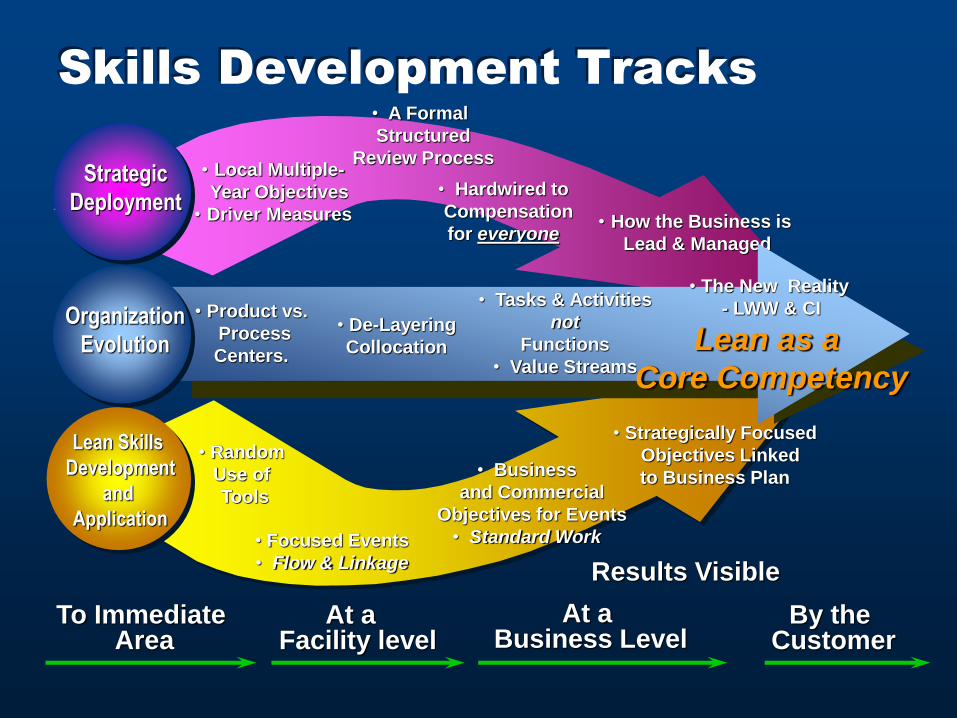
• Business
and Commercial
Objectives for Events
• Standard Work
• A Formal
Structured
Review Process• Local Multiple-
Year Objectives
• Driver Measures • How the Business is
Lead & Managed
• Focused Events
• Flow & Linkage
• Random
Use of
Tools
• Product vs.
Process
Centers.
• De-Layering
Collocation
• The New Reality
- LWW & CI
Lean as a
Core Competency
Lean Skills
Development
and
Application
Organization
Evolution
Strategic
Deployment• Hardwired to
Compensation
for everyone
• Tasks & Activities
not
Functions
• Value Streams
• Strategically Focused
Objectives Linked
to Business Plan
Results Visible
To Immediate Area
By the Customer
At a Business Level
At a Facility level
Skills Development Tracks

Lean & Six Sigma Integration Specialistswww.wyrickenterprises.com [email protected]

Lean & Six Sigma Integration Specialistswww.wyrickenterprises.com [email protected]

Lean & Six Sigma Integration Specialistswww.wyrickenterprises.com [email protected]

Lean & Six Sigma Integration Specialistswww.wyrickenterprises.com [email protected]

Module # 7 Goal = 70 Units
THRUPUT = 68 The Process: Production: MATERIAL
Inventory - 4 units Thruput: 68 units produced
COST = 294 Transfer Batch - 1 unit (Minimum)
Material Movement - “During Shift” Overtime: No Option
LABOR = 200 Low Process Variability Labor: Everyone worked = 200
WIP Variable -WIP: 35 units left in the system
Work In Process = 35
· Reduced variation dice (2-5). Overhead: 1/3 of 200 = 67
OVERHEAD = 67
Learning’s - Material Cost: Thruput 68 x 4.32 = 294
TOTAL COST = 596
1. With a reduction in variation within the Total Cost: 294 + 200 + 35 + 67 = 596
UNIT COST = 8.76 process product flows more evenly.
1. More thruput due to reduction in Unit Cost: 596 ÷ 68 = 8.64
LEAD TIME = 11 days variation.
1. Smaller piles of inventory in
front of everyone during the
round.
Lead Time: 11 Days

Lean & Six Sigma Integration Specialistswww.wyrickenterprises.com [email protected]

THE "GOING BACK TO ZERO" RULE
The Paradigm Shift Question
What today is impossible to do in
your business, but if it could be
done would fundamentally change
what you do?
When a paradigm shifts "everyone goes
back to zero". It doesn't matter how big
your market share is or how strong your
reputation or how good you are at the
Old Paradigm; with the New Paradigm
you go back to zero. "Your past
successes guarantees nothing".

Lean Management Systems
The Four Phases of Hoshin (Strategic) Management
P D C
Environment
Changes
Diagnosing the Step
Function Goal
(by President)
A
Long-Term
Vision and Plan
Company's
Mid-Term Plan
Annual
Step
Function
Goal
Monitoring
the Step
Function Goal
Deploying
the Step
Function Goal
Phase II: Deploying the Hoshin Phase III: Monitoring the Hoshin
Phase IV: Diagnosing
the Hoshin
Phase I: Setting the Hoshin
P D C
Environment
Changes
Diagnosing the Step
Function Goal
(by President)
AA
Long-Term
Vision and Plan
Company's
Mid-Term Plan
Annual
Step
Function
Goal
Monitoring
the Step
Function Goal
Deploying
the Step
Function Goal
Phase II: Deploying the Hoshin Phase III: Monitoring the Hoshin
Phase IV: Diagnosing
the Hoshin
Phase I: Setting the Hoshin
WHAT
Deploy Annual Objectives
RESOURCES
3-5 YEAR
BREAKTHROUGHOBJECTIVES
ANNUAL
OBJECTIVES
TARGET
TO
IMPROVE
BENEFITS
Top Level Strategic Deployment Matrix
Strategic Deployment
WHAT
HOW
WHOWHAT HOW MUCH
Cascade Annual
Objectives
2nd Level Matrix
3rd Level Matrix
Strategic Deployment
1. Establish Organizational Vision
3. Develop Annual Objectives
4. Deploy Annual Objectives
5. Implement Annual Objectives
6. Monthly Review Process
7. Annual Review Process
7 Step Strategic Deployment Process:
Self
Diagnosis
Catchball
Strategic Planning: Develop 3-5 Year Breakthrough Objectives
2.
LMS Tools
PD
C A
WHAT
Deploy Annual Objectives
RESOURCES
3-5 YEAR
BREAKTHROUGHOBJECTIVES
ANNUAL
OBJECTIVES
TARGET
TO
IMPROVE
BENEFITS
Top Level Strategic Deployment Matrix
Strategic Deployment
WHAT
HOW
WHOWHAT HOW MUCH
Cascade Annual
Objectives
2nd Level Matrix
3rd Level Matrix
CASUAL ANALYSIS OF STRATEGIC GAPSCASUAL ANALYSIS OF STRATEGIC GAPS
Tar
get
actu
al
Tar
get
actu
al
Tar
get
actu
al
Tar
get
actu
al
Tar
get
actu
al
Tar
get
actu
al
Tar
get
actu
al
Tar
get
actu
al
Tar
get
actu
al
Tar
get
actu
al
Tar
get
actu
al
Performance Status
Post-it™
Header
cards
Strategic Gap Focus Team
Gap Statement Suggested Target
Lean Management Systems
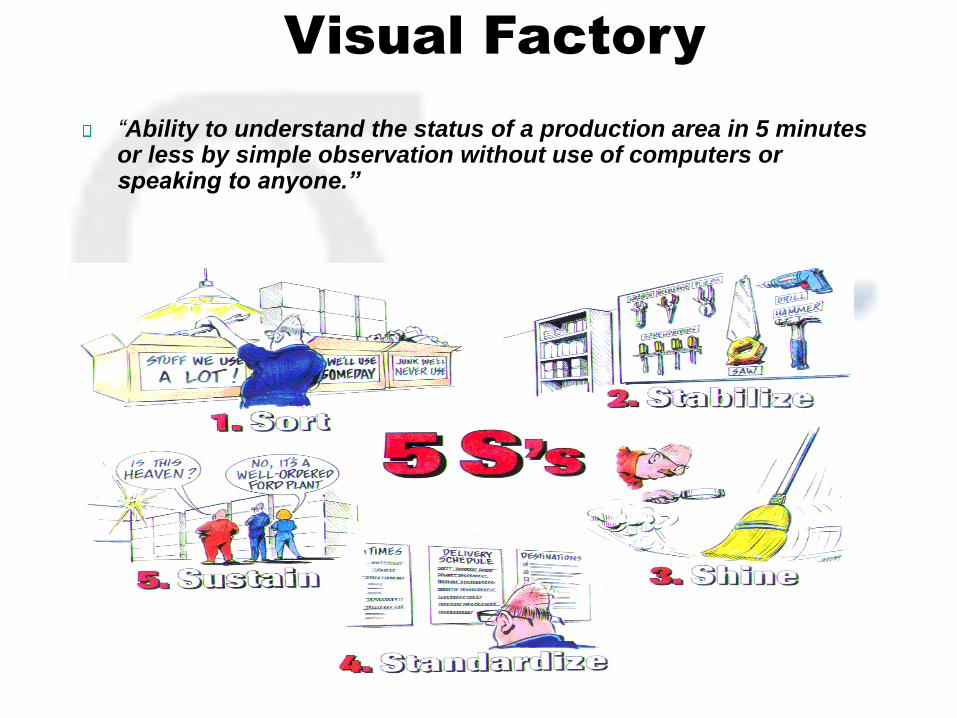
“Ability to understand the status of a production area in 5 minutes or less by simple observation without use of computers or speaking to anyone.”
Visual Factory
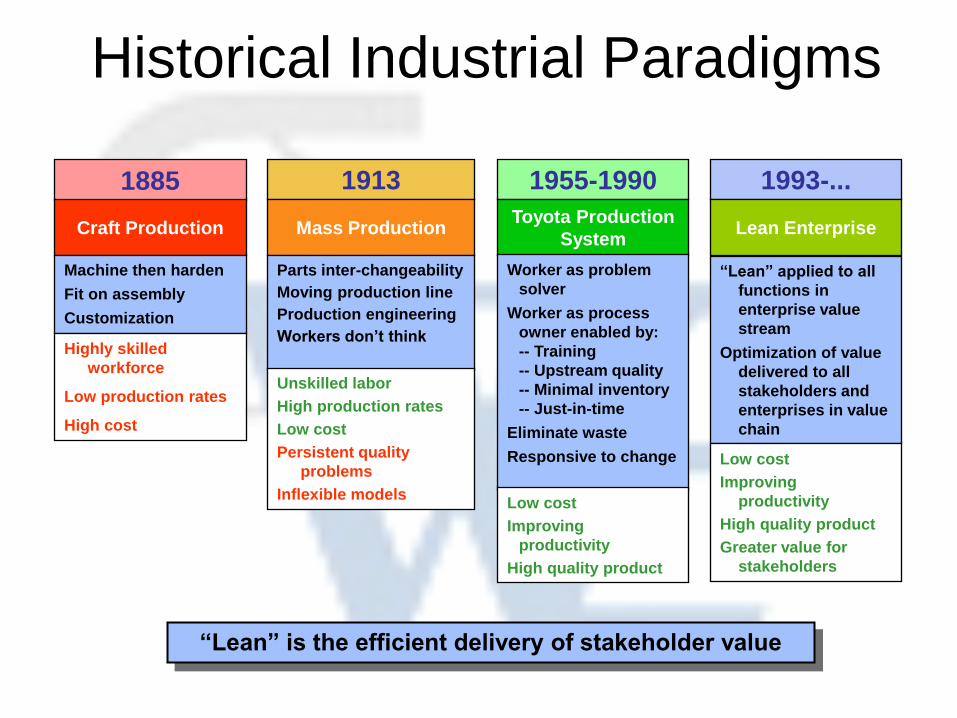
Historical Industrial Paradigms
1885
Craft Production
Machine then harden
Fit on assembly
Customization
Highly skilled
workforce
Low production rates
High cost
1913
Mass Production
Parts inter-changeability
Moving production line
Production engineering
Workers don’t think
Unskilled labor
High production rates
Low cost
Persistent quality
problems
Inflexible models
1955-1990
Toyota Production
System
Worker as problem
solver
Worker as process
owner enabled by:
-- Training
-- Upstream quality
-- Minimal inventory
-- Just-in-time
Eliminate waste
Responsive to change
Low cost
Improving
productivity
High quality product
“Lean” is the efficient delivery of stakeholder value
1993-...
Lean Enterprise
“Lean” applied to all
functions in
enterprise value
stream
Optimization of value
delivered to all
stakeholders and
enterprises in value
chain
Low cost
Improving
productivity
High quality product
Greater value for
stakeholders
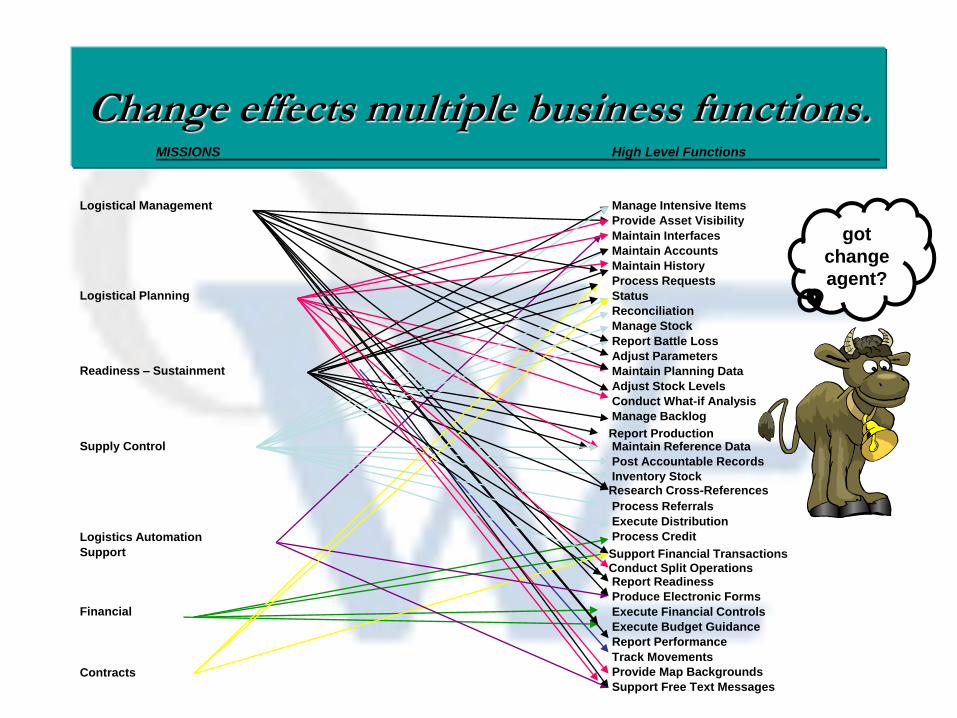
Change effects multiple business functions.MISSIONS High Level Functions
Manage Intensive Items
Provide Asset Visibility
Maintain Interfaces
Maintain Accounts
Maintain History
Process Requests
Status
Reconciliation
Manage Stock
Report Battle Loss
Adjust Parameters
Maintain Planning Data
Adjust Stock Levels
Conduct What-if Analysis
Manage Backlog
Report ProductionMaintain Reference Data
Post Accountable Records
Inventory StockResearch Cross-References
Process Referrals
Execute Distribution
Process Credit
Support Financial Transactions
Conduct Split OperationsReport Readiness
Produce Electronic Forms
Execute Financial Controls
Execute Budget Guidance
Report Performance
Track Movements
Logistical Management
Logistical Planning
Readiness – Sustainment
Supply Control
Logistics Automation
Support
Financial
Contracts Provide Map Backgrounds
Support Free Text Messages
got
change
agent?