Ohio Department Public Safety - LeanOhio | Kaizen, Lean and Six

Lean at the Department of Public Health
Presentation to the San Francisco Health Commission
Joanna Omi and Craig Vercruysse, Rona Consulting Group
City and County of San Francisco
DEPARTMENT OF PUBLIC HEALTH
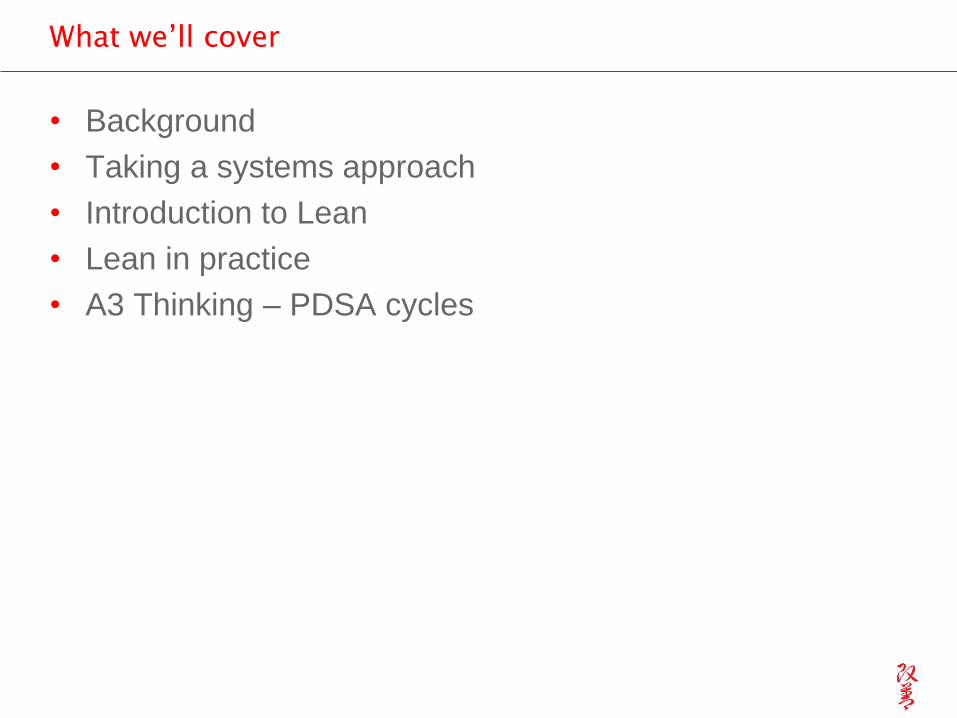
What we’ll cover
• Background
• Taking a systems approach
• Introduction to Lean
• Lean in practice
• A3 Thinking – PDSA cycles

Background
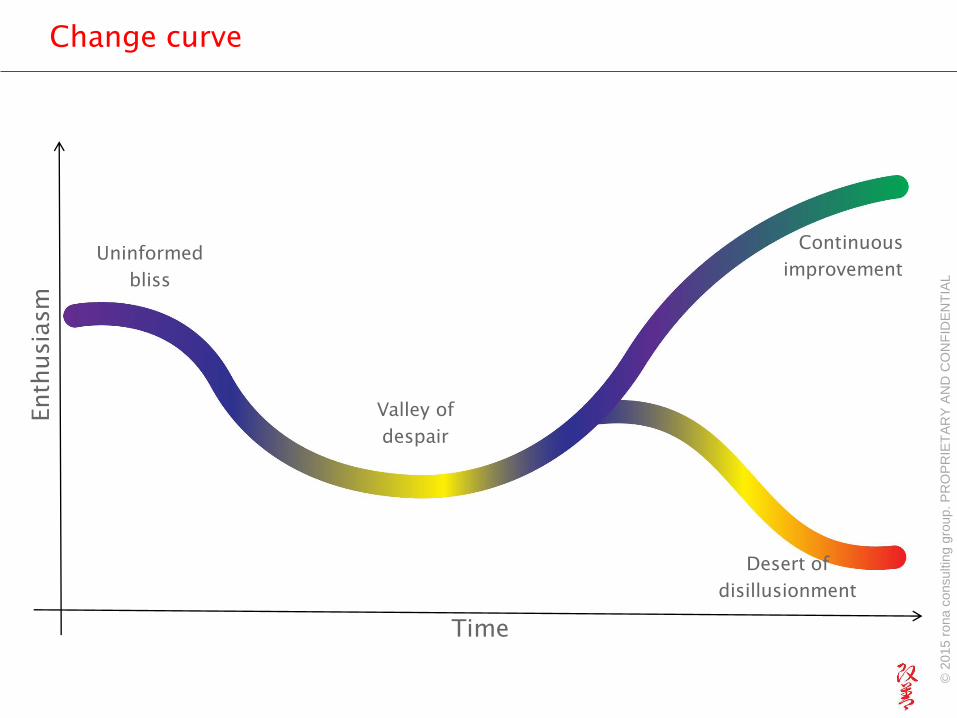
Change curveEnthusiasm
Time
Uninformed
bliss
Valley of
despair
Continuous
improvement
Desert of
disillusionment
© 2
015 r
ona c
onsultin
g g
roup. P
RO
PR
IET
AR
Y A
ND
CO
NF
IDE
NT
IAL

Executive leaders commit to an approach
5
If it were easy it would already be done
A compelling case for change
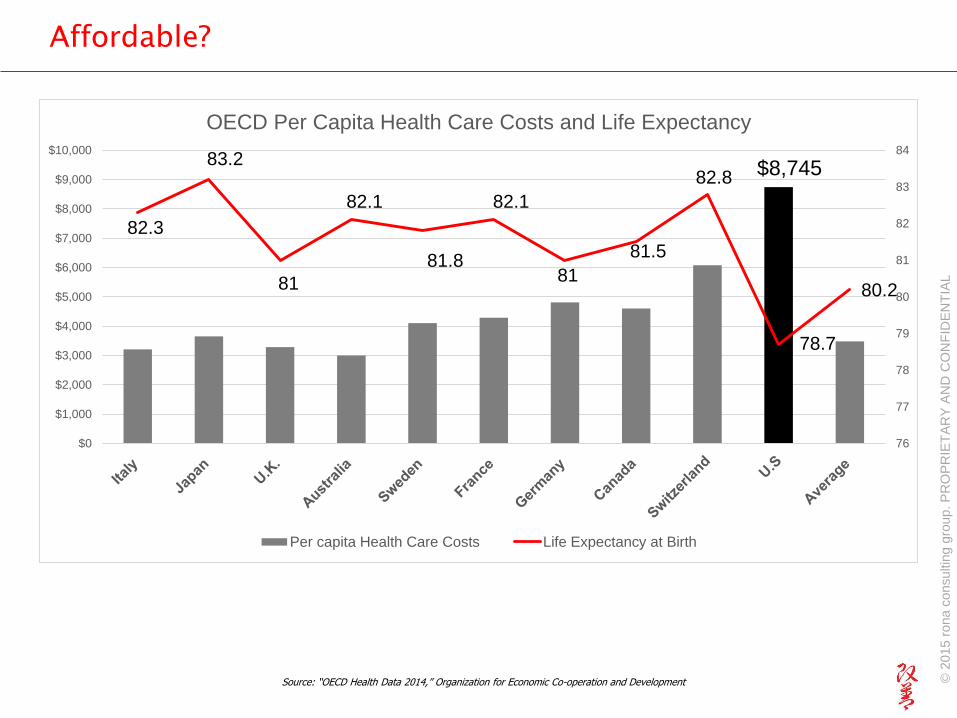
Affordable?
$8,745
82.3
83.2
81
82.1
81.8
82.1
81
81.5
82.8
78.7
80.2
76
77
78
79
80
81
82
83
84
$0
$1,000
$2,000
$3,000
$4,000
$5,000
$6,000
$7,000
$8,000
$9,000
$10,000
OECD Per Capita Health Care Costs and Life Expectancy
Per capita Health Care Costs Life Expectancy at Birth
Source: “OECD Health Data 2014,” Organization for Economic Co-operation and Development © 2
015 r
ona c
onsultin
g g
roup. P
RO
PR
IET
AR
Y A
ND
CO
NF
IDE
NT
IAL
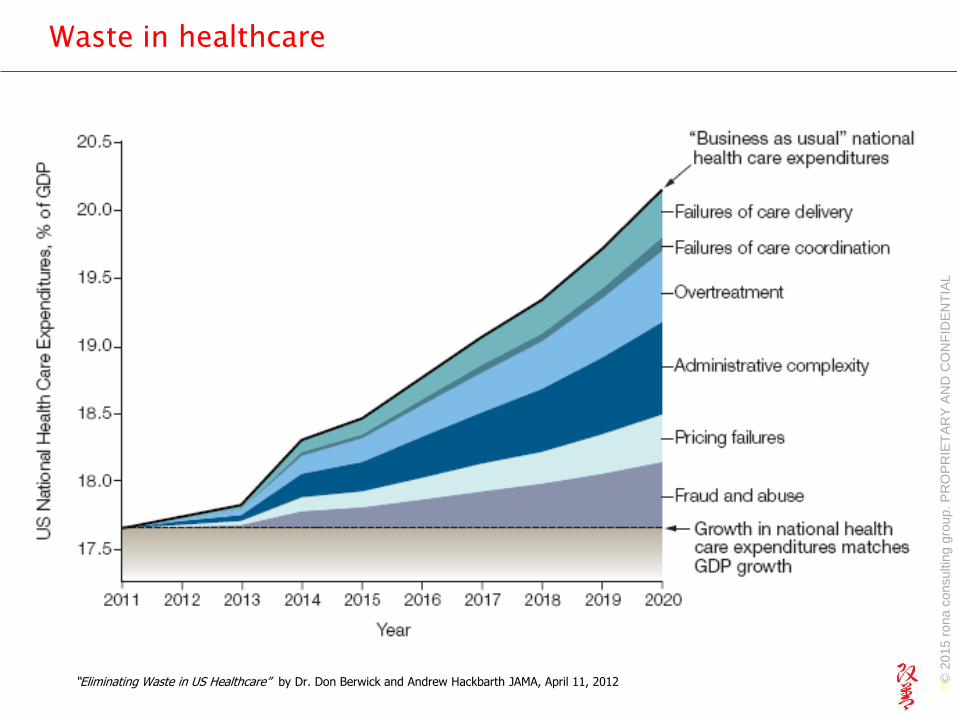
Waste in healthcare
8“Eliminating Waste in US Healthcare” by Dr. Don Berwick and Andrew Hackbarth JAMA, April 11, 2012 © 2
015 r
ona c
onsultin
g g
roup. P
RO
PR
IET
AR
Y A
ND
CO
NF
IDE
NT
IAL
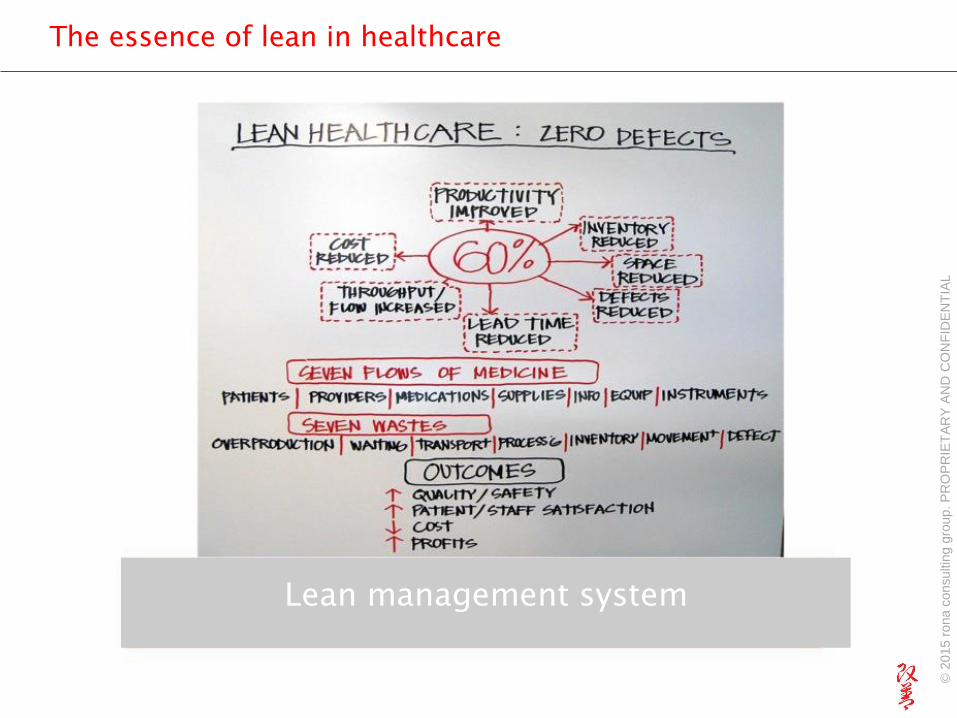
The essence of lean in healthcare
Lean management system
© 2
015 r
ona c
onsultin
g g
roup. P
RO
PR
IET
AR
Y A
ND
CO
NF
IDE
NT
IAL
Taiichi Ohno
“You should submit
wisdom to the company.
If you don’t have any
wisdom to contribute,
submit sweat.
If nothing else, work hard
and don’t sleep.
Or resign.”
Used with permission of John Black and Associates
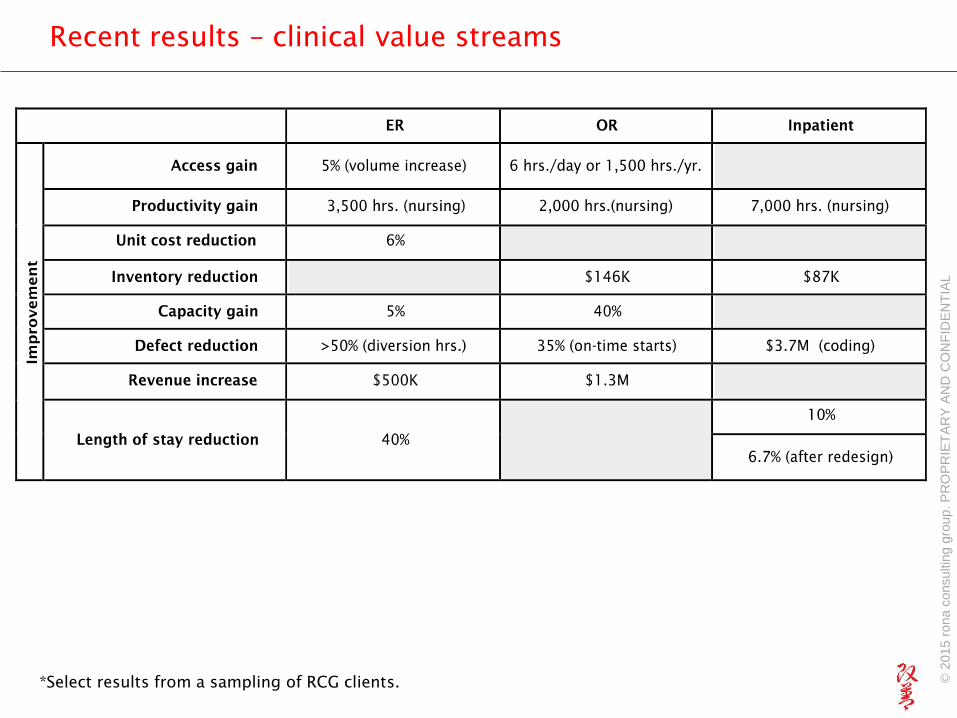
Recent results – clinical value streams
*Select results from a sampling of RCG clients. © 2
015 r
ona c
onsultin
g g
roup. P
RO
PR
IET
AR
Y A
ND
CO
NF
IDE
NT
IAL
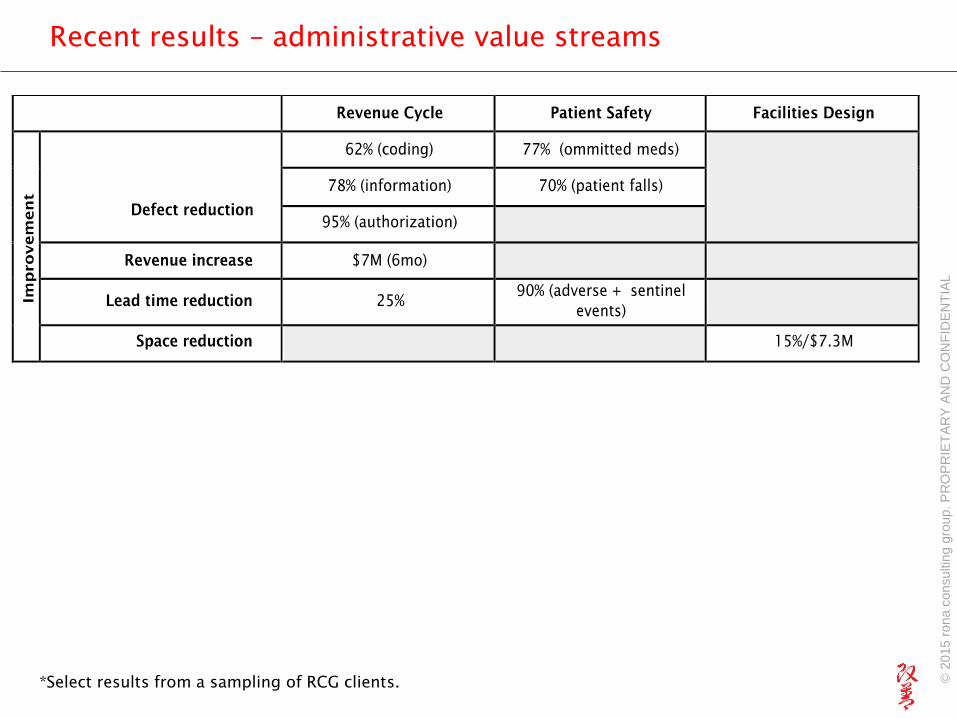
Recent results – administrative value streams
*Select results from a sampling of RCG clients. © 2
015 r
ona c
onsultin
g g
roup. P
RO
PR
IET
AR
Y A
ND
CO
NF
IDE
NT
IAL
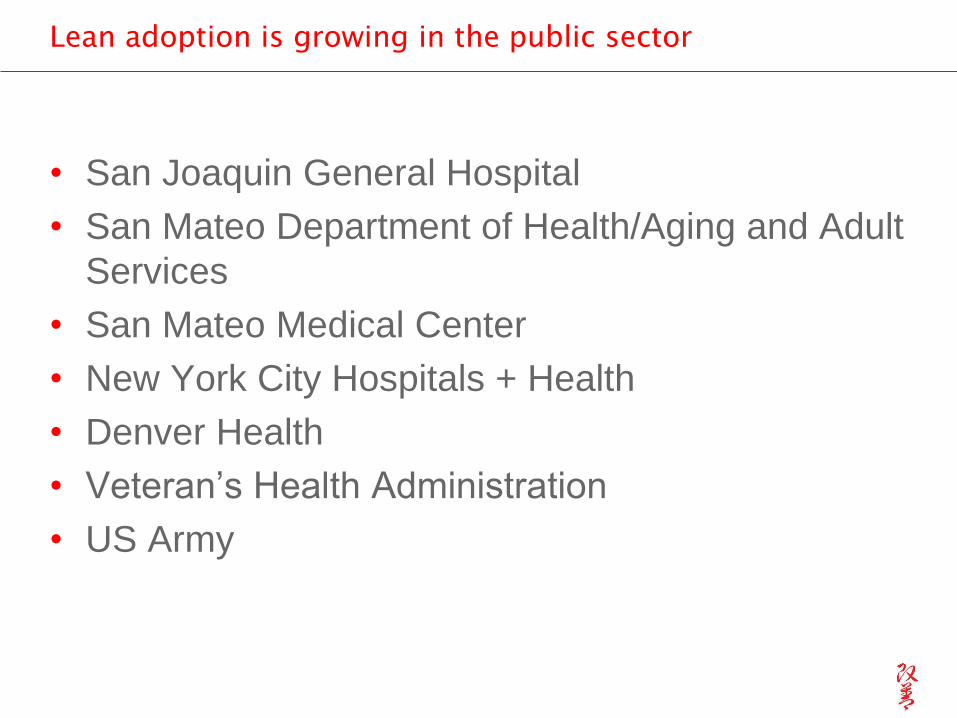
Lean adoption is growing in the public sector
• San Joaquin General Hospital
• San Mateo Department of Health/Aging and Adult
Services
• San Mateo Medical Center
• New York City Hospitals + Health
• Denver Health
• Veteran’s Health Administration
• US Army
Systemic Approach
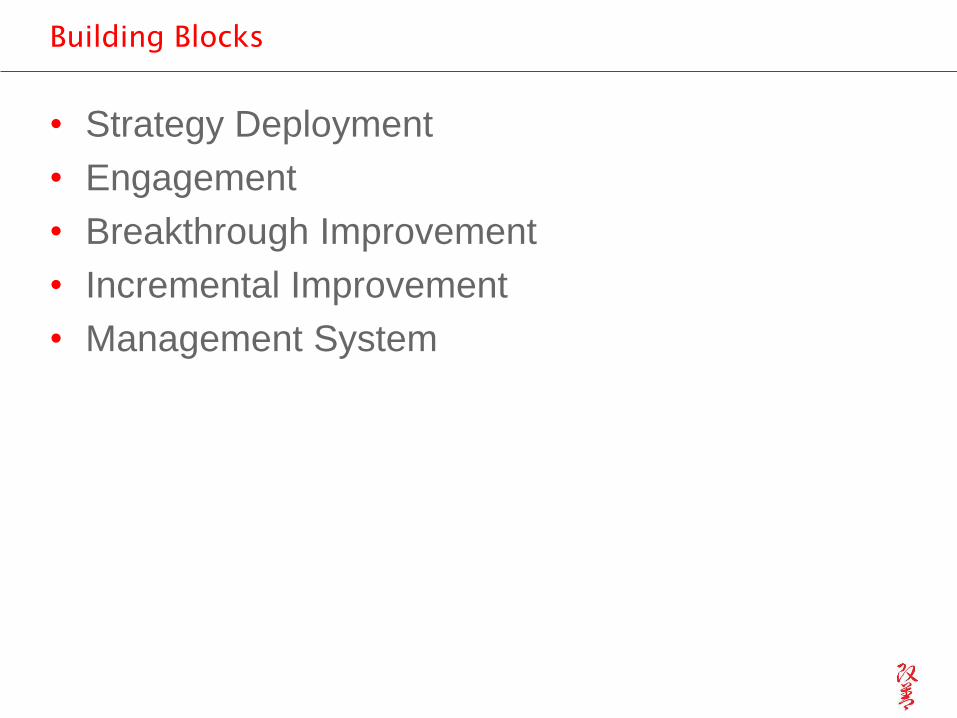
Building Blocks
• Strategy Deployment
• Engagement
• Breakthrough Improvement
• Incremental Improvement
• Management System
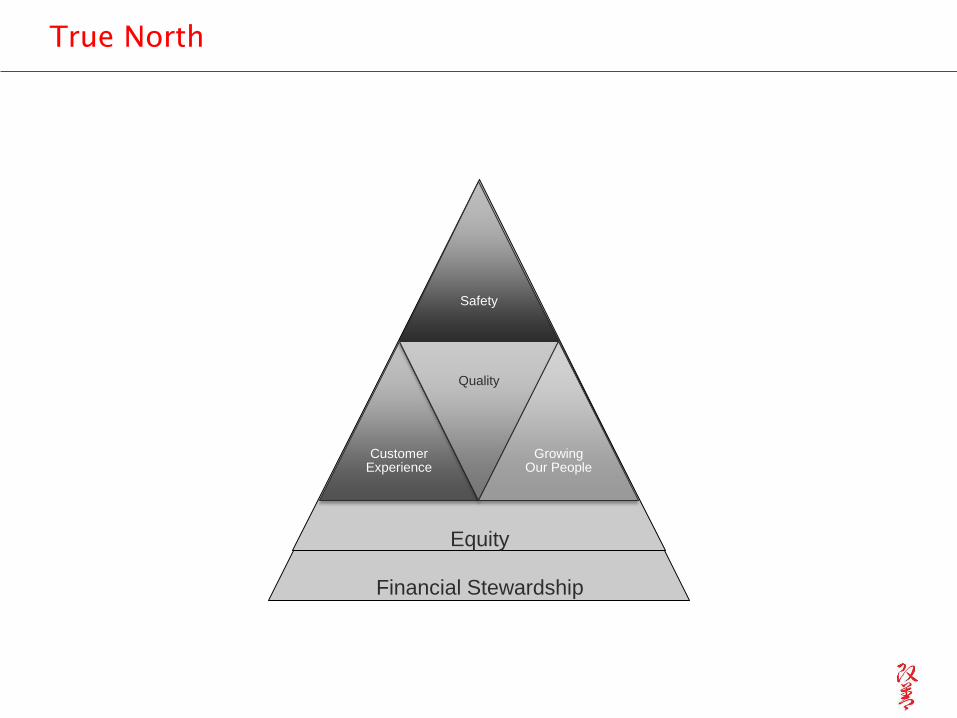
True North
Safety
Customer Experience
Quality
Growing Our People
Financial Stewardship
Equity
6
5
4
3
2
1
6 5 4 3 2 1
1
2
3
4F
: M
eet
the M
eanin
gfu
l U
se f
inancia
l ta
rget
F:
Genera
te $
95m
in n
ew
revenue a
nd r
ecurr
ing s
avin
gs f
rom
Bre
akth
rough a
ctivity (
inclu
des $
20m
rela
ted t
o s
urg
ical serv
ices)
F:
Achie
ve $
168.8
m in n
ew
revenue/c
ost
savin
gs c
onta
ined in t
he F
Y13 A
dopte
d F
inancia
l P
lan f
or
Cost
Conta
inm
ent
and R
estr
ucuring I
nititiv
es
T/D
: D
ecre
ase m
ed/s
urg
ALO
S b
y 5
%
G/C
: In
cre
ase M
+ M
edic
are
enro
llment
by 1
00%
T/D
: Im
pro
ve o
utp
atient
CA
PS
access s
core
by 1
0%
HD
: I
ncre
ase e
ngagem
ent
in J
ust
Culture
by 2
0%
Achieve the Triple Aim (better care, better health, lower cost) while maintaining our mission.
Establish and achieve designation as an ACO with an initial patient cohort
Reduce nosocomial infection rates below national benchmarks
Restructure and align services to optimize cost-efficient, needed capacity, increase patient
satisfaction and reduce the deficit
Q:
Reduce C
LA
BS
I ra
tes b
y 1
5%
Successfu
lly e
xecute
the c
ost
conta
inm
ent,
restr
uctu
ring a
nd m
eanin
gfu
l use p
lans
Ensure
susta
inabili
ty a
nd s
pre
ad o
f B
reakth
rough im
pro
vem
ents
Reduce n
on-v
alu
e a
dded f
acili
ty a
nd s
yste
m v
ariation
Cre
ate
the f
oundation f
or
the A
CO
care
model of
the f
utu
re
Impro
ve q
ualit
y a
cro
ss t
he 6
IO
M a
ims
Engage and train employees in the redesign of our system.
La
Ra
y B
row
n
An
ton
io M
art
in
Jo
e S
ch
ick
An
a M
are
ng
o
Sa
lva
tore
Ru
sso
HD
: I
ncre
ase e
ngagem
ent
in B
reakth
rough b
y 2
0%
Q:
>95%
of
Heart
Failu
re p
atients
will
be d
ischarg
ed w
ith a
ppro
priate
dis
charg
e instr
uctions
Q:
Reduce U
TI
rate
s b
y 1
5%
Ro
ss W
ilso
n
HD
: I
ncre
ase e
ngagem
ent
in T
eam
ST
EP
PS
by 2
0%
Arn
ie S
ap
ers
tein
Achieve the integration of our delivery system necessary to succeed as an accountable care organization.
Embed Bt as our enterprise-wide improvement system and a means for organizational transformation.
Build
infr
astr
uctu
re a
nd d
ata
capabili
ty t
o e
ffectively
manage c
ost
at
the s
erv
ice lin
e level
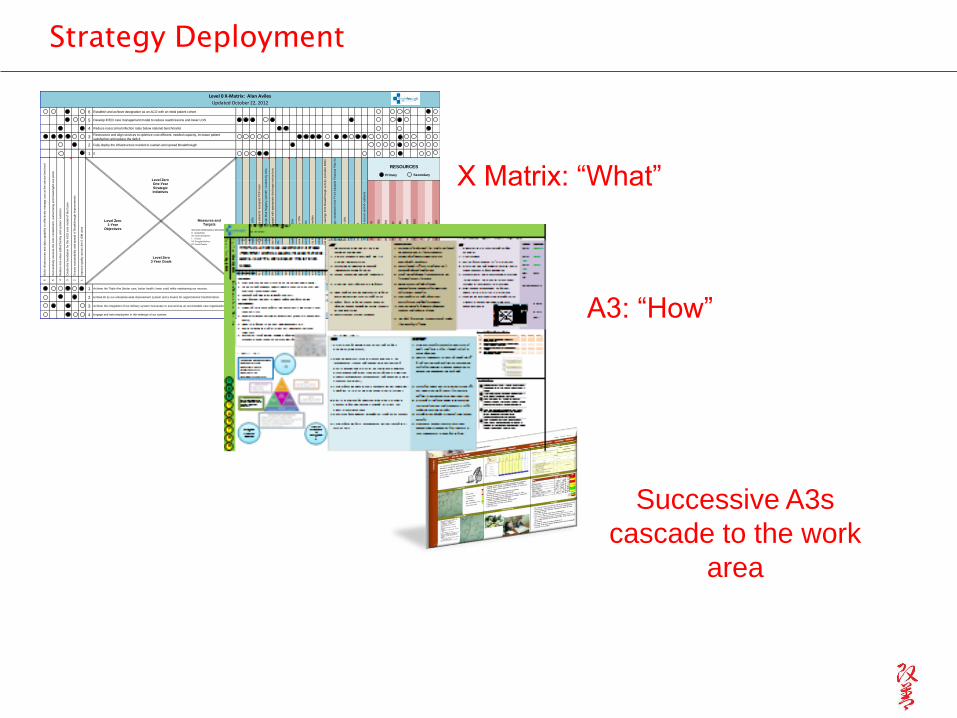
Level 0 X-Matrix: Alan Aviles
Updated October 22, 2012
Fully deploy the infrastructure needed to sustain and spread Breakthrough
Develop IP/ED care management model to reduce readmissions and lower LOS
0
Ta
mir
u M
am
mo
Q:
90%
of
prim
ary
care
vis
its w
ill b
e p
rovid
ed b
y p
atients
' assig
ned P
CP
team
RESOURCES
Ca
rolin
e J
aco
bs
Q:
Incre
ase t
he %
of
patients
in t
he C
ard
iovascula
r R
isk R
egis
try w
ith B
P <
140/9
0 b
y 1
0%
Q:
Reduce C
HF
30-d
ay r
eadm
issio
ns b
y 1
0%
Q:
Reduce p
neum
onia
30-d
ay r
eadm
issio
ns b
y 1
0%
Q:
Reduce A
MI
30-d
ay r
eadm
issio
ns b
y 1
0%
G/C
: E
xpand p
rim
ary
care
access b
y 5
%;
targ
et
senio
rs a
nd M
+ p
atients
HD
: I
ncre
ase H
CA
HP
S s
core
s t
o t
he n
ational m
edia
n
Ma
rle
ne
Zu
rack
BENEFITTARGET TO
Level ZeroOne-Year
Strategic Initiatives
Level Zero3 Year Goals
Level Zero 1-Year
Objectives
Primary
Measures andTargets
TRUE NORTH DIMMENSIONS OF MEASUREMENT Q: Quality/Safety HD: Human Development F: Financial T/D: Throughput/Delivery G/C: Growth/Capacity
Secondary
Achieving our strategic goals requires leadership to support, facilitate and nurture a culture of mutual respect, collaboration, employee empowerment, and continuous learning.
Strategy Deployment
X Matrix: “What”
A3: “How”
Successive A3s
cascade to the work
area
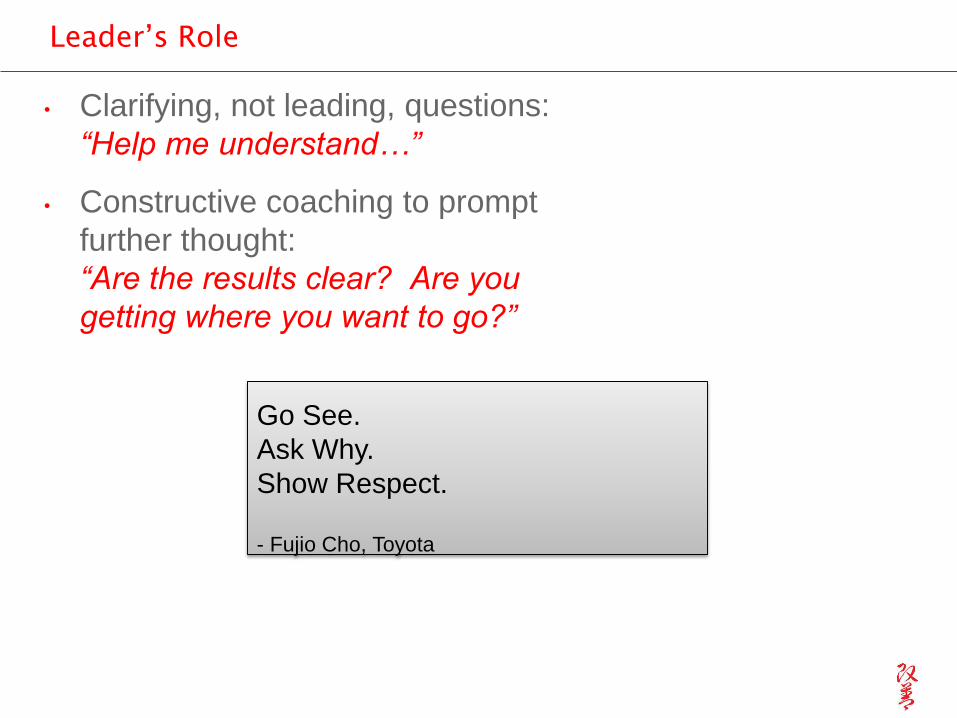
• Clarifying, not leading, questions:
“Help me understand…”
• Constructive coaching to prompt
further thought:
“Are the results clear? Are you
getting where you want to go?”
Go See.
Ask Why.
Show Respect.
- Fujio Cho, Toyota
Leader’s Role
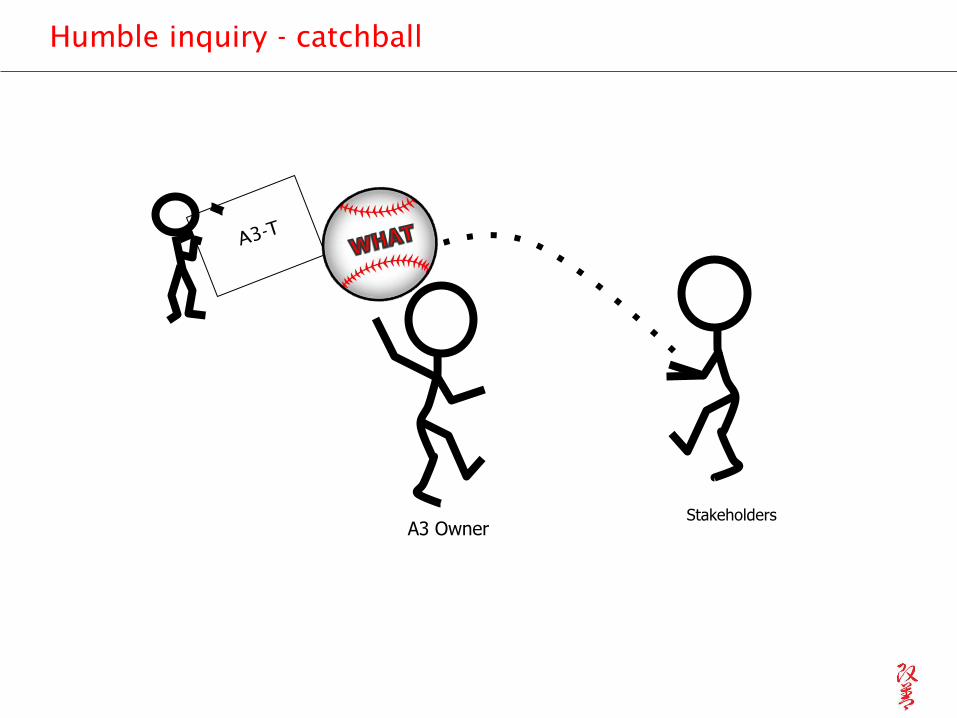
Humble inquiry - catchball
A3 OwnerStakeholders
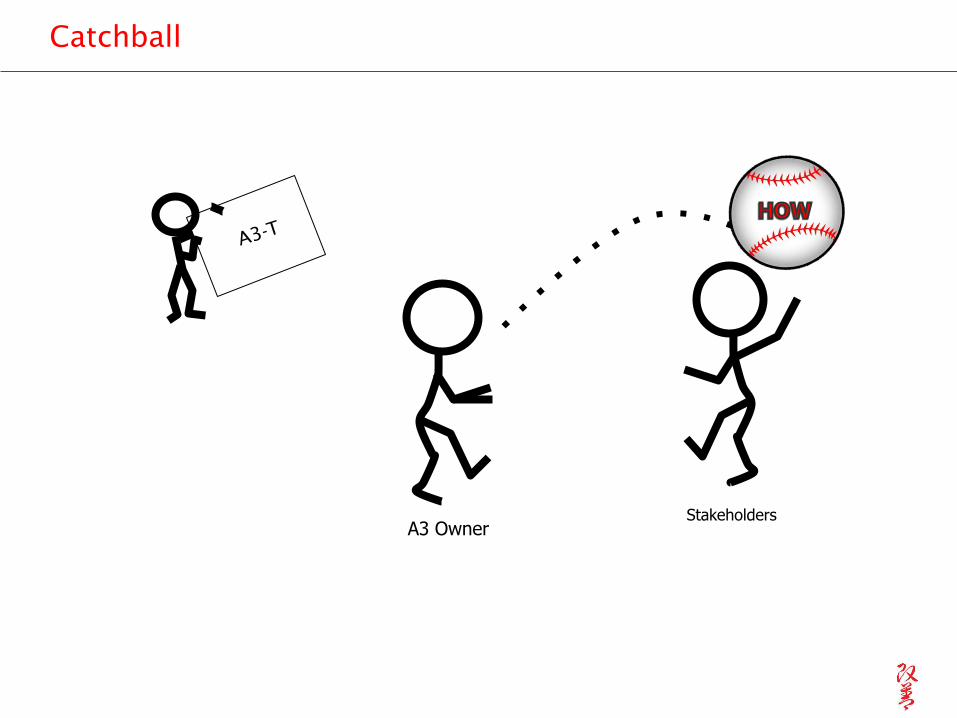
Catchball
A3 OwnerStakeholders
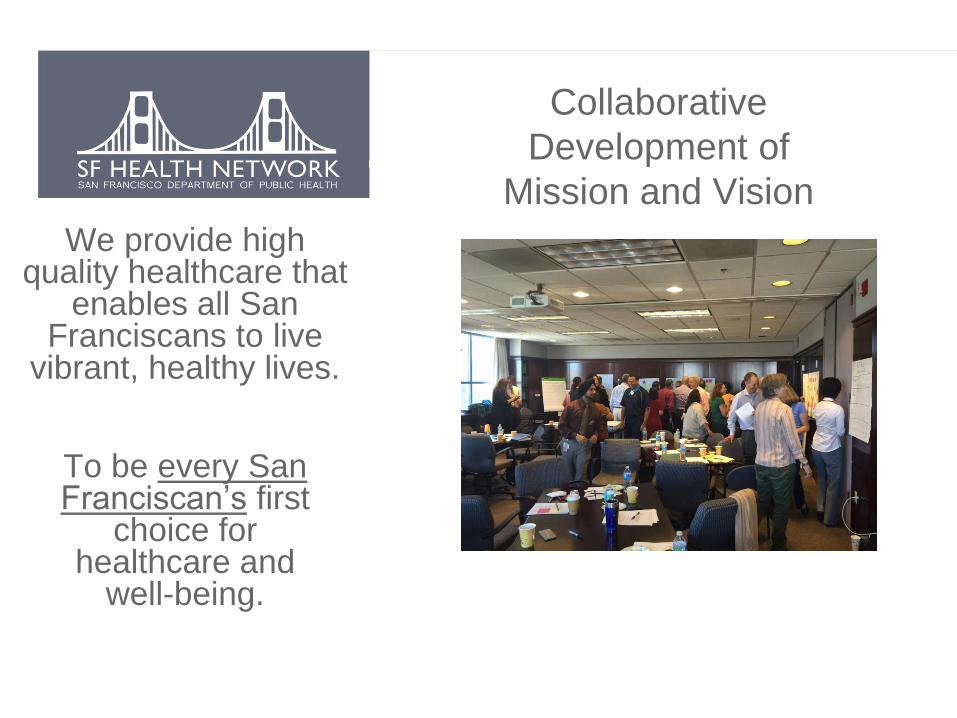
Collaborative
Development of
Mission and Vision
We provide high quality healthcare that
enables all San Franciscans to live
vibrant, healthy lives.
To be every San Franciscan’s first
choice for healthcare and
well-being.
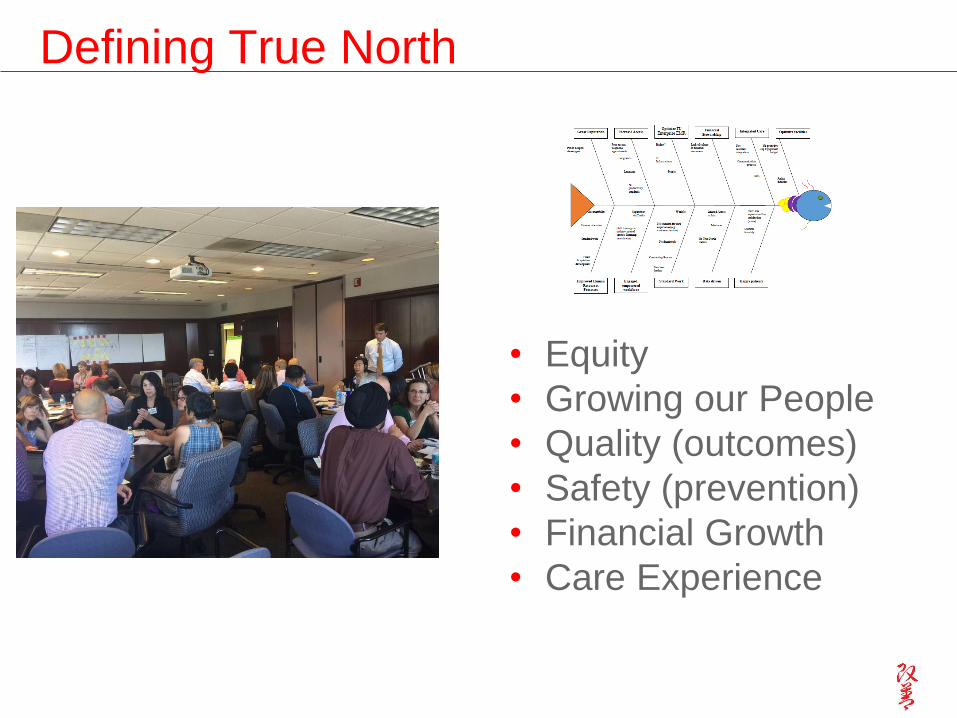
Defining True North
• Equity
• Growing our People
• Quality (outcomes)
• Safety (prevention)
• Financial Growth
• Care Experience
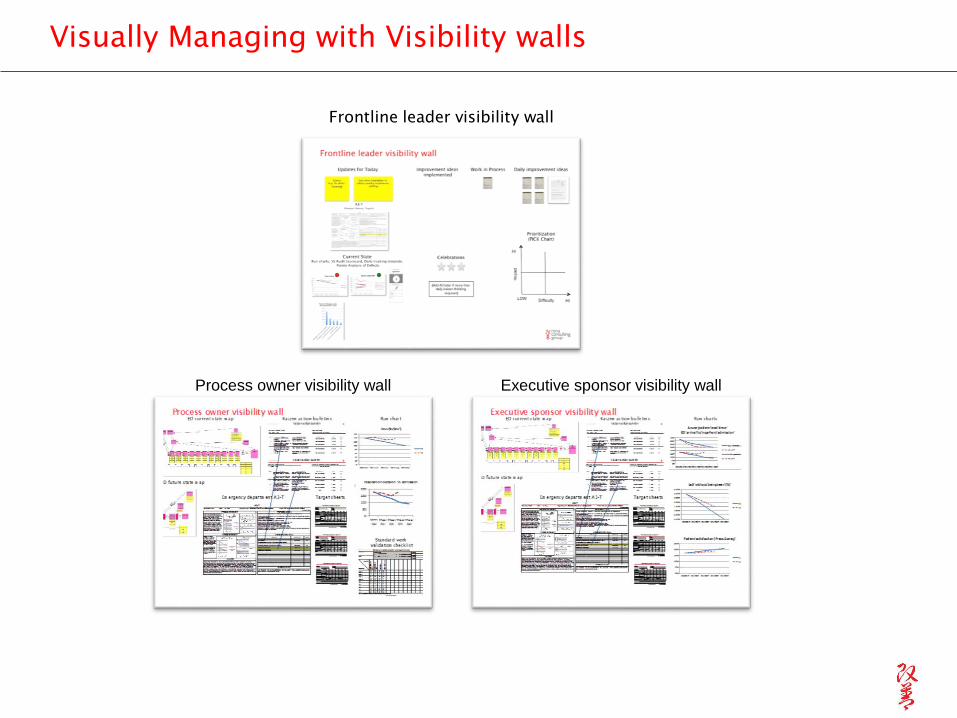
Visually Managing with Visibility walls
Frontline leader visibility wall
Process owner visibility wall Executive sponsor visibility wall

Introduction to Lean
What is lean?
• A system for leading, managing and
continuously improving the work that we do
and the services we provide.

Lean is the means to:
Ensure achievement of strategic priorities
Create a standardized method for planning,
implementing and improving that engages everybody,
everyday
Provide development and promotional opportunities for
staff
Eliminate waste and improve efficiency and
performance
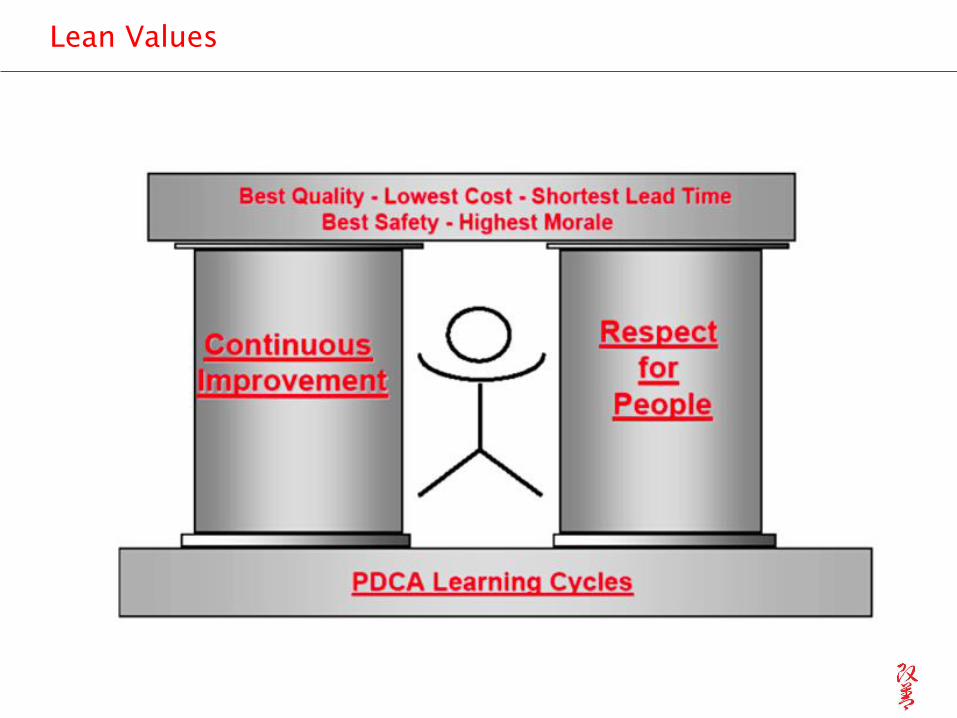
Lean Values
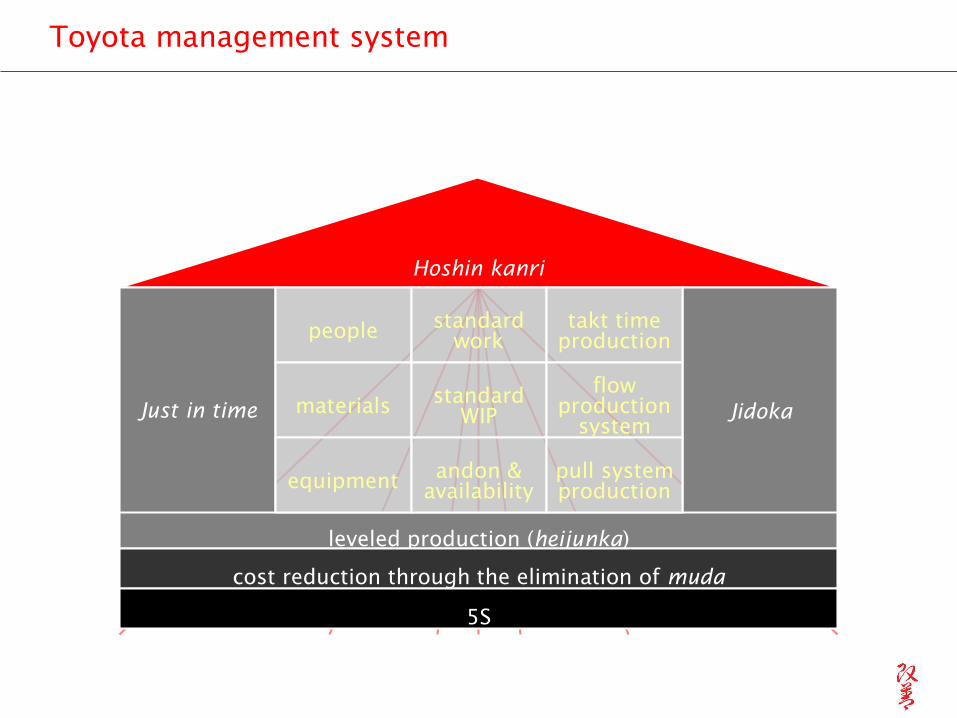
Hoshin kanri
Just in time Jidoka
leveled production (heijunka)
cost reduction through the elimination of muda
people
materials
equipment
standard
work
standard
WIP
andon &
availability
takt time
production
flow
production
system
pull system
production
5S
Toyota management system
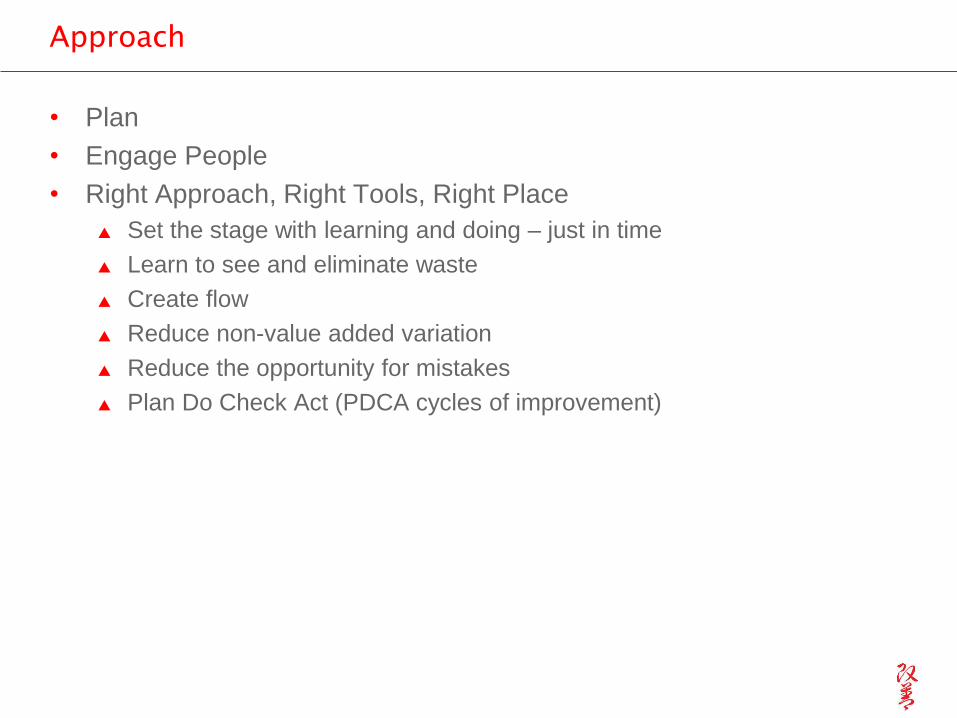
Approach
• Plan
• Engage People
• Right Approach, Right Tools, Right Place
Set the stage with learning and doing – just in time
Learn to see and eliminate waste
Create flow
Reduce non-value added variation
Reduce the opportunity for mistakes
Plan Do Check Act (PDCA cycles of improvement)
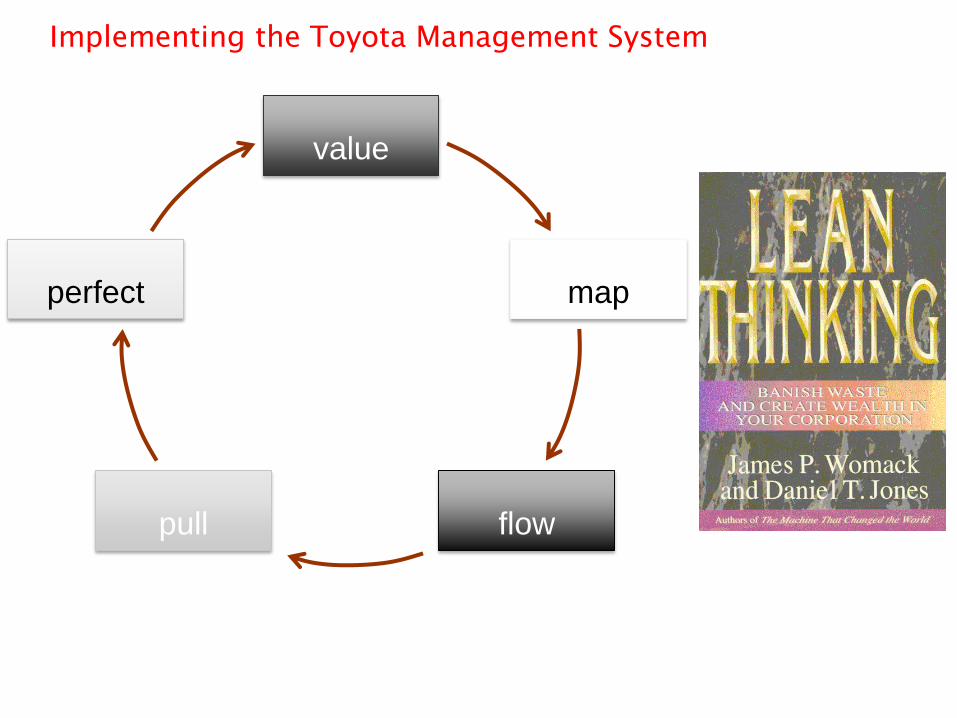
Implementing the Toyota Management System
value
map
flowpull
perfect
Seek and Eliminate Waste
• Learn to see waste
• Learn to eliminate waste
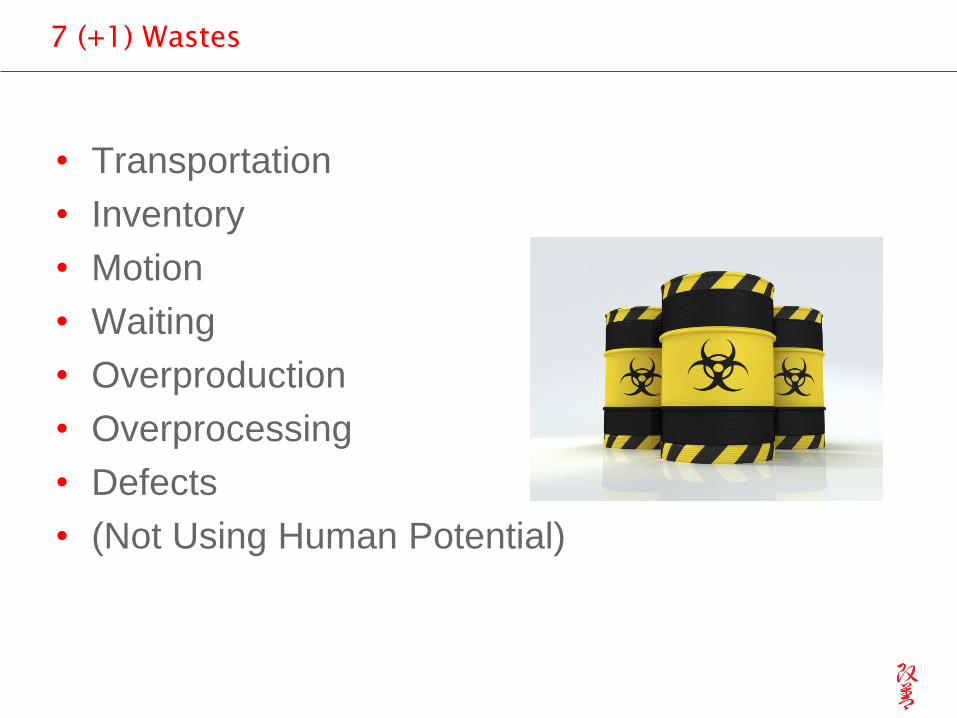
7 (+1) Wastes
• Transportation
• Inventory
• Motion
• Waiting
• Overproduction
• Overprocessing
• Defects
• (Not Using Human Potential)
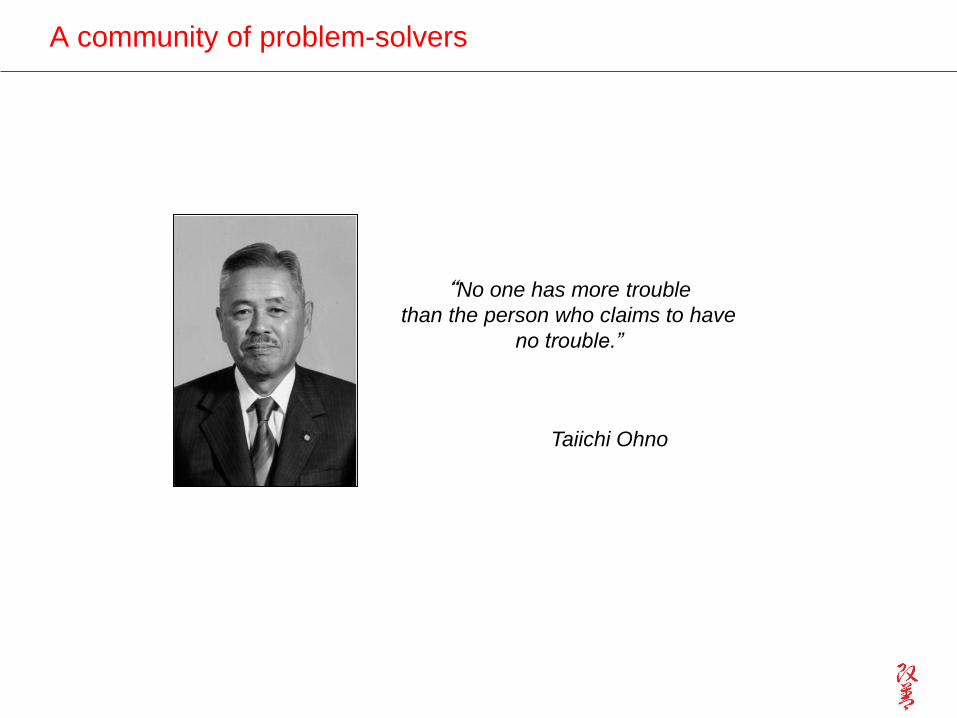
A community of problem-solvers
“No one has more trouble
than the person who claims to have
no trouble.”
Taiichi Ohno
Create Flow – the absence of waste
35
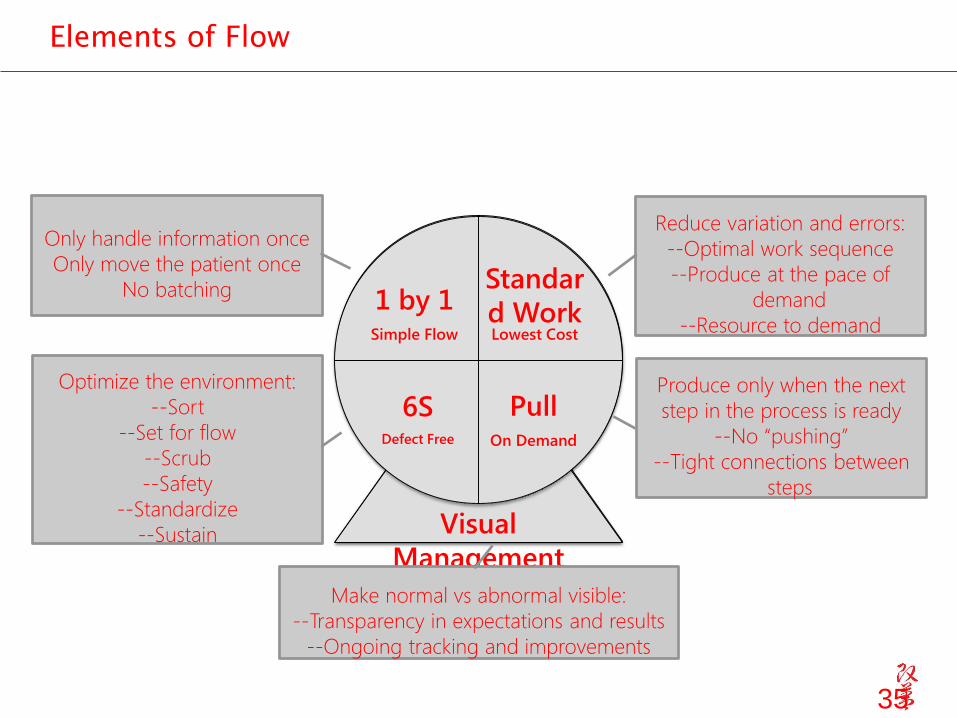
Elements of Flow
Standar
d WorkLowest Cost
1 by 1Simple Flow
Standar
d WorkLowest Cost
6SDefect Free
PullOn Demand
Visual
Management
Only handle information once
Only move the patient once
No batching
Optimize the environment:
--Sort
--Set for flow
--Scrub
--Safety
--Standardize
--Sustain
Produce only when the next
step in the process is ready
--No “pushing”
--Tight connections between
steps
Reduce variation and errors:
--Optimal work sequence
--Produce at the pace of
demand
--Resource to demand
Make normal vs abnormal visible:
--Transparency in expectations and results
--Ongoing tracking and improvements
Lean in Practice – Improvement
Workshops
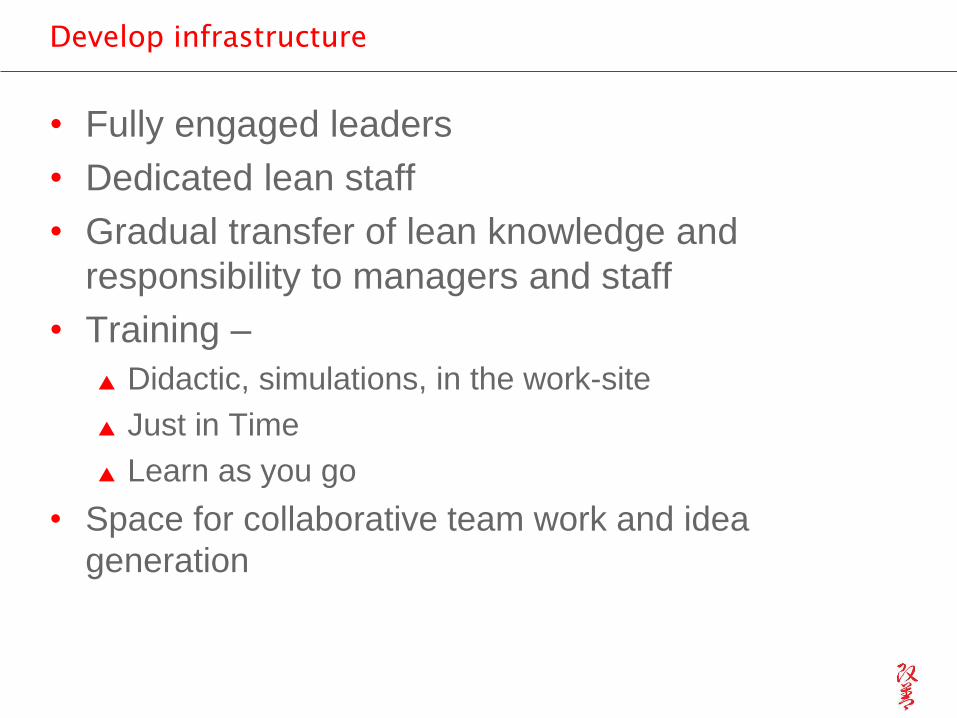
Develop infrastructure
• Fully engaged leaders
• Dedicated lean staff
• Gradual transfer of lean knowledge and
responsibility to managers and staff
• Training –
Didactic, simulations, in the work-site
Just in Time
Learn as you go
• Space for collaborative team work and idea
generation
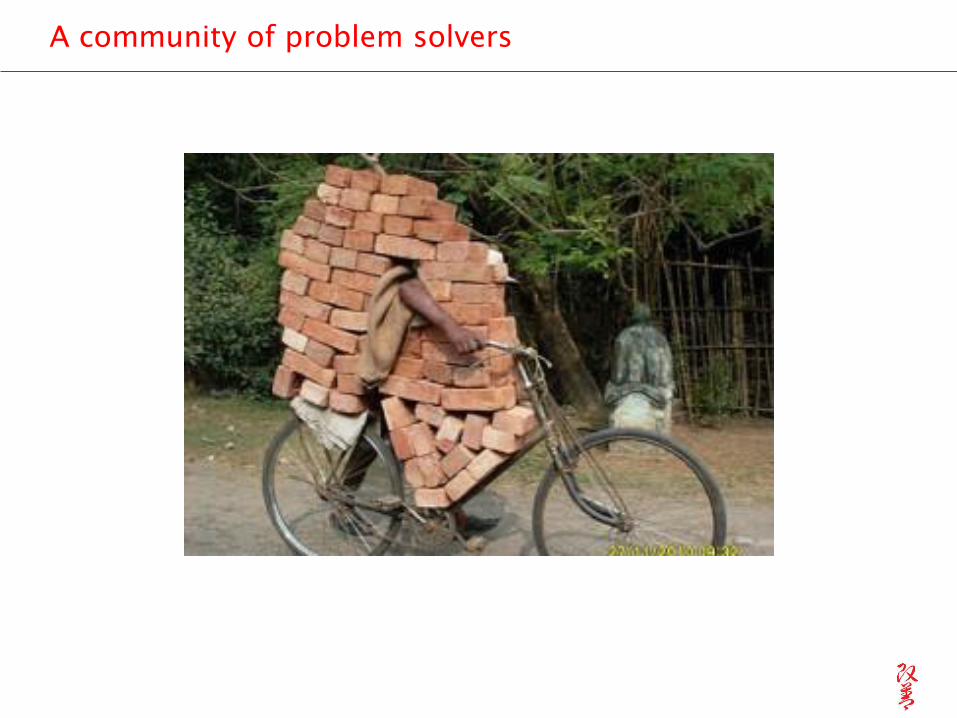
A community of problem solvers

What needs to flow
Patients.
Providers.
Supplies.
Medications.
Information.
Process.
Equipment.
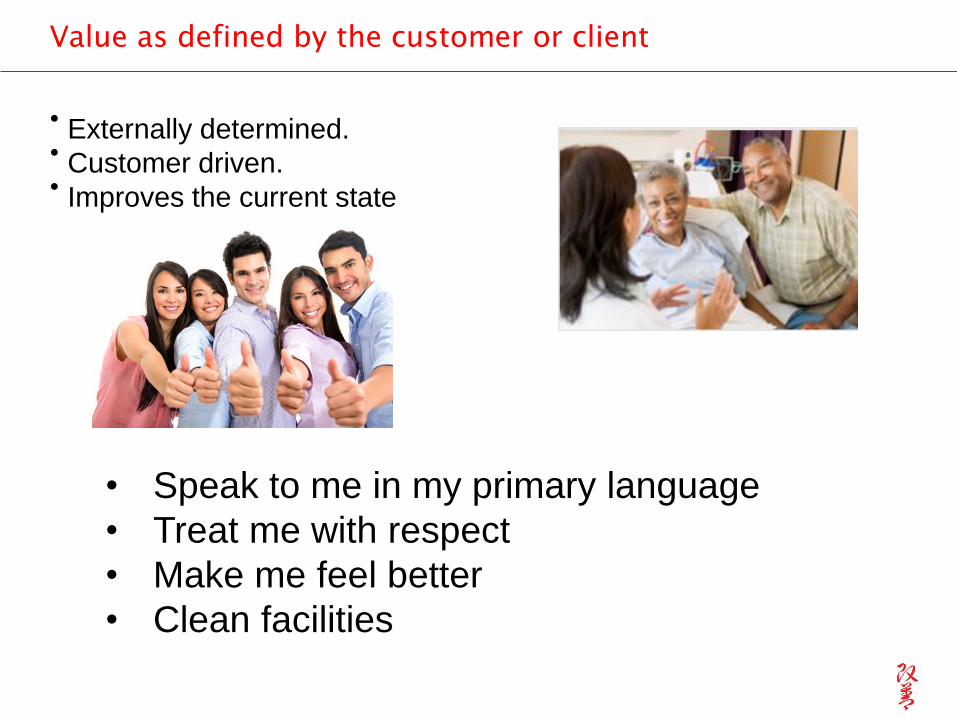
Value as defined by the customer or client
• Externally determined.• Customer driven.• Improves the current state
• Speak to me in my primary language
• Treat me with respect
• Make me feel better
• Clean facilities
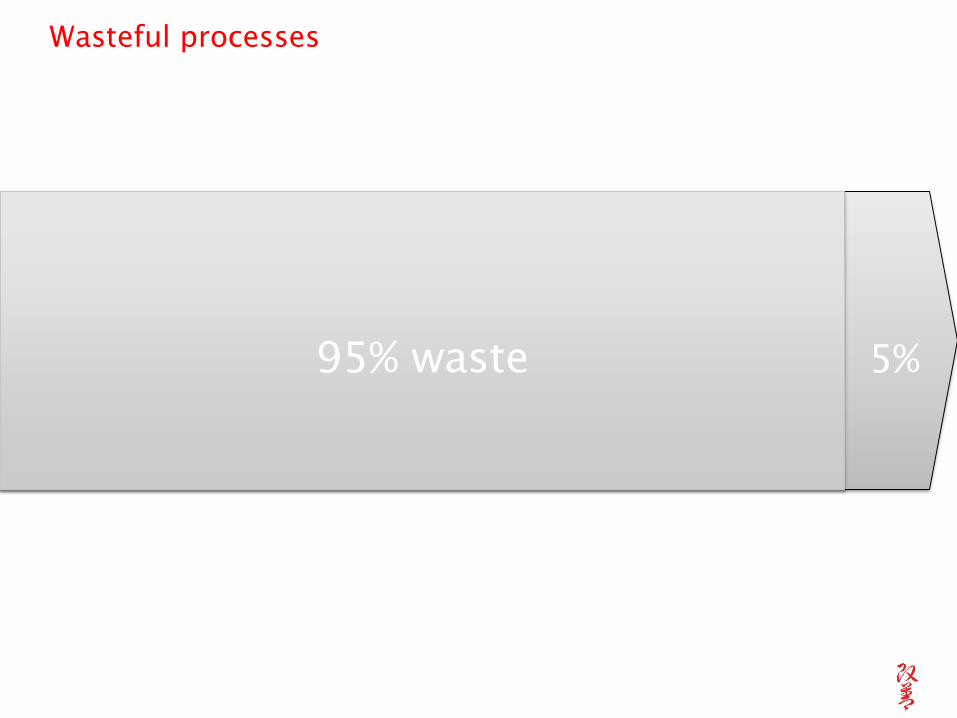
value added operations5%95% waste
Wasteful processes
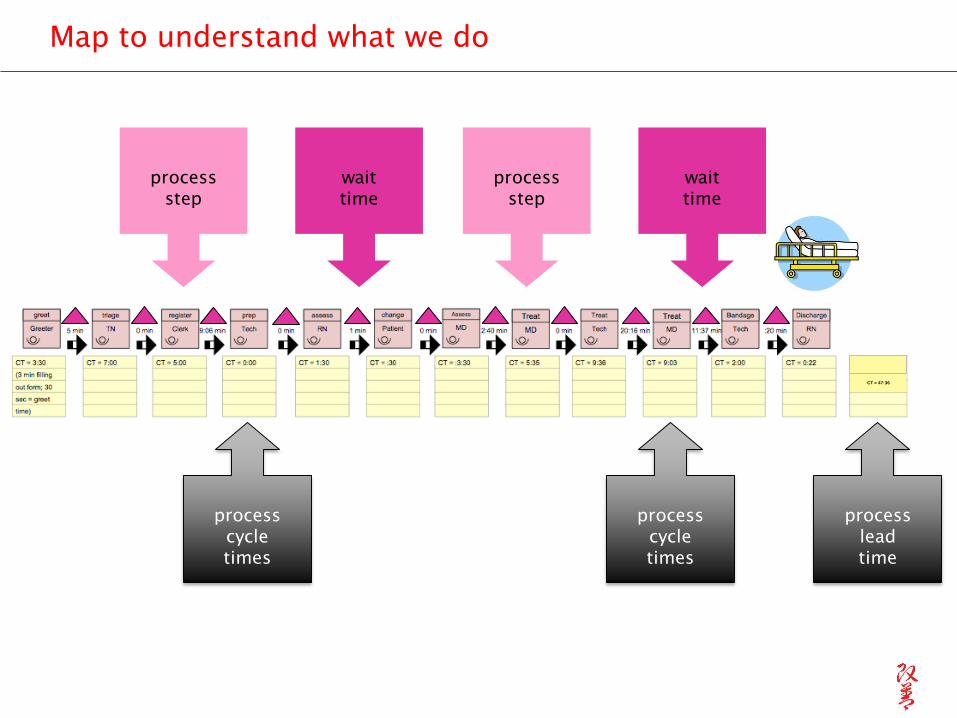
Map to understand what we do
process
cycle
times
process
step
wait
time
process
lead
time
process
step
wait
time
process
cycle
times
CT = 47:36
LT = 117:15
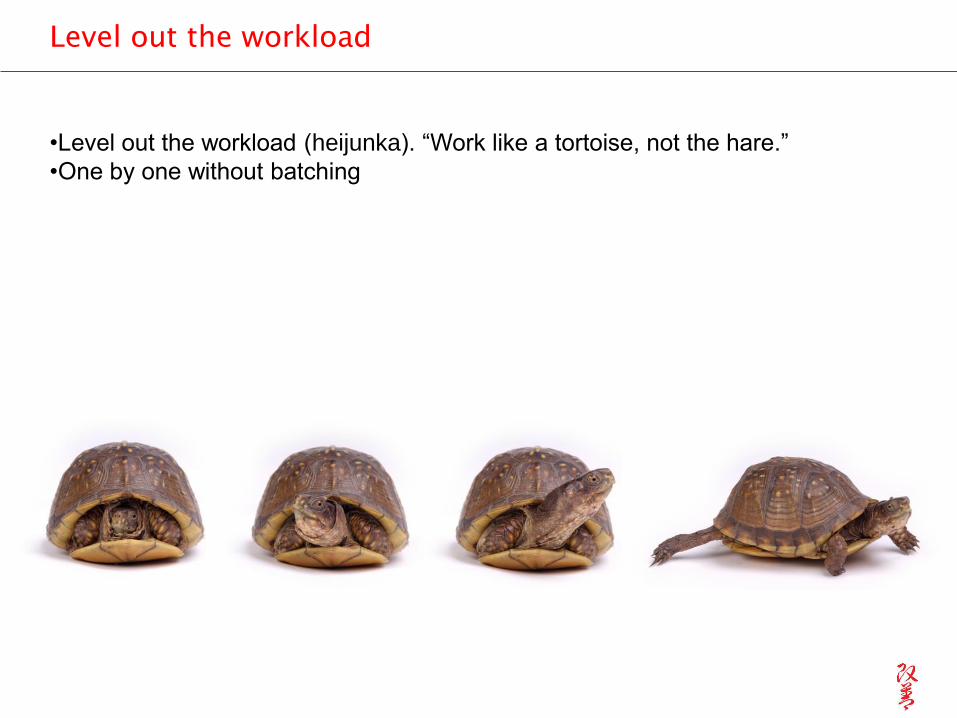
Level out the workload
•Level out the workload (heijunka). “Work like a tortoise, not the hare.”
•One by one without batching
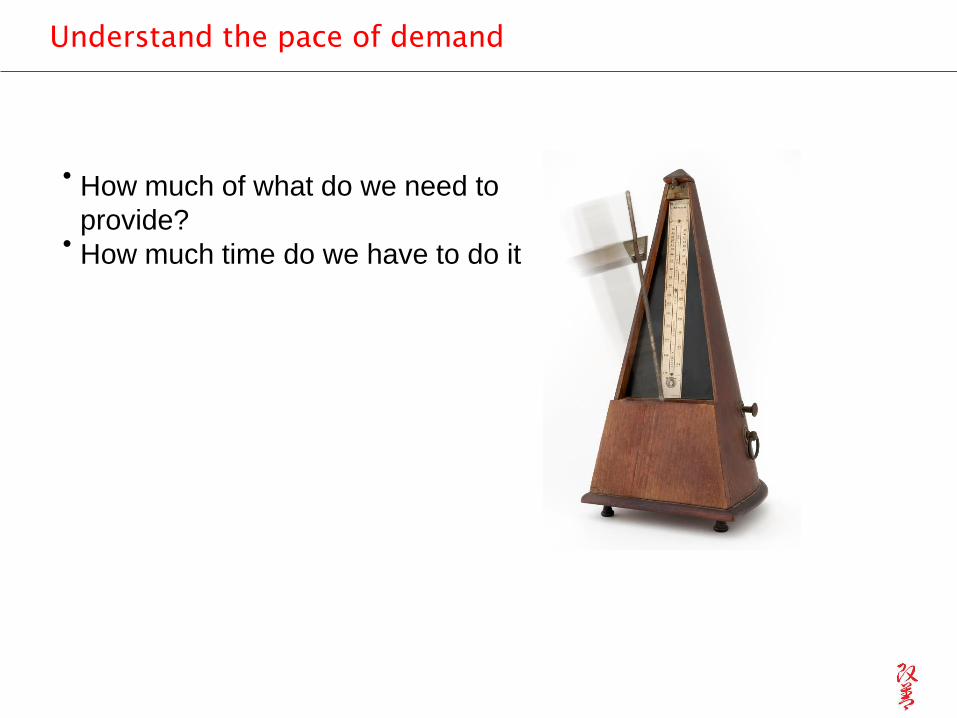
Understand the pace of demand
• How much of what do we need to
provide?• How much time do we have to do it
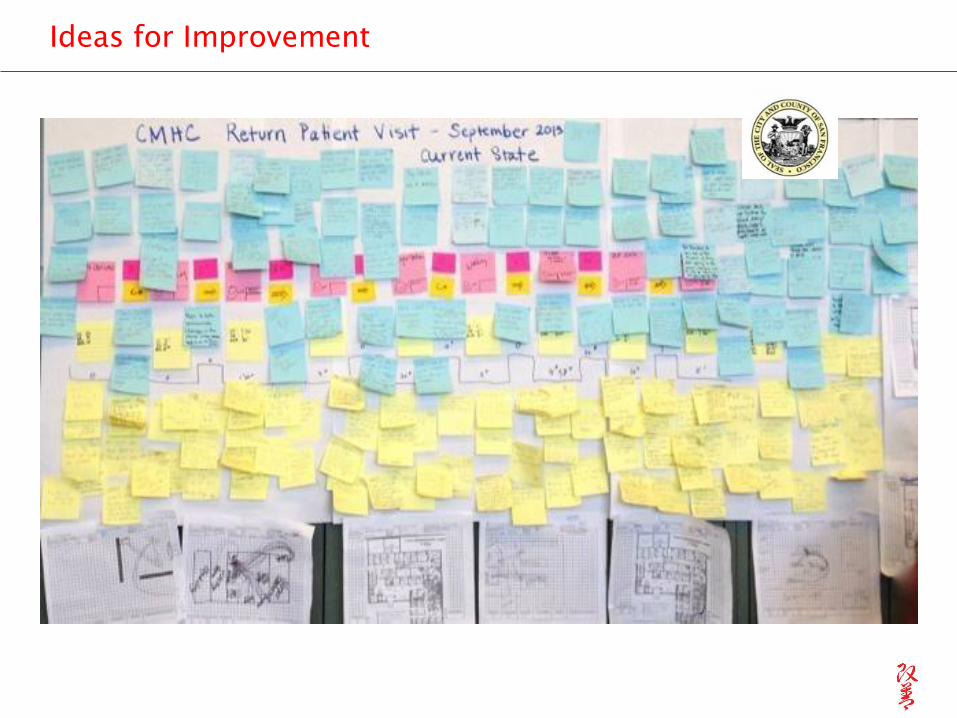
Ideas for Improvement
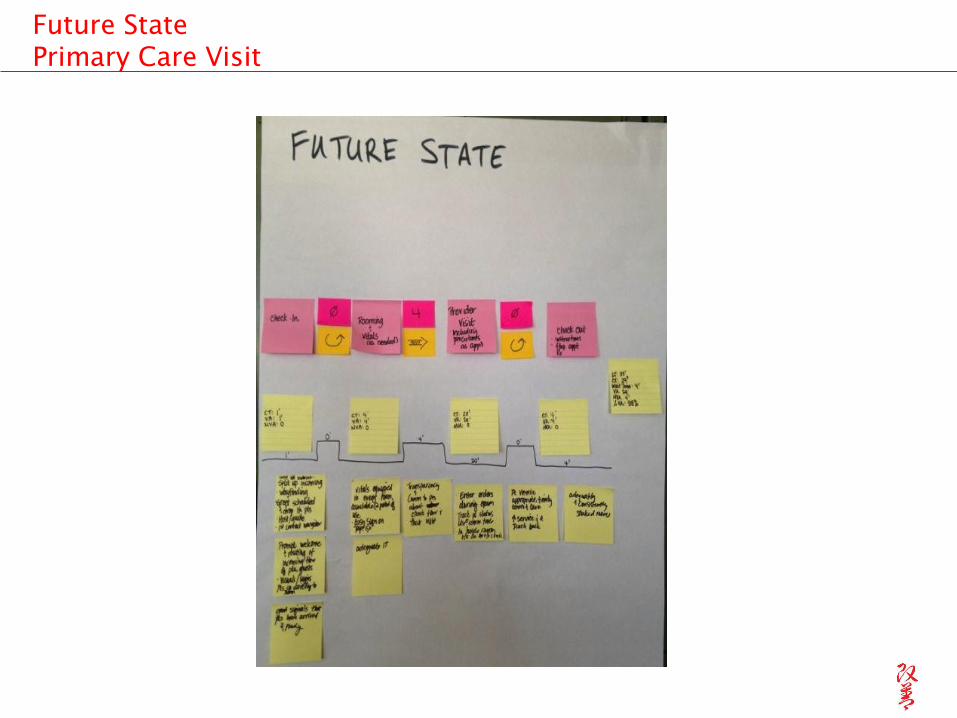
Future State
Primary Care Visit
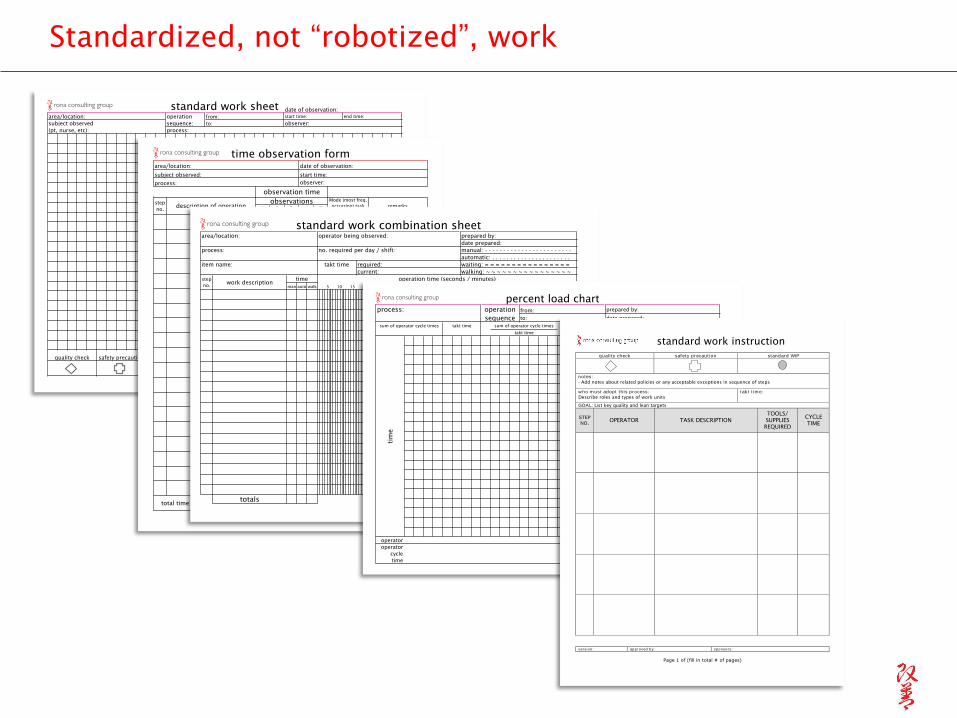
elapsed time for one observationquality check safety precaution standard WIP # pieces of WIP takt time
standard work sheetdate of observation:
operation
sequence:
from:
to:
end time:
observer:
process:
area/location:
subject observed
(pt, nurse, etc):
start time:
Standardized, not “robotized”, work
1 2 3 4 5
total time for one observation
observations
time observation form
observation time
date of observation:
start time:
observer:
area/location:
subject observed:
process:
step
no.description of operation
Mode (most freq.
occurring) task
time
remarks
man auto walk
totals
40 45 50 5515 20 25 30 35
standard work combination sheet
takt time required:
current:
waiting: = = = = = = = = = = = = = = = =
walking: ~ ~ ~ ~ ~ ~ ~ ~ ~ ~ ~ ~ ~ ~ ~ ~
date prepared:
manual: - - - - - - - - - - - - - - - - - - - - - - - -
automatic: . . . . . . . . . . . . . . . . . . . . . .
prepared by:operator being observed:
no. required per day / shift:
area/location:
process:
item name:
step
no.
operation time (seconds / minutes)
5 10 95 100
work description70 75 80 85 90
time
6560
operator
operator
cycle
time
tim
e
takt time sum of operator cycle times
takt time=
team members
requireed=
sum of operator cycle times ! O.C.T.
T.T.=
percent load chart
process: operation
sequence
from:
to:
prepared by:
date prepared:
standard work instruction
version: approved by: sponsors:
Page 1 of (fill in total # of pages)
qual i t y check saf et y precaut ion standard WIP
notes:
- Add notes about related policies or any acceptable exceptions in sequence of steps
w ho m ust adopt t h is process:
Describe roles and types of work units
t ak t t im e:
GOAL: List key quality and lean targets
STEP
NO. OPERATOR TASK DESCRIPTION
TOOLS/
SUPPLIES
REQUIRED
CYCLE
TIME
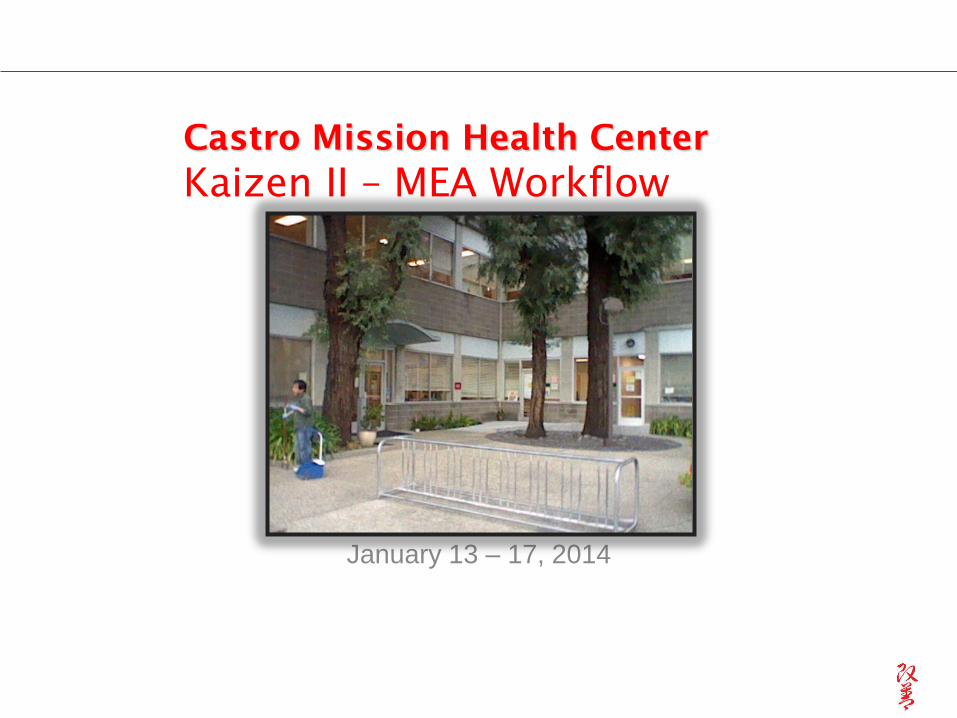
Castro Mission Health Center
Kaizen II – MEA Workflow
January 13 – 17, 2014
San Francisco General HospitalPharmacist Verification, Mistake Proofing & Pick Up Process
August 11-15, 2014
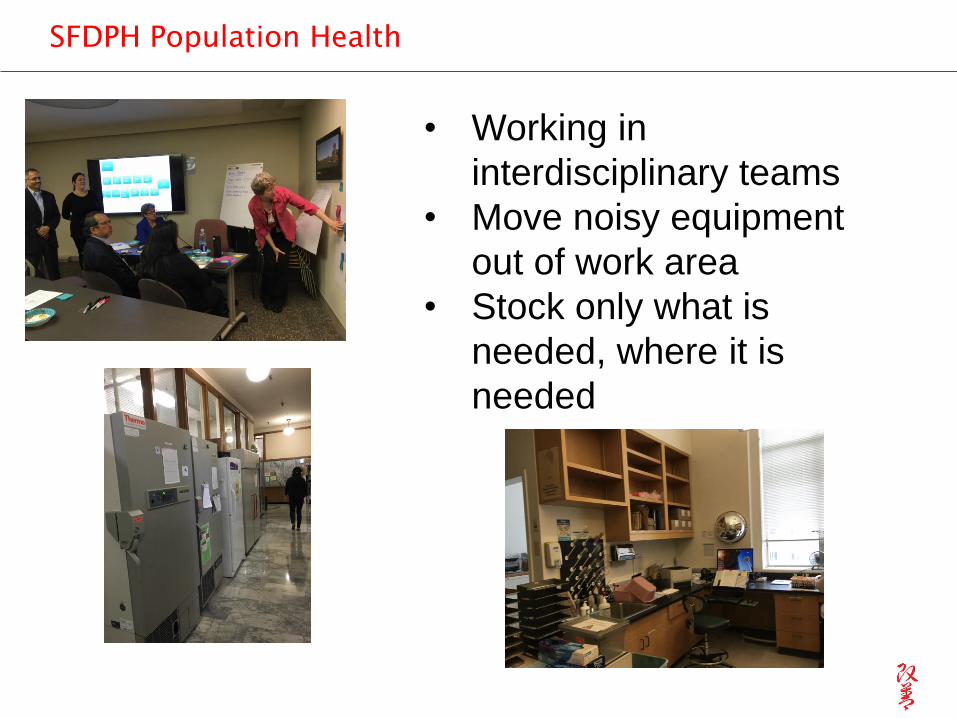
SFDPH Population Health
• Working in
interdisciplinary teams
• Move noisy equipment
out of work area
• Stock only what is
needed, where it is
needed

A3 Thinking
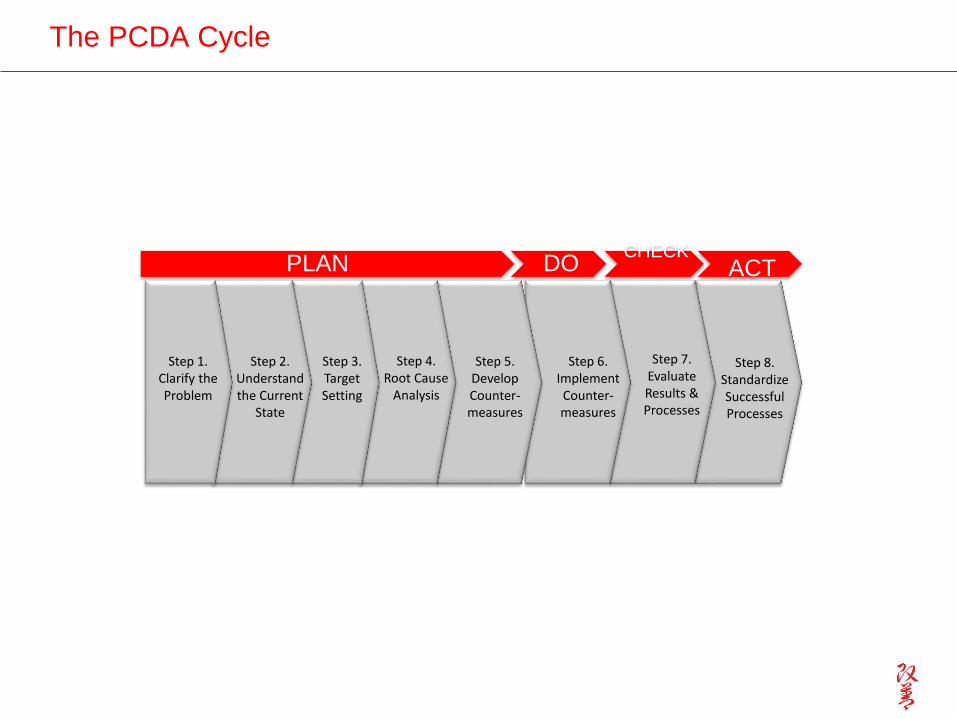
The PCDA Cycle
PLAN DOCHECK
ACT
Step 8.Standardize Successful Processes
Step 7.Evaluate Results & Processes
Step 6.Implement Counter-measures
Step 5.Develop Counter-measures
Step 3.Target Setting
Step 2.Understand the Current
State
Step 1.Clarify the Problem
Step 4.Root Cause
Analysis
Title: Revision:V1.0
Team:
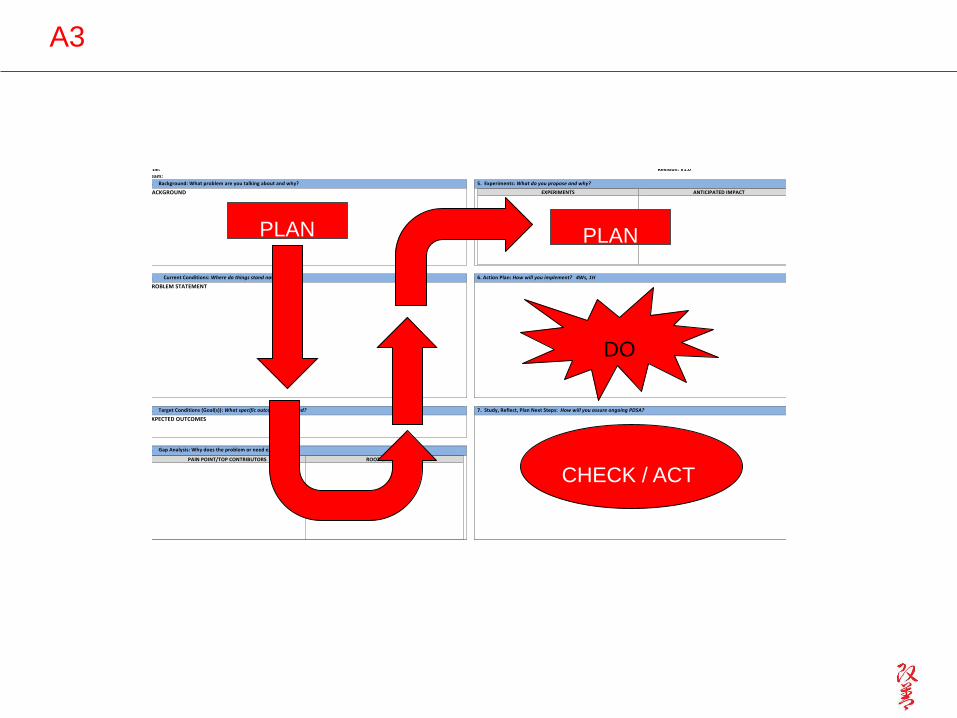
1. Background:Whatproblemareyoutalkingaboutandwhy? 5.Experiments:Whatdoyouproposeandwhy?
BACKGROUND
EXPERIMENTS ANTICIPATEDIMPACT
2. CurrentConditions:Wheredothingsstandnow? 6.ActionPlan:Howwillyouimplement?4Ws,1H
PROBLEMSTATEMENT
§
3. TargetConditions(Goal(s)):Whatspecificoutcomeisrequired? 7.Study,Reflect,PlanNextSteps:HowwillyouassureongoingPDSA?
EXPECTEDOUTCOMES
§ §
§
4. GapAnalysis:Whydoestheproblemorneedexist?
PAINPOINT/TOPCONTRIBUTORS ROOTCAUSE(S)
A3
PLAN
DO
CHECK / ACT
PLAN
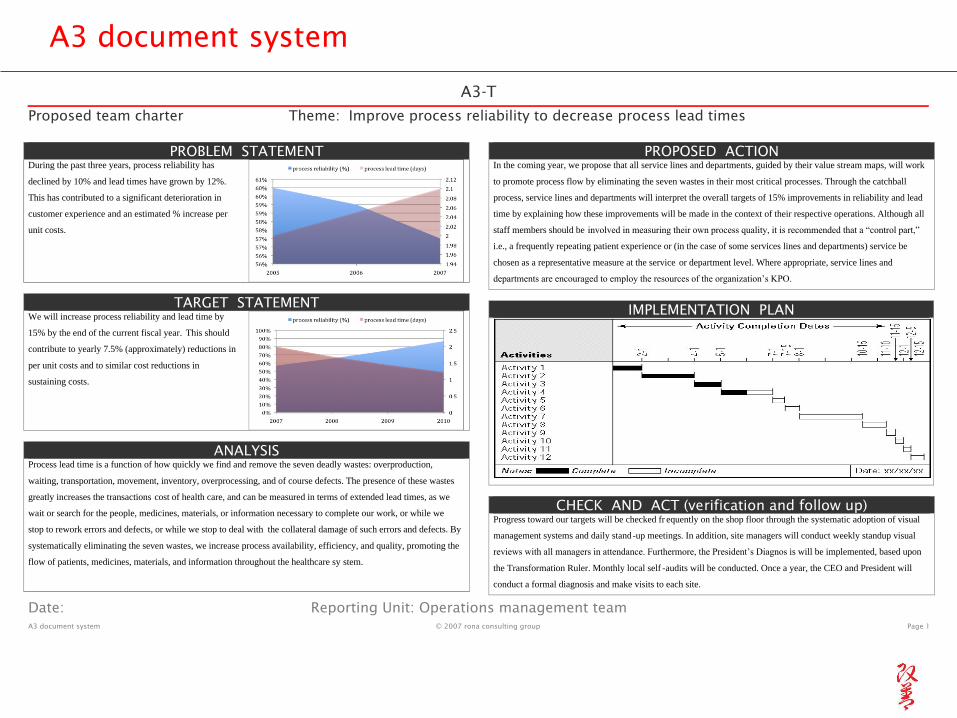
A3 document system
A3-T
Proposed team charter Theme: Improve process reliability to decrease process lead times
Date: Reporting Unit: Operations management team
A3 document system © 2007 rona consulting group Page 1
PROBLEM STATEMENT During the past three years, process reliability has
declined by 10% and lead times have grown by 12%.
This has contributed to a significant deterioration in
customer experience and an estimated % increase per
unit costs.
TARGET STATEMENT We will increase process reliability and lead time by
15% by the end of the current fiscal year. This should
contribute to yearly 7.5% (approximately) reductions in
per unit costs and to similar cost reductions in
sustaining costs.
ANALYSIS Process lead time is a function of how quickly we find and remove the seven deadly wastes: overproduction,
waiting, transportation, movement, inventory, overprocessing, and of course defects. The presence of these wastes
greatly increases the transactions cost of health care, and can be measured in terms of extended lead times, as we
wait or search for the people, medicines, materials, or information necessary to complete our work, or while we
stop to rework errors and defects, or while we stop to deal with the collateral damage of such errors and defects. By
systematically eliminating the seven wastes, we increase process availability, efficiency, and quality, promoting the
flow of patients, medicines, materials, and information throughout the healthcare sy stem.
PROPOSED ACTION In the coming year, we propose that all service lines and departments, guided by their value stream maps, will work
to promote process flow by eliminating the seven wastes in their most critical processes. Through the catchball
process, service lines and departments will interpret the overall targets of 15% improvements in reliability and lead
time by explaining how these improvements will be made in the context of their respective operations. Although all
staff members should be involved in measuring their own process quality, it is recommended that a “control part,”
i.e., a frequently repeating patient experience or (in the case of some services lines and departments) service be
chosen as a representative measure at the service or department level. Where appropriate, service lines and
departments are encouraged to employ the resources of the organization’s KPO.
IMPLEMENTATION PLAN
CHECK AND ACT (verification and follow up) Progress toward our targets will be checked fr equently on the shop floor through the systematic adoption of visual
management systems and daily stand-up meetings. In addition, site managers will conduct weekly standup visual
reviews with all managers in attendance. Furthermore, the President’s Diagnos is will be implemented, based upon
the Transformation Ruler. Monthly local self -audits will be conducted. Once a year, the CEO and President will
conduct a formal diagnosis and make visits to each site.
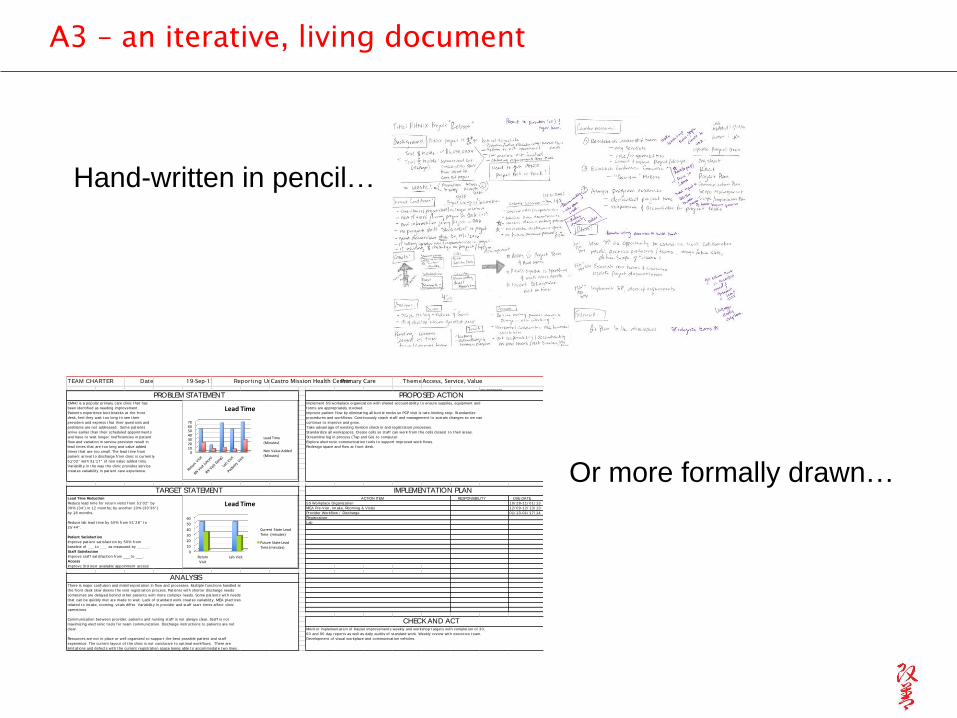
A3 – an iterative, living document
Hand-written in pencil…
DUE DATE
10/ 28-11/ 01/ 13
12/ 09-12/ 13/ 13
01/ 13-01/ 17/ 14
© 2009 rona consulting group
Implement 5S workplace organizat ion wit h shared account abilit y t o ensure supplies, equipment and
forms are appropriat ely st ocked.
Improve pat ient f low by eliminat ing all bot t le necks so PCP visit is rat e-limit ing st ep. St andardize
procedures and workf lows. Cont inuously coach st af f and management t o sust ain changes so we can
cont inue t o improve and grow.
Take advant age of exist ing Invision check in and regist rat ion processes.
St andardize all workspaces. Creat e cells so st af f can work f rom t he cells closest t o t heir areas.
St reamline log in process (Tap and Go) t o comput er.
Explore elect ronic communicat ion t ools t o support improved work f lows.
Redesign space and f low at f ront desk.
5S Workplace Organizat ion
MEA Pre-Visit , Int ake, Rooming & Vit als
Lab
TEAM CHARTER Date: 19-Sep-13 Repor t ing Unit :Castro Mission Health Center Primary Care Theme:Access, Service, Value
Lead Time Reduction
Reduce lead t ime for ret urn visit s f rom 51 '02" by
30% (34 ' ) in 12 mont hs; by anot her 10% (30 '36" )
by 18 mont hs.
Reduce lab lead t ime by 50% from 51 '28" t o
25 '44" .
Pat ient Sat isfact ion
Improve pat ient sat isfact ion by 50% f rom
baseline of ___t o ___ as measured by _____.
Staff Sat isfact ion
Improve st af f sat isfact ion f rom ___t o ___.
Access
Improve 3rd next available appoinment access
There is major confusion and misint erpret at ion in f low and processes. Mult iple funct ions handled at
t he f ront desk slow downs t he visit regist rat ion process. Pat ient s wit h short er discharge needs
somet imes are delayed behind ot her pat ient s wit h more complex needs. Some pat ient s wit h needs
t hat can be quickly met are made t o wait . Lack of st andard work creat es variabilit y. MEA pract ices
relat ed t o int ake, rooming, vit als dif fer. Variabilit y in provider and st af f st art t imes af fect clinic
operat ions.
Communicat ion bet ween provider, pat ient s and nursing st af f is not always clear. St af f is not
maximizing elect ronic t ools for t eam communicat ion. Discharge inst ruct ions t o pat ient s are not
clear.
Resources are not in place or well organized t o support t he best possible pat ient and st af f
experience. The current layout of t he clinic is not conducive t o opt imal workf lows. There are
limit at ions and defect s wit h t he current regist rat ion space being able t o accommodat e t wo lines.
CHECK AND ACTMonit or implement at ion of Kaizen improvement s weekly and workshop t arget s wit h complet ion of 30,
60 and 90 day report s as well as daily audit s of st andard work. Weekly review wit h execut ive t eam.
Development of visual workplace and communicat ion vehicles.
Provider Workf low / Discharge
Regist rat ion
ANALYSIS
PROBLEM STATEMENT PROPOSED ACTION
TARGET STATEMENT IMPLEMENTATION PLAN
CMHC is a popular primary care clinic t hat has
been ident if ied as needing improvement .
Pat ient s experience bot t lenecks at t he f ront
desk, feel t hey wait t oo long t o see t heir
providers and express t hat t heir quest ions and
problems are not addressed. Some pat ient s
arrive earlier t han t heir scheduled appoint ment s
and have t o wait longer. Inef f iciencies in pat ient
f low and variat ion in service provision result in
lead t imes t hat are t oo long and value added
t imes t hat are t oo small. The lead t ime f rom
pat ient arrival t o discharge f rom clinic is current ly
51 '02" wit h 31 '17" of non value added t ime.
Variabilit y in t he way t he clinic provides service
creat es variabilit y in pat ient care experience.
ACTION ITEM RESPONSIBILITY
010203040506070
LeadTime
LeadTime(Minutes)
NonValueAdded(Minutes)
0
10
20
30
40
50
60
ReturnVisit
LabVisit
LeadTime
CurrentStateLeadTime(minutes)
FutureStateLeadTime(minutes)
Or more formally drawn…

Thank you