Leak Detection and Location Method in Natural Gas Pipeline ...
8
Innovative Systems Design and Engineering www.iiste.org ISSN 2222-1727 (Paper) ISSN 2222-2871 (Online) Vol.6, No.9, 2015 1 Leak Detection and Location Method in Natural Gas Pipeline using Acoustic Wireless Sensor Networks Lawrence Boaz Shubi Kaijage Ramadhani Sinde Nelson Mandela African Institution of Science and Technology (NM-AIST), School of Computational and Communication Science and Engineering Arusha, Tanzania Abstract Traditional pipeline leak detection and location technologies generates high false alarm and poor location accuracy, this paper introduce Acoustic Wireless Sensor Network (AWSN) for gas pipeline monitoring which provide real time leak detection and location. AWSN detects and locate leakage by utilizing the measurements of Acoustic sensor mounted along pipeline to sense leak sound. A pipeline of 10m length and 0.25inch diameter filled with higher pressure of 10bar used to test the performance and accuracy of the system. Experimental results show that this method could effectively improve the accuracy of the leak point localization and reduce the undetected rate as well as false alarm rate. Keywords: Acoustic sensor, Gas pipeline network, Leak point location 1. Introduction A wide variety of leak detection and location technology is available for gas pipelines. Some techniques have been improved since their first proposal and some new ones were designed as a result of advances in industrial sensor manufacturing and computing power. However, each detection and location method comes with its advantages and disadvantages (Murvay and Pal-Stefan, 2012; Boaz et al., 2014a). Acoustic sensor prove to present good result, the problem of acoustic sensor is the cost associate for long pipeline, but it can be minimized with the use of high resolution and signal strength devices. Several study has been conducted based on Acoustic sensor, but its application especial for gas pipeline not yet realised at great level despite of its higher sensitivity, reliability and higher signal resolution and accuracy (Kim et al., 2009). Continuous monitoring for gas pipeline is done by installing acoustic sensors outside the pipeline at certain distance from one another. Escaping gas generates an acoustic signal as it flows through a breach in the pipe, this signal is used to determine that a leak has occurred (Boaz et al., 2014b). The distance between two acoustical sensors has to be adapted based on the sensitivity of the acoustic sensor and allocated budget. Placing sensors too far from each other will increase the risk of undetected leaks while installing them too close will lead to an increased system cost. 2. System development A 10m pipeline length with diameter of 0.25 inch, pressurised at 10 bar used to model the system. Two acoustic wireless sensor node mounted on pipeline, each have coverage distance of 4m, separated at equal distance, one placed close to the leak point to collect leak information. Fig. 1 gives the network architecture of the system. Figure 1. Acoustic wireless sensor node on pipeline network architecture 2.1 Acoustic sensor Acoustic sensor used as signal input to the system, acoustic sensor works based on acoustic wave interference. The sensor send acoustic pulse toward the target (leak noise) when this pulse interfere with leak noise are reflected back (echo) to the sensor. The system calculate time taken for reflected wave to reach the sensor to locate leak point. In general, the lower the frequency of the sensor, the longer the range of detection, while a
Transcript of Leak Detection and Location Method in Natural Gas Pipeline ...

Innovative Systems Design and Engineering www.iiste.org
ISSN 2222-1727 (Paper) ISSN 2222-2871 (Online)
Vol.6, No.9, 2015
1
Leak Detection and Location Method in Natural Gas Pipeline
using Acoustic Wireless Sensor Networks
Lawrence Boaz Shubi Kaijage Ramadhani Sinde
Nelson Mandela African Institution of Science and Technology (NM-AIST), School of Computational and
Communication Science and Engineering Arusha, Tanzania
Abstract
Traditional pipeline leak detection and location technologies generates high false alarm and poor location
accuracy, this paper introduce Acoustic Wireless Sensor Network (AWSN) for gas pipeline monitoring which
provide real time leak detection and location. AWSN detects and locate leakage by utilizing the measurements of
Acoustic sensor mounted along pipeline to sense leak sound. A pipeline of 10m length and 0.25inch diameter
filled with higher pressure of 10bar used to test the performance and accuracy of the system. Experimental
results show that this method could effectively improve the accuracy of the leak point localization and reduce the
undetected rate as well as false alarm rate.
Keywords: Acoustic sensor, Gas pipeline network, Leak point location
1. Introduction
A wide variety of leak detection and location technology is available for gas pipelines. Some techniques have
been improved since their first proposal and some new ones were designed as a result of advances in industrial
sensor manufacturing and computing power. However, each detection and location method comes with its
advantages and disadvantages (Murvay and Pal-Stefan, 2012; Boaz et al., 2014a). Acoustic sensor prove to
present good result, the problem of acoustic sensor is the cost associate for long pipeline, but it can be minimized
with the use of high resolution and signal strength devices. Several study has been conducted based on Acoustic
sensor, but its application especial for gas pipeline not yet realised at great level despite of its higher sensitivity,
reliability and higher signal resolution and accuracy (Kim et al., 2009). Continuous monitoring for gas pipeline is
done by installing acoustic sensors outside the pipeline at certain distance from one another. Escaping gas
generates an acoustic signal as it flows through a breach in the pipe, this signal is used to determine that a leak
has occurred (Boaz et al., 2014b). The distance between two acoustical sensors has to be adapted based on the
sensitivity of the acoustic sensor and allocated budget. Placing sensors too far from each other will increase the
risk of undetected leaks while installing them too close will lead to an increased system cost.
2. System development
A 10m pipeline length with diameter of 0.25 inch, pressurised at 10 bar used to model the system. Two acoustic
wireless sensor node mounted on pipeline, each have coverage distance of 4m, separated at equal distance, one
placed close to the leak point to collect leak information. Fig. 1 gives the network architecture of the system.
Figure 1. Acoustic wireless sensor node on pipeline network architecture
2.1 Acoustic sensor
Acoustic sensor used as signal input to the system, acoustic sensor works based on acoustic wave interference.
The sensor send acoustic pulse toward the target (leak noise) when this pulse interfere with leak noise are
reflected back (echo) to the sensor. The system calculate time taken for reflected wave to reach the sensor to
locate leak point. In general, the lower the frequency of the sensor, the longer the range of detection, while a

Innovative Systems Design and Engineering www.iiste.org
ISSN 2222-1727 (Paper) ISSN 2222-2871 (Online)
Vol.6, No.9, 2015
2
higher frequency sensor will have greater measurement resolution and less susceptibility to background noise.
c
fλ = (1)
Fig. 2, is the acoustic sensor (EM4530) used for capturing sound generated by leak on pipeline.
Figure 2. Acoustic sensor
Table 1. Acoustic sensor detailed parameters
Sensitivity OdB = 1V/Pa. 1KHz
Directivity Omnidirectional
Impedance Low Impedance
Current Consumption Max. 0.5mA
Standard Operation Voltage 2.0V
Sensitivity Reduction Within .3dB at 1.5V
S/N Ratio More than 60dB
Sensitivity Range -42 ± 4dB, -44 ± 4dB, -46 ± 4dB, -48 ± 4dB
Figure 3. Acoustic sensor frequency response curve (http://www.soberton.com)

Innovative Systems Design and Engineering www.iiste.org
ISSN 2222-1727 (Paper) ISSN 2222-2871 (Online)
Vol.6, No.9, 2015
3
Figure 4. Acoustic sensor circuit diagram
2.2 Microcontroller
Microcontroller 16F887 used with the main function to perform computations and decision making upon
received signal from acoustic sensor. This is powerful microcontroller, easy to program (only 35 single word
instructions) CMOS FLASH based 8 bit microcontroller packs Microchip's powerful architecture into a 40 pin
package. The PIC16F887 features 256 bytes of EEPROM data memory, self-programming, an ICD, 2
Comparators, 11 channels of 10 bit Analog to Digital (A/D) converter, 1 capture/compare/PWM and 1 Enhanced
capture/compare/PWM functions, a synchronous serial port that can be configured as either 3-wire Serial
Peripheral Interface (SPI) or the 2-wire Inter-Integrated Circuit (I²C) bus and an Enhanced Universal
Asynchronous Receiver Transmitter (EUSART). All of these features make it ideal for more advanced level A/D
applications in automotive, industrial, appliances or consumer applications and well suited for communication
gateways and protocol converters, soft modems, voice recognition and low end imaging, providing both large
buffer size and high processing power (http://www.microchip.com). Fig. 5 describes pin diagram.
Figure 5. Microcontroller Pin diagram
Innovative Systems Design and Engineering www.iiste.org
ISSN 2222-1727 (Paper) ISSN 2222-2871 (Online)
Vol.6, No.9, 2015
4
Figure 6. Microcontroller (16F887)
2.3 Xbee RF module
Digi XBee 802.15.4 modules are the easiest to use, most reliable and cost effective RF devices. The 802.15.4
XBee modules provide two friendly modes of communication; a simple serial method of transmit/receive or a
framed mode providing advanced features (Meribout and M. A, 2011). XBees are ready to use out of the
package, or they can be configured through the X-CTU utility or from microcontroller. These modules can
communicate point to point, from one point to a PC, or in a mesh network. It can be connected to either PCB or
Wired antenna style and power level (1 mW for up to 300 ft). The PCB antenna version provides a lower profile
footprint for applications with limited space while the Wire antenna version allows for more flexibility in
adjusting for optimal range at the same output power. Only series 1 modules can work with series 1 type
modules you cannot mix up series 1 and series 2 modules to setup communication.
It is primarily designed for the wide range controlling applications and to replace the existing non-
standard technologies. It currently operates in 868 MHz band at a data rate of 20Kbps in Europe, 914MHz band
at 40kbps in USA, and the 2.4GHz ISM bands Worldwide at a maximum data-rate of 250kbps. It is used to
verify whether user’s truncation is possible or not. One of the main advantages of this ZIGBEE communication
is that it provides a noise free communication, the amount of noise added in this type of communication is very
less compared to the other wireless communications (G. A et al., 2012).
2.4 LCD
LCD is an output system display, consists an array of tiny segments known as pixels that can be manipulated to
present information. As a result of this technology, many types of these displays are used in applications like
calculator, watch, messaging boards, clock, equipment, machines and a host of other devices that one can think
of.
Most of the Display types are reflective, meaning that they use only ambient light to illuminate the
display. Even displays that do require an external light source consume much less power than CRT devices.
An LCD basically consists of two glass plates with some liquid crystal material between them. The
small size compared to CRT makes it practical for applications where size, current consumption and weight are
the main consideration in electronics design.
A liquid crystal display is a thin, lightweight display device with no moving parts. It consists of an
electrically controlled light polarizing liquid trapped in cells between two transparent polarizing sheets. The
polarizing axes of the two sheets are aligned perpendicular to each other. Each cell is supplied with electrical
contacts that allow an electric field to be applied to the liquid inside.
Fig. 7 below shows the typical LCD modules which can display graphics or characters when interface
with a microcontroller or microprocessor.
Light is polarized by one sheet, rotated through the smooth twisting of the crystal molecules, and then
passes through the second sheet. The whole assembly looks nearly transparent. A slight darkening will be
evident because of light losses in the original polarizing sheet.
When an electric field is applied, the molecules in the liquid align themselves with the field, inhibiting
rotation of the polarized light. As the light hits the polarizing sheet perpendicular to the direction of polarization,
all the light is absorbed and the cell appears dark (IHSglobal, 2013).
According to Stephen Zahra, (2012) stated that pin out on most LCD's will be 14 to 16 pins in a single

Innovative Systems Design and Engineering www.iiste.org
ISSN 2222-1727 (Paper) ISSN 2222-2871 (Online)
Vol.6, No.9, 2015
5
row with the standard 100 mil spacing. The 16 pin version has two extra pins to accommodate a back-light.
However, sometimes the pins are present but not connected to anything. I guess this allows the manufacturer to
have just one board layout for both models. It's always best to look up a datasheet for your part, but the pin out
really is very standardized.
Figure 7. LCD display
Table 2. LCD display pin functions
PIN FUNCTION
1 Ground (Vss), 0V
2 Power (Vdd), +5V
3 Contrast Voltage (usually less than 1V)
4 "R/S" Register Select ( 1 for Data Write, 0 for Command Write)
5 "R/W" Read/Write (1 for Read, 0 for Write)
6 "EN" Enable line (Pulsing high latches a command or data)
7-14 Data Pins (D0-D7) D0 is LSB, in 4-bit mode only D4-D7 are used
15-16 (Optional) Back-light Anode and Cathode, NC, or Not There at All
3. Results
Fig. 8 depicts a testing result using oscilloscope of Acoustic sensor (EM4530) by generating a sound at
frequency of 1.4kHz, the sound generated at 2.0m distance from the sensor. The result show that the signal
amplitude increase with the increase of sound level. The sensor is able to sense sound frequency range between
20Hz to 20kHz audible to human ear.
Innovative Systems Design and Engineering www.iiste.org
ISSN 2222-1727 (Paper) ISSN 2222-2871 (Online)
Vol.6, No.9, 2015
6
Figure 8. Acoustic sensor signal testing
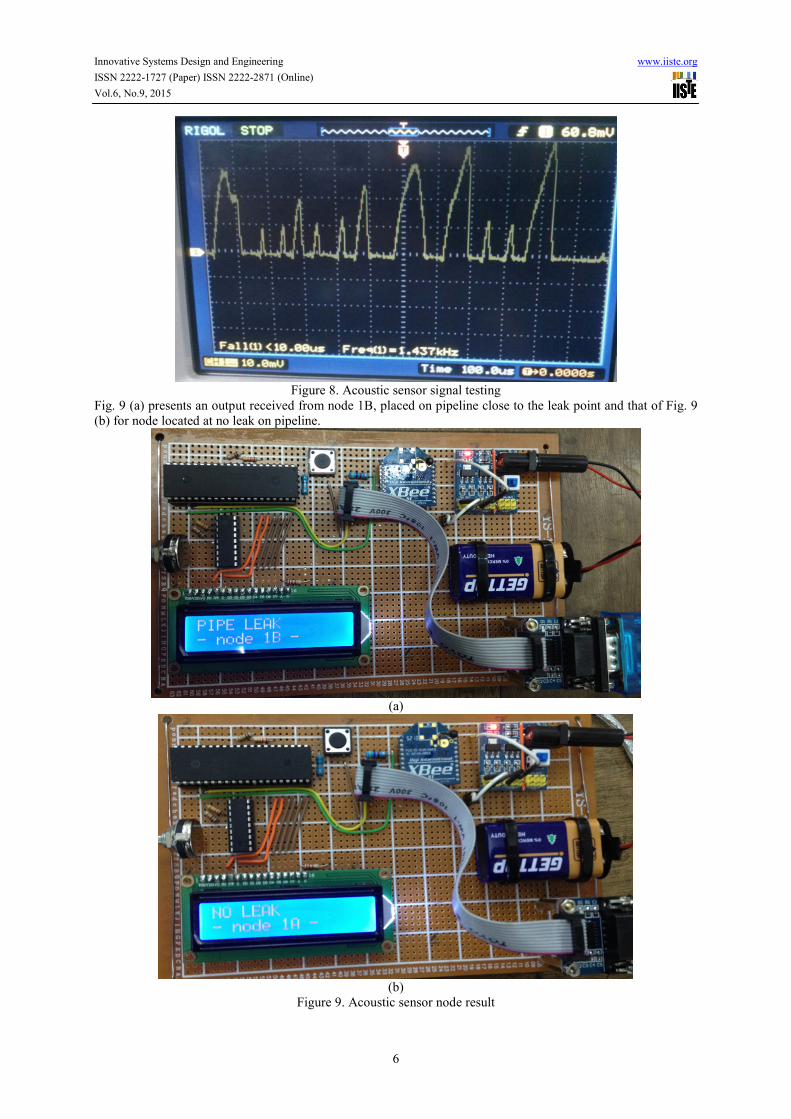
Fig. 9 (a) presents an output received from node 1B, placed on pipeline close to the leak point and that of Fig. 9
(b) for node located at no leak on pipeline.
(a)
(b)
Figure 9. Acoustic sensor node result

Innovative Systems Design and Engineering www.iiste.org
ISSN 2222-1727 (Paper) ISSN 2222-2871 (Online)
Vol.6, No.9, 2015
7
3. Conclusion
We have successfully developed an Acoustic wireless sensor system for gas pipeline leak detection and location.
Hence we strongly believe that the system is the fundamental solution for the gas pipeline management as it does
not require human involvement to perform monitoring and detection task. Despite of challenge encountered
during prototyping the system, but we managed to come out with the system that prove to be used for gas
pipeline leak detection and location. The main challenge is how to interface both hardware and software for the
system to work perfectly without failure.
This system is built to help maintenance and control operator team for gas pipeline to feel comfortable
in a work place and easy to monitor the pipeline. This system device also gives an advantage to the user to easily
get the information about pipeline current situation at control room via Xbee RF wireless technology. The sensor
system uses Acoustic sensor to detect sound frequency emitted at leak point on gas pipeline.
References
Murvay, P. S. & I. Silea (2012). A survey on gas leak detection and localization techniques. Journal of loss
prevention in the process industries 25(6): 966-973.
Boaz L, S. Kaijage & R. Sinde (2014). An overview of pipeline leak detection and location systems. In:
Proceeding of the Pan African International Conference on Information Science, Computing and
Telecommunications (PACT), Arusha-Tanzania (14 to 18 July 2014), 133-137
Kim, M., Lee, S. (2009). Detection of leak acoustic signal in buried gas pipe based on the time-frequency
analysis. Journal of Loss Prevention in the Process Industries 22 (6), 990-994.
Boaz L, S. Kaijage & R. Sinde (2014). Wireless Sensor Node for Gas Pipeline Leak Detection and Location,
International Journal of Computer Applications, 100, 29-33
Pin diagram. Microcontroller (16F887). [Online] Available: http://www.microchip.com. (August 13, 2014.)
G. A. (2012). Implementation of Real time Detection of Gas leakage in Industries using ARM7 &ZigBee.
International Journal of Engineering Research & Technology (IJERT). Vol. 1 (Issue 7, September -
2012)].
IHSglobal. (2013). Electronics Project design. [Online] Available: http://www.electronics-project-
design.com/LCD_Display.html. (Mach 27, 2014)
Stephen Zahra. (2012). LCD Controller Tutorial. [Online] Available:
https://sites.google.com/site/controlandelectronics/lcd-controller-tutorial. (June 24, 2014)

The IISTE is a pioneer in the Open-Access hosting service and academic event management.
The aim of the firm is Accelerating Global Knowledge Sharing.
More information about the firm can be found on the homepage:
http://www.iiste.org
CALL FOR JOURNAL PAPERS
There are more than 30 peer-reviewed academic journals hosted under the hosting platform.
Prospective authors of journals can find the submission instruction on the following
page: http://www.iiste.org/journals/ All the journals articles are available online to the
readers all over the world without financial, legal, or technical barriers other than those
inseparable from gaining access to the internet itself. Paper version of the journals is also
available upon request of readers and authors.
MORE RESOURCES
Book publication information: http://www.iiste.org/book/
Academic conference: http://www.iiste.org/conference/upcoming-conferences-call-for-paper/
IISTE Knowledge Sharing Partners
EBSCO, Index Copernicus, Ulrich's Periodicals Directory, JournalTOCS, PKP Open
Archives Harvester, Bielefeld Academic Search Engine, Elektronische Zeitschriftenbibliothek
EZB, Open J-Gate, OCLC WorldCat, Universe Digtial Library , NewJour, Google Scholar