Leaf aging of Amazonian canopy trees as revealed by ... · PDF fileLeaf aging of Amazonian...
15
Leaf aging of Amazonian canopy trees as revealed by spectral and physiochemical measurements Cecilia Chavana-Bryant 1 , Yadvinder Malhi 1 , Jin Wu 2 , Gregory P. Asner 3 , Athanasios Anastasiou 4 , Brian J. Enquist 2 , Eric G. Cosio Caravasi 5 , Christopher E. Doughty 1 , Scott R. Saleska 2 , Roberta E. Martin 3 and France F. Gerard 6 1 Environmental Change Institute, School of Geography and the Environment, University of Oxford, Oxford, OX1 3QY, UK; 2 Department of Ecology and Evolutionary Biology, University of Arizona, Tucson, AZ 85721, USA; 3 Department of Global Ecology, Carnegie Institution for Science, 260 Panama Street, Stanford, CA 94305, USA; 4 College of Medicine, Swansea University, Singleton Park, Swansea, SA2 8PP, UK; 5 Secci on Qu ımica, Pontificia Universidad Cat olica del Per u (PUCP), Avenida Universitaria 1801, San Miguel, Lima 32, Peru; 6 Centre for Ecology and Hydrology, Wallingford, OX10 8BB, UK Author for correspondence: Cecilia Chavana-Bryant Tel: +44 0 1865 285171 Email: cecilia.chavana- [email protected] Received: 29 September 2015 Accepted: 4 December 2015 New Phytologist (2016) doi: 10.1111/nph.13853 Key words: canopy trees, leaf age, leaf lifecycle, leaf spectral properties, leaf traits, phenology, tropical forests, vegetation indices (VIs). Summary Leaf aging is a fundamental driver of changes in leaf traits, thereby regulating ecosystem processes and remotely sensed canopy dynamics. We explore leaf reflectance as a tool to monitor leaf age and develop a spectra-based par- tial least squares regression (PLSR) model to predict age using data from a phenological study of 1099 leaves from 12 lowland Amazonian canopy trees in southern Peru. Results demonstrated monotonic decreases in leaf water (LWC) and phosphorus (P mass ) con- tents and an increase in leaf mass per unit area (LMA) with age across trees; leaf nitrogen (N mass ) and carbon (C mass ) contents showed monotonic but tree-specific age responses. We observed large age-related variation in leaf spectra across trees. A spectra-based model was more accurate in predicting leaf age (R 2 = 0.86; percent root mean square error (%RMSE) = 33) compared with trait-based models using single (R 2 = 0.07–0.73; %RMSE = 7–38) and multiple (R 2 = 0.76; %RMSE = 28) predictors. Spectra- and trait-based models established a physio- chemical basis for the spectral age model. Vegetation indices (VIs) including the normalized dif- ference vegetation index (NDVI), enhanced vegetation index 2 (EVI2), normalized difference water index (NDWI) and photosynthetic reflectance index (PRI) were all age-dependent. This study highlights the importance of leaf age as a mediator of leaf traits, provides evi- dence of age-related leaf reflectance changes that have important impacts on VIs used to monitor canopy dynamics and productivity and proposes a new approach to predicting and monitoring leaf age with important implications for remote sensing. Introduction A central goal in ecosystem ecology is to link vegetation dynamics to spatial and temporal patterns in primary productivity and bio- geochemical cycles. Recently, there has been much interest in understanding the inter- and intra-annual dynamics of tropical forest phenology using remote sensing methods (Asner et al., 2000, 2004; Saleska et al., 2003, 2007; Huete et al., 2006; Myneni et al., 2007; Doughty & Goulden, 2008; Anderson et al., 2010, 2011; Brando et al., 2010; Samanta et al., 2010, 2012; Bradley et al., 2011; Anderson, 2012; Morton et al., 2014) as they contain 55% of the global carbon stores (Pan et al., 2011) and account for c. 50% of terrestrial photosynthesis (Field et al., 1998). Satellite remote sensing offers an attractive tool for studying the canopy dynamics of tropical forests across large spatial scales. Remote sensing products, such as the Moderate Resolution Imaging Spectroradiometer (MODIS) vegetation indices (VIs), use reflectance data from two or more spectral bands and ratio this data in different ways to provide estimates of canopy greenness – a composite property of both leaf- (leaf intercellular structure and biochemical composition) and canopy-level (canopy leaf area and structure) properties – and other vegetation biophysical properties such as leaf area index (LAI) and/or the fraction of absorbed pho- tosynthetically active radiation (fAPAR) (Huete et al., 2002). Several remote sensing studies have used the MODIS LAI pro- duct (Myneni et al., 2007) and the enhanced vegetation greenness index (EVI; an ‘optimized’ index designed to not saturate in high-biomass regions such as the tropics; Huete et al., 2006) to investigate the inter-annual and seasonal canopy dynamics of the Amazonian basin. These studies report dry season increases in LAI and canopy greenness (a ‘green-up’ effect) across broad areas of Amazonian forests, attributing these increases to flushing of new leaves during the dry season. Although some studies have suggested that remotely detected seasonality in tropical forest canopy greenness might be attributed solely to sensor artifact (Galv ~ ao et al., 2011; Morton et al., 2014), other remote sensing studies (Doughty & Goulden, 2008; Brando et al., 2010; Bradley et al., 2011; Samanta et al., 2012) propose that leaf demography, Ó 2016 The Authors New Phytologist Ó 2016 New Phytologist Trust New Phytologist (2016) 1 www.newphytologist.com Research
-
Upload
trinhtuyen -
Category
Documents
-
view
217 -
download
3
Transcript of Leaf aging of Amazonian canopy trees as revealed by ... · PDF fileLeaf aging of Amazonian...

Leaf aging of Amazonian canopy trees as revealed by spectraland physiochemical measurements
Cecilia Chavana-Bryant1, Yadvinder Malhi1, Jin Wu2, Gregory P. Asner3, Athanasios Anastasiou4, Brian J. Enquist2,
Eric G. Cosio Caravasi5, Christopher E. Doughty1, Scott R. Saleska2, Roberta E. Martin3 and France F. Gerard6
1Environmental Change Institute, School of Geography and the Environment, University of Oxford, Oxford, OX1 3QY, UK; 2 Department of Ecology and Evolutionary Biology, University of
Arizona, Tucson, AZ 85721, USA; 3Department of Global Ecology, Carnegie Institution for Science, 260 Panama Street, Stanford, CA 94305, USA; 4College of Medicine, Swansea University,
Singleton Park, Swansea, SA2 8PP, UK; 5Secci�on Qu�ımica, Pontificia Universidad Cat�olica del Per�u (PUCP), Avenida Universitaria 1801, San Miguel, Lima 32, Peru; 6Centre for Ecology and
Hydrology, Wallingford, OX10 8BB, UK
Author for correspondence:Cecilia Chavana-Bryant
Tel: +44 0 1865 285171Email: cecilia.chavana-
Received: 29 September 2015Accepted: 4 December 2015
New Phytologist (2016)doi: 10.1111/nph.13853
Key words: canopy trees, leaf age, leaflifecycle, leaf spectral properties, leaf traits,phenology, tropical forests, vegetationindices (VIs).
Summary
� Leaf aging is a fundamental driver of changes in leaf traits, thereby regulating ecosystem
processes and remotely sensed canopy dynamics.� We explore leaf reflectance as a tool to monitor leaf age and develop a spectra-based par-
tial least squares regression (PLSR) model to predict age using data from a phenological study
of 1099 leaves from 12 lowland Amazonian canopy trees in southern Peru.� Results demonstrated monotonic decreases in leaf water (LWC) and phosphorus (Pmass) con-
tents and an increase in leaf mass per unit area (LMA) with age across trees; leaf nitrogen
(Nmass) and carbon (Cmass) contents showed monotonic but tree-specific age responses. We
observed large age-related variation in leaf spectra across trees. A spectra-based model was
more accurate in predicting leaf age (R2 = 0.86; percent root mean square error (%RMSE) = 33)
compared with trait-based models using single (R2 = 0.07–0.73; %RMSE = 7–38) and multiple
(R2 = 0.76; %RMSE = 28) predictors. Spectra- and trait-based models established a physio-
chemical basis for the spectral age model. Vegetation indices (VIs) including the normalized dif-
ference vegetation index (NDVI), enhanced vegetation index 2 (EVI2), normalized difference
water index (NDWI) and photosynthetic reflectance index (PRI) were all age-dependent.� This study highlights the importance of leaf age as a mediator of leaf traits, provides evi-
dence of age-related leaf reflectance changes that have important impacts on VIs used to
monitor canopy dynamics and productivity and proposes a new approach to predicting and
monitoring leaf age with important implications for remote sensing.
Introduction
A central goal in ecosystem ecology is to link vegetation dynamicsto spatial and temporal patterns in primary productivity and bio-geochemical cycles. Recently, there has been much interest inunderstanding the inter- and intra-annual dynamics of tropicalforest phenology using remote sensing methods (Asner et al., 2000,2004; Saleska et al., 2003, 2007; Huete et al., 2006; Myneni et al.,2007; Doughty & Goulden, 2008; Anderson et al., 2010, 2011;Brando et al., 2010; Samanta et al., 2010, 2012; Bradley et al.,2011; Anderson, 2012; Morton et al., 2014) as they contain 55%of the global carbon stores (Pan et al., 2011) and account for c.50% of terrestrial photosynthesis (Field et al., 1998).
Satellite remote sensing offers an attractive tool for studyingthe canopy dynamics of tropical forests across large spatial scales.Remote sensing products, such as the Moderate ResolutionImaging Spectroradiometer (MODIS) vegetation indices (VIs),use reflectance data from two or more spectral bands and ratio thisdata in different ways to provide estimates of canopy greenness –
a composite property of both leaf- (leaf intercellular structure andbiochemical composition) and canopy-level (canopy leaf area andstructure) properties – and other vegetation biophysical propertiessuch as leaf area index (LAI) and/or the fraction of absorbed pho-tosynthetically active radiation (fAPAR) (Huete et al., 2002).
Several remote sensing studies have used the MODIS LAI pro-duct (Myneni et al., 2007) and the enhanced vegetation greennessindex (EVI; an ‘optimized’ index designed to not saturate inhigh-biomass regions such as the tropics; Huete et al., 2006) toinvestigate the inter-annual and seasonal canopy dynamics of theAmazonian basin. These studies report dry season increases inLAI and canopy greenness (a ‘green-up’ effect) across broad areasof Amazonian forests, attributing these increases to flushing ofnew leaves during the dry season. Although some studies havesuggested that remotely detected seasonality in tropical forestcanopy greenness might be attributed solely to sensor artifact(Galv~ao et al., 2011; Morton et al., 2014), other remote sensingstudies (Doughty & Goulden, 2008; Brando et al., 2010; Bradleyet al., 2011; Samanta et al., 2012) propose that leaf demography,
� 2016 The Authors
New Phytologist� 2016 New Phytologist Trust
New Phytologist (2016) 1www.newphytologist.com
Research

the effect of age-related variation in photosynthetic efficiency andthe spectral reflectance properties of leaves may significantly con-tribute to explaining this ‘green-up’ effect. If variation in leaftraits, photosynthetic efficiency and associated reflectances is largeenough to influence remotely sensed patterns, these effects shouldbe detectable in individual leaves as they develop and age. How-ever, with the exception of Roberts et al. (1998), no study to datehas conducted in situ measurements to investigate age effects onleaf reflectivity of canopy trees and on the VIs we use to monitortropical canopy dynamics. Furthermore, an efficient and accurateapproach for monitoring leaf age is still largely lacking.
We propose that hyperspectral leaf reflectance can provide anefficient and accurate tool with which to monitor leaf age andintraspecific variation in leaf traits, and thereby enhance ourunderstanding of the mechanisms underlying remotely detectedpatterns. Our proposed methodology takes advantage of the factthat many leaf-scale biochemical and anatomical traits thatchange with leaf age, for example leaf pigmentation, nutrient con-tent, intercellular structure, leaf mass per unit area (LMA) and leafwater content (LWC) (Field & Mooney, 1983; Carter et al.,1989; Miller et al., 1991; Reich et al., 1991; Kitajima et al., 1997,2002; Escudero & Mediavilla, 2003; Mediavilla et al., 2011),have been shown to directly influence the spectral reflectancebehaviour of leaves (Gausman et al., 1970; Knipling, 1970;Roberts et al., 1998; Datt, 1999; Sims & Gamon, 2003). A fewstudies have also observed significant intra-specific variability inleaf spectral reflectance of trees as a result of differences in leaf age(Roberts et al., 1998; Datt, 1999; Lewis, 2002). This study setout to jointly investigate the spectral, morphological (LMA), andbiochemical (leaf water (LWC), phosphorus (Pmass), nitrogen(Nmass) and carbon (Cmass) contents) changes associated with nat-ural leaf aging of 1099 leaves within and across 12 Amazoniancanopy trees in order to address the following questions: (1a)How do leaf spectral properties vary with age and how are thesevariations related to leaf morphological and biochemical traits?(1b) Which spectral domains show most variation associated withleaf aging? (2) Can leaf age be predicted from spectral properties,within and across individual trees, and what are the underlyingmechanisms that mediate the leaf-level spectral age model? (3)What is the sensitivity of VIs to leaf-level age-dependent reflectiv-ity and what are the implications when VIs are used to infer land-scape greenness and productivity in tropical evergreen forests?
By answering these questions, we aimed to reveal how theunderlying morphological and biochemical basis of leaf aging in aselection of Amazonian canopy trees with diverse leaf properties iscaptured by hyperspectral leaf measurements, to offer a new spec-tral approach for determining leaf age and, using leaf-level VIs asproxies, to explore how leaf lifecycle effects can potentially influ-ence the seasonal variation of remotely sensed canopy VIs.
Our paper represents the first attempt to study and predicttropical leaf age using hyperspectral approaches. This paper iscomplemented by two companion papers. In C. Chavana-Bryantet al. (unpublished) we explore the role of leaf age as afundamental driver of intraspecific trait variation withinAmazonian canopy trees. In a follow-up paper, J. Wu et al. (un-published) test the generality of the spectral model we develop
here, by application to an independent data set from a very differ-ent Amazonian forest site in Brazil with slow forest and canopydynamics, and it is also tested for contrasting canopy (sun versusshade) light conditions.
Materials and Methods
Field site
Data were collected in and around two lowland tropical rain-forest plots located within the Tambopata National Reserve inthe Madre de Dios region of Peru in southwestern Amazonia.The two study sites are part of the RAINFOR Amazon ForestInventory Network (Malhi et al., 2002) and GEM intensivemonitoring network, with RAINFOR codes TAM-06(12°50024″S, 69°17059″W) and TAM-09 (12°49048″S, 69°160
48″W). The sites are located between 215 and 220 m above sealevel within lowland closed-canopy primary tropical rain forestgrowing on Haplic alisol soils (Quesada et al., 2010). They arefairly seasonal sites with a 4–5-month-long dry season (numberof months with < 100 mm rainfall) between June and October,mean annual rainfall of 1900 mm (this may be lower than thelong-term mean because of severe droughts in 2005 and 2010;Lewis et al., 2011) and a mean annual air temperature of 24.4°C.A detailed description of the geomorphology, climate and forestcarbon cycle of this site is given by Malhi et al. (2014).
Trees at our sites, as in other tropical forests, exhibit a range ofphenological behaviours, from rapid shedding of short-lived, mesicleaves early in the dry season in deciduous species to irregular orconstant leaf exchange of long-lived, coriaceous leaves in brevidecid-uous and evergreen species (Borchert et al., 2002), and from com-plete intraspecific synchrony to complete asynchrony (Vanschaiket al., 1993). Eleven out of 12 trees in this study displayed brevide-ciduous phenology (i.e. initiated leaf flushing when most senescentleaves had been abscised or after 1–4 wk of leaflessness) andexchanged their leaves before or during the period of the dry season.One tree (Simarouba amara) displayed evergreen phenology andexchanged only c. 50% of its canopy through a prolonged period ofleaf abscission and flushing that lasted the entire dry season.
Tree sampling strategy
The tree sampling for this study focused on canopy and emergenttrees (Table 1), as the chemical properties of top-of-canopy leavesdrive the spectral characteristics of tropical forest canopies (Clarket al., 2005; Asner & Martin, 2008a) as detected by remote sens-ing. According to the Crown Illumination Index (Clark & Clark,1992; Keeling & Phillips, 2007), eight of our sampled trees wereclassified as canopy trees and four were emergent trees. Diameterat breast height (DBH) among sampled trees averaged 171 cm(range 117–237 cm). The sampled trees averaged 32 m in height(range 29–35 m), compared with a mean (� SE) tree height of27� 8 m for canopy trees ≥ 40 cm DBH in local plots. Canopydepth, the difference between tree height and height at the lowestbranch of the canopy, among our sampled trees averaged 9.6 m(range 6.3–15.1 m).
New Phytologist (2016) � 2016 The Authors
New Phytologist� 2016 New Phytologist Trustwww.newphytologist.com
Research
NewPhytologist2

Monitoring canopy and emergent trees in situ presents consid-erable challenges. Canopy walkways and towers, where they exist,do not provide sufficient access across a large number of crowns.Canopy cranes are ideal for such sampling, but there are only afew across the tropics. Hence, we resorted to repeated climbingand sampling of a number of large trees. The total number oftrees sampled in this study was limited by the need to samplestructurally sound trees large enough to withstand the repeatedclimbing required to monitor their leaf lifecycle and sample leavesof different ages, and the difficulty involved in climbing largetrees with ropes to minimize damage caused by repeated climb-ing. We therefore chose to maximize variability within our leafdata set by sampling 12 different tree species with a wide varietyof leaf types (e.g. compound and simple leaves), sizes, shapes,thicknesses and waxinesses. This sampling allowed us to examinethe variability attributable to natural leaf aging of a range of leaftypes, sizes, shapes, thicknesses and waxinesses within individualtrees and across a canopy tree community with diverse leaf prop-erties. As a consequence of our lack of replication within species,we are not able to draw general conclusions about the spectralvariation during the leaf lifecycle of particular species. We are,however, able to explore relationships between leaf traits, spectraand leaf age within individual trees, and, by examining across all12 trees, explore if there is evidence of general relationships ordevelopmental pathways for leaf traits, spectra and leaf age acrossa canopy tree community with diverse leaf properties.
Leaf age classification
We sampled the developmental, mature and senescent leaf phases(the detailed leaf age classification used in this study can be foundin Fig. 1) for eight trees and also sampled some leaf ages from fourother trees (see Supporting Information Table S1 and the ‘Branchsampling’ section in Methods S1). This tree sampling allowed us tobuild a well-balanced leaf phenological data set in which developingleaves were sampled after 1, 2, 3 and 4 wk of active expansion;mature leaves were sampled at different stages (newly matured,mid-maturity and end of maturity); and senescent leaves were alsosampled at different stages (i.e. old leaves not yet abscising and
senescent leaves starting abscission through to advanced senescencewhen most leaves had been abscised from the tree crown).
Based on phenological observations of our trees and the pro-nounced dry season peaks in leaf flush and leaf fall at our site(Malhi et al., 2014), we assigned a 13-month (57-wk) leaf lifecyclefor all trees, which allows for 7 wk of active leaf expansion,6.5months of maturity, 2 months of old age and 3months ofsenescence. This 13-month leaf lifecycle is similar to the mean leaflifespan of 1.6 yr found by Reich et al. (2004) for well-lit trees inan Amazonian terra firme mature forest canopy, although thatstudy was based on a forest in a less seasonal climate and growingon poorer soils, where longer leaf lifespans can be expected.
Morphological and biochemical leaf traits
We selected LMA, LWC, Pmass, Nmass and Cmass as the ensembleof leaf traits to measure (full methodological details are includedin Methods S1). Each of these leaf traits has important links tophysiological and ecological functioning and a demonstratedcontribution to the spectral signatures of vegetation (Curran,1989; Asner et al., 2009). A detailed exploration of these traitsand their relationships to leaf age can be found in C. Chavana-Bryant et al. (unpublished). We assessed leaf waxiness qualita-tively according to leaf glossiness and categorized the eight maintree species into S. amara, Licania brittoniana and Clarisiaracemosa as having high leaf waxiness, and Ruizodendron ovale,Couratari macrosperma, Bertholletia excelsa, Gautteria bolivianaand Pouteria franciscana as having low leaf waxiness.
Leaf spectroscopic measurements
We randomly selected 15–30 leaves from each sampled leaf ageclass for spectral analysis. Leaves were cut (at the base of the peti-ole) from their branch just before reflectance measurements werecollected. Measurements were collected using a field spectrometer(FieldSpec Pro; Analytical Spectral Devices, Boulder, CO, USA)with a spectral range of 350–2500 nm and sampling intervals of1.4 nm from 350 to 1000 and 2 nm from 1000 to 2500 nm. Thespectrometer was fitted with a contact probe (High Intensity
Table 1 Species and structural information for trees sampled for leaf spectral and physiochemical measurements
Tree code Species Family DBH (m)Tree canopyposition Height (m)
Canopydepth (m)
1 Licania brittoniana Fritsch Chrysobalanaceae 1.88 Canopy 29.50 10.503 Simarouba amara Aubl. Simaroubaceae 1.62 Canopy 29.00 8.354 Ruizodendron ovale R.E. Fr. (Ruiz & Pav.) Annonaceae 1.23 Canopy 32.62 10.075 Aspidosperma parvifolium A. DC. Apocynaceae 1.57 Emergent 33.70 8.406 Couratari macrosperma A.C. Sm. Lecythidaceae 1.43 Emergent 33.74 6.277 Licania longistyla (Hook.f.) Fritsch. Chrysobalanacea 1.43 Canopy 30.30 8.708 Bertholletia excelsa Bonpl. Lecythidaceae 2.30 Emergent 34.00 11.609 Tachigali chrysaloides van der Werff Caesalpinioideae 2.10 Canopy 29.70 7.60
10 Clarisia racemosa Ruiz & Pav. Moraceae 1.58 Canopy 33.75 9.2511 Eschweilera coriacea (DC.) S.A. Mori Lecythidaceae 1.88 Emergent 33.32 7.7812 Guatteria boliviana H. Winkl. Annonaceae 1.17 Canopy 31.90 11.3413 Pouteria franciscana Baehni Sapotacea 2.37 Canopy 35.39 15.09
DBH, diameter at breast height.
� 2016 The Authors
New Phytologist� 2016 New Phytologist TrustNew Phytologist (2016)
www.newphytologist.com
NewPhytologist Research 3

Contact Probe; Analytical Spectral Devices) which has its owncalibrated light source designed to minimize measurement errorsassociated with stray light. To ensure measurement quality, thespectrometer was optimized every 5 min, spectra for every leafwere white referenced to a calibration panel (Spectralon; Las-phere, Durham, NH, USA) and an average of 25 spectrum, darkcurrent and white reference measurements were used to improvethe signal-to-noise ratio of the spectra. Furthermore, leaves wereplaced on a custom-designed measurement block covered in alow-reflectivity (3%) material with a firm cushion fittedunderneath to allow the contact probe to be pressed against theleaf without causing damage, while ensuring that no light escapedthe measurement. Four reflectance measurements were collectedand averaged for each leaf (dependent on leaf size). This protocoldelivered high-quality calibrated spectra that did not requiresmoothing or other filters. The full-range leaf spectral data weretrimmed at the far ends (< 412 and > 2450 nm).
In addition to classifying leaves by their age and to account forpotential effects of leaf coatings and natural leaf damage on spec-tra, we recorded the presence of epiphylls (which was always invery low abundance) and/or necrosis for each leaf surface we mea-sured and used only reflectance measurements free of epiphyllsand necrosis.
A short video documenting the fieldwork conducted for thisstudy, which is part of a doctoral research project, can be seen inhttps://vimeo.com/152464003.
Statistical analysis
We used regression analysis to examine the relationships of leaftraits with age (log-transformed) for each individual tree. Onlytrees with four or more sampled leaf age classes were used in theseanalyses with the Akaike information criterion (AIC) and R2 valuesused to identify the best-fit regression models (Fig. 2). For the
Leaf developmental phase ending in maturityAge
codesAge(wk) Leaf description
Y1 1
Young1 – recently emerged leaf, sampled after 1 wk of active leaf expansion. Leaf very fragile and thin, small in size, has no rigidity (folds
Y2 2
Young2 – leaf sampled after 2 wk of active leaf expansion. Leaf still fragile and thin, has notachieved full size, has some rigidity (will not fold
when held up), its colour may be yellow or light green.
if held up), its colour is definitely light green.
Ref
lect
ance
(%
)
Y3 3
Young3 – leaf sampled after 3 wk of active leaf expansion. Leaf not fragile any more, but still thin or close to achieving full thickness and rigidity, has almost achieved full size or
M 7 –35
Mature – fully grown and structurally developed leaf that has achieved a fully darkened green colour. Leaves in this age class are in good condition and show no signs of epiphylls or senescence. Individual trees sampled for up to 3
achieved full size, its colour is darker green.
Leaf senescent phase ending in abscissionAge
codesAge(wk) Leaf description
Wavelength (nm)
months for this age class.
O 36 –44
months before senescence); distinguished from previous age class by darker (shade leaf) and/or yellower (sun leaf) colouration, and by initial signs of epiphylls and/or senescence. Individual trees sampled for up to two consecutive months.
Senescent – leaf in the process of dying and
S 45 –57
p y gabscising; distinguished by loss of chlorophyll and/or onset of decomposition. Individual trees sampled for up to three consecutive months forthis age class.
Wavelength (nm)
Ref
lect
ance
(%
)
Old – leaf near the end of its life cycle ((c. 2
Fig. 1 Leaf age classification used in thisstudy (adapted from Lowman & Box, 1983).Graphs show mean reflectance (15–30leaves) by age class for sun leaves of 12Amazonian canopy and emergent trees. Theyoung/mature (Y/M) leaf age class is notincluded as it was sampled only for two treesfor which Y3 leaves still displayed a lightgreen colouration. Y/M leaves are close tomaturity and have achieved full size, fullthickness and rigidity but their green colour isnot yet fully darkened. Coloured linesrepresent individual trees: 1, Licaniabrittoniana (dark blue); 3, Simarouba amara
(red); 4, Ruizodendron ovale (yellow); 5,Aspidosperma parvifolium (purple); 6,Couratari macrosperma (orange); 7,Licania longistyla (light blue); 8, Bertholletiaexcelsa (light green); 9, Tachigalichrysaloides (black); 10, Clarisia racemosa(pink); 11, Eschweilera coriacea (grey); 12,Guatteria boliviana (dark green); 13,Pouteria franciscana (cyan). Leaf age fordevelopmental phase to maturity wasdetermined by witnessing leaf emergenceand initiation of active leaf expansion. If leafemergence was not observed, leaf age wasdetermined based on leaf condition formature and old leaves. For senescent leaves,an additional classification criterion was thatextensive leaf abscission was observed withinthe canopy of the sampling tree; sampledleaves for this leaf age were those easilyabscised with branch movement.
New Phytologist (2016) � 2016 The Authors
New Phytologist� 2016 New Phytologist Trustwww.newphytologist.com
Research
NewPhytologist4

same subset of trees, we calculated and compared mean reflectance(%; Fig. 3) and reflectance variability (measured as coefficients ofvariation (CVs); bottom graph in Figs 4 and S1) for the differentage cohorts to investigate age effects on leaf reflectivity.
We used a partial least squares regression (PLSR) modellingapproach (Geladi & Kowalski, 1986; Wold et al., 2001) to predictthe age of individual leaves from leaf spectral properties. In orderto do this, we subsampled within the eight trees to predict leaf agewithin these individual trees, and combined leaves from all 12trees and across ages to predict a mean leaf age for our canopy leafcommunity. We also used stepwise (forward) multiple regressionto empirically model leaf age (log-transformed) across all treesusing the five leaf traits (LMA, LWC, Pmass, Nmass and Cmass) andto assess the contribution of these traits to the leaf age prediction.The results of step-wise regressions were then compared to thoseof the spectral leaf age PLSR model results and used to explore themechanisms behind the spectral leaf age model.
PLSR is a standard statistical approach utilized in chemomet-ric analyses and is designed to handle high predictor collinearityand situations where the number of predictor variables (i.e.2151 wavelengths) is much higher than the number of observa-tions. PLSR reduces the large predictor matrix down to a
relatively few, uncorrelated latent factors. As in Asner et al.(2011a,b, 2014, 2015) and Serbin et al. (2014), we performed aone-time randomized 70 : 30 split of our data into calibrationand independent testing sets. We adopted a 1009 permutation10-fold cross-validation (i.e. 100 total permutations using 90%of the calibration data set with 10% used as validation) for eachPLSR model. We evaluated the performance of PLSR modelsusing two main metrics: R2 and root mean square error(RMSE). We identified the optimal number of latent factors byselecting the model that minimized RMSE and maximized R2.The model performance was further characterized by using theindependent testing set. We report the model performance forboth the calibration (Cal) and independent testing (Val) setsand also provide the RMSE as a percentage of the sample mean(% RMSE) following Asner et al. (2011a,b) (Table 2).
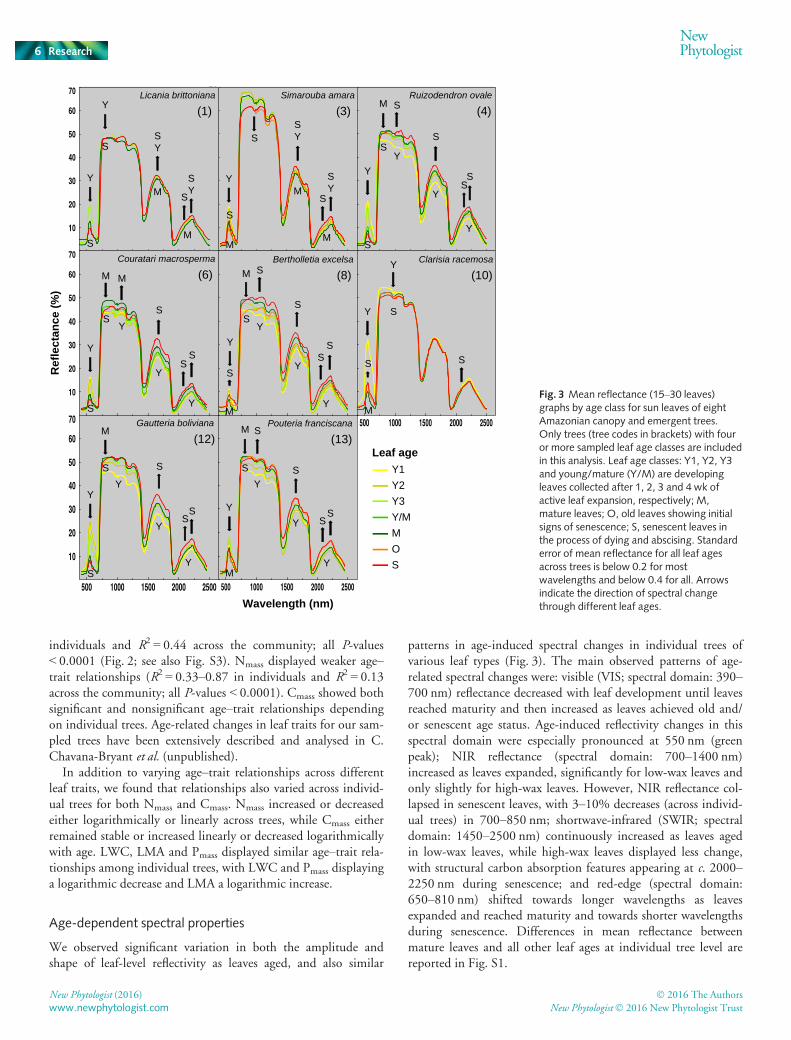
To examine the spectral link between leaf age and leaf traits, weregressed the leaf age spectral weights (w* = PLSR spectral weightsfor each latent factor) for the first five PLSR latent factors againstthose of the leaf traits (Figs 5, S2), and examined the variationexplained by the PLSR latent factors for leaf age and traits (Fig. 6).We also report the leaf age model PLSR spectral coefficients andvariable importance of prediction (VIPs) (Fig. 4; Geladi & Kowal-ski, 1986; Wold et al., 2001). PLSR analyses were performed usingcustom functions along with the MCS function from LIBPLS(http://www.libpls.net) and the PLSREGRESS function in MATLAB
(version R2014a; Mathworks Inc., Natick, MA, USA).Finally, we explored the effect that changes in leaf reflectivity
attributable to age can have on VIs commonly used to measure veg-etation greenness (normalized difference vegetation index (NDVI)and enhanced vegetation index (EVI)), light-use efficiency (photo-synthetic reflectance index (PRI)) and water content (normalizeddifference water index (NDWI)). We used the two-band EVI(EVI2) as atmospheric corrections are not relevant to this studyand derived variants of both NDVI and EVI2 using narrow bands(NB), broad bands (BB) and red edge bands (RE: spectral regionbetween 680 and 780 nm produced by the combination of strongabsorption by leaf pigments in the red region and strong reflectancein the near-infrared (NIR) as a result of scattering in the leaf meso-phyll and the absence of absorption by pigments; Woolley, 1971;Horler et al., 1983). We calculated these VIs for each of our leavesusing individual leaf spectra, the MODIS filter response functions(Xiong, 2015) and equations summarized in Table S2. Mean val-ues and confidence intervals were then calculated for each sampledleaf age class within individual trees and at the community level(i.e. across all 12 trees) (Fig. 7). We report differences (measured in% change) in VIs attrubutable to age.
Results
Age-dependent morphological and biochemical leafproperties
LWC, LMA and Pmass showed strong correlations with age: forLWC, R2 = 0.65–0.93 in individual trees and R2 = 0.73 acrossthe community; for LMA, R2 = 0.62–0.94 in individuals andR2 = 0.40 across the community; for Pmass, R
2 = 0.60–0.93 in
Leaf age (wk)
LMA
(g
m–2
)C
mas
s (%
)LW
C (
%)
Pm
ass
(%)
Nm
ass
(%)
IT R 2 = 0.68–0.93 Com R 2 = 0.73
IT R 2 = 0.33–0.87 Com R 2 = 0.13
IT R 2 = 0.002–0.85 Com R 2 = 0.07
IT R 2 = 0.60–0.93 Com R 2 = 0.44
IT R 2 = 0.62–0.94 Com R 2 = 0.40
Eschweilera coriacea (11)
Tachigali chrysaloides (9)
Licania longistyla (7)
Aspidosperma parvifolium (5)
Licania brittoniana (1)Simarouba amara (3)Ruizodendron ovale (4)
Couratari macrosperma (6)
Bertholletia excelsa (8)
Clarisia racemosa (10)
Pouteria franciscana (13)Guatteria boliviana (12)
Tree species
Community
(a)
(b)
(c)
(d)
(e)
Fig. 2 Relationships between leaf traits and leaf age (log-transformed).Coloured lines represent individual tree regressions (performed only fortrees with four or more sampled leaf age classes; IT R2) and black linesrepresent community regressions (12 trees included; Com R2). Individualleaf trait values are used as data points. Dashed lines are nonsignificantregressions. All significant regressions were P < 0.001. LMA, leaf mass perunit area; LWC, leaf water content; Pmass, leaf phosphorus content; Nmass,leaf nitrogen content; Cmass, leaf carbon content.
� 2016 The Authors
New Phytologist� 2016 New Phytologist TrustNew Phytologist (2016)
www.newphytologist.com
NewPhytologist Research 5
individuals and R2 = 0.44 across the community; all P-values< 0.0001 (Fig. 2; see also Fig. S3). Nmass displayed weaker age–trait relationships (R2 = 0.33–0.87 in individuals and R2 = 0.13across the community; all P-values < 0.0001). Cmass showed bothsignificant and nonsignificant age–trait relationships dependingon individual trees. Age-related changes in leaf traits for our sam-pled trees have been extensively described and analysed in C.Chavana-Bryant et al. (unpublished).
In addition to varying age–trait relationships across differentleaf traits, we found that relationships also varied across individ-ual trees for both Nmass and Cmass. Nmass increased or decreasedeither logarithmically or linearly across trees, while Cmass eitherremained stable or increased linearly or decreased logarithmicallywith age. LWC, LMA and Pmass displayed similar age–trait rela-tionships among individual trees, with LWC and Pmass displayinga logarithmic decrease and LMA a logarithmic increase.
Age-dependent spectral properties
We observed significant variation in both the amplitude andshape of leaf-level reflectivity as leaves aged, and also similar
patterns in age-induced spectral changes in individual trees ofvarious leaf types (Fig. 3). The main observed patterns of age-related spectral changes were: visible (VIS; spectral domain: 390–700 nm) reflectance decreased with leaf development until leavesreached maturity and then increased as leaves achieved old and/or senescent age status. Age-induced reflectivity changes in thisspectral domain were especially pronounced at 550 nm (greenpeak); NIR reflectance (spectral domain: 700–1400 nm)increased as leaves expanded, significantly for low-wax leaves andonly slightly for high-wax leaves. However, NIR reflectance col-lapsed in senescent leaves, with 3–10% decreases (across individ-ual trees) in 700–850 nm; shortwave-infrared (SWIR; spectraldomain: 1450–2500 nm) continuously increased as leaves agedin low-wax leaves, while high-wax leaves displayed less change,with structural carbon absorption features appearing at c. 2000–2250 nm during senescence; and red-edge (spectral domain:650–810 nm) shifted towards longer wavelengths as leavesexpanded and reached maturity and towards shorter wavelengthsduring senescence. Differences in mean reflectance betweenmature leaves and all other leaf ages at individual tree level arereported in Fig. S1.
S
Y Y
S
Y
S
Y
S Y1
Y2
Y3
Y/M
M
O
S
Leaf age
Licania brittoniana
(1)Ruizodendron ovale
(4)
C. macrosperma(6)
Bertholletia excelsa
(8)Clarisia racemosa
(10)
Ref
lect
ance
(%
)
Wavelength (nm)
Pouteria franciscana
(13)Gautteria boliviana
(12)
Simarouba amara
(3)
M
SY
M
SY
Y
S
Y
S
S
Y
S
Y
S
M
Y
S
S
Y
S
Y
S
M
SY
S
M
SY
Y
S
S
Y
S
M
Y
S
M
Y
S
S
Y S
S
Y
S
S
S
Y S
M
Y S
S
Y
S
Y
S
S
M
Y SS
Y
Y
Y
S SS
M M
M
M
M
Couratari macrosperma
(6)
Fig. 3 Mean reflectance (15–30 leaves)graphs by age class for sun leaves of eightAmazonian canopy and emergent trees.Only trees (tree codes in brackets) with fouror more sampled leaf age classes are includedin this analysis. Leaf age classes: Y1, Y2, Y3and young/mature (Y/M) are developingleaves collected after 1, 2, 3 and 4 wk ofactive leaf expansion, respectively; M,mature leaves; O, old leaves showing initialsigns of senescence; S, senescent leaves inthe process of dying and abscising. Standarderror of mean reflectance for all leaf agesacross trees is below 0.2 for mostwavelengths and below 0.4 for all. Arrowsindicate the direction of spectral changethrough different leaf ages.
New Phytologist (2016) � 2016 The Authors
New Phytologist� 2016 New Phytologist Trustwww.newphytologist.com
Research
NewPhytologist6

We also observed age effects in terms of reflectance variability(measured as CV) across individual trees (bottom graph in Figs 4,S4). Reflectance variability was highest in the visible region(CV = 2–53%) and generally lowest in the NIR, except for theregion between the red edge and 850 nm where we observed CVsof up to 50%. Reflectance variability was also high in the SWIR1 region (1450–1940 nm; CV = 4–35%), with main waterabsorption features at c. 1450 and 1940 nm showing peaks invariability (CV = 4–18% and 7–40%, respectively). Furthermore,variability was higher in the SWIR 2 (1940–2450 nm) than inthe SWIR 1 region (CV = 4–35% versus 1–11%, respectively).We found no consistent leaf age effect on CVs across the wholespectrum (Fig. S4).
Spectra-based leaf age model
We treated leaf age as an important but spectrally unexplored leafproperty, and applied PLSR analyses to model leaf age from leaf-level hyperspectral measurements. We tested this spectra-based
age model at both individual tree and community levels. Ourresults (Table 2) revealed that leaf spectra could accurately andprecisely be used to predict leaf age within individual trees(R2 = 0.91–0.98; %RMSE = 10–27 in individual trees), with leafage spanning from 1 to 57 wk. Leaf-level spectra could also pre-dict leaf age across all 12 trees (R2 = 0.86; %RMSE = 33). Fur-thermore, the number of optimal latent factors for the spectralage models showed little variation for individual trees (from fiveto eight factors) and for the community-level model (seven fac-tors). These results confirmed that leaf-level spectra could be usedto classify leaves into young, mature and senescent leaf ages atboth individual tree and community levels.
Trait-based leaf age model
Results from the ‘Age-dependent morphological and biochemicalleaf properties’ subsection indicate that there may be correlationsamong traits, in particular between LMA and LWC (Fig. S5),which makes their relative importance in modelling leaf age diffi-cult to establish. We therefore performed two separate step-wise(forward) regression analyses excluding one of these traits in eachmodel. The best leaf age model was Model 1 (LMA excluded),which included LWC, Nmass and Cmass, respectively, and pre-dicted the variation of leaf age across trees with an accuracy ofR2 = 0.76 and a precision of %RMSE = 32 (Table 3). Model 2(LWC excluded) included Pmass, LMA and Nmass, respectively,and predicted the variation of leaf age across species with both alower accuracy of R2 = 0.50 and precision of %RMSE = 46(Table 3).
These results indicated that LWC was the single most impor-tant leaf trait for modelling leaf age, with a contribution to theleaf age prediction of R2 = 0.73, while Pmass and LMA, the nextmost important traits, had contributions of R2 = 0.45 andR2 = 0.05, respectively. Both Nmass and Cmass had negligible con-tributions (see Table 3). These results agreed with the analysis
Wavelength (nm)
Licania brittoniana (1)Simarouba amara (3)Ruizodendron ovale (4)Couratari macrosperma (6)Bertholletia excelsa (8) Clarisia racemosa (10)
Pouteria franciscana (13)Guatteria boliviana (12)
Tree species
Community
Lea
f ag
e P
LS
R C
CV
Lea
f ag
e P
LS
R V
IP
a,b – chlorophyllsGP – green peakRE – red edgeW – waterP – proteinN – nitrogenL – ligninC – celluloseO – oils
a,b
RE
a
GP
RE
W
W, P, N, L
L,P,N
C
W,L,P,N
P
Cellular structure
C,P,N,O
Fig. 4 Spectral coefficients (C) and variable importance of projection (VIP)for the partial least squares regression (PLSR) leaf age model, and spectralcoefficients of variation (CV) plots. Only trees (tree codes in brackets) withfour or more sampled leaf age classes are included in CV plots, with linesrepresenting individual trees (coloured lines) and the tree community(dashed black line). Dashed vertical lines in VIP and CV plots are peaks inthe leaf age PLSR coefficients. The horizontal dashed line in the VIP plotrepresents the value at which VIPs are considered significant for the theleaf age PLSR model. Leaf physiochemical absorption featurescorresponding to the coefficient peaks of the leaf age PLSR model arebased on Knipling (1970), Curran (1989), Elvidge (1990) and Fourty et al.(1996).
Table 2 Summary statistics and partial least squares regression (PLSR)modelling results for leaf age
Tree
Leaf age (wk)
n M (SD) Range F
R2 RMSE % RMSE
Cal Val Cal Val Cal Val
T1 95 15 (17) 3–57 7 0.95 0.98 4.01 3.75 25 27T3 120 20 (22) 1–51 7 0.93 0.91 5.70 6.00 22 25T4 96 14 (21) 1–54 6 0.98 0.97 2.67 2.01 18 17T6 114 16 (22) 1–54 8 0.97 0.94 4.12 3.96 23 27T8 125 22 (23) 1–57 7 0.97 0.97 4.15 4.03 17 16T10 75 33 (17) 1–57 8 0.96 0.96 3.43 3.15 11 10T12 85 26 (25) 1–53 5 0.98 0.98 3.46 3.79 14 15T13 121 28 (25) 1–57 8 0.97 0.94 4.19 4.75 20 22All 1027 26 (23) 1–57 7 0.86 0.84 8.47 8.05 33 32
M, mean; F, minimum number of latent factors determined by cross-validation for each PLSR model. Root mean square error percentage showsthe error of each model as a percentage of the observed sample mean inthe calibration (Cal.) and independent validation (Val.) data set, respec-tively.
� 2016 The Authors
New Phytologist� 2016 New Phytologist TrustNew Phytologist (2016)
www.newphytologist.com
NewPhytologist Research 7
based on single leaf traits for the subset of eight trees for whichwe had multiple leaf age data (see the ‘Age-dependentmorphological and biochemical leaf properties’ subsection andFig. 2), where we observed that LWC displayed the strongesttrait–age relationship, followed by Pmass and LMA. Furthermore,
due to negative correlation between LMA and LWC (seeFig. S5), most of the contribution of LMA to leaf age predictionis included within the LWC contribution to the model.
Covariance in spectra-age and spectra-trait models: amechanistic basis for the spectral age model
An analysis of the relationship between the PLSR model weightsfor leaf age and the five conventional leaf traits across the first fivePLSR latent factors (Figs 5, S2) revealed that the strongest rela-tionship was found between leaf age and LWC weights across allfive factors (R2 = 0.53–0.91; all P-values < 0.0001), followed byLMA (R2 = 0.12–0.95; all P-values < 0.0001) and Pmass
(R2 = 0.04–0.81; all P-values < 0.0001). Factor weights for bothNmass (R2 = 0.03–0.56; all P-values < 0.0001) and Cmass
(R2 = 0.16–0.46; all P-values < 0.0001 with one nonsignificantrelationship) showed weaker relationships. Furthermore, the vari-ation explained for leaf age and each of the leaf traits by thesePLSR latent factors showed similar patterns as those of the regres-sion analysis of the spectral weights (Fig. 6). The patterns ofvariation explained by each latent factor suggest close spectralrelationships between leaf age, LWC, LMA and Pmass, while thepatterns of variation explained for both Nmass and Cmass indicatedthat they might provide different, but complementary, informa-tion to the overall spectral age relationship.
Vegetation indices change with leaf age
The results of VI calculations for leaves of different agesrevealed that all leaf-level VIs analysed in this study were age-dependent, including indices of water content (NDWI), green-ness (broadband, narrowband, and red edge NDVI and EVI2)and light-use efficiency (PRI) (Fig. 7). Across all trees, theNDWI displayed high sensitivity to leaf age with a continuousdecrease in values with age, while the greenness VIs and PRIinitially increased with leaf development (from youngest tomature cohorts), and then declined when leaves were at oldand senescent stages. Among the greenness VIs, the red edgeNDVI (RE NDVI) and EVI2 (RE EVI2) were the most
LMA
LWC
Pmass
Nmass
Cmass
Leaf age weights
Tra
it w
eig
hts
Factor 2
Factor 3
Factor 4
Factor 5
Factor 1 R2 = 0.16 R2 = 0.84R2 = 0.35R2 = 0.09R2 = 0.00
R2 = 0.12 R2 = 0.89R2 = 0.70R2 = 0.41R2 = 0.16
R2 = 0.66 R2 = 0.91R2 = 0.81R2 = 0.50R2 = 0.46
R2 = 0.95 R2 = 0.90R2 = 0.79R2 = 0.56R2 = 0.46
R2 = 0.71 R2 = 0.53R2 = 0.04R2 = 0.03R2 = 0.18
Fig. 5 Relationships between leaf age spectral weights (w*) and spectralweights for leaf mass per unit area (LMA), leaf water content (LWC),phosphorus content (Pmass), nitrogen content (Nmass) and carbon content(Cmass) (see also Supporting Information Fig. S2). Only spectral weights forthe first five partial least squares regression (PLSR) latent factors (whichcumulatively explain 83% of leaf age variation) are reported. Coloureddata points and lines represent spectral weight values and regressions,respectively, between leaf age and the different leaf traits: LMA (green),LWC (blue), Pmass (red), Nmass (orange) and Cmass (yellow). Dashedregression lines are nonsignificant. All significant regressions wereP < 0.0001.
Latent factor
Tra
it va
riatio
n ex
plai
ned
(%) Leaf age
LMALWCPmassNmassCmass
Fig. 6 Per cent variation explained for leaf age, leaf mass per unit area(LMA), leaf water content (LWC), phosphorus content (Pmass), nitrogencontent (Nmass) and carbon content (Cmass) by partial least squaresregression (PLSR) latent factors.
New Phytologist (2016) � 2016 The Authors
New Phytologist� 2016 New Phytologist Trustwww.newphytologist.com
Research
NewPhytologist8

sensitive to leaf age, with the youngest leaves displaying meandecreases of 26–72% and 14–39%, respectively, and senescentleaves showing mean decreases of 7–31% and 4–20%, respec-tively, relative to mature leaves for individual trees. The broad-band NDVI (BB NDVI) and EVI2 (BB EVI2) displayed meandecreases of 4–39% and 5–33% (for youngest leaves), respec-tively, and 3–15% (for senescent leaves) for individual trees.The narrow band NDVI (NB NDVI) and EVI2 (NB EVI2)displayed much smaller mean decreases of 1–20% (for theyoungest leaves) and 4–11% (for senescent leaves). However,the most dramatic sensitivity to leaf age was observed for thePRI, which decreased on average 133–200% in the youngestleaves and 50–600% for senescent leaves for individual trees.At the community level (across all trees), NDWI values wereon average 22% higher for the youngest and 43% lower forsenescent leaves compared with mature leaves. RE NDVI andEVI2 were 47% and 33% lower for the youngest leaves, respec-tively, and 18% lower for senescent leaves. BB NDVI andEVI2 values were 16% and 22% lower for the youngest leavesand 9% and 11% lower for senescent leaves, respectively, while
NB NDVI and EVI2 values were also lower for both theyoungest and senescent leaves (7% and 11%, respectively). PRIdisplayed the lowest values for both the youngest (167%) andsenescent leaves (200%).
The different sensitivities we found in the greenness VIs(NDVI and EVI2) when derived using different spectral bands/regions (see Table S2) demonstrate that, whereas the narrowband VIs capture too little of the spectral leaf age signal, thebroad band VIs miss the spectral domain that has a maximumcorrelation with leaf age – the RE (see top graph in Fig. 4). Thered edge VIs capture this spectral domain, and thus are the mostsensitive to leaf age.
Discussion
To our knowledge, our study is the first to comprehensively anal-yse the morphological (LMA), biochemical (LWC, Pmass, Nmass
and Cmass) and spectral leaf traits of canopy and emergent tropi-cal tree species during natural (in situ) leaf ageing. Our leaf sam-ples represent a range of leaf types (e.g. compound and simple
Leaf age class
ND
VI
EV
I2N
DW
IP
RI
Red edge (RE NDVI)
Narrowband (NB NDVI)
Red edge (RE EVI2)
Narrowband (NB EVI2)
Broadband (BB NDVI)
Broadband (BB EVI2)
1345678910111213Community
Trees
Fig. 7 Variation in vegetation indices (VIs)commonly used to measure vegetationgreenness (broadband normalized differencevegetation index (BB NDVI) and broadbandenhanced vegetation index 2 (BB EVI2);narrowband (NB) NDVI and NB EVI2; andred edge (RE) NDVI and RE EVI2), watercontent (normalized difference water index(NDWI)) and light use efficiency(photosynthetic reflectance index (PRI))attributable to leaf age. Mean values with95% confidence intervals were calculated foreach sampled leaf age class within individualtrees (coloured lines) and across all trees(black lines). Leaf age classes: Y1, Y2, Y3 andyoung/mature (Y/M) are developing leavescollected after 1, 2, 3 and 4 wk of active leafexpansion, respectively; M, mature leaves;O, old leaves showing initial signs ofsenescence; S, senescent leaves in theprocess of dying and abscising.
� 2016 The Authors
New Phytologist� 2016 New Phytologist TrustNew Phytologist (2016)
www.newphytologist.com
NewPhytologist Research 9

leaves), sizes, shapes, thicknesses and waxinesses. This, togetherwith the variation of these leaf traits across the leaf lifecycle (seeTable 4), resulted in a data set that covered large parts of theglobal leaf trait variability reported for mature leaves. To put ourdata set into perspective, LMA (34.6–214.2 g m�2), LWC (34–81%), P (0.04–0.40%), N (0.85–4.19%) and C (36–60%)exhibited ranges that cover 53, 89, 50, 67 and 100%, respec-tively, of the values reported by Asner et al. (2011a,b) for 6136humid tropical forest trees and also covered large parts of theranges reported by others previously for global leaf trait variation(Wright et al., 2004; Poorter et al., 2009). The high variabilityfound in this leaf phenological data set highlights the importanceof considering leaf age in biochemical, physiological and spectralleaf trait studies, which could have wider implications acrossforests at the global scale.
Variation of leaf spectral characteristics with age and theirrelationship to leaf structure and biochemistry
Consistent with previous studies in both tropical forests(Kitajima et al., 1997, 2002) and nontropical forests (Field &Mooney, 1983; Escudero & Mediavilla, 2003; Niinemets &Kull, 2003; Niinemets et al., 2004, 2005; Mediavilla et al.,2011), our data show strong age effects for leaf traits within indi-vidual trees, with more diverse effects at the tree communitylevel. Our results demonstrate that leaf traits such as LMA, LWCand Pmass display age-dependent monotonic increases (LMA) ordecreases (LWC and Pmass) across individual trees, with thelargest change in these traits happening during leaf expansion.However, interestingly, both Nmass and Cmass displayed tree-specific relationships with age. We also show that these trait–agerelationships mostly remained significant even when young leaveswere not included in the analyses (see Fig. S3). These results sug-gest that reconstructing life histories of multiple physiochemicalleaf properties could be possible and that a single calibration
model may suffice for LWC, LMA and Pmass, while a generalmodel for Nmass and Cmass could be more challenging. The sam-pling of traits through their leaf lifecycle for a much wider rangeof leaf types could allow us to better calibrate for these trait lifehistories. However, the variation within the same species stillremains to be explored, and we cannot infer relationships for par-ticular species with confidence because of a lack of replicationwithin species in our dataset. Furthermore, as in Kitajima et al.(1997, 2002), our results suggest that structural limitations tophotosynthesis as a result of increased LMA (which has beenassociated with increases in total structural carbohydrates andlignin, leaf thickness and density; Niinemets et al., 1999; Poorter& Bongers, 2006; Villar et al., 2006) and biochemical limitationsto photosynthetic capacity may be age-dependent. Thus, intro-ducing leaf aging as a major axis of leaf trait variation would facil-itate predictions of seasonal variation in photosynthesis intropical forests.
Leaf-level spectral properties also show strong age dependence,with the most age-sensitive spectral domains found to be: greenpeak (550 nm), red edge (680–780 nm), NIR (700–850 nm),and around the main water absorption features (c. 1450 and1940 nm) across species. This is because the age-dependentchanges in morphological and biochemical leaf traits wedescribed earlier have a direct influence on the spectral propertiesof leaves (Carter et al., 1989; Miller et al., 1991; Roberts et al.,1998; Datt, 1999; Sims & Gamon, 2002).
Across all trees, reflectance in the visible spectrum (VIS; 412–700 nm) which is dominated by pigment (chlorophylls, antho-cyanins and carotenoids) light absorption (Knipling, 1970;Elvidge, 1990) and controlled by the amount and status of thesepigments (Billings & Morris, 1951), showed a concave responsewith age (Fig. 3). Reflectance decreased continuously across thisspectral domain as chlorophyll developed in young leaves, withthe most marked changes observed at the green peak (550 nm);following maturity, reflectance then increased throughout theVIS but with marked increases at c. 570–630 nm as chlorophyll(the main photosynthetic pigment) broke down relativelyrapidly compared with carotenoids during senescence (Biswall,1995).
In agreement with previous studies by Horler et al. (1983),Boochs et al. (1990) and Roberts et al. (1998), we observed rededge shifts attributable to leaf age. NIR reflectance (700–1400 nm) showed differences in behaviour between high-waxand low-wax leaves. Low-wax leaves displayed a monotonicincrease in NIR reflectance until maturity, while high-wax leavesdisplayed little change in this spectral domain until leavesachieved senescence. Observed NIR increases are associated withthe development of the complex internal cellular structure inyoung leaves whereby photon scattering and reflectance increaseas the number of air–cell wall–water interfaces within leavesincreases (Gausman et al., 1970; Woolley, 1971). However, epi-cuticular waxes and/or thicker cuticles (which have been shownto enhance NIR reflectance by Reicosky & Hanover (1978) andMulroy (1979), respectively) appear to mask the effect of inter-cellular development in young high-wax leaves. During senes-cence, however, both high-wax and low-wax leaves displayed a
Table 3 Results of step-wise (forward) regression modelling for leaf age(log-transformed) using leaf water content (LWC), phosphorus content(Pmass), nitrogen content (Nmass) and carbon content (Cmass) as predictorparameters for Model 1 and leaf mass per unit area (LMA), Pmass, Nmass
and Cmass for Model 2
Model 1summary
Modelstep
Selectedparameters R2 P
R2 = 0.76 1 LWC 0.7339 < 0.0001RMSE = 2.68 2 Nmass 0.7487 < 0.0001%RMSE = 32 3 Cmass 0.7584 0.0003AICc = 735.90
Model 2summary
Modelstep
Selectedparameters R2 P
R2 = 0.50 1 Pmass 0.4484 < 0.0001RMSE = 3.81 2 LMA 0.5019 < 0.0001%RMSE = 46 3 Nmass 0.5042 0.2269AICc = 939.40
Root mean square error (RMSE) and %RMSE are reported on the originalscale. AIC, Akaike information criterion.
New Phytologist (2016) � 2016 The Authors
New Phytologist� 2016 New Phytologist Trustwww.newphytologist.com
Research
NewPhytologist10
marked collapse in NIR reflectance between 700 and 850 nmdue to decreased photon scattering as a result of the breakdownof intercellular structure as leaves senesced. The shortwaveinfrared spectral domain (SWIR; 1400–2500: dominated bywater absorption and biochemical features related to proteins andnitrogen, cellulose, lignin, and other carbon constituents; Wool-ley, 1971; Gao & Goetz, 1995; Fourty et al., 1996; Kokaly et al.,2009; Asner et al., 2015) displayed similar patterns to the NIR.In low-wax leaves, SWIR reflectance showed clear monotonicincrease as LWC decreased with age, while waxes and/or cuticlesalso appeared to mask the decreasing LWC signal in high-waxleaves, which displayed little change until senesce.
The age effects in leaf reflectivity we have described could havepotentially significant impacts for spectral species classificationand many of the VIs commonly used to monitor vegetation pro-ductivity (e.g. PRI) and greenness (e.g. EVI and NDVI). In thefollowing section, we offer an innovative hyperspectral methodol-ogy that can be used to predict leaf age and to disentangle driversof intraspecific trait and spectral variation. We offer this methodas a first step in separating the age signal from species spectraldata used for classification and identifying seasonal patterns inVIs attributable to leaf age.
Spectral leaf age model: underlying mechanisms
The results of our PLSR modelling demonstrate the ability ofspectroscopic data to characterize leaf age for individual trees(R2 = 0.91–0.98; %RMSE = 10–27 across trees) and across a
canopy tree community (R2 = 0.86; %RMSE = 33) with a widerange of different leaf types (Table 2). We found that trees withleaves of different spectral properties aged in a similar manner(Fig. 3) that could be captured by a single calibrated model. Weobserved higher model performance for individual trees thanacross the tree community. Model performance could beimproved with more extensive sampling within two leaf typeshighlighted by our study: a gradient of leaf waxiness as this traitappears to interfere with the age spectral signal in the NIR andSWIR in high-wax leaves, and a gradient of LWC/LMA giventhe strong correlation between these two traits and their couplingwith leaf structure and age. Our results reinforce and, moreimportantly, extend the utility of spectroscopic methods tomodel leaf age.
Unlike using leaf traits individually (Fig. 2) or as multiplepredictors in a step-wise regression model (Table 3) to predict leafage, our PLSR approach captures the simultaneous contribution ofmany important absorption properties of leaves (Fig. 4) across theleaf spectrum, yielding a much more robust model. The spectraldomains of greatest variance (calculated as CVs) among our sam-pled trees and thus potentially containing the most informationrelated to variation in leaf age were captured by both thePLSR coefficients (C) and the variable importance of prediction(VIP) (Fig. 4). Furthermore, the highly significant individualtrait–age relationships, the step-wise regression and the PLSRanalyses demonstrate that LWC is the primary trait related to leafage and that the residual differences between predicted leaf age andLWC might be explained by complementary information (in
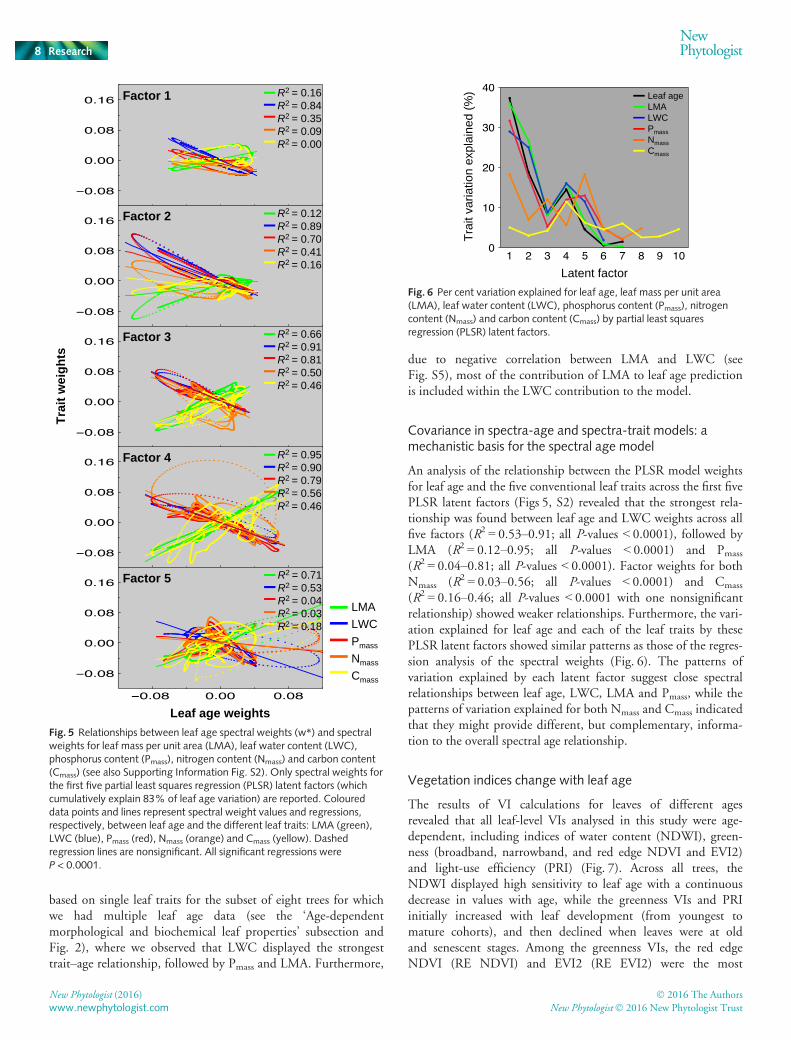
Table 4 Summary statistics for leaf morphological and physiochemical traits by leaf age class (young/mature (Y/M) leaf age not included as only two treeswere sampled for this age class)
Leaf age class
Leaf traits
LMA (gm�2) LWC (%) Pmass (%) Nmass (%) Cmass (%)
Y1 M (SD) 72.8 (25.1) 71 (5) 0.23 (0.08) 2.66 (1.03) 50.22 (2.29)Range 34.6–135.5 60–81 0.11–0.40 0.85–4.19 46.74–55.13n 121 121 40 40 40
Y2 M (SD) 85.4 (34.9) 68 (6) 0.22 (0.06) 2.77 (0.82) 49.66 (2.16)Range 37.6–187.4 55–79 0.10–0.31 1.46–4.08 45.46–53.60n 110 110 35 35 35
Y3 M (SD) 96.9 (26.4) 63 (5) 0.18 (0.06) 2.55 (0.69) 49.12 (1.60)Range 47.4–166.1 51–73 0.08–0.33 1.45–3.69 45.28–52.87n 110 110 35 35 35
M M (SD) 122.5 (26.3) 53 (5) 0.11 (0.03) 2.19 (0.54) 50.33 (3.95)Range 76.1–199.7 44–62 0.06–0.19 1.40–3.68 45.04–59.72n 230 230 65 65 65
O M (SD) 138.7 (28.3) 48 (5) 0.11 (0.04) 2.14 (0.34) 51.73 (4.58)Range 90.4–202.7 38–60 0.05–0.18 1.42–2.93 38.92–59.47n 150 150 50 50 50
S M (SD) 137.0 (32.2) 48 (5) 0.11 (0.04) 2.16 (0.47) 50.65 (4.51)Range 79.4–210.5 34–58 0.04–0.18 1.07–2.89 35.83–57.39n 321 321 80 80 80
All M (SD) 116.45 (37.73) 56 (10) 0.15 (0.07) 2.37 (0.68) 50.34 (3.72)Range 34.60–210.5 34–81 0.04–0.40 0.85–4.19 35.83–59.72n 1099 1099 315 315 315
M, mean; range, minimum and maximum values; n, number of samples. Leaf age classes: Y1, Y2 and Y3 are developing leaves collected after 1, 2 and 3 wkof active leaf expansion, respectively; M, mature leaves; O, old leaves showing initial signs of senescence; S, senescent leaves in the process of dying andabscising.
� 2016 The Authors
New Phytologist� 2016 New Phytologist TrustNew Phytologist (2016)
www.newphytologist.com
NewPhytologist Research 11

descending order of importance) from LMA, Pmass, Nmass andCmass.
The strong spectral relationships between leaf age and LWCare evidenced in the high leaf age PLSR coefficient peaks weobserved at the water absorption features (970, 1450 and1940 nm). Spectral relationships between leaf age and LMA arerelated to the changing internal leaf cellular structure with ageand expressed in PLSR coefficient peaks in the NIR (with partic-ularly high values for 700–850 nm, a spectral region found tohave a positive relationship with leaf thickness by Knapp &Carter (1998), and to be a function of the percentage of intercel-lular air space in the mesophyll and the ratio of mesophyll surfacearea to leaf area by Slaton et al. (2001), Aasamaa et al. (2005) andCastro & Sanchez-Azofeifa (2008)). The relationship betweenleaf age and Pmass and Nmass is related to the build-up duringdevelopment, functioning during maturity and collapse duringsenescence of the leaf photosynthetic apparatus, these relation-ships are reflected in PLSR coefficients peaks at the VIS (particu-larly the green peak at 550 nm), RE (680–750 nm) and SWIR(1510, 1690, 1940 and 2240 nm). The spectral leaf age andCmass relationship is reflected in PLSR coefficient peaks at 1420–1450, 1490, 1690, 1820, 1940 and 2340 nm and related tostructural carbohydrates: polyphenolics and cellulose.
Similar patterns of age-related variation in leaf reflectivity(Figs 3, 4) to those we discuss in the ‘Variation of leaf spectralcharacteristics with age and their relationship to leaf structureand biochemistry’ subsection have also been reported for non-tropical species (Dillen et al., 2012; Yang et al., 2014). Therefore,variations of our spectral age model could potentially apply toleaves from other tropical and nontropical forests. Furthermore,the use of hyperspectral remote sensing to predict leaf age couldbe a powerful indirect method for estimating leaf traits that are afunction of leaf age. Calibration with a wider range of leaf types/species will, of course, be required, but there is a tantalizing possi-bility that calibration will need to be carried out just once toestablish the minima and maxima for groups of leaf types/specieswithin gradients of waxiness and LWC/LMA.
Leaf-level age-dependent vegetation indices: impacts onecosystem processes and satellite remote sensing
All leaf-level VIs we analysed, which measure different aspects ofleaf morphological and biochemical properties, showed agedependence at both the individual tree and community levels(Fig. 7). Red edge-derived greenness VIs were most sensitive tothe leaf age signal, supporting the PLSR spectral-age model highcoefficients and VIPs found for this spectral domain (Fig. 4). Itcould be an interesting exercise to derive pseudo-RE NDVI andEVI using MODIS bands 14 and 15 and explore their seasonalvariation compared with those of the traditional MODIS NDVIand EVI.
Age-dependent VIs in this study were derived from top-of-canopy sun leaves, which drive the spectral characteristics of theupper tropical canopy (Clark et al., 2005; Asner & Martin,2008b). This suggests that the age-dependent leaf reflectance oftop-of-canopy leaves can significantly influence remote sensed
vegetation indices. Indeed, the decreases in community-level VIvalues (PRI = 200%; NDWI = 43%; RE NDVI and REEVI2 = 18% for both VIs) we observed in senescent leaves rela-tive to newly matured dry season leaves are well above or similarto the 25% dry season increase in the MODIS EVI reported byHuete et al. (2006) across seasonally dry Amazon forests. Further-more, field-based studies (Doughty & Goulden, 2008; Chaveet al., 2009; Brando et al., 2010; Malhi et al., 2014) have shownthat many trees in tropical evergreen forests exchange their leavesin and around the dry season. Canopy LAI, however, does notnecessarily change with season, as most trees lose and flush leavesbefore and during the dry season asynchronously within andacross species. Canopy-level VIs will, therefore, be influenced byboth leaf quantity and age distribution. Consequently, in the dryseason, canopy VIs would reflect the mixture of senescent (i.e.leaves with lower VIs from trees that have not yet exchanged theirleaves), young (i.e. new developing leaves with rapidly increasingVIs) and mature leaves (i.e. newly matured leaves with higher VIsattained during the dry season) present. After the dry season,most leaves in the canopy would probably be mature; however,this does not imply a stable canopy VI. As mature leaves age andevolve towards senescence, their morphological, biochemical, andthus spectral properties gradually change towards lower VIsbefore the dry season. Our findings therefore support previousstudies by Huete et al. (2006), Doughty & Goulden (2008) andBrando et al. (2010) that propose that seasonality observed inMODIS EVI and NDVI may be attributable to flushes of newleaf growth in the dry season.
Increasing epiphyll cover with leaf age (Roberts et al., 1998;Toomey et al., 2009) has been suggested to potentially affectremotely sensed VIs. However, from the rare epiphyll cover weencountered in our field observations from this site and anothertwo sites in French Guiana and Brazil (C. Chavana-Bryant, pers.comm.), it seems that epiphyll effects on satellite-based VIs maybe negligible.
Conclusions
This study demonstrates the significant contribution of leaf ageto variation in leaf morphological, biochemical and spectral traitswithin individual Amazonian canopy trees. The age-related leaftrait variations we report here have two important implications:trait variation attributable to leaf age within individual trees cangenerate as much variation as intra- and interspecific variation;and leaf age differences could potentially account for a significantfraction of what we currently understand as intra- and interspeci-fic leaf trait variation. However, leaf age has historically been dif-ficult to measure. This work proposes a simple and efficientapproach for predicting and monitoring leaf age in lowland tropi-cal forests using hyperspectral data.
Our proposed spectral age model will need to be further testedat other sites and with wider data sets and canopy-level mod-elling. However, the results of the testing of our spectral agemodel at a different Amazonian forest site (J. Wu et al., unpub-lished) provide initial support for the generality of our spectralage model for sun leaves of tropical forests.
New Phytologist (2016) � 2016 The Authors
New Phytologist� 2016 New Phytologist Trustwww.newphytologist.com
Research
NewPhytologist12

Finally, this study is the first to directly investigate the effect ofleaf age on commonly used VIs such as NDVI, EVI2, NDWIand PRI. We demonstrate that, at the leaf-level, these VIs displayage sensitivity, with NDWI and PRI displaying high sensitivity.This observed sensitivity, and its timing, suggest that seasonalvariations in remotely sensed VIs previously reported forAmazonian tropical forests may be strongly influenced by leaf ageeffects, although seasonal variation in canopy three-dimensional structure may also be important. Our findings sug-gest that tropical canopy spectral signatures may have relativelytractable and quantifiable variation with leaf age, opening up thepossibility of tracking their leaf demography through remotesensing.
Acknowledgements
This research was supported by an NERC TROBIT project (NE/D005469/1) student grant to C.C-B. with additional grant sup-port to F.F.G. from the Centre for Ecology & Hydrology (CEH).Y.M. is supported by the Jackson Foundation and an ERCAdvanced Investigator Grant GEM-TRAIT (321131). We thankOlivier Jaudoin, Michael Eltringham, Stefan Curtis, Ana Lom-bardero Mor�an, Valentine Alt and Italo Trevi~no Zeballos forexcellent field assistance. We also thank PUCP staff (FabianLimonchi Tamamoto and Eliana Esparza Ball�on) for vital supportwith permits and logistics in Peru, NERC FSF (AlasdairMacArthur and Christopher MacLellan) and CEH staff (CharlesGeorge, Cyril Barrett, Dave McNeil, Alan Warwick and GeoffWicks) for invaluable field equipment support, University of Ari-zona technicians (Vanessa Buzzard and Chris Eastoe) for leafchemical processing, Dan Metcalfe for assisting with leaf area cal-culations, SERNANP for granting research/collection permitsand Explorers’ Inn Tambopata for accommodation. The authorsalso thank the anonymous reviewers who contributed to theimprovement of this manuscript.
Author contributions
C.C-B., Y.M. and F.F.G. planned and designed the research.C.C-B. designed field data collection protocols and conductedfieldwork and field data collection with logistical support fromE.G.C.C. Data integration and quality assurance were performedby C.C-B. and A.A. Data analysis was performed by C.C-B. withsupport from J.W. Chemical analyses were undertaken by B.J.E.at the University of Arizona. C.C-B. wrote the manuscript withcontributions from F.F.G., Y.M., J.W., G.P.A., B.J.E., C.E.D.,S.R.S. and R.E.M.
References
Aasamaa K, Niinemets U, Sober A. 2005. Leaf hydraulic conductance in relation
to anatomical and functional traits during Populus tremula leaf ontogeny. TreePhysiology 25: 1409–1418.
Anderson LO. 2012. Biome-scale forest properties in Amazonia based on field
and satellite observations. Remote Sensing 4: 1245–1271.Anderson LO, Arag~ao LEOC, Shimabukuro YE, Almeida S, Huete A. 2011.
Fraction images for monitoring intra-annual phenology of different vegetation
physiognomies in Amazonia. International Journal of Remote Sensing 32: 387–408.
Anderson LO, Malhi Y, Arag~ao LEOC, Ladle R, Arai E, Barbier N, Phillips O.
2010. Remote sensing detection of droughts in Amazonian forest canopies.
New Phytologist 187: 733–750.Asner GP, Martin RE. 2008a. Airborne spectranomics: mapping canopy
chemical and taxonomic diversity in tropical forests. Frontiers in Ecology and theEnvironment 7: 269–276.
Asner GP, Martin RE. 2008b. Spectral and chemical analysis of tropical forests:
scaling from leaf to canopy levels. Remote Sensing of Environment 112: 3958–3970.
Asner GP, Martin RE, Anderson CB, Knapp DE. 2015.Quantifying forest
canopy traits: imaging spectroscopy versus field survey. Remote Sensing ofEnvironment 158: 15–27.
Asner GP, Martin RE, Ford AJ, Metcalfe DJ, Liddell MJ. 2009. Leaf chemical
and spectral diversity in Australian tropical forests. Ecological Applications 19:236–253.
Asner GP, Martin RE, Knapp DE, Tupayachi R, Anderson C, Carranza L,
Martinez P, Houcheime M, Sinca F, Weiss P. 2011a. Spectroscopy of canopy
chemicals in humid tropical forests. Remote Sensing of Environment 115: 3587–3598.
Asner GP, Martin RE, Tupayachi R, Anderson CB, Sinca F, Carranza-Jim�enez
L, Martinez P. 2014. Amazonian functional diversity from forest canopy
chemical assembly. Proceedings of the National Academy of Sciences, USA 111:
5604–5609.Asner GP,Martin RE, Tupayachi R, Emerson R, Martinez P, Sinca F, Powell
GVN,Wright SJ, Lugo AE. 2011b.Taxonomy and remote sensing of leaf mass
per area (LMA) in humid tropical forests. Ecological Applications 21: 85–98.Asner GP, Nepstad D, Cardinot G, Ray D. 2004. Drought stress and carbon
uptake in an Amazon forest measured with spaceborne imaging spectroscopy.
Proceedings of the National Academy of Sciences, USA 101: 6039–6044.Asner GP, Townsend AR, Braswell BH. 2000. Satellite observation of El Nino
effects on Amazon forest phenology and productivity. Geophysical ResearchLetters 27: 981–984.
Billings WD, Morris RJ. 1951. Reflection of visible and infrared radiation from
leaves of different ecological groups. American Journal of Botany 38: 327–331.Biswall B. 1995. Carotenoid catabolism during leaf senescence and its control by
light. Journal of Photochemistry and Photobiology B: Biology 30: 3–14.Boochs F, Kupfer G, Dockter K, K€uhbauch W. 1990. Shape of the red edge as
vitality indicator for plants. International Journal of Remote Sensing 11: 1741–1753.
Borchert R, Rivera G, Hagnauer W. 2002.Modification of vegetative phenology
in a tropical semi-deciduous forest by abnormal drought and rain. Biotropica34: 27–39.
Bradley AV, Gerard FF, Barbier N, Weedon GP, Anderson LO, Huntingford C,
Aragao LEOC, Zelazowski P, Arai E. 2011. Relationships between phenology,
radiation and precipitation in the Amazon region. Global Change Biology 17:2245–2260.
Brando PM, Goetz SJ, Baccini A, Nepstad DC, Beck PSA, Christman MC.
2010. Seasonal and interannual variability of climate and vegetation indices
across the Amazon. Proceedings of the National Academy of Sciences, USA 107:
14685–14690.Carter GA, Paliwal K, Pathre U, Green TH, Mitchell RJ, Gjerstad DH. 1989.
Effect of competition and leaf age on visible and infrared reflectance in pine
foliage. Plant, Cell & Environment 12: 309–315.Castro KL, Sanchez-Azofeifa GA. 2008. Changes in spectral properties,
chlorophyll content and internal mesophyll structure of senescing Populusbalsamifera and Populus tremuloides leaves. Sensors 8: 51–69.
Chave J, Navarrete D, Almeida S, �Alvarez E, Arag~ao LEOC, Bonal D, Chatelet
P, Silva Espejo J, Goret JY, von Hildebrand P et al. 2009. Regional andtemporal patterns of litterfall in tropical South America. BiogeosciencesDiscussions 6: 7565–7597.
Clark DA, Clark DB. 1992. Life history diversity of canopy and emergent trees in
a neotropical rainforest. Ecological Monographs 62: 315–344.Clark ML, Roberts DA, Clark DB. 2005.Hyperspectral discrimination of
tropical rain forest tree species at leaf to crown scales. Remote Sensing ofEnvironment 96: 375–398.
� 2016 The Authors
New Phytologist� 2016 New Phytologist TrustNew Phytologist (2016)
www.newphytologist.com
NewPhytologist Research 13

Curran PJ. 1989. Remote sensing of foliar chemistry. Remote Sensing ofEnvironment 30: 271–278.
Datt B. 1999. A new reflectance index for remote sensing of chlorophyll content
in higher plants: tests using Eucalyptus leaves. Journal of Plant Physiology 154:30–36.
Dillen SY, Op de Beeck M, Hufkens K, Buonanduci M, Phillips NG. 2012.
Seasonal patterns of foliar reflectance in relation to photosynthetic capacity and
color index in two co-occurring tree species, Quercus rubra and Betulapapyrifera. Agricultural and Forest Meteorology 160: 60–68.
Doughty CE, Goulden ML. 2008. Seasonal patterns of tropical forest leaf area
index and CO2 exchange. Journal of Geophysical Research-Biogeosciences 113:2156–2202.
Elvidge CD. 1990. Visible and near infrared reflectance characteristics of dry
plant materials. International Journal of Remote Sensing 11: 1775–1787.Escudero A, Mediavilla S. 2003.Decline in photosynthetic nitrogen use
efficiency with leaf age and nitrogen resorption as determinants of leaf life span.
Journal of Ecology 91: 880–889.Field C, Mooney HA. 1983. Leaf age and seasonal effects on light, water, and
nitrogen use efficiency in a California shrub. Oecologia 56: 348–355.Field CB, Behrenfeld MJ, Randerson JT, Falkowski P. 1998. Primary
production of the biosphere: integrating terrestrial and ocean components.
Science 218: 237–240.Fourty T, Baret F, Jacquemoud S, Schmuck G, Verdebout J. 1996. Leaf optical
properties with explicit description of its biochemical composition: direct and
inverse problems. Remote Sensing of Environment 56: 104–117.Galv~ao LS, dos Santos JR, Roberts DA, Breunig FM, Toomey M, de Moura
YM. 2011.On intra-annual EVI variability in the dry season of tropical forest:
a case study with MODIS and hyperspectral data. Remote Sensing ofEnvironment 115: 2350–2359.
Gao BC, Goetz AFH. 1995. Retrieval of equivalent water thickness and
information related to biochemical-components of vegetation canopies from
Aviris data. Remote Sensing of Environment 52: 155–162.Gausman HW, Allen WA, Cardenas R, Richardson AJ. 1970. Relation of light
reflectance to histological and physical evaluation of cotton leaf maturity.
Applied Optics 9: 545–552.Geladi P, Kowalski BR. 1986. Partial least-squares regression – a tutorial.Analytica Chimica Acta 185: 1–17.
Horler DNH, Dockray M, Barber J. 1983. The red edge of plant leaf reflectance.
International Journal of Remote Sensing 4: 273–288.Huete A, Didan K, Miura T, Rodriguez EP, Gao X, Ferreira LG. 2002.
Overview of the radiometric and biophysical performance of the MODIS
vegetation indices. Remote Sensing of Environment 83: 195–213.Huete AR, Didan K, Shimabukuro YE, Ratana P, Saleska SR, Hutyra LR, Yang
WZ, Nemani RR, Myneni R. 2006. Amazon rainforests green-up with
sunlight in dry season. Geophysical Research Letters 33: L06405.Keeling HC, Phillips OL. 2007. A calibration method for the crown illumination
index for assessing forest light environments. Forest Ecology and Management242: 431–437.
Kitajima K, Mulkey SS, Samaniego M, Wright SJ. 2002. Decline of
photosynthetic capacity with leaf age and position in two tropical pioneer tree
species. American Journal of Botany 89: 1925–1932.Kitajima K, Mulkey SS, Wright SJ. 1997. Decline of photosynthetic capacity
with leaf age in relation to leaf longevities for five tropical canopy tree species.
American Journal of Botany 84: 702–708.Knapp AK, Carter GA. 1998. Variability in leaf optical propertiesamong 26
species from a broad range of habitats. American Journal of Botany 858: 940–946.
Knipling EB. 1970. Physical and physiological basis for the reflectance of visible
and near-infrared radiation from vegetation. Remote Sensing of Environment 1:155–159.
Kokaly RF, Asner GP, Ollinger SV, Martin ME, Wessman CA. 2009.
Characterizing canopy biochemistry from imaging spectroscopy and its
application to ecosystem studies. Remote Sensing of Environment 113: S78–S91.Lewis L. 2002. Spectral characterization of Australian arid zone plants. CanadianJournal of Remote Sensing 28: 219–230.
Lewis SL, Brando PM, Phillips OL, van der Heijden GMF, Nepstad D. 2011.
The 2010 Amazon drought. Science 331: 554–555.
Lowman MD, Box JD. 1983. Variation in leaf thoughness and phenolic content
among five species of Australian rain forest trees. Australian Journal of Ecology 8:17–25.
Malhi Y, Farf�an Am�ezquita F, Doughty CE, Silva-Espejo JE, Girardin Ca J,
Metcalfe D, Arag~ao Leo C, Huaraca-Quispe LP, Alzamora-Taype I, Eguiluz-
Mora L et al. 2014. The productivity, metabolism and carbon cycle of two
lowland tropical forest plots in south-western Amazonia, Peru. Plant Ecology &Diversity 7: 85–105.
Malhi Y, Phillips OL, Lloyd J, Baker T, Wright J, Almeida S, Arroyo L,
Frederiksen T, Grace J, Higuchi N et al. 2002. An international network to
monitor the structure, composition and dynamics of Amazonian forests
(RAINFOR). Journal of Vegetation Science 13: 439–450.Mediavilla S, Gonz�alez-Zurdo P, Garc�ıa-Ciudad A, Escudero A. 2011.
Morphological and chemical leaf composition of Mediterranean evergreen tree
species according to leaf age. Trees 25: 669–677.Miller JR, Wu JY, Boyer MG, Belanger M, Hare EW. 1991. Seasonal patterns in
leaf reflectance red-edge characteristics. International Journal of Remote Sensing12: 1509–1523.
Morton DC, Nagol J, Carabajal CC, Rosette J, Palace M, Cook BD, Vermote
EF, Harding DJ, North PRJ. 2014. Amazon forests maintain consistent
canopy structure and greenness during the dry season. Nature 506: 221–224.Mulroy TW. 1979. Spectral properties of heavily glaucous and non-glaucous
leaves of a succulent rosette plant. Oecologia 38: 349–357.Myneni RB, Yang WZ, Nemani RR, Huete AR, Dickinson RE, Knyazikhin Y,
Didan K, Fu R, Juarez RIN, Saatchi SS et al. 2007. Large seasonal swings inleaf area of Amazon rainforests. Proceedings of the National Academy of Sciences,USA 104: 4820–4823.
Niinemets U, Cescatti A, Rodeghiero M, Tosens T. 2005. Leaf internal diffusion
conductance limits photosynthesis more strongly in older leaves of
Mediterranean evergreen broad-leaved species. Plant, Cell & Environment 28:1552–1566.
Niinemets U, Kull K. 2003. Leaf structure vs. nutrient relationships vary with soil
conditions in temperate shrubs and trees. Acta Oecologica 24: 209–219.Niinemets U, Kull O, Tenhunen JD. 1999. Variability in leaf morphology and
chemical composition as a function of canopy light environment in coexisting
deciduous trees. International Journal of Plant Sciences 160: 837–848.Niinemets U, Tenhunen JD, Beyschlag W. 2004. Spatial and age-dependent
modifications of photosynthetic capacity in four Mediterranean oak species.
Functional Plant Biology 31: 1179–1193.Pan Y, Birdsey RA, Fang J, Houghton RA, Kauppi PE, Kurz WA, Phillips OL,
Shvidenko A, Lewis SL, Canadell JG et al. 2011. A large and persistent carbon
sink in the world’s forests. Science 333: 988–993.Poorter H, Niinemets €U, Poorter L, Wright IJ, Villar R. 2009. Causes and
consequences of variation in leaf mass per area (LMA): a meta-analysis. NewPhytologist 182: 565–588.
Poorter L, Bongers F. 2006. Leaf traits are good predictors of plant performance
across 53 rain forest species. Ecology 87: 1733–1743.Quesada CA, Lloyd J, Schwarz M, Pati~no S, Baker TR, Czimczik CI, Fyllas
NM, Martinelli LA, Nardoto GB, Schmerler J. 2010. Variations in chemical
and physical properties of Amazon forest soils in relation to their genesis.
Biogeosciences 7: 1515–1541.Reich PB, Uhl C, Waiters MB, Ellsworth DS. 1991. Leaf lifespan as a
determinant of leaf structure and function among 23 amazonian tree species.
Oecologia 86: 16–24.Reich PB, Uhl C, Walters MB, Prugh L, Ellsworth DS. 2004. Leaf demography
and phenology in Amazonian rain forest: a census of 40,000 leaves of 23 tree
species. Ecological Monographs 74: 3–23.Reicosky DA, Hanover JW. 1978. Physiological effects of surface waxes. PlantPhysiology 62: 101–104.
Roberts DA, Nelson BW, Adams JB, Palmer F. 1998. Spectral changes with leaf
aging in Amazon caatinga. Trees 12: 315–325.Saleska SR, Didan K, Huete A, da Rocha HR. 2007. Amazon forest green-up
during 2005 drought. Science 318: 612.Saleska SR, Miller SD, Matross DM, Goulden ML, Wofsy SC, da Rocha HR,
de Camargo PB, Crill P, Daube BC, de Freitas HC et al. 2003. Carbon in
amazon forests: unexpected seasonal fluxes and disturbance-induced losses.
Science 302: 1554–1557.
New Phytologist (2016) � 2016 The Authors
New Phytologist� 2016 New Phytologist Trustwww.newphytologist.com
Research
NewPhytologist14

Samanta A, Ganguly S, Hashimoto H, Devadiga S, Vermote E, Knyazikhin Y,
Nemani RR, Myneni RB. 2010. Amazon forests did not green-up during the
2005 drought. Geophysical Research Letters 37: L05401.Samanta A, Knyazikhin Y, Xu L, Dickinson RE, Fu R, Costa MH, Saatchi SS,
Nemani RR, Myneni RB. 2012. Seasonal changes in leaf area of Amazon
forests from leaf flushing and abscission. Journal of Geophysical Research:Biogeosciences 117: G01015.
Serbin SP, Singh A, Mcneil BE, Kingdon CC, Townsend PA. 2014.
Spectroscopic determination of leaf morphological and biochemical traits for
northern temperate and boreal tree species. Ecological Applications 24: 1650–1669.
Sims DA, Gamon JA. 2002. Relationships between leaf pigment content and
spectral reflectance across a wide range of species, leaf structures and
developmental stages. Remote Sensing of Environment 81: 337–354.Sims DA, Gamon JA. 2003. Estimation of vegetation water content and
photosynthetic tissue area from spectral reflectance: a comparison of indices
based on liquid water and chlorophyll absorption features. Remote Sensing ofEnvironment 84: 526–537.
Slaton MR, Hunt ER, Smith WK. 2001. Estimating near-infrared leaf
reflectance from leaf structural characteristics. American Journal of Botany 88:278–284.
Toomey M, Roberts DA, Nelson B. 2009. The influence of epiphylls on remote
sensing of humid forests. Remote Sensing of Environment 113: 1787–1798.Vanschaik CP, Terborgh JW, Wright SJ. 1993. The phenology of tropical forests
– adaptive significance and consequences for primary consumers. AnnualReview of Ecology and Systematics 24: 353–377.
Villar R, Ruiz-Robleto J, De Jong Y, Poorter H. 2006. Differences in
construction costs and chemical composition between deciduous and evergreen
woody species are small as compared to differences among families. Plant, Cell& Environment 29: 1629–1643.
Wold S, Sj€ostr€om M, Eriksson L. 2001. PLS-regression: a basic tool of
chemometrics. Chemometrics and Intelligent Laboratory Systems 58: 109–130.Woolley JT. 1971. Reflectance and transmittance of light by leaves. PlantPhysiology 47: 656–662.
Wright IJ, Reich PB, Westoby M, Ackerly DD, Baruch Z, Bongers F,
Cavender-Bares J, Chapin T, Cornelissen JHC, Diemer M et al. 2004. Theworldwide leaf economics spectrum. Nature 428: 821–827.
Xiong J-MCST. 2015.MODIS parameters. [WWW document] URL
mcst.gsfc.nasa.gov [accessed 13 June 2015].
Yang X, Tang J, Mustard JF. 2014. Beyond leaf color: comparing camera-based
phenological metrics with leaf biochemical, biophysical, and spectral properties
throughout the growing season of a temperate deciduous forest. Journal ofGeophysical Research: Biogeosciences 119: 181–191.
Supporting Information
Additional supporting information may be found in the onlineversion of this article.
Fig. S1 Difference in mean reflectance between mature leavesand other leaf age classes for sun leaves of eight Amazoniancanopy and emergent trees.
Fig. S2 Spectral weights (w*) for leaf age, leaf mass per unit area(LMA), leaf water content (LWC), phosphorus content (Pmass),nitrogen content (Nmass) and carbon content (Cmass).
Fig. S3 Relationships between leaf traits and leaf age (not includ-ing developing leaves).
Fig. S4 Spectral coefficients of reflectance variation (CV) by leafage class for sun leaves of eight Amazonian canopy and emergenttrees.
Fig. S5 Relationship between leaf water content (LWC) and leafmass per unit area (LMA).
Table S1 Leaf sampling scheme by tree, canopy position(SU = sun) and leaf age class
Table S2 List of vegetation indices (VIs) and correspondingequations used in this study
Methods S1 Branch sampling and leaf traits and measurements.
Please note: Wiley Blackwell are not responsible for the contentor functionality of any supporting information supplied by theauthors. Any queries (other than missing material) should bedirected to the New Phytologist Central Office.
� 2016 The Authors
New Phytologist� 2016 New Phytologist TrustNew Phytologist (2016)
www.newphytologist.com
NewPhytologist Research 15