Leading intimate healthcare Relations...Coloplast delivered 2015/16 7% organic growth and 34% EBIT...
60
Leading intimate healthcare Roadshow presentation 2015/16
Transcript of Leading intimate healthcare Relations...Coloplast delivered 2015/16 7% organic growth and 34% EBIT...

Leading intimate healthcareRoadshow presentation
2015/16

Page 2
The forward-looking statements contained in this presentation, including forecasts of sales and earnings performance, are not guarantees of future results and are subject to risks, uncertainties and assumptions that are difficult to predict. The forward-looking statements are based on Coloplast’s current expectations, estimates and assumptions and based on the information available to Coloplast at this time.
Heavy fluctuations in the exchange rates of important currencies, significant changes in the healthcare sector or major changes in the world economy may impact Coloplast's possibilities of achieving the long-term objectives set as well as for fulfilling expectations and may affect the company’s financial outcomes.
Forward-looking statements

Coloplast delivered 2015/16 7% organic growth and 34% EBIT margin in constant currencies
Page 3
• Organic revenue growth of 7% and 6% in DKK
− For Q4, organic revenue growth of 7% and 3% in DKK
• Gross margin of 69% in constant exchange rates and 68% in DKK
• EBIT margin of 34% in constant exchange rates and 33% in DKK
• Total dividend of DKK 13.5 per share for 2015/16 (DKK 9 per share to be proposed at 2016 AGM)
• ROIC after tax before special items of 49%
• Financial guidance for 2016/17:
− Organic revenue growth of 7-8% and 5-6% in DKK
− EBIT margin of 33-34% in constant exchange rates and ~33% in DKK
− CAPEX guidance of around DKK 700m
HighlightsRevenue growth
EBITEBIT (DKKm)
Reported revenue (DKKm)
Organic growth
Reported EBIT margin (%)
+3%
FY 15/16
14,681
FY 14/15
13,909+7%
+7%
+6%
Q4 15/16
3,739
Q4 14/15
3,621
34 34
35
1,249
Q4 15/16
1,284
Q4 14/15
3333
34
FY 14/15
4,535
FY 15/16
4,846
1)
1) Before special items. Special items Q4 2014/15 includes DKK 3bn provision related to transvaginal surgical mesh products. Special items Q4 2015/16 includes DKK 0.75bn provision related to transvaginal surgical mesh products
EBIT margin in constant currencies (%)
Reported growth

2015/16 organic growth was 7% against a market growth of 4-5%
Page 4
Other developed markets
Emerging markets
Coloplast Group
European markets
Reported revenueDKKm
2015/16 revenue by geography
Organic growthIn percent
Geographicarea
6%
6%
14%
7%
Continence Care
Urology Care
Wound & Skin Care
Ostomy Care
ColoplastGroup
2015/16 revenue by business area
9%
5%
9%
6%
7%
Business area
Reported revenueDKKm
Organic growthIn percent
1,497
2,067
5,935
14,681
5,182
Share of growthIn percent
2,291
9,213
3,177
14,681
Share of growthIn percent
48%
21%
18%
13%
100%
48%
30%
22%
100%

Ostomy Care grew 9% in 2015/16 driven by SenSura® range and Brava® accessories
Page 5
CommentsPerformance
• 2015/16 organic growth of 9% (7% in DKK). Q4 organic growth of 8%
• Satisfactory growth in UK, China, Russia, Nordic markets and Argentina
• Satisfactory growth in SenSura® portfolio driven by UK, Germany, Nordic markets and US
• Growth in Brava® accessories range especially in France, China and UK
• Assura/Alterna® portfolio growth driven by China, Russia and Algeria
• SenSura® Mio Convex launched in 16 markets – due to strong demand Coloplast experienced capacity constraints in Q3 2015/16. New capacity will be made available during 2016/17
• Q4 growth negatively impacted by backorders on urostomy bags due to quality issues related to an external raw materials supplier. Backorder situation is expected to be normalized during Q1 2016/17
• Global market leader with 35-40% share of a DKK 15-16bn market, growing 4-5% annually
5
7
5
99
8
11
9
8
7
1,449
Q3 15/16
1,518
Q1 15/16
1,469
Q4 14/15 Q4 15/16
1,519
Q2 15/16
1,429
Revenues (DKKm)Organic growth (%)Reported growth (%)

Continence Care grew 5% in 2015/16 negatively impacted by US distributor buying patterns and inventory reduction
Page 6
• 2015/16 organic sales growth of 5% (3% in DKK). Q4 organic growth of 6%
• Satisfactory growth in UK, France, Argentina and Russia
• Growth driven by SpeediCath® Compact catheters in the UK, France and Germany
• Growth in standard catheters challenged by distributor buying patterns and inventory reductions in the US and lower tender value in Saudi Arabia compared to last year
• Peristeen® growth remains satisfactory especially in UK, US and France
• SpeediCath® Flex will be launched in all key markets during 2016/17
• Global market leader with ~40% share of a DKK ~12bn market, growing 5-6% annually
CommentsPerformance
12
1
10
16
6663
10
1,249
Q2 15/16
1,2821,308
Q4 14/15
1,330
Q1 15/16
1,343
Q4 15/16Q3 15/16
Reported growth (%) Organic growth (%) Revenues (DKKm)
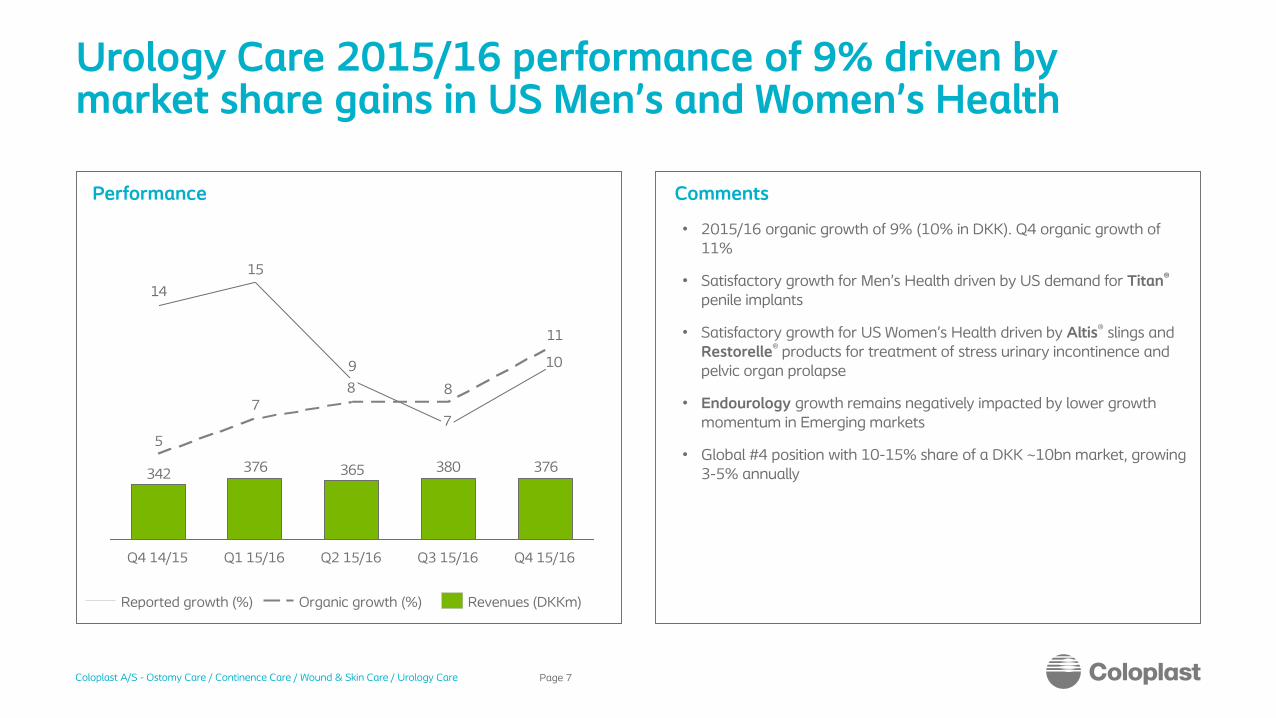
Urology Care 2015/16 performance of 9% driven by market share gains in US Men’s and Women’s Health
Page 7
• 2015/16 organic growth of 9% (10% in DKK). Q4 organic growth of 11%
• Satisfactory growth for Men’s Health driven by US demand for Titan®
penile implants
• Satisfactory growth for US Women’s Health driven by Altis® slings and Restorelle® products for treatment of stress urinary incontinence and pelvic organ prolapse
• Endourology growth remains negatively impacted by lower growth momentum in Emerging markets
• Global #4 position with 10-15% share of a DKK ~10bn market, growing 3-5% annually
CommentsPerformance
376380365376342
9
15
14
10
11
5
87
8
Q4 14/15 Q1 15/16 Q3 15/16 Q4 15/16
7
Q2 15/16
Revenues (DKKm)Organic growth (%)Reported growth (%)

WSC delivered 2015/16 6% organic growth adversely impacted by lower growth momentum in Emerging Markets
Page 8
• 2015/16 organic sales growth in WSC of 6% (5% in DKK), and 5% for Wound Care in isolation
• Q4 organic growth for WSC of 3%, and 2% for Wound Care in isolation
• Growth in Wound Care driven by Biatain® sales, especially Biatain®
Silicone in UK and Germany
• Growth in Wound Care challenged by reimbursement reform in France and lower growth momentum in Emerging markets and in particular China
• Satisfactory growth in Skin Care in the US driven by InterDry® sales
• Contract production of Compeed® contributed positively to sales growth
• Broader silicone portfolio, Biatain® Silicone Sizes & Shapes will be launched in all key markets during 2016/17
• Global #5 position with 7-9% share of a DKK 17-19bn market, growing 3-5% annually
CommentsPerformance
501506
503500
00
7
1515
34
910
9
2
63
9
Q4 15/16Q3 15/16Q2 15/16
557
Q1 15/16
9
Q4 14/15
Organic growth WC (%)
Revenues (DKKm)
Organic growth (%)
Reported growth (%)

• EBIT before special items grew 7% to DKK 4,846m with a reported margin of 33% in line with last year (34% in constant currencies)
• Q4 reported EBIT margin of 34% in line with last year (35% in constant
currencies)• Gross margin of 68% compared to 69% last year
• Continued efficiency gains and positive impact from reduction of approx. 100 production employees in DK primarily offset by product mix and depreciation on new machinery
• Distribution-to-sales 28% on par with last year• Investments in sales and marketing
initiatives, primarily in the US, China, UK and Germany
• Admin costs-to-sales of 4% on par with last year • R&D costs increased 15% compared to 2014/15
due to increased activity, however cost-to-sales
ratio in line at 3%
2015/16 operating margin of 33% in DKK impacted by efficiency gains, product mix, R&D activity and currency
Page 9
CommentsPerformance
1) Before special items. Special items Q4 2014/15 includes DKK 3bn provision2) Before special items. Special items Q4 2015/16 includes DKK 0.75bn provision
∆ R&D-to-sales
-0.3
∆ Admin-to-sales
0.5
∆ Distribution-to-sales
0.1
Reported EBIT
margin 15/16
33.0
∆ Other operating
items
0.3
∆ Gross profit
-0.2
Reported EBIT
margin 14/15
32.61)
2)
EBIT margin 15/16
(constant currencies)
0.5
33.5
Currency adjustment
2)

Positive impact on FCF from higher EBITDA and lower tax payments offset by payments for Mesh settlements
Page 10
• Free cash flow was DKK 2,425m compared to DKK 2,869m for 2014/15
• EBITDA DKK 354m higher
• NWC-to-sales of 24%, in line with 2014/15
• Negative impact from deposits into escrow account and other costs in relation to US Mesh litigation (total YTD payments of DKK 1.6bn)
• Tax payments DKK 813m lower due to voluntary on-account tax payments in 2014/15
• CAPEX-to-sales of 4% in line with last year
• Net sale of bonds decreased by DKK 70m
• 2015/16 FCF ex. Mesh impact of approx. DKK 4bn
CommentsPerformance
17
21
19
26
20
2,372
12/13
2,977
11/12
2,259
10/11
1,251
13/14
2,869
15/1614/15
2,42512
FCF-to-Sales (%) FCF (DKKm)

Financial guidance for 2016/17
Page 11
Tax rate
CAPEX (DKKm)
EBIT margin
Sales growth
Guidance 16/17 Guidance 16/17 (DKK) Long term ambition
7-8% (organic)
33-34% (constant exchange rates)
5-6%
~33
700
7-9% p.a.
+50-100 bps p.a.
4-5% of sales
~23

Leading intimate healthcareIntroduction to Coloplast

Ostomy Care41%
Continence Care35%
Urology Care10%Wound & Skin
Care14%
= Coloplast’s global market position
Group revenue 2015/16 by geography
Coloplast has four business areas all with global sales presence
Page 13
European markets
63%
Other developed markets
22%
Emerging markets
15%
#1
#4
#1
X
DKK14.7bn
DKK 14.7bn
#5
Group revenue 2015/16 by segment

Coloplast specializes in intimate healthcare needs
Page 14
People who have had their intestine redirected to an opening in the abdominal wall
People in need of bladder or bowel management
People with dysfunctional urinary and reproductive systems
Who are our typical users How do we help them?
SenSura® MioOstomy bag
SpeediCath®
Flexible male urinary catheter
Titan® OTRPenile implant
Biatain® SiliconeFoam wound dressing
Ostomy Care
Continence Care
Urology Care
Wound Care
People with difficult-to-heal wounds

Intimate healthcare is characterized by stable industry trends
Page 15
Drivers Limiters
Growing elderly population increases customer base for Coloplast products
Expanding healthcare coverage for populations in emerging markets increases addressable market
Demographics1
2 Emerging markets
1
2
Surgical and medical trends
Healthcare reforms
Earlier detection and cure, eventually reduces addressable market for Coloplast treatment products
Economic restraints drive reimbursement reforms, introduction of tenders, and lower treatment cost
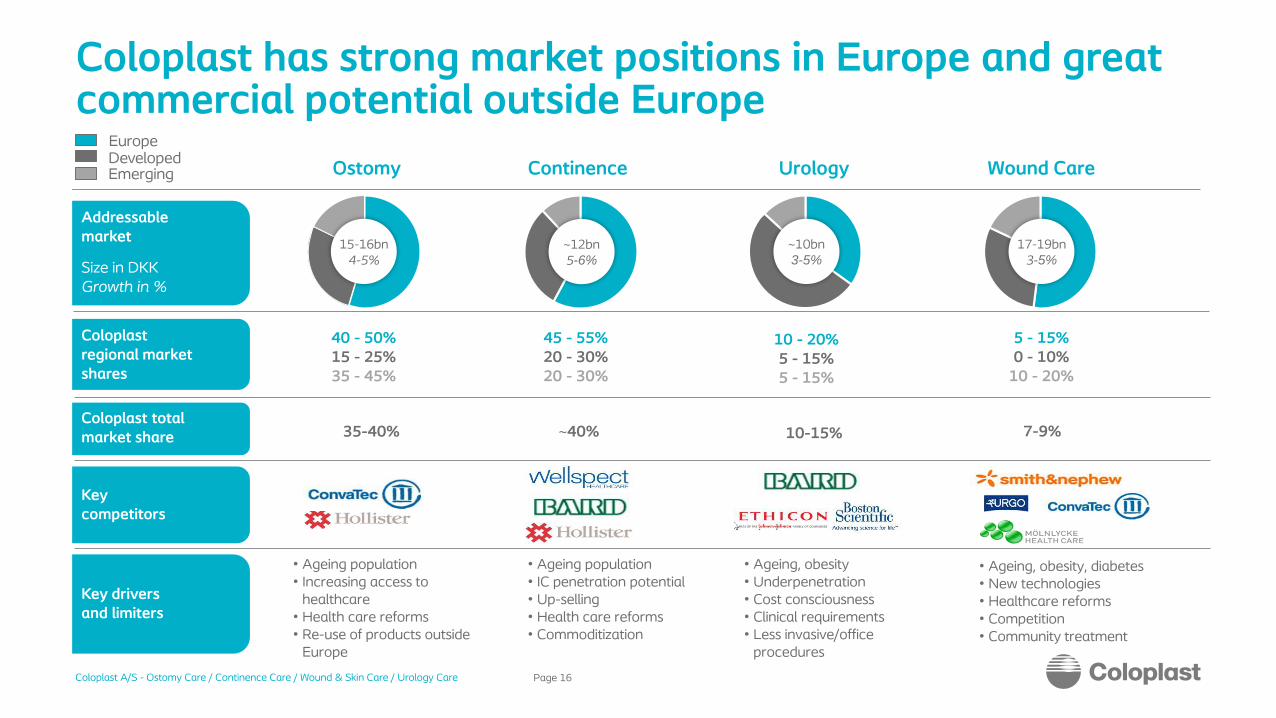
Coloplast has strong market positions in Europe and great commercial potential outside Europe
Page 16
Ostomy Continence Urology Wound Care
Addressablemarket
Size in DKKGrowth in %
Coloplast regional market shares
Coloplast total market share
Key competitors
Key drivers and limiters
15-16bn4-5%
~12bn5-6%
~10bn3-5%
17-19bn3-5%
40 - 50%15 - 25%35 - 45%
45 - 55%20 - 30%20 - 30%
10 - 20%5 - 15%5 - 15%
5 - 15%0 - 10%
10 - 20%
35-40% ~40% 10-15% 7-9%
• Ageing population• Increasing access to
healthcare• Health care reforms• Re-use of products outside
Europe
• Ageing population• IC penetration potential• Up-selling• Health care reforms• Commoditization
• Ageing, obesity• Underpenetration• Cost consciousness• Clinical requirements• Less invasive/office
procedures
• Ageing, obesity, diabetes• New technologies• Healthcare reforms• Competition• Community treatment
EuropeDevelopedEmerging

Coloplast’s new strategy will drive revenue and earnings growth across 4 major themes
Page 17
Superior products & innovation
Unique user focused market approach
Strong leadership development
Unparalleled efficiency
1
3
4
2

We have launched innovative products across business areas and invested heavily in Consumer activities
Page 18
Continence Care Ostomy Care
Wound Care Urology Care
Consumer focus
Consumer Care

We will continue to push for efficiency gains across Global Operations and Business Support
Page 19
Global operations
• Efficiency improvement in the subsidiaries, HQ and business support centre
• Subsidiaries to focus on commercial priorities
• Add new tasks performed by our Business Centre on an ongoing basis
Business support
1. Reduce risk of supply disruption
2. Improve quality of daily material supply
3. Develop footprint 4. Innovation Excellence
5. Optimise supply chain and distribution
6. Retain cost focus

Expansion relies on our organisation and strong leadership development is key to support growth
Page 20
Our organisation will grow … … and it will be even more important to hire for a career and not a job
~250
new leadersby 19/20
Build our internal leadership pipeline
Secure performance and people development
Hire externally for key leadership competencies
Continue to recruit young talent straight out of school
Internal External
~3,000new positions
by 19/20

The strategy will commit up to DKK 2bn in new investments towards 2020
Page 21
Wound care
Innovation
Consumer
Key strategic initiatives Geographical focus areas
Emerging Markets
Pacific
USUK

Profitability uplift to be driven by scalability and efficiency improvements
Page 22
Gross margin development, in % of revenue Cost item
Distribution
Admin
R&D
Development, in % of revenue
68.368.568.767.666.6
+1.7%-points
Long-term15/1614/1513/1412/1311/12
28.128.528.328.528.8
-0.7%-points
28-29
3.84.34.04.6
5.6
-1.8%-points
~4
3.53.23.13.33.1
14/15 15/16
3-4
Long-term
+0.4%-points
13/1412/1311/12

We will continue to deliver strong and attractive free cash flows …
Page 23
• Continued investment in machines and capacity expansion
• Widen factory footprint – factory extensions and/or greenfield investments
4.3%
11/1210/11
3.5%
2.3%
Long-term
2.7%
4-5%
13/14 14/1512/13
CAPEX DKKm
CAPEX in % of revenue
Depreciation in % of revenue
• Working capital expected to be stable at ~24%
• Improve debtor policy in Emerging markets
• Stable inventory levels going forward
23.8%23.9%
11/12 15/1613/14 14/15
24.1%22.5%
12/13
22.2%
Long-term
Operating working capital in % revenue
Net working capital CAPEX1
• DK statutory corporate tax rate lowered to 22% in 2016
• Coloplast tax rate expected to be ~23% going forward
14/1511/12
25.7%
13/1412/13 15/16
23.0%
Long-term
~23%
Reported tax rate
Taxation
~24%
27.8%
1) Gross investments in PPE
15/16
1)
1)
1) Impacted by provision for Mesh litigation

• Coloplast returns excess liquidity to shareholders in the form of dividends and share buy-backs
• Dividend is paid twice a year – after the half-year and full-year financial reporting
• DKK 1bn share buy-back to be completed before 2016/17 fiscal year end
• First part of DKK 500m was initiated in Q2 2015/16 and completed in August 2016
… and attractive cash returns despite large investments in commercial and expansion activities
Page 24
500500500500500
80
7782
7778
38
100
015/1612/13
2,605
Long-term13/14
2,820
11/12
1,341
3,150
14/15
3,035
Dividends paid out in the year (DKKm) Pay-out ratio (%)*Share buy-back (DKKm)
Coloplast cash distribution to investors
* Pay-out ratio for 2013/14, 2014/15 and 2015/16 is before special items related to Mesh litigation
Comments

Our new long-term guidance will continue to deliver strong value creation
Page 25
7–9%
Revenue growthannual organic
50–100 bps
EBIT marginannual improvement

In sum, we believe Coloplast can continue to deliver stable shareholder returns through ...
Page 26
• Stable market trends in our Chronic Care business
• Strong retention program and innovative DtC activities
• Increased focus on growing the business outside Europe
• Additional improvements in manufacturing by leveraging on
global operations footprint
• European leverage will provide funds for further investments in
sales initiatives
• Resulting in strong free cash flow generation and high return on
invested capital
*
Comments
15/1613/1411/1209/1007/08
7%
05/06
8%
7%
33%
EBIT MarginOrganic growth
15/1613/1411/1209/1007/08
10%
8%
05/06
10%
17%
49%
9%
FCF to sales ROIC after tax
*
* Before special items. Special items Q2 2013/14 includes DKK 1bn net provision. Special items Q4 2014/15 includes DKK 3bn provision. Special items Q4 2015/16 includes DKK 0.75bn provision.

Leading intimate healthcareAppendices
NEW!Brava®
Protective Seal

The Coloplast share (COLO’B-KO)
Coloplast share listed on Nasdaq Copenhagen since 1983
~101 billion DKK (~15 billion USD) market cap @ ~467 DKK per share (incl. A shares)
Two share classes:
• 18m A shares carry 10 votes (family)
• 198m B shares carry 1 vote (freely traded)
• Free float approx. 55% (B shares)
Page 28
Note: Share capital ownership as per September 2016
Share Capital Ownership
5%
2% 46%
30%
10%
7%
Holders of A shares and family
Non-reg. Shareholders
Other shareholders
Coloplast A/S
Danish institutionals
Foreign institutionals

Capital structure
• Overall policy is that excess liquidity is returned to shareholders through a combination of dividends and share buy-backs
• Interest bearing debt will be raised in connection with a major acquisition or to support dividends
• Share buy-backs of DKK 500m per year
expected
• Bi-annual dividends
• Coloplast has entered into a 2 year DKK 1.5bn loan facility to fund Mesh litigationsettlements
• Interest-bearing net deposits of DKK 0.8bn
at 30 September 2016
Page 29
Comments Performance
* Before special items. Special items Q2 2013/14 includes DKK 1bn net provision. Special items Q4 2014/15 includes DKK 3bn provision. Special items Q4 2015/16 includes 0.75bn provision.
-813
539
14/1513/14
0.2x
0.6x
-1,490-1,300
-1,744
-0.3x-0.3x
-0.3x -0.2x
-0.4x
15/1612/13
1,593
10/11 11/1209/10
-1,042
NIBD/EBITDA* NIBD (DKKm)

Key Value Ratios
Page 30
Free Cash Flow driversProfitability drivers
* Before special items. Special items Q2 2013/14 includes DKK 1bn net provision. Special items Q4 2014/15 includes DKK 3bn provision. Special items Q4 2015/16 includes 0.75bn provision
3.84.34.04.65.6
5.95.8
31.731.531.332.433.4
35.4
38.7
3.24.1
28.128.528.328.528.829.429.5
15/16
3.5
14/1513/14
3.1
12/13
3.3
11/12
3.1
10/1109/10
4.3
Dist-to-Sales
R&D-to-Sales
COGS-to-Sales(%)
Admin-to-Sales
23.824.123.922.522.223.123.1
4.44.44.33.83.12.53.2
36.636.136.835.8
34.1
30.6
27.1
15/1614/1513/1412/1311/1210/1109/10
NWC-to-Sales (%) EBITDA margin* (%)
CAPEX-to-Sales (%)

Coloplast revenue development by business area
Page 31
Ostomy Care
Continence Care
Urology Care
Wound & Skin Care
9
6
87
6
7
9
55
9
15/16
5,935
14/15
5,567
13/14
5,091
12/13
4,849
11/12
4,633
Organic growthReported growthRevenue (DKKm)
5
8
10
8
3
11
13
7
15/16
5,182
14/15
5,019
13/14
4,438
9
12/13
4,081
7
11/12
3,831
99
6
5
7
11 10
13
15/16
1,497
9
14/15
1,359
13/14
1,199
12/13
1,124
8
11/12
1,037
6
910
5
16
41
15/1614/15
2,0671,964
13/14
1,700
8
12/13
1,581
5
11/12
1,522
-1
5
-1
5

Coloplast group
Other Developed Markets
Coloplast revenue development by geography and total
Page 32
Europe
Emerging Markets
8
6
5
6
44
655
14/15
8,8437,749
11/12
7,388
13/14
8,221
6
12/13 15/16
9,213
8
1915
610
9
7
13/14
2,479
4
12/13 15/16
3,177
6
2,395
5
11/12
2,288
14/15
2,945
23
1614
8
14
2124
14
15/16
13
14/15
2,2912,121
1,491
11
11/12
1,347
13/14
1,728
12/13
12
8
6
779
7
6 13,909
15/16
12,428
14/15
11,635
13/14
11,023
7
12/13
6
11/12
14,681
Organic growthReported growthRevenue (DKKm)

Segment operating profit
Chronic CareOstomy and Continence Care
Wound & Skin CareUrology Care
* Excludes shared/non-allocated costs
Page 33
6161606061
Q4 15/16
1,750
Q3 15/16
1,696
Q2 15/16
1,603
Q1 15/16
1,667
Q4 14/15
1,703
Segment Operating Profit Margin (%)*Segment Operating Profit DKKm*
130133133137
110
35353636
32
Q4 15/16
Q3 15/16
Q2 15/16
Q1 15/16
Q4 14/15
188171
218
184198
38
34
3937
40
Q4 15/16
Q3 15/16
Q2 15/16
Q1 15/16
Q4 14/15

Page 34
We invest to pursue growth opportunities and monitor previous investments, recalibrating if needed
We are executing on our mature markets investments We are recalibrating some investments to new realities
• Ostomy Care expansion
• Consumer investments
• Key Account Management
Expansion in
UK
• Sales force expansion
• Consumer investments
• National accounts
Breakthrough in
US
• Organisation adapted to changed macro-environment
Expansion in
Brazil
• Organisationrestructured as a result of economic crisis
Expansion in
Russia
• Paused investments due to healthcare market slow-down
Expansion in
China
• Organisation adapted to smaller government tenders
Expansion in
Saudi Arabia

0.50.3
1.6
2.4
0.4
US Mesh litigation – Overview of current financial impact
Page 35
P&L Balance Cash flow
• A total of DKK 4,500m (DKK 4,000 net of insurance coverage) has been provisioned in FY 2013/14 and 2014/15
• In 2015/16 a further DKK 750m has been provisioned
• The total provision of DKK 5,250m is currently considered sufficient
Assets
Liabilities
• Settlements expected to be finalised within the next 1-2 years based on the length of the Multidistrict Litigation
• Cash flow impact to continue for several years
• DKK 500m insurance coverage received in 2013/14 and 2014/15
• DKK 1.5bn loan facility (2-3yrs)
Restricted cash, DKKbn2013/14 2014/15 2015/16
EBIT (before special items) 4,147 4,535 4,846
Special items -1,000 -3,000 - 750
EBIT 3,147 1,535 4,096
EBIT % (before special items) 33 33 33
EBIT % 25 11 28
Total liability, DKKbn
Actual/Expected cash flow, DKKbn
Q4 14/15
Q3 14/15
Q2 14/15
Q3 15/16
Q1 14/15
Q2 15/16
Q1 15/16
Q4 15/16
3.32.3
1.5 1.20.9 0.8
0.7
2.42.5
0.6 0.61.1
0.51.0
1.7
0.80.5
2.4
ProvisionOther payables
17/18E13/14 16/17E15/1614/15
Q4 13/14
Q4 14/15
Q3 14/15
Q2 14/15
Q3 15/16
Q1 14/15
Q2 15/16
Q1 15/16
Q4 15/16
Q4 13/14
0.40.6
0.30.2
0.1
0.60.6
1.2
0.5

Exchange rate exposure and hedging policy
Page 36
Financial guidance for 2016/17 based on below assumptions for the company’s principal currencies
0
-260-290
50
-170
-130
GBP HUFUSD
Revenue (DKKm) EBIT (DKKm)
12 months exposure from 10% initial exchange rate drop
To achieve the objective of a stabile Profit before Tax we hedge:
• Balance sheet items in foreign currency • Cash flow in foreign currency - up to 12
months expected CF (on average 10-12 months)
Key currencies hedged - USD, GBP, HUF
Cash flow is hedged using options and forward contracts.
DKK GBP USD HUF EUR
Average exchange rate 2015/161) 956 671 2.39 745
Spot rate, 26 Oct 2016 830 681 2.40 744
Change in spot rate compared with the average exchange rate 2015/16
-13% 2% 0% 0%
Hedging Policy
1) Average exchange rate from 1 October 2015 to 30 September 2016

Mesh litigation timeline
Page 37
Triggering Events
Structuring & Maturing
Towards resolution
2008 2011 2012 2013 2014 2015 2016
July 2011:FDA Updated Public Health Notification
April 29, 2014:FDA proposes re-classification of POP products to Class III
Oct. 2008:FDA Public Health
Notification
June 2013:Creation of Cook
MDL
Feb. 2014:Creation of Neomedic
MDL
Feb. 2012:Creation of AMS, Boston
Scientific, & Ethicon MDLs
July 2011:First mesh claim against Coloplast
Aug. 2012:Creation of
Coloplast MDL
Feb. 28, 2013:
Verdict vs Ethicon
NJ State Court: DKK
63m
July 8, 2013:
AMS/Endo Settlement
DKK 310m
Feb. 2014:
Verdict for
Ethicon
Ethicon MDL
April 30, 2014:
AMS/Endo
Settlement
DKK 4.7bn
~20,000 claims
Sept. 9, 2014:
Verdict vs
BSC
TX State
Court:
USD 73m
(DKK 428.3m)
Sept. 30, 2014:
AMS/Endo
Settlement
USD 830m
(DKK 4.84bn)
Aug. 29, 2014:
Verdict for BSC
MA State Court
Nov. 21, 2014:
Verdict vs BSC
BSC MDL (WV):
USD 18.5m
(DKK 110.6m)
July 29, 2014:
Verdict for BSC
MA State Court
June 30, 2014:
Bard Settlement
Amount Unknown
~ 500 claims
Mar. 5, 2015:
Verdict vs Ethicon
CA State Court:
USD 5.7 m
(DKK 39.06 m)
Oct. 5, 2015:
Verdict for Ethicon
TX State Court
Sept. 2015:Federal Court
Order: 200 Coloplast
cases into discovery phase
Oct. 16, 2015:
Verdict for
BSC
NC Federal
Court
Jan. 4, 2016:
FDA Orders re POP mesh: Reclassify to Class III. Require PMA application
July 23, 2012:
Verdict vs Bard
CA State Court:
USD 3.6m (DKK 31
m)
June 2013:
Verdict for
Mentor
ObTape MDL
Aug. 15, 2013:
Verdict vs Bard
Bard MDL:
DKK 11.5m
April 3, 2014:
Verdict vs
Ethicon
TX State Court:
DKK 6.8m
May 2, 2014:
Coloplast provision
DKK 1.5bn (DKK
1bn net provision)
~7,000 claims
Sept. 5, 2014:
Verdict vs Ethicon
Ethicon MDL:
USD 3.27m (DKK
19.2m)
Nov. 13, 2014:
Verdict vs BSC
BSC MDL (FL):
USD 26.7m
(DKK 159.7m)
Sept. 22, 2015:
Coloplast provision
DKK 3bn
May 28, 2015:
Verdict vs
BSC
DE State
Court:
USD 100m
(DKK 681.3m)
Feb. 18, 2016:
Verdict vs Mentor
Mentor ObTape MDL
USD 4.4 m
(DKK 28.7m)
Feb. 10, 2016:
Verdict vs Ethicon
PA State Court:
USD 13.5m
(DKK 88.2m)
Dec. 24, 2015:
Verdict vs Ethicon
PA State Court:
USD 12.5m
(DKK 85.5m)
Feb. 7, 2016:
Verdict for Bard/BSc
MO State Court
June 2016:Federal Court
Order:240 Coloplast
cases into discovery phase
July 2016:Federal Court
Order:150 Coloplast
cases into discovery phase
Nov. 2, 2016:
Coloplast provision
DKK 0.75bn

Page 38
Health reform landscape
• U.S.: Healthcare reform implementation ongoing
• Brazil: Macroeconomic and political challenges
• Russia: Macroeconomic and political challenges
• Saudi Arabia: Macroeconomic and political challenges
Stable reform environment
Intensifying reform pressure
• France: Reimbursement pressure on WC, OC and CC.
Reimbursement review of OC and CC in 2016/17
• UK: Efficiency savings under NHS reform
• Germany: Reimbursement pressure on CC
• Holland: Reimbursement pressure on OC and CC
• Norway: Budget-driven pressures
• Italy: Regional tenders and pricing challenges
• Greece: Reimbursement pressure
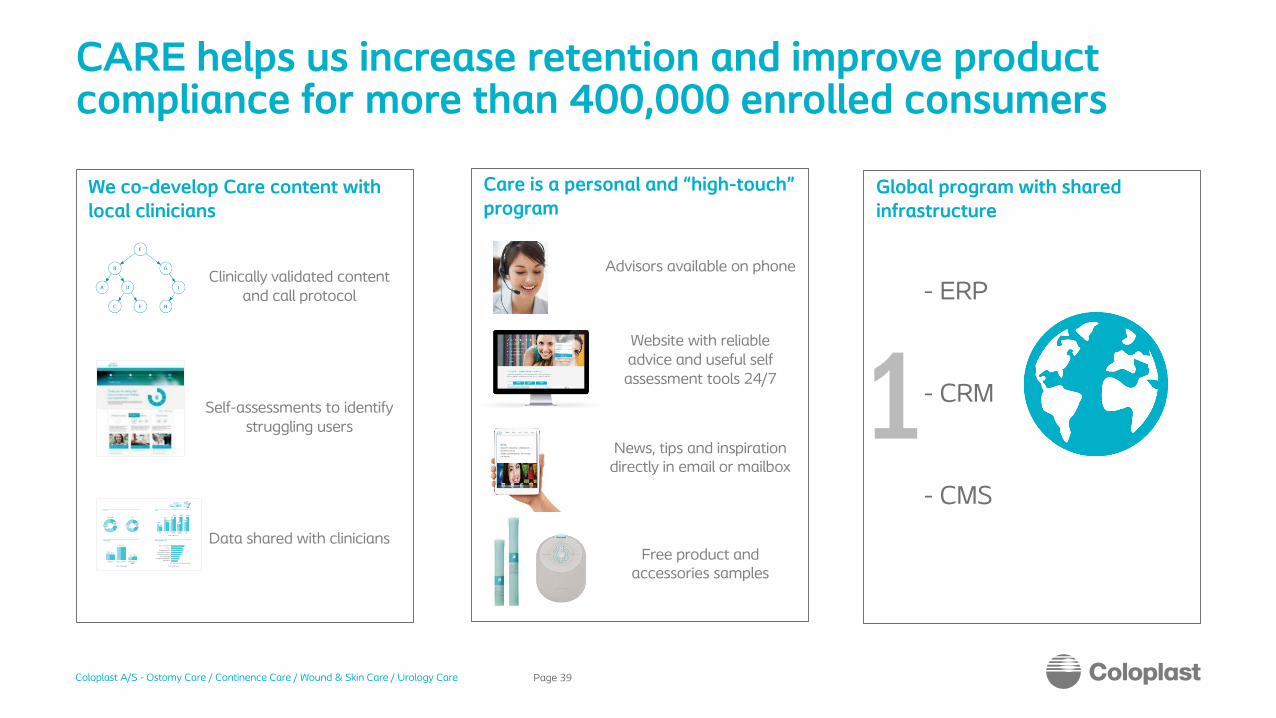
CARE helps us increase retention and improve product compliance for more than 400,000 enrolled consumers
Website with reliable advice and useful self assessment tools 24/7
Page 39
- ERP
- CRM
- CMS
Clinically validated content and call protocol
Data shared with clinicians
Self-assessments to identify struggling users
News, tips and inspiration directly in email or mailbox
Advisors available on phone
Free product and accessories samples
We co-develop Care content with local clinicians
Care is a personal and “high-touch” program
Global program with shared infrastructure

With our DtC marketing program we reach into the community
Page 40
…and with the reach we get several benefits We operate in numerous channels to expose our service and product offering…
Ensureproduct accessibility
Ensure successful experience
Exposeinnovative products

The generic model for distribution and reimbursement of our products
Page 41
Coloplast
ConsumerDistributionPayer
Product
Prescription & Insurance
Prescription & Insurance
Reimbursement price
Product$
DtC Marketing• Campaigns• Community• Relationships• Information

Introducing Ostomy Care
Page 42
• Colorectal cancer (est. 45%)• Bladder cancer (est. 10%)• Diverticulitis (est. 15%)• Inflammatory bowel disease (est. 10%)• Other (est. 20%)
• Nurses, mainly stoma care nurses
• People with a stoma• Wholesalers/distribution• Hospital purchasers and GPOs• Surgeons
• Hospital & community nurses
• Hospital buyers• Distributors• Dealers• Wholesalers• Homecare companies
Distribution of revenues*
*Excluding baseplates and accessories
Key products
Assura® new generation launched in 1998
Alterna® original launched in 1991
SenSura® launched in 2006-2008
SenSura® Mio launched in 2014
Disease areas
Customer groups
Call points
SenSura® Mio Convexlaunched in 2015
Urostomy
Colostomy
Ileostomy

Introducing Ostomy Care Accessories
Page 43
• Nurses, mainly stoma care nurses• People with a stoma• Wholesalers/distributors• Hospital purchasers and GPOs• Surgeons
• Market size of DKK 2bn• Market growth of 6-8%• Market share 25-30%• Main competitors include: Hollister
Adapt, ConvaTec, 3M Cavilon, Eakin
Market fundamentals
Customer groups & call points
Market value by geography
Brava® is a range of ostomy accessories designed to
reduce leakage or care for skin, to make our end-
users feel secure. Brava® was launched in April 2012
and the range includes 12 different products.
Brava® Elastic Tape• Elastic so it follows the
body and movements
Brava® Adhesive Remover• Sting free and skin friendly
Brava® Protective Seal• Designed for leakage
and skin protection
Brava® Skin Barrier• Reducing skin problems
without affecting adhesion
Brava® Lubricating Deodorant• Neutralizing odour
Key products
Other developed markets
Emerging markets
European markets

Introducing Continence Care
Page 44
• Spinal Cord Injured, SCI• Spina Bifida, SB• Multiple Sclerosis, MS• Benign prostatic hyperplasia,
BPH & prostatectomy patients• Elderly
• Continence or home care nurses• Wholesalers/distributors• Hospital purchasers and GPOs
• Rehabilitation centers• Urology wards• Distributors, dealers & wholesalers
Distribution of revenuesKey productsDisease areas
Customer groups
Main call points
SpeediCath® Compact Male intermittent catheterLaunched in 2011
Conveen® Optima External catheterLaunched in 05/06
Conveen® Security+Launched in 2013
SpeediCath® Compact Eve Intermittent catheterLaunched in 2014
Male ext. catheters
Bowel management
Urine bags
Intermittent catheters
SpeediCath® FlexIntermittent catheterLaunched in 2016

Introducing Bowel Management
Page 45
Faecal incontinence (management products only)
• Spinal Cord Injured, SCI• Spina Bifida, SB• Multiple Sclerosis, MS
• Rehab centers• Pediatric clinics• Urology wards
Distribution of revenues
Peristeen® Anal Irrigation• Launched in 2003 • Updated in 2011
Anal plug• Launched in 1995
Disease areas Market dynamics
Customer groups
Call points
+ Growing awareness
+ Huge underpenetrated and
unserved population
+ New devices addressing the many
unmet needs
÷ Still taboo area and non-focus for
professionals (doctors)
÷ Very little patient awareness
÷ Training required (nurses, patients)
÷ Lack of reimbursement
Anal
Peristeen® Anal Irrigation

Introducing Urology CareTreatment (surgical) of urological disorders
Page 46
• Urinary incontinence• Pelvic organ prolapse• Erectile dysfunction• Enlarged prostate• Kidney and urinary stones
• Surgeons• Purchasing
departments and organizations
• End customers
• Urologists• Uro-gynaecologists• Gynaecologists • Purchasing
departments and organizations
Distribution of revenues
Isiris® cystoscopeLaunched in 2015 Single use devices
JJ stentsLaunched in 1998Single use devices
Titan® OTR penile implantLaunched in 2008 Men’s health – Surgical Urology
Altis® single incision slingLaunched in 2012Women’s health – Surgical Urology
Disease areas
Customer groups
Call points
Key products
Single use devices
Women’s health
Men’s health

Distribution of revenues (WSC)
Introducing Wound Care
Page 47
Chronic wounds• Leg ulcers• Diabetic foot ulcers• Pressure ulcers
Hospitals• Wound care
committees• Specialist
nurses/doctors• (Purchasers)
Community• Specialist
nurses/doctors • General practitioners• District/general
nurses • Large nursing homes
Key products
Comfeel® Plus Transparent• Transparent hydrocolloid dressing• Launched in 1994
Biatain® Silicone• Foam dressing with
silicone adhesive. Launched in 2013
Biatain® Ag• Antimicrobial foam dressing• Launched in 2002
Biatain®
• High exudate mgt. foam dressing
• Launched in 1998
Disease areas
Customer groups& call points
Biatain® range
Comfeel® range
Skin Care
Contract manufacturing
Wound Care other

Introducing Skin Care
Page 48
InterDry® Ag• Textile with antimicrobial silver
complex• Unique solution for skin on
skin issues
Sween®
• Broad line of skin care products• Designed to increase
consistency of care
• Moisture associated skin damage• Incontinence• Skin folds & obesity • Prevention of skin impairments
Hospitals• Clinical Specialists • Supply Chain• Value Analysis Committee
Critic-Aid® Clear / AF • Skin Protectant• Suitable for neonate to
geriatric patients
EasiCleanse Bath®
• Disposable Bathing Wipes • Improves Patient Experience
Key products
Community• Wound Clinics• Long Term Care• Home Health Agencies• Distribution
Disease areas
Customer groups& call points
Product mix
Cleansing/Bathing
Moisturizers
Protectants & Antifungals
Textile

Product market for US Skin Care
Page 49
Market trends• Increasing size and vertical integration
of health systems
• Increasing importance of prevention
• Increasing importance of utilization management
• Increasing scale and vertical integration of market leaders
• US market size estimated at DKK
5-6bn with 4-5% growth
• Market share: 7-9%
• Main competitors include:
• Medline Industries
• Sage Products
• ConvaTec
US Skin Care at a glance
+ Aging and obese population
+ CMS Value Based Purchasing
+ Increased focus on prevention
+ Increased importance of utilization management
Market drivers/limiters
÷ Consolidation of Providers
÷ Increased competition from both Channel and Manufacturers

The Coloplast organisation
Page 50
Strategic Business Units
MarketingSalesR&D
Chronic Care
Wound Care Urology Care
Global Operations
MarketingSalesR&D
Skin CareOstomy Care Continence Care
Global Business Support Functions
Sales Regions
IDMarketingSales R&D
R&D
Coloplast Group
Marketing
Strategic Business UnitsChronic Care
SDMarketingSales R&D

Coloplast Executive Management
Page 51
Lars Rasmussen
President, CEO
• Born 1959• With Coloplast since 1988
Allan Rasmussen
EVP, Global Operations
• Born 1967• With Coloplast since 1992
Anders Lonning-Skovgaard
EVP, CFO
• Born 1972• With Coloplast since 2006
Kristian Villumsen
EVP Chronic Care• Born 1970• With Coloplast since 2008

Corporate responsibility – Member of UN Global Compact since 2002 and recognized externally
Page 52

Income statement
Page 53
Revenue 13,909 14,681 6%
Gross profit 9,533 10,032 5%
SG&A costs -4,562 -4,692 3%R&D costs -442 -509 15%Other operating income/expenses 6 15 nm
Operating profit (EBIT) before special items 4,535 4,846 7%Special items -3,000 -750 nmOperating profit (EBIT) 1,535 4,096 167%Profit/loss after tax on investments in associates -1 -1 0%Net financial items -289 -13 -96%Tax -346 -939 171%
899 3,143 250%
Gross margin 69% 68%11% 28%
Earnings per share (EPS), diluted 4.20 14.78
EBIT margin
Net profit
Key ratios
DKKm FY 2014/15 FY 2015/16 Change

Balance sheet
Page 54
1) This item is before Special items. After Special items, ROIC before tax is 80%/28%, and ROIC after tax is 62%/21%
Non-current assets 5,052 4,843 -4%
Current assets 5,765 6,164 7%of which:Inventories 1,473 1,518 3%Trade receivables 2,467 2,679 9%Restricted cash 72 457 nmMarketable securities, cash, and cash equivalents 1,400 1,035 -26%
Total equity 4,706 5,068 8%Non-current liabilities 1,533 630 nmCurrent liabilities 4,578 5,309 16%of which:Trade payables 591 697 18%
Return on average invested capital before tax (ROIC)1) 62% 63%48% 49%
Net asset value per share, DKK 22 24 9%
Key ratios
Equity ratio 44% 46%
11,007 2%
Assets
Equity and liabilities
DKKm 30 Sep 2015 30 Sep 2016 Change
Balance, total 10,817
5,551 18%
Return on average invested capital after tax (ROIC)1)
Invested capital 4,702

Cash flow
Page 55
EBITDA 2,020 4,624 129%
Change in working capital 393 1,126 nm
Net interest payments -266 -60 nm
Paid tax -1,178 -365 -69%
Other 2,368 -2,297 nm
CAPEX -617 -649 5%
Securities 100 30 -70%
Other 49 16 nm
Cash flow from investments -468 -603 29%
Dividends -2,535 -2,650 5%
-428 -218 nm
Net cash flow for the year -94 -443 nm
Net investment in treasury shares and exercise of share options
Cash flow from operations 3,337 3,028 -9%
Free cash flow 2,869 2,425 -15%
DKKm FY 2014/15 FY 2015/16 Change

Manufacturing setup
Page 56
Zhuhai
Minneapolis
TatabányaNyirbátor
Mørdrup
Thisted
Sarlat
Innovation & Competency Centre
High Volume Production
Specialised Production
Mankato
Production by country*
COGS by cost type**
* Produced quantity of finished goods
** FY 2015/16 Cost of goods sold, DKK 4,649m
20%
5%
70%
5%
China
Hungary
US/France
Denmark
8%
21%
49%
9%
13%Salary - Direct
Other
Materials (RM &SFG)
Salary - Indirect
Depreciations & amortisations

Production sites
• Adhesives production• Wound care products• Ostomy care products • Continence care products• Pilot development work Adhesives, Continence
care and Wound care• Number of employees in production: ~400
• Machine development & commissioning• Ostomy care products • Pilot development work Ostomy care• Number of employees in production: ~200
Sarlat• Disposable surgical urology products• Number of employees in production: ~150
Minneapolis
Mankato• Skin and wound care products• Ostomy care accessories• Number of employees in production: ~75
• Urology care products• Number of employees in production: ~100
Page 57
Mørdrup
Denmark
Thisted
France
US

Production sites
• Continence care products• Ostomy care products• Machine building• Number of employees in production: ~1,000
Page 58
Hungary
Tatabánya
Tata
• Catheter care products• Continence care products• Wound care products (incl. Compeed)• Number of employees in production: ~1,500
• Ostomy care products • Adhesives • Continence care products• Urology care products• Number of employees in production: ~1,400
• Postponement & packaging• Cross docking• Warehousing• Distribution & shipping• Number of employees: ~350
Nyírbátor
Zhuhai
China

Contact Investor RelationsHoltedam 1DK-3050 HumlebækDenmark
Ellen Bjurgert
Director, Investor RelationsTel. direct: +45 4911 3376 Office: +45 4911 1800Fax: +45 4911 1555 [email protected]
Page 59
Kristine Husted Munk
Student AssistantTel. direct: +45 4911 3266 Office: +45 4911 1800Fax: +45 4911 1555 [email protected]
Anne-Sofie Søegaard
IR CoordinatorTel. direct: +45 4911 1924 Office: +45 4911 1800Fax: +45 4911 1555 [email protected]

Page 60