LEADING INDUSTRY DISRUPTION
103
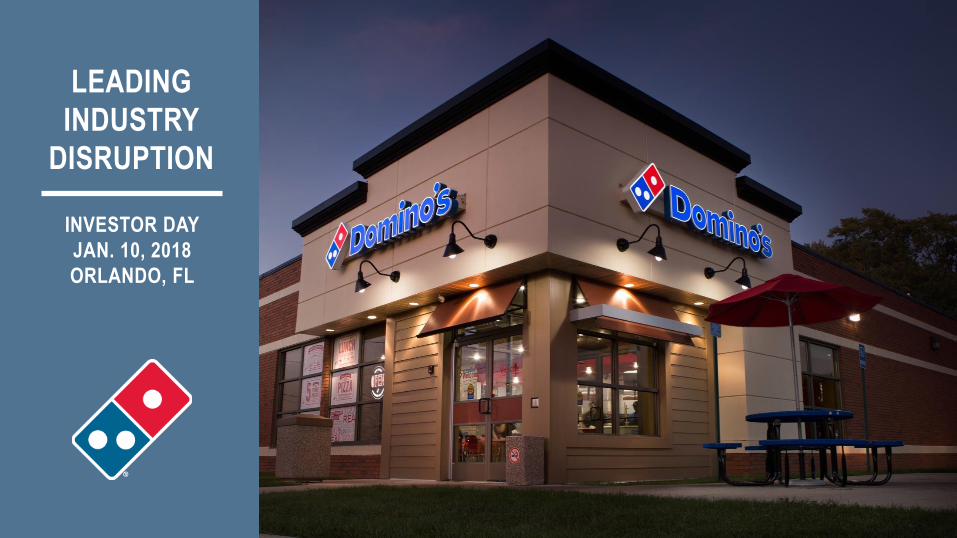
LEADING INDUSTRY DISRUPTION INVESTOR DAY JAN. 10, 2018 ORLANDO, FL
Transcript of LEADING INDUSTRY DISRUPTION
LEADING
INDUSTRY
DISRUPTION
INVESTOR DAY
JAN. 10, 2018
ORLANDO, FL
EVP, Communication & Investor Relations
Tim McIntyre
LEGAL STUFF
These statements may relate to future events or our future financial performance and are subject to known and unknown risks, uncertainties and other factors that may cause our actual results, levels of activity, performance or achievements to differ materially from those expressed or implied by these forward-looking statements. This presentation and our accompanying comments do not purport to identify the risks inherent in an investment in Domino’s Pizza and factors that could cause actual results to differ materially from those expressed or implied in the forward-looking statements. These risks include but are not limited to those risk factors identified in Domino’s Pizza, Inc.’s Annual Report on Form 10-K for the fiscal year ended January 1, 2017, as well as other SEC reports filed by Domino’s Pizza, Inc. from time to time. Although we believe that the expectations reflected in the forward-looking statements are based upon reasonable estimates and assumptions, we cannot guarantee future results, levels of activity, performance or achievements. We caution you not to place undue reliance on forward-looking statements, which reflect our estimates and assumptions and speak only as of the date of this presentation and you should not rely on such statements as representing the views of the Company as of any subsequent date. We undertake no obligation to update the forward-looking statements to reflect subsequent events or circumstances. In light of the above, you are urged to review the disclosures contained in the Domino’s Pizza, Inc. SEC reports, including the risk factors contained therein.
This presentation contains trade names, trademarks and service marks of other companies. We do not intend our use or display of other parties’ trade names, trademarks and service marks to imply a relationship with, or endorsement or sponsorship of, these other parties.
This presentation and our accompanying comments include “forward-looking statements.”
P A G E 3
CHIEF EXECUTIVE OFFICER
Patrick Doyle
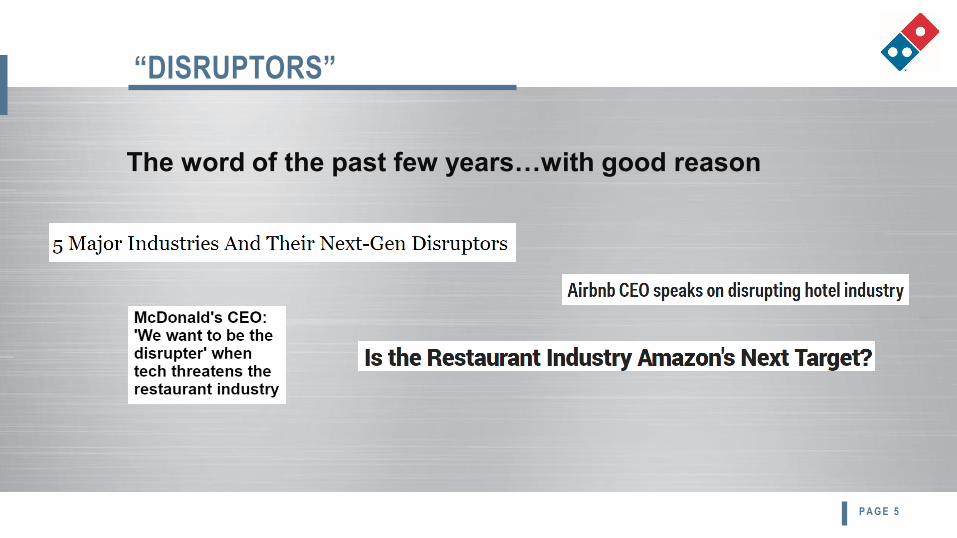
“DISRUPTORS”
The word of the past few years…with good reason
P A G E 5
P A G E 6
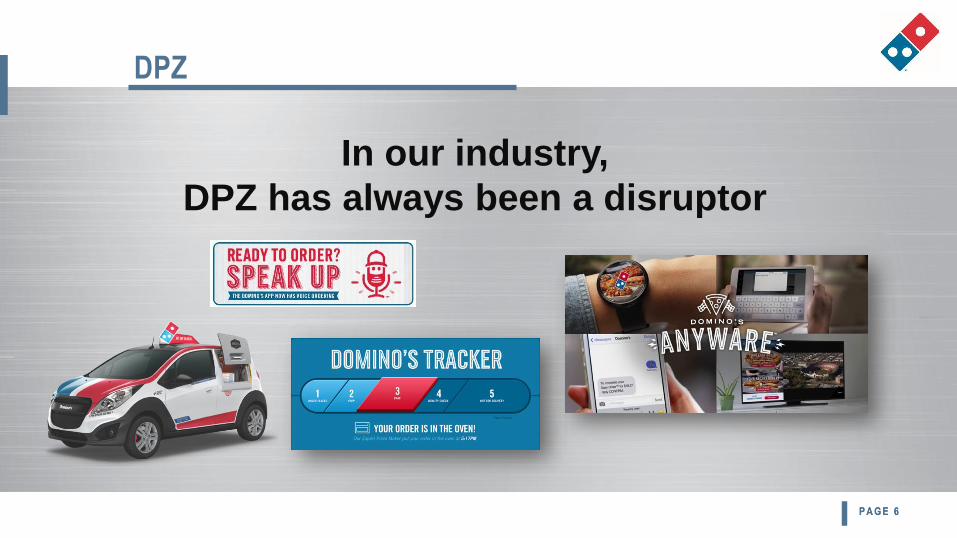
DPZ
In our industry,
DPZ has always been a disruptor
P A G E 6
P A G E 7
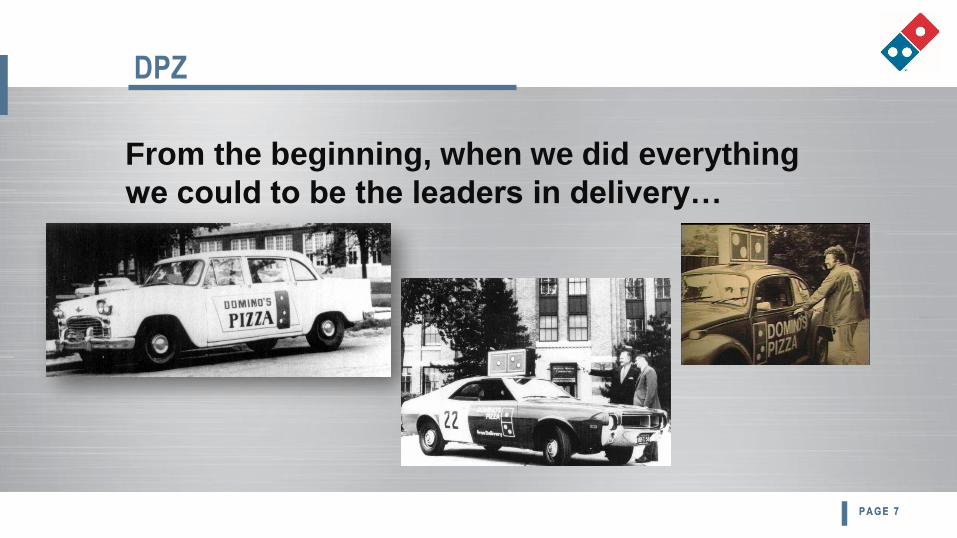
DPZ
From the beginning, when we did everything
we could to be the leaders in delivery…
P A G E 7
P A G E 8
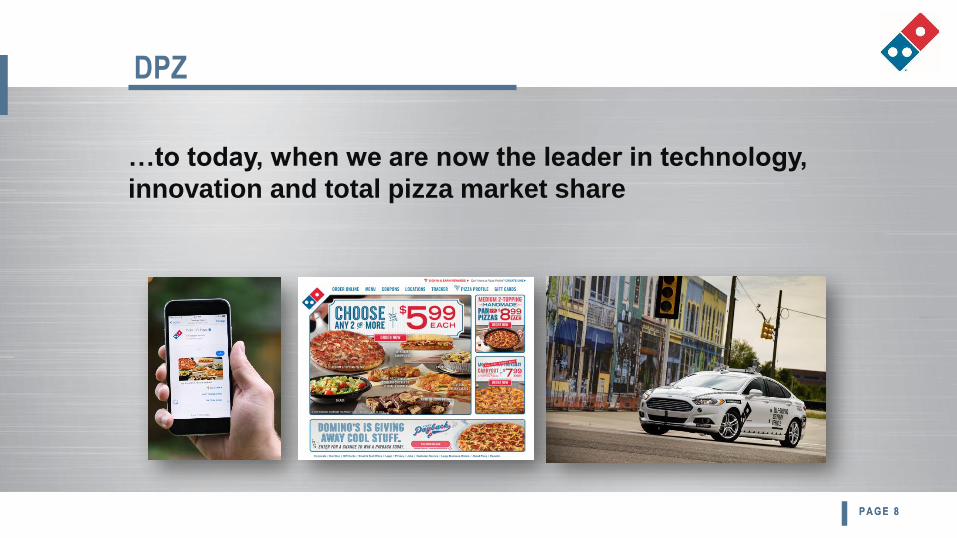
DPZ
…to today, when we are now the leader in technology,
innovation and total pizza market share
P A G E 8
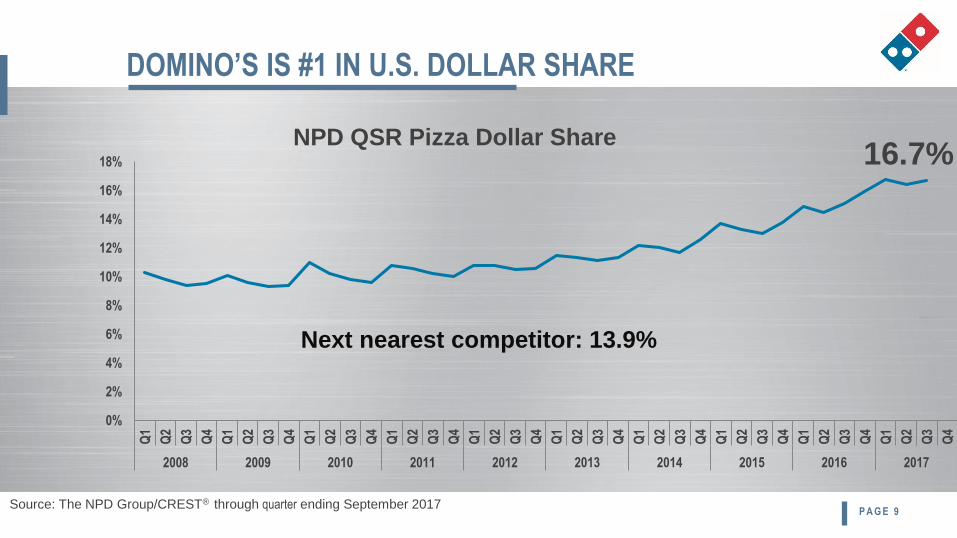
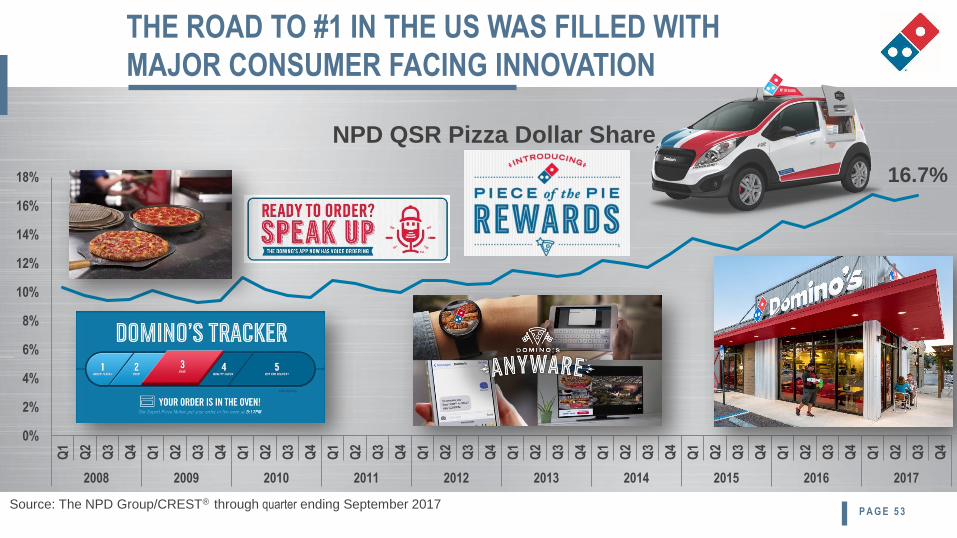
16.7%
0%
2%
4%
6%
8%
10%
12%
14%
16%
18%
Q1
Q2
Q3
Q4
Q1
Q2
Q3
Q4
Q1
Q2
Q3
Q4
Q1
Q2
Q3
Q4
Q1
Q2
Q3
Q4
Q1
Q2
Q3
Q4
Q1
Q2
Q3
Q4
Q1
Q2
Q3
Q4
Q1
Q2
Q3
Q4
Q1
Q2
Q3
Q4
2008 2009 2010 2011 2012 2013 2014 2015 2016 2017
NPD QSR Pizza Dollar Share
DOMINO’S IS #1 IN U.S. DOLLAR SHARE
Next nearest competitor: 13.9%
P A G E 9Source: The NPD Group/CREST® through quarter ending September 2017
P A G E 1 0
-2.0%
-1.0%
0.0%
1.0%
2.0%
3.0%
4.0%
5.0%
6.0%
7.0%
8.0%
9.0%
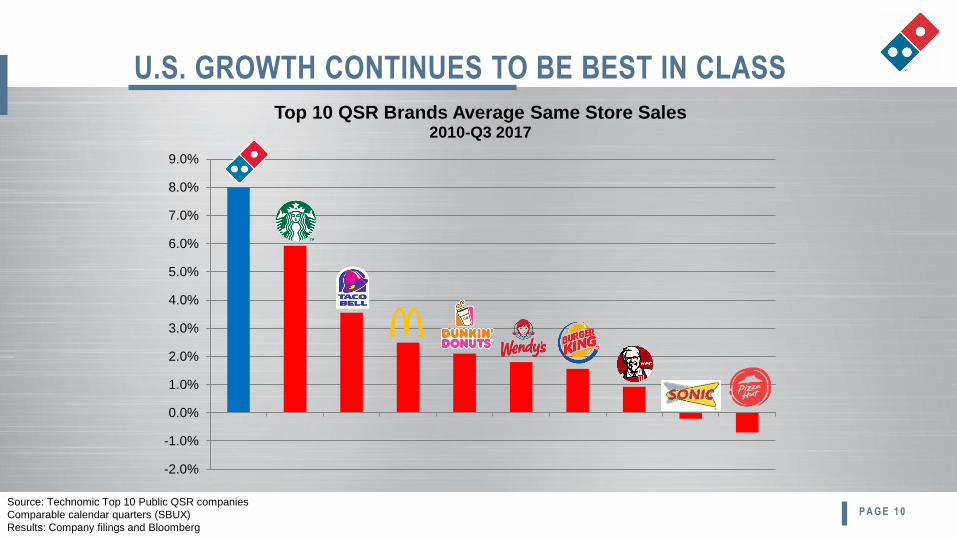
Top 10 QSR Brands Average Same Store Sales 2010-Q3 2017
U.S. GROWTH CONTINUES TO BE BEST IN CLASS
Source: Technomic Top 10 Public QSR companies
Comparable calendar quarters (SBUX)
Results: Company filings and Bloomberg
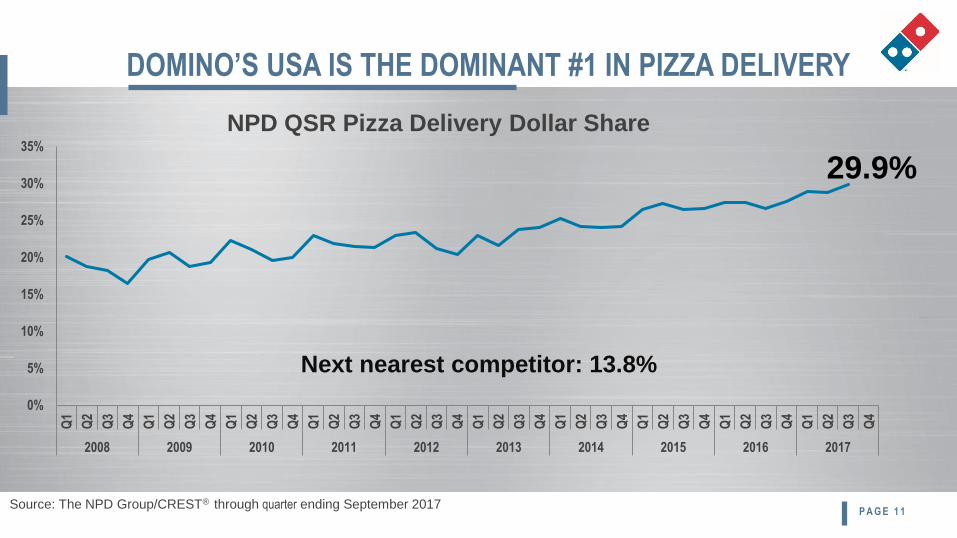
DOMINO’S USA IS THE DOMINANT #1 IN PIZZA DELIVERY
Next nearest competitor: 13.8%
29.9%
0%
5%
10%
15%
20%
25%
30%
35%
Q1
Q2
Q3
Q4
Q1
Q2
Q3
Q4
Q1
Q2
Q3
Q4
Q1
Q2
Q3
Q4
Q1
Q2
Q3
Q4
Q1
Q2
Q3
Q4
Q1
Q2
Q3
Q4
Q1
Q2
Q3
Q4
Q1
Q2
Q3
Q4
Q1
Q2
Q3
Q4
2008 2009 2010 2011 2012 2013 2014 2015 2016 2017
NPD QSR Pizza Delivery Dollar Share
P A G E 1 1Source: The NPD Group/CREST® through quarter ending September 2017
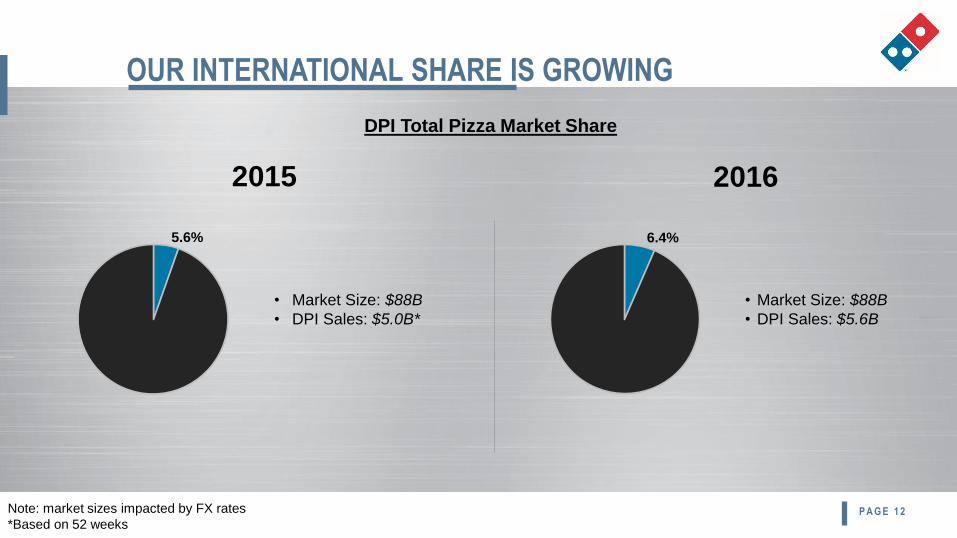
Note: market sizes impacted by FX rates
*Based on 52 weeks
OUR INTERNATIONAL SHARE IS GROWING
5.6%
2015 2016
DPI Total Pizza Market Share
• Market Size: $88B
• DPI Sales: $5.0B*
6.4%
• Market Size: $88B
• DPI Sales: $5.6B
P A G E 1 2
TODAY
Our plan for today: share the
Overall Strategic Intent
behind everything we’ve done; are doing
P A G E 1 3
P A G E 1 4
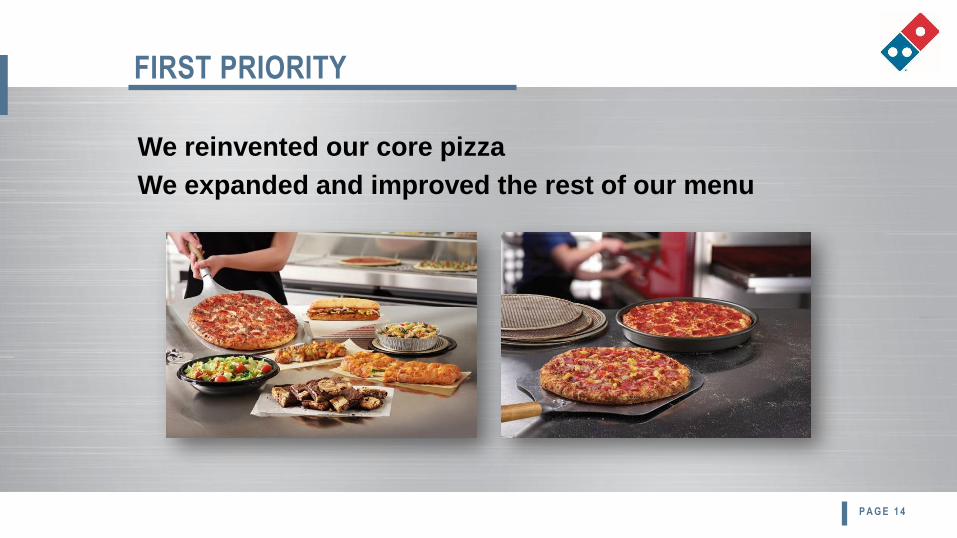
We reinvented our core pizza
We expanded and improved the rest of our menu
FIRST PRIORITY
P A G E 1 5
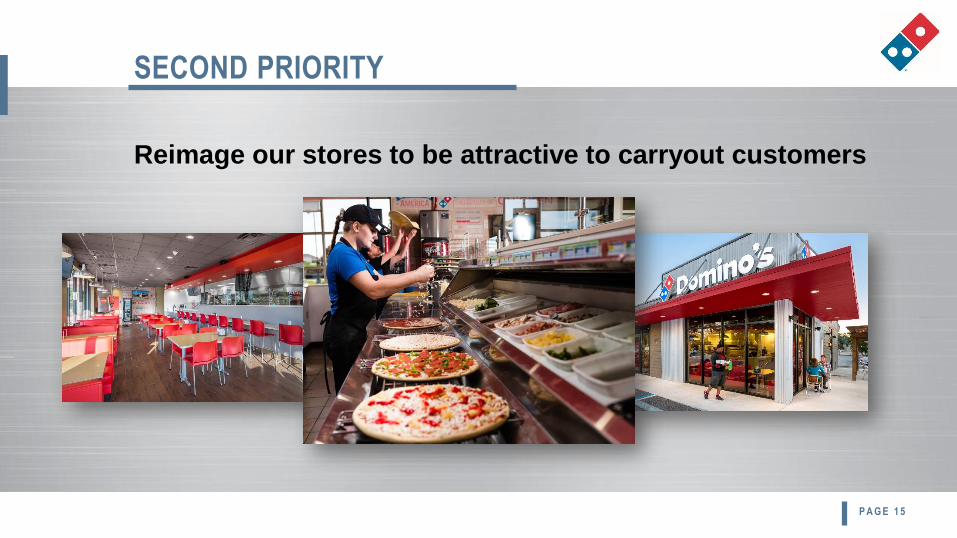
Reimage our stores to be attractive to carryout customers
SECOND PRIORITY
P A G E 1 6
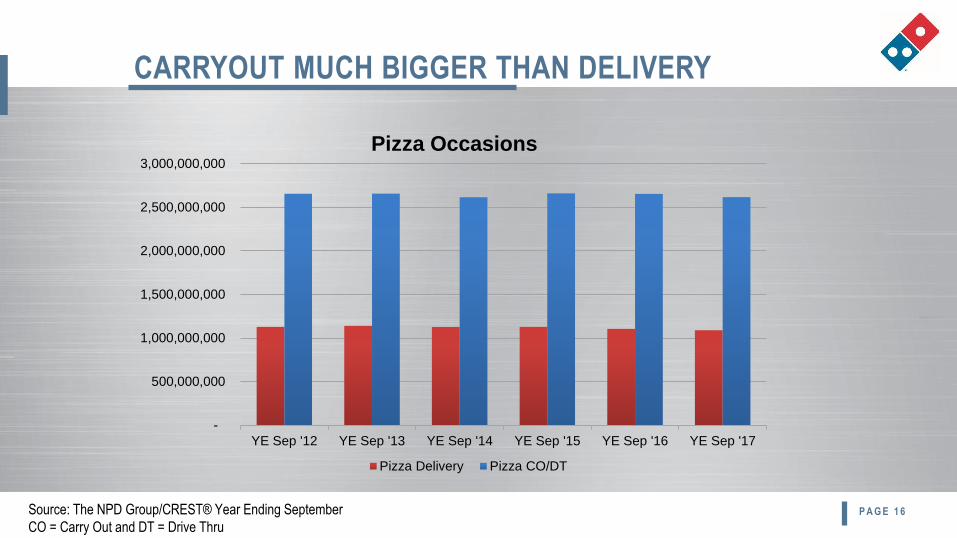
CARRYOUT MUCH BIGGER THAN DELIVERY
-
500,000,000
1,000,000,000
1,500,000,000
2,000,000,000
2,500,000,000
3,000,000,000
YE Sep '12 YE Sep '13 YE Sep '14 YE Sep '15 YE Sep '16 YE Sep '17
Pizza Occasions
Pizza Delivery Pizza CO/DT
Source: The NPD Group/CREST® Year Ending September
CO = Carry Out and DT = Drive Thru
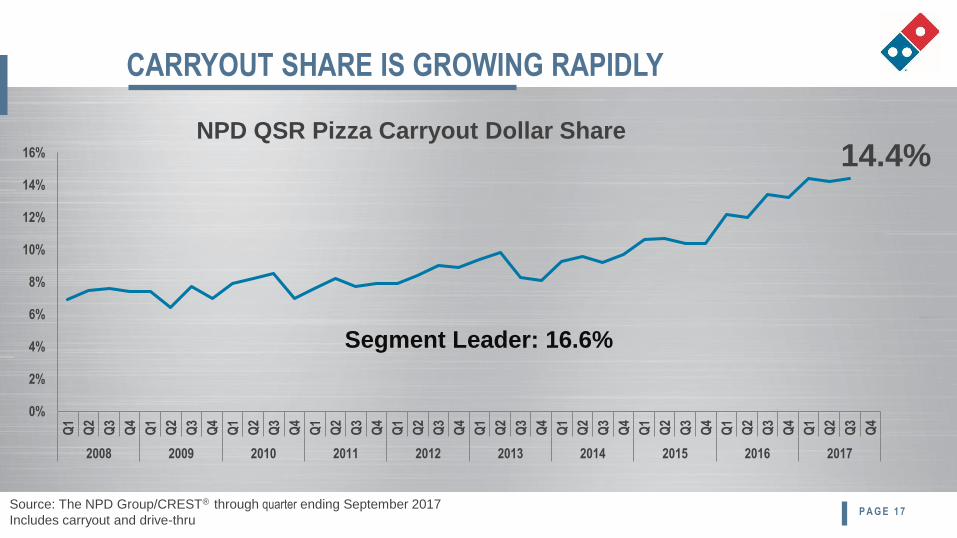
CARRYOUT SHARE IS GROWING RAPIDLY
14.4%
0%
2%
4%
6%
8%
10%
12%
14%
16%
Q1
Q2
Q3
Q4
Q1
Q2
Q3
Q4
Q1
Q2
Q3
Q4
Q1
Q2
Q3
Q4
Q1
Q2
Q3
Q4
Q1
Q2
Q3
Q4
Q1
Q2
Q3
Q4
Q1
Q2
Q3
Q4
Q1
Q2
Q3
Q4
Q1
Q2
Q3
Q4
2008 2009 2010 2011 2012 2013 2014 2015 2016 2017
NPD QSR Pizza Carryout Dollar Share
Segment Leader: 16.6%
P A G E 1 7Source: The NPD Group/CREST® through quarter ending September 2017
Includes carryout and drive-thru
P A G E 1 8
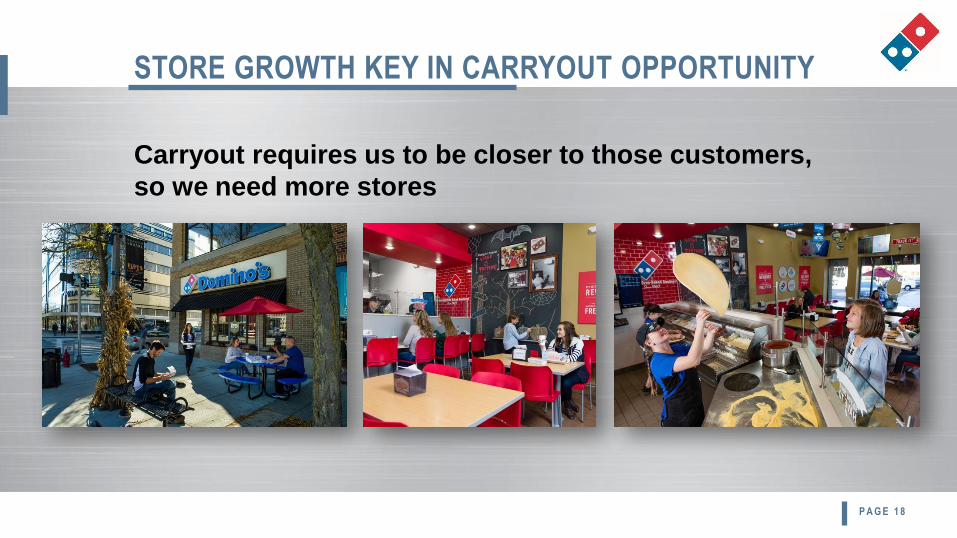
STORE GROWTH KEY IN CARRYOUT OPPORTUNITY
Carryout requires us to be closer to those customers,
so we need more stores
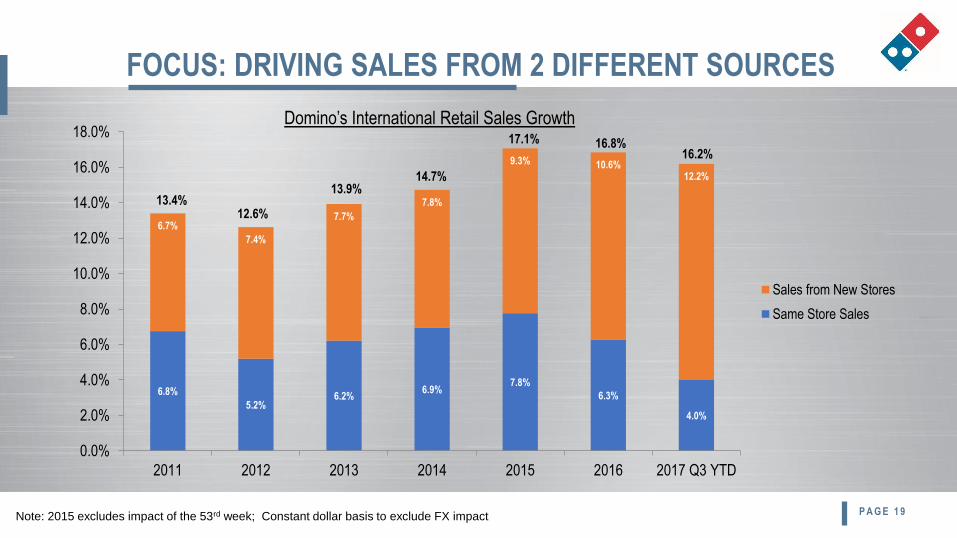
FOCUS: DRIVING SALES FROM 2 DIFFERENT SOURCES
6.8%
5.2%6.2%
6.9%7.8%
6.3%
4.0%
6.7%
7.4%
7.7%
7.8%
9.3% 10.6%12.2%
0.0%
2.0%
4.0%
6.0%
8.0%
10.0%
12.0%
14.0%
16.0%
18.0%
2011 2012 2013 2014 2015 2016 2017 Q3 YTD
Sales from New Stores
Same Store Sales
13.4%12.6%
13.9%14.7%
17.1% 16.8%16.2%
Domino’s International Retail Sales Growth
Note: 2015 excludes impact of the 53rd week; Constant dollar basis to exclude FX impact P A G E 1 9
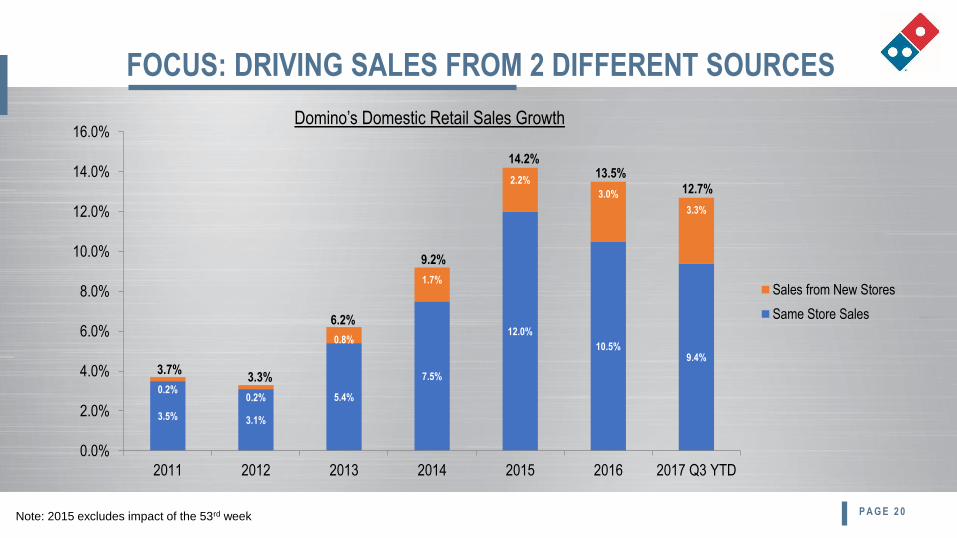
FOCUS: DRIVING SALES FROM 2 DIFFERENT SOURCES
3.5% 3.1%
5.4%
7.5%
12.0%
10.5%9.4%
0.2%0.2%
0.8%
1.7%
2.2%
3.0%
3.3%
0.0%
2.0%
4.0%
6.0%
8.0%
10.0%
12.0%
14.0%
16.0%
2011 2012 2013 2014 2015 2016 2017 Q3 YTD
Sales from New Stores
Same Store Sales
3.7%3.3%
6.2%
9.2%
14.2%13.5%
12.7%
Domino’s Domestic Retail Sales Growth
Note: 2015 excludes impact of the 53rd week P A G E 2 0
P A G E 2 1
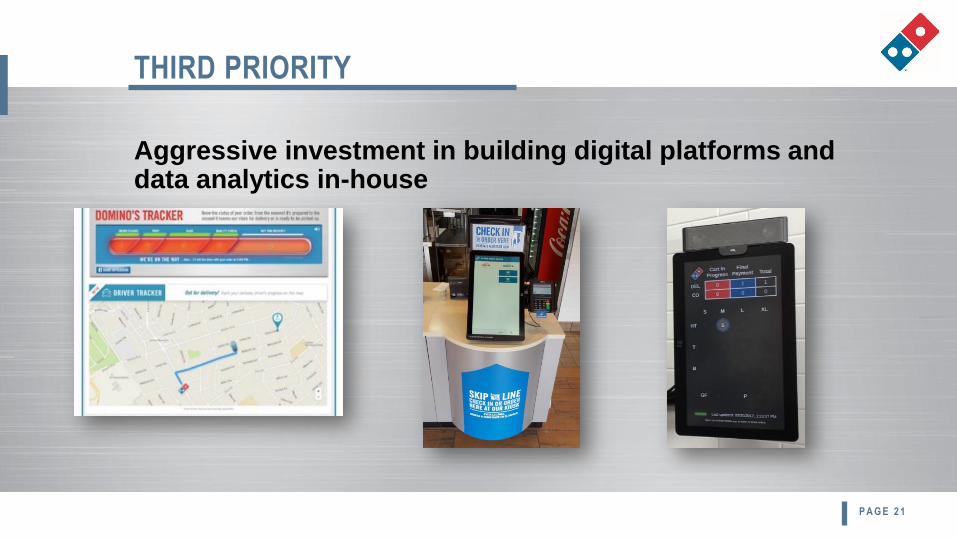
Aggressive investment in building digital platforms and data analytics in-house
THIRD PRIORITY
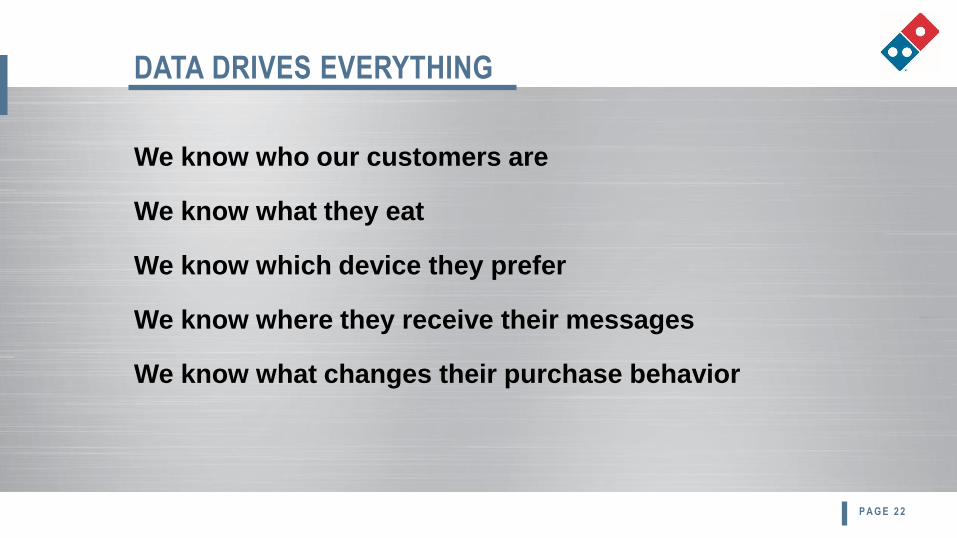
We know who our customers are
We know what they eat
We know which device they prefer
We know where they receive their messages
We know what changes their purchase behavior
DATA DRIVES EVERYTHING
P A G E 2 2
P A G E 2 3
DPZ
WE DON’T INVEST
LIKE OTHER BRANDS
P A G E 2 3
Very different approach to the budget process
WHAT DOES THAT MEAN?
P A G E 2 4
How much do we think we will grow?
How much can we afford to spend?
Can we try some new things?
TYPICAL BUDGET PROCESS
P A G E 2 5
P A G E 2 6
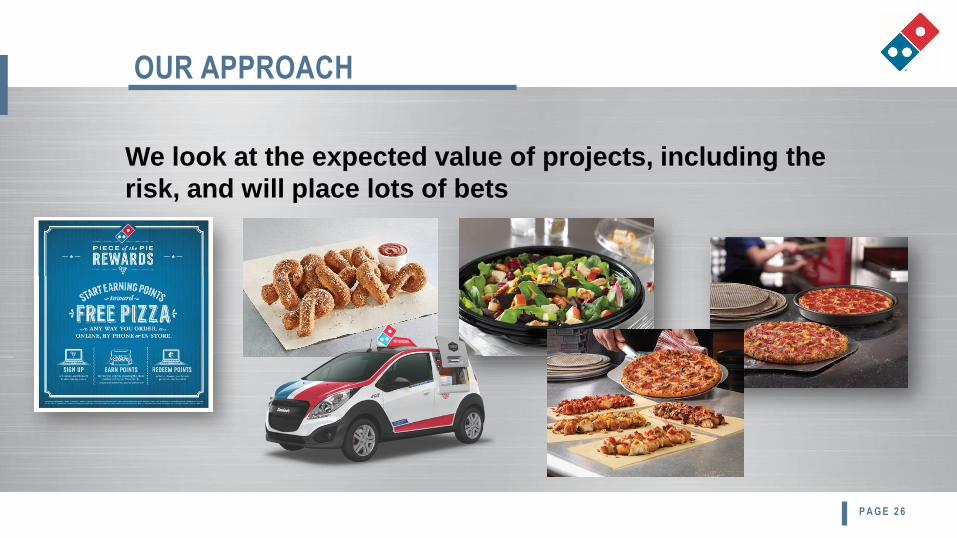
We look at the expected value of projects, including the
risk, and will place lots of bets
OUR APPROACH
P A G E 2 7
Whether capital or expense, we look at cash invested,
what success would look like to shareholders, and the
odds that the investment will be successful
SIMPLE, BUT EFFECTIVE
OUR APPROACH
P A G E 2 8
SIMPLE, FLEXIBLE, DISCIPLINED
=
A COMPETITIVE ADVANTAGE
OUR APPROACH
They invest differently – and heavily – too
They are the ones…
Reimaging & relocating stores
Splitting delivery areas to build more stores
Why? Each is returning strong ROI for them
OUR FRANCHISEES’ APPROACH
P A G E 2 9
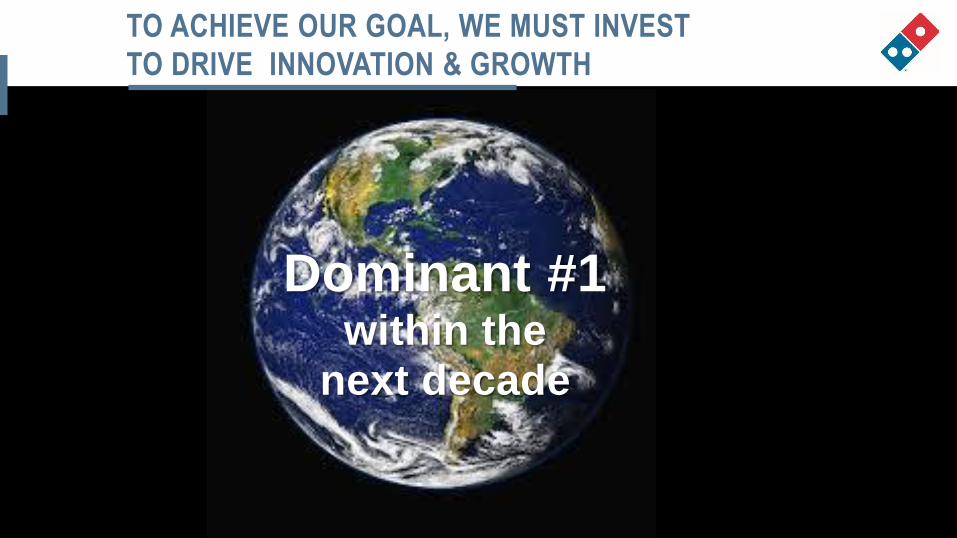
WE’RE #1 – BUT WE’RE NOT FINISHED!
Dominant #1within the
next decade
Next Goal:
PRESIDENT, DOMINO’S INTERNATIONAL
Ritch Allison
Global pizza industry is big and it’s growing
That’s a good thing!
WE’RE #1 – BUT WE’RE NOT FINISHED
P A G E 3 2
It’s also incredibly fragmented
That’s also a good thing!
So…where do we go from here?
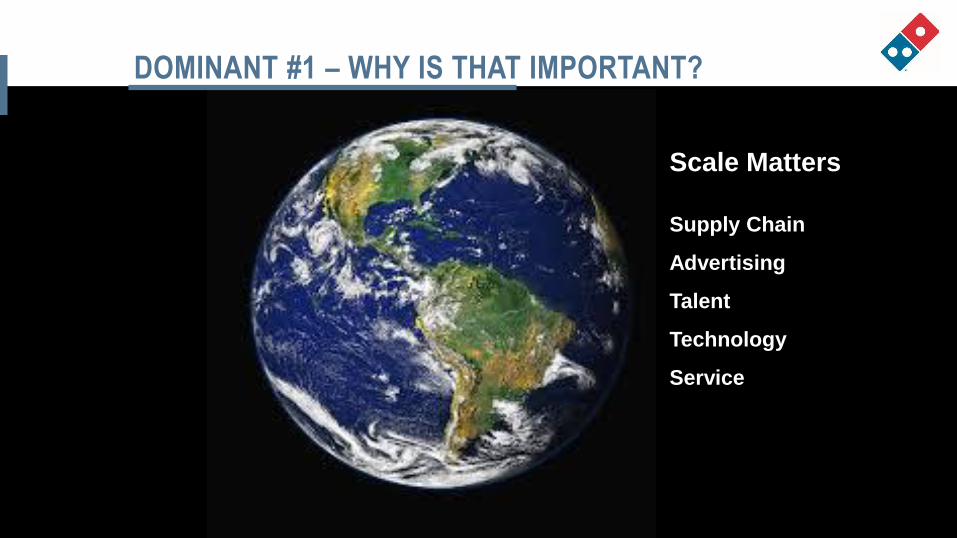
DOMINANT #1 – WHY IS THAT IMPORTANT?
Scale Matters
Supply Chain
Advertising
Talent
Technology
Service
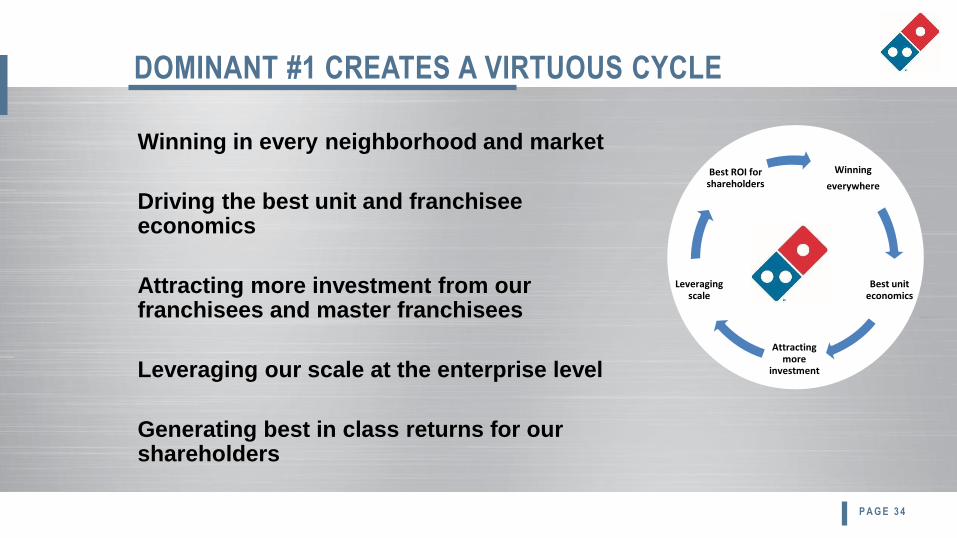
Winning in every neighborhood and market
Driving the best unit and franchisee economics
Attracting more investment from our franchisees and master franchisees
Leveraging our scale at the enterprise level
Generating best in class returns for our shareholders
DOMINANT #1 CREATES A VIRTUOUS CYCLE
P A G E 3 4
Winning
everywhere
Best unit economics
Attracting more
investment
Leveraging scale
Best ROI for shareholders
DOMINANT #1 – HOW DO WE GET THERE?
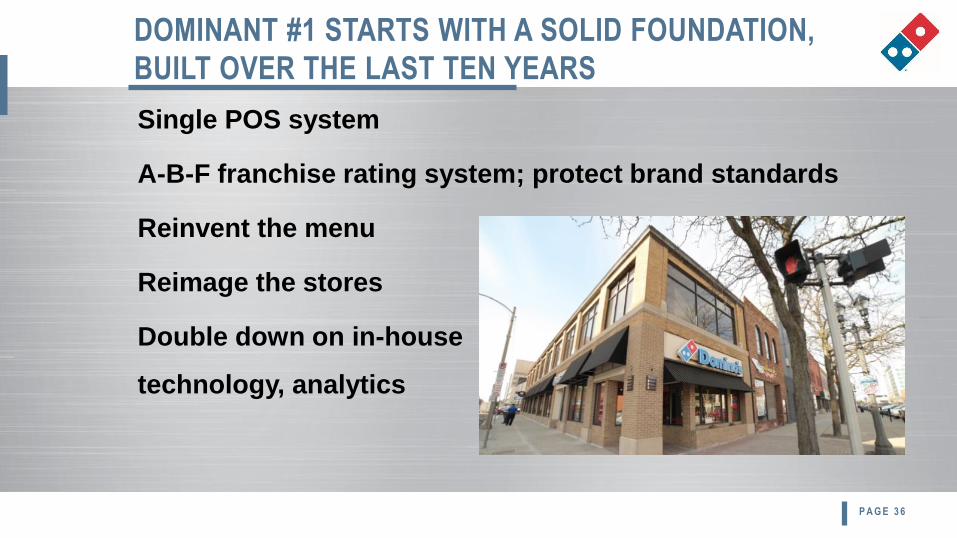
DOMINANT #1 STARTS WITH A SOLID FOUNDATION,
BUILT OVER THE LAST TEN YEARS
P A G E 3 6
Single POS system
A-B-F franchise rating system; protect brand standards
Reinvent the menu
Reimage the stores
Double down on in-house
technology, analytics
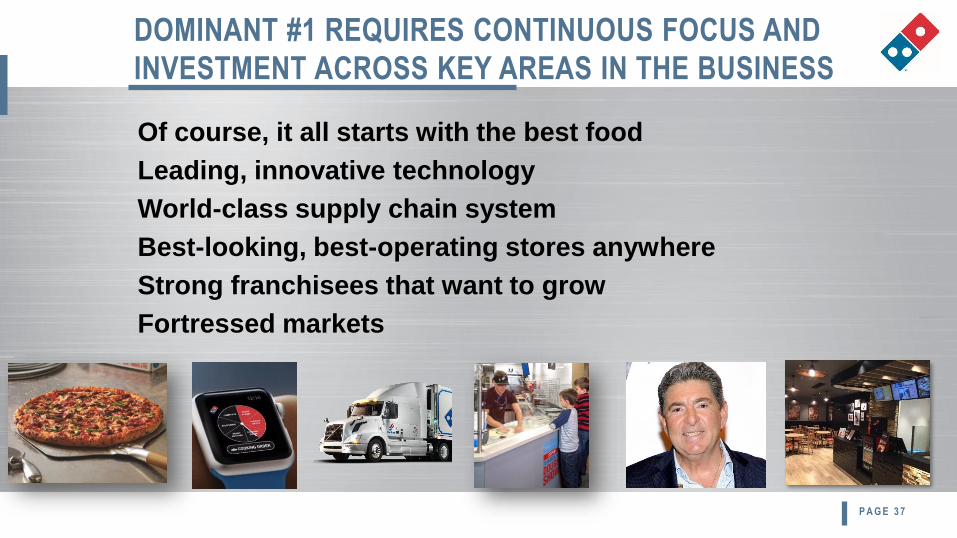
Of course, it all starts with the best food
Leading, innovative technology
World-class supply chain system
Best-looking, best-operating stores anywhere
Strong franchisees that want to grow
Fortressed markets
DOMINANT #1 REQUIRES CONTINUOUS FOCUS AND
INVESTMENT ACROSS KEY AREAS IN THE BUSINESS
P A G E 3 7
THE BEST FOOD IN THE INDUSTRY:
INNOVATION NEVER STOPS
New & Inspired launched the US turnaround, but we haven’t stopped
there
85% of the menu is new since 2010
Continuing to improve our ingredients
Food innovation is happening all over the world
“Taste the Colour” in Australia
Artisan line in Spain
New sandwich line in Japan
New & Inspired line in India
P A G E 3 8
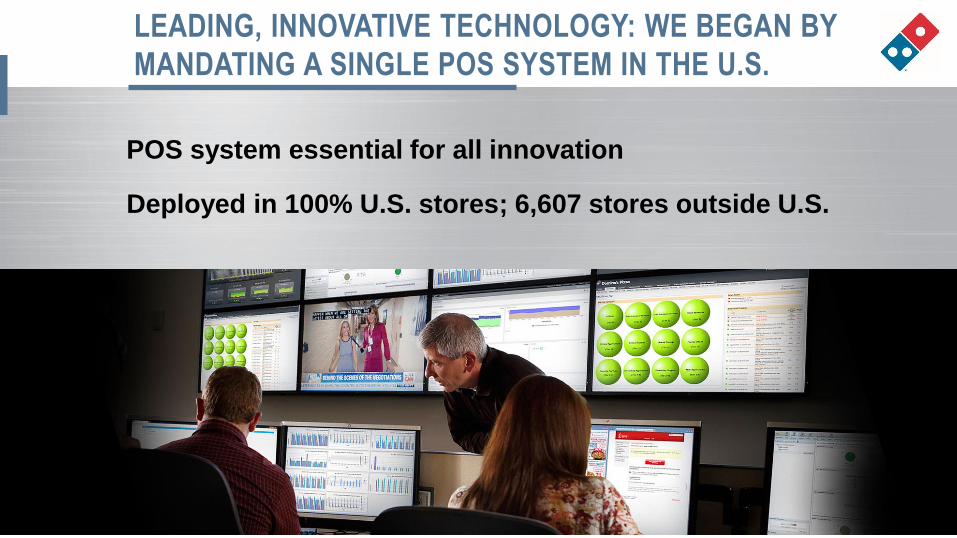
LEADING, INNOVATIVE TECHNOLOGY: WE BEGAN BY
MANDATING A SINGLE POS SYSTEM IN THE U.S.
POS system essential for all innovation
Deployed in 100% U.S. stores; 6,607 stores outside U.S.
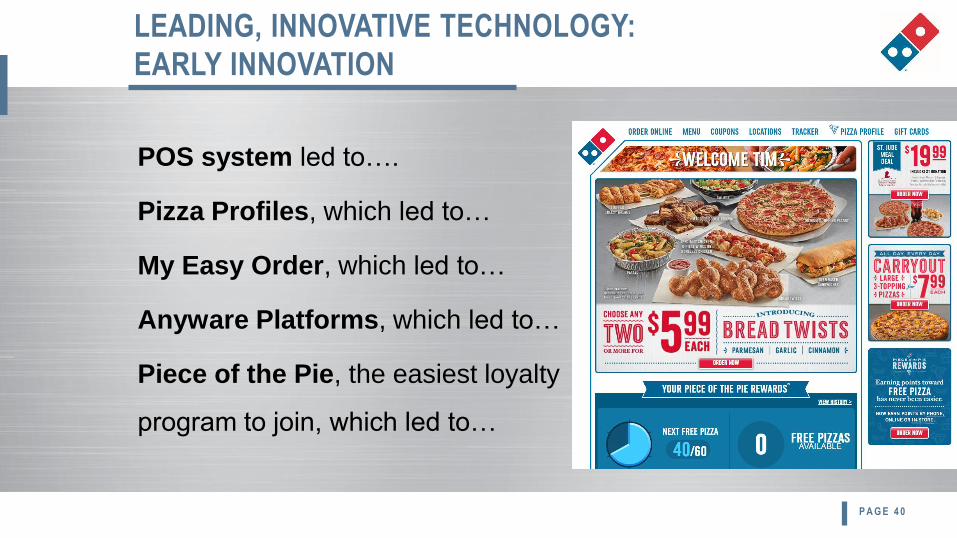
LEADING, INNOVATIVE TECHNOLOGY:
EARLY INNOVATION
POS system led to….
Pizza Profiles, which led to…
My Easy Order, which led to…
Anyware Platforms, which led to…
Piece of the Pie, the easiest loyalty
program to join, which led to…
P A G E 4 0
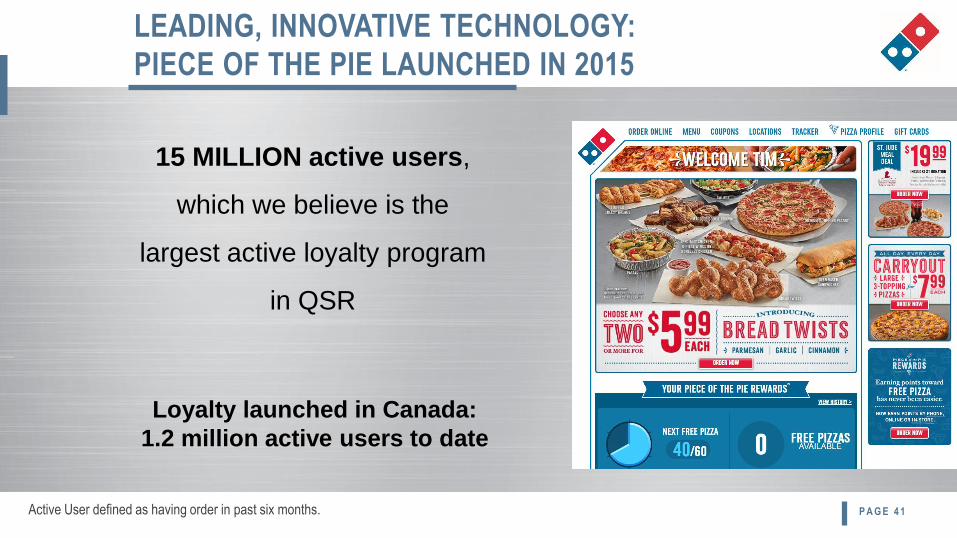
LEADING, INNOVATIVE TECHNOLOGY:
PIECE OF THE PIE LAUNCHED IN 2015
15 MILLION active users,
which we believe is the
largest active loyalty program
in QSR
Loyalty launched in Canada:
1.2 million active users to date
P A G E 4 1Active User defined as having order in past six months.
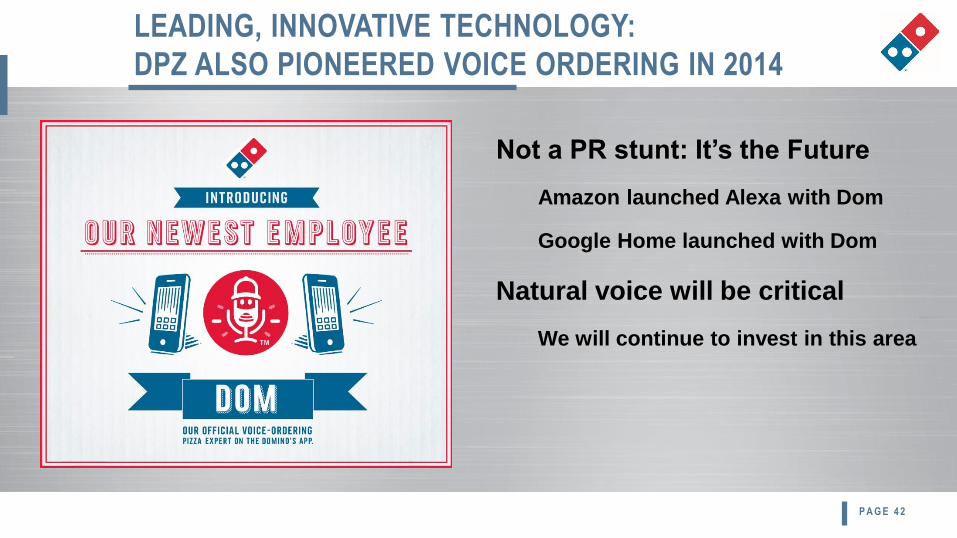
LEADING, INNOVATIVE TECHNOLOGY:
DPZ ALSO PIONEERED VOICE ORDERING IN 2014
Not a PR stunt: It’s the Future
Amazon launched Alexa with Dom
Google Home launched with Dom
Natural voice will be critical
We will continue to invest in this area
P A G E 4 2
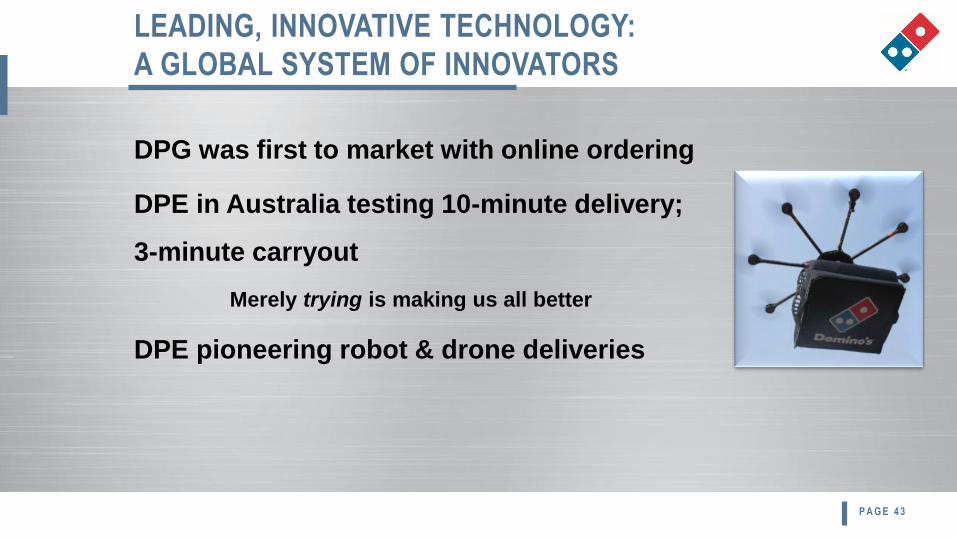
LEADING, INNOVATIVE TECHNOLOGY:
A GLOBAL SYSTEM OF INNOVATORS
DPG was first to market with online ordering
DPE in Australia testing 10-minute delivery;
3-minute carryout
Merely trying is making us all better
DPE pioneering robot & drone deliveries
P A G E 4 3
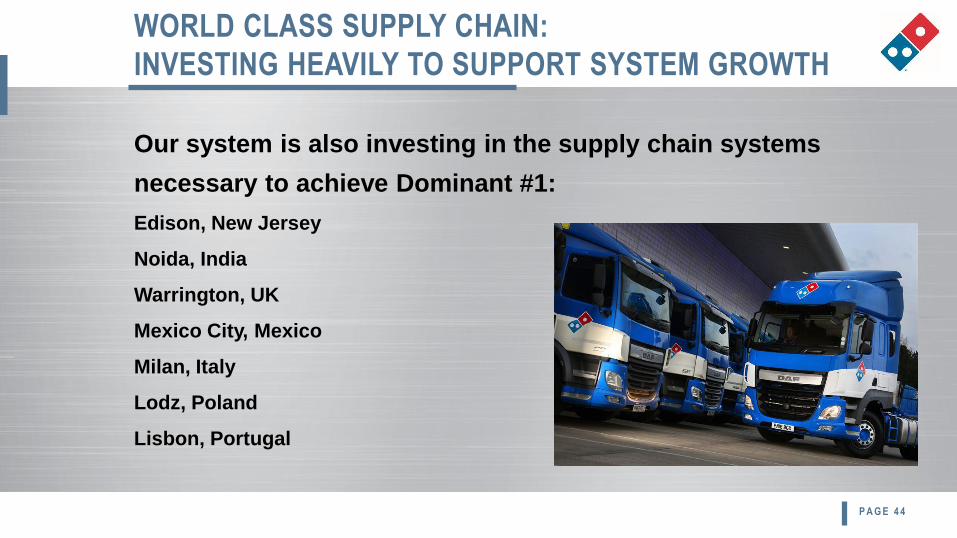
WORLD CLASS SUPPLY CHAIN:
INVESTING HEAVILY TO SUPPORT SYSTEM GROWTH
Our system is also investing in the supply chain systems
necessary to achieve Dominant #1:
Edison, New Jersey
Noida, India
Warrington, UK
Mexico City, Mexico
Milan, Italy
Lodz, Poland
Lisbon, Portugal
P A G E 4 4
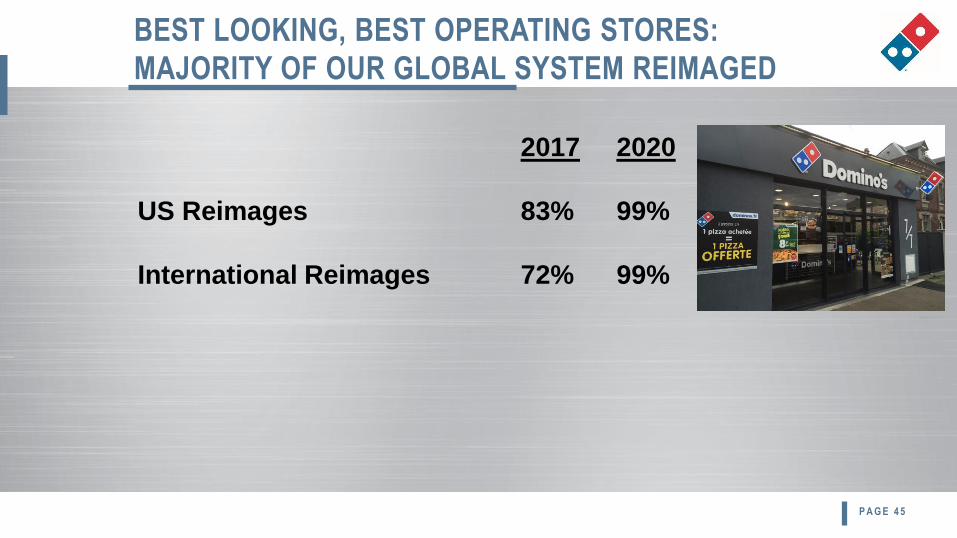
BEST LOOKING, BEST OPERATING STORES:
MAJORITY OF OUR GLOBAL SYSTEM REIMAGED
P A G E 4 5
2017 2020
US Reimages 83% 99%
International Reimages 72% 99%
U.S. A-B-F program moved franchisee count from ~1,300 to ~800
Stores-per-franchisee grew from 4 to 6
International markets realigned under new ownership in a
number of key markets
Japan, Germany, Spain, China, Russia and much of Scandinavia
Continuing to drive alignment with franchisees sharing our
vision and desire to grow
STRONG FRANCHISEES THAT WANT TO GROW:
WE HAVE REALIGNED THE FRANCHISEE BASE
P A G E 4 6
FORTRESSED MARKETS:
FRANCHISEES INVESTING HEAVILY
Franchisees are splitting delivery areas to fortress their markets
273 U.S. stores opened in the last 3 years were splits
Approximately 32% of international stores in last 12 months were splits
Master franchisees are converting competing brands to Domino’s
Scooter’s brand in South Africa converted to Domino’s
DPE purchased #1 & #2 brands in Germany
DPG purchased the #3 brand in Norway
P A G E 4 7
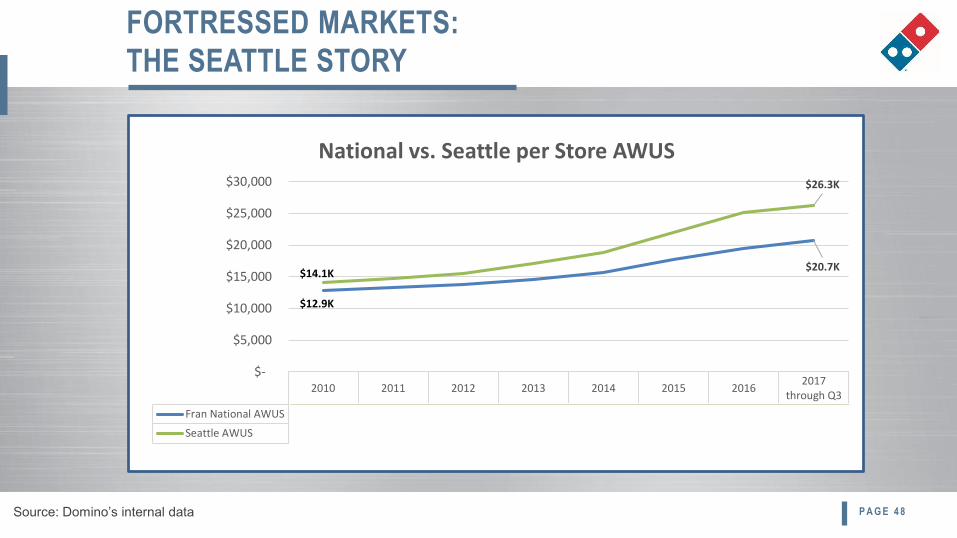
FORTRESSED MARKETS:
THE SEATTLE STORY
P A G E 4 8
2010 2011 2012 2013 2014 2015 20162017
through Q3
Fran National AWUS $12,916 $13,391 $13,840 $14,604 $15,748 $17,706 $19,492 $20,724
Seattle AWUS $14,109 $14,782 $15,488 $17,031 $18,772 $22,056 $25,098 $26,303
$20.7K
$26.3K
$-
$5,000
$10,000
$15,000
$20,000
$25,000
$30,000
National vs. Seattle per Store AWUS
$12.9K
$14.1K
Source: Domino’s internal data
P A G E 4 9
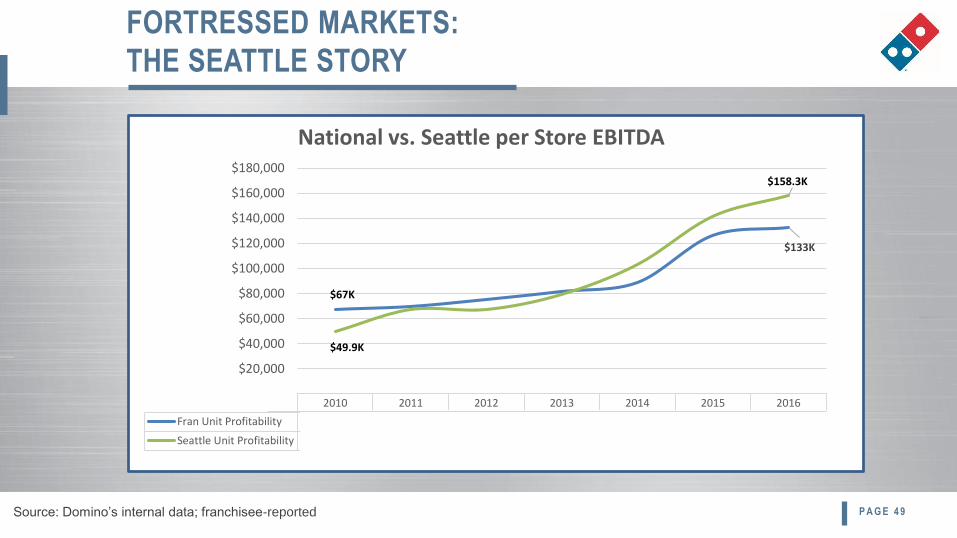
2010 2011 2012 2013 2014 2015 2016
Fran Unit Profitability $67,000 $70,000 $75,000 $82,000 $89,000 $126,000 $133,000
Seattle Unit Profitability $49,960 $67,218 $67,256 $79,449 $102,978 $141,311 $158,392
$133K
$158,392
$0
$20,000
$40,000
$60,000
$80,000
$100,000
$120,000
$140,000
$160,000
$180,000
National vs. Seattle per Store EBITDA
$67K
$49.9K
Source: Domino’s internal data; franchisee-reported
FORTRESSED MARKETS:
THE SEATTLE STORY
$158.3K
P A G E 5 0
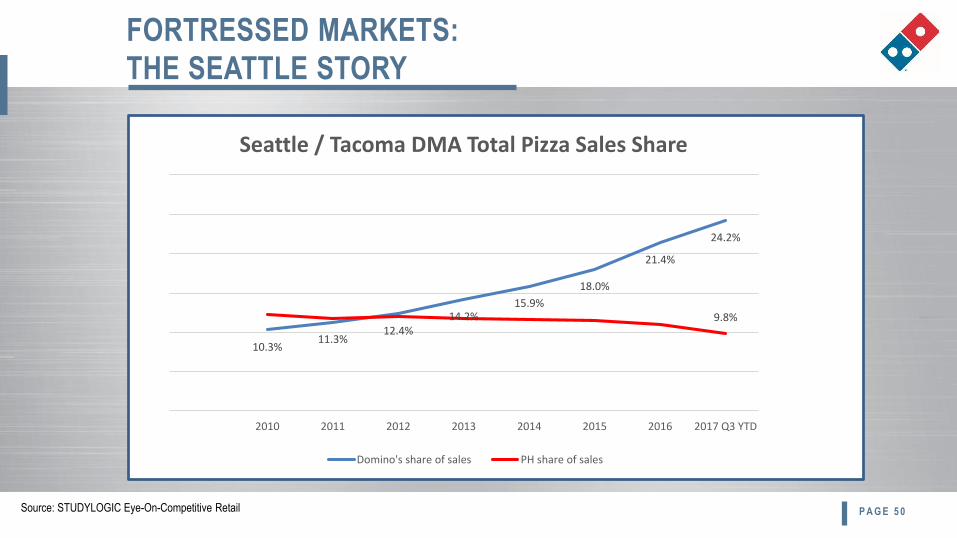
10.3%11.3%
12.4%14.2%
15.9%
18.0%
21.4%
24.2%
9.8%
2010 2011 2012 2013 2014 2015 2016 2017 Q3 YTD
Seattle / Tacoma DMA Total Pizza Sales Share
Domino's share of sales PH share of sales
Source: STUDYLOGIC Eye-On-Competitive Retail
FORTRESSED MARKETS:
THE SEATTLE STORY
TO ACHIEVE OUR GOAL, WE MUST INVEST
TO DRIVE INNOVATION & GROWTH
Dominant #1within the
next decade
PRESIDENT, DOMINO’S USA
Russell Weiner
16.7%
0%
2%
4%
6%
8%
10%
12%
14%
16%
18%
Q1
Q2
Q3
Q4
Q1
Q2
Q3
Q4
Q1
Q2
Q3
Q4
Q1
Q2
Q3
Q4
Q1
Q2
Q3
Q4
Q1
Q2
Q3
Q4
Q1
Q2
Q3
Q4
Q1
Q2
Q3
Q4
Q1
Q2
Q3
Q4
Q1
Q2
Q3
Q4
2008 2009 2010 2011 2012 2013 2014 2015 2016 2017
NPD QSR Pizza Dollar Share
THE ROAD TO #1 IN THE US WAS FILLED WITH
MAJOR CONSUMER FACING INNOVATION
P A G E 5 3Source: The NPD Group/CREST® through quarter ending September 2017
P A G E 5 4
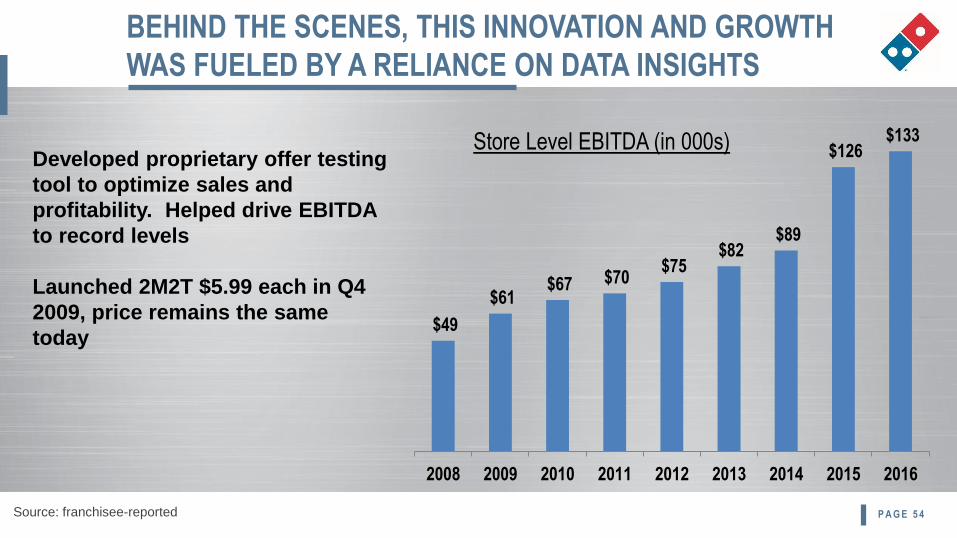
BEHIND THE SCENES, THIS INNOVATION AND GROWTH
WAS FUELED BY A RELIANCE ON DATA INSIGHTS
Developed proprietary offer testing
tool to optimize sales and
profitability. Helped drive EBITDA
to record levels
Launched 2M2T $5.99 each in Q4
2009, price remains the same
today$49
$61 $67 $70
$75 $82
$89
$126 $133
2008 2009 2010 2011 2012 2013 2014 2015 2016
Store Level EBITDA (in 000s)
Source: franchisee-reported
P A G E 5 5
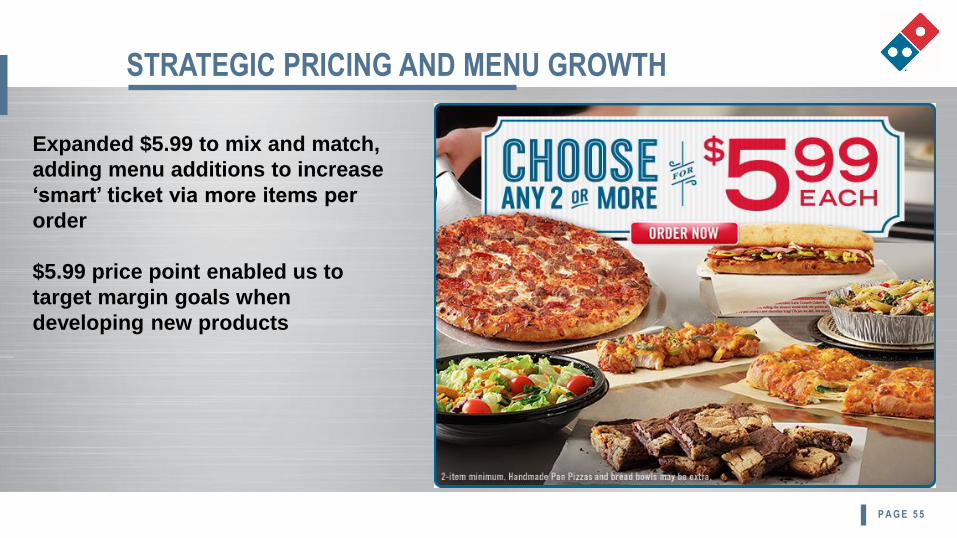
STRATEGIC PRICING AND MENU GROWTH
Expanded $5.99 to mix and match,
adding menu additions to increase
‘smart’ ticket via more items per
order
$5.99 price point enabled us to
target margin goals when
developing new products
P A G E 5 6
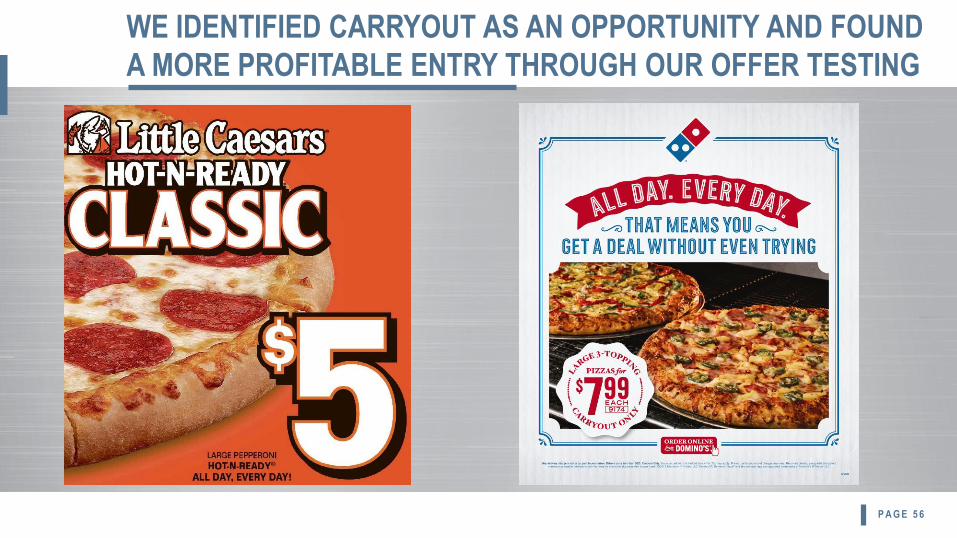
WE IDENTIFIED CARRYOUT AS AN OPPORTUNITY AND FOUND
A MORE PROFITABLE ENTRY THROUGH OUR OFFER TESTING
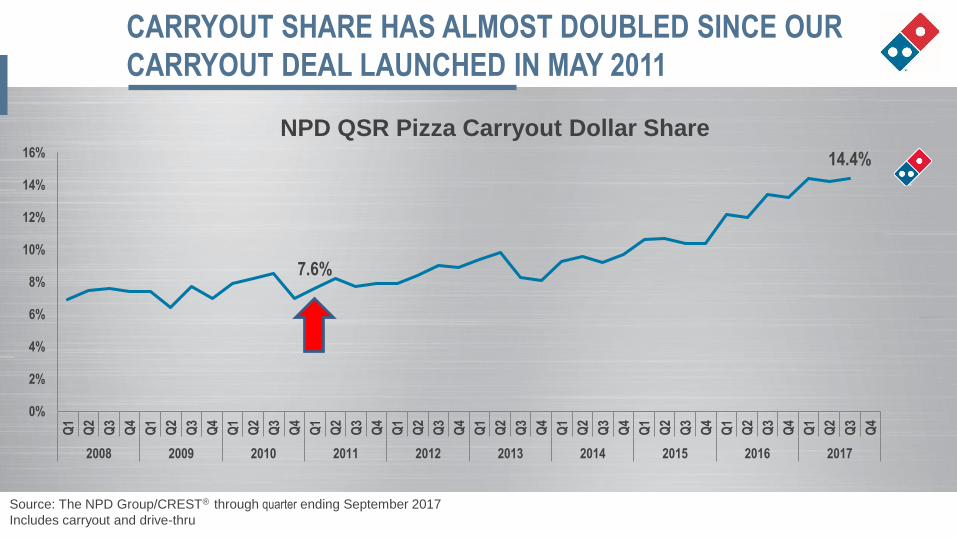
CARRYOUT SHARE HAS ALMOST DOUBLED SINCE OUR
CARRYOUT DEAL LAUNCHED IN MAY 2011
Source: The NPD Group/CREST® through quarter ending September 2017
Includes carryout and drive-thru
7.6%
14.4%
0%
2%
4%
6%
8%
10%
12%
14%
16%
Q1
Q2
Q3
Q4
Q1
Q2
Q3
Q4
Q1
Q2
Q3
Q4
Q1
Q2
Q3
Q4
Q1
Q2
Q3
Q4
Q1
Q2
Q3
Q4
Q1
Q2
Q3
Q4
Q1
Q2
Q3
Q4
Q1
Q2
Q3
Q4
Q1
Q2
Q3
Q4
2008 2009 2010 2011 2012 2013 2014 2015 2016 2017
NPD QSR Pizza Carryout Dollar Share
P A G E 5 8
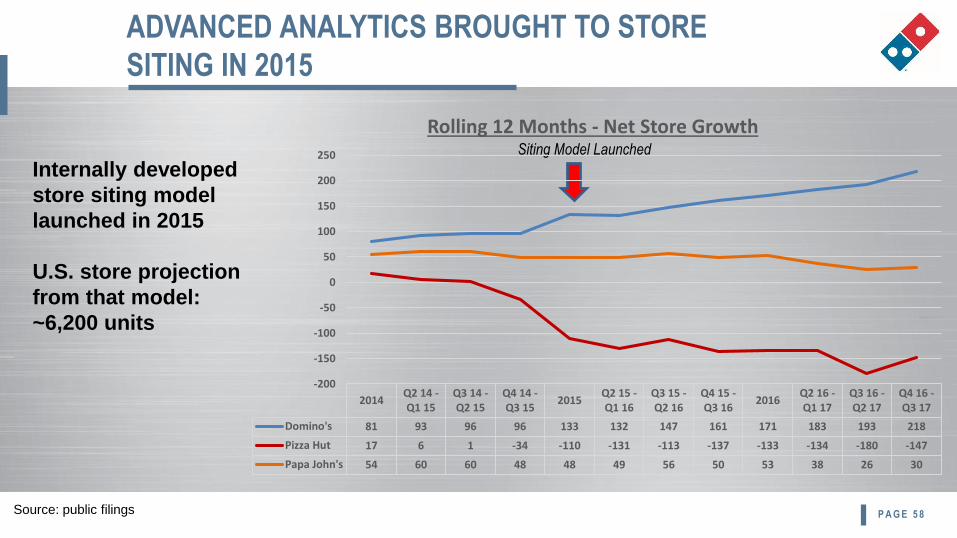
ADVANCED ANALYTICS BROUGHT TO STORE
SITING IN 2015
Internally developed
store siting model
launched in 2015
U.S. store projection
from that model:
~6,200 units
Siting Model Launched
Source: public filings
2014Q2 14 -Q1 15
Q3 14 -Q2 15
Q4 14 -Q3 15
2015Q2 15 -Q1 16
Q3 15 -Q2 16
Q4 15 -Q3 16
2016Q2 16 -Q1 17
Q3 16 -Q2 17
Q4 16 -Q3 17
Domino's 81 93 96 96 133 132 147 161 171 183 193 218
Pizza Hut 17 6 1 -34 -110 -131 -113 -137 -133 -134 -180 -147
Papa John's 54 60 60 48 48 49 56 50 53 38 26 30
-200
-150
-100
-50
0
50
100
150
200
250
Rolling 12 Months - Net Store Growth
P A G E 5 9
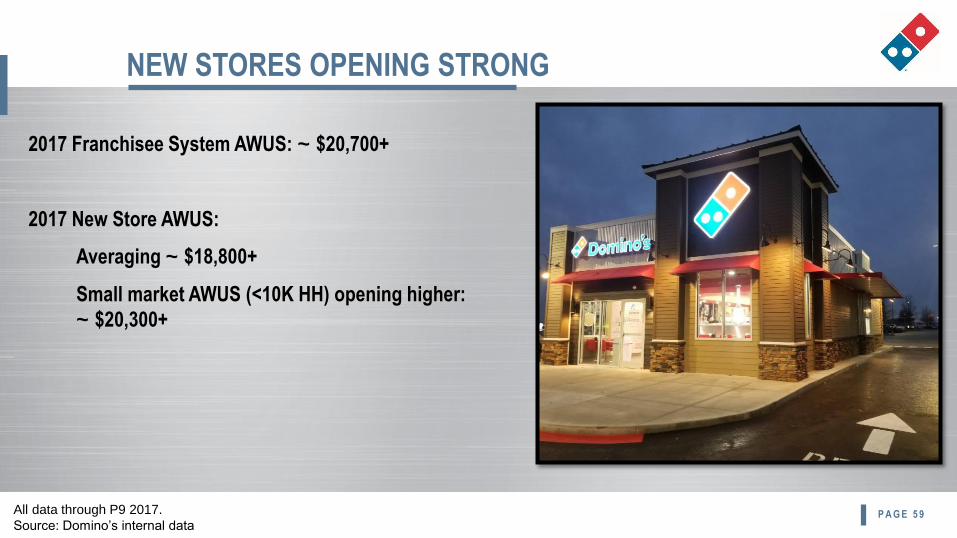
NEW STORES OPENING STRONG
2017 Franchisee System AWUS: ~ $20,700+
2017 New Store AWUS:
Averaging ~ $18,800+
Small market AWUS (<10K HH) opening higher:
~ $20,300+
All data through P9 2017.
Source: Domino’s internal data
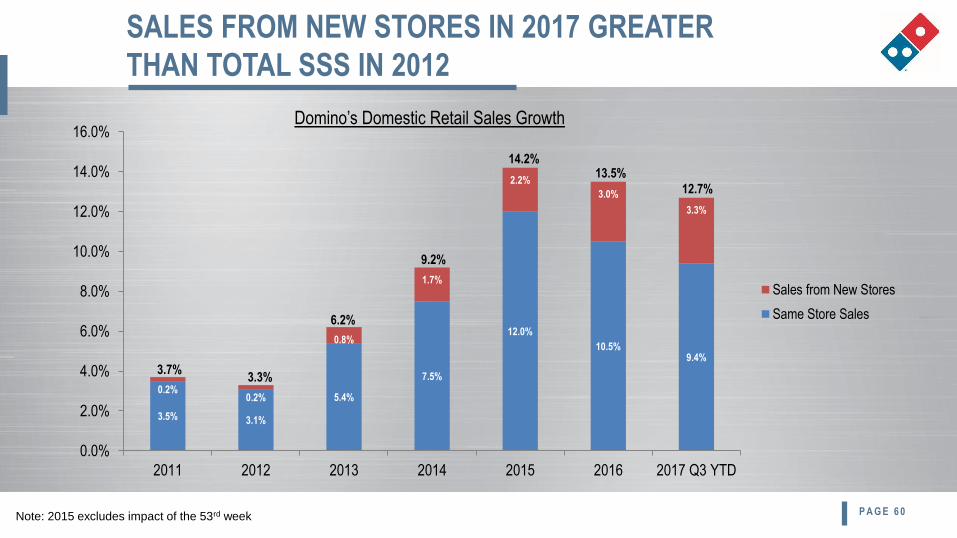
3.5% 3.1%
5.4%
7.5%
12.0%
10.5%9.4%
0.2%0.2%
0.8%
1.7%
2.2%
3.0%
3.3%
0.0%
2.0%
4.0%
6.0%
8.0%
10.0%
12.0%
14.0%
16.0%
2011 2012 2013 2014 2015 2016 2017 Q3 YTD
Sales from New Stores
Same Store Sales
3.7%3.3%
6.2%
9.2%
14.2%13.5%
12.7%
Domino’s Domestic Retail Sales Growth
Note: 2015 excludes impact of the 53rd week P A G E 6 0
SALES FROM NEW STORES IN 2017 GREATER
THAN TOTAL SSS IN 2012
P A G E 6 1
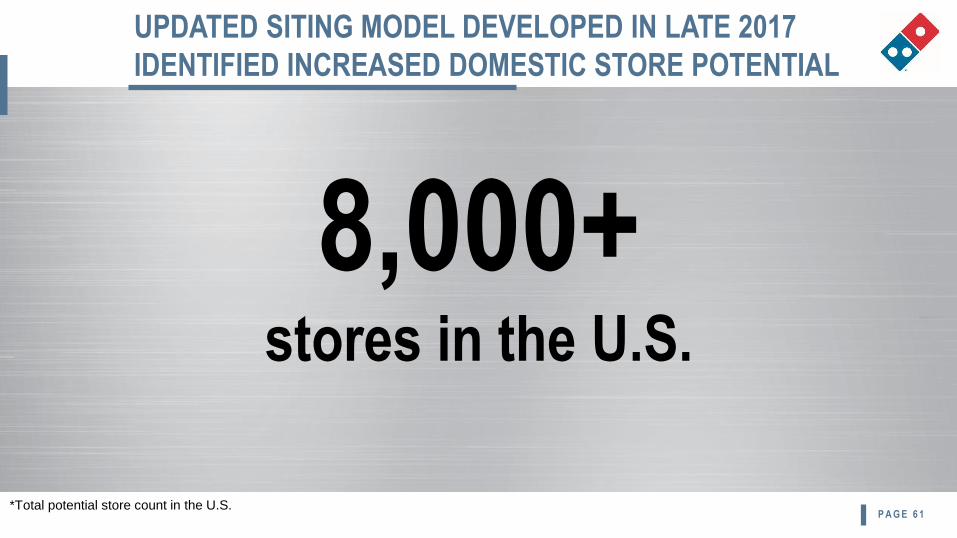
UPDATED SITING MODEL DEVELOPED IN LATE 2017
IDENTIFIED INCREASED DOMESTIC STORE POTENTIAL
8,000+ stores in the U.S.
*Total potential store count in the U.S.
P A G E 6 2
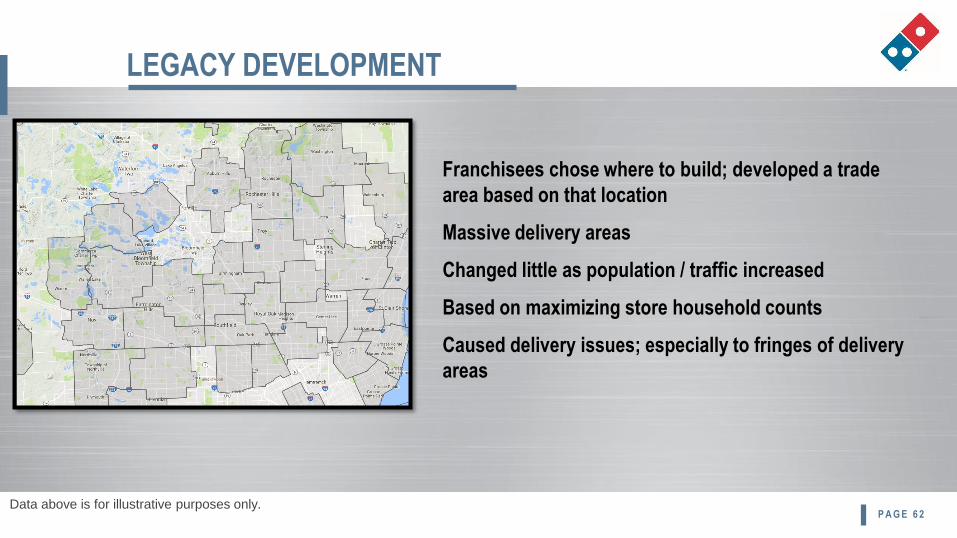
LEGACY DEVELOPMENT
Franchisees chose where to build; developed a trade
area based on that location
Massive delivery areas
Changed little as population / traffic increased
Based on maximizing store household counts
Caused delivery issues; especially to fringes of delivery
areas
Data above is for illustrative purposes only.
P A G E 6 3
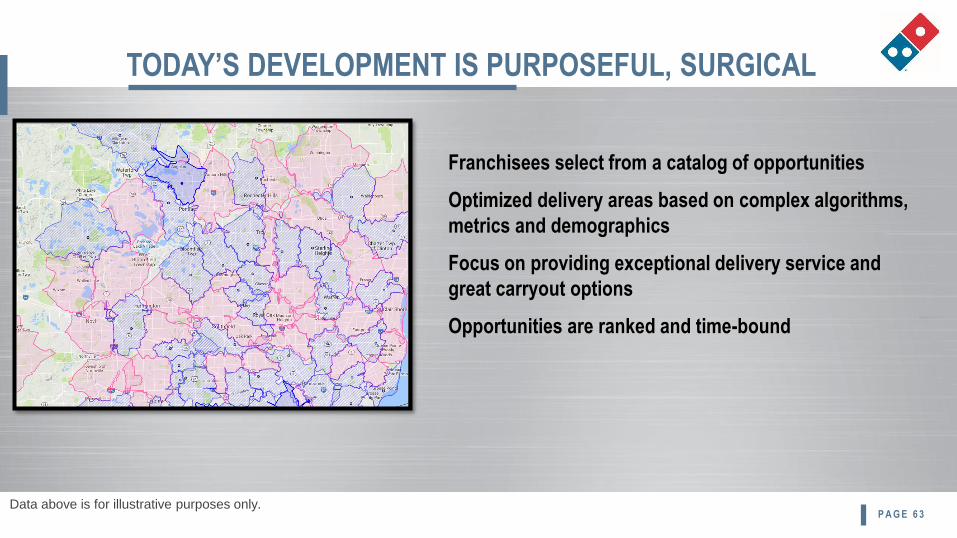
TODAY’S DEVELOPMENT IS PURPOSEFUL, SURGICAL
Franchisees select from a catalog of opportunities
Optimized delivery areas based on complex algorithms,
metrics and demographics
Focus on providing exceptional delivery service and
great carryout options
Opportunities are ranked and time-bound
Data above is for illustrative purposes only.
P A G E 6 4
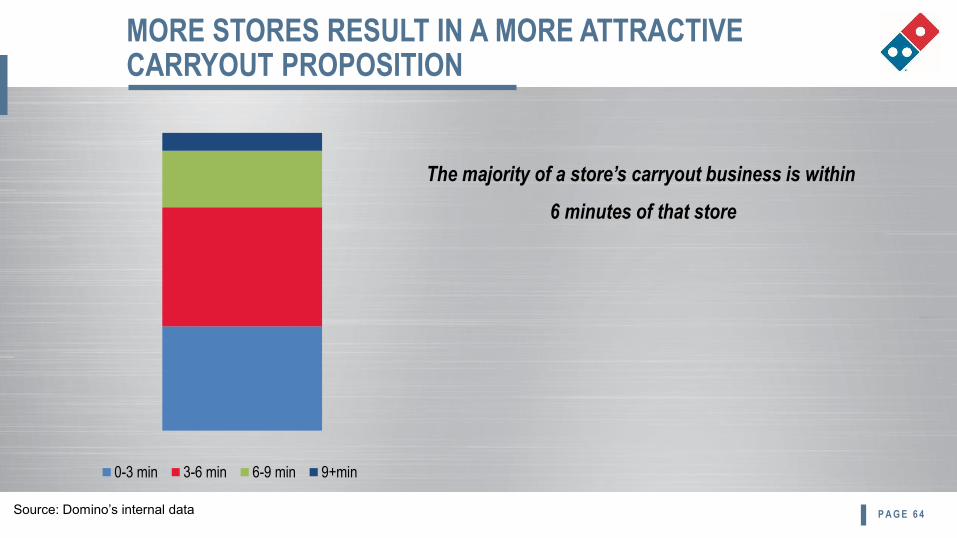
MORE STORES RESULT IN A MORE ATTRACTIVE CARRYOUT PROPOSITION
The majority of a store’s carryout business is within
6 minutes of that store
0-3 min 3-6 min 6-9 min 9+min
Source: Domino’s internal data
P A G E 6 5
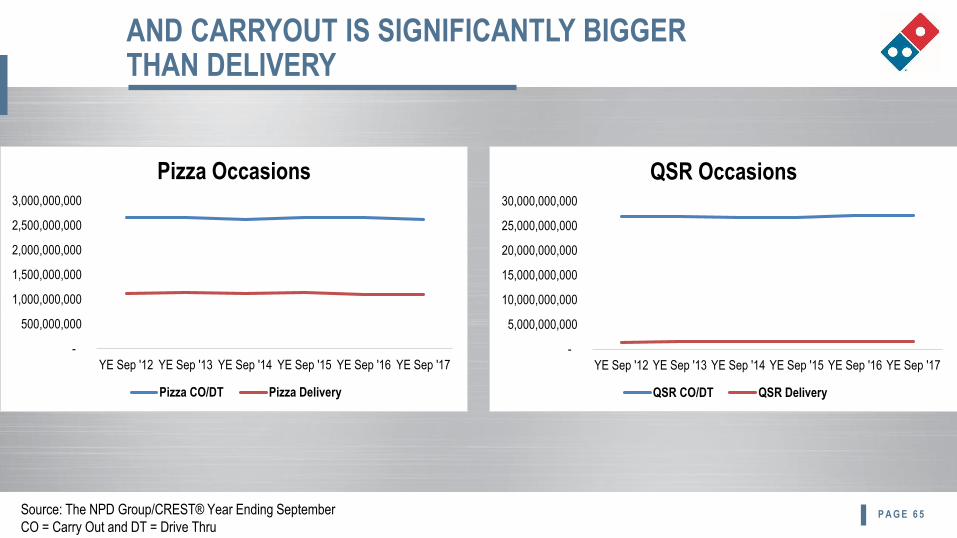
AND CARRYOUT IS SIGNIFICANTLY BIGGER THAN DELIVERY
-
500,000,000
1,000,000,000
1,500,000,000
2,000,000,000
2,500,000,000
3,000,000,000
YE Sep '12 YE Sep '13 YE Sep '14 YE Sep '15 YE Sep '16 YE Sep '17
Pizza Occasions
Pizza CO/DT Pizza Delivery
-
5,000,000,000
10,000,000,000
15,000,000,000
20,000,000,000
25,000,000,000
30,000,000,000
YE Sep '12 YE Sep '13 YE Sep '14 YE Sep '15 YE Sep '16 YE Sep '17
QSR Occasions
QSR CO/DT QSR Delivery
Source: The NPD Group/CREST® Year Ending September
CO = Carry Out and DT = Drive Thru
P A G E 6 6
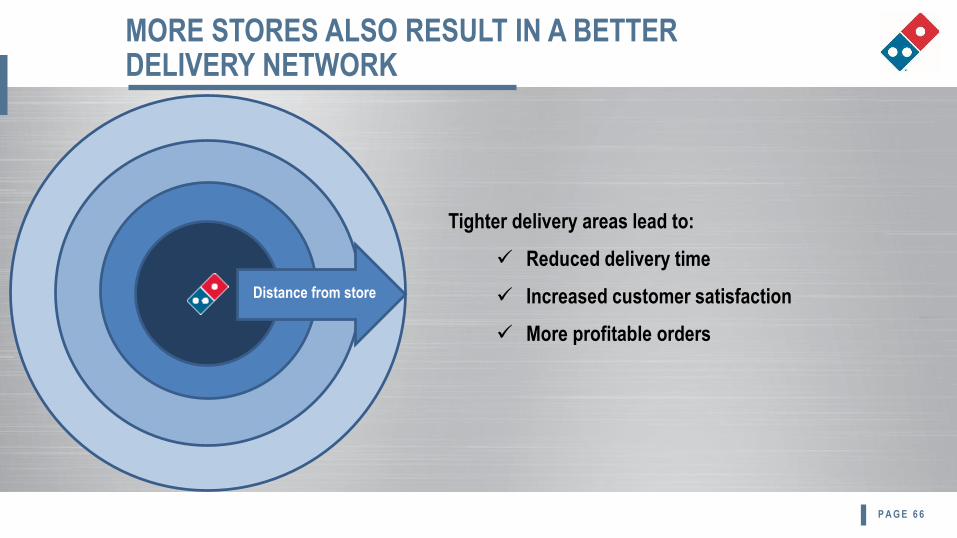
MORE STORES ALSO RESULT IN A BETTER DELIVERY NETWORK
Distance from store
Tighter delivery areas lead to:
✓ Reduced delivery time
✓ Increased customer satisfaction
✓ More profitable orders
P A G E 6 7
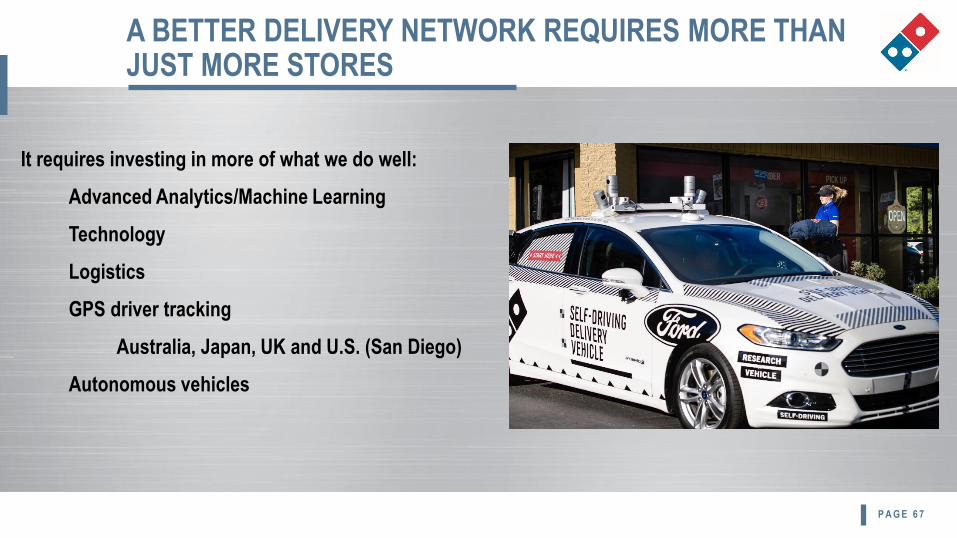
A BETTER DELIVERY NETWORK REQUIRES MORE THAN JUST MORE STORES
It requires investing in more of what we do well:
Advanced Analytics/Machine Learning
Technology
Logistics
GPS driver tracking
Australia, Japan, UK and U.S. (San Diego)
Autonomous vehicles
P A G E 6 8
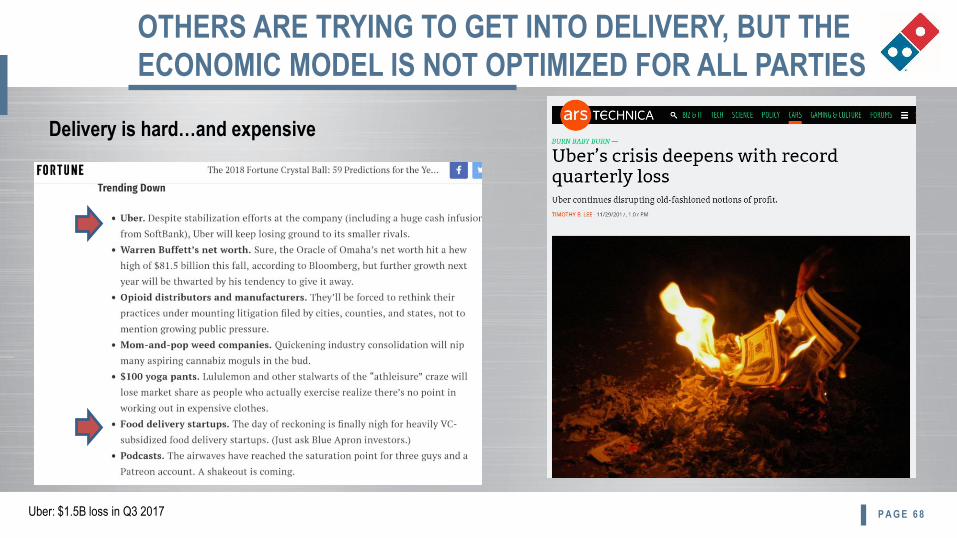
OTHERS ARE TRYING TO GET INTO DELIVERY, BUT THE
ECONOMIC MODEL IS NOT OPTIMIZED FOR ALL PARTIES
Delivery is hard…and expensive
Uber: $1.5B loss in Q3 2017
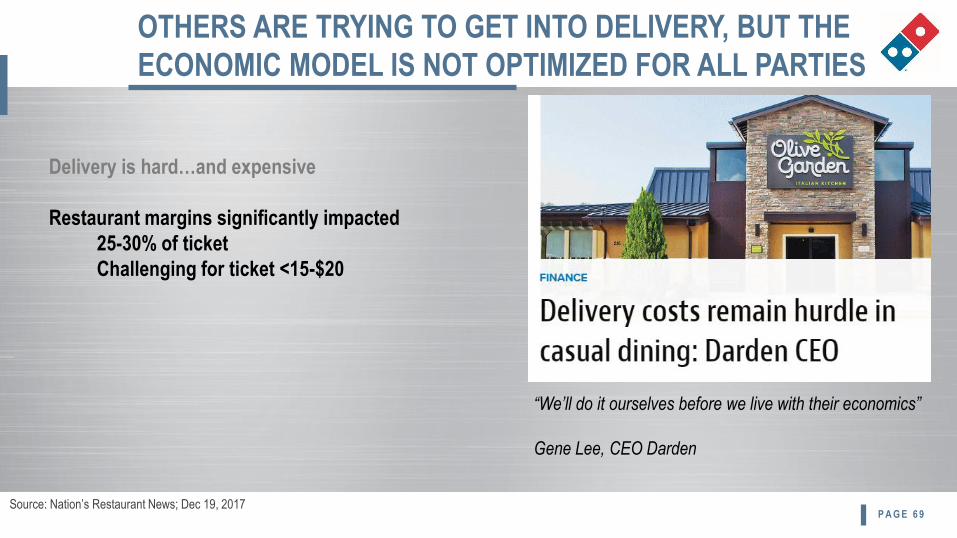
P A G E 6 9
“We’ll do it ourselves before we live with their economics”
Gene Lee, CEO Darden
Delivery is hard…and expensive
Restaurant margins significantly impacted
25-30% of ticket
Challenging for ticket <15-$20
Source: Nation’s Restaurant News; Dec 19, 2017
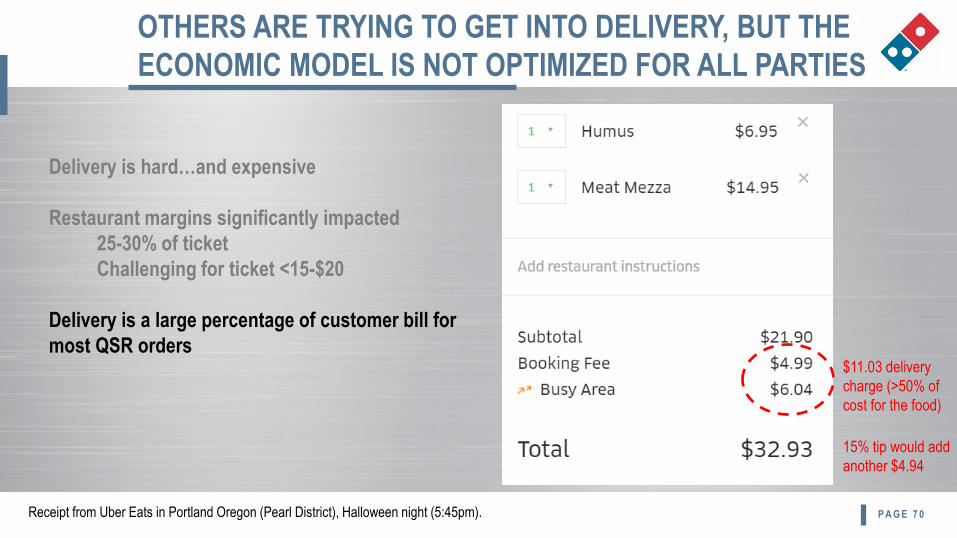
OTHERS ARE TRYING TO GET INTO DELIVERY, BUT THE
ECONOMIC MODEL IS NOT OPTIMIZED FOR ALL PARTIES
P A G E 7 0
Delivery is hard…and expensive
Restaurant margins significantly impacted
25-30% of ticket
Challenging for ticket <15-$20
Delivery is a large percentage of customer bill for
most QSR orders
Receipt from Uber Eats in Portland Oregon (Pearl District), Halloween night (5:45pm).
$11.03 delivery
charge (>50% of
cost for the food)
15% tip would add
another $4.94
OTHERS ARE TRYING TO GET INTO DELIVERY, BUT THE
ECONOMIC MODEL IS NOT OPTIMIZED FOR ALL PARTIES
P A G E 7 1
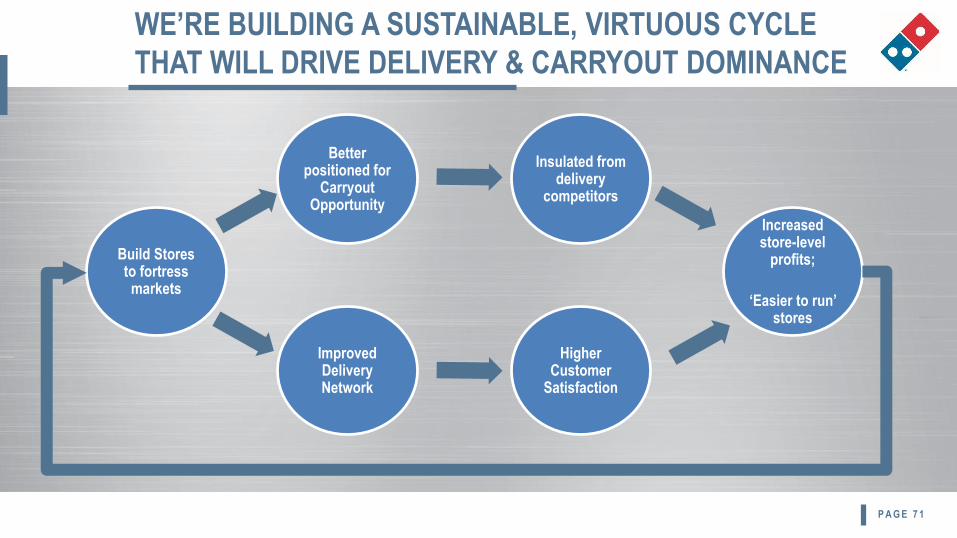
Build Stores to fortress markets
Better positioned for
Carryout Opportunity
Improved Delivery Network
Insulated from delivery
competitors
Higher Customer
Satisfaction
Increased store-level
profits;
‘Easier to run’ stores
WE’RE BUILDING A SUSTAINABLE, VIRTUOUS CYCLE
THAT WILL DRIVE DELIVERY & CARRYOUT DOMINANCE
P A G E 7 2
THIS MODEL IS ALREADY WORKING FOR DOMINO’S
IN GLOBAL MARKETS
Australia opening stores with average of 8,000 households and 6-minute drive
times
Netherlands fortressing and now achieving 21-minute average delivery times
Austria opened with 4-minute drive times
Iceland opened their 23rd store in a country with only 334,000 people!
P A G E 7 3
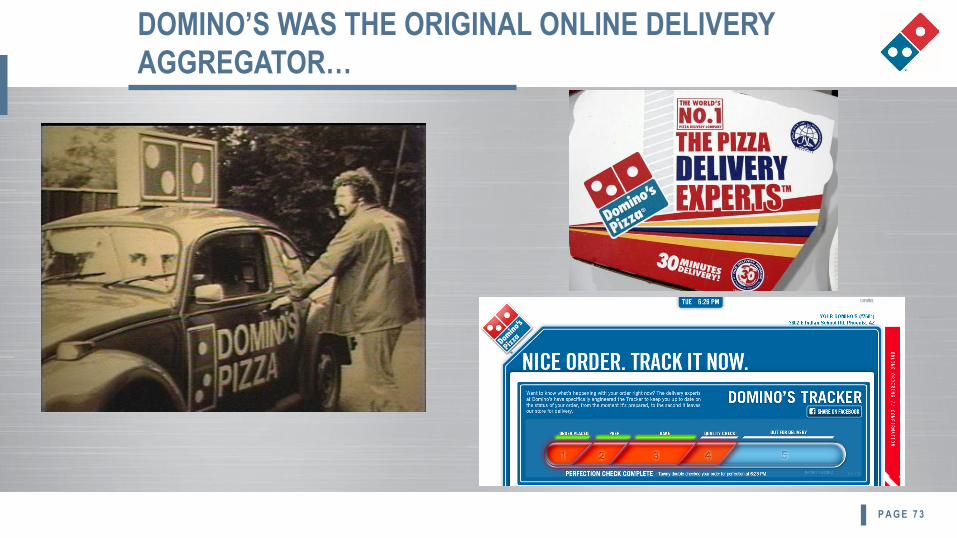
DOMINO’S WAS THE ORIGINAL ONLINE DELIVERY
AGGREGATOR…
P A G E 7 4
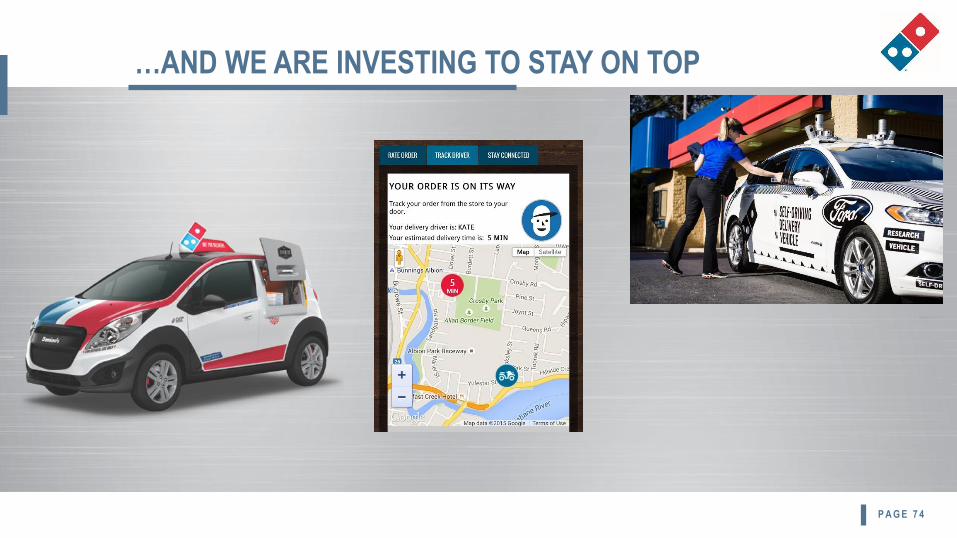
…AND WE ARE INVESTING TO STAY ON TOP

CHIEF FINANCIAL OFFICER
Jeff Lawrence
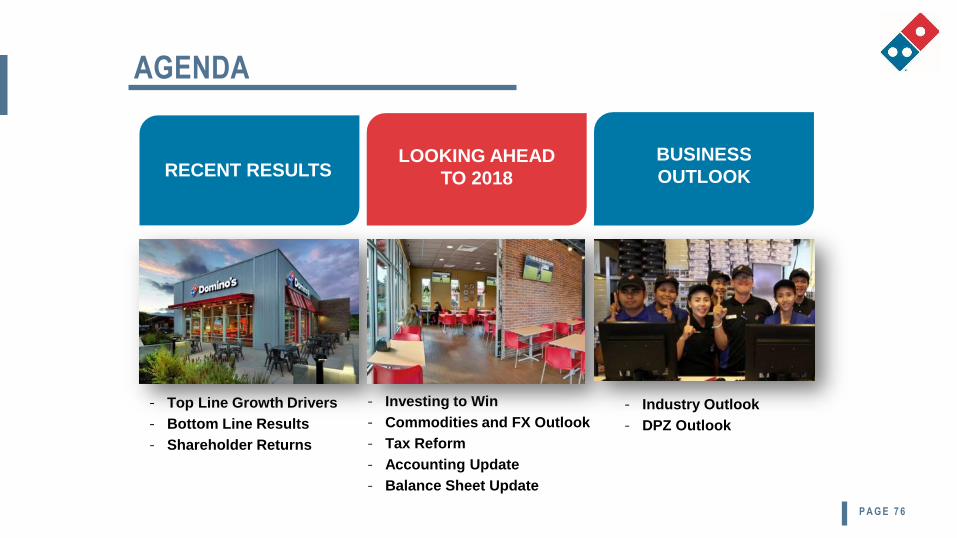
RECENT RESULTS
- Top Line Growth Drivers
- Bottom Line Results
- Shareholder Returns
BUSINESS
OUTLOOKLOOKING AHEAD
TO 2018
- Investing to Win
- Commodities and FX Outlook
- Tax Reform
- Accounting Update
- Balance Sheet Update
- Industry Outlook
- DPZ Outlook
AGENDA
P A G E 7 6
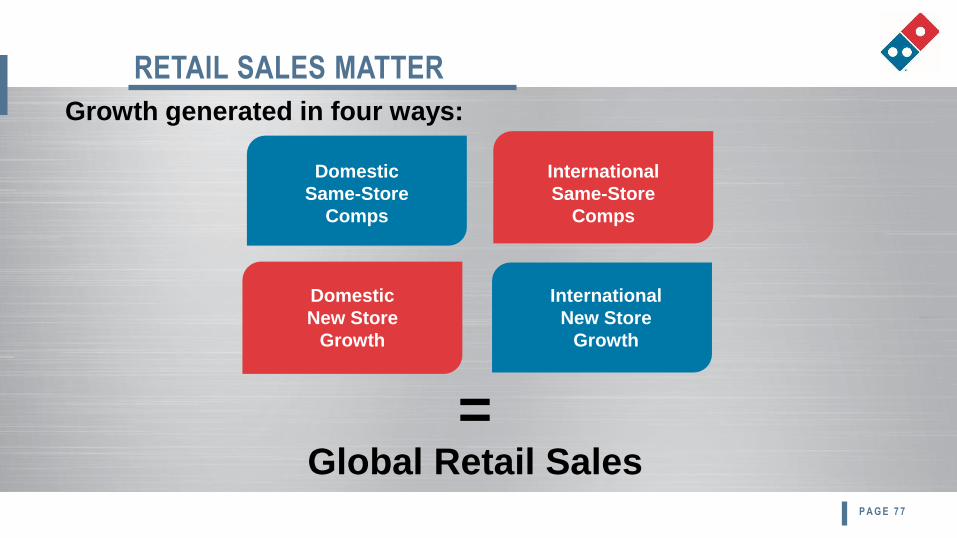
RETAIL SALES MATTER
P A G E 7 7
Growth generated in four ways:
=Global Retail Sales
Domestic
Same-Store
Comps
International
Same-Store
Comps
Domestic
New Store
Growth
International
New Store
Growth
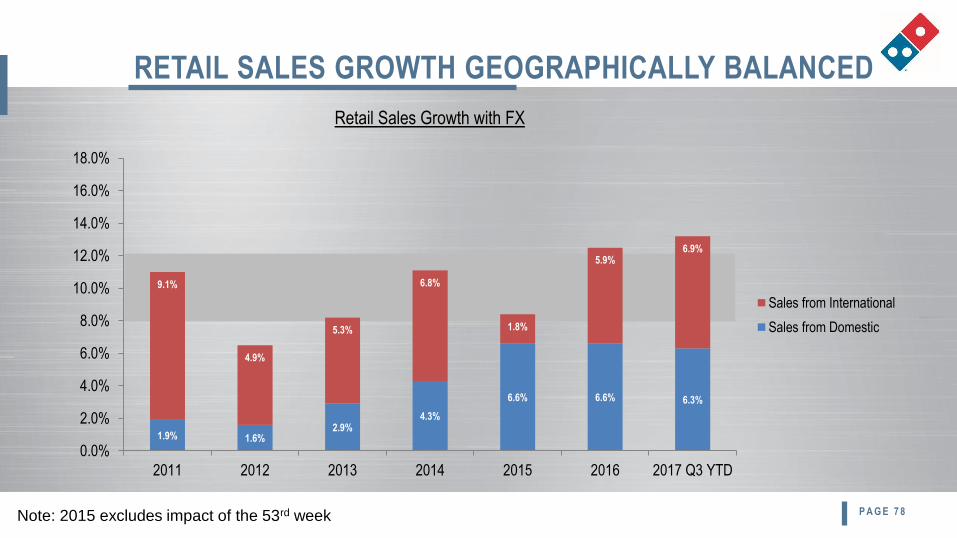
RETAIL SALES GROWTH GEOGRAPHICALLY BALANCED
P A G E 7 8
1.9% 1.6%2.9%
4.3%
6.6% 6.6% 6.3%
9.1%
4.9%
5.3%
6.8%
1.8%
5.9%6.9%
0.0%
2.0%
4.0%
6.0%
8.0%
10.0%
12.0%
14.0%
16.0%
18.0%
2011 2012 2013 2014 2015 2016 2017 Q3 YTD
Sales from International
Sales from Domestic
Retail Sales Growth with FX
Note: 2015 excludes impact of the 53rd week

RETAIL SALES GROWTH GEOGRAPHICALLY BALANCED
P A G E 7 9
1.9% 1.6%2.9%
4.3%
6.6% 6.6% 6.3%
6.9%6.7%
7.3%
8.1%
9.2% 9.0%
8.2%
0.0%
2.0%
4.0%
6.0%
8.0%
10.0%
12.0%
14.0%
16.0%
18.0%
2011 2012 2013 2014 2015 2016 2017 Q3 YTD
Sales from International
Sales from Domestic
Retail Sales Growth without FX
Note: 2015 excludes impact of the 53rd week
STORE GROWTH FINALLY COMPLEMENTING
ROBUST US COMP GROWTH
P A G E 8 0
3.5% 3.1%
5.4%
7.5%
12.0%10.5%
9.4%
0.2%0.2%
0.8%
1.7%
2.2%3.0%
3.3%
0.0%
2.0%
4.0%
6.0%
8.0%
10.0%
12.0%
14.0%
16.0%
18.0%
2011 2012 2013 2014 2015 2016 2017 Q3 YTD
Sales from New Stores
Same Store Sales
Domino’s Domestic Retail Sales Growth
Note: 2015 excludes impact of the 53rd week
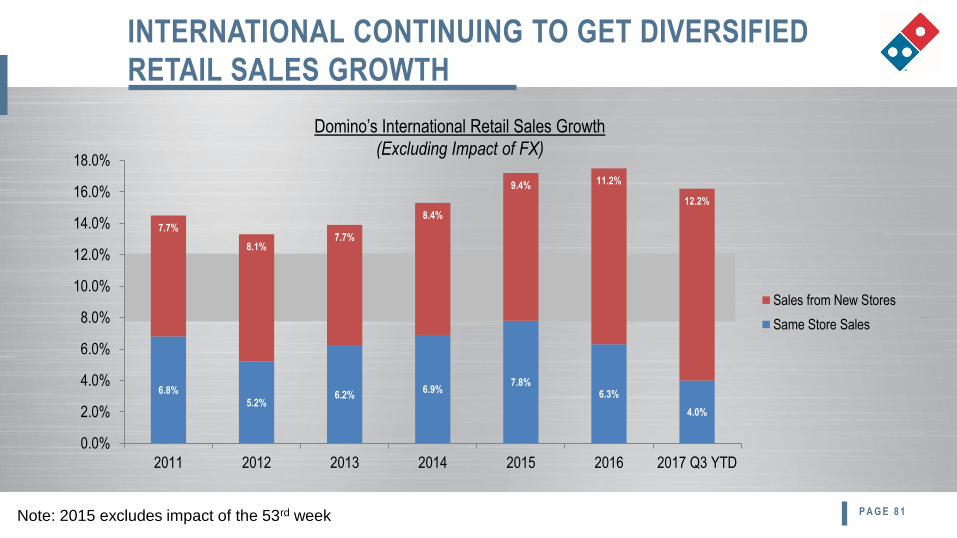
INTERNATIONAL CONTINUING TO GET DIVERSIFIED
RETAIL SALES GROWTH
P A G E 8 1
Domino’s International Retail Sales Growth
(Excluding Impact of FX)
Note: 2015 excludes impact of the 53rd week
6.8%
5.2%6.2%
6.9%7.8%
6.3%
4.0%
7.7%
8.1%7.7%
8.4%
9.4% 11.2%
12.2%
0.0%
2.0%
4.0%
6.0%
8.0%
10.0%
12.0%
14.0%
16.0%
18.0%
2011 2012 2013 2014 2015 2016 2017 Q3 YTD
Sales from New Stores
Same Store Sales
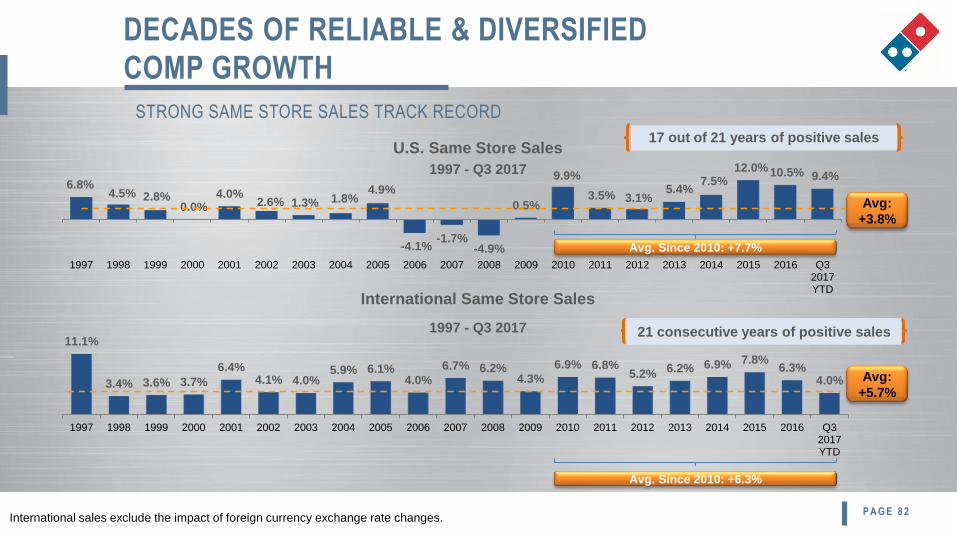
DECADES OF RELIABLE & DIVERSIFIED
COMP GROWTH
STRONG SAME STORE SALES TRACK RECORD
International sales exclude the impact of foreign currency exchange rate changes.
6.8%4.5% 2.8%
0.0%4.0%
2.6% 1.3% 1.8%4.9%
-4.1%-1.7%
-4.9%
0.5%
9.9%
3.5% 3.1%5.4%
7.5%12.0% 10.5% 9.4%
1997 1998 1999 2000 2001 2002 2003 2004 2005 2006 2007 2008 2009 2010 2011 2012 2013 2014 2015 2016 Q32017YTD
Avg:
+3.8%
11.1%
3.4% 3.6% 3.7%
6.4%4.1% 4.0%
5.9% 6.1%4.0%
6.7% 6.2%4.3%
6.9% 6.8%5.2% 6.2% 6.9% 7.8%
6.3%4.0%
1997 1998 1999 2000 2001 2002 2003 2004 2005 2006 2007 2008 2009 2010 2011 2012 2013 2014 2015 2016 Q32017YTD
Avg:
+5.7%
17 out of 21 years of positive salesU.S. Same Store Sales
1997 - Q3 2017
21 consecutive years of positive sales
International Same Store Sales
1997 - Q3 2017
Avg. Since 2010: +7.7%
Avg. Since 2010: +6.3%
P A G E 8 2
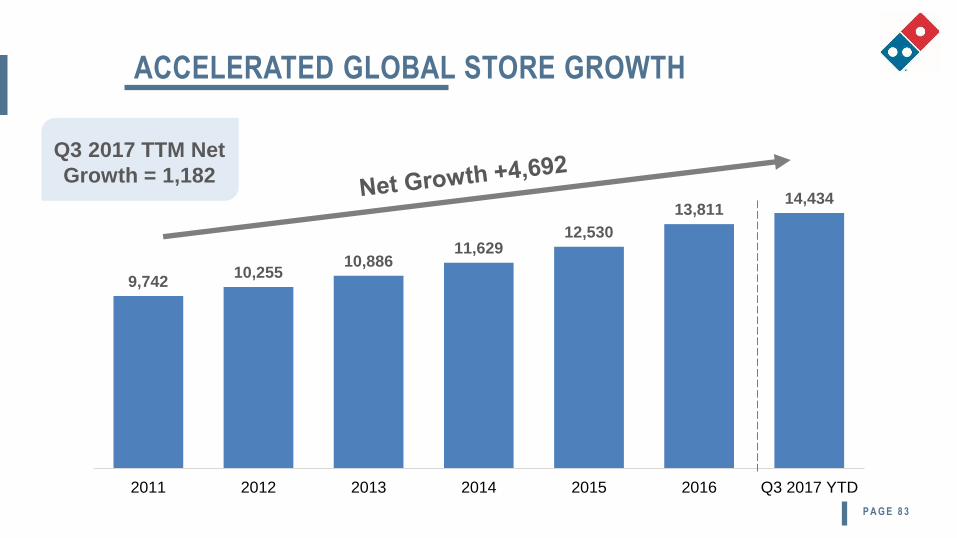
ACCELERATED GLOBAL STORE GROWTH
Q3 2017 TTM Net
Growth = 1,182
P A G E 8 3
9,74210,255
10,88611,629
12,530
13,81114,434
2011 2012 2013 2014 2015 2016 Q3 2017 YTD
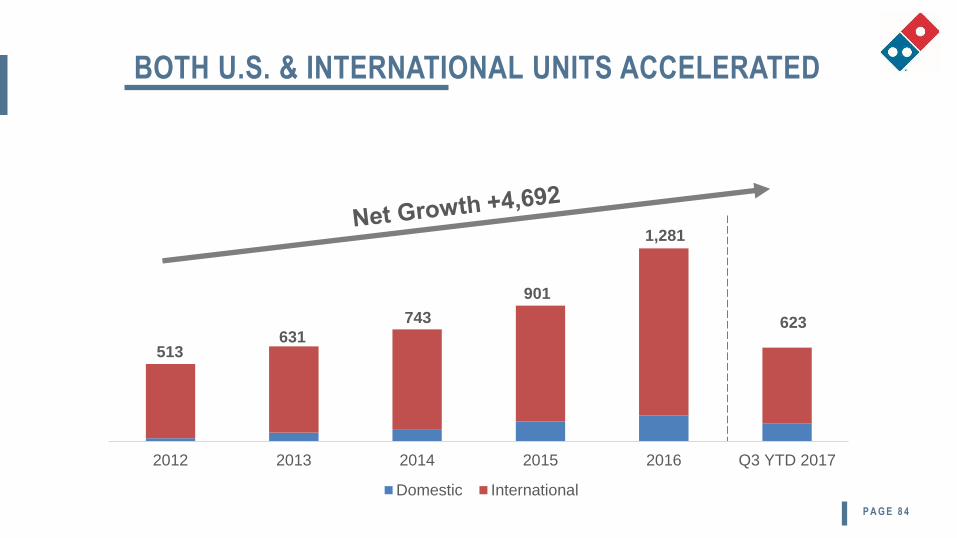
BOTH U.S. & INTERNATIONAL UNITS ACCELERATED
P A G E 8 4
2012 2013 2014 2015 2016 Q3 YTD 2017
Domestic International
513631
743
901
623
1,281
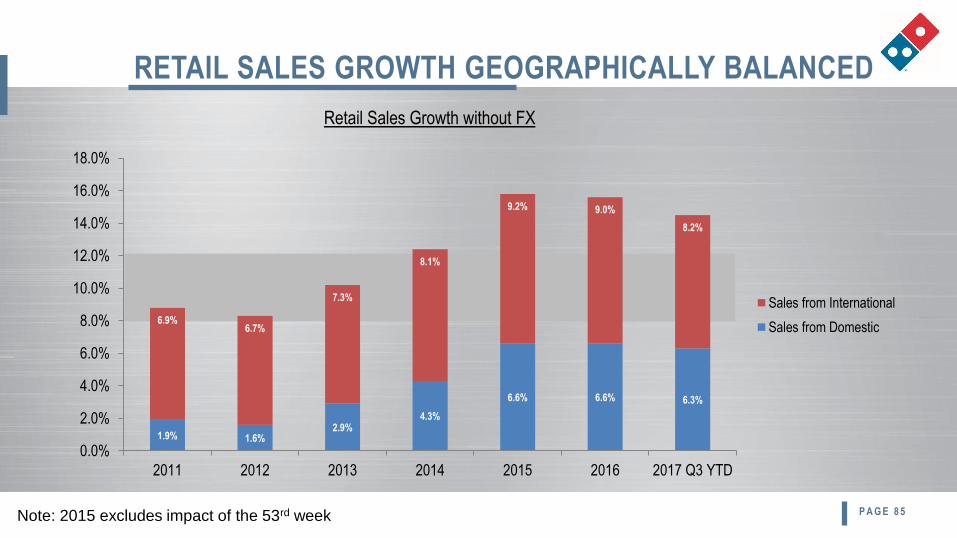
RETAIL SALES GROWTH GEOGRAPHICALLY BALANCED
P A G E 8 5
1.9% 1.6%2.9%
4.3%
6.6% 6.6% 6.3%
6.9%6.7%
7.3%
8.1%
9.2% 9.0%
8.2%
0.0%
2.0%
4.0%
6.0%
8.0%
10.0%
12.0%
14.0%
16.0%
18.0%
2011 2012 2013 2014 2015 2016 2017 Q3 YTD
Sales from International
Sales from Domestic
Retail Sales Growth without FX
Note: 2015 excludes impact of the 53rd week
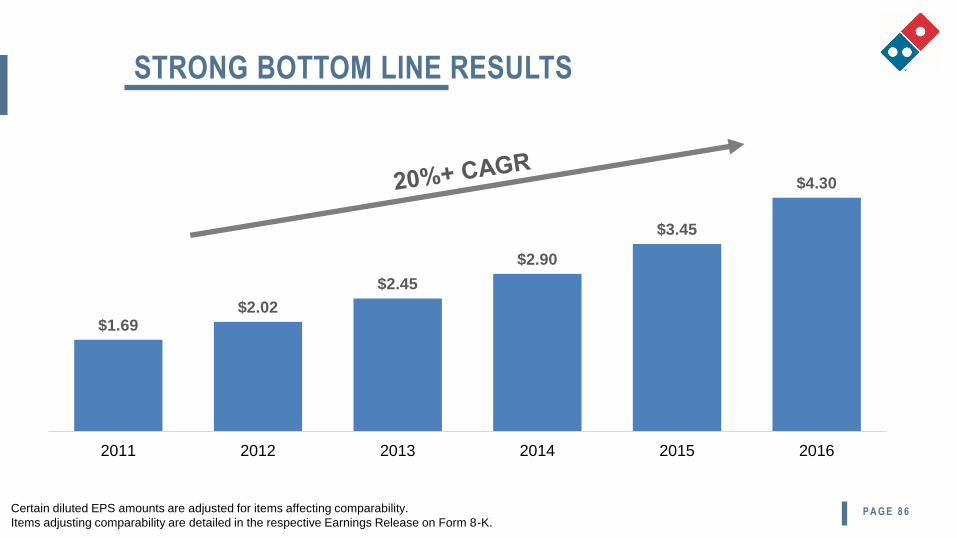
STRONG BOTTOM LINE RESULTS
Certain diluted EPS amounts are adjusted for items affecting comparability.
Items adjusting comparability are detailed in the respective Earnings Release on Form 8-K.P A G E 8 6
$1.69$2.02
$2.45
$2.90
$3.45
$4.30
2011 2012 2013 2014 2015 2016
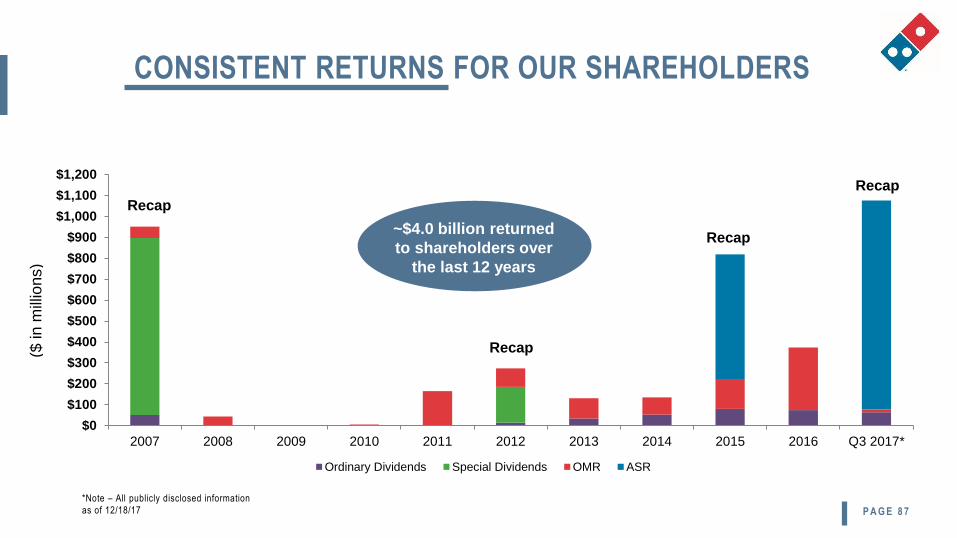
CONSISTENT RETURNS FOR OUR SHAREHOLDERS
$0
$100
$200
$300
$400
$500
$600
$700
$800
$900
$1,000
$1,100
$1,200
2007 2008 2009 2010 2011 2012 2013 2014 2015 2016 Q3 2017*
Ordinary Dividends Special Dividends OMR ASR
($ in
mill
ion
s)
Recap
Recap
Recap
Recap
~$4.0 billion returned
to shareholders over
the last 12 years
P A G E 8 7
*Note – All publicly disclosed information
as of 12/18/17
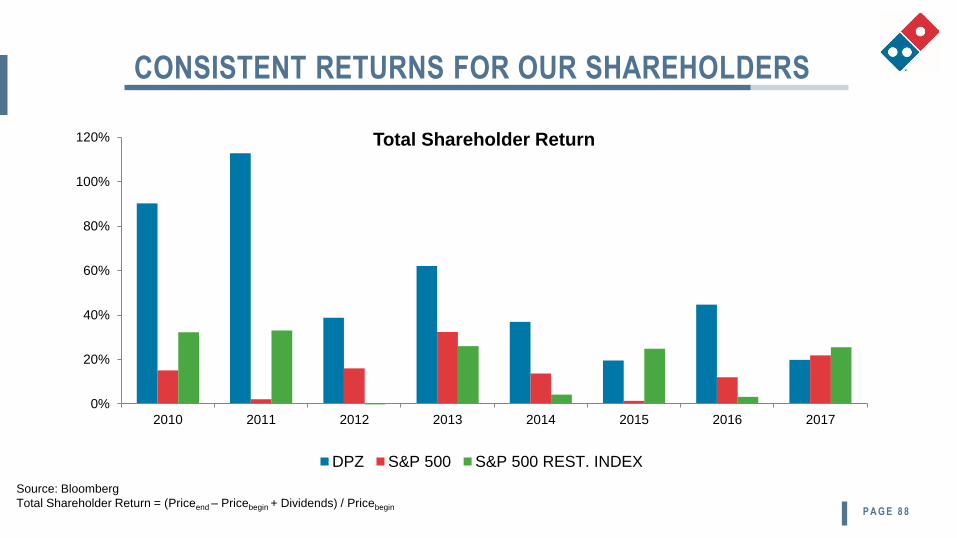
CONSISTENT RETURNS FOR OUR SHAREHOLDERS
Source: Bloomberg
Total Shareholder Return = (Priceend – Pricebegin + Dividends) / Pricebegin
0%
20%
40%
60%
80%
100%
120%
2010 2011 2012 2013 2014 2015 2016 2017
Total Shareholder Return
DPZ S&P 500 S&P 500 REST. INDEX
P A G E 8 8
RECENT RESULTS
- Top Line Growth Drivers
- Bottom Line Results
- Shareholder Returns
BUSINESS
OUTLOOKLOOKING AHEAD
TO 2018
- Investing to Win
- Commodities and FX Outlook
- Tax Reform
- Accounting Update
- Balance Sheet Update
- Industry Outlook
- DPZ Outlook
P A G E 8 9
P A G E 9 0
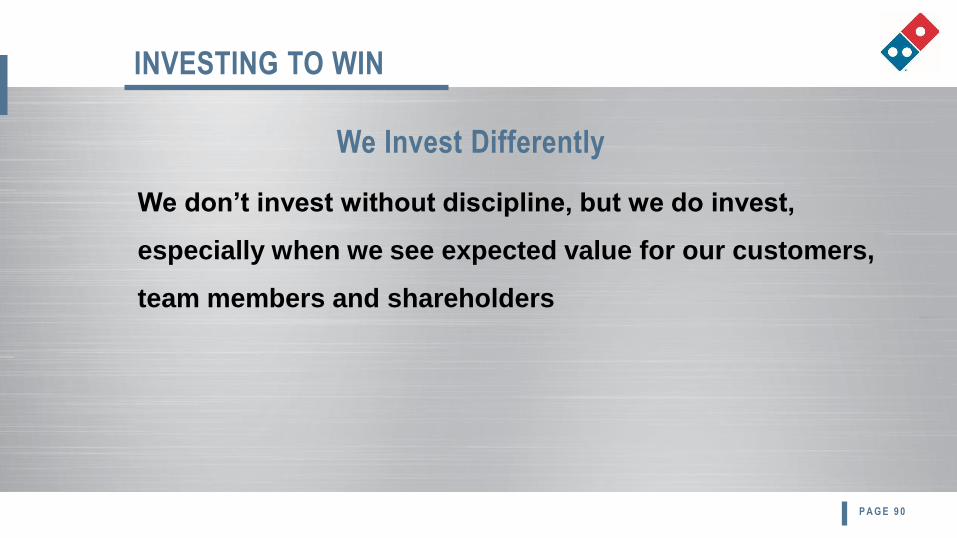
We don’t invest without discipline, but we do invest,
especially when we see expected value for our customers,
team members and shareholders
INVESTING TO WIN
We Invest Differently
P A G E 9 1
We invest like a disruptor; deliver like a growth company
INVESTING TO WIN
We Invest Differently
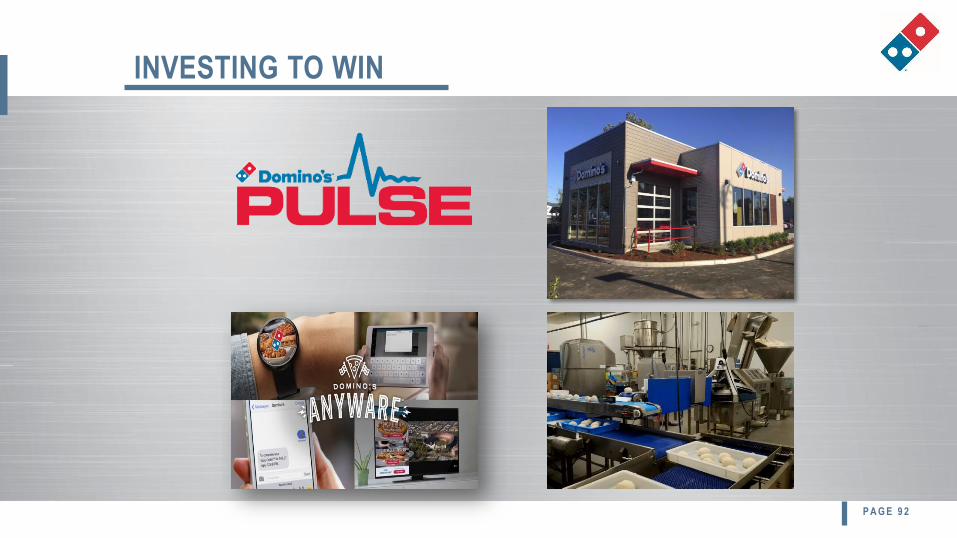
INVESTING TO WIN
P A G E 9 2
INVESTING TO WIN
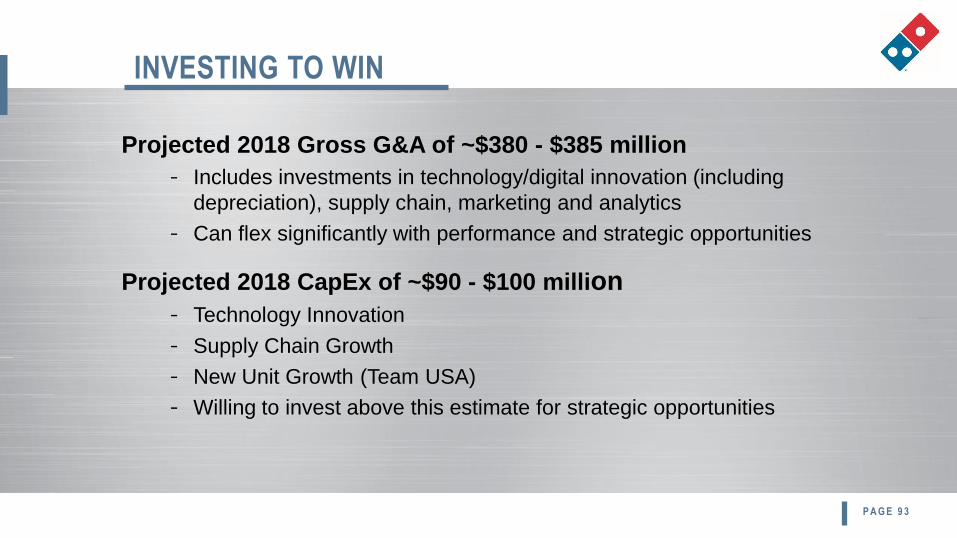
Projected 2018 Gross G&A of ~$380 - $385 million
- Includes investments in technology/digital innovation (including
depreciation), supply chain, marketing and analytics
- Can flex significantly with performance and strategic opportunities
Projected 2018 CapEx of ~$90 - $100 million
- Technology Innovation
- Supply Chain Growth
- New Unit Growth (Team USA)
- Willing to invest above this estimate for strategic opportunities
P A G E 9 3
FRANCHISEES INVESTING TO WIN
P A G E 9 4
Building stores
Reimaging stores
Spending on digital and technology
CAPITAL IS FLOWING TO THE DOMINO’S BRAND!
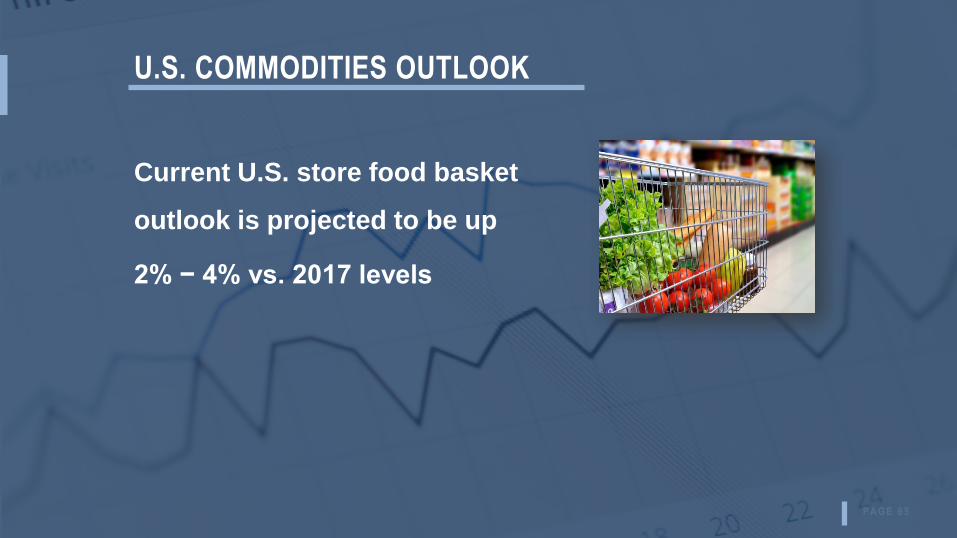
U.S. COMMODITIES OUTLOOK
Current U.S. store food basket
outlook is projected to be up
2% − 4% vs. 2017 levels
P A G E 9 5
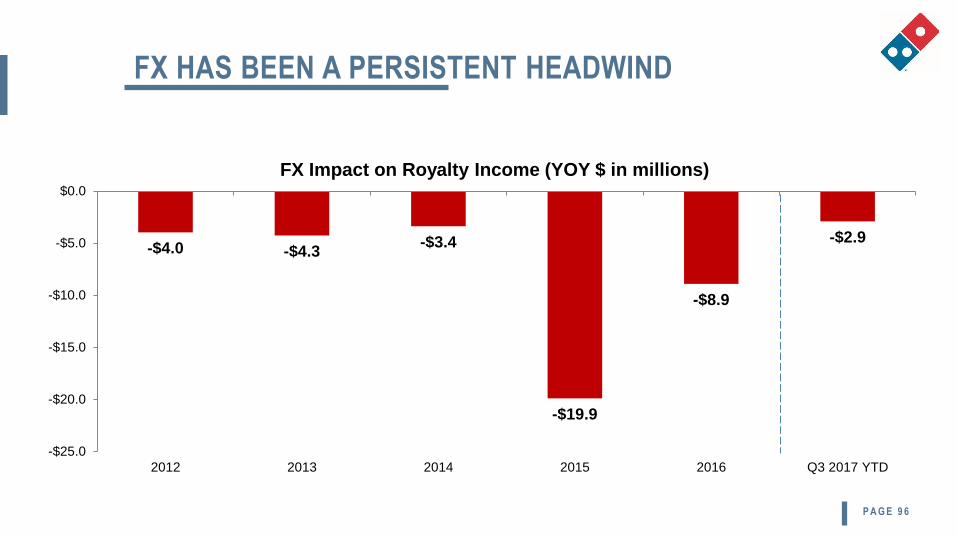
FX HAS BEEN A PERSISTENT HEADWIND
-$4.0 -$4.3-$3.4
-$19.9
-$8.9
-$2.9
-$25.0
-$20.0
-$15.0
-$10.0
-$5.0
$0.0
2012 2013 2014 2015 2016 Q3 2017 YTD
FX Impact on Royalty Income (YOY $ in millions)
P A G E 9 6
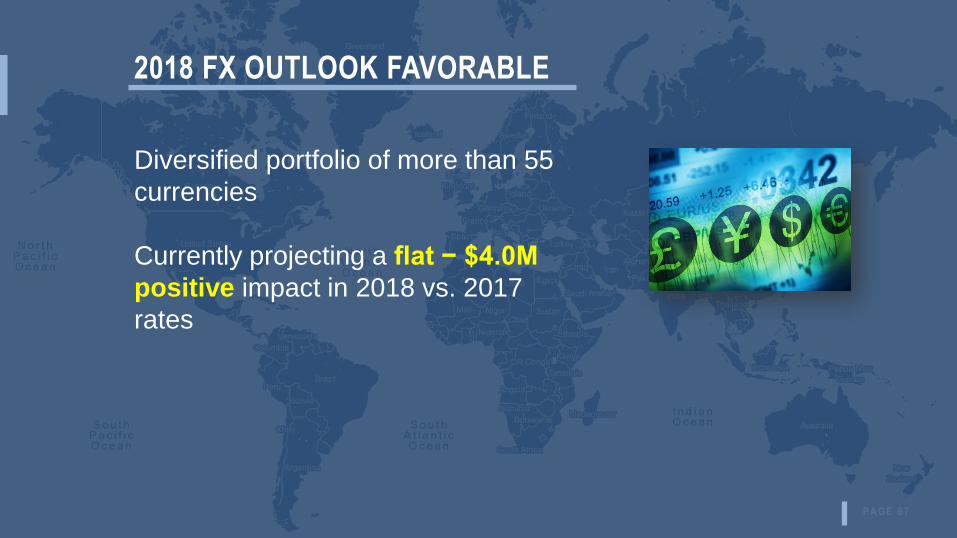
2018 FX OUTLOOK FAVORABLE
Diversified portfolio of more than 55
currencies
Currently projecting a flat − $4.0M
positive impact in 2018 vs. 2017
rates
P A G E 9 7
Tax reform act passed
DPZ historically a full rate tax payer
New ongoing effective tax rate expected to be in 22% - 24%
range
Excludes tax benefit of equity-based compensation
Still assessing full impact of new tax legislation
TAX REFORM
P A G E 9 8
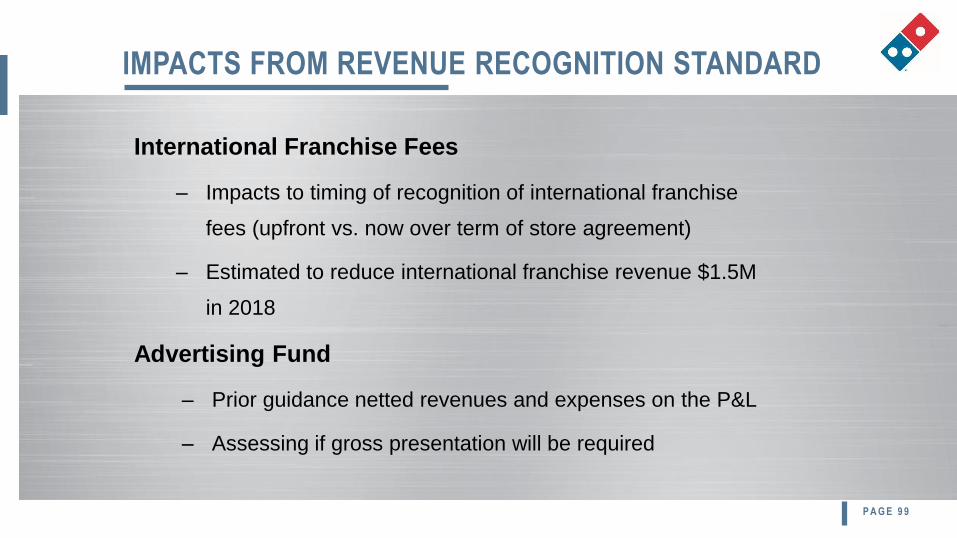
International Franchise Fees
– Impacts to timing of recognition of international franchise
fees (upfront vs. now over term of store agreement)
– Estimated to reduce international franchise revenue $1.5M
in 2018
Advertising Fund
– Prior guidance netted revenues and expenses on the P&L
– Assessing if gross presentation will be required
IMPACTS FROM REVENUE RECOGNITION STANDARD
P A G E 9 9
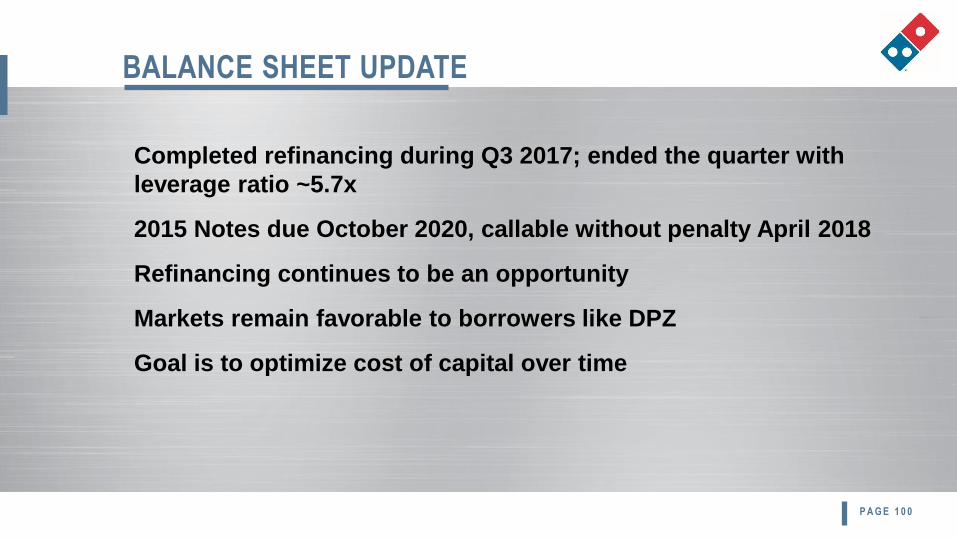
BALANCE SHEET UPDATE
Completed refinancing during Q3 2017; ended the quarter with
leverage ratio ~5.7x
2015 Notes due October 2020, callable without penalty April 2018
Refinancing continues to be an opportunity
Markets remain favorable to borrowers like DPZ
Goal is to optimize cost of capital over time
P A G E 1 0 0

RECENT RESULTS
- Top Line Growth Drivers
- Bottom Line Results
- Shareholder Returns
BUSINESS
OUTLOOKLOOKING AHEAD
TO 2018
- Investing to Win
- Commodities and FX Outlook
- Tax Reform
- Accounting Update
- Balance Sheet Update
- Industry Outlook
- DPZ Outlook
P A G E 1 0 1
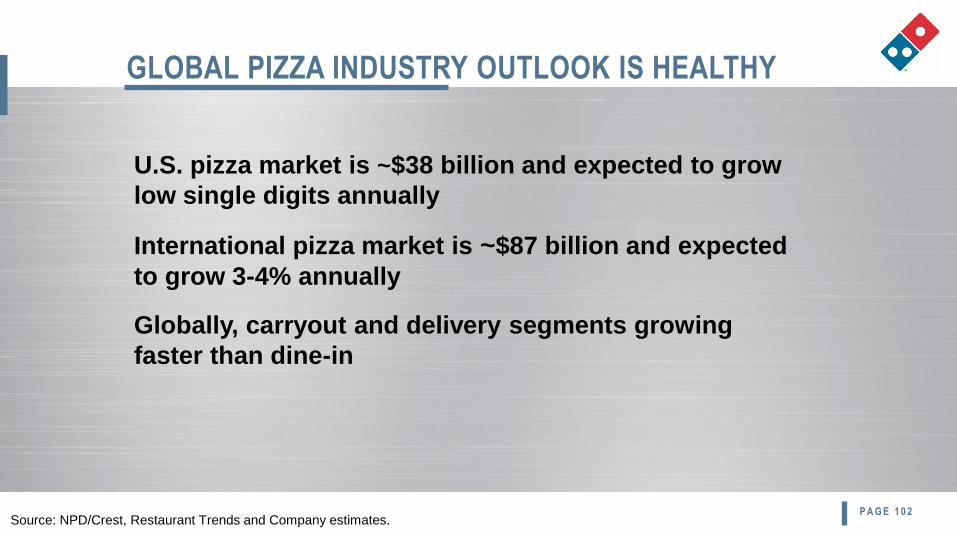
GLOBAL PIZZA INDUSTRY OUTLOOK IS HEALTHY
Source: NPD/Crest, Restaurant Trends and Company estimates.P A G E 1 0 2
U.S. pizza market is ~$38 billion and expected to grow
low single digits annually
International pizza market is ~$87 billion and expected
to grow 3-4% annually
Globally, carryout and delivery segments growing
faster than dine-in
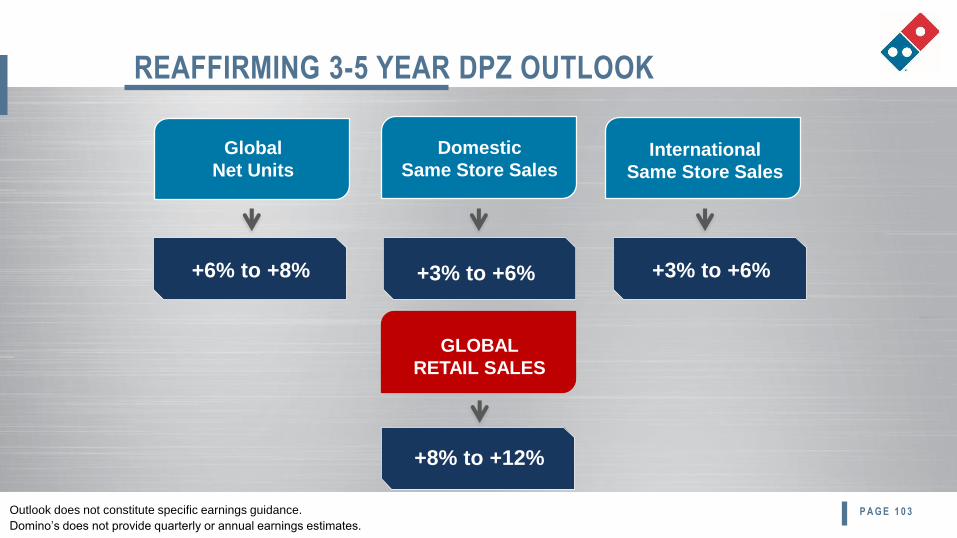
REAFFIRMING 3-5 YEAR DPZ OUTLOOK
Outlook does not constitute specific earnings guidance.
Domino’s does not provide quarterly or annual earnings estimates.
Global
Net Units
Domestic
Same Store SalesInternational
Same Store Sales
GLOBAL
RETAIL SALES
+6% to +8% +3% to +6% +3% to +6%
+8% to +12%
P A G E 1 0 3


![Does Technology Disruption Always Mean Industry Disruption?1 Chintan Vaishnav [email protected]](https://static.fdocuments.us/doc/165x107/613d5f0c736caf36b75c89e7/does-technology-disruption-always-mean-industry-disruption1-chintan-vaishnav-emailprotected.jpg)