Leadership Pulse™ Survey Ambivalence? Dr. Theresa M. Welbourne Preliminary Report October, 2006...
26
Leadership Pulse™ Survey Ambivalence? Dr. Theresa M. Welbourne Preliminary Report October, 2006 the measure of your success
-
Upload
herbert-gray -
Category
Documents
-
view
218 -
download
2
Transcript of Leadership Pulse™ Survey Ambivalence? Dr. Theresa M. Welbourne Preliminary Report October, 2006...
Leadership Pulse™Survey Ambivalence?
Dr. Theresa M. WelbournePreliminary Report
October, 2006
the measure of your success

2Copyright, © 2006, Dr. Theresa M. Welbourne
Introduction: Information on Leadership Pulse sample and response rates

3Copyright, © 2006, Dr. Theresa M. Welbourne
Leadership Pulse Introduction
• Monthly Leadership Learning – Over 4,000 executives around the world are part of the Leadership
Pulse Dialogue since it began in June, 2003– All individuals in the study receive Pulse Dialogues™ (our term for
Pulse Surveys) every two months and all dialogue results (both on-line reports and executive summaries)
• October Topics– Report current energy data and update energy trends. Additionally,
we investigated perceptions of value, ROI, and other important matters related to the customer and employee survey process.
• Why do the study?– Data and Dialogue drive learning; we are providing real-time
learning to our stakeholders.

4Copyright, © 2006, Dr. Theresa M. Welbourne
Sample Characteristics: October, 2006Sample size:
● 309 respondents
Job Levels: ● 35% C-core (CEO, CFO, CIO, CAO, etc.), 23% VP, and 16.2% Director level, 20.7% general management.
5.8% did not provide job level data
Industry Sectors: ● 18 industries were represented, including: 17.8 % manufacturing, 20.7% science and IT, 23.3% consulting, 22% services (not consulting), 9.1% government/not-for-profits, and the remaining 7.1% from other sectors.
Organization size ranged from “less than 100”(45.3%) to “more than 5,001” (16.8%) with 30.4% reporting “between 101-5,000” employees. No company size data were available for 7.5% of the sample.
5Copyright, © 2006, Dr. Theresa M. Welbourne
Section II: Results for Leaders’ Energy Trends
6Copyright, © 2006, Dr. Theresa M. Welbourne
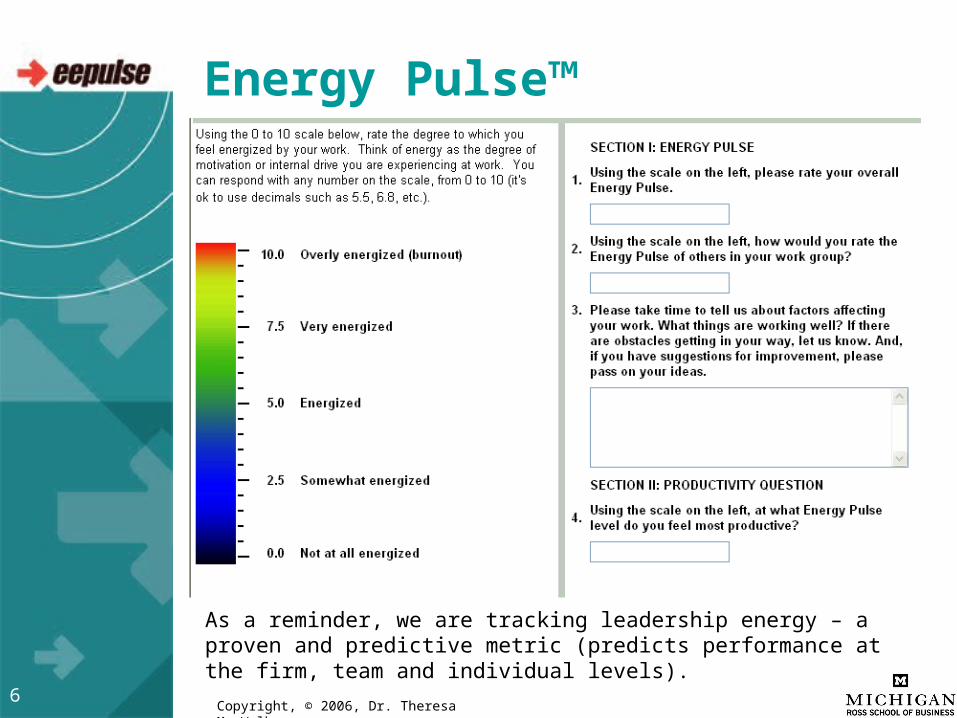
Energy Pulse™
As a reminder, we are tracking leadership energy – a proven and predictive metric (predicts performance at the firm, team and individual levels).
7Copyright, © 2006, Dr. Theresa M. Welbourne
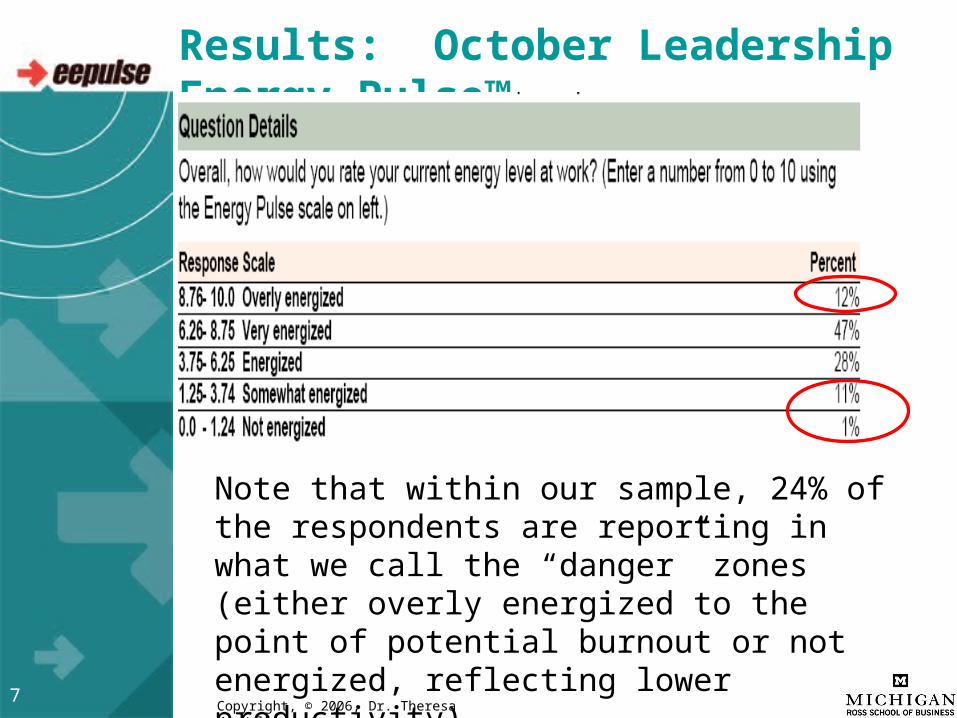
Results: October Leadership Energy Pulse™
Note that within our sample, 24% of the respondents are reporting in what we call the “danger” zones (either overly energized to the point of potential burnout or not energized, reflecting lower productivity).

8Copyright, © 2006, Dr. Theresa M. Welbourne
Energy Trend
Overall, energy levels trended up from their lowest point In 23 months. However, within person change, or the amount of change from respondents who participated in the 7/14/06 dialogue reflect a continued decline in energy levels. Specifically, 106 participants report a decrease in energy of .21 since July.
9Copyright, © 2006, Dr. Theresa M. Welbourne
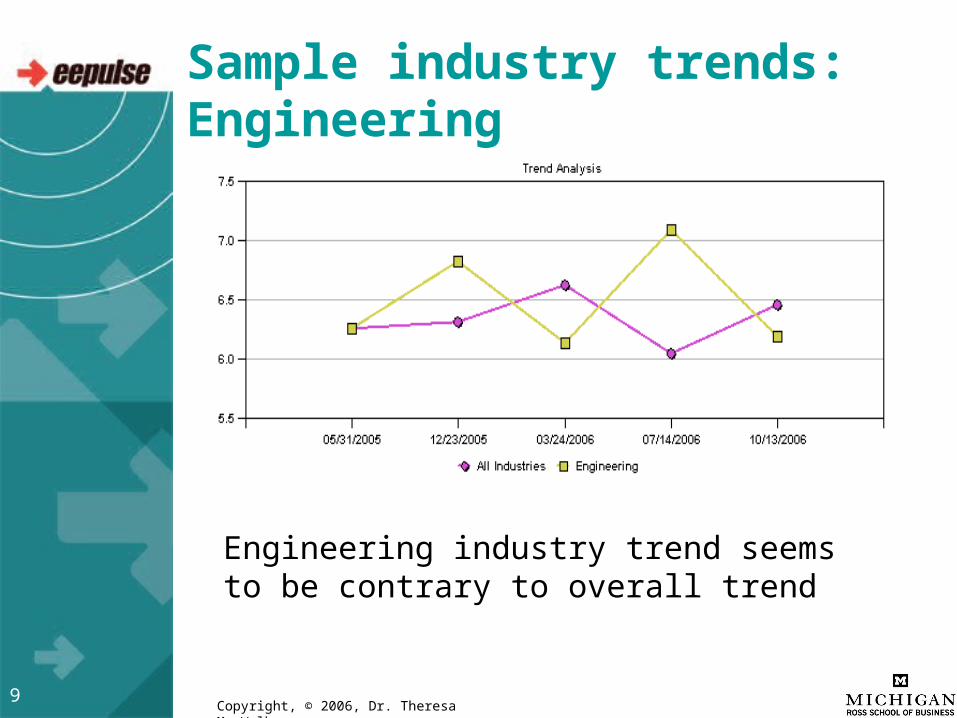
Sample industry trends: Engineering
Engineering industry trend seems to be contrary to overall trend

10Copyright, © 2006, Dr. Theresa M. Welbourne
More industries
Manufacturing
Construction

11Copyright, © 2006, Dr. Theresa M. Welbourne
Overall industry analysis
• 12 of the industries studied had an increase in energy, 3 by more than one point (health care, retail trade, and services, other than consulting)
• 3 industries experienced a decrease in energy, with only one being more than one point (construction)
• Two industries report being “in” their productivity zones (biotechnology and web-based consulting)
• All other industries are still reporting being below their productivity zone (the zone where the leaders report being most productive), and 8 are below by more than one point).
12Copyright, © 2006, Dr. Theresa M. Welbourne
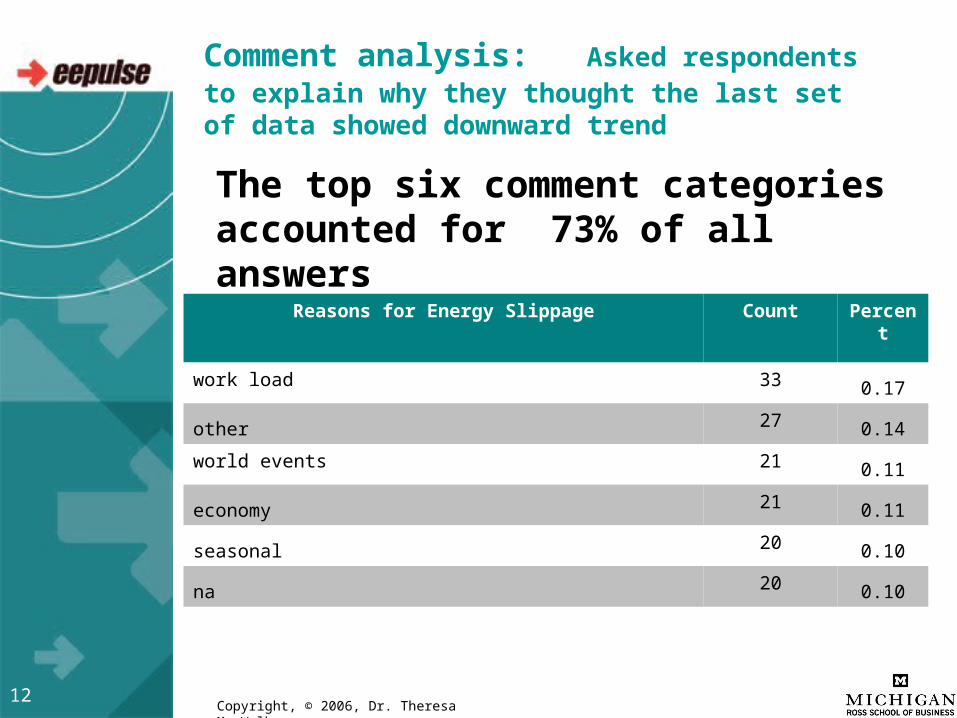
The top six comment categories accounted for 73% of all answers
Reasons for Energy Slippage Count Percent
work load 33 0.17
other 27 0.14
world events 21 0.11
economy 21 0.11
seasonal 20 0.10
na 20 0.10
Comment analysis: Asked respondents to explain why they thought the last set of data showed downward trend

13Copyright, © 2006, Dr. Theresa M. Welbourne
Sample comments: Work load• “It's tough right now for American manufacturers, which my
company is. Stress levels are high trying to keep companies viable in a changing business world, and people are either burning out or giving up.
• Most companies are trying to do more with less. While I actively support the business reasons for this, I also recognize that it is significant change for many. In my experience, significant change often saps motivation levels.
• People are working harder and harder to achieve the same or less results. Burn out!
• People are expected to work harder and for longer hours, yet they don't get to benefit from their efforts--they are only told to work harder, better, or the organization is changed in an unpleasant way. The pressure is unrelenting and the reward is ever-shrinking.”

14Copyright, © 2006, Dr. Theresa M. Welbourne
Section III: Exploring attitudes about surveys

15Copyright, © 2006, Dr. Theresa M. Welbourne
Results: Are Survey’s Evil?
• Definition for “something evil:” a situation that is very unpleasant, harmful, or morally wrong.
• Using the definition above we asked participants to answer a series of questions about customer and annual employee surveys
16Copyright, © 2006, Dr. Theresa M. Welbourne
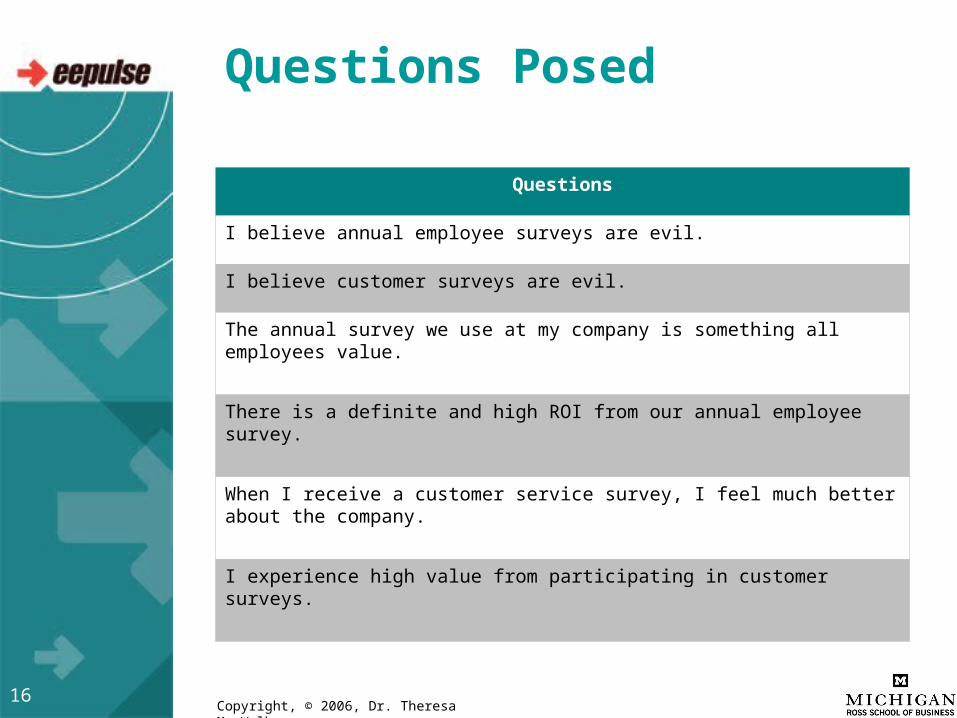
Questions Posed
Questions
I believe annual employee surveys are evil.
I believe customer surveys are evil.
The annual survey we use at my company is something all employees value.
There is a definite and high ROI from our annual employee survey.
When I receive a customer service survey, I feel much better about the company.
I experience high value from participating in customer surveys.

17Copyright, © 2006, Dr. Theresa M. Welbourne
Results: Thoughts on surveys
Response scale: 1 to 5 scale used, where 1 = strongly disagree; 5=strongly agree
3.23
2.89 2.882.87
2.171.95
1.00
1.50
2.00
2.50
3.00
3.50
4.00
4.50
5.00
Receive acustomer
service surveyfeel better
High ROIannual emp
survey
High valueparticipating incust surveys.
Empvalue.annual
survey
Annual empsurveys are
evil.
Cust surveysare evil.
While respondents do not think surveys are “evil” (based on relatively low score on the two “evil” questions); they also don’t think very highly of them (based on low scores on other questions).
18Copyright, © 2006, Dr. Theresa M. Welbourne
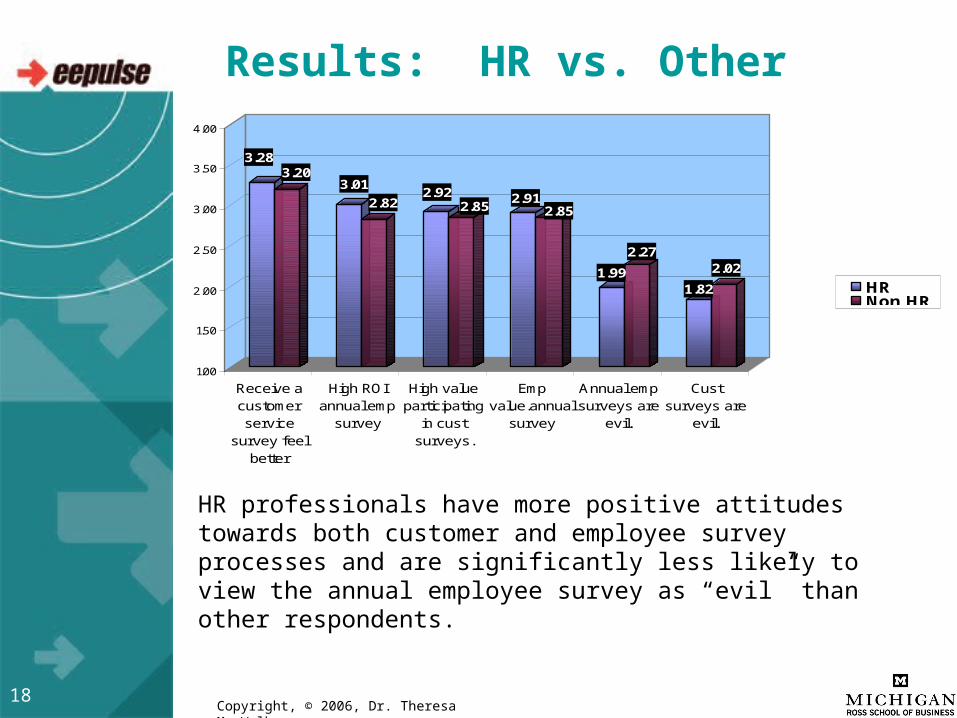
Results: HR vs. Other
3.283.20
3.01
2.822.92
2.852.91
2.85
1.99
2.27
1.82
2.02
1.00
1.50
2.00
2.50
3.00
3.50
4.00
Receive acustomerservice
survey feelbetter
High ROIannual emp
survey
High valueparticipating
in custsurveys.
Empvalue.annual
survey
Annual empsurveys are
evil.
Custsurveys are
evil.
HRNon HR
HR professionals have more positive attitudes towards both customer and employee survey processes and are significantly less likely to view the annual employee survey as “evil” than other respondents.
19Copyright, © 2006, Dr. Theresa M. Welbourne
Other Results of Interest
• Using ANOVA* we looked for differences on selected demographic variables the follow are the results of that investigation.
• Firm size– The larger the firm, the more positive were leaders
perceptions toward the annual employee survey.• Performance
– Leaders of higher performing firms had more positive attitudes toward customer surveys.
• Sector– Leaders from the manufacturing sector had the most positive
attitudes toward the annual employee survey.
* ANOVA = analysis of variance, used to determine statistical significance between various group scores

20Copyright, © 2006, Dr. Theresa M. Welbourne
Survey Experience Comment Results
We coded comments on two dimensions. Affect of comment and then reviewed all comments for common themes.
Overall Affective Responses Count Percent
Neutral76 0.41
Positive58 0.32
Negative50 0.27
Totals184 1.00

21Copyright, © 2006, Dr. Theresa M. Welbourne
Emergent Survey Experience Themes
Themes Count Percent
follow through 40 0.22
metric integrity 27 0.15
other 21 0.11
increase knowledge 20 0.11
length and depth 20 0.11
ethical 13 0.07
na 13 0.07
false expectations 12 0.07
valued 10 0.05
wrong scope 4 0.02
feedback 4 0.02
totals 184 1.00
22Copyright, © 2006, Dr. Theresa M. Welbourne
Sample comments• Employee surveys generate typical bell curve information,
establish a high employee expectation and generally increases employee dissatisfaction.
• I am selective about surveys as I have a pre determined notion that better than 60% of the time nothing will come of the survey. Unfortunately many companies simply go through the motion or the "exercise“
• Surveys are very important in collecting data in a structured and useful format.
• I value the chance to give my opinion. When I was an employee, I always answered surveys because, as a sales representative, I know that marketing and sales managers make most of their decisions based upon surveys because they want to make a majority of people happy rather than having their own opinions.
23Copyright, © 2006, Dr. Theresa M. Welbourne
Section IV: Executive learning and networking opportunities
24Copyright, © 2006, Dr. Theresa M. Welbourne
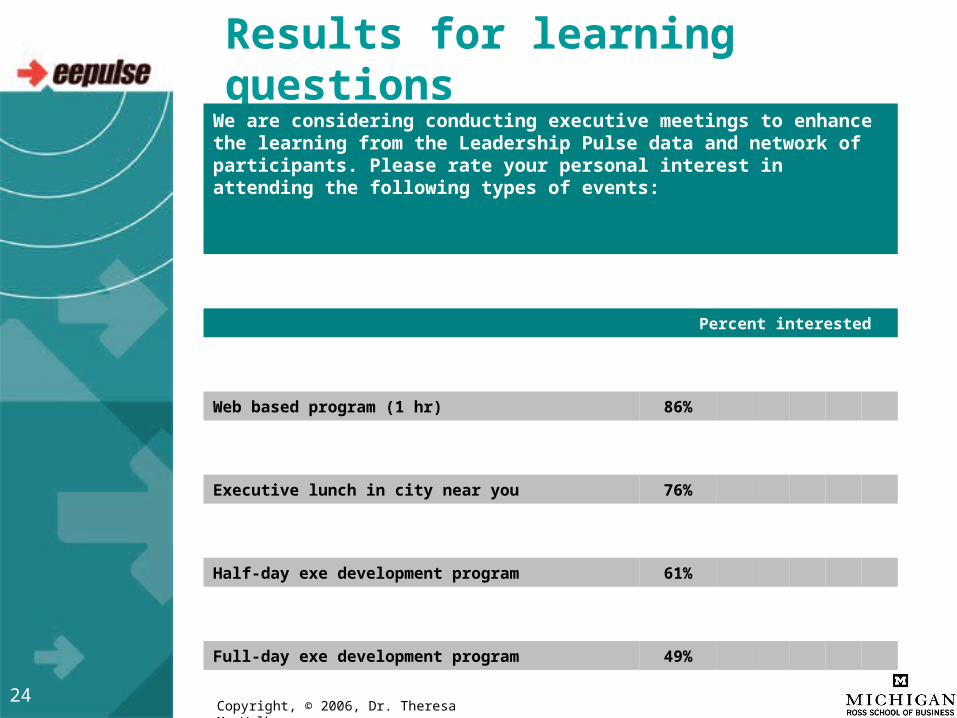
Results for learning questionsWe are considering conducting executive meetings to enhance the learning from the Leadership Pulse data and network of participants. Please rate your personal interest in attending the following types of events:
Percent interested
Web based program (1 hr) 86%
Executive lunch in city near you 76%
Half-day exe development program 61%
Full-day exe development program 49%

25Copyright, © 2006, Dr. Theresa M. Welbourne
Next Steps
• Technical report with details on this month’s report will be available when complete (end of November).
• Please write to us with any comments you have on this data ([email protected])

26Copyright, © 2006, Dr. Theresa M. Welbourne
FOR MORE INFORMATIONABOUT THIS RESEARCH,
TO READ MORE REPORTS, PRESS RELEASES, AND ARTICLES, VISIT:
www.eepulse.comSee the following sections of the web site:
RESEARCHNEWS: PRESS RELEASES
NEWS: ARTICLES
If interested in expanded participation for an organization,please visit the following web site: www.umbs.leadership.eepulse.com.
For more information about the study or how you can get involved,contact Dr. Theresa Welbourne: