Leadership, Knowledge Sharing & Innovation: Implications ... · 1 Leadership, Knowledge Sharing &...
22
1 Leadership, Knowledge Sharing & Innovation: Implications for Performance in a Multi-Country Context Maura Sheehan NUI Galway/University of Brighton E-mail: [email protected] Abstract Set within a dynamic capabilities framework, this article examines whether leader behaviours enhance knowledge sharing and innovation, and whether innovation is positively associated with performance. A multiple respondent, longitudinal database is used to examine these relationships. Leader behaviours that are characterised as “pro-knowledge sharing” are significantly associated with both internal and external knowledge sharing. The direct effect of these leader behaviours on innovation is positive but only marginally (p<0.10). Internal knowledge sharing is very significantly associated with innovation intensity (the share of innovative sales in total shares), whereas external knowledge sharing appears to be more significantly associated with for innovation propensity (the introduction of either a product or process innovation). The interaction between leader behaviours and knowledge upon innovation is also statistically significant. Specifically, leader behaviours and internal knowledge sharing interact to positively and significantly influence innovation propensity (p<0.05) and innovation intensity (p<0.001); while the interaction of leader behaviours and external knowledge sharing also positively influence innovation propensity (p<0.001) and innovation intensity (p<0.05). Differences emerge between the type of knowledge sharing (internal or external) and the type of innovation (propensity or intensity). The second half of the paper examines the critical issue of whether prior innovation enhances performance (measured by objective data on net income per employee (financial performance) and labour productivity). Prior innovation propensity is positively and significantly associated with financial performance (p<0.05) and for prior innovation intensity, the relationship is significant at p<0.001. Prior innovation propensity is positively and significantly associated with enhanced labour productivity (p<0.001) and with innovation intensity at the p<0.10 level. For completeness, whether leader behaviours, knowledge sharing and their interactions are associated directly with performance was examined. Leader behaviours did not have a direct influence on either performance measure; internal knowledge sharing was positively and significantly associated with enhanced labour productivity (p<0.10); and external knowledge sharing was negatively, but not significantly, associated with performance. No significant relationship is found for the interaction between leader behaviours and internal knowledge sharing and financial performance; however, the interaction is positive and highly significant for labour productivity. The interaction between leader behaviours and external knowledge sharing was not significantly associated with either measure of performance. The analysis shows that the relationships between leader behaviours, knowledge sharing, innovation and performance are complex. Given the importance placed on stimulating innovation in organisations, the finding that prior innovation does indeed enhance both financial performance and labour productivity is reassuring. The results also show that pro-knowledge sharing leader behaviours must be carefully operationalised to ensure that these behaviours positively influence internal and external knowledge sharing. Simply having leaders with these behaviours present had minimal influence on innovation and no direct influence on performance. Rather, these leader behaviours need to be used to enhance knowledge sharing which, in turn, was very positively associated with both measures of innovation and subsequent performance. Keywords: leadership, knowledge sharing, innovation, performance. Introduction
Transcript of Leadership, Knowledge Sharing & Innovation: Implications ... · 1 Leadership, Knowledge Sharing &...

1
Leadership, Knowledge Sharing & Innovation: Implications for Performance in a Multi-Country Context
Maura Sheehan
NUI Galway/University of Brighton
E-mail: [email protected]
Abstract
Set within a dynamic capabilities framework, this article examines whether leader behaviours enhance knowledge sharing and innovation, and whether innovation is positively associated with performance. A multiple respondent, longitudinal database is used to examine these relationships. Leader behaviours that are characterised as “pro-knowledge sharing” are significantly associated with both internal and external knowledge sharing. The direct effect of these leader behaviours on innovation is positive but only marginally (p<0.10). Internal knowledge sharing is very significantly associated with innovation intensity (the share of innovative sales
in total shares), whereas external knowledge sharing appears to be more significantly associated with for innovation propensity (the introduction of either a product or process innovation). The interaction between leader behaviours and knowledge upon innovation is also statistically significant. Specifically, leader behaviours and internal knowledge sharing interact to positively and significantly influence innovation propensity (p<0.05) and innovation intensity (p<0.001); while the interaction of leader behaviours and external knowledge sharing also positively influence innovation propensity (p<0.001) and innovation intensity (p<0.05). Differences emerge between the type of knowledge sharing (internal or external) and the type of innovation (propensity or intensity).
The second half of the paper examines the critical issue of whether prior innovation enhances performance (measured by objective data on net income per employee (financial performance) and labour productivity). Prior innovation propensity is positively and significantly associated with financial performance (p<0.05) and for prior innovation intensity, the relationship is significant at p<0.001. Prior innovation propensity is positively and significantly associated with enhanced labour productivity (p<0.001) and with innovation intensity at the p<0.10 level.
For completeness, whether leader behaviours, knowledge sharing and their interactions are associated directly with performance was examined. Leader behaviours did not have a direct influence on either performance measure; internal knowledge sharing was positively and significantly associated with enhanced labour productivity (p<0.10); and external knowledge sharing was negatively, but not significantly, associated with performance. No significant relationship is found for the interaction between leader behaviours and internal knowledge sharing and financial performance; however, the interaction is positive and highly significant for labour productivity. The interaction between leader behaviours and external knowledge sharing was not significantly associated with either measure of performance.
The analysis shows that the relationships between leader behaviours, knowledge sharing, innovation and performance are complex. Given the importance placed on stimulating innovation in organisations, the finding that prior innovation does indeed enhance both financial performance and labour productivity is reassuring. The results also show that pro-knowledge sharing leader behaviours must be carefully operationalised to ensure that these behaviours positively influence internal and external knowledge sharing. Simply having leaders with these behaviours present had minimal influence on innovation and no direct influence on performance. Rather, these leader behaviours need to be used to enhance knowledge sharing which, in turn, was very positively associated with both measures of innovation and subsequent performance.
Keywords: leadership, knowledge sharing, innovation, performance.
Introduction

2
The development and sustainability of valuable, scarce and difficult-to-imitate resources is a major challenge for organisations in dynamic and uncertain environments (Crook, Ketchen, Combs and Todd, 2008). The resource-based view of the firm emphasises that superior performance at one point in time can be gained through critical resources (Lieberman and Montgomery, 1998; Makadok, 2001). To sustain superior performance in dynamic environments firms need to constantly renew their resources (Lichtenthaler, 2012). Therefore, recent literature has emphasised the critical role of dynamic capabilities in managing and enhancing competitive advantage sustainably (Teece, Pisano, and Schuen, 1997; Zahra, Sapienza and Davidson, 2006). A dynamic capability is defined as “the capacity of an organisation to purposefully create, extend or modify its resource based” (Helfat, Finkelstein, Mitchell, Peteraf, Singh, Teece and Winter, 2007: p. 4). A dynamic capability can be disaggregated into three components (Teece, 2007): sensing, seizing and transforming capacity. Sensing involves identifying and shaping new opportunities – the role of knowledge, knowledge exchange and the leadership to ensure that knowledge is effectively exchanged internally and externally - is likely to be critical for this capacity. Seizing capacity refers to addressing opportunities through products and processes. It is thus expected that product and process innovation will be central to achieving this capacity. Transforming capacity relates to maintaining competitiveness through reconfiguring the firm’s resources. This raises the critical question of whether innovation enhances organisation’s competitiveness and performance.
Extant dynamic capabilities research has provided important insights, but much of it remains conceptual (Winter, 2003; Zollo and Winter, 2002). Indeed, empirical work is relatively scarce, and many studies are exploratory and based on single-cases (e.g., Herreld, O’Reilly and Tushman, 2007; Verona and Ravsi, 2003). Few quantitative studies have captured the multidimensional nature of capabilities (for notable exceptions see, Jansen, van den Bosh, and Volberda, 2005; Kale and Singh, 2007; Lichtenthaler, 2012; Ramaswami, Srivastava and Bhargava, 2009). These gaps limit our understanding of dynamic capabilities. This paper examines the role and relationship between three potential sources of dynamic capabilities: (a) the management of knowledge resources and in particular, the factors that facilitate knowledge sharing; (b) the role of leadership in facilitating employee knowledge sharing; and (c) firms’ innovation activities. While prior conceptual work has emphasised the critical role of dynamic capabilities for enhanced innovation and firm performance (Teece et al., 1997), recent work has emphasised that dynamic capabilities do not automatically lead to performance gain (Zahara et al., 2006). Without enhanced performance the value of dynamic capabilities and allocating scarce resources within firm’s to enhance and sustain them, is highly dubious.
This paper contributes empirically to the dynamic capabilities literature by examining the role that leadership has in facilitating knowledge sharing and whether this enhances innovation and then, critically, whether prior innovation contributes to superior performance.
The paper is structured as follows. The theoretical background and hypotheses are developed; the study methodology and variables are described; the results are presented and discussed. Some initial conclusions are provided.
Theoretical Background and Hypotheses (to be expanded)

3
Knowledge sharing is understood in this paper to refer to activities aimed at transferring or disseminating knowledge sharing from one person or group to another (Lee, 2001). Specifically, focus is given to implicit or tacit work experience that is shared and exchanged between employees within the workforce (internal knowledge sharing) and with colleagues outside of the employees’ organisation (external knowledge sharing).
In recent years, there has been a growth in the analysis of organisational change and sustainability (e.g., Anand, Gardner and Morris, 2007). Focus has been given to identifying how companies can improve their innovative activity and what external and internal factors have positive effects on innovation. Specifically, research has emphasised the importance of knowledge sharing between members within, across and outside of the organisation (Chowdhury, 2005) in enhancing the capability of the organisation to innovate (Daellenbach and Davenport, 2004). Thus, knowledge is likely to be central to any investigation of innovation.
Leaders Behaviours and Knowledge Sharing
Despite a now well developed literature that examines the organisational and social reasons, including the role of culture, as well as individual factors that enhance or hinder knowledge sharing (see Wand and Noe, 2010 for a recent review), other than the LMX framework posited by Carmeli (2011) far less is known about the mechanisms by which leadership may facilitate employee knowledge sharing (Nonaka and Toyama, 20005). In particular, the role that leaders have in cultivating the organisational context in order to increase the sharing of knowledge has been under-researched. Thus, while the instrumental role which leaders have in promoting work climates to enhance knowledge sharing is widely recognised, less is known about the behavioural attributes that leaders have which actually generate these positive outcomes in their employees. Drawing upon Carmeli et al.’s (2013) work, it is posited that leaders who support knowledge sharing and collaborative behaviours and encourage information exchange, openness and idea sharing are more likely to motivate their employees to share and exchange knowledge with others within and outside the organisation. Thus,
Hypothesis 1(a): Leader behaviours which promote knowledge exchange (“pro knowledge exchange leadership behaviours”) are positively related to internal knowledge sharing;
Hypothesis 1(b): Leader behaviours which promote knowledge exchange (“pro knowledge exchange leadership behaviours”) are positively related to external knowledge sharing.
Knowledge Sharing and Innovation
Knowledge management scholars have recognised that the knowledge creation processes are central to innovation (Collins and Smith, 2006; Nonaka and Takeuchi, 1995). Sharing knowledge enables the capture of existing knowledge basis both within and outside the organisation. The synthesis of this knowledge enhances the capacity of employees to develop new platforms for the development and introduction of new products and services and new processes within their organisation (Nonaka and Takeuchi, 1995; Wand and Noe, 2010). If knowledge is not shared, however, experience and expertise will not be utilised to their full potential (Hansen, 199; 2002). Yahoo’s CEO’s recent highly unpopular policy of banning all working from home to enable better “communication and collaboration” which she believes will be generated by employees working side-by-side shows the importance given to knowledge sharing – as well as the role of leadership in directing this sharing - in practice.

4
It is, therefore, plausible that there will be a direct impact of pro knowledge sharing leader behaviours on innovation. This effect could be independent of knowledge sharing. Indeed, the leader plays a critical role in generating innovation (Tushman and Nadler, 1986) and is pivotal in creating a climate that encourages the abilities and management practices to sustain innovation. Thus:
Hypothesis 2: There will be a positive association (direct) between pro knowledge sharing leader behaviours and innovation ((a) propensity and (b) intensity).
Information or knowledge can come from two sources: it can be internal, based on tacit knowledge and expertise that an individual already possesses, or external from other employees, other organisations, from training and development or from electronic and print sources, in which knowledge is explicit. The benefits of sharing ideas and the need for group members to pay careful attention to shared ideas to enhance innovation have been clearly demonstrated (Paulus and Brown, 2007; Paulus and Coskun, 2013; Paulus, Makui and Putman, 2006). Studies that have examined knowledge and information sharing find evidence that both internal and external knowledge sharing are important for increased innovation (Ancona and Caldwell, 1992 (external sharing); Monge, Cozzens and Cotractor, 1992 (internal sharing); Troy, Szymanski and Rajan, 2001 (both types)). It is therefore posited that:
Hypothesis 3(a): Internal knowledge sharing is positively associated with innovation.
Hypothesis 3(b): External knowledge sharing is positively associated with innovation.
While leaders can influence innovation in multiple ways by developing a climate conducive for innovation and providing support for creativity and experimentation (Mumford and Hunter, 2005) – and this influence may indeed be a direct one on innovation (hypothesis 2) – it is also likely that pro knowledge sharing behaviours can interact positively with both internal and external knowledge sharing to enhance innovation.
Hypothesis 4: Pro knowledge sharing leader behaviours and knowledge (both (a) internal and (b) external) sharing interact to positively influence innovation.
Innovation and Performance
While a better understanding of factors that enhance innovation is valuable, it is absolutely critical to examine whether innovation – particularly prior innovation – impacts positively on organisational performance. There is some consensus in the literature that innovation is one of the main sources of competitive advantage. Both the resource based view of the firm and the dynamic capabilities literature emphasise that if innovations are based on valuable, rare, inimitable and nonsubstitutible resources including unique and valuable knowledge, this will lead to higher levels of competitive advantage (Barney, 1991). Moreover, if organisational capabilities such as innovative capacity can be seen as a proxy of competitive advantage (Lopez-Cabrales et al., 2006), it is likely that there will be a close link between innovative activity and competitive advantages and performance. Previous studies have indeed found that innovation contributes to organisational performance (Capon et al., 1992; Damanpour, 1991; Garcia-Morales et al., 2008; Lopez-Cabrales et al, 2009; Perez-Luno et al., 2007). This reflects, in part, innovator’s ability to create, expand and revitalise markets and to influence, and even change, consumer preferences and behaviour (Zhou, 2006). It is thus posited that:
5
Hypotheses 5: Both measures of prior innovation (probability and intensity) (2006-2009) are positively associated with subsidiary performance (financial and labour productivity) (2010-2012).
Finally, it is recognised that the value of knowledge refers to “its potential to improve the efficiency and effectiveness of the firm, exploit market opportunities and/or neutralise potential threats” (Lepak and Snell, 2002, p. 519). Barney and Wright’s (1998) suggestion that any resource that creates value through either decreasing product/service costs or differentiating product/service in a way that allows the firm to charge a premium price; the exchange of knowledge – especially if valuable – can yield high returns to markets. It, therefore, is plausible that knowledge transfer and pro knowledge sharing leader behaviours, and their interaction, can have a direct impact on performance. The final hypothesis is:
Hypothesis 6(a): There will be a positive association (direct) between pro knowledge sharing leader behaviours and subsidiary performance; Hypothesis 6(b): Internal knowledge sharing is positively associated with subsidiary performance; Hypothesis 6(c) External knowledge sharing is positively associated with subsidiary performance; 6(d): Pro knowledge sharing leader behaviours and internal knowledge sharing interact to positively influence subsidiary performance; 6(e) Pro knowledge sharing leader behaviours and external knowledge sharing interact to positively influence subsidiary performance.
Figure 1 summarises the main relationships outlined in this paper.
Methodology
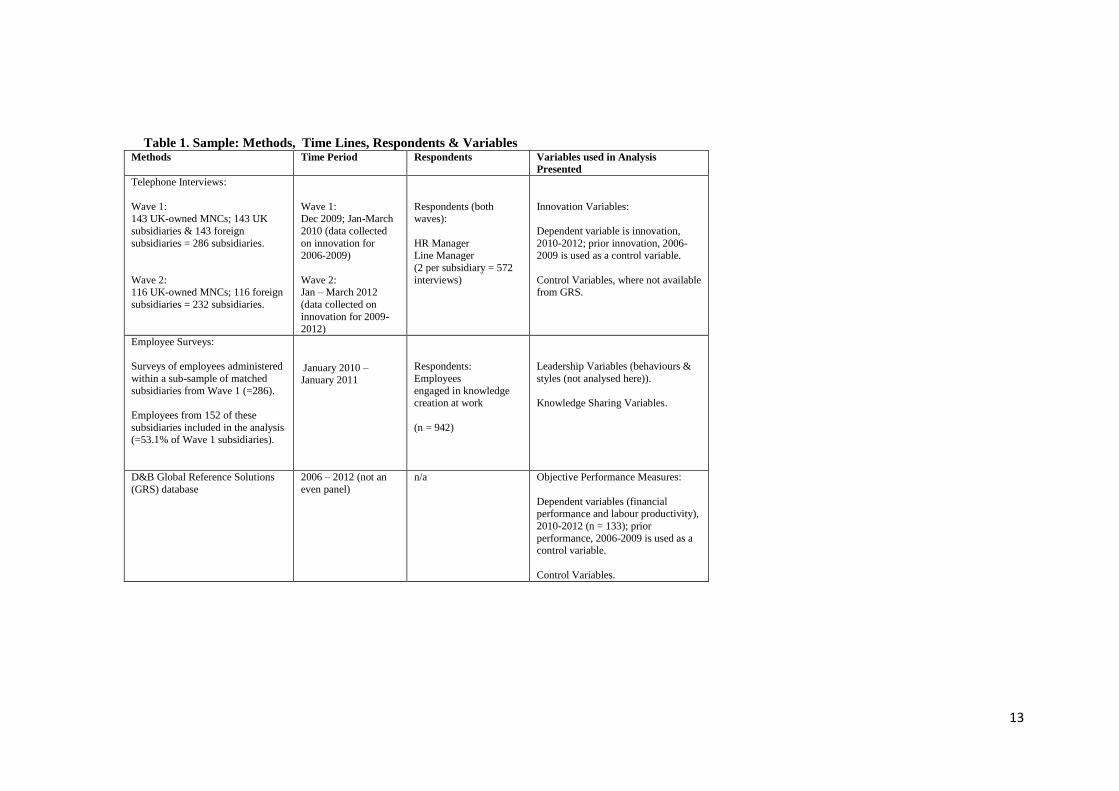
Research Design and Sample The data presented in this paper are derived from a number of sources, respondents and have been collected over-time (see Table 1 for detail). The data presented here are drawn from a larger data set which comprised 143 organisations. Dun and Bradstreet’s Global Reference Solution (GRS) database was used to draw this sample using the following criteria: the ‘global ultimate parent company’ was, (1) in the UK (the UK ownership criteria was used to eliminate potential ‘country of origin’ effects); (2) employed at least 200 people overall (this criteria was used so that the data could be compared with other such surveys – e.g., Cranet – which also uses this size criteria); and (3) had a subsidiary in at least one of the three non-UK study countries (i.e., Czech Republic, Hungary and Poland).i Five hundred and fifteen UK-owned subsidiaries met the study’s criteria. Priority was given to the 378 organisations that also had a similar subsidiary in the UK (proxied by SIC code) so that the results were not diluted by high levels of heterogeneous activities between the two subsidiaries of the organisation. The 143 organisations in the main database have a matched sample whereby the UK HR Director and two HR managers/specialists and two line managers in the organisation’s UK and foreign subsidiaries completed telephone interviews (five respondents per organisation). The response rate was 37.8% and 715 interviews were completed. A two-stage Heckman test was used to test for response bias. The results were not statistically significant. These surveys focussed on strategy, HRM, HRD/human capital investment, innovation and performance and ranged in duration between 30 to 50 minutes. Fifty-seven of the study subsidiaries were based in Poland; 46 in the Czech Republic; 40 in Hungary; and 143 in the UK (286 subsidiaries). A minimum quota of 40 responses per country was set. See Sheehan, 2012 for detailed discussion of the sample and method.

6
The first wave of telephone interviews took place from Dec 2009 – March 2010. A second wave of shorter follow-up interviews with HR managers and line managers in the subsidiaries was undertaken in January – March 2012. The matched sample for the second wave decreased to 116 subsidiaries in the UK and 116 foreign (232 subsidiaries in total). In the first wave of interviews, HR managers were asked to identify 10 employees in the subsidiary ten employees who were engaged in knowledge creation at work (e.g., participants were involved in the development of new products, services, processes, and technology). Not all subsidiaries had such workers and were therefore excluded by default (approximately 41 subsidiaries overall). Surveys of these employees were administered through email, telephone - where necessary - and also during case study visits to 32 of subsidiaries (8 in each study country and with an almost equal split between manufacturing and services). A subsidiary is only included in the analysis if a minimum of 5 completed and usable surveys were returned. In total, 152 subsidiaries could be included (representing 53.1% of the original subsidiaries). The total number of surveys is 942. Hungary is under-represented in the sample both in terms of subsidiaries and employees. These data were collected over the period January 2010-January 2011. The respondents’ average age was 34.91 years (SD = 12.67), and their average tenure in the organisation was 5.28 (SD = 9.67). Thirty-five percent of respondents were female.
Data on control variables and performance were extracted, at the subsidiary level, from Dun and Bradstreet’s GRS database. Missing values were asked about during telephone interviews, case study visits and/or by email correspondence. Nevertheless, 19 organisations needed to be excluded from the final analysis due to missing data. The final number of subsidiaries in the analysis is 133.
Similar to Shipman et al. (2006), this was a longitudinal study which involved collecting data at three specific points in time. At time 1 (Dec 2009-Jan-March 2010), in terms of variables relevant to this analysis, data was obtained on innovation activities for the period 2006-2009 from HR specialists and line managers. Only where the two respondents’ responses converged, is an innovation recorded (this convergence was high at an overall rate of 91.5% in the first period; and 92.3% in the second survey period). At time 2 (January 2010-January 2011) data on knowledge sharing and leadership was obtained from knowledge workers in the subsidiaries. Finally, at time 3 (January-March 2012) the final measurement of innovation was obtained. There was approximately one year between each measurement point. This longitudinal approach enables the direction of relationships to be explored and for this study, it was critical to establish whether prior innovation (i.e., innovation in 2006-2009) enhanced future performance (2010-2012). Moreover, the use of so multiple respondents helps to reduce concern about potential common method bias (see Cascio, 2012 for a discussion).
Measures
Leader Behaviour
Following previous studies on leadership and knowledge exchange or sharing (e.g., Carmeli, Gelbard and Reiter-Palmon, 2013; Carmeli & Waldman, 2010; Connelly & Kelloway, 2003), four items were constructed to assess the extent to which employees believe their line manager supports and encourages knowledge exchange (see the Appendix for detail). Responses were on a five-point scale (ranging from 1 = not at all to 5 = to a large extent). Results from an exploratory factor analysis, indicate that all four items loaded onto one factor with an eigenvalue of 2.63 and explained 65.3 percent of the variability. The Cronbach’s alpha for this measure was 0.82.

7
Knowledge Sharing
Eight items were used to assess the extent to which employees exchange knowledge with colleagues inside and outside their organisation (see, for example, Lee, 2001; Lu, Leung & Koch, 2006 who used similar measures). Respondents were asked to indicate on a five point scale (ranging from 1 = not at all to 5 = to a large extent) the extent to which they exchange knowledge with colleagues inside the organisation (i.e., internal knowledge sharing) and people outside the organisation (i.e., external knowledge sharing) (see Appendix for details of the variables). Results of the exploratory factor analysis indicate that the eight items loaded onto two factors (four items per factor which was also reported by Carmeli et al., 2013 who used the same measures). One factor, internal knowledge sharing had an eigenvalue of 5.05 and explained 31.25 percent of the variability. The second factor, external knowledge sharing, had an eigenvalue of 2.16 and explained 41.29 of the variability. Together, these two factors explained 72.54 percent of the variance. The Cronbach’s alphas for the internal and external knowledge sharing were 0.85 and 0.87, respectively.
Innovation
The definitions of innovation used here are broadly based on those in the Community Innovation Survey (CIS). The CIS definition was modified slightly to reflect the unit of analysis – subsidiaries of MNCs. It was important to capture innovations introduced by the subsidiary unit, rather than those adapted or adopted from head quarters (HQs) or another subsidiary within the MNC’s family tree. Specifically the definition used is as follows: “An innovation is the introduction of a new or significantly improved (a) product and/or (b) process by this subsidiary. The innovation must be new to your subsidiary, although it could have been originally developed by other organisations that are NOT part of this MNC.” While the CIS also asks about organisational and marketing innovations, pilot interviews found that these innovations generally originated from HQs or Regional HQs and were something that subsidiaries had little influence over. Thus, questions about organisational and marketing innovations were not asked.
Two measures of innovation examined are: (a) propensity to innovate which is a dummy variable reflecting whether a product or process innovation was introduced; and (b) innovation intensity which is measured by the share of innovative sales in total sales (see Giannetti and Madi, 2013 who also use these two measures of innovation).ii This latter measure provides a more nuanced insight into innovation and particularly, how it links with other measures of competitive advantage – e.g., total sales.
Performance
Firm performance is frequently assessed in terms of how effectively the firm achieves a variety of objective financial targets or benchmarks or by the firm’s position on a variety of subjective (perceived) measures relative to their competitors. While previous studies have shown that scales of perceived performance correlate positively (with moderate to strong association) with objective measures of firm performance (Wall et al., 2004), however concern still remains about the potential for common methods bias. Thus, objective measures of subsidiary performance are used in this study.
Net income (the subsidiary’s total income minus expenses in each accounting period) per employee is used to measure financial performance; labour productivity is estimated as the

8
ratio of total revenues divided by total wages costs. These data were obtained from the D&B Global Reference Solution (GRS) data base.
Control Variables Standard control variables used in the innovation and firm performance literatures are used (see, for example, Giannetti and Madia, 2013). They are as follows: log of subsidiary size; age; industry; logs of previous R&D expenditure and capital investment; prior innovation propensity and intensity. Collaboration is a dummy variable and indicates whether the subsidiary co-operated with any of its innovation activities with other enterprises or institutions (see CIS, 2010). For performance, prior financial and labour productivity is also controlled for in the estimations.
Sample and Procedures
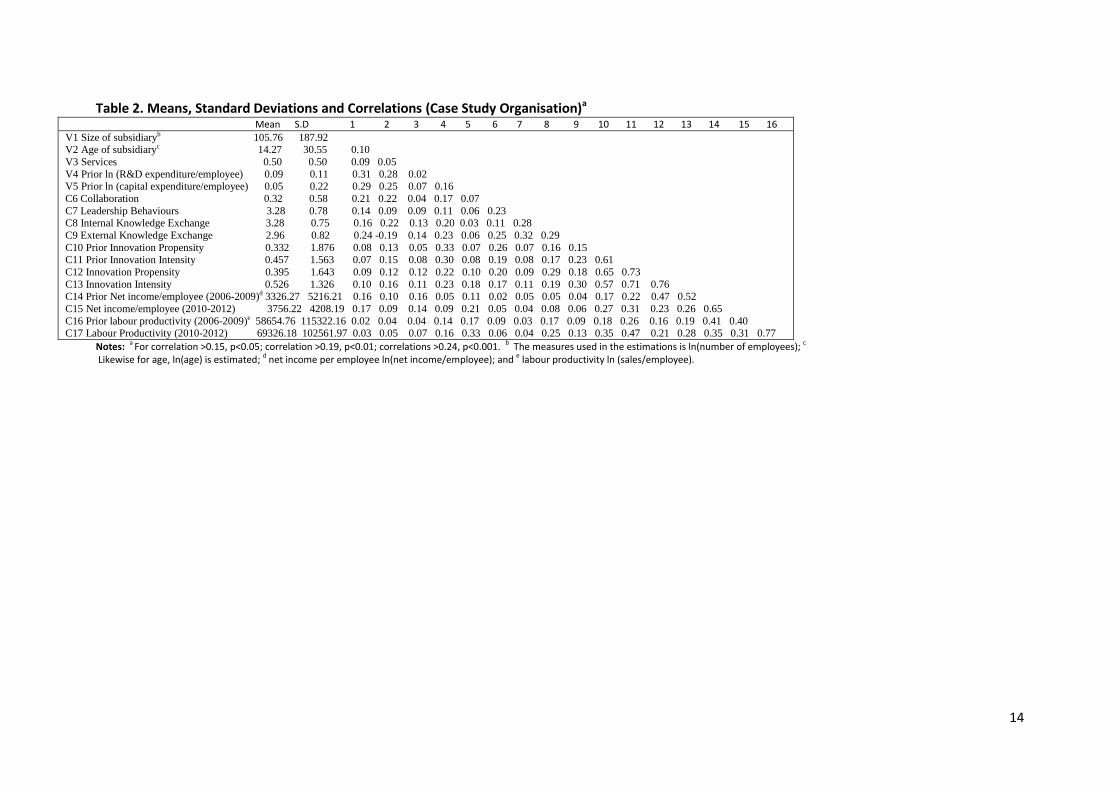
The means, standard deviations and correlations between the study variables are reported in Table 2.
Results
Leader Behaviours & Knowledge Sharing
The results of Models 1 (Table 3) indicate that characteristics of both the subsidiaries and the respondents influence knowledge sharing. Internal knowledge sharing was significantly more likely in smaller subsidiaries compared to larger ones; whereas external knowledge sharing was significantly positively associated with subsidiary size. External knowledge sharing was also more likely to take place in older subsidiaries. Internal knowledge sharing is significantly associated with the respondent being female. External knowledge sharing is positively and significantly associated with employment tenure.
Model 1a examines whether national context influences knowledge sharing. Internal knowledge sharing is positively and significantly associated with the subsidiary being located in the Czech Republic (p<0.05). In contrast, internal knowledge sharing is negatively and significantly associated with being located in Hungary (p<0.001) and Poland (p<0.05). Similar patterns are found in relation to external knowledge sharing: negative and significant for Hungary (p<0.10) and Poland (p<0.05); and positive but not significant for the Czech Republic.
Hypotheses 1a and 1b, which predicted that leader behaviours would be positively associated with both internal and external knowledge sharing, are not rejected. Model 2 in Table 3 shows that leader behaviours are positively and significantly associated with internal knowledge sharing (p<0.05) and external knowledge sharing (p<0.001). A significant improvement to the model’s R2 (between Model 1a and Model 2) when leadership behaviours is added into the estimations – by 53.8% (internal knowledge sharing specification) and 49.1% (external knowledge sharing model specification) suggests that these behaviours are important to understanding knowledge sharing in the sample subsidiaries.
Leader Behaviours, Knowledge Sharing and Innovation
9
Table 4 reports on the factors that influence innovation propensity and intensity. As expected, most of the control variables are significant and have the expected signs. For innovation propensity (Model 1), the following control variables are significant: prior R&D expenditure (positive at p<0.001); prior capital investment (positive at p<0.05); collaboration (positive at p<0.10); prior innovation propensity (positive at p<0.001); and prior innovation intensity (positive at p<0.10).
For innovation intensity the statistically significant control variables are: subsidiary size (positive at p<0.05); prior R&D expenditure (positive at p<0.001); prior capital investment (positive at p<0.001); collaboration (positive at p<0.01); prior innovation propensity (positive at p<0.05); and prior innovation intensity (positive at p<0.05).
Model 1a examines the role of national context and innovation. There are positive and significant relationship for both types of innovation (both at p<0.05) associated with being located in the Czech Republic; for Hungary these relationships are negative and highly significant (p<0.001); and for Poland, positive but not significant (the control country was the UK). Interestingly, of the four study countries, enterprises in the Czech Republic were the most likely to have innovated based on the Community Innovation Survey, 2008-2010 (51.7%; and the other study countries were as follows: UK 44.2%; Hungary 31.1%; and Poland, 28.1%).
Hypothesis 2 posited that there would be a positive direct relationship between leader behaviours and both types of innovation. The relationships are positive and marginally significant (at p<0.10) for both types of innovation. Thus, the hypothesis that there is a positive direct association between leader behaviours that are pro-knowledge sharing and innovation is not rejected, however, the relationships are not particularly strong.
Hypotheses 3(a) and 3(b) posit that both internal and external knowledge sharing would be positively associated with both types of innovation. The results from Model 2 (Table 4) indicate a positive and significant relationship between internal knowledge sharing and innovation propensity (p<0.10) and innovation intensity (p<0.05); for external knowledge sharing the relationship with innovation propensity is positive and significant at p<0.05 and at p<0.10 for innovation intensity. Thus, these hypotheses are not rejected. It appears that internal knowledge sharing is more significant for innovation intensity, whereas external knowledge sharing is more significant for innovation propensity.
Finally, Model 3 examines whether there is an interaction effect between leader behaviours and knowledge sharing, which, in turn, influence innovation. The results show that leader behaviours and internal knowledge sharing interact to positively and significantly influence innovation propensity (p<0.05) and innovation intensity (p<0.001). Leader behaviours and external knowledge sharing also positively influence innovation propensity (p<0.001) and innovation intensity (p<0.05). Thus, hypothesis 4 is not rejected.
Innovation & Performance
While the analysis has shown factors that are important to enhance innovation, it is critical to establish whether there is a positive association between (prior) innovation and performance. Financial performance and labour productivity are examined. For financial performance the following control variables are significant: subsidiary size is positively associated with financial performance (p<0.10); prior R&D expenditure (positive at p<0.005); prior capital expenditure (positive at p<0.05); prior financial performance (positive at

10
p<0.005); and prior labour productivity (positive at p<0.10). Being located in Hungary is negatively and significantly associated with financial performance (p<0.001) and for Poland the relationship is positive and significant at p<0.05. Turning to the role of prior innovation and performance, Model 1a, Table 5 shows that prior innovation propensity positively and significantly influences financial performance (p<0.05) and for prior innovation intensity the relationship is significant at p<0.001.
For labour productivity the following control variables are significant: prior capital expenditure (positive at p<0.05); prior financial performance (p<0.10); and prior labour productivity (p<0.05). Prior innovation propensity is significantly associated with enhanced labour productivity (p<0.001) and with innovation intensity at the p<0.10 level (Model 1a).
Thus, hypothesis 5 is not rejected – prior innovation – of both types – enhances both financial performance and labour productivity.
For completeness, whether leader behaviours, knowledge sharing and their interactions is associated directly with performance is now examined Table 5 (Models 2 and 3). Leader behaviours do not have a direct significant effect on either performance measure; internal knowledge sharing is positively and significantly associated with enhanced labour productivity (p<0.05); and external knowledge sharing is negatively but not significantly so, associated with performance. Thus, hypothesis 6(b) is up held; hypotheses 6(a) and 6(c) are not accepted. No significant relationship is found for the interaction between leader behaviours and internal knowledge sharing and financial performance; however the interaction is positive and highly significant for labour productivity (p<0.001). Thus hypothesis 6(d) is partially supported. The interaction between leader behaviours and external knowledge sharing are not significantly associated with either measure of performance. Thus hypothesis 6(e) is not accepted.
Initial Conclusions
Set within a dynamic capabilities framework, this paper examined the relationship between leader behaviours, knowledge sharing, innovation and performance. Leader behaviours that are “pro knowledge sharing” have positive effects on both internal and external knowledge sharing. Internal and external knowledge sharing are positively associated with innovation. Internal knowledge sharing seems critical to sustaining innovation (intensity); whereas external knowledge sharing appears to be very significant for the likelihood of innovating. This perhaps reflects the importance of brining new knowledge (obtained through external sharing) into the subsidiary in relation to propensity; whereas internal knowledge sharing appears to be critical for sustaining innovation. The interaction between leader behaviours and both types of knowledge sharing are also significantly associated with both types of innovation. Interestingly, the presence of leaders with “pro knowledge sharing” behaviours alone, is only marginally associated with innovation.
The second half of the paper examined the critical issue of whether prior innovation enhances performance. It was found that prior innovation propensity and intensity both significantly and positively influence financial performance and labour productivity. Given the importance placed on stimulating innovation in organisations, the finding that prior innovation does indeed enhance both financial performance and labour productivity is reassuring. The results also show that pro-knowledge sharing leader behaviours must be carefully operationalised to ensure that these behaviours positively influence internal and external knowledge sharing. Simply having leaders with these behaviours present had minimal influence on innovation and no direct influence on performance. Rather, these leader

11
behaviours need to be used to enhance knowledge sharing which, in turn, was very positively associated with both measures of innovation and subsequent performance.

12
13
Table 1. Sample: Methods, Time Lines, Respondents & Variables
Methods Time Period Respondents Variables used in Analysis
Presented
Telephone Interviews:
Wave 1: 143 UK-owned MNCs; 143 UK
subsidiaries & 143 foreign
subsidiaries = 286 subsidiaries.
Wave 2: 116 UK-owned MNCs; 116 foreign
subsidiaries = 232 subsidiaries.
Wave 1: Dec 2009; Jan-March
2010 (data collected
on innovation for
2006-2009)
Wave 2: Jan – March 2012
(data collected on
innovation for 2009-2012)
Respondents (both waves):
HR Manager
Line Manager
(2 per subsidiary = 572
interviews)
Innovation Variables:
Dependent variable is innovation,
2010-2012; prior innovation, 2006-
2009 is used as a control variable.
Control Variables, where not available from GRS.
Employee Surveys:
Surveys of employees administered
within a sub-sample of matched
subsidiaries from Wave 1 (=286).
Employees from 152 of these
subsidiaries included in the analysis (=53.1% of Wave 1 subsidiaries).
January 2010 – January 2011
Respondents:
Employees
engaged in knowledge creation at work
(n = 942)
Leadership Variables (behaviours &
styles (not analysed here)).
Knowledge Sharing Variables.
D&B Global Reference Solutions
(GRS) database
2006 – 2012 (not an
even panel)
n/a Objective Performance Measures:
Dependent variables (financial performance and labour productivity),
2010-2012 (n = 133); prior
performance, 2006-2009 is used as a control variable.
Control Variables.
14
Table 2. Means, Standard Deviations and Correlations (Case Study Organisation)a
Mean S.D 1 2 3 4 5 6 7 8 9 10 11 12 13 14 15 16 V1 Size of subsidiaryb 105.76 187.92 V2 Age of subsidiaryc 14.27 30.55 0.10
V3 Services 0.50 0.50 0.09 0.05
V4 Prior ln (R&D expenditure/employee) 0.09 0.11 0.31 0.28 0.02 V5 Prior ln (capital expenditure/employee) 0.05 0.22 0.29 0.25 0.07 0.16
C6 Collaboration 0.32 0.58 0.21 0.22 0.04 0.17 0.07
C7 Leadership Behaviours 3.28 0.78 0.14 0.09 0.09 0.11 0.06 0.23 C8 Internal Knowledge Exchange 3.28 0.75 0.16 0.22 0.13 0.20 0.03 0.11 0.28
C9 External Knowledge Exchange 2.96 0.82 0.24 -0.19 0.14 0.23 0.06 0.25 0.32 0.29
C10 Prior Innovation Propensity 0.332 1.876 0.08 0.13 0.05 0.33 0.07 0.26 0.07 0.16 0.15
C11 Prior Innovation Intensity 0.457 1.563 0.07 0.15 0.08 0.30 0.08 0.19 0.08 0.17 0.23 0.61
C12 Innovation Propensity 0.395 1.643 0.09 0.12 0.12 0.22 0.10 0.20 0.09 0.29 0.18 0.65 0.73
C13 Innovation Intensity 0.526 1.326 0.10 0.16 0.11 0.23 0.18 0.17 0.11 0.19 0.30 0.57 0.71 0.76 C14 Prior Net income/employee (2006-2009)d 3326.27 5216.21 0.16 0.10 0.16 0.05 0.11 0.02 0.05 0.05 0.04 0.17 0.22 0.47 0.52
C15 Net income/employee (2010-2012) 3756.22 4208.19 0.17 0.09 0.14 0.09 0.21 0.05 0.04 0.08 0.06 0.27 0.31 0.23 0.26 0.65
C16 Prior labour productivity (2006-2009)e 58654.76 115322.16 0.02 0.04 0.04 0.14 0.17 0.09 0.03 0.17 0.09 0.18 0.26 0.16 0.19 0.41 0.40 C17 Labour Productivity (2010-2012) 69326.18 102561.97 0.03 0.05 0.07 0.16 0.33 0.06 0.04 0.25 0.13 0.35 0.47 0.21 0.28 0.35 0.31 0.77
Notes: a For correlation >0.15, p<0.05; correlation >0.19, p<0.01; correlations >0.24, p<0.001. b The measures used in the estimations is ln(number of employees); c
Likewise for age, ln(age) is estimated; d net income per employee ln(net income/employee); and e labour productivity ln (sales/employee).

15
Table 3. Hierarchial Results: Leadership Behaviours & Knowledge Sharing (Internal and External)
Internal
Knowledge
Sharing
(Model 1)
External
Knowledge
Sharing
(Model 1)
Internal
Knowledge
Sharing
(Model 1a)
External
Knowledge
Sharing
(Model 1a)
Internal
Knowledge
Sharing
(Model 2)
External
Knowledge
Sharing
(Model 2)
Constant 2.567***
(0.744)
2.408***
(0.803)
2.558***
(0.739)
2.405***
(0.793)
2.507***
(0.759)
2.396***
(0.738)
ln(subsidiary size = number of employees) -0.287**
(0.115)
0.306**
(0.113)
-0.281**
(0.114)
0.302**
(0.110)
-0.253*
(0.128)
0.297*
(0.135)
Ln(Age (subsidiary)) 0.103
(0.085)
0.208*
(0.110)
0.102
(0.082)
0.207*
(0.107)
0.097
(0.075)
0.205*
(0.106)
Industry
0.010 (1.034)
0.027 (0.006)
0.009 (1.032)
0.025 (0.005)
0.009 (1.032)
0.022 (0.004)
Gender 0.152**
(0.063)
0.038
(0.036)
0.150**
(0.061)
0.035
(0.031)
0.142*
(0.075)
0.032
(0.028)
Age (respondent) -0.039 (0.024)
0.114 (0.072)
-0.035 (0.021)
0.109 (0.066)
-0.028 (0.015)
0.105 (0.061)
Tenure in organisation 0.018 (0.015)
0.234* (0.121)
0.017 (0.014)
0.231* (0.117)
0.014 (0.010)
0.227* (0.115)
Education 0.024
(0.015)
0.142
(0.083)
0.021
(0.013)
0.139
(0.082)
0.018
(0.010)
0.138
(0.080)
National Context (reference category: UK)
Czech Republic 0.143*
(0.072)
0.105
(0.063)
0.132
(0.078)
0.098
(0.056)
Hungary -0.235***
(0.078)
-0.188*
(0.092)
-0.203**
(0.073)
-0.165
(0.103)
Poland -0.169**
(0.070)
-0.154**
(0.059)
-0.148*
(0.074)
-0.132**
(0.063)
Leader Behaviours 0.365**
(0.149)
0.413***
(0.138)
R2 Adjusted R2
F
∆ R2
N
0.228 0.217
-
938
0.206 0.196
-
938
0.256 0.238
0.097
938
0.228 0.216
0.102
938
0.383 0.366
0.538
938
0.342 0.322
0.491
938

16
Table 4. Estimation Results: Leadership Behaviours, Knowledge Sharing (Internal and External) & Innovationa Innovation
Propensity
(Model 1)
Innovation
Intensity
(Model 1)
Innovation
Propensity
(Model 1a)
Innovation
Intensity
(Model 1a)
Innovation
Propensity
(Model 2)
Innovation
Intensity
(Model 2)
Innovation
Propensity
(Model 3)
Innovation
Intensity
(Model 3)
Constant -0.8642**
(0.396)
-4.3221***
(1.216)
-0.7643**
(0.302)
-4.3219***
(1.214)
-0.8639**
(0.382)
-4.3217***
(1.215)
-0.8630**
(0.379)
-4.3206***
(1.326)
ln(subsidiary size = number of employees) 0.0981
(1.522)
0.0022
(0.001)**
0.0943
(1.517)
0.0019
(0.001)
0.0978
(1.520)
0.0016
(0.001)
0.0977
(1.519)
0.0015
(0.001)
ln(Age(subsidiary)) 0.0019 (0.005)
0.0008 (0.004)
0.0015 (0.004)
0.0008 (0.004)
0.0016 (0.006)
0.0007 (0.004)
0.0015 (0.006)
0.0006 (0.004)
Industry
0.0106
(1.034)
0.0027
(0.006)
0.0102
(1.030)
0.0025
(0.006)
0.0104
(1.031)
0.0023
(0.005)
0.0103
(1.030)
0.0022
(0.004)
Prior ln(R&D expenditure/employee) 0.2367***
(0.022)
0.1906***
(0.029)
0.2360***
(0.019)
0.1901***
(0.028)
0.2362***
(0.021)
0.1089***
(0.032)
0.2360***
(0.025)
0.1086***
(0.030)
Prior ln(Capital investment/employee) 0.0198**
(0.009)
0.0217***
(0.007)
0.0191*
(0.009)
0.0216***
(0.006)
0.0197**
(0.008)
0.0215***
(0.005)
0.0196**
(0.008)
0.0214***
(0.004)
Collaboration 0.0216*
(0.012)
0.0032***
(0.0008)
0.0213*
(0.011)
0.0030***
(0.0007)
0.0215*
(0.011)
0.0023**
(0.0009)
0.0214*
(0.010)
0.0022**
(0.0008)
Prior Innovation Propensity 0.4721*** (0.119)
0.3567** (0.149)
0.4719*** (0.118)
0.3560** (0.147)
0.4715*** (0.116)
0.3557** (0.144)
0.4709*** (0.116)
0.3546** (0.144)
Prior Innovation Intensity 0.2681*
(0.128)
0.3105**
(0.127)
0.2677*
(0.124)
0.3100**
(0.124)
0.2673*
(0.122)
0.3097*
(0.155)
0.2668**
(0.115)
0.3092*
(0.154)
National Context (reference category: UK)
Czech Republic 0.0227**
(0.010)
0.0269**
(0.012)
0.0226**
(0.009)
0.0268**
(0.011)
0.0224**
(0.008)
0.0267**
(0.0012)
Hungary -0.2167*** (0.015)
-0.0438*** (0.002)
-0.2166*** (0.013)
-0.0437*** (0.002)
-0.2165*** (0.014)
-0.0435*** (0.002)
Poland 0.0327
(0.020)
0.1685
(0.140)
0.0327
(0.019)
0.1680
(0.137)
0.0325*
(0.018)
0.1696*
(0.0892)
Leader Behaviours & Knowledge Sharing:
Leader Behaviours
0.2342*
(0.118)
0.0145*
(0.007)
0.2338*
(0.117)
0.0133*
(0.007)
Internal Knowledge Sharing 0.1977*
(0.106)
0.2192**
(0.095)
0.1960*
(0.107)
0.2199**
(0.107)
External Knowledge Sharing 0.2861**
(0.125)
0.1287*
(0.067)
0.2618**
(0.115)
0.1283*
(0.065)
Interaction Terms:
Leader Behaviours*Internal Knowledge Sharing
0.2561** (0.0985)
0.3543*** (0.0968)
Leader Behaviours*External Knowledge
Sharing
0.4678***
(0.142)
0.2949*
(0.114)
Log-likelihood - -202.78 - -188.22 - -160.38 - -139.66

17
σ ρ n
(0.170)
(0.069) 132
1.724***
0.765*** 126
(0.180)
(0.076) 132
1.718***
0.750*** 126
(0.186)
(0.081) 130
1.628***
0.750*** 125
(0.192)
(0.090) 130
1.538***
0.724*** 125
Notes: a In the propensity equation the dependent variable is a dummy variable that takes the value of 1 if the firm introduced at least one product or process innovation over the 2010-2012
period. In the intensity equation, the dependent variable is a logit transformation of the actual share of innovation sales. b * significant at p<0.10; ** significant at p<0.05; *** significant at
p<0.01.

18
Table 5. Hierarchial Regression Results: Leadership Behaviours, Knowledge Sharing (Internal and External), Innovation & Performancea
Financial
Performance
(Model 1)
Labour
Productivity
(Model 1)
Financial
Performance
(Model 1a)
Labour
Productivity
(Model 1a)
Financial
Performance
(Model 2)
Labour
Productivity
(Model 2)
Financial
Performance
(Model 3)
Labour
Productivity
(Model 3)
Constant 4.226*** (0.987)
3.267*** (0.773)
4.206*** (0.981)
3.259*** (0.769)
4.198*** (0.976)
3.252*** (0.755)
4.165*** (0.932)
3.226*** (0.730)
ln(subsidiary size = number of employees)
0.016* (0.008)
0.011 (0.007)
0.019* (0.005)
0.009 (0.006)
0.010 (0.007)
0.008 (0.005)
0.007 (0.008)
0.010 (0.007)
ln(Age(subsidiary)) 0.014*
(0.007)
0.010
(0.006)
0.017**
(0.007)
0.011
(0.008)
0.013*
(0.008)
0.011
(0.007)
0.009
(0.006)
0.010
(0.006)
Industry
0.082
(0.055)
-0.007
(0.006)
0.078
(0.059)
-0.018
(0.013)
0.075
(0.057)
-0.017
(0.010)
0.066
(0.051)
-0.011
(0.008)
Prior ln(R&D
expenditure/employee)
0.467**
(0.156)
0.026
(0.017)
0.452**
(0.181)
0.022
(0.016)
0.450**
(0.178)
0.021
(0.015)
0.448**
(0.175)
0.019
(0.013)
Prior ln(Capital investment/employee)
0.021* (0.011)
0.387** (0.152)
0.019* (0.010)
0.379** (0.153)
0.017 (0.013)
0.375** (0.146)
0.014 (0.011)
0.368* (0.185)
Collaboration 0.007 (0.010)
0.010 (0.015)
0.009 (0.009)
0.013 (0.014)
0.006 (0.009)
0.009 (0.013)
0.004 (0.009)
0.008 (0.012)
Prior Financial Performance 0.025**
(0.011)
0.056*
(0.028)
0.022**
(0.008)
0.054*
(0.027)
0.020*
(0.009)
0.053*
(0.025)
0.018*
(0.009)
0.051*
(0.024)
Prior Labour Productivity 0.018*
(0.009)
0.122**
(0.052)
0.015*
(0.008)
0.119**
(0.052)
0.017*
(0.009)
0.114*
(0.060)
0.016*
(0.009 )
0.113*
(0.059)
Prior Innovation Propensity 0.102**
(0.039)
0.449***
(0.103)
0.101**
(0.037)
0.446***
(0.098)
0.100**
(0.035)
0.443***
(0.096)
0.098**
(0.033)
0.438***
(0.090)
Prior Innovation Intensity
0.079***
(0.021)
0.185*
(0.096)
0.077***
(0.020)
0.184*
(0.095)
0.075***
(0.019)
0.182*
(0.093)
0.070***
(0.016)
0.180*
(0.091)
National Context (reference category: UK)
Czech Republic 0.025
(0.017)
0.009
(0.005)
0.023
(0.015)
0.008
(0.004 )
0.021
(0.014)
0.006
(0.005 )
Hungary -0.187***
(0.058)
-0.085*
(0.044)
-0.155**
(0.053)
-0.077*
(0.039)
-0.142**
(0.051)
-0.075*
(0.036)
Poland 0.130*
(0.067)
0.206**
(0.081)
0.126*
(0.066)
0.201**
(0.078)
0.125*
(0.067)
0.187*
(0.086)
Leader Behaviours &

19
Knowledge Sharing:
Leader Behaviours
0.019
(0.023)
0.007
(0.057)
0.018
(0.022)
0.006
(0.055)
Internal Knowledge Sharing 0.026
(0.019)
0.197**
(0.082)
0.025
(0.017)
0.188**
(0.075)
External Knowledge Sharing -0.005 (0.004)
-0.107 (0.071)
-0.003 (0.003)
-0.103 (0.068)
Interaction Terms:
Leader Behaviours*Internal
Knowledge Sharing
0.076
(0.051)
0.235***
(0.071)
Leader Behaviours*External
Knowledge Sharing
0.012
(0.009)
0.109
(0.073)
R2
Adjusted R2
F ∆ R2
N
0.132
0.116
4.763 (0.001) -
124
0.372
0.346
46.239(0.001) -
129
0.155
0.137
6.005 (0.001) 0.181
124
0.408
0.387
58.226(0.000) 0.118
129
0.184
0.177
18.751(0.000) 0.292
122
0.592
0.561
73.006(0.000) 0.450
128
0.207
0.196
21.569(0.000) 0.107
122
0.616
0.598
82.783(0.000) 0.066
128

20
Appendix Indicators of Leader Behaviours Factor Loading
My manager encourages information exchange between members
0.82
My manager encourages openness in the discussion meetings 0.80
My manager encourages members to share ideas with each other 0.81
My manager is a role model for collaboration and knowledge sharing 0.78
Eigenvalue = 2.63; variance explained 65.3%
Indicators of Knowledge Exchange
Internal Knowledge Exchange Factor Loading
External Knowledge Exchange Factor Loading
I regularly (e.g., at least once every 1-3 months) meet with my colleagues in this organisation and exchange ideas with them regularly
0.28 0.80
I regularly access my colleagues in this organisation and exchange new ideas and developments with them
0.26 0.84
I regularly interact with my colleagues in this organisation to discuss suggestions and ideas
0.29 0.87
I make sure to be available for sharing experiences with my colleagues in this organisation
0.25 0.76
I regularly meet & exchange ideas regularly with people outside this organisation
0.82 0.29
I regularly access people outside this organisation and exchange new ideas and developments with them
0.89 0.24
I regularly interact with people outside this organisation to discuss suggestions and ideas
0.90 0.25
I am available for sharing experiences with people outside this organisation
0.81 0.22
Eigenvalue 5.05 2.16
Variance explained 31.25% 41.29%
21
Selected References (to be expanded)
Anand, N. Gardner, H.K. and Morris, T. (2007). Knowledge-based innovation: emergence and embedding of new practice areas in management consulting firms. Academy of Management Journal, Vol. 50(2), 406-428.
Carmeli, A., Gelbard, R. and Reiter-Palmon, R. (2013). Leadership, Creative problem-solving capacity, and creative performance: the importance of knowledge sharing. Human Resource Management, Vol. 52(1), 95-122.
Giannetti, C. and Madia, M. (2013). Work arrangements and firm innovation: is there any relationship?. Cambridge Journal of Economics, Vol 37, 273-297.
Lopez-Cabrales, A., Perez-Luno, A. and Valle Cabrera, R.V. (2009) Knowledge as a mediator between HRM practices and innovative activity, Human Resource Management, Vol. 48(4), 485-503.
Nonaka, I. and Toyama, R. (2005). The theory of the knowledge-creating firm: subjectivity, objectivity and leadership: a synthesis. Industrial and Corporate Change, Vol. 14, 419-436.
Reiter-Palmon, R. and Illies, J.J. (2004). Leadership and creativity: Understanding leadership from a creative problem-solving perspective. Leadership Quarterly, Vol. 15, 55-77.
Sheehan, M. (2012). Investing in management development in turbulent time and perceived organisational performance: a study of UK MNCs and their subsidiaries. The International Journal of Human Resource Management, Vol. 23(12), 2491-2513.
Shipton, H., West, M., Dawson, J., Birdi, K. and Patterson, M. (2006) HRM as a predictor of innovation. Human Resource Management Journal, Vol. 16(1), 3-27.
Teece, D.J., Pisano, G., Shuen, A. (1997). Dynamic capabilities and strategic management. Strategic Management Journal, Vol. 18(7), 509-533.

22
Endnotes i
These countries are examined because they have received the largest share of UK foreign direct investment (FDI) in the region with the exceptions of Cyprus and Malta (UNCTAD, World Investment Report, 2008). ii Subsidiary innovation intensity was determined by means of the following question: ‘What is the share
of sales stemming from innovative products in 2006-2009; and 2010-2012’.