Leaders, Followers, and the Logic of Collective Actionasu.edu/mpa/v1.pdf · sector and public...
42
Spring 2004 36 Leaders, Followers, and the Logic of Collective Action This essay attempts to formulate an economic theory of leadership. In the framework that will be developed, leadership is viewed as a relationship between leader and followers, a relationship that results in the creation of public goods. This phenomenon will be descri- bed and analyzed in several stages. First, and after a brief review of the relevant leader- ship literature, leadership will be defined in terms of public good creation, with benefits and costs of the public good noted. Then, there will be some discussion of the short and long run factors that sustain leadership, with emphasis on the central role of followership. Finally, the developed framework will be used to analyze the differences between private sector and public sector leadership. A Brief Review The assumption in this essay is that leadership is a relationship between leader and fol- lowers. In the past, many writers have commented on this connection (Kouzes & Posner, 1993; chapter 1, Gardner, 1990; chapter3, & Greenleaf, 1995) and have also noted the im- portance of followers to this relationship. Yet these same writers, as well as others, have not explored the ramifications of this phenomenon. Instead, there has been continuous discussion on the meaning of leadership, with traits, contingencies, etc., being used as de- fining variables. This has resulted in an endless series of debates about the definition of leadership and the best leadership style and whether public and private sector leadership are different. The approach taken in this paper will be decidedly different. Following Wittgenstein (1953), the view taken here is that the meaning of leadership lies in its use, or, more ap- propriately, that the essence of leadership can be found in what it produces. In taking this position, it is recognized that leaders are typically managers that work within organiza- tions. For these managers, moreover, the task is very clear. In the modern world, speciali- zation and division of labor characterize large organizations. While this is responsible for large increases in productivity and output, it does present problems of coordination. Man- agers, then, resolve the conflicts that result from this required differentiation by perform- ing tasks that integrate the various production processes. But managers only take this so far, an observation that has been made by other writers. Gardner (chapters 9 & 10) writes about fragmentation, pluralism, the common good, and "knitting together," with the presumption that it takes leaders to super integrate Leaders, Followers, and the Logic of Collective Action: Leadership as a Public Good Michael Petrowsky
Transcript of Leaders, Followers, and the Logic of Collective Actionasu.edu/mpa/v1.pdf · sector and public...
Spring 2004 36
Leaders, Followers, and the Logic of Collective Action
This essay attempts to formulate an economic theory of leadership. In the framework that will be developed, leadership is viewed as a relationship between leader and followers, a relationship that results in the creation of public goods. This phenomenon will be descri-bed and analyzed in several stages. First, and after a brief review of the relevant leader-ship literature, leadership will be defined in terms of public good creation, with benefits and costs of the public good noted. Then, there will be some discussion of the short and long run factors that sustain leadership, with emphasis on the central role of followership. Finally, the developed framework will be used to analyze the differences between private sector and public sector leadership.
A Brief ReviewThe assumption in this essay is that leadership is a relationship between leader and fol-lowers. In the past, many writers have commented on this connection (Kouzes & Posner, 1993; chapter 1, Gardner, 1990; chapter3, & Greenleaf, 1995) and have also noted the im-portance of followers to this relationship. Yet these same writers, as well as others, have not explored the ramifications of this phenomenon. Instead, there has been continuous discussion on the meaning of leadership, with traits, contingencies, etc., being used as de-fining variables. This has resulted in an endless series of debates about the definition of leadership and the best leadership style and whether public and private sector leadership are different.
The approach taken in this paper will be decidedly different. Following Wittgenstein (1953), the view taken here is that the meaning of leadership lies in its use, or, more ap-propriately, that the essence of leadership can be found in what it produces. In taking this position, it is recognized that leaders are typically managers that work within organiza-tions. For these managers, moreover, the task is very clear. In the modern world, speciali-zation and division of labor characterize large organizations. While this is responsible for large increases in productivity and output, it does present problems of coordination. Man-agers, then, resolve the conflicts that result from this required differentiation by perform-ing tasks that integrate the various production processes.
But managers only take this so far, an observation that has been made by other writers. Gardner (chapters 9 & 10) writes about fragmentation, pluralism, the common good, and "knitting together," with the presumption that it takes leaders to super integrate
Leaders, Followers, and the Logic of Collective Action:
Leadership as a Public Good
Michael Petrowsky
37 Perspectives in Public Affairs
Petrowsky
organizations within the larger community. Other writers have been even more vague in describing this super integrative function, for they have used words like visionary, far see-ing, courageous, as well as other honorific adjectives, to describe what leaders do. Schein (1985), however, gives this more explicit formulation when he argues that this knitting to-gether occurs when leaders create, change, or modify the culture within their organiza-tions in order to achieve wider goals. The leader, in this view, is thus a shaper and produc-er of organizational culture.
From this, it seems clear that leaders do something that managers do not, and that it oc-curs in a boundary specific setting. This difference, too, has even been noted and labeled as a distinction between having transactional and transformational qualities (Burns, 1978). In this framework, managers engage in transactional activities, while leaders perform more transformational tasks. Yet it is also true that this distinction has not been fully un-derstood and developed within a more comprehensive model (Van Wart, 2003). To this task we now turn.
Leadership as the Production of Public GoodsAs we have seen from the previous section, leadership is made up of several salient char-acteristics. First, it is a relational concept, for leadership must of necessity involve follow-ers as well. This means that followership is an integral part of the leadership concept, for one cannot exist without the other. Second, the leadership dynamic is usually bounded in the sense that it operates within a particular setting. While this setting could be a country, an organization (either public or private), or even a small, informal group, it is only suffi-cient to point out that boundaryless leadership is perhaps nonsensical, for leadership nor-mally seems to be organization or group specific, a quality which may change the nature of leadership if these boundaries are crossed by the leader. And, finally, leadership is made up of transactional and transformational elements, components whose interaction and integration is little understood.
Definition. We can think of an organization, or even an informal group, as a small economy which is characterized by boundaries that, while porous, clearly distinguish this economy from others in the wider milieu (Radner, 1992). But unlike a pure market econo-my, which is held together and sustained by private property and relative price allocation schemata, our internal economy is guided and coordinated by management within a clear-ly prescribed hierarchy that specifies responsibility, authority, and accountability (Coase, 1937). Both types of economies, moreover, can also be described by production functions, in which inputs (the factors of production) are linked to subsequent outputs in the form of goods and services.
But our small, internal economy (our organization or group) can also sometimes pro-duce a public good which occurs as a result of the interaction between followers (subordi-nates, underlings, acolytes, postulants, etc.,) and some managers. When this happens, these managers can properly be called leaders. Leadership, then, is a relational concept that has the capacity to produce public goods within a clearly circumscribed internal econ-omy that can be thought of as a country, an organization, a firm, or even an informal group. Seen in this light, leadership may be regarded as another, yet tentative, factor of

Spring 2004 38
Leaders, Followers, and the Logic of Collective Action
production (in addition to land, labor and capital) that may sometimes arise out of the re-lationship between managers and subordinates. And when this happens, public goods are created that can benefit the organization and perhaps those outside it.
There are several aspects of this definition that are worth exploring in detail. First, there is the nature of the public good that leadership generates. At least within the organization, the "leadership public good" (LPG) appears to share some of the nonexclusive and non ri-val characteristics that make up the public good genre (Holcombe, 1988; Nicholson, 1989).1 While this may be complicated by group boundaries, it seems clear that the bene-fits of leadership within the group structure have strong public good qualities, for nearly everyone in the organization appears to benefit when effective leadership is present.
Second, the LPG has resulted from a relational dynamic between followers and some managers. In this sense, the production of LPGs is largely independent of capital and land, making the LPG distinctively different from other public goods such as education, nation-al defense, or a park. Although capital and land are imbued with coercive qualities that a manager can use to promote leadership, the essence of leadership lies in its ability to gen-erate public goods, an ability that ultimately relies on the relational or transactional (Com-mons, 1974)2 connections between some managers and their followers. In the simplest form, there is a manager with positional authority, an authority that is limited within the boundaries of the organization. And when leadership occurs, a public good is created whose impact is largely felt within the confines of the organization.
Of course, it is a priori possible for some non-managers to achieve leadership status as well. And it is also a priori possible that this leadership could exist in a boundary less set-ting, even though you normally lead something somewhere. But for our purposes, it is easier to think of leadership as occurring between managers and subordinates when a pub-lic good is created that benefits the members of the group within the organization. These latter conditions help to ensure that the public good is easily identifiable and sustained, even though some individuals outside the organization may experience benefits from the production of the public good.
Benefits and Costs of Leadership Public Goods (LPGs). Writers that describe the bene-fits associated with LPGs frequently use such phrases as "vision," "improved employee morale," and greater teamwork.3 We can, however, break down the benefits of leadership into two main categories. First, when LPGs are produced, it results in greater trust, credi-bility, and competency in both the managers that become leaders and the followers that support them. This climate or ethos generates more effective delegation and decision making that results in (1) lower internal transaction costs and (2) greater output gains from more effective use of specialized labor (Holcombe, p.93).
1 A good is non rival (sometimes referred to as a collective consumption good) if consumption by one person does not decrease the quantity of the good available for someone else. A good is non excludable if it is difficult to prevent another person from benefiting from it.2 The unit of analysis for Commons was the transaction that involved five people.3 There are utility and production benefits associated with leadership. Improved morale can be thought of as a state in which utility functions are heightened and perhaps made interdependent. Team work occurs when marginal product functions are increased and also made more interdependent. It is presumed that the net effect of this greater organizational output (however defined) results in greater monetary and non monetary rewards for group members.

39 Perspectives in Public Affairs
Petrowsky
Second, the production of LPGs may dramatically reduce the inefficiencies (moral haz-ard, adverse selection) that are found in principal-agent relationships that make up nearly all hierarchical organizations (Radner, pp. 1404-1409). In most principal-agent models, this typically occurs by having the principal (the manager) be neutral towards risk, while the agent (the follower, the employee) be averse to risk. (As an example, an employee is given a fixed income instead of being paid on a commission basis, the hope being that the employee will take the job, be grateful and loyal, and thus be highly motivated since the risk of nonperformance is borne by the manager or company.)
If LPGs are produced, however, this dynamic may dramatically change. A truly effec-tive manager might heighten his transactional managerial skills by promoting risk through strategies that reduce risk consequences for individual employees, where risk is defined as a state of knowledge where the probability of the outcome is known (Knight, 1971; Ob-rinsky, 1983). But when LPGs are produced, this is taken a large and qualitatively differ-ent step further, for the leader transforms the principal-agent relationship by actively pro-moting uncertainty (a state of knowledge in which the probability of the outcome is not known) as a challenge that everyone in the organization should welcome and accept (Javi-dan & Waldman, 2003). Thus, the leader, by shouldering the cost of uncertainty, creates a climate that enables employees to perform in uncharted waters. In effect, the possibility of leadership public goods being produced occurs when an organization and its members both welcome and accept the challenge of uncertainty. While effective managers perform their traditional tasks by encouraging risk, it is only leaders that qualitatively move an or-ganization by the creation of public goods. And these public goods can only come about when uncertainty is welcomed and accepted. When this challenge, moreover, is accepted by the followers, the leader and his organization are said to be visionary and endowed with supernal attributes that make up much of the popular, anecdotal, literature on leader-ship (Bennis, 1989).4
But the benefits associated with the production of LPGs are not dispensed without cost. For one, there is a free rider problem. Simply put, some followers can enjoy the benefits associated with the LPG without actually paying for it in terms of providing an adequate amount of followership. This free rider problem, moreover, is heightened as the size of the group increases, resulting in a less than optimal amount of the public good being provided (Olson, 1971; pp.34-35). In effect, as the size of the group becomes larger, followers be-come more individualistic, more calculating, and less morally and emotionally involved with the group (Williamson, 1975; p.128), resulting in the leader not only having less fol-lowers, but less committed followers as well. This weakening of the leader-follower rela-tionship must of necessity reduce the amount of the LPG provided. It also means that the remaining followers must assume ever larger "followership burdens" if an adequate amount of the public good is to be maintained (Olson, p.29).
In addition to the free rider problem, it is also highly probable that the cost of providing LPGs is subject to the law of diminishing returns, meaning that marginal and average
4 Charismatic leadership typically occurs when a leader (a prophet) convinces his subordinates to accept the uncertainties of this life (including death) in exchange for a better future.

Spring 2004 40
Leaders, Followers, and the Logic of Collective Action
costs will eventually rise. Beyond a certain point (where MC=ATC), the cost of providing LPGs will soon prove burdensome to both leaders and followers, thus exacerbating the free rider problem previously noted. While the most efficient (least unit cost) amount of LPGs is not known, a similar problem (high unit cost) arises if LPGs are under produced. In this vein, it should be noted that most of the popular literature on leadership focuses on this "crisis" of leadership underproduction, while virtually ignoring the possibility that overproduction could occur just as well.5
Finally, there are costs associated with LPGs that arise from the fact that no property rights are ascribed to these public goods. In this "common pool" problem (Holcombe, pp. 76-77), we can see a variation of "The Tragedy of the Commons" (Hardin, 1968). In such a setting, overuse of the LPG is possible, meaning that some LPGs may not be pure col-lective consumption goods. At least in the short run, while my consumption of the LPG does not decrease another individual's consumption, it may, in the long run, and in the ag-gregate, reduce the quality and extent of the LPG if it is overused to such an extent that it becomes trite and meaningless. This is especially so since the LPG is based on relations between leaders and followers, that is, relations that are built on trust and credibility, and not on such factors of production as capital and land. So, if there is such a "Tragedy of Leadership" today, it may very well be the result of this overuse.
Notwithstanding the issue of overuse and under use, all of this is simply to say that the foundations of leadership occur in a hierarchical, clearly circumscribed setting that in-volves managers and subordinates. And it is from this relational milieu that we ascribe to management the transactional qualities that attempt to resolve the differentiation and inte-gration conflicts that are inherent in every modern organization that is characterized by di-vision of labor and specialization. But sometimes this relational concept becomes trans-formational, and when this happens leaders are produced that generate public goods. The production of these public goods is the distinguishing characteristic of the leader arche-type.
The Dynamics of Leadership Sustenance: A Problem of FollowershipBecause leadership is a relational concept, the would be leader must tend to the behavioral dynamics that shape and mold follower behavior. In particular, the leader must be sensi-tive to the parameters that guide followers. At a minimum, the leader must understand the free rider problem and its relationship to the size of the group. Then, too, the leader must be cognizant of the costs that are associated with providing LPGs, for these goods, like any others, are subject to rising unit costs.
This being said, the cultivation of followers must recognize that self-interest and other calculating behavior are not absent in the follower's choice. For potential followers, the choice to follow a leader will only occur when the marginal benefit of followership (MBF) exceeds the marginal cost of followership (MCF). For a follower, the benefits are both intangible (intrinsic) and tangible (extrinsic) and would range from heightened self-
5 In a competitive environment, the force of competition might reward firms that generated the optimum amount of LPGs. Where con-sumption is absent (as in the public sector), we might be more inclined to see under and over production of these goods, resulting in outcomes that are not allocatively efficient.

41 Perspectives in Public Affairs
Petrowsky
esteem and a sense of purpose to greater monetary benefits. On the cost side, this might range from a loss of freedom and autonomy to stricter accountability and higher expecta-tions for improved job performance. For the follower, then, it seems clear that choice is embedded within utility functions that go beyond the simple decision to provide labor by giving up leisure (what is sometimes called the disutility of labor.)
Given this framework, the function of the leader, in the short run, is to shift the MBF/MCF calculus so as to promote followership. In effect, this means creating condi-tions that will increase MBF (shifting the curve outward and to the right) while reducing the MCF (shifting this curve outward and to the right also) in order to increase the quanti-ty of followership. This is the first and necessary condition for the creation of additional public goods; it is what distinguishes dynamic from static leadership. As a practical mat-ter, most "how to" textbooks on leadership (Kouzes & Posner, 2002) attempt to do this, al-beit not in the framework described in this essay.
The leader can take several steps to modify this calculus in a positive (increased quanti-ty of followership) fashion. First, and as Olson has pointed out (pp. 35, 45), free rider ef-fects can be mitigated by having group members with different degrees of interest in the LPG. This means that some group members will have disproportionate followership bur-dens. On a wider level, this also means that leadership can be sustained, and the LPGs in-creased, when inequality in the followership ranks is promoted and encouraged. In a strange way, then, the advent of strong, effective leadership almost always requires a trend of inequality in followership. From this, it appears that leadership and equality are indeed antithetical in nature, creating a possible tension and clash with democratic and egalitarian values.
Inequality aside, coercion is yet another method that the leader can use (Olson, p.44; Hechter, 1987) to promote followership. Because coercion can raise the cost of not fol-lowing, it can increase the quantity of followership and so help to mitigate free rider ef-fects. For coercion to work, it need not be administered widely or even fairly to be effec-tive; in fact, the inequality of coercive dispensation may be just as effective as the inequality of reward dispensation in minimizing free rider problems. It is only necessary that the threat of coercion be visible and present for it to be effective at increasing the quantity of followership.
At least some of the foundations of leadership, then, rest on promoting inequality and on using coercion. Given this, an organizational environment characterized by strong leadership seems almost prone to create a culture in which democratic and progressive values are absent or weak. Yet this also ignores the way the leader views his position and the time dimension under which this view is formed. As McGuire and Olson (1996) have shown, leaders that feel secure in their positions, and/or have long tenure, will generally work to provide public goods that serve the entire organization. Thus, long leadership lon-gevity can help to mitigate the coercive and non-egalitarian aspects of strong leadership. The leader in this position (long tenure, or the expectation of long tenure) will, while act-ing in his self-interest, reduce the negative aspects of coercion and inequality by adopting policies that are best described as paternalistic. This "velvet glove" approach thus turns the darker side of leadership into a benevolent autocracy.
Spring 2004 42
Leaders, Followers, and the Logic of Collective Action
In doing this, the leader builds trust, credibility, dependency, and loyalty with his fol-lowers. So it is no surprise that leaders with long years of service are thought to be more effective (Ingstrup & Crookall, 1998; p.10), for the long term leader will act to shift the MBF function outward through paternalistic conduct. On a more micro level, long leader-ship tenure may thus help to merge the differences between leader and follower outcomes, thus lessening the need for coercive mechanisms (de Vries, Roe, & Taillieu, 2002).
Coercion, inequality, and tenure are variables that are independent of organization and group size. Yet organizational size is a relevant leadership factor, for it affects the distance that separates leaders from followers, even affecting such larger dynamics as organiza-tional development (Steele, 1973). While this distance could be purely physical (measured in feet), it could just as well be a social configuration, or even one based on task interac-tion frequency. However it is measured, though, it seems obvious that the leader-follower relationship is affected by distance (Antonakis & Atwater, 2002). But for our purposes, it is how the leader handles this distance that is of importance. Because the leader is striving to promote the quantity of followership, the tools that the leader uses to influence the MBF/MCF calculus may change as the leader-follower distance widens. When the dis-tance is small, the leader may encourage follower dependency by using gift, barter ex-change, peer pressure, and other highly personalized techniques; as the distance widens, however, money and formal discipline may be more frequently used (Petrowsky, 1992).
The various factors (inequality, coercion, longevity, and distance) all impact the MBF/MCF calculus. But in the long run, and as the size of the group or organization grows, free rider and rising marginal costs pose a threat to the existing leadership func-tion. Diseconomies of scale to the LPGs thus generate a serious problem for leaders of large and growing organizations. Should this occur, there are only two avenues open. First, if the existing leadership wants to sustain its transformational essence, it must then create conditions that result in "leadership economies of scale" that can stave off free rider and rising cost problems. This is only to say that the nature of the LPG must undergo dra-matic changes that create new production functions (products, services, processes, etc.) that dramatically alter the MBF-MCF calculus. Seen in this light, sustained transforma-tional leadership closely parallels Schumpeter's (1934) entrepreneur in terms of the quali-tative changes that it generates.
If transformational leadership does not occur, however, and if serious problems persist as a result of leadership decline, then the door may be open to revolutionary change. A small but determined group, independent of any free riders, may move to overthrow the leader and replace him/her with a leader that generates LPGs more in tune with the fol-lowers' calculus of benefits and costs (Hardin, 1982; Oliver & Marwell, 1988). The small group that performs this function, and the leaders that arise out of it, go beyond transfor-mational leadership, for they are imbued with revolutionary qualities (Lenin, 1969) that sets them apart from other followers. A new organization, a new country, and even a new society are thus born out of long run LPG decline.6
6 From this standpoint, the "great man" and economic determinism models of historic change thus merge into one.

43 Perspectives in Public Affairs
Petrowsky
Public (Governmental) versus Private Sector LeadershipThe analysis developed in this paper can be applied to leadership in any setting, although it is perhaps most fruitful to examine some of the differences between public and private sector leadership. As a starting point, it is postulated that the size and breadth of the LPG is what distinguishes private sector from public sector leadership. In addition, while the LPG in the public sector is more visible, it is also more fragile, tenuous, and volatile for reasons (that we previously noted) stem from the absence of competition.
But the lack of competition is not the only reason for this difference. There are other factors as well. First, there is less inequality in public sector employment in terms of sal-ary and other benefits. As we saw earlier, inequality promotes the development of LPGs because it acts to minimize free rider effects. But it is also known that civil service regula-tions tend to narrow wage and benefit differentials when compared to the private sector. Greater equality in this area would thus be likely to increase free rider effects, making it more difficult for leadership to increase followership and thus the quantity of LPGs rela-tive to the private sector.
Then, too, civil service regulations guarantee, or at least protect, employment through due process provisions that seriously weaken at will employment. This means that a top manager - a would be leader - has less means to exert coercion on marginal or wayward followers. The cost of non followership is thus lessened, decreasing the amount of follow-ership available to the leader. As a result, there is a possible diminution in the amount of the LPG provided and a related increase in the number of free riders. LPGs in the public sector, then, are probably produced in a sub-optimal amount that is far less than that found in the private sector, leaving aside the leavening absence of competition.
Leadership longevity is also another factor that impacts the quantity of followership and the magnitude of the resultant LPG. Because the tenure of public sector top management is often brief and tenuous, leaders in this environment have more of an incentive to con-duct short-term strategies that promote their narrow self-interest. This means that these leaders will attempt to use their office in ways that probably maximize their personal goals to the detriment of followers. In this setting, the accompanying cynicism on the part of followers would reduce the quantity of followership and the subsequent amount of LPGs. Then, too, followers will rationally expect that the short term leader's coercive powers would be limited because it takes time to terminate employment in a civil service organization. Thus, the weakening of this coercive power would also reduce followership and the LPG quantity.
As was previously pointed out, group size increases the free rider phenomenon. While private sector organizations can be just as large as their private sector counterparts, it seems likely that public sector organizations have a larger number and variety of stake-holders that are in and outside of the organization's boundaries. This complexity probably increases free rider effects, making followership more difficult to obtain. In addition, some governmental activities, such as regulations, have coercive outcomes that can turn some outside stakeholders into adversaries. These "anti-followers" can seriously weaken the leader-follower relationship, thus generating a less than optimal amount of LPGs.
This last point highlights the importance of boundaries to the success of leadership and

Spring 2004 44
Leaders, Followers, and the Logic of Collective Action
to the creation of LPGs. In the public sector, the boundaries of the organization are more permeable. The distinction between "we" and "they" is more diffuse (government belongs to everyone), creating LPG spillovers that go outside the agency's boundaries. To the ex-tent that this happens, LPGs become generalized, making it more difficult for organiza-tion-specific followers to see any direct benefits of the LPG to them. One consequence of this is that the MBF curve will shift leftward, the shift amount depending on just how dif-fuse the boundaries are in the public sector organization. This will of necessity reduce the amount of followership, creating a sub optimal amount of the LPG greater than what we would find in the private sector where private property rights circumscribe the firm's boundaries.
Boundaries and private property rights are thus closely related in terms of followership and leadership public goods, which brings us back to the tragedy of the commons. In ef-fect, the lack of clearly defined boundaries may also exacerbate the common pool prob-lem previously discussed, creating conditions in which the small (less than optimal) amount of the LPG is overused in and outside the organization. In more vernacular terms, conditions are generated in which public sector leadership promises too much and deliv-ers too little. The paradox of public sector leadership is thus an enigma built on permeable boundaries and poorly defined property rights.
In summary, and for these reasons, and perhaps others, the relationship between leaders and followers in the public sector is weaker and less certain. The provision of LPGs is thus less than optimal and probably more erratic, ebbing with the currents in the political fabric. The challenge for public sector leadership is to recognize these constraints and to develop new institutions that will allow the relational aspects of leadership to grow and prosper. If this were to occur, we might just witness a flowering of leadership public goods that would dramatically alter the way we view the governmental sector.
ConclusionThis essay has examined leadership as a phenomenon that occurs as a result of a relation-ship between subordinates and managers, a relationship that generates "public goods" that are largely experienced within the organization's boundaries. In using this analysis, an at-tempt has been made to provide a framework that reveals the differences between leaders and managers, between transactional and transformational behavior, and between public and private sector leadership. The framework has also been used to show the benefits and costs of providing leadership public goods as well as the difficulties and challenges that face all leaders. Short and long run considerations have also been discussed within this framework, with the latter time horizon being seen as the avenue through which sustained transformational leadership and even revolutionary change is exhibited.
From this, a number of promising conclusions can be drawn. First, the transactional - transformational distinction may be operationalized by using risk and uncertainty varia-bles. Second, because the distinguishing characteristic of leadership is its ability to gener-ate public goods, the presence or absence of these goods will necessarily define the pres-ence or absence of leadership. This means that leadership research might usefully focus on the output side of leadership instead of such customary inputs as traits and other

45 Perspectives in Public Affairs
Petrowsky
antecedent variables. Third, the short run tactical strategy for a leader is to increase fol-lowership, so popular "how to" books might be more productive if they moved in the di-rection along some of the lines (inequality, coercion, longevity) indicated in this essay. And, finally, the sustained long-term provision of leadership public goods may require Schumpeterian entrepreneurs, so a merging of leadership and entrepreneurial research seems in order.
ReferencesAntonakis, J., & Atwater, L. (2002). Leader distance: A review and a proposed theory. Leadership Quarter-
ly, 13 (6), 673-704.Bennis, W. (1989). On Becoming a Leader. Cambridge, Mass: Perseus Books.Burns, J.M. (1978). Leadership. New York: Harper and Row.Coase, R.H. (1937). The nature of the firm. Economica, 4, 386-405. Commons, J.R. (1924). Legal Foundations of Capitalism. Chapter 4. Reprinted 1974. Clifton, NJ: Augustus
M. Kelley.dVries, R.E., Roe, R.A., & Taillieu, T. (2002). Need for leadership as a moderator of the relationships be-
tween leadership and individual outcomes. Leadership Quarterly, 13 (2), 121-137.Gardner, J.W. (1990). On Leadership. New York: The Free Press.Greenleaf, R. (1995). Servant leadership. Taken from The Leaders Companion, 18-23. J. Wren, ed. New
York: The Free Press.Hardin, G. (1968). The tragedy of the commons. Science, 162, 1243-48.Hardin, R. (1982). Collective Action. Baltimore: John Hopkins University Press.Hechter, M. (1987). Principles of Group Solidarity. Berkeley: University of California Press.Holcombe, R. (1988). Public Sector Economics. Chapter 3. Belmont, CA: Wadsworth.Ingstrup, O., & Crookall, P. (1998). The Three Pillars of Public Management. Montreal: McGill-Queens
University Press. Javidan, M. & Waldman, D.A. (2003). Exploring charismatic leadership in the public sector: measurement
and consequences. Public Administration Review, 63 (2), 229-242.Knight, F. (1971). Risk, Uncertainty, and Profit. Chicago: University of Chicago Press.Kouzes, J.M., & Posner, B.Z. (1993). Credibility. San Francisco: CA: Jossey-Bass.Kouzes, J.M., & Posner, B.Z. (2002). The Leadership Challenge. Third Edition. San Francisco, CA: Jossey-
Bass.Lenin, V.I. (1969). What Is To Be Done? New York: International Publishers.McGuire, M. & Olson, M. (1996). The economics of autocracy and majority rule: The invisible hand and
the use of force. Journal of Economic Literature, 34, 72-96.Nicholson, W. (1989). Microeconomic Theory. Chapter 4. New York: The Dryden Press.Obrinsky, M. (1983). Profit Theory & Capitalism. Chapter 6. Philadelphia, PA: University of Pennsylvania
Press.Oliver. P.E., & Marwell, G. (1988). The paradox of group size in collective action: A theory of the critical
mass. American Sociology Review, 53 (1), 1-18.Olson, M. (1971). The Logic of Collective Action. Cambridge, Mass: Harvard University Press.Petrowsky, M. (1992). The Boundaries of the Firm: An Anthropological View. Unpublished paper.Radner, R. (1992). Hierarchy: The economics of managing. Journal of Economic Literature, 30, 1382-1415.Schein, E.H. (1985). Organizational Culture and Leadership. San Francisco, CA: Jossey-Bass.Schumpeter, J. (1934). The Theory of Economic Development. Chapter 4. London: Oxford University Press.Steele, F. (1973). Physical Settings and Organization Development. Reading, Mass: Addison-Wesley.Van Wart, M. (2003). Public sector leadership theory: An assessment. Public Administration Review, 63 (2),
214-228. Williamson, O.E. (1975). Markets and Hierarchies. New York: The Free Press.Wittgenstein, L. (1953). Philosophical Investigations. Oxford: B. Blackwell.

Spring 2004 18
The Causes of Poverty - Cultural vs. Structural
There are many competing theories about the causes of poverty in the United States with mountains of empirical evidence to justify support for each. The debate among theorists and policymakers is primarily divided between advocates who support cultural/behavioral arguments and those who support structural/economic arguments. This debate tends to manifest itself across political party lines with republicans supporting the cultural/behav-ioral thesis and democrats looking more to structural causes. The passage of the "behavioral" focused Personal Responsibility and Work Opportunity Reconciliation Act (1996) and its possible strengthening by the Bush Administration and its congressional al-lies calls for further examination of the relationship between cultural/behavioral and struc-tural causes of poverty. This paper will briefly examine the theoretical arguments behind these competing views followed by an analysis to determine the empirical relevancy of each. It should be noted that the exploration of this topic began with the intention of making an argument for the fusion of these perspectives into a single empirically validat-ed theory; one that would build upon Orlando Patterson's (2000) theoretical model on the interaction between cultural models, structural environments and behavioral outcomes.
In close similarity to Patterson (2000), my thesis is that cultural and/or behavioral varia-bles are only relevant to the degree that historical structural factors condition the environ-ment in which groups of varying economic and social advantage operate in and react to. More specifically, behavioral variables (e.g., teen pregnancy, divorce, crime) should not merely be viewed as static behavioral dysfunctions exclusive to certain groups, but as proxies for cultural mechanisms that are always at play in all social groups and in all con-texts. These two perspectives should not be viewed as dichotomous, but interrelated and more or less relatively valid depending on the context. While Patterson argues for a dy-namic integration of variables (a position I agree with), the ordinary least squares (OLS) analyses can at best reveal the relative relationships of the various independent variables to poverty; the results of which may provide a useful framework for a truly integrated and multiplicative model or perhaps a two-stage model with structural level variables condi-tioning the environment in which cultural/behavioral adaptations develop. However, the empirical tests that will be reviewed shortly demonstrate little support for the inclusion of cultural/behavioral variable into a larger structural model, but this failure is not without caveats. Based on several time series regression models using aggregated national level data for the years 1947 through 2002, an integrated model could not be constructed using
The Causes of PovertyCultural vs. Structural:Can There Be a Synthesis?
Gregory Jordan

19 Perspectives in Public Affairs
Jordan
the selected behavioral/cultural variables and structural variables. Only annual changes in the structural variables were found to have any significant correlation with change in pov-erty.
A Culture of Poverty?Culture tends to be the explanatory variable that theorists and policymakers look to last when attempting to explain social dysfunction, particularly due to the sometimes visible connection between culture and race (Glazer, 2000). This may be why cultural arguments waned from the discussion and why some theorists and policymakers came to link pover-ty to behavior (Mead, 1997; 1986), or to rational calculation (Murray 1984). These schol-ars argue that poverty is largely the result of social and behavioral deficiencies in individ-uals that ostensibly make them less economically viable within conventional society. However, due to persistence of poverty in certain areas, the behavioral perspective is rein-forced by the culture of poverty thesis, which suggests that individuals create, sustain, and transmit to future generations a culture that reinforces the various social and behavioral deficiencies (Rodgers, 2000). A corollary to this perspective suggests that government policy, that is, welfare in the form of cash assistance to able bodied/minded adults, over the last forty years has created a culture of dependence on government aid, perpetuates poverty, and contributes to a variety of other socials ills including rising rates of divorce (Murray, 1984).
The "culture of poverty" thesis, which emanated from the anthropological arguments of Oscar Lewis (1970), later came to be erroneously associated with laying blame for pover-ty either on the poor themselves or on a government that keeps them dependent (Patterson 2000). Along these lines, it is the deficient character of the poor along with their deviant behavior and the resultant self-reinforcing environment that restrict their access to eco-nomic viability and success. Rising rates of divorce, female headed single parent fami-lies, teen pregnancy, drug/alcohol misuse, and criminal activity are said to reflect these dysfunctional attitudes and values, relative to mainstream society, about family, education and work. These attitudes are passed onto subsequent generations leading to a vicious cy-cle of poverty from which few escape (Rodgers, 2000). Patterson (1994) traces the trajec-tory of the culture thesis from one based primarily in nuanced sociological and anthropo-logical arguments to a more stereotypical and simplistic version. Regarding the former, Patterson (1994) quotes sociologist Herbert Gans' mid 1960s argument that the poor were "an economically and politically deprived population whose behavior, values - and path-ologies - are adaptations to their existential situation, just as the behavior, values, and pathologies of the affluent are adaptations to their existential situation" (p. 116). Gans' view demonstrates a dynamic interaction between culture, environment and behavior.
The "culture of poverty" perspective must draw its relevance from cultural anthropolo-gy. The noted anthropologist Oscar Lewis wrote in 1961 that poverty was "an adaptation to a set of objective conditions of the larger society, [but] once it comes into existence, it tends to perpetuate itself from generation to generation because of its effect on children" (Patterson 1994, p. 119). While Lewis argued that poverty was culturally self-reinforcing, its incidence was directly connected to "structural conditions in society" (Massey and

Spring 2004 20
The Causes of Poverty - Cultural vs. Structural
Denton, 1993, p.5). This important point became lost as Americans internalized the view of poverty as expressed by a 1964 edition of the Saturday Evening Post which suggested the cause of poverty was in fact purely behavioral dysfunction transmitted between gener-ations (Patterson, 1994).
Daniel Patrick Moynihan's landmark report, The Negro Family: The Case for National Action (1965), somewhat unintentionally contributed to the renewed, if misunderstood, relevance of cultural causes among conservative theorists and policymakers. Moynihan investigated the families of poor urban blacks and concluded that the disintegration of many of these families could be traced to their matriarchal character1, a situation that stood in contrast to the patriarchal character of the larger society. The cognitive disso-nance this created for black males contributed to the dysfunctional behaviors that rein-forced their own condition. Since the Great Depression and prior to the 1960s, policy-makers and social scientists tended to think that poverty was primarily caused by economic conditions. While controversial, "the Moynihan Report", which called for poli-cies that improved the condition of the black family, contributed to a gradual resurgence of behavioral arguments. However, Washington at the time was dominated by the liberal side of the aisle, and, Moynihan's recommendations were effectively ignored during the design of the Great Society programs as funding was channeled to cash assistance instead of strengthening families. Conservative scholars would later argue that cash assistance added fuel to the fire of family disintegration by creating disincentives to marry and work.
The cultural/behavioral interpretation, which many argue found empirical support in "the Moynihan Report", saw its influence grow during the thirty years that preceded wel-fare reform in 1996. This view is well articulated by Myron Magnet (1993), in The Dream and the Nightmare, in which Myron argues that poverty comes from " a destitution of the soul, a failure to develop the habits of education, reasoning, judgment, sacrifice, and hard work required to succeed in the world" (Rodgers 2000 p. 69). In Losing Ground, Charles Murray (1984) suggests that just when tremendous improvements were being made in reducing poverty - though largely due to the post-war economic boom - the wel-fare system was then dramatically expanded under President Johnson's administration and led to welfare dependence and family disintegration instead of real poverty reduction. Murray does not necessarily view the poor as behaviorally or morally deficient, but rather as rational actors; cash assistance creates a disincentive to engage in the private economy, serving only to create dependency and enabling the "destitution of the soul". Lawrence Mead (1986) argues that the welfare system is too permissive and does not expect enough out its beneficiaries; the permissiveness allows people to take advantage of the system and poisons their notions of self-sufficiency and citizenship. These conservative theorists tend to think that full exposure to the realities of the economic market is the best cure to a poverty problem that many today see as caused by the welfare system. What is more, Murray and Mead argue that the welfare system contributes to family disintegration by creating incentives for single mothers to remain single or even divorce. Ellwood & Sum-mers (1986) argue that this relationship is minimal at best suggesting that other cultural forces external to the welfare system are more relevant.
1 Also see Patterson (2000) for discussion on sources of matriarchy.
21 Perspectives in Public Affairs
Jordan
This cultural/behavioral perspective remains controversial within academic circles, yet the "blaming the victim" mentality seems to retain a significant hold on Americans' per-ceptions of the causes of poverty and the government's level of responsibility. In a 1994 poll by Times Mirror, 63 percent of respondents stated that welfare spending should be cut (Gilens, 1999). Similarly, a poll taken by the General Social Survey, also in 1994, showed that 71 percent of respondents believed that the number of people on welfare should be cut (Gilens, 1999). These statistics stand in contrast to data that demonstrate higher support for social programs such as education, healthcare, and child care (Gilens, 1999). The durability of the negative perception of "welfare" may be due to its manipula-tion by politicians as a means to limit the publics' position on the degree of government responsibility (Patterson 2000), and consequently public funding for progressive anti-pov-erty programs. Presumably, a more conservative government would lower funding for so-cial programs, particularly programs that provide assistance to people who should be ex-pected to assist themselves. If one accepts the arguments offered by Murray or Mead, and welfare is indeed part of the problem, then logically, the poverty rate should be positively correlated with the level of government assistance. Moreover, if conservative interpreta-tions retain any validity, then the degree of republican control over the executive and leg-islative branches should correlate inversely with measures of poverty. These relationships will be tested shortly. In the meantime, I argue that the popular "culture of poverty" argu-ment is mainly a political one. The role of culture as it relates to poverty must be under-stood in the context of cultural processes or mechanisms.
According to Orlando Patterson (2000), culture in general should be understood as "a repertoire of socially transmitted and intra-generationally generated ideas about how to live and make judgments, both in general terms and in regard to specific domains of life" (p. 208). Furthermore, Patterson argues that these "ideas" about life and living interact dynamically with structural factors and condition behavioral outcomes. Patterson devel-ops a useful abstract model of these relationships and illustrates it using an example from African-American history.2
The relevant question is to what degree can cultural variables (i.e., cultural mecha-nisms) be quantified in a way that engages the structural forces at play and demonstrates the interactive nature of these perspectives. In this sense, a cultural mechanism refers to the process by which a group of similarly oriented people (either through ethnicity, loca-tion, or class) will develop shared behaviors or values based on their common experience of the environment they inhabit. These groups will naturally develop attitudes and behav-iors that serve as methods of adaptation, or maladaptation, which are conditioned by the environment (Edgerton 2000). In short, while behavior is an outcome of this integrative process, it is the array of constraints and opportunities that set the environment, and these constraints and opportunities are subject to manipulation through public policy. This pa-per represents a limited attempt to uncover the relationships between these perspectives as well as to suggest that the interactive process between culture processes, the structural
2 Patterson (2000) suggests that the present generation of African-Americans inherited a cultural model that encompasses the cultural traits of pre-slavery West Africans and transmutes those values through the experiences associated with slavery in America and in sub-sequent eras. See p. 211.
Spring 2004 22
The Causes of Poverty - Cultural vs. Structural
environment, and behavioral outcomes works to sustain poverty among the poor much as it works to sustain affluence among the rich.
Structural Causes of PovertySupporters of the "structural" school of thought argue that most poverty can be traced back to structural factors inherent to either the economy and/or to several interrelated in-stitutional environments that serve to favor certain groups over others, generally based on gender, class, or race. Of the various institutional environments that tend to sustain a mul-titude of economic barriers to different groups, it is discrimination based on race and gen-der that create the most insidious obstructions. The disproportionately high rate of pover-ty among women may be viewed as the consequence of a patriarchal society that continues to resist their inclusion in a part of society that has been historically dominated by men, and as a consequence, welfare programs have been designed in ways that stigma-tize public support for women as opposed to marital support; both arrangements tend to reinforce patriarchy (Abramovitz, 1996). In this regard, the rise in poverty among women is an important structural level variable to consider, but the lack of reliable data going back to 1947 makes testing difficult.
It is to race that I will turn now, particularly discrimination against Blacks, as a com-plete data set going back to 1947 is available. Evidence of the economic disparities caused by historical and contemporary racial discrimination against blacks is seen clearly when one views the data on white and black median income. In 1947, the percent of black median income relative to white median income was 51 percent. In 2002, the figure had risen to only 62 percent (U.S. Census, 2002). In 2000, 35.5% of Black single parent families were considered low-income while Blacks represented only 12.1% of the general population in that year (IWPR 2003). Given the over-representation of black Americans among the poor, it stands to reason that closing the gap between black and white median income by working to end racism and discrimination will have positive affects on poverty. Massey and Denton (1993) argue that institutional racism in general, and residential seg-regation in particular, is a critical structural level cause of the severe poverty in the black community. However, they contend that as segregation took hold, the black communities in the inner cities reacted by creating an "oppositional culture that devalues work, school-ing, and marriage and stresses attitudes and behaviors that are antithetical and often hos-tile to success in the larger economy" (p. 8). Wilson (1987) would tend to agree that an "oppositional culture" exists, but takes the analysis a step beyond segregation, citing "social isolation" as the primary culprit. Wilson argues that historical racism against Black Americans erected contemporary barriers to their economic success; their predica-ment is compounded by factors uniquely associated with American capitalism and de-mography. For example, as most White and a few middle class Blacks followed jobs from the cities to the suburbs, the people left behind were relatively uneducated, unskilled and lacked the kind of mainstream role models that would have helped them to transition to the middle class. As a result, they suffered disproportionately from urban unemploy-ment, low wages, unequal distribution of wealth and resources, and relatively poor social and educational services. Wilson argues that the "social isolation" of inner-city and rural

23 Perspectives in Public Affairs
Jordan
poor populations creates a self-reinforcing and dichotomous situation between the urban poor and the affluent suburban middle class. Specifically, without mainstream role mod-els, the urban poor in general, and inner-city Black populations in particular, develop de-viant behaviors and coping mechanisms that are due in part to their isolation, but may also be thought of as a kind of rebellion to mainstream culture.
This view is in part analogous to "spatial mismatch" theory, which generally hypothe-sizes that the location and relative access to jobs of the disadvantaged group is more oper-able than race per se. In a comprehensive literature review, Holzer (1990) concludes that "spatial mismatch has a significant effect on Black employment" and is primarily due to the low availability of well-paying jobs in the inner-city; a situation brought on by job de-centralization and increasing commute times to distant jobs (p. 118). However, Holzer suggests that the root cause of higher unemployment among inner-city Blacks may not be clearly distinguishable between "...the characteristics of the people who reside in each place as opposed to the problems created by location per se..." (p. 118).
Based on interviews with Chicago areas employers, Kirschenman & Neckerman (1991) demonstrate that preconceived notions based on race, class and even address are often ap-plied to prospective employees. Specifically, the employers' perception of a prospective employee's productivity was often affected by the applicant's race. For example, 37.7 per-cent of employers ranked Blacks last in relation to other races (p. 210). Clearly, the racial prejudice that underlies this statistic not only emanates from institutional racism, but rein-forces it, thus sustaining the barriers that bar Black and other non-White Americans from shedding the arguably idiosyncratic cultural adaptations they have made to survive in a system that has been historically stacked against them. In contrast to the negative percep-tions displayed by Kirschenman and Neckerman's employers, DiIulio (1989) points out that there is little research to suggest that the extreme poor have views on work and fami-ly that are much different than the general population, but that small sub-groups within the urban underclass do much of the damage to the environment and broader public per-ception, mainly through criminal activity (p. 32). DiIilio argues that the majority of the poor are hardworking well intentioned people whose potential for positive actions are se-verely constrained by fear of their surroundings and the social stigma that emanates from it.
Structural economic factors include the level and variation in unemployment, median income, and measures of income inequality. The effects of unemployment and rises in median income are well documented and their relationship to poverty is intuitive. The rate of poverty tracks very closely with median income and in general, rises in median in-come has positive benefits for all classes, including the poor (Hines, Hoynes & Krueger 2001). Over the last half century, as median income has risen, the rate of poverty has de-creased in close correlation (Ellwood & Summers, 1986). This relationship lends credi-bility to the argument that work is the best mechanism for lifting people out of poverty. Indeed, one of the clearest strategies for fighting poverty should be to focus on ensuring a strong and growing economy. However, for individuals to take full advantage of a strong and changing economy, they need education. Rises in income are positively correlated with educational attainment (US Census). Yet education is not equally accessible by all
Spring 2004 24
The Causes of Poverty - Cultural vs. Structural
members of the population. Since property taxes represent the largest share of local school funding, the quality of education will necessarily vary relative the economic wealth of the locality. Federal and State funding represent smaller shares and are meant to level the playing fields somewhat, but they do not. It is education that allows people to adapt to changes in the economy and by extension changes in the demand for labor. Dur-ing the latter half of the 20th Century, the American economy shifted from one based on manufacturing to one based on services. The gains in wages and working conditions that were made in the manufacturing sector have been weakened by the service economy. For example, Wal-Mart offers its employees one of the weakest wage/benefits packages of any corporation of its kind and continues to fend off unionization (Ehrenreich, 2001); it is now one the most powerful corporations with a huge market share and monopsony power over its suppliers (Jones, 2003). The gains in US GDP are in part due to the success of a consumer economy that rewards Wal-Mart and its cousin conglomerates, but at what cost to the Americans working low wage/benefit jobs?
A related shift in the American economy involves the growing demand for personnel trained in various high-end and relatively well paid disciplines such as information tech-nology and finance (Holzer 1990, Wilson 1987). In short the service sector has split into two halves, low- income service workers and high- income service workers, with little op-portunity in between. Indeed, income inequality is an important indicator in its own right, but is better understood with reference to its own causes, which Gottschalk & Smeeding (1997) argue include the erosion of the "real" minimum wage, the declining influence of unions, and changes in the market demand for skilled labor versus unskilled labor. The Gini index, which measures income inequality, provides quantitative evidence for this di-vergence. According to the US Census (2003), the Gini index continues its upward trend, which confirms that the rich are in fact getting richer while the poor are getting poorer. Welfare opponents routinely argue that employment is the best cure for poverty, and while higher employment is correlated with lower poverty, the low wage service sector is doing little to help the poor escape poverty; it is, in fact, growing the number of "near poor".
The barriers created by these trends are difficult for the poor to overcome. How is the poor parent supposed to take care of his/her family based on a near minimum wage job with poor and/or expensive health coverage and child care? A publication by the Institute of Women's Policy Research demonstrates that many among the poor rely on several sour-ces of income in order to get by, including government assistance, income from other family members, child support, and job income (Hartmann et al., 2003). These multiple sources of income along with the stresses inherent to the pursuit of each would not be as needed if sufficient employment were available for livable wages and benefits.
Political FactorsPresumably, republicans tend to harbor ideals that favor business over the working class, at least in terms of public policy; a more sophisticated description would be that republi-cans believe that government interference in the economy ultimately hurts more citizens than it helps by creating inefficient markets and impeding productivity. Historically, re-publicans have sought to curb domestic spending, particularly social spending, based on
25 Perspectives in Public Affairs
Jordan
the ideals of individualism, limited government, and Laissez Faire economics. The con-servative position that one's poverty is the sole responsibility of the individual and that cash assistance creates dependence by shielding recipients from the market and prevents functional adaptation to market conditions reflects these ideals.
The economic system of capitalism depends upon a labor surplus so that laborers are forced to compete for positions; a situation that fosters a continuous evolution of skills and productivity, but also keeps wages low. The republican position is in some ways a contradiction: welfare is a cause of poverty, yet the current breed of American capitalism depends to some extent on the existence of a lower class. The mediating variable, or per-haps ideal, would seem to be equal opportunity for all citizens, but equal opportunity does not exist for all citizens as the preceding discussions on gender, race, employment trends, income and education suggest. If republican ideals on the benevolence of the free market and the perfectly diffuse presence of equal opportunity are correct, then their policies should be associated with reductions in poverty. However, this analysis will demonstrate that variation in republican power over the last half century is directly related to variation in the rate of poverty.
The Strange Role of Imprisonment in the United StatesThe rising prison population in this country has received scant attention in relation to the poverty discussion. According to the Bureau of Justice Statistics (BJS), the crime rate be-gan to rise at increasingly larger rates during the 1960s while the United States' prison population remained relatively constant from 1947 until the 1970s. If one were to exam-ine these trends graphically, one might conclude that the rise in prison population after the 1970s was the direct result of the rise in crime. But how does one account for the contin-ued expansion of the prison population while the crime rate has declined sharply over the last ten years? On the surface, the answer would seem to be that criminals, particularly drug related offenders (Irvine and Xu, 2003) were receiving more and longer prison terms, thus removing repeat offenders from the streets. However, research suggests that the correlation between crime and imprisonment is tenuous at best. Jacobs and Helms (2001) concluded that the dramatic increase in imprisonment is not matched by changes in the crime rate. In their comprehensive literature review, Chiricos and Delone (1992) found, "…a direct and substantial labor surplus-punishment link that is independent of the mediating influence of criminal behavior" (p. 429). Wilkins (1991) questions the role of crime in the rate of imprisonment. "The amount of crime is not controlled by the machi-nery of government - government agencies control only the definition of crime and the style and amount of its punishment" (p.96). Such assessments are not merely the product of a fixed or even variable degree of societal morality. Such categorizations are in part the product of the applicable economic system. Georg Rusche and Otto Kirchheimer (1939) did the first serious work on the connection between labor surplus and imprison-ment. Their conclusion, albeit without empirical support, was that punishment in general, and imprisonment in particular evolved along with changing economic systems. Their thesis is clearly based in Marxist thought and fueled half a century of debate over whether or not the United States' rising prison population was part of an effort to institutionalize

Spring 2004 26
The Causes of Poverty - Cultural vs. Structural
the surplus or unemployable population in order to control inflation by keeping unem-ployment relatively low, as well as a method of controlling the underclass in lieu of in-creasing economic inequality. In this vein, one might think that rises in prison population would lower official poverty levels. In this analysis, prison population is shown to be rel-evant, but as a positive correlate to poverty and supports recent work by Irvine and Xu (2003), who conclude that "the introduction of the incarcerated population into poverty measurement increases the intensity of poverty by between 9% and 15% in 1997 over and above the value obtained when the non-incarcerated population alone is considered" (p. 3). Irvine and Xu's conclusion is based on the argument that the incarcerated population should be included in the official poverty estimate as the income and consumption of this subgroup - excluding the cost of incarceration - clearly puts it below the official poverty line. However, this does not explain why variation in the prison population would corre-late with poverty among the non-incarcerated population. This raises an important ques-tion; to what relative degrees does the increase in the US's prison population reflect re-sponses to crime alone or a more concerted effort to institutionalize the part of the population most likely to need welfare assistance and/or perhaps create social instability as was the case during the urban riots of the sixties and seventies.
Can There Be A Synthesis?This analysis aims to establish empirically the extent to which these competing perspec-tives can be shown as interrelated in their impact on poverty. In short, I argue that the ex-planatory power of cultural variables should be viewed in terms of cultural mechanisms, not in terms of deficient values and behaviors that remain static. Furthermore, the degree to which cultural mechanisms are operable is only relevant within the context of the his-torical structural factors that condition the environment in which groups of varying eco-nomic and social advantage live within.
Cultures are not created in vacuums. The American political culture, which values indi-vidualism, liberty and strives for equal opportunity was not created intact and handed to the founding men and women. The success of the Republic is based upon these particular aspects of culture, but these values were forged within larger environmental contexts. In-dividualism has it roots in Protestantism3, but the vastness and isolation of the American frontier from the 16th through the 19th century provided one of several environmental paradigms for that particular value to flourish into a founding principle of the United States' political and economic systems. More recently, in Making Democracy Work, Rob-ert Putnam (1993) demonstrates how cultural factors and institutions interrelate. Putnam argues that divergent cultural factors inherent to the northern and southern regions of Italy led to disparate levels social capital and by extension economic and political success.4 Similarly, any theory on the causes of poverty that includes cultural variables must also include the relevant structural contexts.
3 For a discussion of the religious foundations of individualism and capitalism review the still much debated Protestant Ethic and the Spirit of Capitalism by Max Weber (1905).4 The concept of "social capital" encapsulates high levels of trust, associational activity and reciprocity, and purportedly leads to higher political participation and institutional performance as well as greater economic success by the reduction of transaction costs. See Robert Putnam's Making Democracy Work (1993) or Trust by Francis Fukuyama (1995).

27 Perspectives in Public Affairs
Jordan
In an essay on the microeconomics of cross-national prosperity, Michael Porter (2000) makes the following relevant observation: "The question is not whether culture has a role but how to understand this role in the context of the broader determinants of prosperity (p. 14). What is more, "The way people behave in a society has much to do with the signals and incentives that are created in the economic system in which they live" (p. 23). Porter then makes reference to the common quip that workers in developing nations have a poor work ethic, a claim that Kirschenman & Neckerman (1991) revealed in reference to Chi-cago employers' view of urban Black workers; but then asks whether or not there is any reward for hard work within the existent system. In an economic system where poor workers or welfare recipients who are raised in a system in which equal access to the tools of success, namely education and other support services, is not assured, near poverty level wages may be the best one perceives as achievable. As individuals become more eco-nomically constrained, their perspective on the choices before them will narrow and their behavior will adapt accordingly; thus their children inherit a world view that conditions their own behavior.
MeasurementAggregated national data for the United States between 1947 and 2002 will be the sole fo-cus of this analysis. Table 1 lists the variables tested in this analysis as well as descriptive statistics.
Table 1 - Variable Names, Definitions and Descriptive StatisticsDefinitions Minimum Maximum Mean
Number of poor families per 100,000 2,274 6,498 3,548
Number of unemployed per 100,000 1,145 4,609 2,502 National family median income 19,584 52,148 37,675 Ratio of black family income to white family income 0.51 0.64 0.57 Income inequality 0.35 0.44 0.38 Per capita gross domestic product 10,374 32,736 20,082 Number of pisoners per 100,000 * 93 474 196
Republican control over executive & legislative branches 0.32 1.49 0.98
Number of divorces per 100,000 210 529 373 Number of crimes per 100,000 ** 1,150 5,901 3,752 Number of live births per 100,000 *** 150 332 257 Total direct payments to individuals as percent of GDP 0.020 0.100 0.069 Number of poor families with female head per 100,000 874 2,768 1,511
Notes:All data series that are standardized for population are based on total US populationSources:
i US Bureau of the Cenusii US Bureau of Justice Statisticsiii Uniform Crime Reportsiv US Bureau of Labor Statisticsv Centers for Disease Control vi Office of Management and Budget vii US House of Representatives and US Senate
viii US Bureau of Economic Analysis* Prisoners per 100,000 reflects prison system only
** Property and Violent Crime*** Live births to mothers under the age of 19
Name
Structral/Economic
Poverty*Dependent Variable
GINI Index (i)Black/White Median Income Ratio (i)Median Income (i)Unemployment (i)
Prison Population (ii) (iii)Per Capita Gross Domestic Product (viii)
Divorce (i) (v)Cultural
Republican Control Index (vii)Political
Female Poverty (i)Federal Payments to Individuals (vi)Births to Teenage Mother (v)Crime (ii) (iii)

Spring 2004 28
The Causes of Poverty - Cultural vs. Structural
The dependent variable in this analysis is number of poor families per 100,000 (US population). Wherever possible, data series have been converted to rates per 100,000 to ensure greater comparability. Since the regression analyses will focus on time series data, serial autocorrelation is a risk; to mitigate, all variables were first order differenced5; thus the analyses will test all relationships in terms of annual change rather than annual level.
The structural level independent variables tested include prison population, median in-come, the gap between black median income and white median income, the Gini index, unemployment, and the degree of republican control.6 Viewing prison population as a structural level variable may be subject to debate; however, for this analysis, it shall serve as a proxy for shifts in economic and social management that are designed to positively affect economic performance. As noted, the gap in median income between Blacks and Whites will serve as a proxy for institutional racism. Median income, unemployment and the Gini index are well documented correlates with poverty and need to be included to en-sure a complete model. On theoretical grounds, the index used to assess the degree of re-public control (RCI) may not be operable in terms of annual change. However, the analy-sis will show that the RCI is valid and significant while the relationship to annual absolute values was not significant. Furthermore, a graphical comparison of the standardized scores for annual change in the RCI and number of families in poverty per one hundred thousand illustrates similar trends over time.
Behavioral/cultural theorists point to various social pathologies that the poor engage in and which cause and reinforce their condition. Among these pathologies are criminal ac-tivity, teenage pregnancy (proxy for sexual activity among teenagers), and the rate of di-vorce, which conservative theorists suggest contributes to a break down of the traditional family. In reference to the teen pregnancy and divorce variables, some conservative theo-rists allege that the permissiveness of society, particularly regarding sex, has led to a deg-radation of values among the poor which in turn leads to teen pregnancy and children born out of wedlock, which in turn forces mothers to leave the educational system and work low wage jobs or receive welfare to care for the family (Rodgers, 2000; Tanner, 2003). While Tanner (2003) states that there is considerable empirical support linking in-creases in welfare spending to out of wedlock births, auxiliary analyses of the data used for this paper suggest that spending on welfare has no significant role in, or correlation with, teen pregnancy.7 However, a significant although minimal relationship was estab-lished with divorce as the dependent variable.8 If the "culture of poverty" theory retains
5 Durbin-Watson statistic equaled 1.913 on model five where variables were first order differenced indicating that serial autocorrela-tion was largely mitigated. 6 The degree of Republican control at the national level was assessed in several ways. A dummy code of 1 was assigned to the pres-ence of a Republican President, while the percent of republican control of the US Congress was assessed separately. Additionally, an index was created that simultaneously assessed the relative strength of the Republican Party as exhibited through the Presidency and Congress. A technique borrowed from Bretschneider and Gorr (1992) was employed in the following manner. The dummy code of 1 for the Republican President was added to the percent of Republican control of Congress. If the score was greater than 1.5, then it was subtracted from 3.0. If the score was below 1.5, then it was coded in present form. 7 Independent time series regression assessing relationship between total federal direct payments to individuals and birth to teenage mothers was insignificant. 8 Independent analysis of relationship between total federal direct payments to individuals and divorce was significant at p<.05. Ad-justed R-squared = .097

29 Perspectives in Public Affairs
Jordan
any validity, then these variables should also correlate with fluctuations in the rate of pov-erty. If the hypothesis of this paper retains any validity, then one or more of the "cultural" variables should show correlation as part of a larger structural model.
Total direct payments to individuals by the federal government may be viewed as either a proxy for welfare dependence. Theoretically, if federal welfare spending is meant to curb poverty, then there should be an inverse relationship between associated spending and rates of poverty. In accordance with conservative viewpoints about the negative af-fects of welfare spending on the poor (Mead, 1986; Murray, 1984; Niskanen, 1996), a positive correlation might signify that welfare spending programs in fact contribute to poverty by creating dependence or an incentive to disengage from the private economy. Along these lines, the welfare system has harmed the impetus and motivation for self-suf-ficiency and economic growth by allowing able-bodied/minded adults to be taken care of. Moreover, the welfare system also created a financial disincentive for marriage, which was compounded by the feminist revolution of the latter half-century; purportedly these intermingling trends have contributed to the break-up of the American family and the in-crease in single parents; single parents representing a demographic more susceptible to economic hardship. Taken together these variables create a useable construct of what conservative theorists think about the causes of modern poverty in America.
ResultsTable 2 presents five tested models. Model I tested the correlation between annual change in the "culture" variables alone with the annual rate of change in the number of poor fami-lies per one-hundred thousand. Only annual changes in divorce and total direct payments to individuals (as a percent of GDP) were found to be significant. Criminal activity and births to teen mothers were both found to be insignificant in all cases regardless if they were tested independently or in conjunction with other independent variables. The results seem to confirm that the increasing rate of divorce, which leads to more single mother households, may be contributing to poverty in general. However, when change in divorce was tested independently in relation to change in poverty, the relationship was not signifi-cant. Change in divorce only attained validity within these models when welfare spend-ing is included. Model II reduces the cultural variables to just divorce and welfare spend-ing and the explanatory power of the model increases, though marginally as seen in the adjusted R-squared statistic. These initial results seem to lend support to the conservative arguments (Mean, 1984; Murray 1986) that argue the welfare system may be creating de-pendency and/or creating disincentives to engage in the private economy, and perhaps contributing to the persistence of poverty. As a corollary, the rate of divorce appears to be operable only when mediated through the variable of total welfare spending. This may in-dicate that the welfare system is creating incentives for divorce or to remain single.
In Model III, all independent variables were found to significant except per capita gross domestic product (PCGDP) and the ratio of black family median income to white family median income. While the general strength of the economy is indicated through PCGDP, it is strongly correlated with median income; though median income is the better indicator of economic strength and average wealth relative to poverty. Thus, the loss of PCGDP

Spring 2004 30
The Causes of Poverty - Cultural vs. Structural
was expected, but should be taken to mean that the relative strength of the economy has no affect on poverty. Given the data series used to measure racism, it is not surprising that no relationship could be found between the ratio of black median income to white median income. As noted earlier, there has been a mere eleven point rise in this racial in-equality indicator over the last fifty years. Based on this statistic alone and the greater in-cidence of poverty among Blacks is sufficient to conclude that the income disparity be-tween these two groups plays an important role in poverty in general, as well as Black poverty in particular. That annual change in this variable fails to interact with both change in poverty and the other independent variables should not be taken to mean that the historical racism which led to this disparity is not a fundamental cause of poverty. With more research, a useable variable should be constructed that is relevant to poverty and operable within an aggregated time series model. The significance of the remaining structural level variables will be discussed in reference to Model V.
Model IV takes the structural/political variables as a group and tests their significance in relation to poverty. All structural/political variables are found to be significant except
Table 2 - The Influence of Changes in Cultural, Economic and Political Factors on Changes in PovertyChange in… Model 1 Model 2 Model 3 Model 4 Model 5
Dependent VariablePoverty
Intercept -97.538 -87.879 -97.197 -70.901 -70.646
Structral/EconomicUnemployment .437 (***) .346 (***) .309 (***)Median Income -.453 (***) -.394 (***) -.373 (***)Black/White Income Ratio -.023 -.015GINI Index -.309 (***) .318 (***) .318 (***)Per Capita Gross Domestic Product .223Prison Population .152 (*) .204 (**) .192 (**)
PoliticalRepublican Control Index .189 (*) .161 (*) .175 (**)
CulturalDivorce -.274 (*) -.249 (*) .096Crime .058 -.015Births to Teenage Mothers -.121 -.055Federal Payments to Individuals .486 (***) .515 (***) -.093
R statistic .254 .240 .751 .749 .739Adjusted R .194 .211 .714 .692 .712
Notes:Data series: 1947-2002Dependent variable is the annual change in number of poor families per 100,000All independent variables are based on annual changeAll coeffecients are standardized*** statistically significant, p < 0.01** statistically significant, p < 0.05* statistically significant, p < 0.10
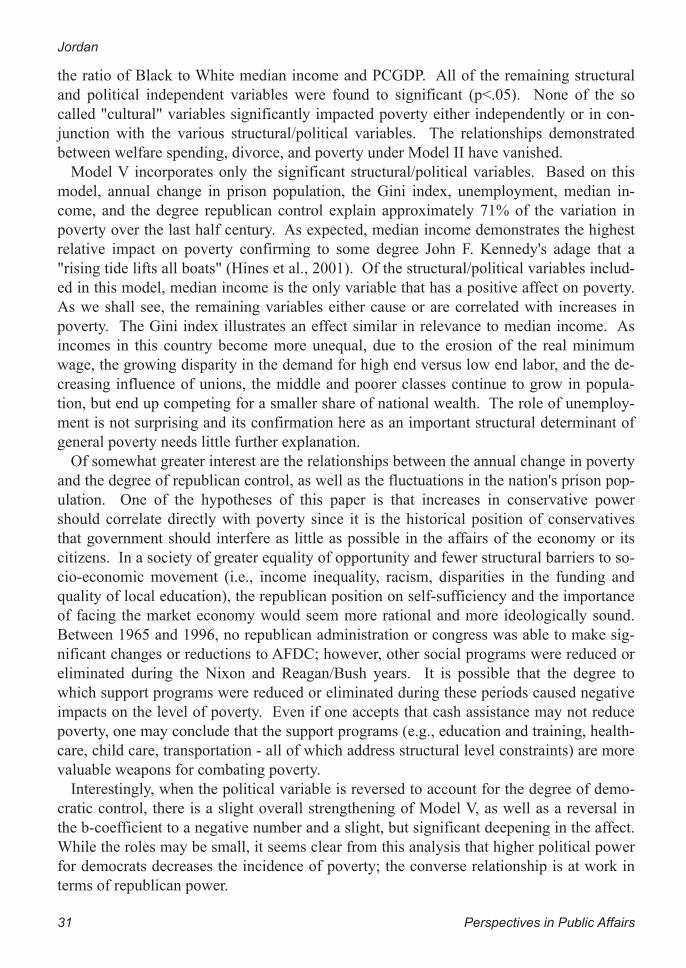
31 Perspectives in Public Affairs
Jordan
the ratio of Black to White median income and PCGDP. All of the remaining structural and political independent variables were found to significant (p<.05). None of the so called "cultural" variables significantly impacted poverty either independently or in con-junction with the various structural/political variables. The relationships demonstrated between welfare spending, divorce, and poverty under Model II have vanished.
Model V incorporates only the significant structural/political variables. Based on this model, annual change in prison population, the Gini index, unemployment, median in-come, and the degree republican control explain approximately 71% of the variation in poverty over the last half century. As expected, median income demonstrates the highest relative impact on poverty confirming to some degree John F. Kennedy's adage that a "rising tide lifts all boats" (Hines et al., 2001). Of the structural/political variables includ-ed in this model, median income is the only variable that has a positive affect on poverty. As we shall see, the remaining variables either cause or are correlated with increases in poverty. The Gini index illustrates an effect similar in relevance to median income. As incomes in this country become more unequal, due to the erosion of the real minimum wage, the growing disparity in the demand for high end versus low end labor, and the de-creasing influence of unions, the middle and poorer classes continue to grow in popula-tion, but end up competing for a smaller share of national wealth. The role of unemploy-ment is not surprising and its confirmation here as an important structural determinant of general poverty needs little further explanation.
Of somewhat greater interest are the relationships between the annual change in poverty and the degree of republican control, as well as the fluctuations in the nation's prison pop-ulation. One of the hypotheses of this paper is that increases in conservative power should correlate directly with poverty since it is the historical position of conservatives that government should interfere as little as possible in the affairs of the economy or its citizens. In a society of greater equality of opportunity and fewer structural barriers to so-cio-economic movement (i.e., income inequality, racism, disparities in the funding and quality of local education), the republican position on self-sufficiency and the importance of facing the market economy would seem more rational and more ideologically sound. Between 1965 and 1996, no republican administration or congress was able to make sig-nificant changes or reductions to AFDC; however, other social programs were reduced or eliminated during the Nixon and Reagan/Bush years. It is possible that the degree to which support programs were reduced or eliminated during these periods caused negative impacts on the level of poverty. Even if one accepts that cash assistance may not reduce poverty, one may conclude that the support programs (e.g., education and training, health-care, child care, transportation - all of which address structural level constraints) are more valuable weapons for combating poverty.
Interestingly, when the political variable is reversed to account for the degree of demo-cratic control, there is a slight overall strengthening of Model V, as well as a reversal in the b-coefficient to a negative number and a slight, but significant deepening in the affect. While the roles may be small, it seems clear from this analysis that higher political power for democrats decreases the incidence of poverty; the converse relationship is at work in terms of republican power.

Spring 2004 32
The Causes of Poverty - Cultural vs. Structural
The relationship between poverty and prison population is more difficult to assess. On the surface, it seems apparent that annual change in the incarceration rate over time is having an affect on poverty, in conjunction with the other structural/political variables, which is independent from annual change in the crime rate. As noted earlier, a society does not directly control crime, but it does control the definition of punishment and it se-verity and these definitions are subject to influence from economic and political spheres in addition to public morality (Wilkins, 1991). Separate analysis demonstrates that the rise in the prison population is also correlated with the Gini index. I would hypothesize that the interrelationship between income inequality and the prison population and their combined correlation with poverty reflects the growing chasm in the demand for labor brought on by a rapidly changing economy. As previously discussed, there is a growing demand for high skilled labor and a growing demand for low skilled labor. The wages and benefits associated with low skill labor are typically not sufficient to live at a standard much above the poverty line. Given the drop in the crime rate over the last two decades, it is apparent that low low-income individuals are not committing more crimes to offset the erosion of decent work and livable wages, but as a society we are nonetheless incar-cerating more of them. Why is this so? Is it possible that we are incarcerating more peo-ple in order to artificially offset the poverty problem in this county? Or perhaps as the skills gap and income inequality have widened and the inner-cities remained in destitu-tion, the rising incarceration rate has been the lid on Pandora's Box; thus mitigating a pos-sible return to the urban riots of the sixties and seventies. Finally, and perhaps more prac-tically, the higher incarceration rate deprives families of income earners. The possible answers to these questions are beyond the scope of this paper, but they would seem to be fertile ground for further research.
ConclusionWhile measurement issues remain, including the applicability of a national level analysis to various regions and cities each with potentially differentiated forms and causes of pov-erty, the final Model V of this analysis provides a useful framework for understanding the general causes of poverty at the national level. Contrary to the hypothesis of the paper, the cultural variables employed could not be integrated with the structural/political varia-bles into a larger model that demonstrated the dynamic interrelation between the structur-al environment, cultural processes, and behavioral outcomes as theorized by Orlando Pat-terson (2000). Admittedly, there may be some difficulty in using aggregate behavioral variables to assess the degree to which cultural mechanisms may be at work. However, this should not discourage further research into generating models that do integrate the various dynamics. In this analysis, the strength of the structural variables seemed to over-whelm the role of behavior/culture variables, but this should only serve to instruct us to search for better variables that capture the cultural dynamics and behavioral outcomes in a ways that engage the structural variables. Perhaps an index could be generated at the sub-national level or for particular geographic regions (i.e., inner cities) that could quantify the transmission of particular generalized worldviews, and which would demonstrate the level of interaction with the structural barriers of inequality and racism and the related

33 Perspectives in Public Affairs
Jordan
economic hurdles associated with changes in demand for labor and wage/benefit erosion.Returning to anthropology for a moment, Edgerton (2000) cites work by anthropologist
Walter Goldschmidt who studied the Sebei of Uganda. Goldschmidt concluded that the primary cause of what he referred to as a general "disequilibria and maladaptation" of the Sebei's society could be traced to "changing socioeconomic circumstances" (Edgerton, 2000, pp. 129). Through this lens we might gain some insight into how the rapidly chang-ing American economy and growing economic inequality is causing certain segments of the population to be left behind. Since the political will does not seem to exist to ensure that equal opportunity begins with a level playing field, then I fear the US's poverty prob-lem will get worse and not better in the near future.
ReferencesAbramovitz, M. (1996). Regulating the Lives of Women: Social Welfare Policy from Colonial Times to the
Present. Boston, MA: South End Press.Bretschneider, S. & Gorr W. (1992). Economic, organizational and political influences on biases in state
revenue forecasting. Journal of International Forecasting, 7: 457-66.Chiricos, T.G. & Delone, M.A. (1992). Labor Surplus and Punishment: A Review and Assessment of Theo-
ry and Evidence. Social Problems 39 (4): 421-435.DeWeever, A.J., Peterson, J. & Song, X. (2003). Before & After Welfare Reform: The Work and Well-Being
of Low-Income Single Parent Families. Institute for Women's Policy Research. Washington, DC: Insti-tute for Women's Policy Research.
DiIulio, J.J. (1989). Impact of Inner City Crime. The Public Interest, 96 (2): 28-46. Edgerton, R.B. (2000). Traditional Beliefs and Practices - Are Some Better than Others? In L.E. Harrison
and S.P. Huntington (Eds.). Culture Matters. (pp. 126-140).Ehrenreich B. (2001). Nickel and Dimed: On Not Getting By in America. New York: Henry Holt & Compa-
ny. Ellwood, D.T., & Summers, L.H. (1986). Poverty in America: Is Welfare the Answer or the Problem? In
S.H. Danziger and D.H. Weinburg (Eds.). Fighting Poverty: What Works and What Doesn't. (pp. 78-105). Cambridge, MA: Harvard University Press.
Gilens, M. (1999). Why Americans Hate Welfare: Race, Media and the Politics of Anti-Poverty Policy. Chi-cago, IL: The University of Chicago Press.
Glazer, N. (2000). Disaggregating Culture. In L.E. Harrison and S.P. Huntington (Eds.). Culture Matters. (pp. 219-230).
Gottschalk, P. & Smeeding, T. (1997). Cross-National Comparisons of Earnings and Income Inequality. Journal of Economic Literature, 35(2): 633-687.
Hartman, H., Spalter-Roth, R., Sills, M. & Yi, M. (2003). Survival at the Bottom: The Income Packages of Low-Income Families with Children. Washington D.C.: Institute for Women's Policy Research.
Hines, J.R., Hoynes, H. & Krueger, A.B. (2001). Another Look at Whether a Rising Tide Lifts All Boats. Prepared for the Russell Sage-Century Foundation. Retrieved December 4, 2003 from the World Wide Web: http://www.econ.ucdavis.edu/faculty/hoynes/publications/hhk-final.pdf
Holzer, H. J. (1991). The Spatial Mismatch Hypothesis: What Has the Evidence Shown? Urban Studies, 28(1): 105-122.
Irvine, I. & Xu, K. (2003). Crime Punishment and the Measurement of Poverty in the United States, 1979-1997. Working Paper.
Jones, R. (2003). Wal-Mart Takes on the World. MSNBC online. Retrieved November 18, 2003 from the World Wide Web: http://msnbc.msn.com/id/3540911/.
Kirschenman, J., & Neckerman, K.M. (1991) "We'd Love to Hire Them, But...": The Meaning of Race for Employers. In C. Jenks and P.E. Peterson. (Eds.). The Urban Underclass. (pp. 203- 231) Washington, DC: The Brookings Institution.

Spring 2004 34
The Causes of Poverty - Cultural vs. Structural
Lewis, O. (1970). Anthropological Essays. New York: Random House.Massey, D.S., & Denton, N.A. (1993). American Apartheid: Segregation and the Making of the Under-
class. Cambridge, MA: Harvard University Press.Mead, L.M. (1986). Beyond Entitlement: The Social Obligations of Citizenship. New York, NY: Free
Press.Moynihan, D.P. (1965). Negro Family: The Case for National Action. Washington, D.C.: Office of Policy
Planning and Research, U.S. Department of Labor.Murray, C. (1984). Losing Ground: American Social Policy 1950-1980. New York, NY: Basic Books. Niskanen, W.A. (1996). Welfare and the Culture of Poverty. The Cato Journal 16(1): Retrieved November
15, 2003 from the World Wide Web: http://www.cato.org.Patterson, J.T. (2000). America's Struggle Against Poverty in the Twentieth Century. Cambridge, MA: Har-
vard University Press.Patterson, O. (2000). Taking Culture Seriously: A Framework and Afro-American Illustration. In L.E. Har-
rison and S.P. Huntington (Eds.). Culture Matters. (pp. 202-218).Office of Management and Budget. (2003). Historical Tables, Budget of the United States Government:
Fiscal Year 2004. Retrieved November 15, 2003 from the World Wide Web: http://www.whitehouse.gov/omb/budget/fy2004/pdf/hist.pdf
Putnam, R.D. (1993) Making Democracy Work. New Jersey: Princeton University Press. Rodgers, H.R. (2000). American Poverty in a New Era of Reform. New York: M.E. Sharpe.Rusche, G. & Kirchheimer O. (1939). Punishment and Social Structure. New York: Russell & Russell. Tanner, M. (2003). Welfare Reform: Less Than Meets the Eye. Cato Policy Analysis No. 473. Cato Insti-
tute. Retrieved December 5, 2003 from the World Wide Web: http://www.cato.org.U.S. Bureau of the Census. (2003). Gini Ratios for Households. Retrieved October 13, 2003 from the
World Wide Web: http://www.census.gov/hhes/income/histinc/h04.html.U.S. Bureau of the Census. (2003). Historical Income Tables - Families. Retrieved October 12, 2003 from
the World Wide Web: http://www.census.gov/hhes/income/histinc/f23.html.U.S. Bureau of the Census. (2003). Historical National Population Estimates. Retrieved October 5, 2003
from the World Wide Web: http://eire.census.gov/popest/archives/pre1980/popclockest.txt. U.S. Bureau of the Census. (2003). Poverty in the United States. Retrieved October 5, 2003 from the
World Wide Web: http://www.census.gov/prod/2002pubs/p60-219.pdf.U.S. Bureau of Labor Statistics. (2003). Employment Status of the Civilian Non-institutional Population:
1939 to Date. Retrieved October 12, 2003 from the World Wide Web: http://www.bls.gov/cps/cpsaat1.pdfU.S. Bureau of Justice Statistics. (2002). Sourcebook of Criminal Justice Statistics - 1999. Washington
DC: U.S. Government Printing Office. U.S. Bureau of Justice Statistics. (2002). Sourcebook of Criminal Justice Statistics - 1999. Washington
DC: U.S. Government Printing Office.U.S. Centers for Disease Control (2003). National Vital Statistics Reports - 2002. Retrieved November 6,
2003 from the World Wide Web: http://www.cdc.gov/nchs/U.S Department of Justice. (2000). United States Total Index Offenses: 1960-2001. Retrieved October 15,
2002 from the World Wide Web: http://149.101.22.40/dataonline/Search/Crime/State/RunCrimeTrendsInOneVar.cfm.
U.S. Department of Justice (1980). Uniform Crime Reports for the United States. Washington DC: U.S. Government Printing Office.
U.S. Department of Justice (1959). Uniform Crime Reports for the United States. Washington DC: U.S. Government Printing Office.
U.S. Department of Justice (1958). Uniform Crime Reports for the United States. Washington DC: U.S. Government Printing Office.
Weber, M. (1905, 2002). The Protestant Ethic and the "Spirit" of Capitalism. New York: Penguin Books.Wilkins, L.T. (1991). Punishment, Crime and Market Forces. Aldershot: Dartmouth Publishing Company.Wilson, J.Q. (1987). The Truly Disadvantaged: The Inner City, the Underclass, and Public Policy. Chica-
go, IL: Chicago University Press.

Spring 2004 6
The Spatial Decomposition of Theil's T Statistic
William Julius Wilson (1987) observed that complex patterns of growth in U.S. cities cou-
pled with historic and existing racial discrimination created socially isolated places within
these cities. These social islands, he argued, are increasingly areas of higher poverty con-
centrations, higher unemployment, lower educational attainment levels and lower labor
force participation. Populations in these areas are also more likely to be both young and in
a racial or ethnic minority (Wilson, 1987). Wilson (1987) contended that these socially
isolated areas were mainly a product of societal and public policy mechanisms, and that
antipoverty policies should be aimed at changing those mechanisms rather than address-
ing (and "correcting") the cultural features of the poor. Using data aggregated to Chicago
Community Areas, he illustrated that the above variables defining the "social island" all
changed in the expected direction from 1970 to 1980 for the impoverished enclaves in the
city (Wilson, 1987).
It is important to note that Wilson's studies mainly focused on large cities in the Mid-
western and Eastern U.S. like Chicago. Little is known about the applicability of Wilson's
theories of social isolation outside of those regions. This paper will attempt to test several
of Wilson's hypotheses for the greater Phoenix metropolitan area, a quintessentially
Southwestern city with a vastly different history and growth pattern from the traditional
Wilsonian cities. The research questions proposed here aim to quantify the extent to
which Wilson's social isolation hypotheses are operative over time in Phoenix. These
questions follow:
To what extent has (1) the concentration of poverty changed; (2) unemployment
changed; (3) the educational attainment level changed; and (4) labor force par-
ticipation changed for poor areas within the greater Phoenix metropolitan area
over time?
To what extent are the racial and ethnic minorities in the greater Phoenix metro-
politan region disproportionately represented in impoverished areas? Have
these areas changed their minority representation over time?
In testing these hypotheses, one would typically choose a measure of poverty like the
census-defined measure as the dependent variable. However, this absolute measure of
Does Phoenix Fit Wilson's
Social Isolation Model?
Evidence From the Spatial Decomposition
of Theil's T Statistic
John David Godchaux

7 Perspectives in Public Affairs
Godchaux
poverty has significant drawbacks for this study. The absolute nature of the poverty line
disregards the income distribution outside of poverty essentially disregarding the cost of
living in a given region. This problem compounds itself over time as regional cost of liv-
ing either increases or decreases. In addition, this measure of poverty categorizes people
as either poor or non-poor, which mischaracterizes the continuum of incomes. To combat
these two drawbacks, this study uses a measure of income inequality (Theil's T statistic)
as the dependent variable.
Theil's T statistic or the Theil index is a measure of income inequality ranging from 0 to
infinity of the form:
Equation 1
where m is the number of groups (census tracts), pj is the proportion of total population in
each group, and Rj is the ratio of average group income to overall average income (Con-
ceicao and Galbraith, 1998). The interpretation of the minimum value of Theil's T is very
similar to that of the Gini coefficient - when T=0 all persons in the evaluated area have
equal income (Conceicao and Galbraith, 1998). However, since Theil's T has no upper
bound, their interpretations diverge somewhat when T > 0. In completely unequal societ-
ies where one person earns all the income (and more than one person is in this society),
the Gini coefficient equals one, but the Theil index increases in value as the society in-
creases in size (Conceicao and Galbraith, 1998). Relative changes over time in the Theil
index can show either income transfers (rich to poor or vice versa) or population move-
ments. Other data are needed to discover the extent to which each process is occurring.
One large shortcoming of the Theil index is the difficulty in interpreting the actual calcu-
lated value. The power of the index is in its relative changes over time.
One other feature of the Theil index that is only being utilized in a limited fashion in
this study is its ability to be decomposed into additive parts. This is especially useful
when looking at multiple geographic scales (country, state, and county scales, for exam-
ple) when one would like to know the inequalities between and within similar geogra-
phies (Conceicao and Ferreira, 2000). For example, we could use the decompositional
property of the Theil index to show both the inequalities between two countries and the
inequalities within each county (at the state or province geographic level). Since the over-
all Theil index is a sum of the decomposed parts or Theil elements, we can characterize
each part of the decomposition as that geographic area's contribution to the overall Theil
index (Conceicao and Ferreira, 2000). Interpreting the Theil elements proves much easier
than interpreting the overall Theil index (Conceicao and Ferreira, 2000). Theil elements
whose value is zero contribute nothing to inequality. That is to say that the proportion of
overall population within that geography receives their "fair share" of income (Rj = 1; ln
Rj = 0). Theil elements below zero contribute negatively to the Theil index (Rj < 1), while
Theil elements above zero contribute positively to the Theil index (Rj > 1).
In addition, relative changes in Theil elements over time can demonstrate that an area is
either becoming more or less equal relative to an overall "fair share" of income
lnR∑=
m
j
jjj Rp1
T =

Spring 2004 8
The Spatial Decomposition of Theil's T Statistic
(Conceicao and Ferreira, 2000). This interpretation is important for confirming the extent
to which income inequality is increasing in impoverished areas. If Wilson's hypotheses
hold, then one should see increasing income inequality coupled with the expected changes
in the social isolation variables.
Data and Methodology
All data used in this study comes from the GeoLytics Census CD Neighborhood Change
Database (NCDB), which was created jointly by GeoLytics Corp. and The Urban Insti-
tute. The NCDB was created wholly from the U.S. Census Bureau Decennial Census, SF3
(long form) data from the years 1970, 1980, 1990 and 2000. The important feature of the
NCDB is that all data has been normalized to the 2000 census tract boundaries.1 This al-
lows for straightforward longitudinal comparisons at the census tract level, which is the
unit of analysis in this study. The study area includes 656 census tracts in Maricopa Coun-
ty, Arizona, that include a slightly larger area than the census-defined Phoenix-Mesa, Ari-
zona Metropolitan Statistical Area in 2000 (Figure 1).
This study uses relevant variables in the cate-
gories of race, poverty, education, unemploy-
ment and labor force participation. Age varia-
bles were not available throughout the NCDB in
a useful format, so this category was not used.
I computed Theil's T statistic across the study
area for the years 1970, 1980, 1990 and 2000.
Due to unavailability of household income data,
I used family income variables. These variables
were the only total income variables that cov-
ered all time steps in the NCDB. Although this
is an inferior income variable (I am likely miss-
ing quite a bit of income from unrelated individ-
uals within a household), I contend that by using
this variable this study most likely presents an
overestimation of income inequality. I suspect
(although I have no data to support this as of
yet) that poor households benefit from income
coming from unrelated individuals more so than wealthy households. Perhaps this is not
the case, but in any event, future work in this area should use household income variables
when the data become available.
ArcGIS maps were created to describe and analyze the spatial distribution of Theil ele-
ments over time. One purely descriptive map was made for each year in the study. In ad-
dition, four maps were created to illustrate the change in the value of Theil elements from
Figure 1. Overview map of the greater
Phoenix metropolitan area.
Arizona
Greater Phoenixmetropolitan
area (study area)
1 The U.S. Census Bureau draws cartographic boundaries between census tracts, which places between 4,000 and 10,000 people into
each census tract. In a rapidly growing city like Phoenix, census tracts often become split into two or more parts during subsequent
Censuses making longitudinal comparisons very difficult. The NCDB has the advantage of having the data from previous Censuses
(1970, 1980 and 1990) disaggregated through a complicated algorithm into smaller units and re-aggregated to 2000 census tract boun-
daries based on their spatial location.

9 Perspectives in Public Affairs
Godchaux
Interstate 17Corridor
Scottsdale
Mesa
DowntownPhoenix Ahwatukee
Figure 2. Overview map of locations within the greater Phoenixmetropolitan area.
1970 to 1980, 1980 to 1990, 1990 to 2000 and finally 1970 to 2000.
Correlations were calculated between each independent variable and the dependent var-
iable, Theil elements, to determine the extent to which changes in the independent varia-
bles reduce errors in predicting the changes in the Theil elements.
Findings and Discussion
The purely descriptive GIS maps showing the distribution of Theil elements in each year
of the study show some very interesting trends in the growth of Phoenix (Appendix 1). By
inspection, one can note the very solid blue centered on downtown Phoenix in 1970 indi-
cating that this area contributed very negatively to the Theil index (Figure 3). That is to
say that the ratio of average group income to overall average income was quite small.
However, note that over time this solid area of blue breaks up and shifts to both the north-
west and the east (Figure 6).
The GIS maps depicting change show essentially the same trends (Appendix 1). Figure
7 depicts the change in the Theil elements from 1970 to 1980. One can see from this map
that the downtown Phoenix area (the solid blue area noted in Figure 3) shows very large
increases in its Theil elements relative to other areas of the city. This change indicates that
the downtown area is contributing less negatively to the overall Theil index by 1980. Ulti-
mately, the means that average group incomes have increased relative to the overall aver-
age income across Phoenix. However, Figure 4 demonstrates that these increases in
Spring 2004 10
The Spatial Decomposition of Theil's T Statistic
average group income were not sufficient to raise this average to the overall average in-
come across Phoenix (note the dark blue areas still present in 1980). Another interesting
feature of Figure 6 is in the area north of downtown Phoenix. There we begin to see a rel-
ative decrease in the Theil elements as wealthier people begin to move to northern Phoe-
nix and northern Scottsdale. Note that in Figure 10, some of the largest positive changes
in Theil elements from 1970 to 2000 occur in these areas (north Phoenix and north Scotts-
dale). One can also see significant positive changes in Ahwatukee, parts of the southeast
Valley (Chandler, Gilbert and Queen Creek) and downtown Phoenix.
Table 1 shows the overall characteristics of the greater Phoenix metropolitan area over
time. Between 1970 and 2000, the population more than tripled, family income rose by
nearly a factor of four and the overall Theil index doubled. Essentially, this means that as
family income precipitously increased, the distribution of family income in 2000 was
about twice as unequal as the distribution of family income in 1970. There are two factors
that drive this increase in the overall Theil index: the wealthy become wealthier or the
poor become poorer. Table 2 illustrates that while both of these forces are pushing the
overall Theil index higher, the wealthy becoming wealthier has contributed much more to
inequality than the poor becoming poorer.
Table 2 shows the sum of all Theil elements that contribute either positively or nega-
tively to the overall Theil index in a given year. Note that for each year, the sum of these
two calculated values (the negative contribution and the positive contribution) yields the
overall Theil index found in Table 1. From 1970 to 2000, the elements that contribute
negatively to the overall Theil index decrease from -0.102 to -0.146 showing that the poor
are indeed getting poorer. Similarly, the sum of Theil elements that contribute positively
to the overall Theil index increased from 0.174 to 0.293. This increase illustrates that the
Table 1Population, Family Income and Theil index characteristics of the greater Phoenix metropolitanarea in 1970, 1980, 1990 and 2000.
1970 1980 1990 2000
Total Population 959,762 1,494,547 2,101,034 3,035,104
Aggregate FamilyIncome (in 2000dollars) $13,183,238,126 $24,031,852,530 $34,201,568,246 $50,852,406,100
Overall Theil Index 0.072 0.079 0.130 0.147
Table 2Temporal View of Contributions to the Overall Theil Index
1970 1980 1990 2000
Sum of Theil ElementsContributing Negatively tothe Overall Theil Index
-0.102 -0.109 -0.135 -0.146
Sum of Theil ElementsContributing Positively tothe Overall Theil Index
0.174 0.188 0.265 0.293

11 Perspectives in Public Affairs
Godchaux
wealthy elements' contribution to Theil inequality is increasing, and thus the wealthy are
becoming wealthier. In addition, the magnitude of this increase is much greater than the
magnitude of the temporal change amongst the elements contributing negatively to the
overall Theil index. Simply put, this means that the increase in the overall Theil index
over time has been largely driven by the wealthy becoming wealthier in the greater Phoe-
nix metropolitan area.
Table 3 exhibits the changes over time in the Wilsonian social isolation variables in-
cluded in the statistical analysis (results of which are presented in Table 4). Three interest-
ing features present themselves in Table 3. First, minority races and ethnicities shares of
the population have increased from 1970 to 2000 with the exception of the African Ameri-
can and Native American populations, which have had relatively constant shares. Second,
the overall poverty rate has stayed relatively consistent over time even though family in-
come inequality had doubled in the same time period. One interpretation of this finding is
that, again, those families in poverty are not experiencing the same level of an increase in
income as wealthy families are experiencing. Finally, overall educational attainment has
increased greatly over time.
Table 4 displays Pearson product moment correlations between the calculated Theil ele-
ments and the Wilsonian suite of social isolation variables presented in Table 3 for each
tract in 1970, 1980, 1990 and 2000. Correlations below ±0.2 show essentially no relation-
ship between the variables. Correlations between 0.2 and 0.4 show a weak correlation
Table 3
Percent of population with variable characteristics
Variable
Percent with
characteristic,
1970
Percent with
characteristic,
1980
Percent with
characteristic,
1990
Percent with
characteristic,
2000
Race
White 94.9 % 87.6 % 84.9 % 78.4 %
African American 3.3 3.2 3.5 3.9
Hispanica
14.5 13.2 16.0 24.9
American Indian No Data 1.5 1.8 1.9
Asian No Data 1.0 1.7 2.7
Pacific Islander No Data No Data No Data 0.2
Other No Data No Data 8.1 11.9
People < Poverty Line 11.6 10.4 12.1 11.6
Education levelb
No High School 22.6 12.7 7.3 7.4
Some High School 17.2 12.1 11.1 10.0
High School or GED 32.3 34.9 25.4 23.0
Some College 15.1 21.9 34.0 33.6
Bachelor’s Degree 12.9 18.4 22.2 26.0
Employmentc
Unemployed 3.9 5.4 6.0 4.7
In Labor Force ------- ------- ------- -------
Unemployment Rate ------- ------- ------- -------aThe variable Hispanic as defined by the census is not mutually exclusive from other race/ethnicity categories.bFor the population 25 years and older.cFor the population 16 years and older.

Spring 2004 12
The Spatial Decomposition of Theil's T Statistic
between variables, while correlations from 0.4 to 0.6 show a moderate correlation be-
tween the variables. Correlations above 0.6 represent a strong association between varia-
bles. The important feature of these correlations, however, is the changes in them over
time, and this is where I will focus my analysis.
First, note that over the entire time period, only the White and Asian race/ethnicity vari-
ables exhibited an increase in their correlations with Theil's T, meaning that as White and
Asian populations increased, the value of census tract Theil elements also increased. For
every other race/ethnicity category the opposite was true. Over time, African Americans,
Hispanics, Native Americans and the category "Other" showed increasing negative corre-
lations with Theil's T. As these minority populations increased, their negative contribution
to the overall Theil index increased. In other words, these minority populations were over
time more likely to reside in a census tract that on average had family incomes well below
the overall average income. This finding lends strong support to Wilson's hypothesis that
socially isolated areas are becoming increasingly minority.
Table 4 also shows the strengthening inverse relationship between the Theil elements
and (1) the number of people in poverty; (2) level of educational attainment below the
Bachelor's degree; and (3) the number of unemployed in each census tract. Each of these
strengthening relationships (meaning that the correlations are becoming stronger over
time) exhibits further support in Phoenix for Wilson's social isolation hypotheses. Only
the labor force participation variable showed no correlation or discernable temporal
change with Theil elements.
Table 4
Pearson product moment correlation between Theil Elements and Social Isolation Variables
Variable
Theil’s T,
1970
Theil’s T,
1980
Theil’s T,
1990
Theil’s T,
2000
Race/Ethnicity
White 0.191 0.212 0.234 0.388
African American -0.213 -0.173 -0.169 -0.250
Hispanica
-0.295 -0.329 -0.290 -0.390
American Indian No Data -0.130 -0.122 -0.180
Asian No Data 0.003 -0.001 0.129
Pacific Islander No Data No Data No Data -0.226
Other No Data No Data -0.281 -0.379
People < Poverty Line -0.267 -0.297 -0.310 -0.369
Education levelb
No High School -0.212 -0.279 -0.272 -0.371
Some High School 0.012 -0.185 -0.265 -0.395
High School or GED 0.254 0.070 -0.087 -0.156
Some College 0.468 0.295 0.109 0.195
Bachelor’s Degree 0.659 0.592 0.546 0.703
Employmentc
Unemployed -0.064 -0.191 -0.228 -0.284
In Labor Force 0.171 0.081 -0.022 0.102
Unemployment Rate -0.197 -0.284 -0.241 -0.246aThe variable Hispanic as defined by the census is not mutually exclusive from other race/ethnicity categories.bFor the population 25 years and older.cFor the population 16 years and older.
13 Perspectives in Public Affairs
Godchaux
Conclusion
Taken together, the GIS and statistical analysis represent a change in thinking about social
isolation, specifically in major Southwestern cities. The GIS work illustrates that areas
contributing negatively to income inequality have shifted from downtown Phoenix to the
Interstate-17 corridor, the University/Main St. corridor in Mesa, and areas directly to the
west and north of downtown Phoenix. However, while the regions of lower average in-
come shift place, their Wilsonian social isolation characteristics have continued to
strengthen over time. This means that although the areas within town have shifted, these
areas still are predominantly and increasingly below the poverty line, unemployed, poorly
educated, and minority.
One major implication of these findings is that the Wilsonian model of social isolation
has some merits outside of the large Midwestern and Eastern cities previously studied.
While Phoenix is different in some ways, the public policy solutions that Wilson suggests
are ultimately applicable here. Wilson (1987) argues that since social isolation is a condi-
tion with basically structural origins, public policy should address these structures rather
than culture. It is clear that structure of various types (economic, family, class…) are the
main drivers behind both the place shifts in inequality and the increase in social isolation
variables over time, and that to undo those trends, these drivers must be addressed.
References
Allison, P.D. (1978). Measures of Inequality. American Sociological Review, 43, 865-880.
Bourguignon, F. (1979). Decomposable Income Inequality Measures. Econometrica, 47, 901-920.
Conceicao, P. & Galbraith, J.K. (1998). Constructing Long and Dense Time Series of Inequality Using the
Theil Index. University of Texas Inequality Project Working Paper No. 1.
Conceicao, P. & Ferreira, P. (2000). The Young Person's Guide to the Theil Index. University of Texas In-
equality Project Working Paper No. 14.
Cowell, F.A. (1980). On the Structure of Additive Inequality Measures. The Review of Economic Studies,
47, 521-531.
Shorrocks, A.F. (1984). Inequality Decomposition by Population Subgroups. Econometrica, 52, 1369-86.
Wilson, W.J. (1987). The Truly Disadvantaged: The Inner City, the Underclass, and Public Policy. Chicago:
University of Chicago Press.

Spring 2004 14
The Spatial Decomposition of Theil's T Statistic
Appendix 1
Maps showing the distribution of Theil elements in 1970, 1980, 1990 and 2000 and the
changes between years 1970-1980, 1980-1990, 1990-2000 and 1970-2000. Data are dis-
tributed into categories by "octiles," meaning that one-eighth of the distribution is repre-
sented in each category.
Figure 3. Distribution of Theil Elements across the Greater Phoenix Region, 1970.Note the cluster of dark blue centered on downtown Phoenix, which indicates that thisarea is contributing very negatively to the Theil Index.
Figure 4. Distribution of Theil Elements across the Greater Phoenix Region, 1980.
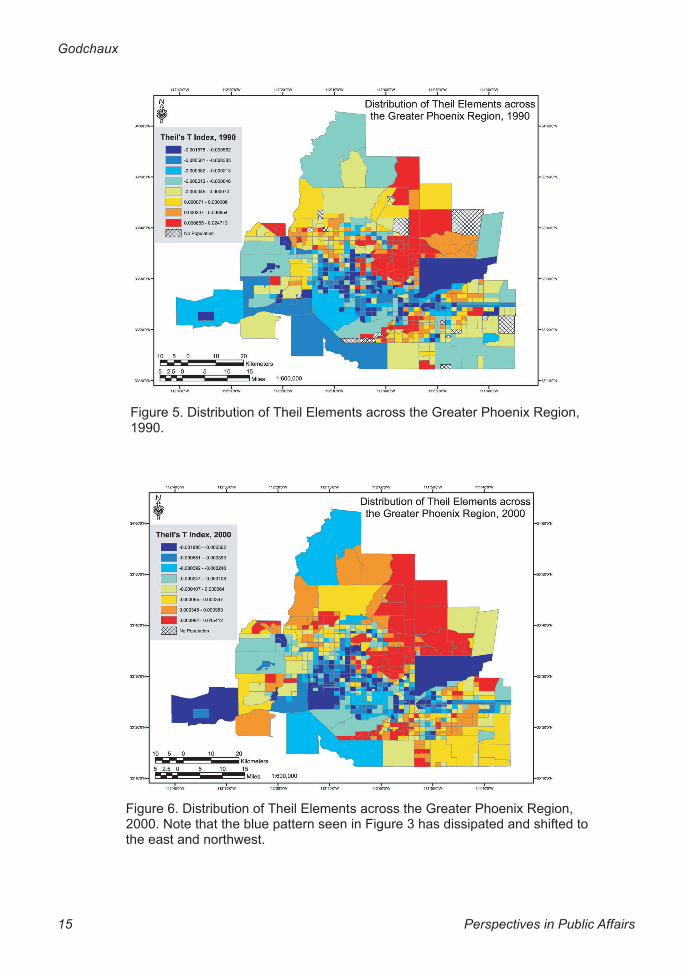
15 Perspectives in Public Affairs
Godchaux
Figure 5. Distribution of Theil Elements across the Greater Phoenix Region,1990.
Figure 6. Distribution of Theil Elements across the Greater Phoenix Region,2000. Note that the blue pattern seen in Figure 3 has dissipated and shifted tothe east and northwest.
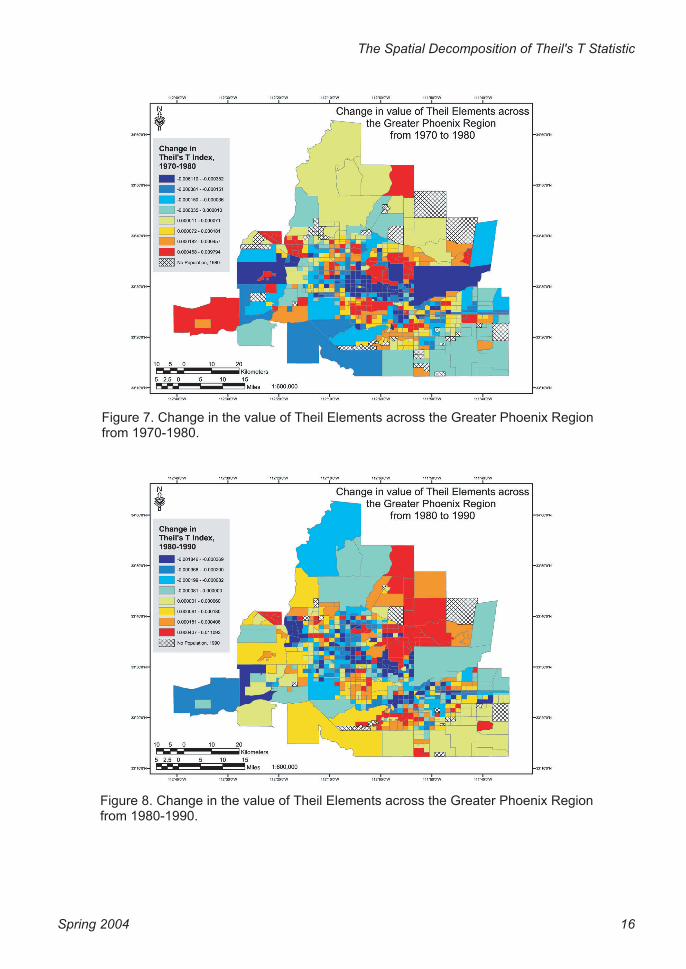
Spring 2004 16
The Spatial Decomposition of Theil's T Statistic
Figure 7. Change in the value of Theil Elements across the Greater Phoenix Regionfrom 1970-1980.
Figure 8. Change in the value of Theil Elements across the Greater Phoenix Regionfrom 1980-1990.

17 Perspectives in Public Affairs
Godchaux
Figure 9. Change in the value of Theil Elements across the Greater Phoenix Regionfrom 1990-2000.
Figure 10. Change in the value of Theil Elements across the Greater Phoenix Regionfrom 1970-2000.

Spring 2004 46
Why Americans Hate Welfare
Martin Gilens' book, Why Americans hate welfare: Race, media and the politics of anti-poverty policy, effectively uses evidence from public opinion polls, an analysis of public policy and welfare reforms and content analysis of media reports to examine the complex reasons for opposition to welfare in the United States. Based on his empirical analysis, Gilens concludes, as the title suggests, that negative feelings about welfare are related to the perception of welfare as a program for African Americans and the misrepresentation in the media of most welfare recipients as black and the undeserving poor. This book in-forms researchers in a variety of fields including public policy, political science, mass communications, social welfare and race relations.
Although most would agree that social and political structures shape government policy toward the welfare state, Gilens argues that there is less general acceptance about the in-fluence of public opinion. Using data from 10 different public opinion polls over an al-most ten year period (1986 - 1995), Gilens examines the public opinions of Americans in relation to increasing or decreasing spending on social welfare programs (Table 1.2, p. 28). In almost every program area, the majority interviewed believes that spending should be increased. The data indicate that the general support for social welfare is not limited to just programs benefiting large numbers of Americans, such as social security and education but also for more targeted populations, such as the poor - 71 percent polled believe that spending should be increased to fight poverty (Table 1.2, p. 28). The results would seem to indicate that Americans do support social welfare programs but when asked about whether welfare spending or support for people on welfare should be in-creased, Americans indicated they were strongly opposed to these general programs. Six-ty-three percent believe welfare spending should be decreased and 71 percent indicate spending for people on welfare should be decreased. These two results are essentially contradictory - Americans support helping the poor but do not support welfare, the pri-mary program designed to help the poor.
Gilens presents four possible explanations for the opposition to welfare - individualism, economic self-interest, perceptions that welfare recipients are undeserving and racial atti-tudes. Using data from public opinion polls, Gilens rejects that individualism and self-in-terest can explain the underlying opposition to welfare but finds support for the influence of racial attitudes and the perception that welfare recipients are undeserving.
Why Americans Hate Welfare:Race, Media and the Politics of Antipoverty Policy
Martin GilensUniversity of Chicago Press, 1999, 296 pages, $23.00
Reviewed by Amy Bartels

47 Perspectives in Public Affairs
Bartels
Gilens analysis is not simply limited to presenting descriptive data from multiple surveys and polls to support his arguments. Using survey data from the 1991 National Race and Political Study he also completes a careful statistical analysis of his four possible explana-tions of individualism, economic self-interest, perceptions of welfare recipients as unde-serving and racial attitudes. Restricting the statistical model to non-black respondents he finds strong support for the explanation of racial attitudes (blacks as lazy) and welfare re-cipients as undeserving as "central elements in generating public opposition to welfare" (p. 92).
The question Gilens poses is how do we account for these perceptions of welfare recipi-ents as undeserving and the racial attitudes, in particular the attitude of blacks as lazy. To understand how the poor have been portrayed in the media, Gilens traces the media repre-sentation of the poor over the past forty-five years in Time, Newsweek, and U.S. News and World Report as well as television news coverage for three historical periods, 1968, 1982-83 and 1988-1992. From 1950 through 1964, the poor people portrayed were predomi-nantly white, but from 1967 through 1992, blacks averaged 57 percent of the poor por-trayed, almost double the proportion of blacks among the poor in the U.S. In addition to an increase in the portrayal of blacks in pictures of poverty, during the period of 1972-1973, when there was general widespread public opinion of problems with welfare, Afri-can Americans were represented in 70 percent of the stories indexed under poverty and in 75 percent of the stories indexed under welfare (p. 123).
Gilens suggests that this misrepresentation in the media contributes significantly to Americans' opposition to welfare. The deserving poor - the elderly and the working poor - are typically portrayed as poor white individuals whereas poor blacks have appeared mostly in stories about welfare abuse or the underclass (p. 154). The stereotype of blacks as lazy is an image that has prevailed throughout history, and as stated earlier this percep-tion was found to be a strong determinant to non-blacks opposition to welfare.
Gilens states that his focus of this book is not on racial policy but rather welfare policy, a program designed to be race neutral but that beliefs about blacks are central to opinions about welfare and therefore should be considered in discussions of welfare. The recent welfare reforms emphasize work and returning welfare recipients to work as soon as pos-sible. This emphasis lends support to Gilens' argument that opposition to welfare is driv-en by images of the undeserving poor and welfare recipients as lazy.
The focus on decreasing caseloads by quickly returning individuals to work leads states to concentrate on placing the most employable first. According to research by the Insti-tute for Women's Policy Research (IWPR) (2003) the face of welfare is changing. While the representation of blacks among welfare recipients stayed stable three years after the passage of the Personal Responsibility and Work Opportunity Reconciliation Act (PRWORA), they are the only group who experienced an increase in the percentage of non-welfare low-income single parents. IWPR states their findings are consistent with re-search that white low-income single parents may be able to move out of poverty easier than racial/ethnic minority groups. These findings also support Gilens' concerns about the racialization of welfare and the need for awareness of welfare policies that may unfairly impact racial minorities.
Spring 2004 48
Why Americans Hate Welfare
Although Gilens more than adequately addresses the impact of racial attitudes on the op-position to welfare, he neglects to consider the issue of gender and how the picture of the welfare abuser is often portrayed as a black unemployed mother with several children. Racial inequalities are important to consider when discussing welfare reform, but as an overwhelming number of welfare recipients women, it is important to also consider ineq-uities related to gender including labor market and education issues (IWPR, 2003).
This book adeptly analyzes a complex subject by using multiple sources of data and techniques to support the author's arguments. The book is an important contribution to framing public policy in relation to social welfare, poverty and race relations. In addition the book contributes to the knowledge base on the power of the media in influencing pub-lic opinion and political viewpoints and helping to shape the nature of welfare reform.
ReferencesInstitute for Women's Policy Research (2003). Before & after welfare reform: The work and well-being of
low-income single parent families. Washington, DC: Institute for Women's Policy Research.Gilens, M. (1999). Why Americans hate welfare: Race, media and the politics of anti-poverty policy. Chi-
cago, IL: The University of Chicago Press.