Leader in Digital Entertainment - Creative Technologyimages.americas.creative.com/docs/fy03.pdf ·...
50
Speakers Systems Annual Report 2003 Creative NOMAD MuVo 128MB Creative NOMAD MuVo NX 128MB Creative NOMAD MuVo 2 1.5GB Creative NOMAD MuVo 2 XT rainer 512MB Creative NOMAD Jukebox 2 Creative Digital MP3 Player LX100 Creative Digital MP3 Player MX200 Creative I-Trigue L3500 Creative I-Trigue L3450 Creative I-Trigue 2.1 3300 Creative TravelSound MP3 Creative Inspire GD580 Creative Inspire TD7700 Creative GigaWorks S750 700Watts 7.1 Speaker System Creative MegaWorks THX 6.1 650 The Leader in Digital Entertainment Portable Audio Creative NOMAD Jukebox Creative Playdock Creative Inspire 5.1 Digital 5700 Creative Inspire 2.1 Slim 2600 Creative Inspire Monitor 85D Creative Inspire G380 CSW PlayWorks PS2000 Digital Creative NOMAD MuVo NX 256MB Creative NOMAD Jukebox Zen Xtra Creative NOMAD Jukebox Zen NX Creative NOMAD II MG Creative CD-MP3 Slim600 Creative CD-MP3 M100 Creative CD-MP3 Player Creative Digital MP3 Player NOMAD DXT 200 MP3 English Learning Device Creative NOMAD II Creative NOMAD I Creative Digital MP3 Player 2 Creative NOMAD Jukebox C Creative NOMAD Jukebox 3 Creative NOMAD MuVo 2 XTrainer 1GB Creative NOMAD Jukebox Zen
Transcript of Leader in Digital Entertainment - Creative Technologyimages.americas.creative.com/docs/fy03.pdf ·...

Speakers Systems
Annual Report 2003
Creative NOMAD MuVo128MB
Creative NOMAD MuVo NX 128MB Creative NOMAD MuVo2 1.5GB
Creative NOMAD MuVo2 XTrainer 512MB
Creative NOMAD Jukebox 2
Creative Digital MP3 Player LX100
Creative Digital MP3 Player MX200
Creative I-Trigue L3500 Creative I-Trigue L3450 Creative I-Trigue 2.1 3300 Creative TravelSound MP3
Creative Inspire GD580 Creative Inspire TD7700 Creative GigaWorks S750700Watts 7.1 Speaker System
Creative MegaWorks THX 6.1 650
The Leader in Digital Entertainment
Portable Audio
Creative NOMAD Jukebox
Creative Playdock Creative Inspire 5.1 Digital 5700 Creative Inspire 2.1 Slim 2600 Creative Inspire Monitor 85D
Creative Inspire G380
CSW PlayWorks PS2000 Digital
Creative NOMAD MuVo NX 256MB
Creative NOMAD Jukebox Zen Xtra Creative NOMAD Jukebox Zen NX
Creative NOMAD II MG
Creative CD-MP3 Slim600 Creative CD-MP3 M100 Creative CD-MP3 Player
Creative Digital MP3 Player NOMAD DXT 200MP3 English Learning Device
Creative NOMAD II Creative NOMAD I
Creative Digital MP3 Player 2
Creative NOMAD Jukebox CCreative NOMAD Jukebox 3
Creative NOMAD MuVo2 XTrainer 1GB Creative NOMAD Jukebox Zen

Chairman’s Message 2
Selected Consolidated Financial Data 4
Management’s Discussion and Analysis of
Financial Condition and Results of Operations 6
Report of Independent Accountants 17
Consolidated Balance Sheets 18
Consolidated Statements of Operations 19
Consolidated Statements of Cash Flows 20
Consolidated Statements of Shareholders’ Equity 22
Notes to Consolidated Financial Statements 23
Stock Market Information 45
The Creative Network 46
Corporate Directory 48
CONTENTS
2
CHAIRMAN’S MESSAGE
Dear Shareholders,
Creative is at an inflection point.
The Personal Digital Entertainment (PDE) market that we pioneered five years ago has finally achieved “critical mass”. Ithas reached a self-sustaining rapid growth stage and is about to explode.
For the past three years, while we focused on cutting costs to tackle the tough macro-economic situation, we did not neglectinvesting in and growing new resources and capabilities. In fact, I am proud to say that we were able to cut our costs backto 1997 levels, while at the same time we developed many more products and entered several new markets.
The PC market and Consumer Electronics markets are also at their inflection points. The battle has begun. The head-oncollision of these two giant markets will be phenomenal and have great consequences. There will be surprising newwinners and losers, and it will create many new opportunities for those who are quick and nimble.
We are fortunate that we had prepared ourselves well over these past few years. With the new capabilities we acquiredin PDE, Speakers, and 3D-Graphics, and solidly backed by our massive experience and unrivaled leadership in the PC audioarena, I believe we are well positioned and fully prepared to take on this new and exciting challenge.
The strategy going forward and direction ahead of us are very clear. The targets are visibly lined up ahead; we just needto aim and shoot. We need to shoot accurately, though. In one word: we need to EXECUTE.
Creative must execute well to take on the new convergence market, whatever that may be. The electronics market is ina mini-boom now, with component shortages in a few areas. This is being driven by the consumer market, or moreprecisely by the digital entertainment market. New external devices like cell phones with cameras, digital cameras andof course, MP3 players like the NOMAD® MuVo® and NOMAD Jukebox have all reached their critical masses.
If Creative can take full advantage of this new inflection point, we could be entering another era of rapid growth. Butwe must run very, very fast, because the competition scrambling for this new space will not wait. There will be a lot ofnew players, and the old dominant incumbents from the consumer electronics side will not step aside without a fight.
Can Creative live up to the challenge?
Before I deal with this big question, I would like to give you a review of the fiscal year behind us.
Fiscal 2003 was an operationally solid and profitable year for Creative. This performance was achieved despite very tougheconomic and market conditions.
Revenues declined further in fiscal 2003 as we continued to be impacted by the uncertain global economic environment,particularly in the global technology markets, and other negative events during the year such as the port closures in theUS West Coast, the military conflict in Iraq and the outbreak of SARS.
However, even with the reduction in revenues, we continued to achieve operating profits and improve gross margins. Weachieved our highest gross margin percentage in many years, reflecting the results of the initiatives we had taken over thepast two years to re-direct our strategy toward a focus on profitability, moving away from lower margin, higher riskproducts and concentrating on the higher-margin core audio, speakers and PDE products. The higher gross margins andthe on-going cost reduction and expense control measures we have instituted over the past two years in all aspects of thebusiness were key contributors to our achieving operating profits in all four quarters of the fiscal year.
Sales for fiscal year 2003 were $702 million, a reduction of 13% compared to $806 million for the fiscal year 2002. Grossprofit as a percentage of sales was 35% in fiscal 2003 compared to 33% in fiscal 2002. Net income for fiscal 2003 was $23million, compared to a net loss of $20 million in fiscal 2002. Net income for fiscal 2003 included net investment lossesof $6 million, while the loss for fiscal 2002 included net investment losses of $45 million and a one-time charge of $26million for in-process technology relating to the acquisition of 3Dlabs. Excluding these investment losses and othercharges, the results would have been a net income of $29 million for fiscal 2003 and $52 million for fiscal 2002.
Now, to answer the “big question” raised earlier on whether Creative can live up to the challenge, I would like to putforward some points for your assessment.
Besides the success of our focus on profitability, as reflected in the financial results, what is perhaps more significant arethe successes and achievements we had on the product and technology fronts during the fiscal year. We have made strongprogress on our strategy of leveraging our enormously strong brand name within the PC industry, increasing the breadthof our product lines, and moving more of our new product offerings outside of the PC box where we can offer great visualindustrial design (ID) and appeal to a broader base of potential customers. We have focused our R&D resources oninnovation in both technical product design and the visual ID of our products, as we significantly increased the overallnumber of product offerings. We have also dedicated substantial development resources to completely remodeling our

3
product lines and our business with the goal of extending our leadership position in the PDE market – a market wepioneered. We believe there are long term growth opportunities as we continue to introduce PDE products with greatvisual ID and award-winning functionality that work with and away from the PC.
We have significantly expanded the breadth of our product lines, with the introduction of more new products than in anyother period in our history. In the first half of the new fiscal year, we plan to launch over 90 products, the most in ourhistory, across all of our product categories. With the launch of these new products, we have what is probably our mostexciting and innovative line of products to date.
The new products that I am most excited and proud of include the Creative NOMAD Jukebox Zen NX, NOMADMuVo NX, NOMAD MuVo2, and the Creative I-Trigue™ L3500/L3450 speakers.
The Creative NOMAD Jukebox Zen NX, is our flagship hard disk-based, pocket-size digital audio player. It is theslimmest, lightest NOMAD Jukebox ever, with huge storage capacity of 20GB, 30GB or 60GB, and superfast USB 2.0connectivity. The stylish NOMAD Jukebox Zen NX can store tens of thousands of MP3 and WMA songs and play backhigh-fidelity music at 98dB SNR for up to 14 hours on one full battery charge. Our patented technology allows significantlylonger battery life than the competition, and the removable battery module allows the user to have even longer playtimeby carrying spares.
The tiny, flash memory-based NOMAD MuVo NX, introduced in July 2003, improves on the classic design of the originalNOMAD MuVo, and introduces a cool blue backlit LCD screen, a built-in microphone for voice recording, graphicequalizer and other additions to the original feature set. The NOMAD MuVo NX can also be connected directly to Creativespeaker systems, such as the new Creative I-Trigue™ speaker line, via an M-PORT™ interface for instant music playback.There are patents pending worldwide on the MuVo’s technology, and the US patent application was published by theUnited States Patent & Trademark Office in September, 2003.
The NOMAD MuVo2 was launched in September, 2003 as a brand new line of ultra-compact and lightweight MP3 players,available in both hard drive- and flash memory-based models. The hard drive-based model, the NOMAD MuVo2 1.5GB,comes with 1.5GB storage capacity, and is Creative’s smallest hard-drive based MP3 player ever. The rugged flash memoryversion, the NOMAD MuVo2 X-Trainer, comes with 512MB or 1GB capacity, and is designed specifically for the digitalmusic consumer with an active lifestyle. All versions are extremely compact and feature high-capacity removable andrechargeable Li-Ion batteries, unparalleled audio quality, super fast USB 2.0 connectivity and simple drag and dropfunctionality.
Creative made a big statement with its new Creative I-Trigue L3500/L3450 speakers, which combine an exterior designthat looks simply stunning with cutting-edge technology such as Lateral Firing Transducers for a wider soundstage andricher listening experience. Each new Creative I-Trigue speaker system features bi-amplification for optimum performancein specific frequency ranges and more accurate sound reproduction.
The full list of Creative’s new products is far too long to incorporate into this letter, but it includes many offerings in soundcards, external audio, speakers, digital audio players, cameras, workstation graphics, communications, keyboards and mice.
To have a comprehensive view of the breadth and beauty of Creative’s products, I would like to invite you to visit theCreativex Showroom at our Singapore Headquarters and our www.Creative.com web site.
Creative is now a much leaner company with an improved cost structure, yet our expanded product development capabilitiesafford us the ability to respond rapidly to changes in business conditions and to pursue new business opportunities whichwere not feasible with our previous cost structure. We are ready to focus on growth again through our remodeled productlines and businesses. With a large majority of our many new products functioning external to the PC box, we are no longersolely dependent on the PC market and add-in cards.
As we continue to move the company into new, higher growth markets outside of the PC box and our core audio productcategory, the growth opportunities we see are not limited to our traditional retail channels, but also include opportunitiesto further build our direct-to-consumer business, our OEM business, and to develop new ODM relationships. We believethat with our new operating cost structure, we can aggressively pursue these OEM and ODM channels for incrementalrevenue and profit — and we have already made progress on this front with a major customer.
We believe our downturn in revenues has bottomed out, and that we are now poised to reap the benefits of our hard workover the past two years to remodel our product lines and businesses.
Yes. Creative is ready to live up to the challenge.
Sim Wong HooChairman & Chief Executive Officer

4
The following table contains selected data from Creative’s Consolidated Statements of Operations for the five years endedJune 30, 2003. The data for the three years ended June 30, 2003 is derived from and should be read in conjunction with,the consolidated financial statements and related notes thereto included elsewhere in this Annual Report. The data forthe two years ended June 30, 2000 are derived from the audited financial statement which are not included in this annualreport.
CONSOLIDATED STATEMENTS OF OPERATIONS DATA(US$’000, EXCEPT PER SHARE DATA):
For the years ended June 30
2003 2002(1) 2001 2000 1999
Sales, net (2) $ 701,769 $ 805,905 $ 1,226,068 $ 1,342,192 $ 1,296,403
Cost of goods sold 452,952 543,382 894,236 947,157 944,499
Gross profit 248,817 262,523 331,832 395,035 351,904
Operating expenses:
Selling, general and administrative (2) 162,839 170,122 230,417 252,321 209,534
Research and development 58,775 38,248 54,022 60,428 46,725
Other charges (3) – 26,080 22,814 20,000 –
Operating income 27,203 28,073 24,579 62,286 95,645
(Loss) gain from investments, net (6,049) (45,414) (148,490) 103,443 15,048
Interest income and other, net 4,864 5,155 2,416 5,287 14,621
Income (loss) before incometaxes and minority interest 26,018 (12,186) (121,495) 171,016 125,314
Provision for income taxes (4) (2,720) (5,698) (8,409) (9,472) (9,920)
Minority interest in loss (income) 79 (1,843) (469) (532) (312)
Net income (loss) $ 23,377 $ (19,727) $ (130,373) $ 161,012 $ 115,082
Basic earnings (loss) per share $ 0.30 $ (0.27) $ (1.65) $ 1.96 $ 1.28
Weighted average ordinary sharesoutstanding (’000) 79,202 73,182 79,049 82,028 89,818
Diluted earnings (loss) per share $ 0.29 $ (0.27) $ (1.65) $ 1.86 $ 1.25
Weighted average ordinary sharesand equivalents outstanding (’000) 80,851 73,182 79,049 86,612 92,241
SELECTED CONSOLIDATED FINANCIAL DATA

5
CONSOLIDATED BALANCE SHEET DATA (US$’000):
As of June 30
2003 2002(1) 2001 2000 1999
Cash and cash equivalents $ 232,053 $ 166,917 $ 168,157 $ 285,757 $ 318,990
Working capital 209,389 165,945 203,180 331,414 400,998
Total assets 646,843 666,378 673,980 1,176,459 805,689
Long-term debt, net ofcurrent maturities 39,027 16,782 22,560 27,051 28,642
Shareholders’ equity 428,837 423,952 381,886 778,638 560,261
Notes:
(1) Financial data for fiscal 2002 includes the results of 3Dlabs Inc., Ltd (“3Dlabs”), see Note 16 of “Notes to ConsolidatedFinancial Statements,” acquired during fiscal 2002, from the date the acquisition was completed.
(2) In fiscal 2002, Creative adopted Emerging Issues Task Force (“EITF”) Issue No. 01-9, “Accounting for ConsiderationGiven by a Vendor to a Customer (Including a Reseller of the Vendor’s Products).” As a result, certain considerationpaid to distributors and resellers of its products has been reclassified as a revenue offset rather than as selling, generaland administrative expense. Prior years’ financial statements have been reclassified to conform to this presentation.
(3) Included in the results of operations are other charges of: $26.1 million in fiscal 2002 for write-off of in-processtechnology arising from the acquisition of 3Dlabs, see Note 16 of “Notes to Consolidated Financial Statements;”$22.8 million in fiscal 2001 which comprised $8.4 million restructuring charges, $3.2 million fixed assets impairmentwrite-downs and $11.2 million write-off of other assets acquired from Aureal Semiconductor, Inc. (“Aureal”), seeNote 13 of “Notes to Consolidated Financial Statements;” and in fiscal 2000, the $20.0 million charge relates to thesettlement of all outstanding litigation claims between Aureal and Creative.
(4) As described in Note 10 of “Notes to Consolidated Financial Statements,” Creative was granted a Pioneer Certificatein 1990 under which income classified as pioneer status income is exempt from tax in Singapore, subject to certainconditions. The Pioneer Certificate expired in March 2000. Such status had the effect of reducing Creative’sprovision for income taxes by approximately $15.4 million and $26.4 million, or $0.18 and $0.29 per share, forfiscal 2000 and 1999. The corporate income tax rate in Singapore, which would otherwise be applicable, would havebeen 25.5% for fiscal year 2000 and 26% for fiscal year 1999.
Creative has applied for a separate and new Pioneer Certificate. If Creative is awarded this new Pioneer Certificate,profits under the new Pioneer Certificate will be exempted from tax in Singapore. For fiscal 2000 (covering periodfrom April 1, 2000 to June 30, 2000), 2001, 2002 and 2003, corporate tax was provided for in full based on thestandard tax rates of 25.5% and 24.5% for fiscal 2000 and 2001 respectively and 22.0% for 2002 and 2003 as theterms and agreements of the new Pioneer Certificate is currently still under negotiation as at to date. Whenawarded, the new Pioneer Certificate is expected to result in the reduction of Creative’s provision for income taxes,subject to the terms and agreement by the Singapore Comptroller of Income Tax. See Management’s Discussion andAnalysis of Financial Condition and Results of Operations (“MD&A”) for further discussion.

6
MANAGEMENT’S DISCUSSION AND ANALYSIS OFFINANCIAL CONDITION AND RESULTS OF OPERATIONS
SAFE HARBOR STATEMENTS UNDER THE PRIVATE SECURITIES LITIGATION REFORM ACT OF 1995
Except for the historical information contained herein, the matters set forth herein are forward-looking statements withinthe meaning of the safe harbor provisions of The Private Securities Litigation Reform Act of 1995. These forward-lookingstatements involve risks and uncertainties that could cause Creative’s actual results to differ materially. Such risks anduncertainties include: Creative’s ability to timely develop new products that gain market acceptance and to managefrequent product transitions; competitive pressures in the marketplace; Creative’s ability to successfully integrate acquisitions;potential fluctuations in quarterly results due to the seasonality of Creative’s business and the difficulty of projecting suchfluctuations; possible disruption in commercial activities caused by factors outside of Creative’s control, such as terrorism,armed conflict and labor disputes; a reduction in demand for computer systems, peripherals and related consumerproducts as a result of poor economic conditions, social and political turmoil and major health concerns, such as the spreadof Severe Acute Respiratory Syndrome, or SARS; the proliferation of sound functionality in new products from competitorsat the application software, chip and operating system levels; the failure of cost-cutting measures to achieve anticipatedcost reduction benefits; the deterioration of global equity markets; exposure to excess and obsolete inventory; Creative’sreliance on sole sources for many of its chips and other key components; component shortages which may impactCreative’s ability to meet customer demand; Creative’s ability to protect its proprietary rights; a reduction or cancellationof sales orders for Creative products; accelerated declines in the average selling prices of Creative’s products; the vulnerabilityof certain markets to current and future currency fluctuations; the effects of restricted fuel availability and rising costsof fuel; fluctuations in the value and liquidity of Creative’s investee companies; and the potential decrease in the tradingvolume and value of Creative’s Ordinary Shares as a result of Creative’s intended delisting from NASDAQ and eliminationof its U.S. public reporting obligations. For further information regarding the risks and uncertainties associated withCreative’s business, please refer to its filings with the SEC, including its Form 20-F for fiscal 2002 filed with the SEC.Creative undertakes no obligation to update any forward-looking statement to conform the statement to actual resultsor changes in Creative’s expectations.
CRITICAL ACCOUNTING POLICIES AND ESTIMATES
GENERAL
Management’s Discussion and Analysis of Financial Condition and Results of Operations are based upon Creative’sConsolidated Condensed Financial Statements, which have been prepared in accordance with accounting principlesgenerally accepted in the United States of America. The preparation of these financial statements requires managementto make estimates and assumptions that affect the reported amounts of assets, liabilities, revenues and expenses, andrelated disclosure of contingent assets and liabilities. Management bases its estimates on historical experience and onvarious other assumptions that are believed to be reasonable under the circumstances, the results of which form the basisfor making judgements about the carrying values of assets and liabilities that are not readily apparent from other sources.Actual results may differ from these estimates under different assumptions or conditions.
Management believes the following critical accounting policies affect its more significant estimates and assumptions usedin the preparation of its consolidated financial statements:
Revenue recognition;Allowances for doubtful accounts, returns and discounts;Valuation of inventories;Valuation of investments;Valuation of goodwill and other intangible assets;Assessment of the probability of the outcome of current litigation; andAccounting for income taxes.
7
REVENUE RECOGNITION
Revenue from product sales is recognised when persuasive evidence of an arrangement exists, title and risk of losstransferred, delivery has occurred, price is fixed or determinable, and collectibility is probable. Allowances are providedfor estimated returns, discounts and warranties. Management analyzes historical returns, current economic trends andchanges in customer demand and acceptance of its products when evaluating the adequacy of the sales returns allowance.Such allowances are adjusted periodically to reflect actual and anticipated experience. When recognizing revenue,Creative records estimated reductions to revenue for customer and distributor programs and incentive offerings, includingprice protection, promotions, other volume-based incentives and rebates. Creative may take action to increase customerincentive offerings, possibly resulting in an incremental reduction of revenue at the time the incentive is offered. Significantmanagement judgement and estimates must be used in connection with establishing these allowances in any accountingperiod. If market conditions were to decline, Creative may take action to increase customer incentive offerings, possiblyresulting in an incremental reduction of revenue at the time the incentive is offered.
ALLOWANCES FOR DOUBTFUL ACCOUNTS, RETURNS AND DISCOUNTS
Creative establishes allowances for doubtful accounts, returns and discounts for specifically identified doubtful accounts, returnsand discounts based on credit profiles of its customers, current economic trends, contractual terms and conditions and historicalpayment, return and discount experience. Management performs ongoing credit evaluations of customers’ financial conditionand uses letters of credit in certain circumstances. Credit insurance coverage is obtained when coverage is available and feasible.However, Creative is not able to procure credit insurance coverage for all customers as insurers have excluded certain customersand geographic markets. In the event actual returns, discounts and bad debts differ from these estimates, or Creative adjustthese estimates in future periods, its operating results and financial position could be adversely affected.
VALUATION OF INVENTORIES
Creative states inventories at the lower of cost or market. Management performs a detailed assessment of inventory at eachbalance sheet date to establish provisions for excess and obsolete inventories. Evaluation includes a review of, among otherfactors, historical sales, current economic trends, forecasted sales, demand requirements, product lifecycle and productdevelopment plans, quality issues, and current inventory levels. In the event that Creative adjusts its estimates, such asforecasted sales and expected product lifecycles, its operating results and financial position could be adversely affected.
VALUATION OF INVESTMENTS
Creative holds equity investments in various companies from less than 1% to 100% of the issuer’s outstanding capital stock.Investments in companies in which Creative acquires more than 50% of the outstanding capital stock, or which are underCreative’s effective control, are treated as investments in subsidiaries, and the balance sheets and results of operations arefully consolidated after making an allowance for any minority interests. Companies in which Creative’s investments totalbetween 20% and 50% of such company’s capital stock are treated as associated companies and recorded on an equity basis,whereby the cost of investment is adjusted to recognise Creative’s share of all post acquisition results of operations.
As for investments of less than 20%, non-quoted investments are carried at cost, less provisions for permanent impairmentwhere necessary, and quoted investments are reported at fair value with the unrealised gains and losses included as aseparate component of shareholders’ equity. The investment portfolio is monitored on a periodic basis for impairment.Creative’s investments in these companies are inherently risky because the markets for the technologies or products theyhave under development are typically in the early stages and may never develop. In the event that the carrying value ofan investment exceeds its fair value and the decline in value is determined to be other-than-temporary, an impairmentcharge is recorded and a new cost basis for the investment is established. Fair values for investments in public companiesare determined using quoted market prices. Fair values for investments in privately-held companies are estimated basedupon one or more of the following: pricing models using historical and forecasted financial information and current marketrates, liquidation values, the values of recent rounds of financing, or quoted market prices of comparable public companies.
8
VALUATION OF INVESTMENTS (Cont’d)
In order to determine whether a decline in value is other-than-temporary, Creative evaluates, among other factors: theduration and extent to which the fair value has been less than the carrying value; the financial condition of and businessoutlook for the company, including key operational and cash flow metrics, current market conditions and future trendsin the company’s industry, and the company’s relative competitive position within the industry; and Creative’s intent andability to retain the investment for a period of time sufficient to allow for any anticipated recovery in fair value.
VALUATION OF GOODWILL AND OTHER INTANGIBLE ASSETS
Creative uses the purchase method of accounting for business combinations, in line with Financial Accounting Standards Board’s(“FASB”) Statement of Financial Accounting Standard (“SFAS”) No. 141 “Business Combinations.” The purchase method ofaccounting for acquisitions requires extensive use of accounting estimates and judgments to allocate the purchase price paid tothe fair value of the net tangible and intangible assets acquired, including in-process technology. The allocation of the purchaseprice was based on independent appraisals. The amounts and useful lives assigned to intangible assets could impact futureamortization; the amount assigned to in-process technology is expensed immediately. If the assumptions and estimates used toallocate the purchase price are not correct, purchase price adjustments or future asset impairment charges could be required.
Creative reviews for impairment of goodwill on an annual basis. Reviews for impairment of goodwill and other intangibleassets are also conducted whenever events indicate that the carrying amount might not be recoverable. Factors thatCreative may consider important which could trigger an impairment review include the followings:
• significant under performance relative to expected historical or projected future operating results;• significant changes in the manner of use of the acquired assets or the strategy for Creative’s overall business;• significant negative industry or economic trends;• significant decline in Creative’s stock price for a sustained period; and• Creative’s market capitalization relative to net book value.
When the existence of one or more of the above factors indicate that the carrying value of goodwill and other intangibles assetsmay be impaired, Creative measures the amount of impairment based on a projected discounted cash flow method using adiscount rate determined by the management to be commensurate with the risk inherent in Creative’s current business model.
ASSESSMENT OF THE PROBABILITY OF THE OUTCOME OF CURRENT LITIGATION
Creative records accruals for loss contingencies when it is probable that a liability has been incurred and the amount ofloss can be reasonably estimated.
ACCOUNTING FOR INCOME TAXES
In preparation of the financial statements, Creative estimates its income taxes for each of the jurisdictions in which it operates.This involves estimating the actual current tax exposure and assessing temporary differences resulting from differing treatmentof items, such as reserves and accruals for tax and accounting purposes. These differences result in deferred tax assets andliabilities, which are included within Creative’s consolidated balance sheet. Significant management judgment is required indetermining the provision for income taxes, deferred tax assets and liabilities and future taxable income for purposes ofassessing the ability to realize any future benefit from its deferred tax assets. Valuation allowance is provided for Creative’sdeferred tax assets as management believes substantial uncertainty exists regarding the realizability of these assets.
The Singapore corporate income tax rate is currently at 22.0%, the rate at which Creative is providing taxes on Singaporeincome. Creative was granted a Pioneer Certificate in 1990 under which income classified as pioneer status income isexempt from tax in Singapore, subject to certain conditions. As the Pioneer Certificate expired in March 2000, Creativehas applied for a separate and new Pioneer Certificate. If Creative is awarded this new Pioneer Certificate, the effectivetax rate will be reduced as profits under the new Pioneer Certificate will be exempted from tax in Singapore.
In the event that actual results differ from these estimates or Creative adjust these estimates in future periods, its operatingresults and financial position could be materially affected.
MANAGEMENT’S DISCUSSION AND ANALYSIS OFFINANCIAL CONDITION AND RESULTS OF OPERATIONS

9
RESULTS OF OPERATIONS
The following table sets forth, for the periods indicated, selected statement of operations data as a percentage of sales:
Years ended June 30
2003 2002 2001
Sales, net 100 % 100 % 100 %
Cost of goods sold 65 67 73
Gross profit 35 33 27
Operating expenses:
Selling, general and administrative 23 21 19
Research and development 8 5 4
Other charges – 3 2
Operating income 4 4 2
Loss from investments, net (1) (6) (12)
Interest income and other, net 1 1 –
Income (loss) before income taxes and minority interest 4 (1) (10)
Provision for income taxes (1) (1) (1)
Minority interest in loss (income) – – –
Net income (loss) 3 % (2) % (11) %
Creative’s net sales, by product category, for the past three fiscal years were as follows:
Percentage of Net Salesfor fiscal years ended June 30
2003 2002 2001
Audio products 33 % 44 % 41 %
Speakers 23 % 21 % 12 %
Personal Digital Entertainment 18 % 9 % 9 %
Graphics & Video products 12 % 6 % 6 %
Multimedia Upgrade Kits 1 % 5 % 22 %
Communication / Other products 13 % 15 % 10 %
10
MANAGEMENT’S DISCUSSION AND ANALYSIS OFFINANCIAL CONDITION AND RESULTS OF OPERATIONS
YEAR ENDED JUNE 30, 2003 COMPARED TO YEAR ENDED JUNE 30, 2002
Net sales for the year ended June 30, 2003 decreased by 12.9% compared to the year ended June 30, 2002. The lowernet sales was mainly attributed to the difficult global economic climate where several major U.S. retailers have encounteredslowing sales. Audio product sales, which include Sound Blaster audio cards and chipsets, for fiscal year 2003 decreasedby 34% compared to fiscal year 2002, and as a percentage of total sales, decreased from 44% in fiscal 2002 to 33% infiscal 2003. The decrease in audio product sales was primarily due to the decline in sales to the system integrator marketand a drop off in sales of low-end audio products. Sales of speakers in fiscal 2003 decreased marginally by 4% comparedto fiscal 2002, mainly due to reduced sales of non-multimedia speakers offset by higher demand for new models ofmultimedia speakers. Speakers represented 23% of sales in fiscal 2003 compared with 21% of sales in fiscal 2002. Salesof personal digital entertainment (“PDE”) products, which includes digital audio players and digital cameras, increasedby 71% in fiscal 2003 compared to fiscal 2002 and represented 18% of sales in fiscal 2003 as compared to 9% of salesin fiscal 2002. The significant increase was driven by strong demand for the NOMAD MuVo and the introduction of theNOMAD Jukebox Zen in fiscal 2003. Sales of graphics and video products increased by 78% in fiscal 2003 compared tofiscal 2002 and represented 12% of sales in fiscal 2003 compared with 6% of sales in fiscal 2002. The significant increasein graphic card sales was primarily due to sales of graphic cards by 3Dlabs, which was acquired by Creative in May 2002.Sales of multimedia upgrade kits (“MMUK”), which includes data storage devices, decreased by 82% in fiscal 2003compared to fiscal 2002 and comprised 1% of sales compared to 5% of sales in the prior fiscal year. The reduction inMMUK sales in fiscal 2003 is in line with Creative’s current business strategy of de-emphasizing lower margin products.Sales of other products, which includes accessories, music products, communication products and other miscellaneousitems, decreased by 27% in fiscal 2003 compared to fiscal 2002 and represented 13% of sales in fiscal 2003 comparedto 15% of sales in the prior fiscal year. This decrease in other product sales was primarily due to a decrease in sales ofcommunication products.
Gross profit in fiscal 2003 increased to 35% of net sales, compared to 33% in fiscal 2002. This improvement in gross profitwas primarily a result of Creative’s business strategy of shifting away from low-margin and high-risk products andfocusing on audio products, speakers and PDE products.
Selling, general and administrative (“SG&A”) expenses in fiscal 2003 declined by 4% compared to fiscal 2002. As apercentage of sales, SG&A expenses were 23% of sales for fiscal 2003 and 21% for fiscal 2002. Creative has been focusingon reducing its operating expenses, but the increase in SG&A expenses as a percentage of sales was primarily due to theaddition of operating expenses incurred by 3Dlabs. SG&A expenses incurred by 3Dlabs include amortization of otherintangible assets of $8.0 million in fiscal 2003 and $2.5 million in fiscal 2002. Research and development (“R&D”)expenses increased from 5% of sales in fiscal 2002 to 8% of sales in fiscal 2003, mainly due to the higher R&D expensesincurred by 3Dlabs which was acquired in May 2002.
Other charges of $26.1 million in fiscal 2002 relates to the write off of acquired in-process technology arising from theacquisition of 3Dlabs and represented 3% of sales in fiscal 2002. See Note 16 of “Notes to Consolidated FinancialStatements.”
Net investment loss of $6.0 million in fiscal year 2003 included permanent write-downs of quoted and unquoted investmentsby $13.6 million offset partially by net gains from sale of quoted investments of $7.6 million. The $45.4 million netinvestment loss in fiscal year 2002 comprised $49.3 million in write-downs of investments, offset partially by a $3.9million net gain from sales of investments and marketable securities. Net interest and other income decreased by $0.3million to $4.8 million in fiscal 2003 compared to $5.1 million in the prior fiscal year. This decrease was primarily dueto a reduction in interest income by $1.0 million resulting from lower interest rates, increase in share of associates’ lossesby $1.0 million, offset partially by increase in exchange gain of $1.5 million.
Creative’s provision for income taxes for fiscal 2003 as a percentage of operating income was 10% compared to 20% infiscal 2002. The higher tax provision in fiscal 2002 was primarily due to changes in the mix of taxable income arisingfrom various geographical regions and other charges of $26.1 million in fiscal 2002 which Creative has considered it anon-tax deductible expense.

11
YEAR ENDED JUNE 30, 2002 COMPARED TO YEAR ENDED JUNE 30, 2001
Net sales for the year ended June 30, 2002 decreased by 34% compared to the year ended June 30, 2001. The substantiallylower revenues in fiscal year 2002, was a result of the strategic shift by Creative to focus on its core products and to de-emphasize lower margin products and the difficult global economic climate. Audio product sales for fiscal year 2002decreased by 30% compared to fiscal year 2001, but as a percentage of total sales, increased from 41% in fiscal 2001 to44% in fiscal 2002. Sales of speakers increased by 10% and represented 21% of sales in fiscal 2002 compared with 12%of sales in fiscal 2001. The improvement in speaker sales was primarily a result of the introduction of new models ofmulti-media speakers. Sales of PDE products decreased by 31% and represented 9% of sales in fiscal 2002 and fiscal 2001.Sales of MMUKs decreased by 84% in fiscal 2002 compared to fiscal 2001 and comprised 5% of sales compared to 22%of sales in the prior fiscal year. The reduction in MMUK sales in fiscal 2002 is in line with Creative’s current businessstrategy of de-emphasizing lower margin products. Similarly, in line with this current strategy, sales of graphics and videoproducts decreased by 36% and represented 6% of sales in both fiscal years 2002 and 2001. Sales of other products, whichincludes accessories, music products, communication products and other miscellaneous items, increased by 4% andrepresented 15% of sales in fiscal 2002 compared to 10% of sales in the prior fiscal year. This increase in other productsales was primarily due to an increase in sales of communication products.
Gross profit in fiscal 2002 increased to 33% of net sales, compared to 27% in fiscal 2001. This improvement in gross profitwas primarily a result of the strategic shift in business, with emphasis on Creative’s core audio products, speakers andPDE products.
SG&A expenses in fiscal 2002 declined by 26% due to management’s cost cutting efforts to correspond to the revisedrevenue expectations. As a percentage of sales, SG&A expenses were 21% of sales for fiscal 2002 and 19% for fiscal 2001.R&D expenses were 5% of sales in fiscal 2002 and 4% of sales in fiscal 2001.
Other charges of $26.1 million in fiscal 2002 relates to the write-off of acquired in-process technology arising from theacquisition of 3Dlabs and represented 3% of sales in fiscal 2002 compared to 2% of sales in fiscal 2001. See Note 16 of“Notes to Consolidated Financial Statements.”
Net investment loss of $45.4 million in fiscal year 2002 comprised $49.3 million in write-downs of investments, offsetpartially by a $3.9 million net gain from sales of investments and marketable securities. Net investment loss of $148.5million in fiscal 2001 included $200.3 million in write-downs of investments, offset partially by a $51.8 million net gainfrom sales of investments and marketable securities. Net interest and other income increased by $2.7 million to $5.1million in fiscal 2002 compared to $2.4 million in the prior fiscal year. This increase was primarily due to an exchangegain of $3.9 million in fiscal 2002 versus an exchange loss of $3.7 million in fiscal 2001, offset partially by lower interestincome resulting from lower interest rates and lower average cash balances.
Creative’s provision for income taxes for fiscal 2002 as a percentage of operating income was 20% compared to 34% infiscal 2001. The higher tax provision in fiscal 2001 was primarily due to changes in the mix of taxable income arisingfrom various geographical regions and a lower other charges in fiscal 2001 compared to fiscal 2002 which Creative hasconsidered it a non-tax deductible expense.

12
MANAGEMENT’S DISCUSSION AND ANALYSIS OFFINANCIAL CONDITION AND RESULTS OF OPERATIONS
QUARTERLY RESULTS
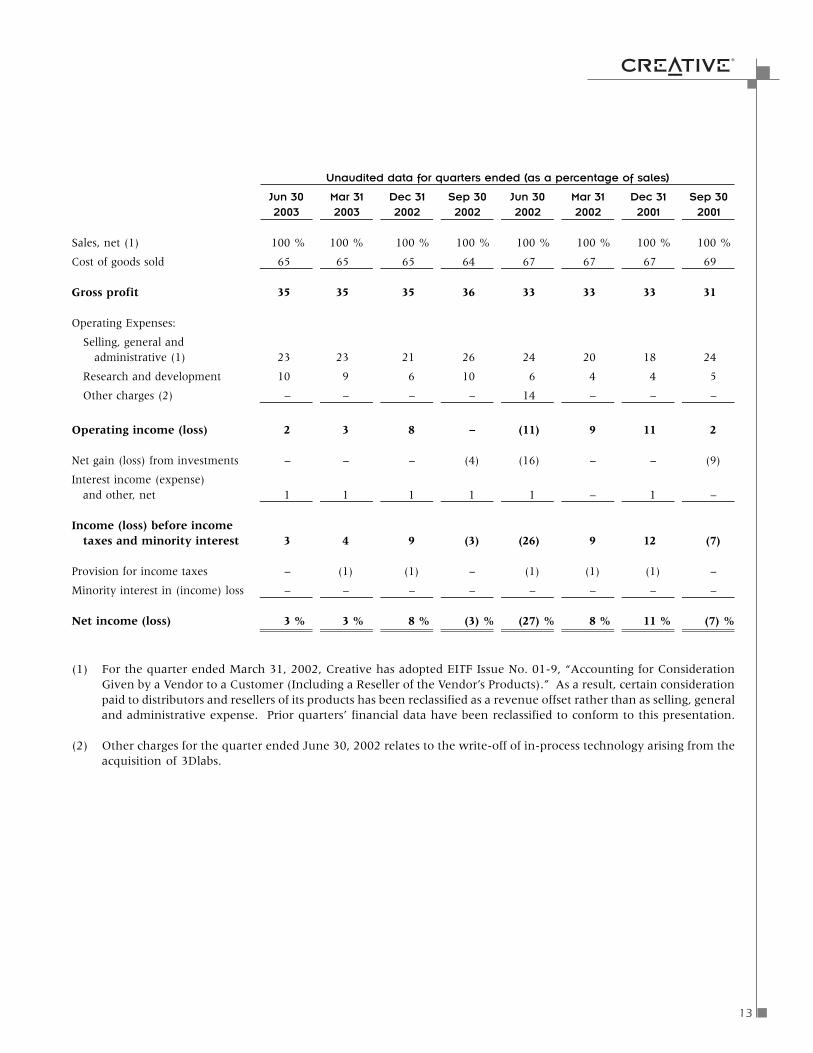
The following is a summary of Creative’s unaudited quarterly results for the eight quarters ended June 30, 2003, togetherwith the percentage of sales represented by such results. Consistent with the PC peripheral market, demand for Creative’sproducts is generally stronger in the quarter ended December 31, compared to any other quarter of the fiscal year dueto consumer buying patterns. In management’s opinion, the results detailed below have been prepared on a basisconsistent with the audited financial statements and include all adjustments, consisting only of normal recurring adjustments,necessary for a fair presentation of the information for the periods presented when read in conjunction with the financialstatements and notes thereto contained elsewhere herein. Creative’s business is seasonal in nature and the quarterlyresults are not necessarily indicative of the results to be achieved in future quarters.
Unaudited data for quarters ended (in US$’000 except per share data)
Jun 30 Mar 31 Dec 31 Sep 30 Jun 30 Mar 31 Dec 31 Sep 30
2003 2003 2002 2002 2002 2002 2001 2001
Sales, net (1) $ 149,589 $ 160,617 $ 230,940 $ 160,623 $ 182,572 $ 193,385 $ 249,506 $ 180,442
Cost of goods sold 96,788 104,365 149,169 102,630 122,291 129,209 167,353 124,529
Gross profit 52,801 56,252 81,771 57,993 60,281 64,176 82,153 55,913
Operating expenses:
Selling, general andadministrative (1) 34,266 37,379 49,039 42,155 42,815 38,737 45,143 43,427
Research and development 15,583 14,646 13,279 15,267 10,748 8,412 9,480 9,608
Other charges (2) – – – – 26,080 – – –
Operating income (loss) 2,952 4,227 19,453 571 (19,362) 17,027 27,530 2,878
Net gain (loss) from investments 10 85 172 (6,316) (29,845) 128 728 (16,425)
Interest income (expense)and other, net 1,972 886 1,199 807 2,289 151 1,291 1,424
Income (loss) before incometaxes and minority interest 4,934 5,198 20,824 (4,938) (46,918) 17,306 29,549 (12,123)
Provision for income taxes (295) (423) (1,945) (57) (1,012) (1,703) (2,753) (230)
Minority interest in(income) loss (12) 73 – 18 (436) (423) (489) (495)
Net income (loss) $ 4,627 $ 4,848 $ 18,879 $ (4,977) $ (48,366) $ 15,180 $ 26,307 $ (12,848)
Basic earnings (loss) per share $ 0.06 $ 0.06 $ 0.24 $ (0.06) $ (0.65) $ 0.21 $ 0.36 $ (0.17)
Weighted average ordinaryshares outstanding (’000) 79,527 79,377 79,026 78,877 74,375 72,134 72,366 73,854
Diluted earnings (loss) per share $ 0.06 $ 0.06 $ 0.23 $ (0.06) $ (0.65) $ 0.20 $ 0.36 $ (0.17)
Weighted average ordinaryshares and equivalentsoutstanding (’000) 80,906 80,557 80,699 78,877 74,375 76,323 73,664 73,854
13
Unaudited data for quarters ended (as a percentage of sales)
Jun 30 Mar 31 Dec 31 Sep 30 Jun 30 Mar 31 Dec 31 Sep 302003 2003 2002 2002 2002 2002 2001 2001
Sales, net (1) 100 % 100 % 100 % 100 % 100 % 100 % 100 % 100 %
Cost of goods sold 65 65 65 64 67 67 67 69
Gross profit 35 35 35 36 33 33 33 31
Operating Expenses:
Selling, general andadministrative (1) 23 23 21 26 24 20 18 24
Research and development 10 9 6 10 6 4 4 5
Other charges (2) – – – – 14 – – –
Operating income (loss) 2 3 8 – (11) 9 11 2
Net gain (loss) from investments – – – (4) (16) – – (9)
Interest income (expense)and other, net 1 1 1 1 1 – 1 –
Income (loss) before incometaxes and minority interest 3 4 9 (3) (26) 9 12 (7)
Provision for income taxes – (1) (1) – (1) (1) (1) –
Minority interest in (income) loss – – – – – – – –
Net income (loss) 3 % 3 % 8 % (3) % (27) % 8 % 11 % (7) %
(1) For the quarter ended March 31, 2002, Creative has adopted EITF Issue No. 01-9, “Accounting for ConsiderationGiven by a Vendor to a Customer (Including a Reseller of the Vendor’s Products).” As a result, certain considerationpaid to distributors and resellers of its products has been reclassified as a revenue offset rather than as selling, generaland administrative expense. Prior quarters’ financial data have been reclassified to conform to this presentation.
(2) Other charges for the quarter ended June 30, 2002 relates to the write-off of in-process technology arising from theacquisition of 3Dlabs.

14
MANAGEMENT’S DISCUSSION AND ANALYSIS OFFINANCIAL CONDITION AND RESULTS OF OPERATIONS
LIQUIDITY AND CAPITAL RESOURCES
Cash and cash equivalents at June 30, 2003 were $232.0 million, an increase of $65.1 million compared to the balanceof $166.9 million at June 30, 2002.
Operating Activities:Net cash generated from operating activities during fiscal 2003 was $99.7 million compared with $89.4 million in fiscal2002. The cash generated during fiscal 2003 primarily resulted from net income of $23.4 million, net adjustments of$39.8 million for non-cash items, a net decrease in accounts receivable and other assets and prepaid of $30.3 million, anet decrease in inventory of $28.2 million, which is in line with lower sales and management’s decision to maintain alower inventory level, and a decrease in marketable securities of $1.4 million. The cash contributions were offset partiallyby a decrease in accounts payable and accrued and other liabilities of $15.1 million and a decrease in income taxesincluding deferred tax of $8.3 million. The $39.8 million of adjustments of non-cash items to net income includedepreciation of fixed assets of $19.1 million, amortization of intangible assets of $9.1 million, write downs of investmentsand other non-current assets of $13.6 million and net gain from investments of $7.8 million.
Net cash generated from operating activities during fiscal 2002 was $89.4 million compared with $77.5 million in fiscal2001. The cash generated during fiscal 2002 primarily resulted from the net loss of $19.7 million offset by net adjustmentsof $105.9 million for non-cash items including depreciation and amortization of $29.9 million, write off of in-processtechnology acquired from 3Dlabs amounting to $26.1 million (see Note 16 of “Notes to Consolidated Financial Statements”),investments and other non-current asset write downs of $49.3 million, and net gain from investments of $5.3 million.Also contributing to the cash generated from operating activities were net decreases in accounts receivable of $18.2million and inventory of $50.6 million which was in line with the management’s decision to maintain a lower inventorylevel. However, the positive cash flow was offset partially by a net reduction in accounts payable, other accrued liabilitiesand income taxes including deferred tax of $69.1 million, resulting in the net cash generated of $89.4 million.
Investing Activities:Net cash used for investing activities during fiscal 2003 was $12.3 million compared with $50.0 million in fiscal 2002.The amount used in fiscal 2003 comprises $15.7 million in capital expenditures, $5.5 million to purchase investments,and $4.9 million for the acquisition of other non-current assets. The cash used in investing activities was offset in partby the proceeds from the sale of fixed assets and quoted investments amounting to $2.6 million and $11.2 million,respectively.
Net cash used for investing activities during fiscal 2002 was $50.0 million compared with $69.4 million in fiscal 2001.The amount used in fiscal 2002 comprises $25.8 million for the acquisition of 3Dlabs, net of cash acquired (see Note 16of “Notes to Consolidated Financial Statements”), purchase of investments of $9.2 million, capital expenditures of $8.7million, and the acquisition of other non current assets of $20.6 million. The cash used in investing activities was offsetin part by the proceeds from sale of quoted investments amounting to $13.9 million.

15
Financing Activities:During fiscal 2003, $22.3 million was used for financing activities compared with $40.7 million in fiscal 2002. Cash usedfor financing activities included a $6.7 million decrease in minority shareholders’ loan and equity balance, a $4.0 millionbuyout of minority interest, $21.7 million repayments of debt obligations, $2.9 million repayments of capital leases anddividends payment of $21.9 million (see Note 8 of “Notes to Consolidated Financial Statements”) to shareholders andminority interest. The cash used in financing activities was offset partially by cash generated from exercises of stockoptions to purchase Creative ordinary shares, which amounted to $4.1 million and $30.8 million proceeds from debtobligations.
During fiscal 2002, $40.7 million was used for financing activities compared with $125.7 million in fiscal 2001. Cash usedfor financing included $18.0 million to purchase and retire 2.7 million Creative ordinary shares (see Note 7 of “Notes toConsolidated Financial Statements”), $18.0 million for dividends paid (see Note 8 of “Notes to Consolidated FinancialStatements”), $10.0 million to buyout a subsidiary’s preference shares issued to minority interests (see Note 12 of “Notesto Consolidated Financial Statements”), and $2.8 million to repay debt obligations. The cash used in financing activitieswas offset partially by cash generated from exercises of stock options to purchase Creative ordinary shares amounting to$8.2 million.
As of June 30, 2003, in addition to cash reserves and excluding long term loans, Creative has credit facilities totaling $92.5million for overdrafts, guarantees, letters of credit and fixed short-term loans, of which approximately $87.9 million wereunutilized. Creative continually reviews and evaluates investment opportunities, including potential acquisitions of, andinvestments in, companies that can provide Creative with technologies, subsystems or complementary products that canbe integrated into or offered with its existing product range. Creative generally satisfies its working capital needs frominternally generated cash flows. Management believes that Creative has adequate resources to meet its projected workingcapital and other cash needs for at least the next twelve months. To date, inflation has not had a significant impact onCreative’s operating results.

16
CONTRACTUAL OBLIGATIONS AND COMMERCIAL COMMITMENTS
The following table presents the contractual obligations and commercial commitments of Creative as of June 30, 2003:
Payments Due by Period (US$’000)
Less than 1 to 3 4 to 5 After 5Contractual Obligations Total 1 year years years years
Long Term Debt $ 29,091 $ 3,423 $ 6,845 $ 6,845 $ 11,978
Convertible Note 8,764 – 8,764 – –
Capital Lease Obligations 3,433 1,949 1,439 45 –
Operating Leases 40,939 9,976 14,027 3,832 13,104
Unconditional Purchase Obligations 49,470 49,470 – – –
Other Obligations 522 522 – – –
Total Contractual Cash Obligations $ 132,219 $ 65,340 $ 31,075 $ 10,722 $ 25,082
As of June 30, 2003, Creative has utilized approximately $4.6 million under guarantees, letters of credit, overdraft andshort-term loan facilities.
RECENTLY ISSUED ACCOUNTING PRONOUNCEMENTS
Please refer to Note 1 of “Notes to Consolidated Financial Statements” for the discussion of recently issued accountingpronouncements.
MANAGEMENT’S DISCUSSION AND ANALYSIS OFFINANCIAL CONDITION AND RESULTS OF OPERATIONS

17
TO THE BOARD OF DIRECTORS ANDSHAREHOLDERS OF CREATIVE TECHNOLOGY LTD.
In our opinion, the accompanying consolidated balance sheets and the related consolidated statements of operations, ofcash flows and of shareholders’ equity present fairly, in all material respects, the financial position of Creative TechnologyLtd. and its subsidiaries at June 30, 2003 and 2002, and the results of their operations and their cash flows for each ofthe three years in the period ended June 30, 2003 in conformity with accounting principles generally accepted in theUnited States of America. These financial statements are the responsibility of Creative’s management; our responsibilityis to express an opinion on these financial statements based on our audits. We conducted our audits of these statementsin accordance with auditing standards generally accepted in the United States of America, which require that we planand perform the audit to obtain reasonable assurance about whether the financial statements are free of materialmisstatement. An audit includes examining, on a test basis, evidence supporting the amounts and disclosures in thefinancial statements, assessing the accounting principles used and significant estimates made by management, and evaluatingthe overall financial statement presentation. We believe that our audits provide a reasonable basis for our opinion.
PricewaterhouseCoopersSingaporeAugust 5, 2003
REPORT OF INDEPENDENT ACCOUNTANTS

18
(In US$’000, except per share data)
June 30 June 302003 2002
ASSETS
Current assets:
Cash and cash equivalents $ 232,053 $ 166,917
Marketable securities – 1,388
Accounts receivable, less allowances of $18,417 and $22,159 61,225 85,193
Inventory 80,367 108,549
Other assets and prepaids 11,269 17,773
Total current assets 384,914 379,820
Property and equipment, net 104,404 104,748
Investments 49,168 66,688
Other non-current assets 108,357 115,122
Total Assets $ 646,843 $ 666,378
LIABILITIES AND SHAREHOLDERS’ EQUITY
Current liabilities:
Accounts payable $ 52,869 $ 64,809
Accrued liabilities 79,573 77,831
Income taxes payable 37,564 43,794
Current portion of long term obligations and others 5,519 27,441
Total current liabilities 175,525 213,875
Long term obligations 39,027 16,782
Minority interest in subsidiaries 3,454 11,769
Shareholders’ equity:Ordinary shares (’000); S$0.25 par value;
Authorized: 200,000 sharesOutstanding: 79,714 and 78,866 shares 7,713 7,592
Additional paid-in capital 314,572 311,445
Unrealized holding gains on quoted investments 14,189 20,636
Deferred share compensation (4,305) (8,836)
Retained earnings 96,668 93,115
Total shareholders’ equity 428,837 423,952
Total Liabilities and Shareholders’ Equity $ 646,843 $ 666,378
The accompanying notes are an integral part of these consolidated financial statements.
CONSOLIDATED BALANCE SHEETS

19
(In US$’000, except per share data)
Years ended June 30
2003 2002 2001
Sales, net $ 701,769 $ 805,905 $1,226,068
Cost of goods sold 452,952 543,382 894,236
Gross profit 248,817 262,523 331,832
Operating expenses:
Selling, general and administrative 162,839 170,122 230,417
Research and development 58,775 38,248 54,022
Other charges (Notes 13 and 16) – 26,080 22,814
Operating income 27,203 28,073 24,579
Loss from investments, net (6,049) (45,414) (148,490)
Interest income and other, net 4,864 5,155 2,416
Income (loss) before income taxes and minority interest 26,018 (12,186) (121,495)
Provision for income taxes (2,720) (5,698) (8,409)
Minority interest in loss (income) 79 (1,843) (469)
Net income (loss) $ 23,377 $ (19,727) $ (130,373)
Basic earnings (loss) per share $ 0.30 $ (0.27) $ (1.65)
Weighted average ordinary shares outstanding (’000) 79,202 73,182 79,049
Diluted earnings (loss) per share $ 0.29 $ (0.27) $ (1.65)
Weighted average ordinary shares andequivalents outstanding (’000) 80,851 73,182 79,049
The accompanying notes are an integral part of these consolidated financial statements.
CONSOLIDATED STATEMENTS OF OPERATIONS

20
Increase (decrease) in cash and cash equivalents (in US$’000)Years ended June 30
2003 2002 2001Cash flows from operating activities:
Net income (loss) $ 23,377 $ (19,727) $ (130,373)Adjustments to reconcile net income (loss) to net cash
provided by operating activities:Depreciation of fixed assets 19,094 24,636 20,706Amortisation of intangible assets 9,129 5,233 6,298Deferred share compensation amortization 3,706 2,759 3,254Write off of acquired in-process technology – 26,080 –Minority interest in (loss) income (79) 1,843 469Equity share in loss of unconsolidated investments 2,186 1,220 927(Gain) loss on disposal of fixed assets (113) 215 329Write downs of investments and other non-current assets 13,618 49,303 214,754Gain from investments, net (7,777) (5,341) (49,934)
Changes in assets and liabilities, net:Accounts receivable 23,968 18,243 4,478Inventory 28,182 50,589 75,066Marketable securities 1,388 2,193 17,575Other assets and prepaids 6,368 1,298 15,673Accounts payable (11,940) (33,659) (94,608)Accrued and other liabilities (3,125) (29,431) (6,360)Income taxes, including deffered tax (8,294) (6,014) (749)
Net cash provided by operating activities 99,688 89,440 77,505
Cash flows from investing activities:Capital expenditures, net (15,695) (8,730) (34,957)Proceeds from sale of fixed assets 2,605 383 138Proceeds from sale of quoted investments 11,248 13,936 88,874Purchase of new subsidiaries (net of cash acquired) – (25,806) –Purchase of investments (5,516) (9,152) (110,397)Increase in other non current assets, net (4,914) (20,629) (13,106)
Net cash used in investing activities (12,272) (49,998) (69,448)
Cash flows from financing activities:(Decrease) increase in minority shareholders’ loan
and equity balance (6,690) 229 1,071Net proceeds from issuance of preference shares
to minority shareholders – – (670)Buyout of subsidiary’s preference shares issued to minority interest – (10,019) –Buyout of subsidiary’s minority interest (3,992) – –Proceeds from exercise of ordinary share options 4,073 8,195 9,265Repurchase of ordinary shares – (18,013) (91,029)Proceeds from debt obligations 30,802 – –Repayments of debt obligations (21,697) (2,758) (4,671)Repayments of capital leases (2,887) (292) (54)Dividends paid to ordinary shareholders (19,824) (18,024) (39,414)Dividends paid to minority interest (2,065) – (155)
Net cash used in financing activities (22,280) (40,682) (125,657)
CONSOLIDATED STATEMENTS OF CASH FLOWS
The accompanying notes are an integral part of these consolidated financial statements.

21
Net increase (decrease) in cash and cash equivalents 65,136 (1,240) (117,600)Cash and cash equivalents at beginning of year 166,917 168,157 285,757
Cash and cash equivalents at end of year $ 232,053 $ 166,917 $ 168,157
Supplemental disclosure of cash flow information:Interest paid $ 1,061 $ 752 $ 1,028
Income taxes paid, net $ 10,951 $ 11,711 $ 9,158
Non cash transaction:Buyout of a subsidiary’s preference shares – $ 11,789 $ –
Shares issued for aqcuisition of subsidiary – $ 71,724 $ –
Purchase of property and equipment financed by capital leases – – $ 228
The accompanying notes are an integral part of these consolidated financial statements.
Years ended June 30
2003 2002 2001
22
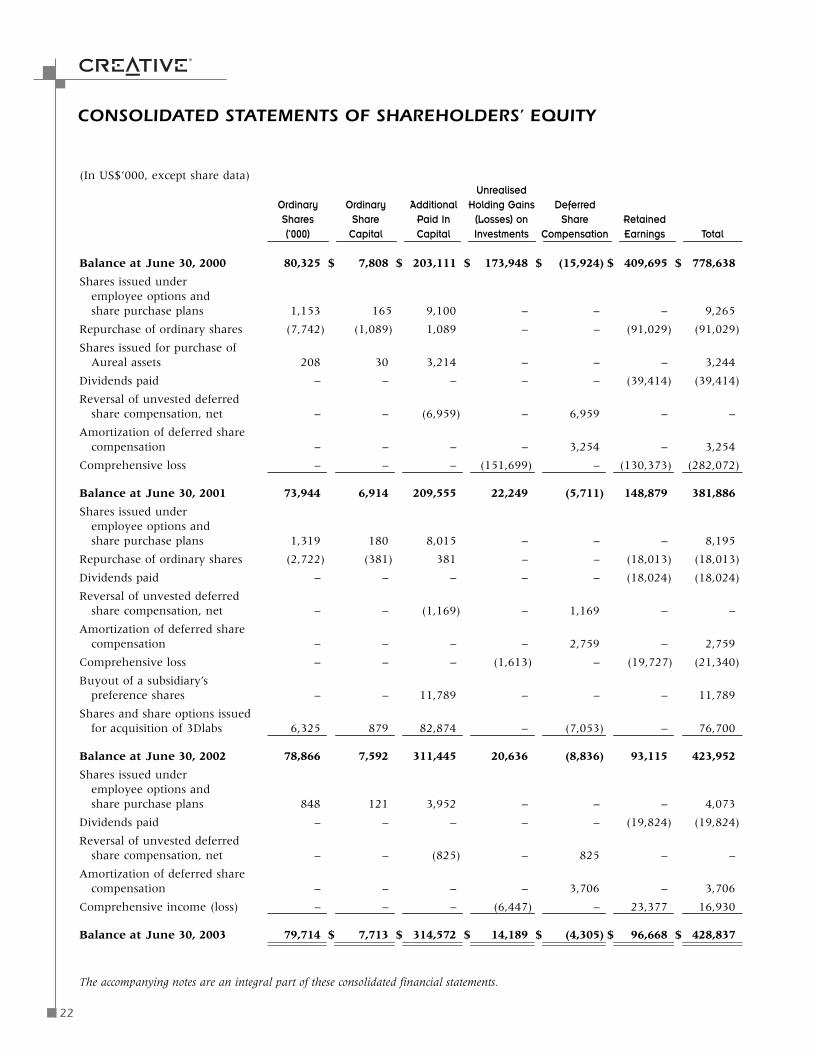
(In US$’000, except share data)Unrealised
Ordinary Ordinary Additional Holding Gains DeferredShares Share Paid In (Losses) on Share Retained(’000) Capital Capital Investments Compensation Earnings Total
Balance at June 30, 2000 80,325 $ 7,808 $ 203,111 $ 173,948 $ (15,924) $ 409,695 $ 778,638
Shares issued underemployee options andshare purchase plans 1,153 165 9,100 – – – 9,265
Repurchase of ordinary shares (7,742) (1,089) 1,089 – – (91,029) (91,029)
Shares issued for purchase ofAureal assets 208 30 3,214 – – – 3,244
Dividends paid – – – – – (39,414) (39,414)
Reversal of unvested deferredshare compensation, net – – (6,959) – 6,959 – –
Amortization of deferred share compensation – – – – 3,254 – 3,254
Comprehensive loss – – – (151,699) – (130,373) (282,072)
Balance at June 30, 2001 73,944 6,914 209,555 22,249 (5,711) 148,879 381,886
Shares issued underemployee options andshare purchase plans 1,319 180 8,015 – – – 8,195
Repurchase of ordinary shares (2,722) (381) 381 – – (18,013) (18,013)
Dividends paid – – – – – (18,024) (18,024)
Reversal of unvested deferredshare compensation, net – – (1,169) – 1,169 – –
Amortization of deferred sharecompensation – – – – 2,759 – 2,759
Comprehensive loss – – – (1,613) – (19,727) (21,340)
Buyout of a subsidiary’spreference shares – – 11,789 – – – 11,789
Shares and share options issuedfor acquisition of 3Dlabs 6,325 879 82,874 – (7,053) – 76,700
Balance at June 30, 2002 78,866 7,592 311,445 20,636 (8,836) 93,115 423,952
Shares issued underemployee options andshare purchase plans 848 121 3,952 – – – 4,073
Dividends paid – – – – – (19,824) (19,824)
Reversal of unvested deferredshare compensation, net – – (825) – 825 – –
Amortization of deferred sharecompensation – – – – 3,706 – 3,706
Comprehensive income (loss) – – – (6,447) – 23,377 16,930
Balance at June 30, 2003 79,714 $ 7,713 $ 314,572 $ 14,189 $ (4,305) $ 96,668 $ 428,837
The accompanying notes are an integral part of these consolidated financial statements.
CONSOLIDATED STATEMENTS OF SHAREHOLDERS’ EQUITY

23
NOTE 1 – SUMMARY OF SIGNIFICANT ACCOUNTING POLICIES
Basis of presentationThe consolidated financial statements include the financial statements of Creative Technology Ltd and Creative’s subsidiariesunder its effective control from their respective dates of acquisition, after elimination of intercompany transactions andbalances. The consolidated financial statements are presented in accordance with accounting principles generally acceptedin the United States of America (“US GAAP”). The preparation of financial statements in accordance with US GAAPrequires management to make estimates and assumptions that affect the amounts reported in the consolidated financialstatements and accompanying notes. Actual results could differ from those estimates. Creative conducts a substantialportion of its business in United States dollars (“US$” or “$”). All dollar amounts included in the financial statements andin the notes herein are United States dollars unless designated as Singapore dollars (“S$”). Creative’s fiscal year-end isJune 30. Creative generally operates on a thirteen week calendar closing on the Friday closest to the natural calendarquarter. For convenience, all quarters are described by their natural calendar dates.
Foreign exchangeThe functional currency of Creative and its subsidiaries is predominantly US dollar and accordingly, gains and lossesresulting from the translation of monetary assets and liabilities denominated in currencies other than the US dollar arereflected in the determination of net income (loss). Creative enters into forward exchange contracts to reduce its exposureto foreign exchange translation gains and losses. Forward exchange contracts are marked to market each period and theresulting gains and losses are included in the determination of net income or loss. No forward exchange contracts wereoutstanding at June 30, 2003. Included in interest and other expenses for fiscal years 2003, 2002 and 2001 are exchangegains of $5.4 million and $3.9 million, and exchange losses of $3.7 million, respectively.
At June 30, 2003, monetary assets and liabilities of Creative are denominated in the following currencies:
Approximate Percentage of $ Balance Denominated in:
US$ S$ EURO Other Currencies
Cash and cash equivalents 83 % 0 % 6 % 11 %
Accounts receivable, less allowances 72 % 0 % 15 % 13 %
Total current liabilities 79 % 9 % 6 % 6 %
Long-term obligations 32 % 67 % – 1 %
The exchange rates for the S$ and Euro utilized in translating the balance sheet at June 30, 2003, expressed in US$ perone S$ and Euro was 0.5704 and 1.1413, respectively.
Cash equivalentsCash equivalents consist of highly liquid investment instruments with original or remaining maturities of three monthsor less at the time of purchase. All deposits are in short term deposit and money market accounts with various banks. Thisdiversification of risk is consistent with Creative’s policy to maintain liquidity and ensure the safety of principal. Includedin cash equivalents as of June 30, 2003 and 2002 are fixed rate deposits of $188.2 million and $128.0 million respectively.
In fiscal 2002, a total of $4.5 million in the fixed rate deposits was held as collateral for one of the subsidiary’s bankoverdraft and short term loan facilities (see Note 11), but in fiscal 2003, the entire outstanding balances has been repaidand all liabilities were discharged.
Marketable SecuritiesCreative determines the appropriate classification of marketable securities at the time of acquisition and evaluates such designationat each balance sheet date. For all periods presented, Creative has classified marketable securities as trading securities, andaccordingly such securities are stated at their market values based on the last transacted prices at each balance sheet date. Theresulting net unrealized gains or losses on marketable securities are included in earnings in the period they are incurred.
NOTES TO CONSOLIDATED FINANCIAL STATEMENTS

24
NOTES TO CONSOLIDATED FINANCIAL STATEMENTS
NOTE 1 – SUMMARY OF SIGNIFICANT ACCOUNTING POLICIES (Cont’d)
Fair value of financial instrumentsFor certain of Creative’s financial instruments, including cash equivalents, accounts receivable, accounts payable andaccrued expenses, the carrying amounts approximate fair value due to their short maturities. The amounts shown for longterm obligations also approximate fair value because current interest rates charged to Creative for debts of similar maturitiesare substantially the same.
InventoryInventory is stated at the lower of cost or market. Cost is determined using standard cost, appropriately adjusted at balancesheet date to approximate actual cost on a weighted average basis. In the case of finished products and work-in-progress,cost includes materials, direct labor and an appropriate proportion of production overheads.
Management performs a detailed assessment of inventory at each balance sheet date to establish provisions for excess andobsolete inventories. Evaluation includes a review of, among other factors, historical sales, current economic trends,forecasted sales, demand requirements, product lifecycle and product development plans, quality issues, and currentinventory levels.
Property and equipmentProperty and equipment are stated at cost less accumulated depreciation. Depreciation is computed using the straight-linemethod over the estimated useful lives of the assets. Leasehold improvements are amortized over the shorter of theremaining facility lease term or the estimated useful lives of the improvements. No depreciation is provided on freeholdland and construction in progress.
InvestmentsCreative holds equity investments in various companies pursuant to which it has acquired anywhere from less than 1%to 100% of the issuer’s outstanding capital stock. Investments in which Creative acquires more than 50% of the outstandingcapital stock of an entity, or which are under the effective control of Creative, are treated as investments in subsidiaries,and the balance sheets and results of operations of these subsidiaries are fully consolidated after making allowance for anyminority interests. Companies in which Creative’s investment totals between 20% and 50% of such company’s capitalstock are treated as associated companies and recorded on an equity basis, whereby Creative adjusts its cost of investmentsto recognize its share of all post acquisition results of operations.
Non quoted investments of less than 20% in an entity are carried at cost, less provisions for permanent impairment wherenecessary.
In accordance with SFAS 115, “Accounting for Certain Investments in Debt and Equity Securities,” quoted investmentsof less than 20% in an entity are classified as available-for-sale. Such investments are reported at fair value with theunrealized gains and losses included as a separate component of shareholders’ equity. Unrealized losses are chargedagainst income when a decline in fair value is determined to be other than temporary. Realized gains and losses upon thesale or disposition of such investments are based on the average cost of the specific investments sold.
The investment portfolio is monitored on a periodic basis for impairment. Creative’s investments in these companies areinherently risky because the markets for the technologies or products they have under development are typically in theearly stages and may never develop. In the event that the carrying value of an investment exceeds its fair value and thedecline in value is determined to be other-than-temporary, an impairment charge is recorded and a new cost basis for theinvestment is established. Fair values for investments in public companies are determined using quoted market prices.Fair values for investments in privately-held companies are estimated based upon one or more of the following: pricingmodels using historical and forecasted financial information and current market rates, liquidation values, the values ofrecent rounds of financing, or quoted market prices of comparable public companies.

25
In order to determine whether a decline in value is other-than-temporary, Creative evaluates, among other factors: theduration and extent to which the fair value has been less than the carrying value; the financial condition of and businessoutlook for the company, including key operational and cash flow metrics, current market conditions and future trendsin the company’s industry, and the company’s relative competitive position within the industry; and Creative’s intent andability to retain the investment for a period of time sufficient to allow for any anticipated recovery in fair value.
A summary of investments is as follows (in US$’000):
As of June 30
2003 2002
Non quoted investments $ 12,944 $ 15,924Quoted investments 36,224 50,764
Total investments $ 49,168 $ 66,688
AcquisitionsCreative acquired 3Dlabs in fiscal 2002 (Note 16). The acquisition was accounted for under the purchase method ofaccounting, and accordingly, the estimated fair value of assets acquired and liabilities assumed and the results of operationswere included in Creative’s consolidated financial statements as of the effective date of the acquisition through the endof the period. There were no significant differences between the accounting policies of Creative and 3Dlabs.
Goodwill and other intangible assetsGoodwill and other intangible assets are stated at cost and relate principally to the acquisition of new subsidiaries accountedfor under the purchase method. Under this method, the purchase price has been allocated to the assets acquired, liabilitiesassumed and in-process technology based on their estimated fair market values at the dates of acquisition. Amountsallocated to acquired in-process technology are expensed in the period in which the acquisition is consummated. Thegoodwill and identifiable intangible assets acquired in connection with the acquisition of 3Dlabs have been accounted forin accordance with SFAS 141 and SFAS 142, “Business Combinations” and “Goodwill and Other Intangible Assets.”Intangible assets are amortized on a straight line basis over the estimated useful lives of the assets, ranging from one toseven years. Goodwill is not subject to amortization, but will be evaluated at least annually for impairment.
Creative reviews for impairment of goodwill on an annual basis. Reviews for impairment of goodwill and other intangibleassets are also conducted whenever events indicate that the carrying amount might not be recoverable. Factors thatCreative may consider important which could trigger an impairment review include the followings:
• significant under performance relative to expected historical or projected future operating results;• significant changes in the manner of use of the acquired assets or the strategy for Creative’s overall business;• significant negative industry or economic trends;• significant decline in Creative’s stock price for a sustained period; and• Creative market capitalization relative to net book value.
When the existence of one or more of the above factors indicates that the carrying value of the goodwill or intangible assetsmay be impaired, Creative measures any impairment based on a projected discounted cash flow method using a discountrate determined by the management to be commensurate with the risk inherent in Creative’s current business model.Creative performed an assessment for goodwill impairment as at June 30, 2003 and accordingly no impairment of goodwillis assessed.
26
NOTES TO CONSOLIDATED FINANCIAL STATEMENTS
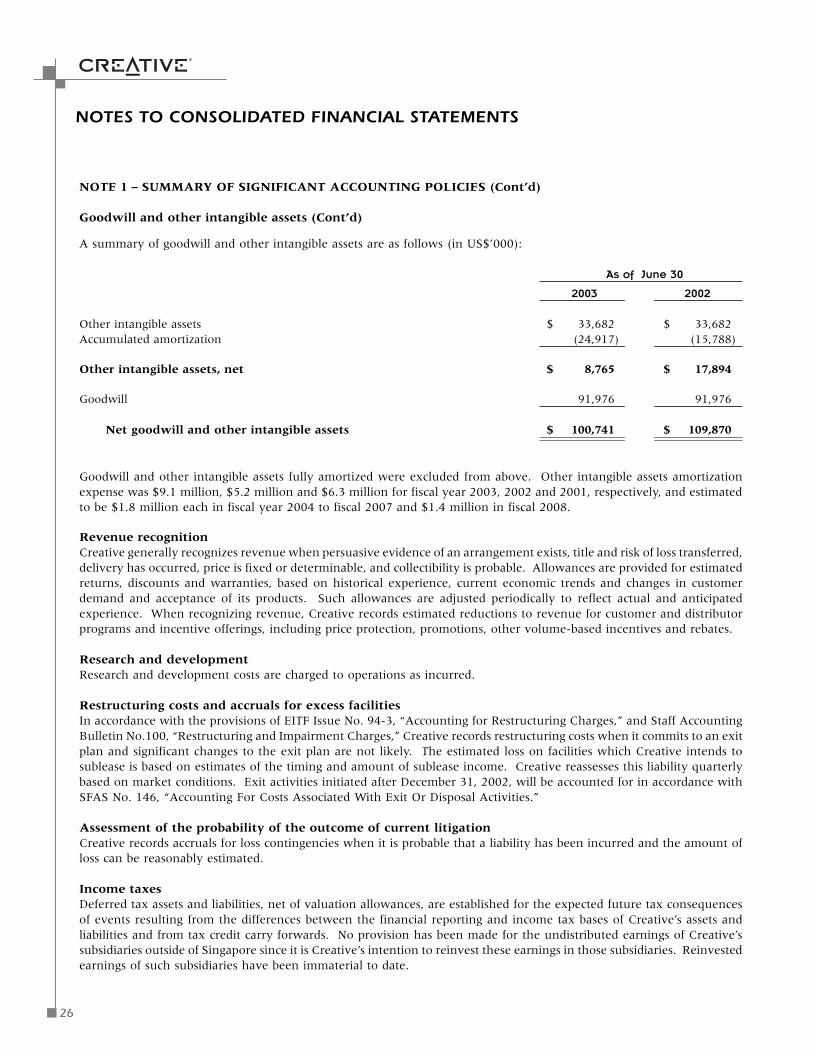
A summary of goodwill and other intangible assets are as follows (in US$’000):
As of June 30
2003 2002
Other intangible assets $ 33,682 $ 33,682Accumulated amortization (24,917) (15,788)
Other intangible assets, net $ 8,765 $ 17,894
Goodwill 91,976 91,976
Net goodwill and other intangible assets $ 100,741 $ 109,870
Goodwill and other intangible assets fully amortized were excluded from above. Other intangible assets amortizationexpense was $9.1 million, $5.2 million and $6.3 million for fiscal year 2003, 2002 and 2001, respectively, and estimatedto be $1.8 million each in fiscal year 2004 to fiscal 2007 and $1.4 million in fiscal 2008.
Revenue recognitionCreative generally recognizes revenue when persuasive evidence of an arrangement exists, title and risk of loss transferred,delivery has occurred, price is fixed or determinable, and collectibility is probable. Allowances are provided for estimatedreturns, discounts and warranties, based on historical experience, current economic trends and changes in customerdemand and acceptance of its products. Such allowances are adjusted periodically to reflect actual and anticipatedexperience. When recognizing revenue, Creative records estimated reductions to revenue for customer and distributorprograms and incentive offerings, including price protection, promotions, other volume-based incentives and rebates.
Research and developmentResearch and development costs are charged to operations as incurred.
Restructuring costs and accruals for excess facilitiesIn accordance with the provisions of EITF Issue No. 94-3, “Accounting for Restructuring Charges,” and Staff AccountingBulletin No.100, “Restructuring and Impairment Charges,” Creative records restructuring costs when it commits to an exitplan and significant changes to the exit plan are not likely. The estimated loss on facilities which Creative intends tosublease is based on estimates of the timing and amount of sublease income. Creative reassesses this liability quarterlybased on market conditions. Exit activities initiated after December 31, 2002, will be accounted for in accordance withSFAS No. 146, “Accounting For Costs Associated With Exit Or Disposal Activities.”
Assessment of the probability of the outcome of current litigationCreative records accruals for loss contingencies when it is probable that a liability has been incurred and the amount ofloss can be reasonably estimated.
Income taxesDeferred tax assets and liabilities, net of valuation allowances, are established for the expected future tax consequencesof events resulting from the differences between the financial reporting and income tax bases of Creative’s assets andliabilities and from tax credit carry forwards. No provision has been made for the undistributed earnings of Creative’ssubsidiaries outside of Singapore since it is Creative’s intention to reinvest these earnings in those subsidiaries. Reinvestedearnings of such subsidiaries have been immaterial to date.
NOTE 1 – SUMMARY OF SIGNIFICANT ACCOUNTING POLICIES (Cont’d)
Goodwill and other intangible assets (Cont’d)
27
Concentrations of credit riskFinancial instruments that potentially subject Creative to significant concentrations of credit risk consist principally of cashand cash equivalents and trade accounts receivable. Creative limits the amount of credit exposure to any one financialinstitution. Creative sells its products to original equipment manufacturers, distributors and key retailers. Creativebelieves that the concentration of credit risk in its trade receivables is substantially mitigated due to performance ofongoing credit evaluations of its customers’ financial condition, use of short collection terms, use of letters of credit incertain circumstances, procurement of credit insurance coverage and the geographical dispersion of sales. Creativeestablishes allowances for doubtful accounts, returns and discounts for specifically identified doubtful accounts, returnsand discounts based on credit profiles of its customers, current economic trends, contractual terms and conditions andhistorical payment, return and discount experience.
Stock-based compensationCreative accounts for stock-based employee compensation in accordance with Accounting Principles Board Opinion(“APB”) No. 25, “Accounting for Stock Issued to Employees,” and related Interpretations, and complies with the disclosureprovisions of Statement of Financial Accounting Standards (“SFAS”) No. 123, “Accounting for Stock-Based Compensation,”and SFAS 148, “Accounting for Stock-Based Compensation, Transition and Disclosures.” Accordingly, compensationexpense for stock options is measured as the excess, if any, of the fair market value of Creative’s stock at the date of thegrant over the stock option exercise price. See Note 9.
Recently issued accounting pronouncementsIn December 2002, the FASB issued SFAS 148, “Accounting for Stock-Based Compensation, Transition and Disclosures.”SFAS 148 provides alternative methods of transition for a voluntary change to the fair value based method of accountingfor stock-based employee compensation. SFAS 148 also requires that disclosures of the pro forma effect of using the fairvalue method of accounting for stock-based employee compensation be displayed more prominently and in a tabularformat. Additionally, SFAS 148 requires disclosure of the pro forma effect in interim financial statements. Creative hasadopted the interim and annual disclosure requirements of SFAS 148 in this fiscal year 2003.
In January 2003, the Financial Accounting Standards Board issued FASB Interpretation (“FIN”) No. 46, “Consolidation ofVariable Interest Entities.” Under that interpretation, certain entities known as Variable Interest Entities (“VIE”) must beconsolidated by the primary beneficiary of the entity. The primary beneficiary is generally defined as having the majorityof the risks and rewards arising from the VIE. For VIEs in which a significant (but not majority) variable interest is held,certain disclosures are required. FIN 46 requires disclosure of VIE in financial statements issued after January 31, 2003,if it is reasonably possible that as of the transition date: (1) the Company will be the primary beneficiary of an existingVIE that will require consolidation or, (2) the Company will hold a significant variable interest in, or have significantinvolvement with, an existing VIE. Any VIEs created after January 31, 2002, are immediately subject to the consolidationguidance in FIN 46. The measurement principles of this interpretation will be effective for the Company’s 2003 financialstatements. Creative does not have any significant entities that require disclosure or new consolidation as a result ofadopting the provisions of FIN 46.
In April 2003, the FASB issued SFAS 149, “Amendment of SFAS 133 on Derivative Instruments and Hedging Activities.”SFAS 149 amends and clarifies accounting and reporting for derivative instruments, including certain derivative instrumentsembedded in other contracts, and for hedging activities under SFAS 133, “Accounting for Derivative Instruments andHedging Activities.” In particular, this Statement clarifies under what circumstances a contract with an initial net investmentmeets the characteristic of a derivative. It also clarifies when a derivative contains a financing component that warrantsspecial reporting in the statement of cash flows. SFAS 149 is generally effective for contracts entered into or modified afterJune 30, 2003 and is not expected to have a material impact on Creative’s financial position or results of operations.
In May 2003, the FASB issued SFAS 150, “Accounting for Certain Financial Instruments with Characteristics of both Liabilitiesand Equity.” SFAS 150 establishes standards for how an issuer classifies and measures certain financial instruments withcharacteristics of both liabilities and equity. It requires that an issuer classify a financial instrument that is within its scope asa liability (or an asset in some circumstances). SFAS 150 is effective for interim periods beginning after June 15, 2003. Theadoption of SFAS 150 is not expected to have a material impact on Creative’s financial position or results of operations.

28
NOTE 2 – NET INCOME (LOSS) PER SHARE
In accordance with SFAS 128, “Earnings per Share,” Creative reports both basic earnings per share and diluted earningsper share. Basic earnings per share is computed using the weighted average number of ordinary shares outstanding duringthe period. Diluted earnings per share is computed using the weighted average number of ordinary and potentiallydilutive ordinary equivalent shares outstanding during the period. Ordinary equivalent shares are excluded from thecomputation if their effect is anti-dilutive. In computing the diluted earnings per share, the treasury stock method is usedto determine, based on average stock prices for the respective periods, the ordinary equivalent shares to be purchasedusing proceeds received from the exercise of such equivalent shares. Other than the dilutive effect of stock options, thereare no other financial instruments that would impact the weighted average number of ordinary shares outstanding usedfor computing diluted earnings per share. The potentially dilutive ordinary equivalent shares outstanding under theemployee share purchase plan were not material.
Following is a reconciliation between the average number of ordinary shares outstanding and equivalent shares outstanding(in ‘000):
As of June 30
2003 2002 2001
Weighted average ordinary shares outstanding 79,202 73,182 79,049
Weighted average dilutive stock options outstanding 1,649 – –
Weighted average ordinary shares andequivalents outstanding 80,851 73,182 79,049
For fiscal 2003, approximately 0.5 million shares related to the convertible note were excluded from the computation ofdilutive earnings per share as the effect would be anti-dilutive.
For the fiscal 2002 and 2001, approximately 2.4 million and 2.0 million potentially dilutive shares were excluded fromthe determination of diluted net loss per share, as the effect of including such shares is anti-dilutive.
NOTES TO CONSOLIDATED FINANCIAL STATEMENTS

29
NOTE 3 – BALANCE SHEET DETAIL (in US$’000)
As of June 30
2003 2002Inventory:
Raw materials $ 20,189 $ 33,826
Work in progress 2,918 5,658
Finished products 57,260 69,065
Total inventory $ 80,367 $ 108,549
Estimated As of June 30
Useful Life 2003 2002Property and equipment:
Land and buildings 25 years $ 92,719 $ 83,698
Construction in progress – – 1,013
Machinery and equipment 3 - 6 years 44,239 50,880
Furniture, fixtures and office equipments 2 - 8 years 79,659 82,690
Leasehold improvements Term of lease 12,546 11,981
$ 229,163 $ 230,262
Accumulated depreciation (124,759) (125,514)
Net property and equipment $ 104,404 $ 104,748
Included in property and equipment are assets purchased under capital lease obligations with a cost and accumulateddepreciation of approximately $9.0 million and $4.6 million for fiscal 2003 and $10.4 million and $2.4 million for fiscal2002, respectively.
As of June 30
2003 2002Other non-current assets:
Goodwill $ 91,976 $ 91,976
Other intangible assets 8,765 17,894
Other non-current assets 7,616 5,252
Total other non-current assets $ 108,357 $ 115,122
As of June 30
2003 2002Other accrued liabilities:
Marketing accruals $ 20,732 $ 20,764
Payroll accruals 18,177 19,188
Royalty accruals 6,319 5,092
Other accruals 34,345 32,787
Total other accrued liabilities $ 79,573 $ 77,831
Other accruals of $34.3 million and $32.8 million as of June 30, 2003 and 2002 includes accruals for various operatingexpense items that individually account for less than 5% of the total current liabilities.
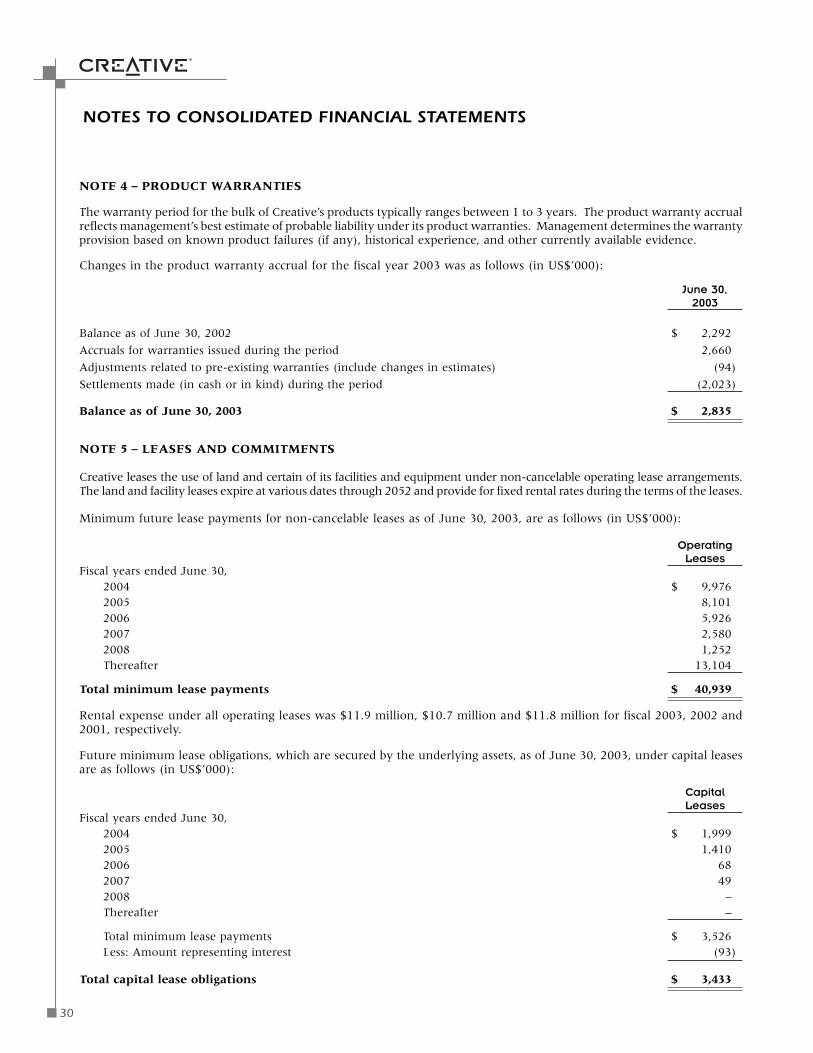
30
NOTE 4 – PRODUCT WARRANTIES
The warranty period for the bulk of Creative’s products typically ranges between 1 to 3 years. The product warranty accrualreflects management’s best estimate of probable liability under its product warranties. Management determines the warrantyprovision based on known product failures (if any), historical experience, and other currently available evidence.
Changes in the product warranty accrual for the fiscal year 2003 was as follows (in US$’000):
June 30,2003
Balance as of June 30, 2002 $ 2,292
Accruals for warranties issued during the period 2,660
Adjustments related to pre-existing warranties (include changes in estimates) (94)
Settlements made (in cash or in kind) during the period (2,023)
Balance as of June 30, 2003 $ 2,835
NOTE 5 – LEASES AND COMMITMENTS
Creative leases the use of land and certain of its facilities and equipment under non-cancelable operating lease arrangements.The land and facility leases expire at various dates through 2052 and provide for fixed rental rates during the terms of the leases.
Minimum future lease payments for non-cancelable leases as of June 30, 2003, are as follows (in US$’000):
OperatingLeases
Fiscal years ended June 30,2004 $ 9,9762005 8,1012006 5,9262007 2,5802008 1,252Thereafter 13,104
Total minimum lease payments $ 40,939
Rental expense under all operating leases was $11.9 million, $10.7 million and $11.8 million for fiscal 2003, 2002 and2001, respectively.
Future minimum lease obligations, which are secured by the underlying assets, as of June 30, 2003, under capital leasesare as follows (in US$’000):
CapitalLeases
Fiscal years ended June 30,2004 $ 1,9992005 1,4102006 682007 492008 –Thereafter –
Total minimum lease payments $ 3,526Less: Amount representing interest (93)
Total capital lease obligations $ 3,433
NOTES TO CONSOLIDATED FINANCIAL STATEMENTS
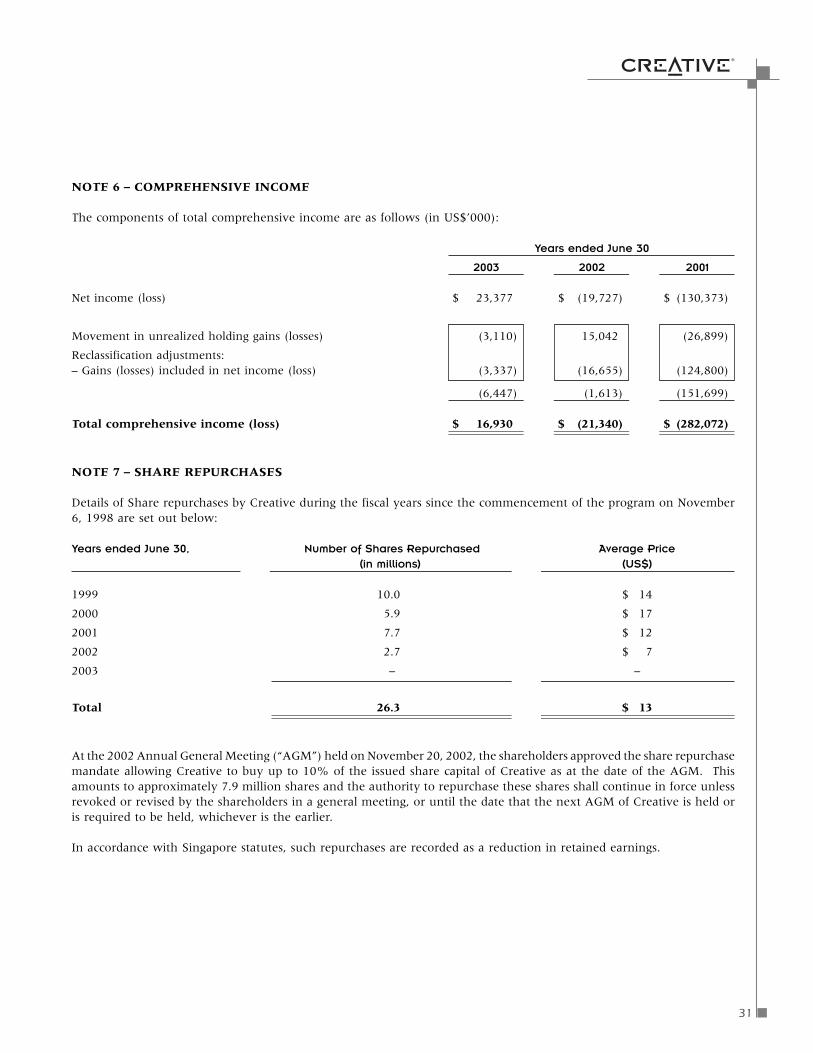
31
NOTE 6 – COMPREHENSIVE INCOME
The components of total comprehensive income are as follows (in US$’000):
Years ended June 30
2003 2002 2001
Net income (loss) $ 23,377 $ (19,727) $ (130,373)
Movement in unrealized holding gains (losses) (3,110) 15,042 (26,899)
Reclassification adjustments:– Gains (losses) included in net income (loss) (3,337) (16,655) (124,800)
(6,447) (1,613) (151,699)
Total comprehensive income (loss) $ 16,930 $ (21,340) $ (282,072)
NOTE 7 – SHARE REPURCHASES
Details of Share repurchases by Creative during the fiscal years since the commencement of the program on November6, 1998 are set out below:
Years ended June 30, Number of Shares Repurchased Average Price(in millions) (US$)
1999 10.0 $ 14
2000 5.9 $ 17
2001 7.7 $ 12
2002 2.7 $ 7
2003 – –
Total 26.3 $ 13
At the 2002 Annual General Meeting (“AGM”) held on November 20, 2002, the shareholders approved the share repurchasemandate allowing Creative to buy up to 10% of the issued share capital of Creative as at the date of the AGM. Thisamounts to approximately 7.9 million shares and the authority to repurchase these shares shall continue in force unlessrevoked or revised by the shareholders in a general meeting, or until the date that the next AGM of Creative is held oris required to be held, whichever is the earlier.
In accordance with Singapore statutes, such repurchases are recorded as a reduction in retained earnings.
32
NOTES TO CONSOLIDATED FINANCIAL STATEMENTS
NOTE 8 – DIVIDENDS
At the Annual General Meeting held on November 20, 2002, Creative’s shareholders approved an ordinary dividend of$0.25 for each outstanding ordinary share of Creative for the fiscal year ending June 30, 2003. Dividends of $19.8 millionwere paid on December 19, 2002 to all shareholders of record as of December 5, 2002. Creative paid an ordinary dividendof $0.25 amounting to $18.0 million in the fiscal year ended June 30, 2002 and an ordinary dividend of $0.25 and a specialdividend of $0.25 amounting to $39.4 million in the fiscal year ended June 30, 2001.
NOTE 9 – EMPLOYEE SHARE PURCHASE AND STOCK OPTION PLANS
Creative Employee Share Purchase PlanAs approved by the shareholders in November 1999, Creative has adopted the 1999 Employee Share Purchase Plan thatpermits substantially all employees to purchase ordinary shares of Creative. Participating employees may purchaseordinary shares through regular payroll deductions accumulated during each offering period at a purchase price of 85%of the lower of the fair market value on the offering date or on the purchase date. Each offering period consists of foursix months purchase periods, except for the first purchase period in the first offering period, which was four months. Atotal of 1.0 million ordinary shares were reserved for issuance under this plan. In addition, on each July 1, the aggregatenumber of ordinary shares reserved for issuance under the plan shall be increased automatically by 1% of the total numberof outstanding ordinary shares of Creative on the immediately preceding June 30; provided that the aggregate sharesreserved under this plan shall not exceed 5.0 million shares.
In fiscal 2003, 2002 and 2001, 282,700, 248,000 and 225,000 shares were issued at a weighted average exercise price of$5.24, $5.19 and $10.80 per share under Creative’s Employee Share Purchase Plan respectively.
Creative Employee Stock Option PlansIn December 1994, Creative adopted the new Creative Technology Employees’ Share Option Scheme (the “New Plan”).Options granted under this plan were in accordance with Section 422(a) of the US Internal Revenue Code of 1986, asamended. On November 13, 1996, at a special meeting, shareholders approved certain changes to the New Plan to makeit less restrictive. Under the amended New Plan, the total number of shares that could be granted was increased to anoverall maximum of 15% of the issued share capital of Creative. The amended New Plan also provided for incentive stockoptions to be granted to employees of Creative on a quarterly basis, at the average market price established on the fivedays closing immediately prior to the date of grant. The options vested at the rate of 25% at the end of each anniversaryof the grant date and were exercisable over a period not exceeding five years from the date of grant.
As of October 6, 1998, Creative is no longer subject to the listing rules of the Singapore Exchange but is required only tocomply with the listing rules of NASDAQ, including rules governing stock option plans. Since many of Creative employeesand shareholders are located in the United States of America, Creative has obtained shareholders’ approval on December30, 1998 to replace the New Plan with the Creative Technology (1999) Share Option Scheme (“1999 Scheme”), which ismore in accordance with US practice. The 1999 Scheme allows options to be granted to full-time employees as well asconsultants and non-executive directors. The total number of shares that may be granted as options is 7.5 million providedthat such amount shall be automatically increased on the first day (July 1) of each of the five fiscal years ending June 30,2001, 2002, 2003, 2004 and 2005 by four percent of the issued share capital of Creative as at the last day of the immediatepreceding fiscal year. The Option Committee has the discretion to decide the vesting schedule in the letter of offer. If itis not specifically stated in the letter of offer, 1/4 of the total amount of the grant vest on the first anniversary of the grantdate and 1/48 of the total amount of the grant on the last day of each calendar month thereafter. The exercise price ofoptions granted under the 1999 Scheme may be less than the fair market value of the shares as of the date of grant andthe options expire after the tenth anniversary of the date of grant, except in the case of options granted to participantsother than employees, options expire not later than the fifth anniversary of the date of grant.
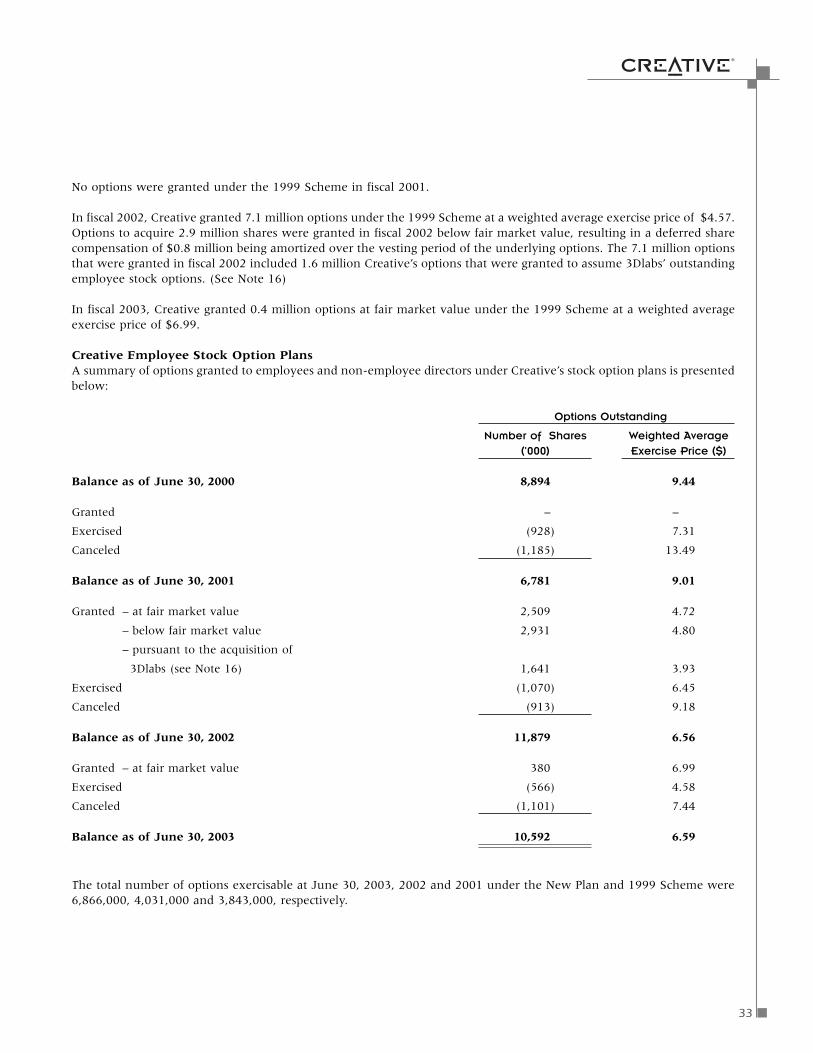
33
No options were granted under the 1999 Scheme in fiscal 2001.
In fiscal 2002, Creative granted 7.1 million options under the 1999 Scheme at a weighted average exercise price of $4.57.Options to acquire 2.9 million shares were granted in fiscal 2002 below fair market value, resulting in a deferred sharecompensation of $0.8 million being amortized over the vesting period of the underlying options. The 7.1 million optionsthat were granted in fiscal 2002 included 1.6 million Creative’s options that were granted to assume 3Dlabs’ outstandingemployee stock options. (See Note 16)
In fiscal 2003, Creative granted 0.4 million options at fair market value under the 1999 Scheme at a weighted averageexercise price of $6.99.
Creative Employee Stock Option PlansA summary of options granted to employees and non-employee directors under Creative’s stock option plans is presentedbelow:
Options Outstanding
Number of Shares Weighted Average
(’000) Exercise Price ($)
Balance as of June 30, 2000 8,894 9.44
Granted – –
Exercised (928) 7.31
Canceled (1,185) 13.49
Balance as of June 30, 2001 6,781 9.01
Granted – at fair market value 2,509 4.72
– below fair market value 2,931 4.80
– pursuant to the acquisition of
3Dlabs (see Note 16) 1,641 3.93
Exercised (1,070) 6.45
Canceled (913) 9.18
Balance as of June 30, 2002 11,879 6.56
Granted – at fair market value 380 6.99
Exercised (566) 4.58
Canceled (1,101) 7.44
Balance as of June 30, 2003 10,592 6.59
The total number of options exercisable at June 30, 2003, 2002 and 2001 under the New Plan and 1999 Scheme were6,866,000, 4,031,000 and 3,843,000, respectively.

34
NOTES TO CONSOLIDATED FINANCIAL STATEMENTS
Summary of outstanding options under Creative’s employee stock option plansThe following table summarizes option information for Creative’s employee stock option plans (New Plan and 1999Scheme) as at June 30, 2003.
Options Outstanding Options Exercisable
WeightedAverage
Remaining Weighted WeightedRange of Number Contractual Average Number Average
Exercise Prices Outstanding Life Exercise Price Exercisable Exercise Price(’000) (years) ($) (’000) ($)
$1.00 to $2.99 478 7.86 2.86 195 2.88
$3.00 to $4.99 4,407 8.28 4.46 1,642 4.45
$5.00 to $7.99 1,115 7.90 6.18 640 6.09
$8.00 to $10.99 4,577 5.91 9.10 4,377 9.11
$11.00 to $14.99 – – – – –
$15.00 to $22.00 15 6.67 18.40 12 18.40
10,592 7.19 6.59 6,866 7.55
Subsidiary Stock Option PlanEffective April 2000, unvested stock options to purchase 0.2 million shares of Creative’s ordinary stock granted under theNew Plan and 1999 Scheme to employees of a subsidiary were canceled in exchange for the right to receive optionsgranted by the subsidiary. The employees were allowed to retain outstanding Creative options vested on March 31, 2000until March 31, 2001 at which time unexercised options were canceled. In May 2000, the subsidiary adopted a separatestock option plan and employees were then granted options under this plan. The total number of shares that may begranted as options under the subsidiary 2000 Stock Option Plan (“2000 Plan”) is 8 million shares provided that suchamounts shall be automatically increased on the first day (July 1) of each of the five fiscal years ending June 30, 2001,2002, 2003, 2004 and 2005 by the lesser of (i) three hundred thousand shares or (ii) one percent of the issued share capitalof the Company as at the last day of the immediately preceding fiscal year. The exercise price of options granted underthe 2000 Plan may be less than the fair market value of the shares as of the date of grant and the options expire after thetenth anniversary of the date of grant.
In fiscal 2001, the subsidiary granted 0.9 million options under the 2000 Plan at a weighted average exercise price of $2.45.Included in the options granted during the fiscal year were replacement options granted to certain employees of CreativeTechnology Ltd to acquire 235,000 and 30,000 of the subsidiary company’s shares at an exercise price of $2.50 and $1.00per share respectively. These options were granted in lieu of the cancellation of 470,000 shares at an exercise price of $2.50per share and 60,000 shares at $1.00 per share. The replacement options vested immediately on grant date and the sharecompensation expense arising from replacement of options amounted to $0.7 million which was expensed in fiscal 2001.
The subsidiary did not grant options in fiscal 2002 and fiscal 2003.
NOTE 9 – EMPLOYEE SHARE PURCHASE AND STOCK OPTION PLANS (Cont’d)

35
A summary of options granted to employees, consultants and directors under the subsidiary’s stock option plan is presentedbelow:
Options Outstanding
Weighted AverageNumber of Shares Exercise Price
(’000) ($)
Balance as of June 30, 2000 3,841 1.98
Options granted 899 2.45
Options canceled (2,540) 1.80
Balance as of June 30, 2001 2,200 2.39
Options granted – –
Options canceled (2,195) 2.39
Balance as of June 30, 2002 5 2.50
Options granted – –
Options canceled (5) 2.50
Balance as of June 30, 2003 – –
Creative and Subsidiary Pro Forma DisclosuresThe fair value of the purchase rights under the Creative employee share purchase plan and stock option plan is estimatedusing the Black-Scholes model based on the following assumptions:
Fiscal 2003 Fiscal 2002 Fiscal 2001
Volatility 45% 60% 50%
Risk-free interest rates
Share purchase plan 2.18% to 3.26% 2.18% to 5.16% 3.78% to 6.09%
Stock options 1.27% to 3.01% 2.16% to 5.16% –
Dividend yield 3.0% 2.5% –
Expected lives:
Share purchase plan 6 months 6 months 6 months
Stock options 0.01 years after vest date 0.01 years after vest date –

36
NOTES TO CONSOLIDATED FINANCIAL STATEMENTS
Years ended June 30
2003 2002 2001
Weighted average fair value of stock options granted:
Stock options:
At market $ 1.70 $ 1.53 $ –
Below market $ – $ 3.74 $ –
The fair value of the purchase rights under the subsidiary stock option plan is estimated at the date of the grant using theBlack-Scholes model based on the following assumptions:
Fiscal 2003 Fiscal 2002 Fiscal 2001
Volatility – – –
Risk-free interest rates – – 3.78% to 6.34%
Dividend yield – – –
Expected lives – – 0.01 years after vest date
The following table illustrates the effect on net income and earnings per share if the company had applied the fair valuerecognition provisions of SFAS 123, “Accounting for Stock-Based Compensation,” to stock-based employee compensation:
In US$’000, except for per share data
Years ended June 30
2003 2002 2001
Net income (loss) as reported $ 23,377 $ (19,727) $ (130,373)
Less: Total stock-based employeecompensation expense determined underfair value based method for all awards,net of related tax effects (7,309) (6,031) (6,960)
Add: Stock-based employee compensationexpense included in reported net income,net of related tax effects 3,703 2,295 2,465
Pro forma net income (loss) $ 19,771 $ (23,463) $ (134,868)
Earnings (loss) per share:
Basic – as reported $ 0.30 $ (0.27) $ (1.65)
Basic – pro forma $ 0.25 $ (0.32) $ (1.71)
Diluted – as reported $ 0.29 $ (0.27) $ (1.65)
Diluted – pro forma $ 0.25 $ (0.32) $ (1.71)
NOTE 9 – EMPLOYEE SHARE PURCHASE AND STOCK OPTION PLANS (Cont’d)

37
NOTE 10 – INCOME TAXES
Creative was granted a Pioneer Certificate in 1990 under the Singapore Economic Expansion Incentives (Relief fromIncome Tax) Act, Cap. 86 for the design and manufacture of digital computer video, audio and multimedia products,including personal computers and related components, chipsets and software but not including interest income. ThePioneer Certificate exempted income derived from such activities (“Pioneer Income”) from tax in Singapore, subject tocertain conditions. The Pioneer Certificate expired in March 2000.
Creative has applied for a separate and new Pioneer Certificate. If Creative is awarded this new Pioneer Certificate, profitsunder the new Pioneer Certificate will be exempted from tax in Singapore. For fiscal 2001, 2002 and 2003, corporate taxwas provided for in full based on the standard tax rates of 24.5% for fiscal 2001 and 22% for fiscal 2002 and 2003, as theterms and agreements of the new Pioneer Certificate is currently still under negotiation as at to-date. The new PioneerCertificate is expected to result in the reduction of Creative’s provision for income taxes, subject to the terms andagreement by the Singapore Comptroller of Income Tax.
The Singapore and other components of income (loss) before income taxes are as follows (in US$’000):
Years ended June 30
2003 2002 2001
Singapore $ 36,199 $ 45,738 $ 25,193
Other countries (10,181) (57,924) (146,688)
Income (loss) before income taxes and minority interest $ 26,018 $ (12,186) $ (121,495)
The provisions for income taxes consists of (in US$’000):Years ended June 30
2003 2002 2001
Singapore $ 2,464 $ 4,780 $ 7,971
Other countries 256 918 438
Provisions for income taxes $ 2,720 $ 5,698 $ 8,409
Creative’s effective tax provision for fiscal 2003, 2002 and 2001 reconciles to the amount computed by applying theSingapore statutory rate of 22.0% for 2003 and 2002 and 24.5% for 2001 to income before income taxes and minorityinterest, as follows (in US$’000):
Years ended June 30
2003 2002 2001
Income tax (benefit) at Singapore statutory rate $ 5,724 $ (2,681) $ (29,766)
Tax excempt income
Singapore (11) (13) (834)
Others – – –
Non-deductible expenses and write-offs 1,433 3,013 5,486
Change in valuation allowances (6,106) (657) 8,699
Rate differences and others 1,680 6,036 24,824
Provisions for income taxes $ 2,720 $ 5,698 $ 8,409

38
NOTES TO CONSOLIDATED FINANCIAL STATEMENTS
Deferred tax assets at June 30, 2003 and 2002 consisted of the following (in US$’000):
As of June 30
2003 2002
Non-deductible reserves $ 26,110 $ 33,778
Net operating loss carryforwards 70,390 20,099
Other 1,971 1,765
Total deferred tax assets $ 98,471 $ 55,642
Valuation allowance for deferred tax assets (98,471) (55,642)
$ – $ –
Creative had Irish net operating loss carryforward of nil and approximately $1.9 million at June 30, 2003 and June 30,2002. US net operating loss carryforward is approximately $162.0 million and $47.8 million as at June 30, 2003 and June30, 2002. The Irish net operating losses have an indefinite carryforward period while the US net operating losses expirebetween 2005 to 2022. The utilization of these net operating losses by Creative is subject to certain conditions.
Valuation allowance is provided for Creative’s deferred tax assets as management believes substantial uncertainty existsregarding the realizability of these assets.
Creative has United States tax deductions not included in the net operating loss carryforward described above aggregatingapproximately $53.6 million at June 30, 2003 and June 30, 2002, as a result of the exercise of employee stock options,the tax benefit of which has not been realized. The tax benefit of the deductions, when realized will be accounted for asa credit to additional paid-in capital rather than a reduction of the income tax provision.
NOTE 11 – DEBT OBLIGATIONS
On March 13, 1996, Creative Technology Centre Pte Ltd (“CTC”), a Singapore subsidiary of Creative, entered into anagreement with two banks for an eight year term loan facility for up to S$60.0 million ($34.0 million) to finance theconstruction of Creative’s headquarters building in Singapore. The loan is repayable in nineteen quarterly installmentscomprising eighteen installments of S$1.5 million ($0.9 million) and a final installment for the remaining S$30.9 million($17.6 million). The repayment commenced on July 5, 1998. The interest on the outstanding loan balance is payable atthe banks’ cost of funds plus 1.25%. The interest rate charged for fiscal 2002 was at 2.19%. The loan is secured by a firstmortgage on the building and by way of a fixed and floating charge over all assets of CTC. At June 30, 2002, S$33.9 million($19.2 million) was outstanding. The outstanding balance was fully repaid by CTC in January 2003.
On November 21, 2002, CTC entered into a new nine year term loan facility for up to S$54.0 million ($30.8 million) withone of the banks. The loan is repayable in thirty-six quarterly installments of S$1.5 million ($0.9 million). The repaymentcommenced on March 31, 2003. The interest on the outstanding loan balance is based on bank’s floating rate plus margin1.5%. The interest rate charged for fiscal 2003 was at 2.15%. The loan is secured by a first mortgage on the building andby way of a fixed and floating charge over all assets of CTC. At June 30, 2003, S$51.0 million ($29.1 million) wasoutstanding.
NOTE 10 – INCOME TAXES (Cont’d)
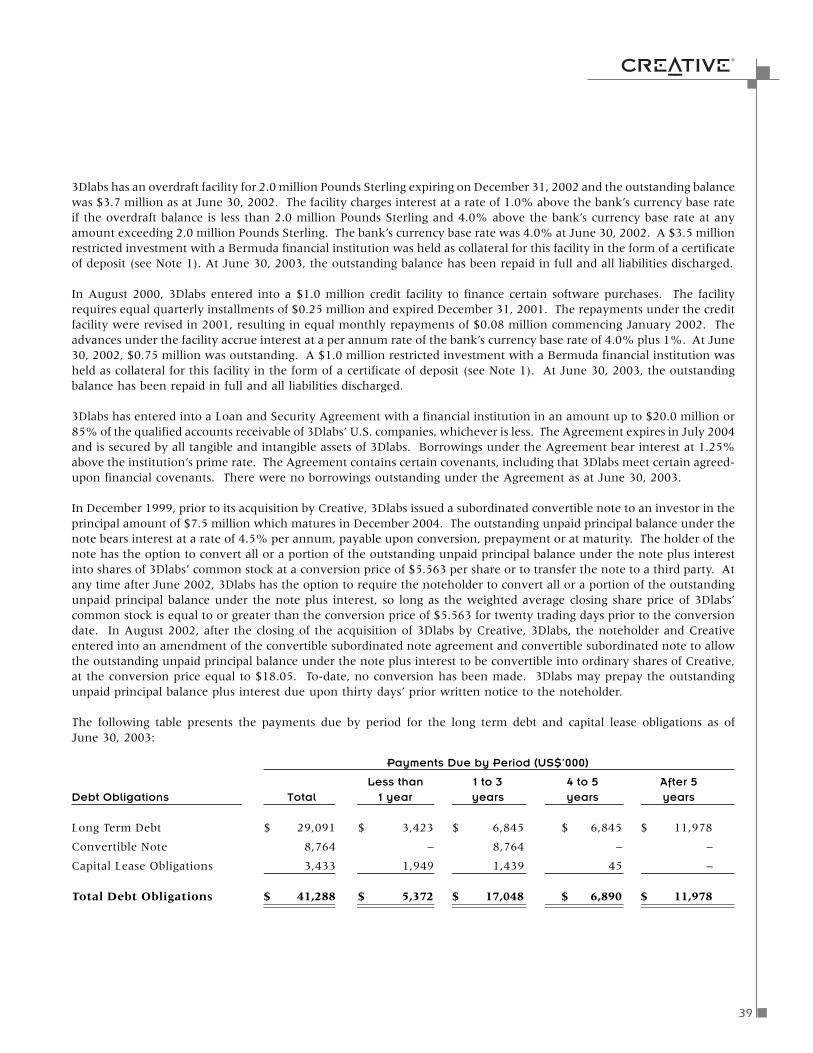
39
3Dlabs has an overdraft facility for 2.0 million Pounds Sterling expiring on December 31, 2002 and the outstanding balancewas $3.7 million as at June 30, 2002. The facility charges interest at a rate of 1.0% above the bank’s currency base rateif the overdraft balance is less than 2.0 million Pounds Sterling and 4.0% above the bank’s currency base rate at anyamount exceeding 2.0 million Pounds Sterling. The bank’s currency base rate was 4.0% at June 30, 2002. A $3.5 millionrestricted investment with a Bermuda financial institution was held as collateral for this facility in the form of a certificateof deposit (see Note 1). At June 30, 2003, the outstanding balance has been repaid in full and all liabilities discharged.
In August 2000, 3Dlabs entered into a $1.0 million credit facility to finance certain software purchases. The facilityrequires equal quarterly installments of $0.25 million and expired December 31, 2001. The repayments under the creditfacility were revised in 2001, resulting in equal monthly repayments of $0.08 million commencing January 2002. Theadvances under the facility accrue interest at a per annum rate of the bank’s currency base rate of 4.0% plus 1%. At June30, 2002, $0.75 million was outstanding. A $1.0 million restricted investment with a Bermuda financial institution washeld as collateral for this facility in the form of a certificate of deposit (see Note 1). At June 30, 2003, the outstandingbalance has been repaid in full and all liabilities discharged.
3Dlabs has entered into a Loan and Security Agreement with a financial institution in an amount up to $20.0 million or85% of the qualified accounts receivable of 3Dlabs’ U.S. companies, whichever is less. The Agreement expires in July 2004and is secured by all tangible and intangible assets of 3Dlabs. Borrowings under the Agreement bear interest at 1.25%above the institution’s prime rate. The Agreement contains certain covenants, including that 3Dlabs meet certain agreed-upon financial covenants. There were no borrowings outstanding under the Agreement as at June 30, 2003.
In December 1999, prior to its acquisition by Creative, 3Dlabs issued a subordinated convertible note to an investor in theprincipal amount of $7.5 million which matures in December 2004. The outstanding unpaid principal balance under thenote bears interest at a rate of 4.5% per annum, payable upon conversion, prepayment or at maturity. The holder of thenote has the option to convert all or a portion of the outstanding unpaid principal balance under the note plus interestinto shares of 3Dlabs’ common stock at a conversion price of $5.563 per share or to transfer the note to a third party. Atany time after June 2002, 3Dlabs has the option to require the noteholder to convert all or a portion of the outstandingunpaid principal balance under the note plus interest, so long as the weighted average closing share price of 3Dlabs’common stock is equal to or greater than the conversion price of $5.563 for twenty trading days prior to the conversiondate. In August 2002, after the closing of the acquisition of 3Dlabs by Creative, 3Dlabs, the noteholder and Creativeentered into an amendment of the convertible subordinated note agreement and convertible subordinated note to allowthe outstanding unpaid principal balance under the note plus interest to be convertible into ordinary shares of Creative,at the conversion price equal to $18.05. To-date, no conversion has been made. 3Dlabs may prepay the outstandingunpaid principal balance plus interest due upon thirty days’ prior written notice to the noteholder.
The following table presents the payments due by period for the long term debt and capital lease obligations as ofJune 30, 2003:
Payments Due by Period (US$’000)
Less than 1 to 3 4 to 5 After 5
Debt Obligations Total 1 year years years years
Long Term Debt $ 29,091 $ 3,423 $ 6,845 $ 6,845 $ 11,978
Convertible Note 8,764 – 8,764 – –
Capital Lease Obligations 3,433 1,949 1,439 45 –
Total Debt Obligations $ 41,288 $ 5,372 $ 17,048 $ 6,890 $ 11,978
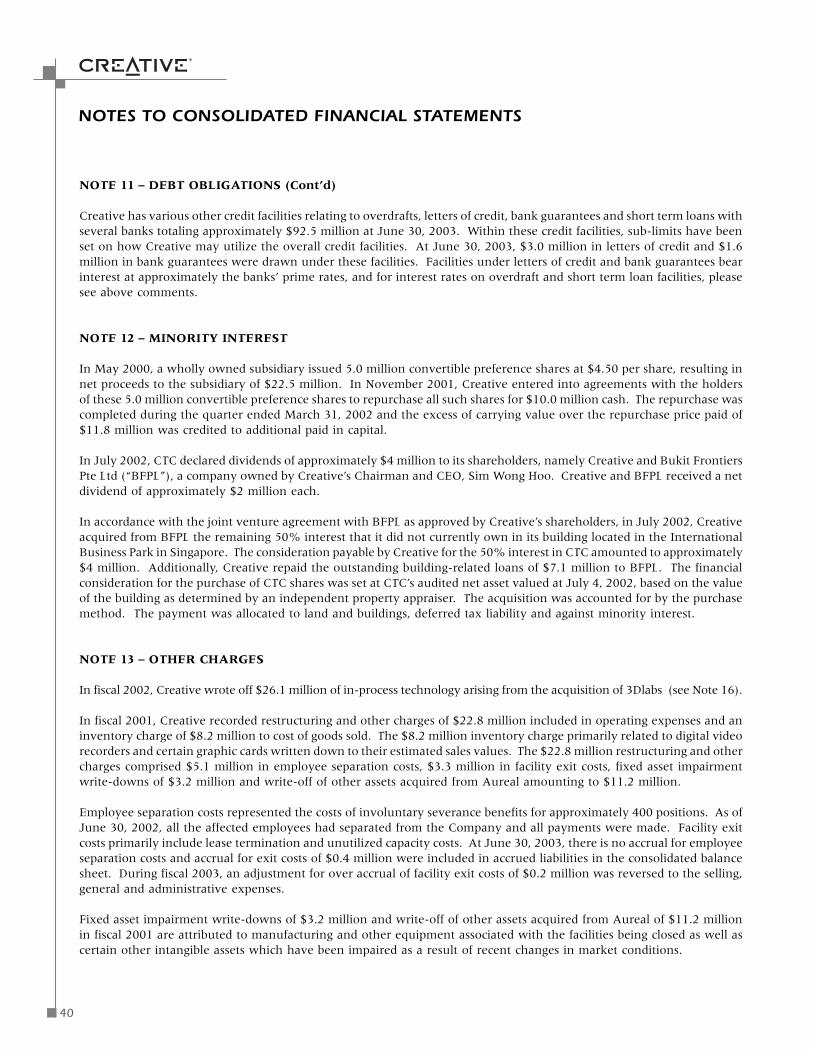
40
NOTES TO CONSOLIDATED FINANCIAL STATEMENTS
NOTE 11 – DEBT OBLIGATIONS (Cont’d)
Creative has various other credit facilities relating to overdrafts, letters of credit, bank guarantees and short term loans withseveral banks totaling approximately $92.5 million at June 30, 2003. Within these credit facilities, sub-limits have beenset on how Creative may utilize the overall credit facilities. At June 30, 2003, $3.0 million in letters of credit and $1.6million in bank guarantees were drawn under these facilities. Facilities under letters of credit and bank guarantees bearinterest at approximately the banks’ prime rates, and for interest rates on overdraft and short term loan facilities, pleasesee above comments.
NOTE 12 – MINORITY INTEREST
In May 2000, a wholly owned subsidiary issued 5.0 million convertible preference shares at $4.50 per share, resulting innet proceeds to the subsidiary of $22.5 million. In November 2001, Creative entered into agreements with the holdersof these 5.0 million convertible preference shares to repurchase all such shares for $10.0 million cash. The repurchase wascompleted during the quarter ended March 31, 2002 and the excess of carrying value over the repurchase price paid of$11.8 million was credited to additional paid in capital.
In July 2002, CTC declared dividends of approximately $4 million to its shareholders, namely Creative and Bukit FrontiersPte Ltd (“BFPL”), a company owned by Creative’s Chairman and CEO, Sim Wong Hoo. Creative and BFPL received a netdividend of approximately $2 million each.
In accordance with the joint venture agreement with BFPL as approved by Creative’s shareholders, in July 2002, Creativeacquired from BFPL the remaining 50% interest that it did not currently own in its building located in the InternationalBusiness Park in Singapore. The consideration payable by Creative for the 50% interest in CTC amounted to approximately$4 million. Additionally, Creative repaid the outstanding building-related loans of $7.1 million to BFPL. The financialconsideration for the purchase of CTC shares was set at CTC’s audited net asset valued at July 4, 2002, based on the valueof the building as determined by an independent property appraiser. The acquisition was accounted for by the purchasemethod. The payment was allocated to land and buildings, deferred tax liability and against minority interest.
NOTE 13 – OTHER CHARGES
In fiscal 2002, Creative wrote off $26.1 million of in-process technology arising from the acquisition of 3Dlabs (see Note 16).
In fiscal 2001, Creative recorded restructuring and other charges of $22.8 million included in operating expenses and aninventory charge of $8.2 million to cost of goods sold. The $8.2 million inventory charge primarily related to digital videorecorders and certain graphic cards written down to their estimated sales values. The $22.8 million restructuring and othercharges comprised $5.1 million in employee separation costs, $3.3 million in facility exit costs, fixed asset impairmentwrite-downs of $3.2 million and write-off of other assets acquired from Aureal amounting to $11.2 million.
Employee separation costs represented the costs of involuntary severance benefits for approximately 400 positions. As ofJune 30, 2002, all the affected employees had separated from the Company and all payments were made. Facility exitcosts primarily include lease termination and unutilized capacity costs. At June 30, 2003, there is no accrual for employeeseparation costs and accrual for exit costs of $0.4 million were included in accrued liabilities in the consolidated balancesheet. During fiscal 2003, an adjustment for over accrual of facility exit costs of $0.2 million was reversed to the selling,general and administrative expenses.
Fixed asset impairment write-downs of $3.2 million and write-off of other assets acquired from Aureal of $11.2 millionin fiscal 2001 are attributed to manufacturing and other equipment associated with the facilities being closed as well ascertain other intangible assets which have been impaired as a result of recent changes in market conditions.

41
NOTE 14 – LITIGATION
During the course of its normal business operations, Creative and its subsidiaries are involved from time to time in a varietyof intellectual property and other disputes, including claims against Creative alleging copyright infringement, patentinfringement, contract claims, employment claims and business torts. A lawsuit by a purported class of 3Dlabs shareholdersagainst Creative and 3Dlabs has been dismissed in defendants’ favor and is no longer pending. Ongoing disputes existwith, among other entities, the Lemelson Foundation (an action involving patent claims by Lemelson against over 500entities, including Creative, which action has been stayed pending resolution of issues in third party litigation) andExtreme Audio Reality, Inc. (a patent infringement suit). Creative is subject to two actions alleging violations of CaliforniaBusiness and Professions Code Section 17200 by representative purchasers of Audigy sound cards (an action for falseadvertising and unfair competition based on allegations that Creative’s packaging and advertising falsely represent theAudigy sound card’s audio processing capabilities) and purchasers of Nomad MuVo (an action alleging false advertising andunfair competition in connection with the available storage capacity contained in the flash memory MP3 players). Creativealso from time to time receives licensing inquiries and/or threats of potential future patent claims from a variety of entities,including Lucent Technologies and Dyancore Holdings.
Creative believes it has valid defenses to the various claims asserted against it, and intends to defend the actions vigorously.However, should any of these claimants prevail in their suits or claims, Creative does not expect there to be any consequentmaterial adverse effect on its financial position, cash flow or results of operations.
NOTE 15 – INVESTMENTS
Due to a continued downturn in global equity markets, Creative experienced a decline in its investment portfolio in fiscal2003 and 2002, resulting in net investment losses of $6.0 million and $45.4 million, respectively. Net investment lossesof $6.0 million in fiscal 2003 include permanent write-downs of quoted and unquoted investments by $13.6 million andnet gains from quoted investments of $7.6 million. Included in the results of operations for fiscal 2002 were permanentwrite-downs of quoted and unquoted investments by $49.3 million and net gains from quoted investments of $3.9 million.
NOTE 16 – BUSINESS COMBINATION
In May 2002, Creative completed the acquisition of 3Dlabs, a graphics vendor, supplying graphics accelerator solutions forprofessionals in Computer Aided Design (“CAD”), Digital Content Creation (“DCC”), and visual simulation markets.Creative believes that the acquisition will provide Creative a significant competitive advantage in the graphics space andallow Creative to re-emphasize graphics products.
To acquire the remaining outstanding capital stock of 3Dlabs, Creative paid approximately $37.0 million in cash, issuedapproximately 6.3 million shares of Creative’s ordinary shares valued at approximately $71.7 million at the time of theclosing, and assumed 3Dlabs’ outstanding options exercisable into approximately 1.6 million shares of Creative ordinaryshares valued at approximately $12.0 million at the time of the closing. As a result of the acquisition, Creative alsoassumed 3Dlabs net liabilities of $21.1 million. In addition, Creative incurred approximately $1.3 million in transactionfees, including legal, valuation and accounting fees. The ordinary shares issued were valued in accordance with EITF IssueNo. 99-12, “Determination of the Measurement Date for the Market Price of Acquirer Securities Issued in a PurchaseBusiness Combination,” using the average for the Creative closing prices ordinary shares during the two days before andtwo days after (and including) the day on which the total number of Creative shares issuable to holders of 3Dlabs commonshares were fixed and determinable. The assumed stock options were valued using the Black-Scholes valuation model,with a volatility rate of 60%, a risk-free interest rate of 2.20% to 4.93%, expected dividend yield of 2.5%, and an estimatedvest term of 0.01 years after vest date.

42
NOTES TO CONSOLIDATED FINANCIAL STATEMENTS
NOTE 16 – BUSINESS COMBINATION (Cont’d)
Of the total assumed stock options of 3Dlabs, approximately 1.3 million stock options with an intrinsic value of $7.0million were unvested. In accordance with FIN 44, “Accounting for Certain Transactions Involving Stock Compensation,”these unvested options were accounted for as deferred stock-based compensation and are being recognized as compensationexpense over their related vesting periods. Total stock-based compensation expense with respect to the unvested optionstotaled $0.3 million in fiscal 2002.
Creative accounted for the acquisition using the purchase method of accounting and has included the results of 3Dlabsfrom the acquisition date of May 15, 2002. The allocation of the purchase price to in-process technology and identifiableintangible assets acquired was based on independent appraisals. The income approach, which includes an analysis of themarkets, cash flows and risks associated with achieving such cash flows, was the primary technique utilized in valuing theexisting technology, in-process technology and non-competition agreements. The estimated net free cash flows generatedby the existing technology, in-process technology and non-competition agreements were discounted at rates ranging from16% to 40%. In estimating the fair value of the patents/core technology and trade name/trademarks, royalty savingsapproach was used, whereby the value of an asset was estimated by capitalizing the royalties saved, with discount ratesranging from 18% to 28%.
The following table summarizes the estimated fair values of the tangible assets acquired and the liabilities assumed at thedate of acquisition (in US$’000):
Cash $ 11,285
Other current assets 13,899
Property and equipment 10,717
Total assets acquired $ 35,901
Total liabilities assumed (56,963)
Net liabilities assumed $ (21,062)
The following table summarizes the allocation of the purchase price to the tangible and identifiable intangible assetsacquired and liabilities assumed (in US$’000):
Net liabilities assumed $ (21,062)
Goodwill 91,976
Acquired in-process technologies 26,080
Other intangible assets consisting of:
Existing technology 7,580
Patent/core technology 6,910
Non-competition agreement 620
Trade name/trademarks 4,160
Total purchase price excluding deferred share compensation $ 116,264
Total deferred share compensation 7,053
Total purchase price including deferred share compensation $ 123,317
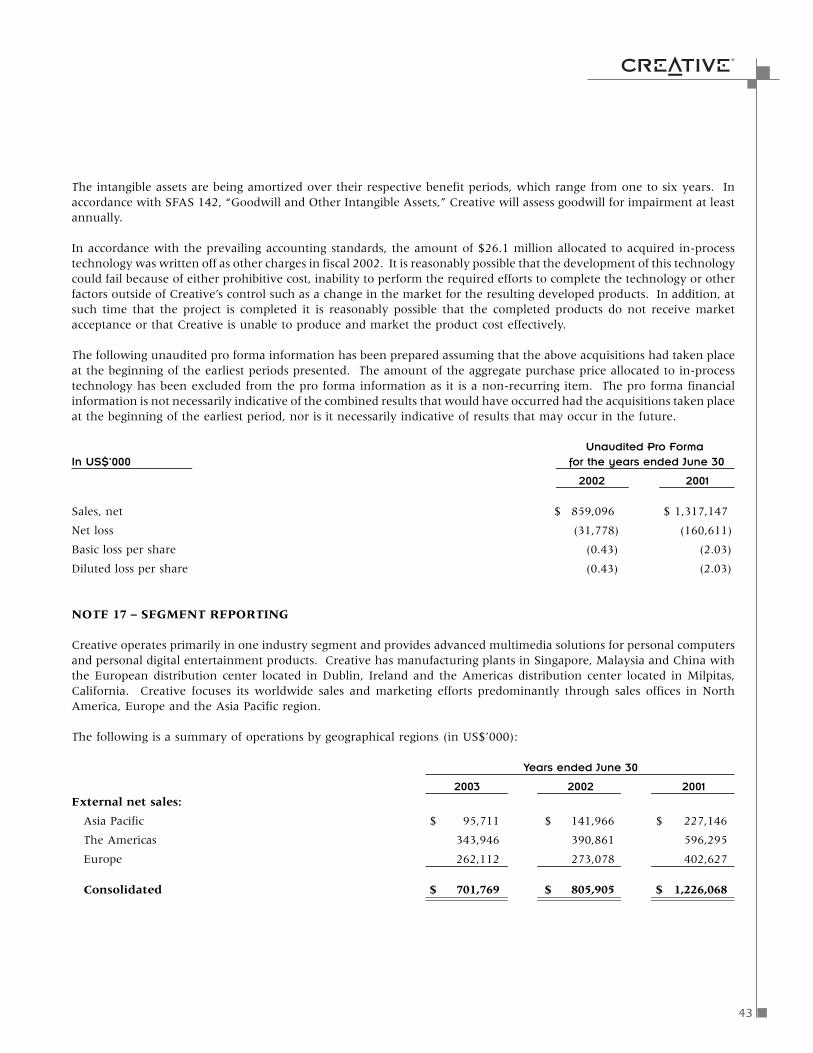
43
The intangible assets are being amortized over their respective benefit periods, which range from one to six years. Inaccordance with SFAS 142, “Goodwill and Other Intangible Assets,” Creative will assess goodwill for impairment at leastannually.
In accordance with the prevailing accounting standards, the amount of $26.1 million allocated to acquired in-processtechnology was written off as other charges in fiscal 2002. It is reasonably possible that the development of this technologycould fail because of either prohibitive cost, inability to perform the required efforts to complete the technology or otherfactors outside of Creative’s control such as a change in the market for the resulting developed products. In addition, atsuch time that the project is completed it is reasonably possible that the completed products do not receive marketacceptance or that Creative is unable to produce and market the product cost effectively.
The following unaudited pro forma information has been prepared assuming that the above acquisitions had taken placeat the beginning of the earliest periods presented. The amount of the aggregate purchase price allocated to in-processtechnology has been excluded from the pro forma information as it is a non-recurring item. The pro forma financialinformation is not necessarily indicative of the combined results that would have occurred had the acquisitions taken placeat the beginning of the earliest period, nor is it necessarily indicative of results that may occur in the future.
Unaudited Pro FormaIn US$’000 for the years ended June 30
2002 2001
Sales, net $ 859,096 $ 1,317,147
Net loss (31,778) (160,611)
Basic loss per share (0.43) (2.03)
Diluted loss per share (0.43) (2.03)
NOTE 17 – SEGMENT REPORTING
Creative operates primarily in one industry segment and provides advanced multimedia solutions for personal computersand personal digital entertainment products. Creative has manufacturing plants in Singapore, Malaysia and China withthe European distribution center located in Dublin, Ireland and the Americas distribution center located in Milpitas,California. Creative focuses its worldwide sales and marketing efforts predominantly through sales offices in NorthAmerica, Europe and the Asia Pacific region.
The following is a summary of operations by geographical regions (in US$’000):
Years ended June 30
2003 2002 2001
External net sales:
Asia Pacific $ 95,711 $ 141,966 $ 227,146
The Americas 343,946 390,861 596,295
Europe 262,112 273,078 402,627
Consolidated $ 701,769 $ 805,905 $ 1,226,068

44
Years ended June 30
2003 2002 2001
Operating income (loss):
Asia Pacific $ 25,353 $ 11,126 $ 26,913
The Americas (10,744) (5,290) (18,954)
Europe 12,594 22,237 16,620
Consolidated $ 27,203 $ 28,073 $ 24,579
As of June 30
2003 2002Identifiable assets:
Asia Pacific $ 496,646 $ 468,227
The Americas 89,683 122,651
Europe 60,514 75,500
Consolidated $ 646,843 $ 666,378
Long-lived assets are based on the physical location of the assets at the end of each of the fiscal years. Goodwill of $92.0million as of June 30, 2003 and 2002 was allocated to Asia Pacific region. Geographic revenue information for the threeyears ended June 30, 2003 is based on the location of the selling entity.
As of June 30
2003 2002
Identifiable assets:
Singapore $ 289,248 $ 233,316
United States of America 89,683 122,651
Ireland 52,382 61,268Rest of World 215,530 249,143
Consolidated $ 646,843 $ 666,378
Years ended June 30
2003 2002 2000
Revenue by geographic region:
Singapore $ 58,418 $ 89,458 $ 149,228
United States of America 343,946 390,861 596,295
Ireland 260,964 272,824 402,627Rest of World 38,441 52,762 77,918
Consolidated $ 701,769 $ 805,905 $ 1,226,068
Major customers: In fiscal 2003, 2002 and 2001, no customer accounted for more than 10% of net revenues. As of June30, 2003 and 2001, two and one customer(s) respectively accounted for more than 10% of net accounts receivable andas of June 30, 2002, no customer accounted for more than 10% of net accounts receivable.
NOTE 17 – SEGMENT REPORTING (Cont’d)
NOTES TO CONSOLIDATED FINANCIAL STATEMENTS

45
Creative’s ordinary shares have been traded on the NASDAQ National Market (“NASDAQ”) since August 3, 1992, underthe symbol “CREAF.” Creative’s ordinary shares have been traded on the Singapore Exchange (“SGX-ST”) since June 15,1994. In January 2003, Creative announced that it intends to move to a single primary stock exchange listing on the SGX-ST. Consequently, Creative intends to delist its ordinary shares from NASDAQ and will initiate steps that can facilitate theelimination of its U.S. public reporting obligations. On June 1, 2003, a flow back restriction was commenced. The flowback restriction stops the electronic transfer of Creative’s ordinary shares from the register of The Central Depository (Pte)Limited in Singapore to accounts with brokers located in the United States. The delisting of Creative ordinary shares fromNASDAQ would not affect the status of Creative’s shares on the SGX-ST.
The following table presents, for the registered shares on the NASDAQ and SGX-ST: (i) the annual high and low marketprices for the five most recent full fiscal years; (ii) the high and low market prices for each full fiscal quarter for the twomost recent full fiscal years; and (iii) the high and low market prices for each month for the most recent six months. Theseprices do not include retail markups, markdowns, or commissions.
NASDAQ SGX-ST(Price in US$/Share) (Price in Singapore $/Share)
High Low High LowAnnual High and LowFiscal 1999 18.56 8.12 30.30 14.10
Fiscal 2000 38.00 9.69 64.00 16.60
Fiscal 2001 23.81 8.10 41.00 14.90
Fiscal 2002 15.05 4.20 27.90 8.15
Fiscal 2003 10.50 5.65 18.90 10.10
Quarterly High and LowFiscal 2002:First Quarter 9.00 4.20 16.90 8.15
Second Quarter 8.30 4.24 15.10 8.25
Third Quarter 15.05 8.16 27.90 14.80
Fourth Quarter 12.20 8.40 22.90 15.10
Fiscal 2003First Quarter 10.50 6.26 18.90 11.50
Second Quarter 8.55 6.10 14.70 11.10
Third Quarter 7.75 5.65 13.70 10.10
Fourth Quarter 8.30 6.06 14.70 10.70
Monthly High and Low
March 2003 6.55 5.65 11.80 10.10
April 2003 6.65 6.06 12.30 10.70
May 2003 6.77 6.20 11.90 11.10
June 2003 8.30 6.52 14.70 11.40
July 2003 8.63 7.91 15.20 14.10
August 2003 10.69 7.73 18.80 13.80
As of September 19, 2003, there were approximately 14,735 shareholders of record of the ordinary shares, of whichapproximately 282 were registered in the US, and approximately 14,453 in Singapore. Because many of the US sharesare held by brokers and other institutions on behalf of shareholders, Creative is unable to estimate the total number ofshareholders represented by these US record holders.
On September 19, 2003, the closing price of Creative’s ordinary shares on the NASDAQ National Market was $10.85 andon the SGX-ST was S$18.80.
STOCK MARKET INFORMATION
46
INSIDE ASIA
SingaporeBroadxent Pte Ltd31 International Business Park,Creative Resource,Singapore 60991Tel: +65-6890 5200Fax: +65-6890 5269
ChinaCreative Future Computer Co. LtdCreative Park, No.18, Anhuaxili Block 2,Chaoyang District, Beijing 100011People’s Republic of ChinaTel: +86-10-6425 5500Fax: +86-10-6425 9314
Hong KongCreative Labs (HK) LimitedUnit 927-931, 9/F.,Hongkong International Trade &Exhibition Centre,1 Trademart Drive, Kowloon Bay,Kowloon, Hong KongTel: +852-2331 2930Fax: +852-2331 2151
JapanCreative Media K.K.Kanda Eight Bldg.,3F, 4-6-7 Soto-Kanda, Chiyoda-ku,Tokyo 101-0021, JapanTel: +81-3-3256 5577Fax: +81-3-3256 5221
MalaysiaCubic Electronics Sdn BhdNo.1, Jalan T.U.43,Taman Tasik Utama, Air Keroh,75450 Melaka, MalaysiaTel: +60-6-251 2888Fax: +60-6-251 2999
THE CREATIVE NETWORK
Worldwide CorporateHeadquarters
Creative Technology Ltd.31 International Business Park,Creative Resource,Singapore 609921Tel: +65-6895 4000Fax: +65-6895 4999Website: www.creative.com
US Headquarters
Creative Labs, Inc.1901 McCarthy Boulevard,Milpitas, CA 95035Tel: +1-408-428 6600Fax: +1-408-428 6611
Europe HeadquartersCreative Labs (Ireland) Ltd.Ballycoolin Business Park,Blanchardstown,Dublin 15, IrelandTel: +353-1-820 6444Fax: +353-1-820 9557
TaiwanCreative Labs Taiwan Co., Ltd15F, No. 163, Sec. 1, Keelung Road,Taipei, Taiwan, R.O.C. Zip Code: 110Tel: +886-2-2748 2988Fax: +886-2-2748 2989
Australia/New ZealandCreative Labs Pty LtdShop 3 – 5, 524 Parramatta RoadPetersham. NSW 2049AustraliaTel: +61-2-9021 9800Fax: +61-2-9021 9899

47
ItalyCreative Labs SrlStrada 4 ED A/2,20090 Assago Milanofiori, (MI), ItalyTel: +39-02-822 8161Fax: +39-02-5750 0768
PolandCreative Labs Sp. z o.o02-708 Warsawul. Bzowa 21, PolandTel: +48-22-853 02 65Tel/Fax: +48-22-843 2283
PortugalCreative Labs Lda.Av. Eng. Duarte Pacheco,Torre 2 – Amoreiras, piso 4º, sala 41070-102 Lisboa, PortugalTel: +351-21-383 97 20Fax: +351-21-383 97 27
SpainCreative Labs, S.L.Constitución 1-4º, 3Edificio Diagonal 1, 08960 Sant JustDesvernBarcelona, SpainTel: +34-93-470 3150Fax: +34-93-499 0811
SwedenCreative Technologies Scandinavia ABSpånga Center, Stormbyvägen 2-4,163 29 Spånga, SwedenTel: +46-8-564 72020Fax: +46-8-795 7835
INSIDE USA
Operations Center5555 Auto Mall Parkway,Fremont, CA94538Tel: +1-510-492 5000
Creative Labs Customer Response Center1523 Cimarron Plaza,Stillwater, Oklahoma 74075Tel: +1-405-742 6600Fax: +1-405-742 6644
Cambridge SoundWorks, Inc.100 Brickstone Square,Andover, MA 01810Tel: +1-978-623 4400Fax: +1-978-475 7265Website: www.cambridgesoundworks.com
Broadxent, Inc.188 Topaz Street, Milpitas, CA 95035Tel: +1-408-719 5100Fax: +1-408-262 1390Website: www.broadxent.com
E-mu Systems, Inc.1600 Green Hills Road,Scotts Valley, CA 95066-4924Tel: +1-831-438 1921Fax: +1-831-438 8612Website: www.emu.com
Creative Advanced Technology Center1500 Green Hills Road, Suite 101Scotts Valley, CA 95067Tel: +1-831-440 2800Fax: +1-831-438 8509Website: www.sei.com
3Dlabs (Alabama) Inc.9668 Madison Boulevard,Madison, AL 35758Tel: +1-256-319 1100Fax: +1-256-319 1114Website: www.3dlabs.com.
INSIDE EUROPE
United KingdomCreative Labs (UK) LtdUnit 3, The Pavilions,Ruscombe Business Park,Ruscombe, Berkshire, RG10 9NN, UKTel: +44-118-9344 322Fax: +44-118-9320 271
3Dlabs LtdMeadlake PlaceThorpe Lea RoadEgham, Surrey, TW20 8HE, UKTel: +44-178-4470 555Fax: +44-178-4470 699
BeneluxCreative Labs N.V.Royal House, Coremansstraat 34 bus 2,B-2600 BerchamTel: +32-3-2878777Fax: +32-3-2308550
DenmarkCreative Labs A/SGydevang 39-41, DK-3450Allerød, Denmark.Tel: +45-48-244 322Fax: +45-48-244 323
FranceCreative Labs, SA47/53 rue Raspail92594 Levallois Perret Cedex, FranceTel: +33-1 55 21 33 50Fax: +33-1 55 21 33 51
GermanyCreative Labs, GmbHFeringastrasse 4,85774 München-Unterföhring,GermanyTel: +49-89-992 8710Fax: +49-89-9928 7122

48
CORPORATE DIRECTORY
CORPORATE HEADQUARTERS COMPANY SECRETARY
31 International Business Park Ng Keh Long
Creative Resource 31 International Business Park
Singapore 609921 Creative Resource
Tel: 65-6895-4000 Singapore 609921
US HEADQUARTERS REGISTRAR/TRANSFER AGENT
1901 McCarthy Boulevard Lim Associates Pte Ltd
Milpitas CA 95035 USA 10 Collyer Quay
Tel: 1-408-428-6600 #19-08 Ocean Building
Singapore 049315
&
EUROPE HEADQUARTERS Mellon Investor Services
235 Montgomery Street
Ballycoolin Business Park 23rd Floor
Blanchardstown, Dublin 15 San Francisco CA 94104 USA
Republic of Ireland
Tel: 353-1-820-6444
INDEPENDENT ACCOUNTANTS
CORPORATE COUNSEL PricewaterhouseCoopers
8 Cross Street #17-00
ASG Law Corporation PWC Building
30 Raffles Place Singapore 048424
#12-00 Caltex House
Singapore 048622
&
Morrison & Foerster LLP
Attorneys at Law
425 Market Street
San Francisco, CA 94105-2482 USA
BOARD OF DIRECTORS
Sim Wong Hoo, Chairman
Tan Lip-Bu, Director
Tang Chun Choy, Director
Lee Kheng Nam, Director

Keyboards
Graphics
ProsumerSpeakers System
Peripherals andStorage Solutions
Communications
Camera
AudioAudio
Lifestyle Digital Entertainment_ Inspirational Living
uncompromised quality, complete solutions, and the empowerment of consumer's choice and flexibility, to enhance theuncompromised quality complete solutions and the empowerment of consumer's choice and flexibility to enhance theoverall digital entertainment experience to suit the consumer's lifestyle and personal needs. Most of all, the Creative lifestyledigital entertainment experience is for anyone and everyone.
Constant Innovation_ Design and Technology
Today's lifestyle demands both form and functionality from the discerning and sophisticateduser. With this understanding in mind, we have been channeling investment into the researchand development of excellent product design to create products that integrate cool ID, user-friendlinessand suitability for the user lifestyle. Design aside, a good product must also encompass great features to enhance theuser experience. At Creative, we are persistently striving to better ourselves each time by formulating improved andadvanced features. To see our users carry and use our products with pride, that is what drives us.
From Strength to Strength_ The Future
No longer contented with being the leader in the sound card industry, we have tapped on our strength and expertise toextend to other areas of audio. In line with our far-reaching vision and strategy, we have produced a slew of top-notchquality MP3 players and speakers amongst a host of Creative products for consumers who are IT-savvy, who want choicesand who want to be entertained. More than that, we must be swift, nimble and flexible to ride on favorable market forcesor react to changes in order to remain competitive. All this is made possible by a team of dedicated people who believe andenjoy what we do. This is what motivates us to keep innovating and create quality products that aspire to
deliver fantastic digital entertainment for many unforgettable, inspiring experiences.tyle digital entertainment philosophy.e lifest
"We're now lean and mean. We are ready to rock."_ Sim Wong Hoo, Chairman & CEO,
Creative Technology
Sound Blaster Wireless Music USB Sound BlasterDigital Music
Creative PC-CAM 900 Creative PC-CAM 880 Creative PC-CAM 750
Creative WebCam Go ES
Creative WebCam 5Creative WebCam Mobile
Creative CardCam Creative CardCam ValueCreative WebCam Pro
Creative Broadband BlasterBritePort 7420C
Creative Broadband BlasterBritePort Router 8110
Network Blaster WirelessLAN Access Point
Network Blaster Wireless LANPCMCIA Card
Network Blaster WirelessLAN USB Adapter
Network Blaster Wireless2020 PCMCIA Card
Network Blaster Wireless2103 Access Point Router
Network Blaster WirelessAccess Point
Network BlasterNotebook Adapter
Creative DC-CAM 3000Z
Network Blaster WirelessUSB Adapter
Network Blaster WirelessAccess Point Router
Modem Blaster V.92 USB Modem Blaster PCI
Creative Mouse WirelessOptical 3000
Creative Mouse WirelessOptical 5000
Creative Desktop Wireless 6000 Creative MouseNotebook Optical
DVD±RW 8X Creative Montage Television Tuner
CDRW External 52.32.52 CDRW Blaster 1394 External Storage Blaster
Creative Prodikeys E-MU PK-6 Proteus Keys Ensoniq Halo Kerboard
3D Labs Wildcat 4
Newton Theater T300 6.1Home Theater Speaker System
Newton Series T500Tower Speakers
Newton Series T300Tower Speakers
Newton Theater MC300.5Home Theater Speaker System
MovieWorks 208Home Theater Speaker System
MusicWorks 411 Mini-System Newton Series MC500Main/Center Speakers
Newton Series S300Surround Speakers
Newton Series P500Powered Subwoofer
Creative SLiX BareboneCreative DVD+CDRW Combo48.24.48/16X
Creative LCD Monitor 1700
Creative Mouse Optical Lite Creative Mouse Wireless
Newton Series M50Bookshelf Speakers
SoundWorks Radio CD Twelve TransportableSpeaker System
Outdoor 62All-Weather Speakers
Ambiance 82In-Wall Speakers
Creative Prodikeys DM
3D Labs Wildcat VPCreative WebCam Pro eX
Modem Blaster USBDE5673
3D Blaster 5 RX9800 ProGraphic Blaster Picture Perfect
USB Sound BlasterAudigy 2 NX
Sound Blaster Extigy
EMU 1212MSound Blaster Audigy LSSound Blaster Audigy 2 ZSPlatinum
Sound Blaster Audigy 2 ZSSound Blaster Audigy 2 ZSPlatinum Pro
Creative WebCam NX Pro Creative WebCam NX Ultra Creative WebCam Notebook

![FY03/12 4th Quarter Earnings Review - Amazon S3...FY03/12 4th Quarter Operating Results Changing Factor (Companywide : Consolidated) Net Sales increase 2.8%YOY to ¥94mn. C[] h C fI](https://static.fdocuments.us/doc/165x107/60699e1fa652603e2340c588/fy0312-4th-quarter-earnings-review-amazon-s3-fy0312-4th-quarter-operating.jpg)