Lead Markets for Clean Coal Technologies A Case Study …ftp.zew.de/pub/zew-docs/dp/dp12063.pdf ·...
48
Discussion Paper No. 12-063 Lead Markets for Clean Coal Technologies A Case Study for China, Germany, Japan and the USA Jens Horbach, Qian Chen, Klaus Rennings, and Stefan Vögele
Transcript of Lead Markets for Clean Coal Technologies A Case Study …ftp.zew.de/pub/zew-docs/dp/dp12063.pdf ·...
Dis cus si on Paper No. 12-063
Lead Markets for Clean Coal Technologies
A Case Study for China, Germany, Japan and the USA
Jens Horbach, Qian Chen, Klaus Rennings, and Stefan Vögele

Dis cus si on Paper No. 12-063
Lead Markets for Clean Coal Technologies
A Case Study for China, Germany, Japan and the USA
Jens Horbach, Qian Chen, Klaus Rennings, and Stefan Vögele
Download this ZEW Discussion Paper from our ftp server:
http://ftp.zew.de/pub/zew-docs/dp/dp12063.pdf
Die Dis cus si on Pape rs die nen einer mög lichst schnel len Ver brei tung von neue ren For schungs arbei ten des ZEW. Die Bei trä ge lie gen in allei ni ger Ver ant wor tung
der Auto ren und stel len nicht not wen di ger wei se die Mei nung des ZEW dar.
Dis cus si on Papers are inten ded to make results of ZEW research prompt ly avai la ble to other eco no mists in order to encou ra ge dis cus si on and sug gesti ons for revi si ons. The aut hors are sole ly
respon si ble for the con tents which do not neces sa ri ly repre sent the opi ni on of the ZEW.

Non-technical summary
Despite the high CO2 emission intensity of fossil and especially coal fired energy production,
these energy carriers will play an important role during the coming decades. In Germany, nu-
clear energy has to be replaced and in countries such as China or India the high and still grow-
ing energy demand requires the use of coal in addition to renewable energy sources. A further
argument for coal is the fact that it is in most countries cheaper compared to the use of natural
gas.
The paper identifies pulverized coal combustion as the main technological trajectory concern-
ing more efficient coal fuel combustion and explores the potentials for lead markets for the
responding technologies in China, Germany, Japan and the USA. We do this by deriving indi-
cators for the lead market success factors as they are described in the literature, taking into
account the different regulation schemes in these countries. We concentrate on technologies
that have already left the demonstration phase. This is the case for supercritical (SC) and ul-
tra-supercritical (USC) pulverized coal technologies that are already established.
The analysis shows that the typical pattern of a stable lead market only applies to a limited
extent. In the 1960s and 1970s, the USA has established a lead market for SC und USC tech-
nologies. In the meanwhile, Japan has surpassed the United States, although it started as a
typical lag market. Japan has caught up in terms of supply factors, China in terms of price,
demand and regulation advantage. China is practicing a leapfrogging strategy, and has already
become a leader in the market segment of low and middle quality boilers, whereas Japan and
Germany still dominate the world turbine market.
Firm interviews confirmed that Japan and Germany have clear first mover advantages con-
cerning the highly innovative parts of clean coal technologies and in general for 600 °C power
plants whereas China has second mover advantages in manufacturing cheap boilers. The cru-
cial question remains if the German firms are able to keep the first mover benefits against the
background of the shrinking importance of coal technologies in Germany. Germany and also
Japan may lose their first mover advantages because a considerable part of learning from in-
novation activities occurs when a power plant is constructed in close cooperation with the
client. Due to the fact that nearly no new coal-fired power plants are projected in Germany,
this country may lose a part of these first mover advantages.

ii
Das Wichtigste in Kürze
Trotz der hohen CO2-Intensität von fossilen Energieträgern, insbesondere Kohle, werden
diese weltweit auch in den kommenden Jahrzehnten eine gewichtige Rolle spielen. In
Deutschland ist die Kernenergie zu ersetzen, und in Ländern wie China oder Indien verlangt
eine hohe und wachsende Energienachfrage den Gebrauch von Kohle zusätzlich zu erneuerba-
ren Energien. Ein weiteres Argument für den Einsatz von Kohle ist, dass sie in den meisten
Ländern im Vergleich zu Gas günstiger ist.
Die Studie identifiziert die Staubfeuerung als wesentliche technologische Trajektorie im Be-
reich von Kohlekraftwerken, und bestimmt die Potentiale für einen Lead Market in China,
Deutschland, Japan und den Vereinigten Staaten. Dies erfolgt anhand der Ableitung von Indi-
katoren für die wichtigsten Lead Market Faktoren, die in der Literatur beschrieben werden,
wobei auch die unterschiedlichen Regulierungsschemen in den verschiedenen Ländern be-
rücksichtigt werden. Es werden nur solche innovativen Technologien betrachtet, die schon auf
dem Markt verbreitet sind. Dies ist der Fall für superkritische (SC) und ultra-superkritische
(USC) Kohlekraftwerke, die sich seit Jahrzehnten inkrementell weiterentwickeln.
In der Analyse zeigt sich, dass das Muster eines über Jahrzehnte stabilen Lead Markets für
Kohlekraftwerke nur begrenzte Gültigkeit hat. In den 1960er und 1970er Jahren etablierten
die USA einen Lead Market für SC und USC Technologien. Inzwischen hat Japan die Verei-
nigten Staaten überholt, obwohl es als Nachzügler gestartet ist. Japan ist vor allem im Bereich
von Angebotsfaktoren wie beispielsweise F+E überlegen, China hat bezüglich Preis-, Nach-
frage- und Regulierungsvorteilen aufgeholt. China praktiziert eine sogenannte Leapfrogging-
Strategie, d.h. es holt rasch auf, indem es einzelne Stufen überspringt. So wurde China bereits
zum Marktführer im Segment von Kesseln niedriger und mittlerer Qualität, während Japan
und Germany nach wie vor den Weltmarkt für Turbinen dominieren.
Firmeninterviews bestätigen, dass Japan und Deutschland klare First Mover Vorteile bezüg-
lich der innovativen Kohletechnologie haben, insbesondere für 600 °C Kraftwerke, während
China Second Mover Vorteile bei der Herstellung wenig innovativer Kessel besitzt. Die Frage
ist, ob Deutschland diese Vorteile angesichts der sinkenden heimischen Bedeutung von Kohle
behalten wird. Deutschland und Japan könnten ihren Innovationsvorsprung verlieren, da ein
beachtlicher Lernanteil, der bei Innovationsaktivitäten entsteht, durch die Interaktion und Ko-
operation mit dem Kunden entsteht. Da nahezu keine neuen Kohlekraftwerke in Deutschland
geplant werden, können die First Mover Vorteile verloren gehen.

Lead markets for clean coal technologies
A case study for China, Germany, Japan and the USA
Authors:
Jens Horbach, Hochschule Augsburg Qian Chen, Chinese Academy of Science (CAS), Institute for Policy and Management (IPM),
Beijing Klaus Rennings, Centre of European Economic Research (ZEW), Mannheim
Stefan Vögele, Forschungszentrum Jülich (FZJ)
Abstract: Despite the high CO2 emission intensity of fossil and especially coal fired energy production, these energy carriers will play an important role during the coming decades. The case study identifies the main technological trajectories concerning more efficient fossil fuel combustion and explores the potentials for lead markets for these technologies in China, Germany, Japan and the USA taking into account the different regulation schemes in these countries. We con-centrate on technologies that have already left the demonstration phase. This is the case for supercritical (SC) and ultra-supercritical (USC) pulverized coal technologies that are already established. The analysis shows that the typical pattern of a stable lead market only applies to a limited extent. In the 1960s and 1970s, the USA has established a lead market for SC und USC tech-nologies. In the meanwhile, Japan has surpassed the United States, although it started as a typical lag market. Japan has caught up in terms of supply factors, China in terms of price, demand and regulation advantage. This supports the hypothesis that - apart from the demand-oriented lead market model - push factors such as R&D activity play a strong role as well. The advantage of Japan mainly stems from its intensive R&D activities. It can also be observed that some other advantages – such as price and demand advantage – are shifting to China. China is practicing a leapfrogging strategy, and has already become a leader in the market segment of low and middle quality boilers, whereas Japan and Germany still dominate the world turbine market. The conclusion is that lead markets may switch over time to markets with high growth rates, although first mover advantages exist for some market segments such as turbines. First mov-ers have a strong technological expertise which is important in the catching up process of late followers, and they may even profit from the growth in lag countries by exporting and co-operation activities. Thus international technology cooperation is a beneficial process for all involved parties. Keywords: Lead Markets, Coal Power plants, Energy Technology, Energy Policy

2
1 Introduction
Despite the high CO2 emission intensity of fossil and especially coal fired energy production,
these energy carriers will play an important role during the coming decades. In Germany, nu-
clear energy has to be replaced and in countries such as China or India the high and still grow-
ing energy demand requires the use of coal in addition to renewable energy sources. The ex-
isting resources of coal are with 14.800 billion tons still sufficient for the next century (Lö-
schel, 2009). 44% of the hard coal resources may be assigned to the USA, 28% to China and
18% to Russia. The resources of lignite (brown coal) are also considerable: 4,200 billion tons
(33% USA, 31% Russia, 15% China, 1% Germany). A further argument for coal consists in
the fact that it is in most countries cheaper compared to the use of natural gas.
In Germany hard coal (22.8%) and brown coal (25.5%) contributed to nearly half of the whole
electricity production in 2007. Following a scenario of IEA (2007), the relevance of the use of
coal will not shrink until 2030, for the EU 27 the share of 30% will remain, in China we will
still observe a value of around 80% concerning the electricity production. Even if we consider
a scenario with a higher use of energy efficiency improvements, China will produce more
than 60% of its electricity by the use of coal (see Löschel 2009).
Against this background, cleaner and more efficient coal-fired power plants will have an im-
portant role to play for both global energy and climate policy in the future. This study will
identify the lead market strategies of four major countries in the global coal power plant mar-
ket (China, Germany, Japan and the USA) regarding the main innovations of clean coal tech-
nology. The lead market approach for environmental innovations as developed by Beise and
Rennings (2005) has identified six success factors for lead markets: Comparative price and
demand advantages, a high reputation in environmental technology (transfer advantage), simi-
lar market conditions (export advantage), a competitive market structure and ambitious envi-
ronmental regulation. We will also take further supply side aspects and the very different reg-
ulation schemes in those countries into account (see also Rennings and Cleff 2011, and Tiwari
and Herstatt 2011). Our ex-post analysis tries to identify the existence of lead markets for the
most important efficient, “clean coal” technologies compared to the scenario that a “second
follower strategy” fits better for these technologies.
The most important technological trajectory of fossil fuel power plants is the pulverized

3
combustion with a share of 90% of coal-fired capacity worldwide (WCI 2005, see also
Rennings and Smidt 2010), so that this technology will be in the focus of our case study.
Another reason is that we want to concentrate on technologies that have already left the
demonstration phase. This is the case for subcritical, super- and ultra-supercritical pulverized
coal technologies that are already established whereas for technologies such as Carbon
Capture Storage (CCS) no diffusion curves can be derived yet due to their early phase of
innovation.
The paper is structured as follows: Section 2 describes the relevant clean coal technologies. In
Section 3, we derive their diffusion curves for Germany, China, Japan and the USA. Section 4
applies the lead market approach to the case of efficient coal technologies. Section 5 takes
additionally supply side factors into account. In Section 6, we report on strategies for German
firms based on expert interviews. Section 7 summarizes the results and concludes.
2 Coal Power Plant Technology Description
In general terms, a clean coal technology may be defined as a “technology that when
implemented improves the environmental performance and efficiency as compared to the
current state-of-the art in coal fired power plants” (Buchan and Cao 2004). Coal-fired power
stations with pulverized bed combustion are differentiated and called by the steam conditions
when entering the turbine, although it is not the only property which characterizes a coal-fired
power station. Other important characteristics are the condenser pressure or the efficiency of
the turbine (RWE Power AG 2011, IEA 2010a).
The steam conditions are divided in subcritical-, supercritical- and ultra-supercritical-
conditions. Steam is called supercritical, when the steam parameters exceed the critical point1.
The higher the temperature and pressure of the steam is, the higher the efficiency of the power
plant.2 A subcritical power plant works with a steam temperature about 540 °C or less and a
pressure about 160 bar, which lies under the critical point. This technology is obsolete and
1 Critical point describes the temperature and pressure above which the working fluid – in this case water – no longer turns into steam but instead decreases in density when it is heated above 'boiling point'. By eliminating the transition into steam (phase change) the efficiency of the process can be improved. For water the actual conditions are temperatures and pressures of over 374°C and 221.2 bar respectively. 2 The rule of thumb in power plant construction is that each additional bar causes a 0.005% increase in degree of efficiency and each additional degree Celsius causes a 0.011% increase.

4
was removed by the supercritical power plants. Here, the steam temperature lies between 540
°C and 600 °C and the pressure between 230 bar and 270 bar. Temperatures of 600 °C with a
pressure of 270 bar are state of the art and are called ultra-supercritical. Applying this
technology, an efficiency of 40% - 43% can be achieved. Technologies characterized by
temperatures of 700°C and pressures of 375 bar will be called advanced ultra-supercritical.3
The so-defined advanced ultra-supercritical power plants are currently applied in some
projects only, because of the high costs of materials which can resist this temperature and the
pressure (IEA, 2010). Therefore nickel alloys will be developed. An efficiency of 50% can be
reached with this technology (Energy 2.0, 2008).
The main improvements in power plant technology focus on efficiency and on the decrease of
emissions. To achieve these targets, knowledge of many disciplines is required, because
improvements are often based on incremental changes in different technologies. The diffusion
of new technologies in coal-fired power plants is slow due to a long average life time of 35-40
years, and the risk of the high investments which leads to risk-averse investment decisions
(Rennings et al., 2010).
Our case study will analyze the diffusion of supercritical and ultra-supercritical power plants
as innovative solutions compared to the older subcritical plants.
3 Diffusion Curves
Diffusion curve of supercritical pulverized coal technology
Supercritical pulverized coal technology is one of the most common technologies among
coal-fired electricity generation. This technology has been used for several decades (since
1959) and realises its diffusion in the United States, Germany, Japan and China. Figure 1
shows the diffusion curve over time as the share of supercritical power plants on the entire
installed capacity of coal-fired power plants in a country, which means the accumulative
installed capacity of supercritical power plants/ total installed capacity per year.
3 The IEA coal database already defines technologies as ultra-supercritical that are characterized by a steam pressure of more than 250 bar combined with a steam temperature of at least 550 °C. The diffusion curves in Section 3 are calculated following this definition.

5
Figure 1: Diffusion curve of Supercritical pulverized coal technology in selected countries
Source: IEA (2011a), own calculations.
USA
The United States was the leader in designing and manufacturing supercritical pulverized
coal technology in the late 1950s. In 1959, the first coal-fired supercritical power unit Avon
Lake 8 was commissioned in the USA and in 1960 four more supercritical power units
followed. Then this technology developed well especially after the material problems were
overcome in the second half of 1960’s (Rennings and Smidt, 2010). The share of supercritical
power plants rose constantly and reached its peak (24.1%) in 1976 and then it came to a stop
in the late 1970’s and remains by 20% up to now.
Germany
Germany quickly followed the USA in adopting supercritical power plants since 1965. Just
like in the United States, the diffusion of supercritical plants seemed promising in the
beginning. However, just after reaching a market share of 14.1% in 1970, the diffusion of
supercritical power plants stopped and declined again to about 7.3% in 1981. After the
reunification of Germany in 1990 the ratio of supercritical to subcritical power units rose
again. The government’s commitment to advance the state-of-the-art pulverized coal
technology was the most important driver to the development of supercritical technology. The
peak of the diffusion rate of supercritical power units reached 19.4% in 1999 and it declined
to 17% in 2010. Beginning from 1999, Germany concentrated on the construction of ultra-
supercritical plants characterized by steam temperatures of 550 °C and more (following the
0
0,1
0,2
0,3
0,4
0,5
0,6
0,7
shar
e of
supe
rcrit
ical
pla
nt o
n to
tal
capa
city
(per
cent
age)
China
Germany
USA
Japan

6
definition of The IEA coal database, see also Figure 2).
Japan
Japan started constructing supercritical plants in the 1970s, and caught up in the next decades.
Influenced by the oil price crisis, the share of Japanese supercritical power plants quickly rose
from zero in 1980 to 60.2% in 1996, at an annual growth rate of 27.3%. The total installed
capacity in 1996 was 11900 MW in Japan. After then it started to decline to 36.6% in 2010.
China
China is the last country regarding the development of supercritical pulverized coal
technology of the four countries. China started using supercritical technology in the 1990s
with the procurement of ten units from Russia. Since then, many more supercritical units were
built and approximately 27 were in operation at the end of 2010. Sixty percent of the new
plants that started construction after 2005 and represent a total of 37.8 GW (600 MW each)
are supercritical. From 2010 to 2020, new power plants with unit capacities of 600 MW and
more will all be required to be supercritical and about half of the newly built power
generating units will be ultra-supercritical. Consequently, supercritical units will account over
30% by 2020 (Huang, 2008).
It seems that the USA first takes over the role of a lead market in the 1960’s and during the
following 20 years. Other countries followed the American innovation design, such as
Germany in the 1960’s and Japan in the 1970’s. So far, the lead markets model argues that
lead markets do not switch to other countries but are “stable”. This has been supported by
several empirical analyses such as the diffusion of cellular phones, facsimile machine; diesel
motors with direct injection, etc. (see Beise 2001, Beise and Rennings 2005). However in this
case, the diffusion curves overlap by Japan in the early 1980’s since America stopped to build
new supercritical power plants (Rennings and Smidt, 2010).
Diffusion curve of ultra-supercritical pulverized coal technology
The diffusion of ultra-supercritical pulverized coal technology (USC) paints a similar picture
to what was already indicated in the analysis of supercritical pulverized coal technology. The
first USC plant in the world was Ohio Power’s (now American Electric Power) Philo unit 6 in
the USA in 1960. Not as expected, America decided to abandon this technology on the
domestic market since 1960, only one year after the first ultra-supercritical pulverized power

7
plant was built. Since then it lost its lead market role although it was the first who designed
and manufactured ultra-supercritical power plants. Ultra-supercritical power plants first
appeared in the USA, but other countries joined in applying the technology. For example,
instead of Germany, Japan picked up ultra-supercritical pulverized coal technology in 1993.
As a second mover, Japan was the major driver for USC technologies during the 1990s and
became the technology leader before 2005. Germany started with the diffusion of this
technology in 1999. Although China is still the last country that introduced this technology in
2007, commercial adoption of ultra-supercritical technology is expanding rapidly.
Supercritical and USC used to represent a small percentage of the newly ordered power plants
(10%-30%) before 2002, but in recent years they represent more than 60 percent of all coal
power plants in China. And there are 23 USC power plants with 33 GW-level USC units
operating in China at the end of 2010, while 11 more were under construction (CEC, 2011). Figure 2: Diffusion curve of Ultra-supercritical coal-fired power plants
Source: IEA (2011a), own calculations.
0
0,05
0,1
0,15
0,2
0,25
0,3
0,35
1959
1962
1965
1968
1971
1974
1977
1980
1983
1986
1989
1992
1995
1998
2001
2004
2007
2010
Shar
e of
ultr
a-su
perc
ritic
al p
lant
s on
tota
l in
stal
led
capa
city
(in
%) China
Germany
USA
Japan
8
4 Lead Market Factors
4.1 Price advantage
The price advantages can be measured by using different indicators: proved reserves, fuel
costs, absolute and comparative cost advantage. First, proved reserves are defined by the IEA
(2007, p. I. 9) as all resources “…that are not only confidently considered to be recoverable
but also can be recovered economically, under current market conditions.” This means that
using proved reserve data makes it unnecessary to take national differences in accessibility
and extracting costs into account. It is an indicator of the supply side for relative cost ad-
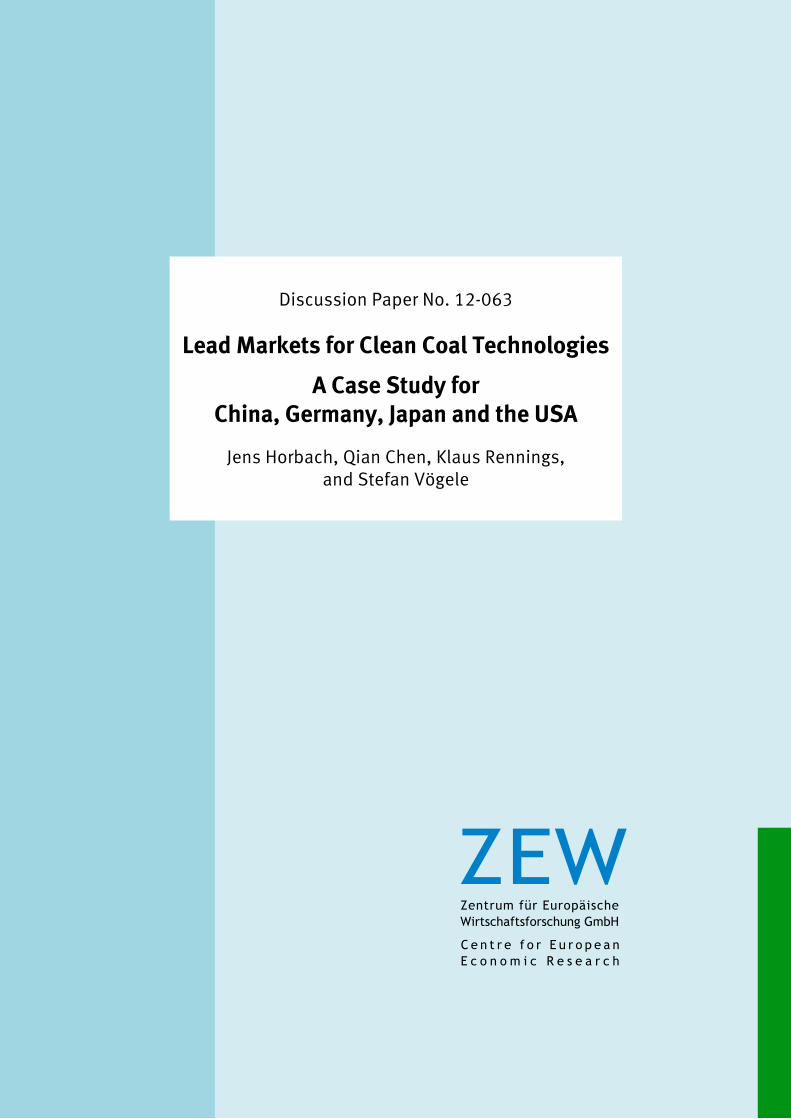
vantages regarding resources. Figure 3 shows the proved recoverable coal reserves [in million
short tons] in the different countries.
Figure 3: Proved hard and brown coal reserves in 2008 of selected countries
Source: IEA (2011b).
There is a great inequality concerning the spread of reserves across the globe. If it is assumed
that importing fuels is more expensive than extracting own reserves, then the endowment of a
country regarding coal reserves decides whether it has a price advantage or not. The useful-
ness of proved resources as an indicator for price advantages is however limited. It is possible
USA Japan China GermanyHard coal 207119 340 95900 99Brown coal 30176 10 18600 40600
0
50000
100000
150000
200000
250000
Mill
ion
tons

9
that a country is not able to make use of its reserves, because it is not permitted by the nation-
al energy policy. Then, of course, the rich reserve with coal is no advantage for a country.
Reliable data concerning proved reserves are only accessible for very few points in time. No
time series are available and the publicly availably publications only cover the time from the
late 1990s onwards. The data used for the analysis are from IEA statistics on “Coal infor-
mation 2011”.
As Figure 3 shows, the United States own the far largest coal reserves in the world (IEA,
2011). The structure of coal reserves in both USA and China is similar. 87.3% of total re-
served coal is hard coal in USA and 83.8% in China. Germany has only abundant reserves
concerning brown coal and Japan’s total proved coal reserves are negligible. Following
Beise’s argumentation (Beise 2001), USA has a price advantage caused by its abundant coal
reserves compared to the other countries.
Fuel prices also give information about the price advantage of a country. Figure 4 shows the
steam coal price paid by utilities in each country (except China) for electricity generation
(US$/toe). Data is often not reported for countries that rely to a large extent on domestic coal
production and for those countries whose mining sector is state owned. This applies for Chi-
na, where data about coal prices is not available. Furthermore, tax reductions and other privi-
leges may distort the picture painted by the analysis of fuel costs. It may occur that a country
has to pay high import prices and has no reserves that it can rely on, but domestic regulation
compensates for the high fuel prices.
Figure 4: Steam coal price paid by utilities for electricity generation
Source: IEA (2011c).
0,00
50,00
100,00
150,00
200,00
250,00
USD
/toe
Germany
Japan
United States

10
The analysis of the fuel price data shows that the USA has a definite price advantage com-
pared to Japan and Germany. Not only did American utilities sometimes pay less than a third
of what Japanese and German utilities had to pay, the price for steam coal in the US also re-
mained relatively stable. Germany is a perfect example of how state regulation can influence
the costs of utilities. Until 1994, German utilities were forced to buy steam coal out of domes-
tic production, which operated – due to unfavorable geological conditions – on an uneconom-
ical level. This led to steam coal prices exceeding those in Japan by far. Prices dropped im-
mediately after the act was abolished in 1994. The USA maintains its price advantage
throughout the entire time.
A third indicator for the price advantage of a country is the absolute cost advantage in terms
of electricity generating costs for the main energy sources (see Figure 5).
Figure 5: Leveled cost of electricity from four energy sources in selected countries4
Source: IEA (2011d).
The analysis of the electricity costs for the main energy sources shows that China has a defi-
nite cost advantage compared to the other three countries whereas Japan is characterized by
the highest electricity costs reflecting the low endowment with energy resources.
4 USA, Germany and Japan: Black coal pulverized coal combustion technologies; China: Black coal supercritical coal combustion technologies.
0
20
40
60
80
100
120
Nuclear Coal Gas Onshore wind
China
Germany
USA
Japan
USD
/MW
h

11
4.2 Demand advantage
Per capita income can be used as an indicator for demand advantages. The wealth of a nation
plays a positive role on the rate and time of adoption of innovations (Dekimpe et al. (1998)
and Vernon (1979)). From a supply perspective, it may increase the motivation to invest in
new technologies and from a consumer perspective it reflects a greater willingness to pay for
new products. However, the correlation between income and the rate a nd time of adoption of
innovations has been mostly proven for consumer goods (Beise 2001, p. 91) whereas the in-
novative behavior of firms strongly depends on further factors such as the existence of inno-
vative capacities or a highly qualified staff. Figure 6 shows the total GDP and GDP per capita
(current international $, in Purchase Power Parities (PPP)) in the selected countries.
Figure 6: Total GDP and GDP per capita (current international $, in PPP) of selected countries
Total GDP GDP per capita
Source: Word data bank (2011a).
Among the four countries examined in this study, the USA shows the highest total GDP. Chi-
na´s total GDP grew rapidly during the last two decades and passed Germany in 2007 and
Japan in 2009, becoming the second largest economy in the world.
The GDP per capita shows another picture: The USA is characterized by the highest income
per capita, Germany and Japan follow closely. China’s income-per-capita in 2010 was only
4354 $. Summarized, the USA seems to have a demand advantage over the other three coun-
tries, followed by Japan, then Germany and China. Given the high growth rate of GDP during

12
the last decades, China can however be expected to take over the lead regarding demand ad-
vantages in future.
Electricity intensity can be interpreted as a second indicator for demand advantages. It can be
assumed that those countries with a high coal-based electricity production will also show high
demand for new and efficient coal-fired technologies. The figures 7-9 show the electricity
production from coal sources, the total thermal electricity intensity of GDP and the share of
coal on total electricity output in the selected countries.
Since 2010, China is the second largest electricity consumer with 4190000 Gigawatt hour
(GWh), very close to USA with 4361401 GWh in 2010. However, after nearly 10% annual
economic growth in the past decades and tripling its coal electricity production since 1970,
China has already surpassed the USA regarding coal electricity production since 2006. In con-
trast to the stable trend in the three other countries, there was a rapid increase in the coal elec-
tricity production since 2006.
Figure 7: Electricity production from coal sources in selected countries between 1960 and 2010 [GWh]
Source: World bank database (2011b).
Figure 8 shows the amount of production of electricity generated from coal per $ GDP, i.e. the
electricity intensity of each country. In 2010 China produces 0.07 kWh per $ GDP and thus
has a demand advantage, while the USA (0.014 kWh/$) cannot keep their “leading” position.
Germany (0.008 kWh/$) and Japan (0.005 kWh/$) are less electricity intensive.
As technical equipment gets more efficient in general and electricity prices keep rising, all
countries have experienced a decrease in electricity intensity over the last decade. Especially
in China, the electricity intensity declined by 41.7% during 1971-2009.
0
500
1000
1500
2000
2500
3000
3500
1960 1965 1970 1975 1980 1985 1990 1995 2000 2005 2010
Billi
on k
ilow
atth
ours
China
Germany
Japan
United States

13
Figure 8: Total thermal electricity intensity of GDP of selected countries between 1970-2010
Source: World bank database (2011b).
Figure 9: Share of coal on total electricity output of selected countries
Source: World bank database (2011b).
Since the mid-1980s China shows the highest coal shares on total electricity output compared
to the other three countries (see Figure 9). In 2010, more than 80 % of the Chinese electricity
production was based on coal. Germany, on the other hand, shows an opposite development.
The coal share decreased substantially since the 1960’s from 87% in 1960 to 44% in 2010.
0
0,02
0,04
0,06
0,08
0,1
0,12
1970
1972
1974
1976
1978
1980
1982
1984
1986
1988
1990
1992
1994
1996
1998
2000
2002
2004
2006
2008
2010
kilo
wat
thou
rs/U
S$
China
Germany
Japan
United States
0
0,1
0,2
0,3
0,4
0,5
0,6
0,7
0,8
0,9
1
1960 1965 1970 1975 1980 1985 1990 1995 2000 2005 2010
%
China
Germany
Japan
UnitedStates
14
The USA shows a relatively stable share of coal-based power generation of around 50%. Ja-
pan has seen a very instable role of coal throughout the course of time. After a decrease be-
fore 1975 the share of coal rose again. Currently coal contributes 24.9% in 2010 to support
Japan’s power supply.
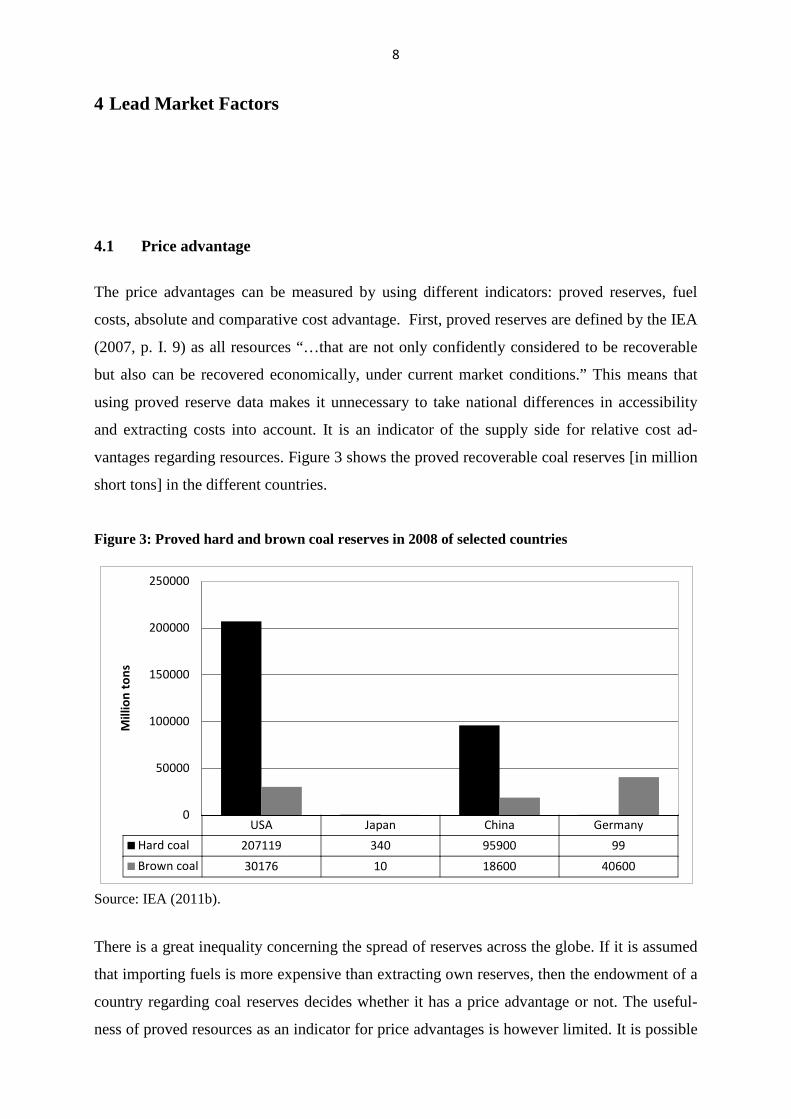
Figure 10: CO2 intensity of total electricity and heat output in selected countries
Source: IEA (2010b). *data was missing in China and Unite State before1992
CO2 intensity of electricity production can also be regarded as indicator for demand
advantages. As climate change became the global issue, countries with high CO2 emission and
high CO2 intensity of electricity from coal face high political pressure from other countries to
improve their CO2 performance. These countries will likely invest in low carbon technologies,
including clean coal. A limitation of this indicator is that countries with a high CO2 intensity
of the electricity sector may also switch to other energy resources such as renewables to
produce electricity. Figure 10 and 11 show CO2 intensity of total electricity and heat output
and from coal source in the selected countries.
The two figures show that there is a declining trend regarding CO2 intensity of electricity and
heat output in the selected countries. Due to a still high CO2 intensity of total electricity, Chi-
na and USA have a relative demand advantage. However the advantages become smaller re-
garding the CO2 intensity of electricity and heat output from coal.
200
300
400
500
600
700
800
900
1000
1100
1200
1960
1963
1966
1969
1972
1975
1978
1981
1984
1987
1990
1993
1996
1999
2002
2005
2008
China
Germany
Japan
United StatesCO2
per k
Wh
(g C
O2
per k
Wh)

15
Figure 11: CO2 intensity of electricity and heat output from coal in selected countries
Source: IEA (2010b). * data was missing in China and USA before1992
The average age of power stations, as shown in Figure 12, can be seen as the last indicator for
demand advantages. Countries characterized by high average plant age have a demand ad-
vantage since the power plants can be expected to be replaced soon. Coal-fired power plants
do usually run for a period of 25-35 years. The United States has the highest average age of
their coal-fired power plants.
Figure 12: Average age of coal-fired power plants in selected countries in 2010
Source: IEA (2011a).
600
800
1000
1200
1400
1600
1800
2000
1960
1963
1966
1969
1972
1975
1978
1981
1984
1987
1990
1993
1996
1999
2002
2005
2008
China
Germany
Japan
United States
CO2
per k
Wh
(g C
O2
per k
Wh)
05
1015202530354045
Average age
China
Germany
Japan
USA
Year
s
16
4.3 Export advantage
In the following, we try to assess which countries are specialized in the production of clean
coal technologies and successful in selling clean coal equipment to other countries. To meas-
ure the export advantage, we use the trade balance (exports – import) in 2010 and the devel-
opment of the export/import ratio from 2007 to 2010. The UN Comtrade data basis provides
such data not explicitly for clean coal technologies but for the product groups “steam boilers”
and “steam turbines”.
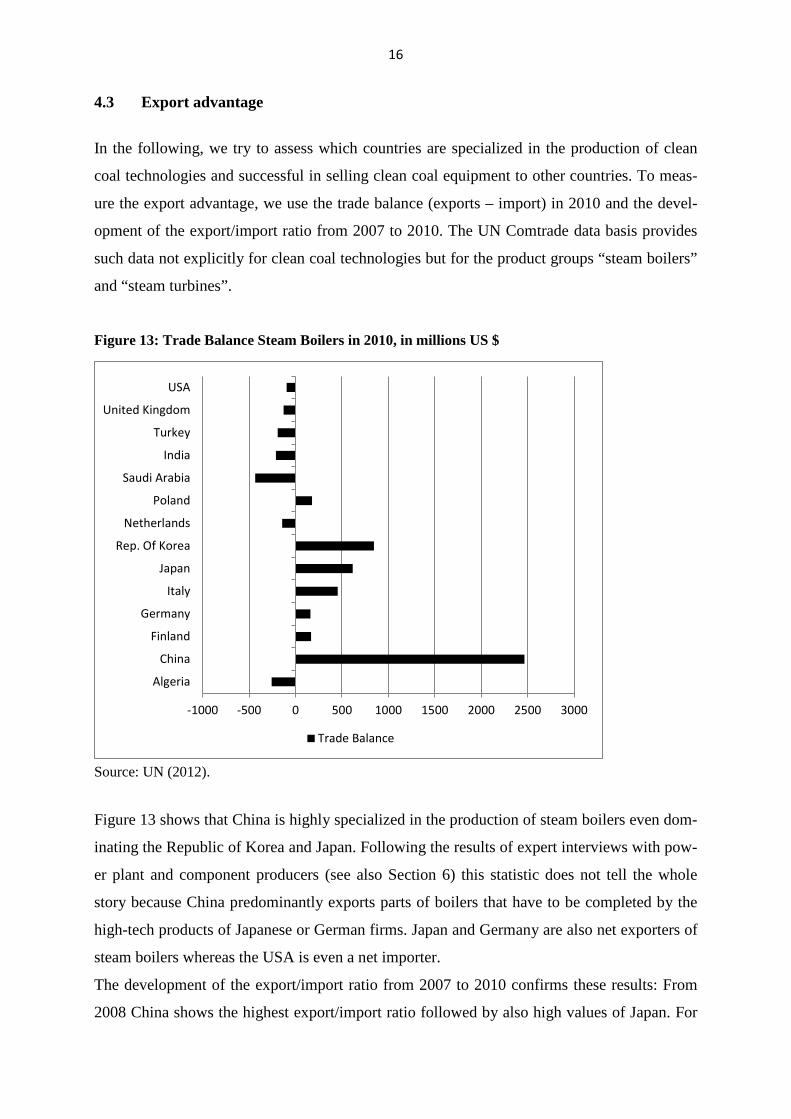
Figure 13: Trade Balance Steam Boilers in 2010, in millions US $
Source: UN (2012).
Figure 13 shows that China is highly specialized in the production of steam boilers even dom-
inating the Republic of Korea and Japan. Following the results of expert interviews with pow-
er plant and component producers (see also Section 6) this statistic does not tell the whole
story because China predominantly exports parts of boilers that have to be completed by the
high-tech products of Japanese or German firms. Japan and Germany are also net exporters of
steam boilers whereas the USA is even a net importer.
The development of the export/import ratio from 2007 to 2010 confirms these results: From
2008 China shows the highest export/import ratio followed by also high values of Japan. For
-1000 -500 0 500 1000 1500 2000 2500 3000
Algeria
China
Finland
Germany
Italy
Japan
Rep. Of Korea
Netherlands
Poland
Saudi Arabia
India
Turkey
United Kingdom
USA
Trade Balance

17
Germany, this value even declined slightly from 2007 to 2010 confirming the lower im-
portance of Germany as a production location for these products. In the USA, we observe a
slight increase but the ratio remains below the value one.
Figure 14: Steam Boilers: Development of export-import ratios from 2007 to 2010
Source: UN (2012).
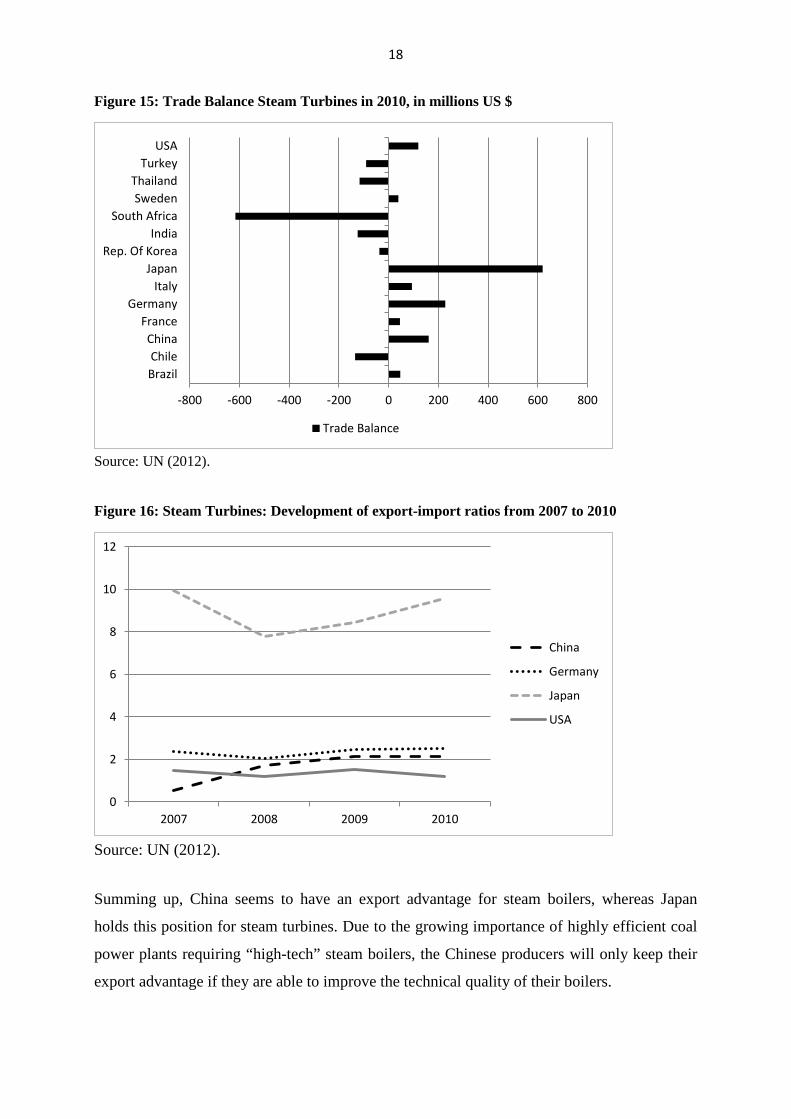
Concerning steam turbines, Japan seems to be the most specialized country documented by a
high trade surplus in 2010 (Figure 15) and very high export/import ratios from 2007 to 2010
(Figure 16) compared to the other countries. Especially Germany, but also China and the USA
also show high net exports in 2010 for steam turbines.
As concerns the trade balance and the export/import ratio, Germany still remains beyond Chi-
na whereas the export/import ratio of the USA is now lower than that of China.
0
2
4
6
8
10
12
14
16
2007 2008 2009 2010
China
Germany
Japan
USA
18
Figure 15: Trade Balance Steam Turbines in 2010, in millions US $
Source: UN (2012).
Figure 16: Steam Turbines: Development of export-import ratios from 2007 to 2010
Source: UN (2012).
Summing up, China seems to have an export advantage for steam boilers, whereas Japan
holds this position for steam turbines. Due to the growing importance of highly efficient coal
power plants requiring “high-tech” steam boilers, the Chinese producers will only keep their
export advantage if they are able to improve the technical quality of their boilers.
-800 -600 -400 -200 0 200 400 600 800
BrazilChile
ChinaFrance
GermanyItaly
JapanRep. Of Korea
IndiaSouth Africa
SwedenThailand
TurkeyUSA
Trade Balance
0
2
4
6
8
10
12
2007 2008 2009 2010
China
Germany
Japan
USA
19
4.4 Transfer advantage
On the one hand, the transfer advantage describes the capability of a country to be or to be-
come a lead market in the respective technology. On the other hand, but closely correlated to
the capability, a country shows a high transfer advantage if the international reputation and
attention regarding the specific technology is high (see Rennings and Smidt 2010).
To measure the transfer advantage for efficient coal technologies, we use the following indi-
cators:
• Degree to which R&D matters in a country;
• R&D related to coal technologies and CCS (Carbon Capture Storage);
• Number of demonstration plants in a country;
• Efficiency of coal fired power plants (Output of electricity sector/Input electricity sec-
tor).
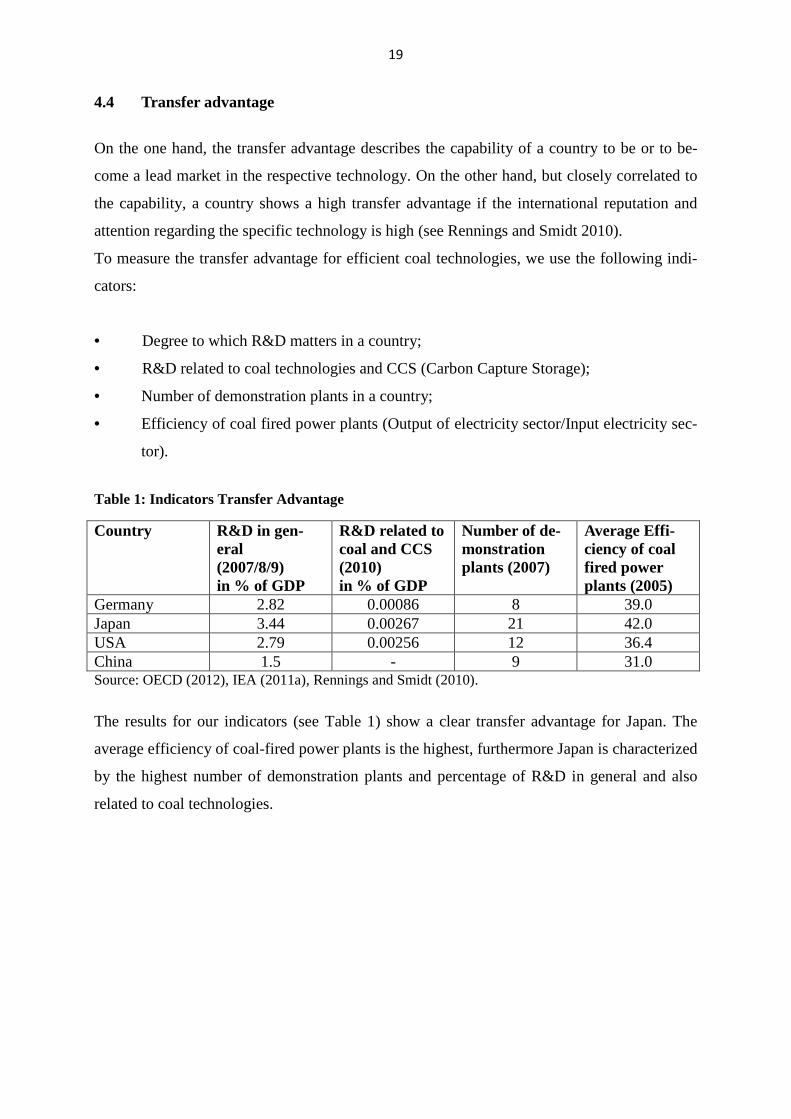
Table 1: Indicators Transfer Advantage
Country R&D in gen-eral (2007/8/9) in % of GDP
R&D related to coal and CCS (2010) in % of GDP
Number of de-monstration plants (2007)
Average Effi-ciency of coal fired power plants (2005)
Germany 2.82 0.00086 8 39.0 Japan 3.44 0.00267 21 42.0 USA 2.79 0.00256 12 36.4 China 1.5 - 9 31.0 Source: OECD (2012), IEA (2011a), Rennings and Smidt (2010). The results for our indicators (see Table 1) show a clear transfer advantage for Japan. The
average efficiency of coal-fired power plants is the highest, furthermore Japan is characterized
by the highest number of demonstration plants and percentage of R&D in general and also
related to coal technologies.
20
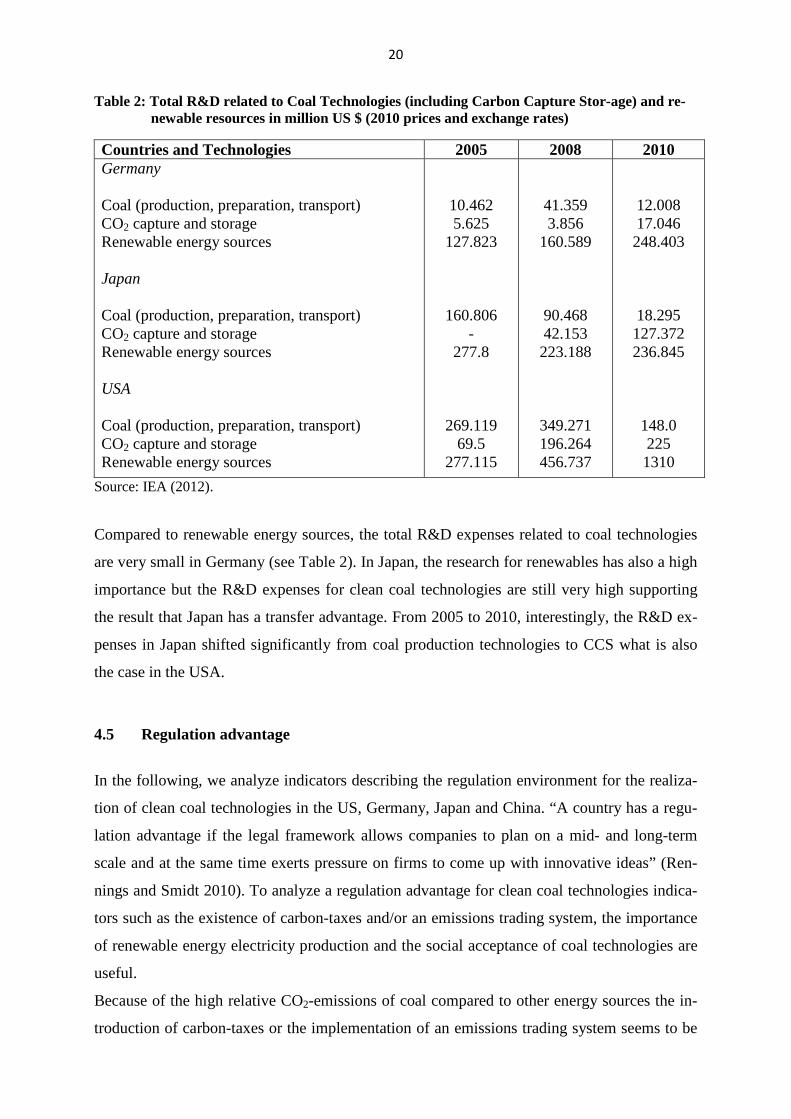
Table 2: Total R&D related to Coal Technologies (including Carbon Capture Stor-age) and re-newable resources in million US $ (2010 prices and exchange rates)
Countries and Technologies 2005 2008 2010 Germany Coal (production, preparation, transport) CO2 capture and storage Renewable energy sources Japan Coal (production, preparation, transport) CO2 capture and storage Renewable energy sources USA Coal (production, preparation, transport) CO2 capture and storage Renewable energy sources
10.462 5.625
127.823
160.806 -
277.8
269.119 69.5
277.115
41.359 3.856
160.589
90.468 42.153 223.188
349.271 196.264 456.737
12.008 17.046 248.403
18.295 127.372 236.845
148.0 225 1310
Source: IEA (2012).
Compared to renewable energy sources, the total R&D expenses related to coal technologies
are very small in Germany (see Table 2). In Japan, the research for renewables has also a high
importance but the R&D expenses for clean coal technologies are still very high supporting
the result that Japan has a transfer advantage. From 2005 to 2010, interestingly, the R&D ex-
penses in Japan shifted significantly from coal production technologies to CCS what is also
the case in the USA.
4.5 Regulation advantage
In the following, we analyze indicators describing the regulation environment for the realiza-
tion of clean coal technologies in the US, Germany, Japan and China. “A country has a regu-
lation advantage if the legal framework allows companies to plan on a mid- and long-term
scale and at the same time exerts pressure on firms to come up with innovative ideas” (Ren-
nings and Smidt 2010). To analyze a regulation advantage for clean coal technologies indica-
tors such as the existence of carbon-taxes and/or an emissions trading system, the importance
of renewable energy electricity production and the social acceptance of coal technologies are
useful.
Because of the high relative CO2-emissions of coal compared to other energy sources the in-
troduction of carbon-taxes or the implementation of an emissions trading system seems to be
21
a very important driver of clean coal technologies. Furthermore, a high proportion of renewa-
ble energy electricity production may exert a pressure on the coal sector to become more effi-
cient and less CO2 intensive. At least in the long run, energy policy decisions are dependent
on the acceptance of the society – the story of nuclear power being an excellent example for
this argument. On the one hand, a low social acceptance for coal may trigger activities to de-
velop cleaner coal technologies. But on the other hand, due to the fact that it is difficult to
explain to a non-technician that coal may be “clean”, the low social acceptance may also lead
to a resistance against all “dirty” and “clean” coal technologies. Thus we will describe and
compare the energy innovation systems and environmental policy in the four countries to
identify which country has advantages regarding regulation.
Germany
Historical development
In the following, we give a short historical overview on the evolution of the coal policy in
Germany showing drastic changes in the role of coal as energy source.5
The decade from 1970-1980 was still characterized by an explicit promotion of the production
of electricity by hard coal. As a consequence of the so-called “3. Verstromungsgesetz” the
electricity sector has been obliged to use a certain quantity of hard coal (justified by the secu-
rity of electricity supply). On the other side, new oil or gas plants even needed an explicite
permission. Furthermore, a subsidy compensating the high hauling cost for hard coal (“Stein-
kohlepfennig”) was introduced to reduce the burden for the energy suppliers (see Fuchs et al.
2011).
During this time period, the construction of sub-critical coal power plants with a degree of
effectiveness of 35% dominated. But on the other side, a more strict environmental policy
(especially the “Bundesimmissionsschutzgesetz”) emerged regulating the reduction of sulphur
dioxide (SO2) and NOx (mainly by end-of-pipe measures).
During 1980-1990 more rigorous emission limits for SO2, NOx and dust have been introduced
(“Großfeuerungsanlagenverordnung”). The second energy research program postulated an
increase of energy efficiency and a reduction of energy imports. After the nuclear catastrophe
in Tschernobyl (1986) the research in nuclear power technologies has been reduced. Because
of the before-mentioned Großfeuerungsanlagenverordnung, six GW of old subcritical coal
power plants were closed accompanied by an enlargement of electricity power-heat combina-
5 For a comprehensive report see Fuchs et al. (2011).
22
tion (KWK), the construction of 11 GW new power plants on the basis of hard coal but de-
spite the availability of supercritical technologies, most of the new power plants were still
subcritical. The time period was also characterized by a further development of fluidized bed
combustion (see Fuchs et al. 2011).
The coal policy from 1990-2000 was initially dominated by the reunification of Germany
leading to high subsidization for new lignite based power plants in East Germany. The so-
called “Kohlepfennig” was declared as illegal leading to a reduction of the use of hard coal in
Germany, furthermore the restrictions for gas and oil fired power plants were abolished. As a
consequence, only few hard coal based power plants with predominantly supercritical steam
parameters (efficiency degrees of 43%) have been constructed. The liberalization of the ener-
gy market led to high cost pressures for the energy suppliers.
From 2000-2011 the energy policy in Germany was more and more oriented towards renewa-
ble energies. The 5th and 6th energy research program aims at making the energy system sus-
tainable by using renewable energy. A well balanced energy mix using hard and brown coal
shall be realized. An increase of energy efficiency against the background of increasing ener-
gy prices from 2005 to 2008 and a higher share of renewables connected with climate protec-
tion are in the focus. Concerning coal the use of CCS technologies has been proposed but the
societal acceptance of this technology is very low in Germany.
The introduction of the CO2 emission trade system can be understood as a disadvantage for
the use of coal despite the fact that the prices of CO2 emission permits remained moderate
during this decade. Nevertheless, only few new fossil-based power plants have been con-
structed since 2000. The competition policy concerning energy was characterized by an intro-
duction of a stock market for electricity and further liberalization of the electricity market.
In 2011, an agreement to phase-out nuclear energy was decided in Germany after the Fuku-
shima accident, which may be a driver for the construction of new clean coal technologies.
Assessment of the regulation advantage for clean coal technologies in Germany
The general policy background for coal technologies in Germany is characterized by a low
societal acceptance whereas the high subsidized renewable energies are in the focus of energy
policy. As already shown, the coal policy strategy has strongly changed during 1970 to 2011
but the sixth energy research program of the German government from 2011 still contains
important elements to promote clean coal technologies. An important institution is COORE-

23
TEC denoting CO2 reduction technologies (see Bundesministerium für Wirtschaft und Tech-
nologie, 2011) for the use of fossil fuels. This initiative aims at
• an improvement of energy efficiency in fossil-fuel-fired power plants;
• the promotion of Carbon Capture Storage (CCS) technologies;
• system integration of power plants, network optimization, better connection of power
plants with industrial processes.
Furthermore, European initiatives play an important role. Already in 1998, a group of major
suppliers to the power industry and some of the major utilities in Europe started a 17-year
demonstration project that was financially supported by the European Commission (European
Commission 2011:74), namely the so-called Thermie 700°C. “The main aim of the
THERMIE 700 °C steam coal power plant project is to make the jump from using steels to
nickel-based super alloys for the highest temperatures in the steam cycle which should enable
efficiencies in the range of 50-55 % to be achieved.” (European Commission 2011:74).
As regards the German innovation policy, the sixth energy research program shows that coal
technologies are not in the focus of innovation policy and subsidies because of the high atten-
tion towards renewables but the program confirms that the improvement of the use of coal for
electricity production is necessary despite a low societal acceptance. In fact, the environmen-
tal policy goes in a similar direction. Renewable energy is highly subsidized, on the other side
eco-taxes and the European Emission Trade System (ETS) lead to a higher burden of fossil
fuel energy suppliers and energy consumers. The negative effect of environmental policy (e.
g. ETS) is moderated because the amount of permits for energy suppliers were high and main-
ly costless because a grandfathering allocation system was still in use. Furthermore, there are
still exceptions for energy suppliers concerning eco-taxes. From the side of the industrial pol-
icy, too, the liberalization of the electricity market led to a higher competition and costs for
fossil fuel energy suppliers.
In a nutshell, Germany lost much of its regulation advantage for clean coal technologies dur-
ing the last ten years because of a clear cut change of paradigm towards renewables. It may be
true that this new strategy also triggers the development of more efficient coal technologies
but on the other hand the coal sector lost much of its financial support by the state in favor of
renewables. In the long run, it can be expected that the low societal acceptance of coal will
lead to a further loss of regulation advantage for clean coal technologies.

24
China
Historical development of “clean coal policy”
Subcritical coal power plants dominated in China until 2000. Whereas significant supercritical
technologies are observable only from beginning of 2004, the installation of ultra-supercritical
capacities began in 2007. Historically, the decade from 1970-1980 is characterized by ineffi-
ciencies of the innovation system (see Fuchs et al. 2011): A strict state control on innovation
activities was accompanied by low R&D spending. In absence of environmental regulation
measures exclusively subcritical technologies have been used. Furthermore, some plants with
Circulated Fluidized Bed Combustion (CFBC) with low efficiency but allowing to burn cheap
coal were constructed.
From 1980-1990 the Chinese economy grew by 15% per year, first considerable foreign direct
investment was observed. This decade also showed first measures to protect the environment:
1984 Pollution Prevention and Control Law, 1987 Air Pollution Prevention and Control Law,
1989 Environmental Protection Law of the People's Republic of China (see Fuchs et al. 2011).
The Chinese government tried to promote high technology innovation activities: National
High Technology Research and Development Program und the Torch Program (high and
emerging technology industry development program) but the lack of protection of knowledge
in China led to low incentives for foreign investors to use new technologies, furthermore the
overall spending in R&D was still low. Furthermore, state-regulated low electricity prices
reduced the incentives to invest in clean coal technologies (see Fuchs et al. 2011).
During 1990-2000 the national innovation system was strengthened by the National Basic
Research program: promotion of research in agriculture, energy, environmental issues, infor-
mation and communication technologies. China introduced a law for the electricity sector to
trigger investments and higher emission limits for power plants but they were still significant-
ly lower compared to other countries. A further aim was the increase of energy efficiency:
Law of the People's Republic of China on Conserving Energy.
Concerning coal technologies, China promoted FBC technologies and also IGCC. Joint ven-
tures (e.g. Dongfang and Hitachi Company (Japan), Shanghai Electric and Siemens) and li-
cense contracts Harbin and Pyro-Power Company, Dongfang and Foster&Wheeler aimed at
improving the technological performance of Chinese coal fired power plants. Furthermore, a
closer cooperation between Japan and China for the construction of power plants has been
realized. In 1992, first supercritical power plants were constructed.
25
During 2000-2011 the high energy demand in connection with higher energy prices increased
the pressure to develop more efficient power plants. The 11th five-year-plan contained the
goal of a reduction of energy consumption per unit of GDP by 20% to increase energy effi-
ciency. Concerning technology, the medium and long term energy conservation plan intended
to use more FDC technologies and heat-power combinations and an increase of R&D in
IGCC technologies. During this decade, China became a member of WTO, foreign direct in-
vestment and foreign R&D in China has been enlarged significantly (see Fuchs et al. 2011).
Assessment of the regulation advantage for clean coal technologies in China
The general policy conditions for the use of coal power plants in China are – against the
background of a still highly growing energy demand – favorable, despite a growing con-
sciousness of politicians and population for environmental measures. Following Hong et al.
(2009), China has tightened its environmental protection laws and standards during the recent
years. Environmental protection in the power industry is mainly carried out through the State
Electricity Regulation Commission. “At the end of 2001 China’s State Environmental Protec-
tion Administration initiated the national 10th Five-Year Plan for Environmental Protection to
address the grim situation of environmental protection in China. The plan proposed energy-
conservation and emission-reduction goals specifying that by 2005 sulphur dioxide emissions
from the power industry would be reduced by 10 to 20 per cent from 2000 levels and the av-
erage coal consumption of coal-fired power plants would drop to 15 to 20 grams per kilowatt-
hour below 2000 levels.” (Hong et al., 2009:20).
The 11th Five-Year Plan of the Chinese government aims at restructuring the energy sector by
shutting down high polluting and energy-consuming small thermal power plants: “In 2007 the
State Council proposed the closure of 50 gigawatts of thermal power units during the period
of the 11th Five-Year Plan, replacing them with the installed capacity of larger and more en-
ergy-saving superscale or ultra-superscale thermal power units. This means that 12 gigawatts
to 13 gigawatts will be closed down annually.” (Hong et al., 2009:22).
The industrial policy of the Chinese government aims at increasing the energy efficiency in
energy-intensive sectors such as steel and electrolytic aluminum industries “ … in order to
substantially lift entry barriers in terms of energy efficiency and to speed up the elimination of
small steel-making and thermal power.” (Hong et al., 2009:22). In Article 31 of the law on
Energy Conservation, “…the state encourages industrial enterprises to adopt highly efficient
and energy-saving motors, boilers, furnaces, fans and pumps, and to employ co-generation

26
technology, residual heating and pressure utilization, clean coal technology and advanced
energy monitoring and control technologies.” (Hong et al., 2009:20). In fact, from 2001 to
2011, 21 ultra-supercritical coal-fired power plants were constructed in China.
To sum up, in China, the regulation situation seems to be positive for the implementation of
clean coal technologies. On the one hand, because of the high and still growing energy de-
mand connected with enormous coal reserves, China will not renounce the use of coal. On the
other hand, a growing environmental consciousness of politicians and parts of the population
trigger the development of cleaner coal technologies. The construction of ultra-supercritical
coal-fired power plants during the last years confirms this argumentation.
Japan
Historical development
In the early 1970s Japan had a quite one-sided alignment towards oil. After the oil crises in
1973 and 1979, a more balanced energy mix was developed. The “Law concerning Rational
Use if Energy” was passed and R&D expenditure for coal increased obviously, for example
coal liquefaction (see Fuchs et al. 2011).
The “Alternative Energy Law” was passed to promote alternative energy sources for oil and a
prohibition for building oil power plants. Central elements of R&D was circulating fluidized
bed combustion, pressurized fluidized bed combustion and the development of power plants
with ultra-supercritical steam parameters to lower costs and raise efficiency (see Fuchs et al.
2011).
In 1995, the first “Science and Technology Basic Law” was adopted and specified by the
“Science and Technology Basic Plan”. Japan also began to liberalize its energy market. One
year later a voluntary agreement to lower CO2 emissions was enacted, inter alia “The Federa-
tion of Electric Power Companies of Japan” concluded to lower the CO2 emissions per unit of
output about 20%. Several possibilities to achieve this goal were mentioned: more nuclear
power plants, a raise of efficiency of power plants and the use of new techniques (renewable
energy). Research still focused on fluidized bed combustion and IGCC technology (see Fuchs
et al. 2011).
In 2001 and 2006, new Science and Technology Basic Plans were established. The “Basic
Energy Plan” and “Strategic Energy Plan” aim among other things for a reduction of depend-
ence on imports and a raise of CO2-free energy production to over 70%. For this purpose, an
27
obvious reduction of CO2 emissions of new coal power plants was planned. Furthermore, Ja-
pan proceeded with liberalizing their energy market and continued research in the IGCC tech-
nology sector (see Fuchs et al. 2011).
After the catastrophe of Fukushima in 2011 there was nearly no social acceptance for nuclear
energy (Meltzer 2011). To close the gap left behind by nuclear power plants Japan is forced to
raise the amount of coal and especially oil/gas power which will lead to increased costs of
imports. Currently Japan is working out a new energy concept (see Hünteler et al., 2012).
Assessment of the regulation advantage for clean coal technologies in Japan
Especially the Japanese innovation policy seems to be favorable for the development of clean
coal technologies because of the focus on highly efficient power plants. The R&D subsidies
are high and co-operations between universities and the industry are actively supported. The
relatively high amount of ultra-supercritical power plants constructed during the last twenty
years confirms this picture. In fact, Japan is forced to develop and use highly efficient coal
technologies because the country is highly dependent on imports of energy. On the other side,
the Japanese energy firms are strongly export oriented so that they are forced to develop new
and efficient technologies that may be sold on the world market.
In future, against the background of the high risk of nuclear power plants in Japan, efficient
clean coal technologies may still play a more important role.
USA
Historical development
In the 70ies subcritical power plants dominated, but, interestingly, in 1959/1960 the USA
constructed the first ultra-supercritical coal-fired power plant but abandoned this technology
nearly completely. First measures to reduce the dependence from oil reserves took place, e.g.
the Public Utility Regulatory Policies Act promoting renewable energy and opening electrici-
ty markets, and the Energy Tax Act reducing charges for solar, wind and geothermal heat.
The use of oil and gas in the industrial sector was limited by an enlargement of R&D for the
energy sector, by promoting of PFBC allowing for higher efficiency and the by use of low-
quality coal (see Fuchs et al. 2011).
In the 80ies, under the Reagan-Government, deregulation and a reduction of public R&D
started. A Clean Coal Technology Program was introduced due to the discussion of acid rain.
28
The policy continued in the 90ies with the Energy Policy Act of 1992. This led to a further
opening of the electricity market leading to an increase of the construction of gas-fired power
plants due to their low investment costs and due to generally low gas prices and high reserves
of gas in the USA (see Fuchs et al. 2011).
During the past decade oil prices increased drastically, and a Climate Change Technology
Program (CCPT) was introduced: The goal is to reduce greenhouse gas emissions and to fur-
ther develop clean coal technologies such as IGCC and CCS, new nuclear power plants and
more renewable energy. The Clean Coal Power Initiative (CCPI) developed and commercial-
ized new coal technologies, especially CCS and IGCC (see Fuchs et al. 2011).
Today, the USA experiences a new natural gas boom. One reason consists in the new envi-
ronmental targets of less CO2 emissions. The combustion of natural gas emits less CO2 and
SO2. Combined cycle power plants only emit the half compared to an equivalent coal power
plant. The second reason is the increasing gas supply in the USA accompanied by decreasing
prizes. Due to the hydraulic fracturing technology, unconventional new resources that were
not profitable up to now, can be extracted (Energy in Brief, 2012). So it has been estimated
that 500 coal power plants can be replaced by new natural gas power plants (Handelsblatt,
2011).
Assessment of the regulation advantage for clean coal technologies in USA
The development of efficient energy technologies is mainly market-driven, there is only few
public R&D support. Concerning coal technologies, the USA show a concentration on IGCC
and Fluidized Bed Combustion. Despite the fact that the first ultra-supercritical power plant
was constructed in the USA in 1959, this country abandoned this technology. Furthermore,
the environmental policy regarding a CO2 emission reduction strategy is quite lax. In fact,
there seems to be no regulation advantage for the USA concerning clean coal technologies.
To sum up, compared to the US, Germany and Japan, China seems to have a regulation ad-
vantage concerning clean coal technologies.

29
5 Market structure, lead suppliers and technological capability
The recent literature on lead markets (e.g. Rennings and Cleff 2011 or Tiwari and Herstatt
2011) accentuates the role and the importance of supply side aspects for the developments of
lead markets. A competitive market structure combined with the existence of highly innova-
tive lead suppliers may be the basis of the leadership of a country in a specific technology.
Therefore, we firstly analyse the market structure for coal technologies combined with an
identification of the respective lead suppliers. Secondly, we analyse the framework conditions
for competition and innovation in our four countries followed by a deeper analysis of the
technology capabilities using patent indicators.
The question which market structure is best for the realization of innovations has a long tradi-
tion in the theoretical literature on innovation behaviour of firms. Following Arrow (1962),
firms in competitive markets have higher incentives to invest in R&D because they may get –
at least for a limited period of time - the full economic rent from an innovation. Contrary to
that, Schumpeter (1943) argues that big firms in monopolistic markets are more likely to solve
the appropriation problem, namely to keep the rents of their innovation. Therefore, the role of
the market structure remains an empirical question. Many empirical analyses support the view
of Arrow, but especially the more capital intensive the industry and the respective innovation
activities, large firms in monopolistic markets may also be more innovative (see Martin
2006).
Concerning coal technologies, the markets in our four countries seem to be highly concentrat-
ed. Table 3 shows the shares of the “big five” producers of whole components, turbine and
boiler suppliers. Following this indicator, the markets in Japan and the USA are characterized
by the highest concentration whereas the situation in Germany seems to be a bit more compet-
itive.
30
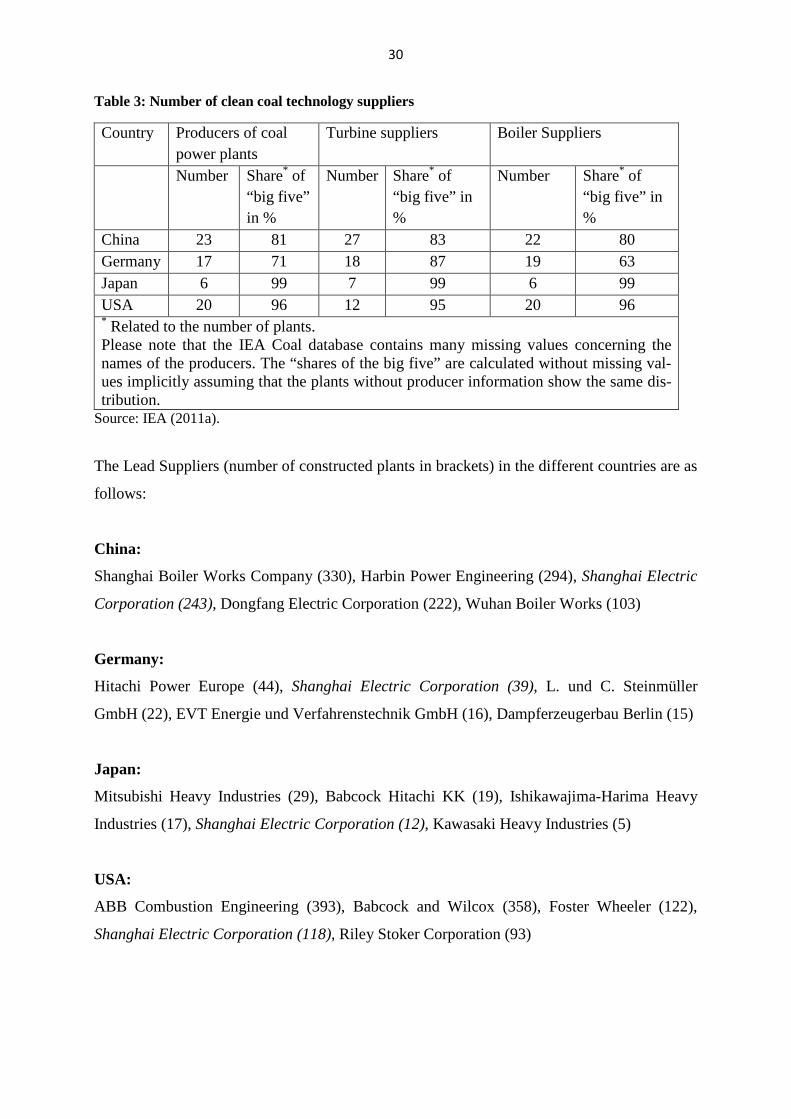
Table 3: Number of clean coal technology suppliers
Country Producers of coal power plants
Turbine suppliers Boiler Suppliers
Number Share* of “big five” in %
Number Share* of “big five” in %
Number Share* of “big five” in %
China 23 81 27 83 22 80 Germany 17 71 18 87 19 63 Japan 6 99 7 99 6 99 USA 20 96 12 95 20 96 * Related to the number of plants. Please note that the IEA Coal database contains many missing values concerning the names of the producers. The “shares of the big five” are calculated without missing val-ues implicitly assuming that the plants without producer information show the same dis-tribution.
Source: IEA (2011a).
The Lead Suppliers (number of constructed plants in brackets) in the different countries are as
follows:
China:
Shanghai Boiler Works Company (330), Harbin Power Engineering (294), Shanghai Electric
Corporation (243), Dongfang Electric Corporation (222), Wuhan Boiler Works (103)
Germany:
Hitachi Power Europe (44), Shanghai Electric Corporation (39), L. und C. Steinmüller
GmbH (22), EVT Energie und Verfahrenstechnik GmbH (16), Dampferzeugerbau Berlin (15)
Japan:
Mitsubishi Heavy Industries (29), Babcock Hitachi KK (19), Ishikawajima-Harima Heavy
Industries (17), Shanghai Electric Corporation (12), Kawasaki Heavy Industries (5)
USA:
ABB Combustion Engineering (393), Babcock and Wilcox (358), Foster Wheeler (122),
Shanghai Electric Corporation (118), Riley Stoker Corporation (93)
31
Interestingly, the Chinese company “Shanghai Electric Corporation” constructs power plants
in all of the considered countries showing the rising importance of China for coal technolo-
gies.
On the background of the above mentioned controversial theoretical debate and the fact that
the development and the construction of new clean coal based power plants is capital inten-
sive the identification of a market structure advantage of any of the four countries is - follow-
ing our concentration indicator - not possible.
Therefore, it is furthermore useful to explore the general competition conditions in the four
countries on the basis on the Global Competitiveness Report of 2011. This report contains a
rich set of indicators on innovation and the respective framework conditions (see Table 4).
The overall Global Competitiveness Index (GCI) shows the highest rank for the USA (5) fol-
lowed by Germany (6) and Japan (9). China already reaches rank 26. To assess the conditions
for the development of new (clean coal) technologies it is more interesting to look at sub-
groups of the GCI especially on innovation indicators and those that describe the efficiency of
the goods market.
The innovation indicators show a dominant role of Japan: First ranks on the capacity of inno-
vation, company spending on R&D and a second rank for the availability of scientists and
engineers seeming to be a problem for Germany only reaching the last rank of the four coun-
tries (41). Concerning the patents granted (2), the state of the cluster development (3) and for
the firm-level technology absorption (3) Japan also attains the highest values of the four coun-
tries. Besides variables on trade barriers and rules on FDI, Japan shows high values for the
variables on good market efficiency, too. The intensity of local competition (rank 4) and the
effectiveness of anti-monopoly policy (rank 9) also seem to be very high in Japan.
The USA also reaches high ranks but mostly behind Japan except e.g. the quality of scientific
research institutions (rank 7), the government procurement of advanced technical products (9,
the availability of latest technologies (13) and the venture capital availability (12).
Germany also shows high innovation capacities (3) and a high quality of scientific research
institutions (10). Comparing the four countries, Germany reaches the best positions regarding
the quality of the educational system (17), the quality of the overall infrastructure (10) and the
intellectual property protection (13). Concerning this indicator, China only attains a low rank
(47). That is also the case for the effectiveness of anti-monopoly policy (48) and especially
for the existence of bureaucratic barriers in this country measured by the number of proce-
dures to start a business (131). Compared to the other three countries, the innovation capaci-
ties in China still seem to be quite low.

32
Table 4: Indicators from the Global Competitiveness Report
Indicator China Germany Japan USA Value Rank Value Rank Value Rank Value Rank
GCI 2011-2012 Good market efficiency Intensity of local competition Extent of market dominance Effectiveness of anti-monopoly policy No. of procedures to start a business Prevalence of trade barriers Business impact of rules on FDI Innovation indicators Capacity for innovation Quality of scientific research insti-tutions Company spending on R&D University-industry collaboration in R&D Gov´t procurement of advanced technical products Availability of scientists and engi-neers Utility patents granted/mill. popu-lation State of cluster development Availability of latest technologies Firm-level technology absorption FDI and technology transfer Venture capital availability Further indicators Quality of the educational system Quality of overall infrastructure Quality of electricity supply Intellectual property protection Burden of government regulation Transparency of government poli-cy Strength of investor protection
4.9 5.5 4.7 4.3 14 4.5 5.3 4.2 4.3 4.2 4.5 4.4 4.6 2.0 4.7 4.5 4.9 4.6 3.5 4.0 4.2 5.5 4.0 3.9 4.7 5.0
26 22 20 48 131 63 22 23 38 23 29 16 33 46 17 100 61 80 22 54 69 49 47 21 41 77
5.4 5.8 5.7 4.9 9 4.7 4.6 5.7 5.6 5.5 5.2 4.2 4.5 150.6 4.9 6.2 5.9 4.3 3.0 4.9 6.2 6.7 5.6 3.0 5.0 5.0
6 9 3 23 94 49 72 3 10 5 13 29 41 9 13 20 14 92 37 17 10 11 13 88 28 77
5.4 5.9 5.8 5.2 8 4.1 4.5 5.8 5.5 5.9 5.1 4.1 5.8 352.9 5.3 6.3 6.3 4.7 2.9 4.4 6.0 6.5 5.3 3.2 4.8 7.0
9 4 2 9 78 100 87 1 11 1 16 32 2 2 3 15 3 65 47 36 13 17 22 73 38 16
5.4 5.6 5.2 5.0 6 4.6 4.7 5.2 5.8 5.3 5.7 4.7 5.5 339.4 5.1 6.0 5.9 4.9 4.0 4.7 5.7 6.0 5.0 3.4 4.5 8.3
5 18 11 17 34 59 68 7 7 6 3 9 4 3 9 13 18 49 12 26 24 32 28 58 50 5
Source: World Economic Forum (2011).

33
The technological capabilities of the different countries with respect to coal technologies can
be measured by the importance of the respective patent activities. Figure 17 shows the world
market shares of coal fired power plant technologies in the four countries documenting the
high technology capabilities of Japan with a share of 40% in 2007. In the USA, the market
share declined from 1991 to 2007 showing the diminishing interest and capability of this
country in the development of clean coal technologies. In Germany, the patent shares are
stagnating whereas the figures for China are rising but starting at a very low level.
Figure 17: World Market Share Patents: Coal-fired Power Plant Technologies
Source: ISI (2012).
Furthermore, the Relative Patent Advantage is calculated for each country i and each technol-
ogy field j according to (see Walz and Marscheider-Weidemann (2011)):
RPAij = 100 * tanh ln{(pij/∑i pij)/(∑j pij/∑ij pij)}
0,0%
10,0%
20,0%
30,0%
40,0%
50,0%
60,0%
1991 1993 1995 1997 1999 2001 2003 2005 2007
ChinaJapanGermanyUSA

34
The RPA indicates if the world patent share of clean coal technologies of a country is bigger
or smaller than the country´s world patent share for all technologies.
The RPA values confirm the picture obtained for the world patent shares (see Figure 18).
Figure 18: Relative Patent Advantage for Coal-fired Power Plant Technologies
Source: ISI (2012).
For all years from 1991 to 2007, only Japan shows positive figures documenting its leading
technological capabilities for clean coal technologies. The RPA values also confirm the de-
cline of the importance of coal technologies for the USA. Because of low absolute values for
the number of coal related patents the figures for China do not yet show a clear picture. The
stagnating situation for Germany regarding clean coal technology capabilities is confirmed.
To sum up, all countries are characterized by high concentration values for coal technology
suppliers so that further indicators have to be analysed to assess a market structure advantage.
Once again, Japan seems to be on top of the four countries because of its high innovation ca-
pacities and the high availability of scientists and engineers.
-150
-100
-50
0
50
100
1991 1993 1995 1997 1999 2001 2003 2005 2007
China
Japan
Germany
USA

35
6 Firm views and strategies – results from expert interviews
To analyze the strategies of firms regarding the development and use of new efficient coal
technologies against the background of a growing political support of renewables expert in-
terviews were carried out. A producer of components for coal based power plants
(Saarschmiede), a power plant producer (Hitachi Power Europe) and an energy supplier (Vat-
tenfall) were interviewed.
The expert interviews aimed at analyzing
• the existence and the role of first mover advantages concerning efficient coal technol-
ogies including the countries China, Germany, Japan and the USA;
• how component suppliers, power plant producers and energy suppliers react to energy
policy changes especially in Germany.
Presentation of the questioned firms
Saarschmiede produces components for (coal fired) power plants (e. g. turbine & generator
shafts, turbine & compressor rings, parts for plant construction or high pressure vessels).
Germany remains the main market (37%) followed by Europe (23%), Asia (23%) and the
USA (15%). Whereas the construction of completely new power plants plays an important
role in China and India, in Germany and especially in the USA, the refurbishment of existing
power plants dominate. The Saarschmiede may be characterized as one of the world market
leaders regarding high quality steel components for power plants, the main competitors are
coming from Japan (Japan Steel Works, Japan Casting and Forging Corporation) or from Eu-
rope (Böhler, Germany or Terni Steel, Italy) whereas competitors from the USA do not play
an important role. The main customers in Europe are Siemens, Alstom or GE but the Chinese
market gains importance (Shanghai Boiler Works, Harbin Power Engineering or Dongfang
Electric Corporation as clients of Saarschmiede).
Hitachi Power Europe is one of the main constructors of fossil fired power plants (especially
coal fired and nuclear based power plants). Whereas the rapidly growing market of China is
supplied by other firms of the Hitachi group, Hitachi Power Europe concentrates on the con-
struction of new power plants in Europe (especially Poland, Turkey and Russia), India and

36
South-Africa. In Germany, the company increasingly concentrates on services and refurbish-
ment for existing power plants because, at the moment, nearly no new coal fired power plant
projects are planned. The main competitors concerning boilers are Alstom and IHI and Sie-
mens with regard to turbines.
Vattenfall is an energy supplier mainly producing electricity by lignite (80%). Concerning
electricity production, Vattenfall has a market share of 16% in Germany. The main competi-
tors are RWE, EON and EnBW. The main constructors of the power plants of Vattenfall are
Hitachi Power Europe, Alstom and Siemens.
Market development in Germany, China, Japan and the USA
At present, the market for (clean) coal technologies in Germany is negatively assessed be-
cause of the high political support of renewables in combination with uncertainties concerning
the future role of coal technologies. Nevertheless, the experts of Hitachi and Vattenfall are
optimistic that coal technologies will play even a growing role to assure the energy supply in
Germany, especially by the use of lignite based highly efficient power plants. At the moment,
only refurbishment of existing coal power plants and services are important business areas
whereas nearly no new projects are realized. In Japan, the future role of nuclear power is un-
certain, but the experts do not expect a dynamic development concerning coal fired power
plants. The market in China is very dynamic, around 50 new power plants are built every year
leading to extensive possibilities to implement highly efficient technologies (ultra-
supercritical). In the USA, at present, only few new coal fired power plants are constructed
because of the high availability of gas but the high age of coal fired power plants (see Section
4.2) leads to high refurbishment potentials and markets.
Future dominating efficient coal technologies
Super and ultra-supercritical technologies will dominate other coal based technologies such as
fluidized bed combustion, the future of advanced ultra-supercritical (700°C power plants) is
unclear because of high investment costs and technology risks. Especially in Germany, lignite
drying will be useful to increase efficiency of lignite based power plants. In the distant future
Carbon Capture Storage (CCS) may play an important role but this development is strongly
dependent on CO2 prices and societal acceptance.

37
Assessment of the role of China as supplier
Following our analysis in Section 4.3, Japan and Germany still dominate the markets and the
international trade for turbines, but concerning boilers China shows the highest export vol-
ume. According to our expert interviews, this picture is not totally true: China is specialized in
low and middle temperature boilers, whereas the Chinese producers have still problems to
produce high quality boilers. Even components supplied to German power plant producers
have to be repaired and improved before they may be used. One expert assesses that China
will be able to reduce their quality gap concerning boilers – an argument that may be con-
firmed by the Benson Boiler reference list of Siemens showing that Chinese firms (e. g.
Dongfang Boiler Works) are able to produce boilers that are resistant to steam temperatures of
more than 600 °C. Interestingly, following the new five-year-plan, China has decided to build
a 700°C power plant. If this strategy will be successful, China would probably get the techno-
logical leadership. In fact, this seems to be highly uncertain because the Chinese innovation
system is predominantly characterized by imitations and less by totally new technologies and
products.
Concerning lignite based power plants, China is still not competitive, Hitachi and Alstom are
market leaders.
Competition situation of coal technologies in Germany
Disregarding the negative external effects caused by the emissions of coal-based electricity
production coal would be the cheapest solution among all energy carriers because of its rea-
sonable cost of production and the high security of supply. The energy policy in Germany
tries to internalize these negative external effects by taxes and emission permits (see also Sec-
tion 4.5). Furthermore, renewable energies are highly subsidized. Nevertheless, the represent-
atives of Hitachi and Vattenfall are optimistic that coal and especially lignite will play an im-
portant role in Germany at least up to 2050. Saarschmiede points to a growing importance to
gas based electricity production.
Relevance of first mover advantages
Japan and Germany seem to have clear first mover advantages concerning the highly innova-
tive parts of clean coal technologies and in general for 600 °C power plants whereas China
has second mover advantages in manufacturing boilers. Following the experts, Germany has
highly profited from these first mover advantages in terms of export success and technological

38
leadership. The crucial question remains if the German firms are able to keep the first mover
benefits against the background of the shrinking importance of coal technologies in Germany?
Saarschmiede as a component producer is at least optimistic that the R&D units (“innovative
cells”) will not leave Germany or Japan despite of declining markets in these countries be-
cause of the lack of highly educated and innovative staff in China.
The experts of Hitachi and Vattenfall are more pessimistic. Germany and also Japan may lose
their first mover advantages because a considerable part of innovation activities occurs when
a power plant is constructed in close cooperation with the client. Due to the fact that nearly no
new coal-fired power plants are projected in Germany, this country may lose a part of these
first mover advantages. On the other side, the high market volume in China (nearly 50 power
plants per year) leads to more innovation activities in this country. It is unclear if Chinese
firms will be able to build a 700 °C power plant as intended in the five-year-plan but they will
gain experiences and may get a technological leadership.
Following the opinion of Vattenfall, Germany will not lose its first mover advantages regard-
ing lignite-based power plants.
An important pre-condition for keeping the technological leadership for efficient coal tech-
nologies would be the reduction of the high uncertainty regarding the future use of coal,
whereas - on the other side - the profits for renewables are guaranteed. Following one expert,
there is also a lack of qualified staff (engineers), an enlargement of cooperation with universi-
ties would be useful.
Strategic reactions of firms against the background of energy policy and the low societal ac-
ceptance of coal in Germany
Following the opinion of the questioned experts, the market situation in Germany for clean
coal technologies requires far-reaching changes of firm strategies. For Saarschmiede, an in-
creasing concentration on foreign markets is necessary because of the uncertainty regarding
coal power plants in Germany, the firm will more and more concentrate on the Chinese mar-
ket. At present, Hitachi Power Europe extends its business fields services, the refurbishment
of existing power plants or the de-construction of nuclear power plants because, in Germany,
the construction of new coal power plants will only be relevant in 5-10 years. Furthermore,
the firm extends its activities in new markets such as Poland, Turkey or Romania whereas the
Chinese market is not possible for Hitachi Power Europe. Despite these activities, Hitachi was
forced to cut jobs.

39
On the one hand, Vattenfall will extend the use of renewable energies, on the other hand, the
firm will still rely on lignite because under the condition of current and expected CO2 prices
this energy carrier will be competitive. A further option is the extension of R&D for CCS.
7 Summary and conclusions
Despite the high CO2 emission intensity of fossil and especially coal fired energy production,
these energy carriers will play an important role during the coming decades. The case study
identifies the main technological trajectories concerning more efficient fossil fuel combustion
and explores the potentials for lead markets for these technologies in China, Germany, Japan
and the USA taking into account the different regulation schemes in these countries. We con-
centrate on technologies that have already left the demonstration phase. This is the case for
supercritical (SC) and ultra-supercritical (USC) pulverized coal technologies that are already
established.
An analysis of the diffusion of efficient coal technologies shows that the USA took over the
role of a lead market in the 1960’s and during the following 20 years. Other countries fol-
lowed the American innovation design, such as Germany in the 1960’s and Japan in the
1970’s. The diffusion curves overlap by Japan in the early 1980’s since America stopped to
build new (ultra-) supercritical power plants. Although China is still the last country that in-
troduced ultra-supercritical technologies in 2007, commercial adoption of this technology is
expanding rapidly. The analysis shows that the typical pattern of a stable lead market only
applies to a limited extent because Japan has surpassed the USA although it started as a typi-
cal lag market.
In a second step, we analyze the different lead market factors. The price advantage is de-
scribed by hard and brown coal reserves, fuel prices and electricity generating costs. The USA
and China show a clear price advantage regarding the coal reserves. Furthermore, China has
the lowest generating costs so that, all in all, China seems to have the best position regarding
the price advantage whereas Japan holds the last position because of the lack of reserves and
high prices. High income per capita in the USA, Japan and Germany point to a demand ad-
vantage of these countries but high electricity intensity and the highest share of coal in elec-
40
tricity production (80%) favors China. The USA shows the highest average age of coal plants
pointing to refurbishment potentials. To describe the export advantage the indicators “export
minus import” and the “development of export/import ratio” has been used. China seems to
have an export advantage for steam boilers, whereas Japan holds this position for steam tur-
bines. Due to the growing importance of highly efficient coal power plants requiring “high-
tech” steam boilers, the Chinese producers will only keep their export advantage if they are
able to improve the technical quality of their boilers.
On the one hand, the transfer advantage describes the capability of a country to be or to be-
come a lead market in the respective technology. On the other hand, but closely correlated to
the capability, a country shows a high transfer advantage if the international reputation and
attention regarding the specific technology is high. To measure the transfer advantage for ef-
ficient coal technologies, we use the indicators “degree to which R&D matters in a country”,
“R&D related to coal technologies and CCS (Carbon Capture Storage)”, “number of demon-
stration plants in a country” and the “efficiency of coal fired power plants”. The results for
our indicators show a clear transfer advantage for Japan. The average efficiency of coal-fired
power plants is the highest, furthermore Japan is characterized by the highest number of
demonstration plants and percentage of R&D in general and also related to coal technologies.
Germany lost much of its regulation advantage for clean coal technologies during the last ten
years because of a clear cut change of paradigm towards renewables. It may be true that this
new strategy also triggers the development of more efficient coal technologies but on the oth-
er hand the coal sector lost much of its financial support by the state in favor of renewables. In
the long run, it can be expected that the low societal acceptance of coal will lead to a further
loss of regulation advantage for clean coal technologies. On the other hand, in China, the reg-
ulation situation seems to be positive for the implementation of clean coal technologies. Chi-
nese politicians will not renounce the use of coal because of the high and still growing energy
demand connected with enormous coal reserves. Furthermore, a growing environmental con-
sciousness of politicians and parts of the population triggers the development of cleaner coal
technologies. Compared to the US, Germany and Japan, China seems to have a regulation
advantage concerning clean coal technologies.
The analysis of supply side factors shows that all countries are characterized by high concen-
tration values for coal technology suppliers. To assess a market structure advantage, further
indicators have to be analysed. Japan seems to be on top of the four countries because of its

41
high innovation capacities and the high availability of scientists and engineers and because of
its leadership regarding clean coal patent activities.
All in all, Japan has caught up in terms of supply factors, China in terms of price, demand and
regulation advantage. The fact that Japan is now the leading country for ultra-supercritical
coal technologies supports the hypothesis that - apart from the demand-oriented lead market
model - push factors such as R&D activity play a strong role as well. The advantage of Japan
mainly stems from its intensive R&D activities. It can also be observed that some other ad-
vantages - such as price and demand advantage - are shifting to China. China is practicing a
leapfrogging strategy, and has already become a leader in the market segment of low and
middle quality boilers, whereas Japan and Germany still dominate the world turbine market.
To learn more about the reactions of firms towards a changing energy policy favoring renew-
ables expert interviews were carried out. These interviews confirm that Japan and Germany
seem to have clear first mover advantages concerning the highly innovative parts of clean coal
technologies and in general for 600 °C power plants whereas China has second mover ad-
vantages in manufacturing boilers. The crucial question remains if the German firms are able
to keep the first mover benefits against the background of the shrinking importance of coal
technologies in Germany? Saarschmiede as a component producer is at least optimistic that
the R&D units (“innovative cells”) will not leave Germany or Japan despite of declining mar-
kets in these countries because of the lack of highly educated and innovative staff in China.
The experts of Hitachi and Vattenfall are more pessimistic. Germany and also Japan may lose
their first mover advantages because a considerable part of innovation activities occurs when
a power plant is constructed in close cooperation with the client. Due to the fact that nearly no
new coal-fired power plants are projected in Germany, this country may lose a part of these
first mover advantages.
Following the opinion of the questioned experts, the market situation in Germany for clean
coal technologies requires far-reaching changes of firm strategies. For Saarschmiede, an in-
creasing concentration on foreign markets is necessary because of the uncertainty regarding
coal power plants in Germany, the firm will more and more concentrate on the Chinese mar-
ket. At present, Hitachi Power Europe extends its business fields services, the refurbishment
of existing power plants or the de-construction of nuclear power plants because, in Germany,
the construction of new coal power plants will only be relevant in 5-10 years. Furthermore,
the firm extends its activities in new markets such as Poland, Turkey or Romania. On the one
42
hand, Vattenfall will extend the use of renewable energies, on the other hand, the firm will
still rely on lignite because under the condition of current and expected CO2 prices this energy
carrier will be competitive.
Acknowledgements
This work was made possible by funding from the project “Lead Market Strategies: First Mover, Early Follower, Late Follower” (funded by the German Ministry of Research and Ed-ucation under the Program “Science for Sustainability, Economics and Sustainability”). References Arrow, K. (1962): Economic Welfare and the Allocation of Resources for Invention, in:
Nelson, R. (ed.): The Rate and Direction of Inventive Activity, New Jersey, pp. 609-625.
Beise, M. (2001): Lead Markets. Country-Specific Success Factors of the Global Diffusion of Innovations. ZEW Economic Studies Vol. 14, Heidelberg/New York.
Beise, M., K. Rennings (2005): Lead markets and regulation: a framework for analyzing the international diffusion of environmental innovations. Ecological Economics Vol. 52, p. 5-17.
Buchan, B., C. Cao (2004): Coal-fired generation: Proven and developing technologies. Of-fice of Market Monitoring and Strategic Analysis, Florida Public Service Commission, http://www.naruc.org/associations/1773/files/definition.pdf .
Bundesministerium für Wirtschaft und Technologie (2011): Forschung für eine umweltscho-nende, zuverlässige und bezahlbare Energieversorgung, Das 6. Energieforschungspro-gramm der Bundesregierung, Berlin.
China Electricity Council (CEC) (2011): The Preliminary statistics of national electric power industry in 2010, Beijing, http://www.cec.org.cn/tongjixinxibu/tongji/niandushuju/ 2011-02-23/44236.html.
Dekimpe, M. G., Parker P. M., Sarvary M. (1998): “Globalisation”: Modelling Technology adoption Timing across Countries. INSEAD working paper No. 98/69/MKT.
Energy 2.0 (2008): Strom in Kraftwerken effizienter erzeugen, p. 24 ff. Energy in Brief (2012): What is shale gas and why is it important?, April 11, 2012,
http://205.254.135.7/energy_in_brief/about_shale_gas.cfm. European Commission (2011): 2011 Update of the Technology Map for the SET-Plan, Chap-
ter 9: Advanced Fossil Fuel Power Generation, Brussels Fuchs, G., Wassermann, S., Weimer-Jehle, W., Vögele, S. (2011): Entwicklung und Verbrei-
tung neuer Kraftwerkstechnologien im Kontext dynamischer (Nationaler-) Innovati-onssysteme, Forschungszentrum Jülich, STE Preprint 10/2011, Jülich
Handelsblatt (2011): Riesige Vorkommen – Gasboom in den USA, November 19, 2011: http://www.handelsblatt.com/unternehmen/industrie/riesige-vorkommen-gas-boom-in-den-usa/5858166.html.
Hong, S., Cosbey, A., Savage M. (2009): China’s Electrical Power Sector, Environmental Protection and Sustainable Trade, Report of the International Institute for Sustainable Development (iisd), http://www.iisd.org/pdf/2010/china_power_sector_sd.pdf.
Huang Q.L (2008): Clean and highly effective coal-fired power generation technology in China. Huadian Technology, 30 (3) (2008), pp. 1-8.
Hünteler J., Schmidt T.S., Kanie N. (2012): Japan's post-Fukushima Challenge - Implications

43
from the German Experience on Renewable Energy Policy. Energy Policy 45, pp. 6-11.
IEA International Energy Agency (2007): Coal Power Database, Paris. IEA (International Energy Agency) (2010a): Power Generation from coal - Measuring and
Reporting Efficiency Performance and CO2 Emissions, Paris. IEA (International Energy Agency) (2010b): Emissions per kWh of electricity and heat
output, IEA CO2 Emissions from Fuel Combustion Statistics (database), Paris. IEA (International Energy Agency) (2011 a): Coal Power Database, Paris. IEA (International Energy Agency) (2011b): Coal Information 2011, Paris. IEA (International Energy Agency) (2011c), End-use prices: Energy prices in US dollars, IEA
Energy Prices and Taxes Statistics (database), Paris. IEA (International Energy Agency) (2011d): Projected Costs of Generating Electricity, Paris. IEA (International Energy Agency) (2012): R&D database, Paris, http://www.iea.org/stats/rd.asp ISI (2012): Sonderauswertung von Patentstatistiken für Kohletechnologien, Karlsruhe. OECD (2012): Science and Technology: Key Tables from OECD, Paris, doi: 10.1787/rdxp-
table-2011-1-en. Löschel, A. (2009), Die Zukunft der Kohle in der Stromerzeugung in Deutschland, Eine um-
weltökonomische Betrachtung der öffentlichen Diskussion, Energiepolitik (1) 2009, Herausgegeben vom Arbeitskreis Energiepolitik, Berlin.
Martin, S. (2006): Advanced Industrial Economics, Second Edition, Blackwell, Oxford. Meltzer, J. (2011): After Fukushima: What’s Next for Japan’s Energy and Climate Change
Policy?, Global Economy and Development at Brookings, Washington. Rennings, K., Markewitz, P., Vögele, S. (2010): How clean is clean? Incremental versus
radical technological change in coal-fired power plants. Journal of Evolutionary Economics (Online Version).
Rennings K., Smidt, W. (2010): A Lead Market Approach Towards the Emergence and Diffusion of Coal-fired Power Plant Technology, Politica Economia XXVII, n. 2, pp. 301 - 327.
Rennings, K., Cleff, T. (2011): First and second mover strategy options for pioneering countries on environmental markets - From national lead market to combined lead market and lead supplier strategies.Working Paper No. 5 within the project "Lead Markets" funded under the BMBF Programme WIN 2, Mannheim.
Schumpeter, J. A. (1943): Capitalism, Socialism and Democracy, London. Tiwari, R., C. Herstatt (2011): Role of ‘Lead Market’ Factors in Globalization of Innovation:
Emerging Evidence from India & its Implications. Proceedings of IEEE International Technology Management Conference (IEEE-ITMC), June 27-30, 2011, San José.
RWE Power AG (2011): Braunkohle – ein heimischer Energieträger, Essen, p.39 ff. UN (United Nations) (2012): United Nations Commodity Trade Statistics Database, New
York, http://comtrade.un.org/ Vernon, R. (1979): The Product Cycle Hypothesis in a New International Environment. Ox-
ford Bulletin of Economics and Statistics. Vol. 41 (4), pp. 255-267. Walz, R., Marscheider-Weidemann, F. (2011): Technology-specific absorptive capacities for
green technologies in Newly Industrialising Countries. Int. J. Technology and Globali-sation, Vol. 5, Nos. 3/4, pp. 212–229.
WCI 2005 (World Coal Institute) (2005): The Coal Resource. November 15th 2007: http://www.worldcoal.org/pages/content/index.asp? PageID=37.
World Economic Forum (2011): Global Competitiveness Report 2011/2012, Geneva. Word data bank (2011a):

44
http://databank.worldbank.org/ddp/home.do?Step=2&id=4&hActiveDimensionId=WDI_Series
Word data bank (2011b): Electric power consumption (kWh per capita), http://data.worldbank.org/indicator/EG.USE.ELEC.KH.PC