Lead: Children's Health and the Environment
59
1 1 TRAINING FOR HEALTH CARE PROVIDERS TRAINING FOR HEALTH CARE PROVIDERS [Date [Date …Place Place …Event Event…Sponsor Sponsor…Organizer] Organizer] LEAD LEAD Children's Health and the Environment WHO Training Package for the Health Sector World Health Organization www.who.int/ceh July 2008 version <<NOTE TO USER: Please add details of the date, time, place and sponsorship of the meeting for which you are using this presentation in the space indicated.>> <<NOTE TO USER: This is a large set of slides from which the presenter should select the most relevant ones to use in a specific presentation. These slides cover many facets of the problem. Present only those slides that apply most directly to the local situation in the region.>> This presentation will deal with the epidemiology, sources, routes of exposure, clinical manifestations, laboratory aspects and basic approach for prevention and management of poisoning due to lead exposure in children, an important problem affecting children’s health and development worldwide.
Transcript of Lead: Children's Health and the Environment
1
1
TRAINING FOR HEALTH CARE PROVIDERSTRAINING FOR HEALTH CARE PROVIDERS[Date [Date ……Place Place ……EventEvent……SponsorSponsor……Organizer]Organizer]
LEADLEAD
Children's Health and the EnvironmentWHO Training Package for the Health Sector
World Health Organization
www.who.int/cehJuly 2008 version
<<NOTE TO USER: Please add details of the date, time, place and sponsorship of the meeting for which you are using this presentation in the space indicated.>>
<<NOTE TO USER: This is a large set of slides from which the presenter should select the most relevant ones to use in a specific presentation. These slides cover many facets of the problem. Present only those slides that apply most directly to the local situation in the region.>>
This presentation will deal with the epidemiology, sources, routes of exposure, clinical manifestations, laboratory aspects and basic approach for prevention and management of poisoning due to lead exposure in children, an important problem affecting children’s health and development worldwide.
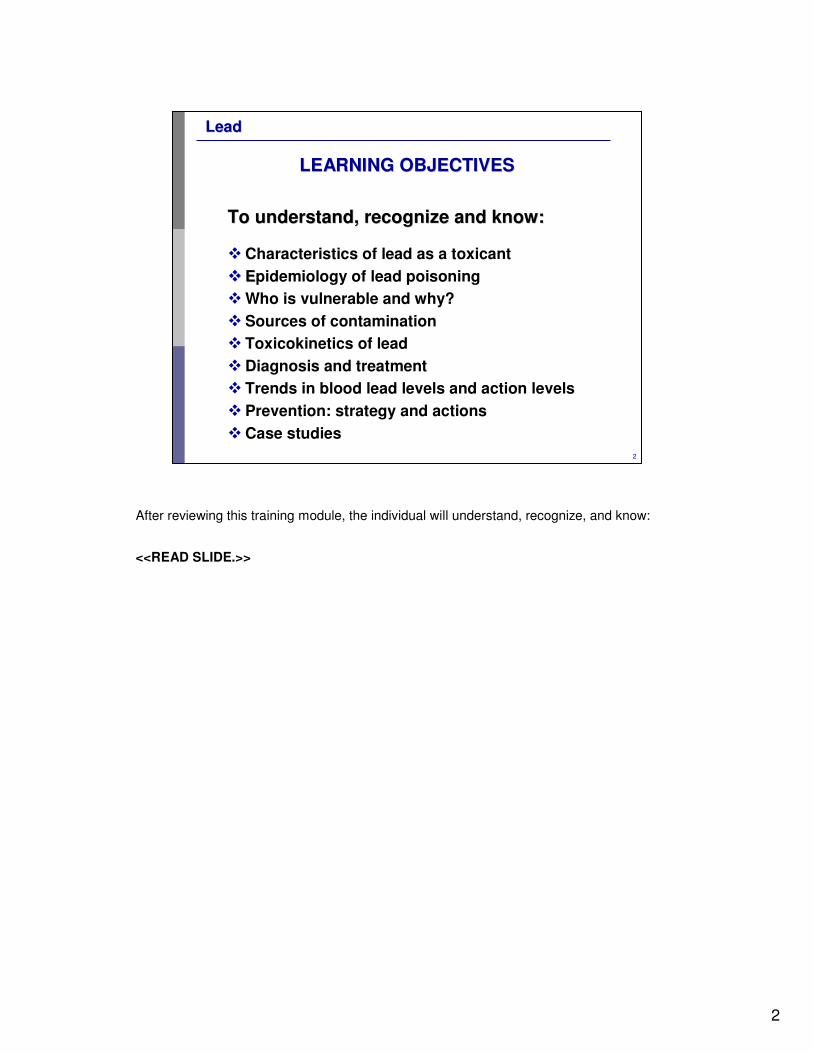
2
2
LeadLead
LEARNING OBJECTIVESLEARNING OBJECTIVES
To understand, recognize and know:To understand, recognize and know:
�Characteristics of lead as a toxicant
�� EEpidemiology of lead poisoning
�Who is vulnerable and why?
�Sources of contamination
� Toxicokinetics of lead
�Diagnosis and treatment
� Trends in blood lead levels and action levels
�Prevention: strategy and actions
�Case studies
After reviewing this training module, the individual will understand, recognize, and know:
<<READ SLIDE.>>
3
3
LeadLead
LEAD PRODUCTION IN THE 20LEAD PRODUCTION IN THE 20THTH CENTURYCENTURY
0
10
20
30
40
50
60
70
80
90
100
1990198019701960195019401930192019101900
0
5
10
15
20
25
30
35
40Emissions
Production
Pro
du
cti
on
(m
illio
ns
me
tric
to
nn
es
)
Em
iss
ion
s (
tho
us
an
ds
me
tric
to
nn
es
)
Adapted from Nriagu, (1996) 272:223
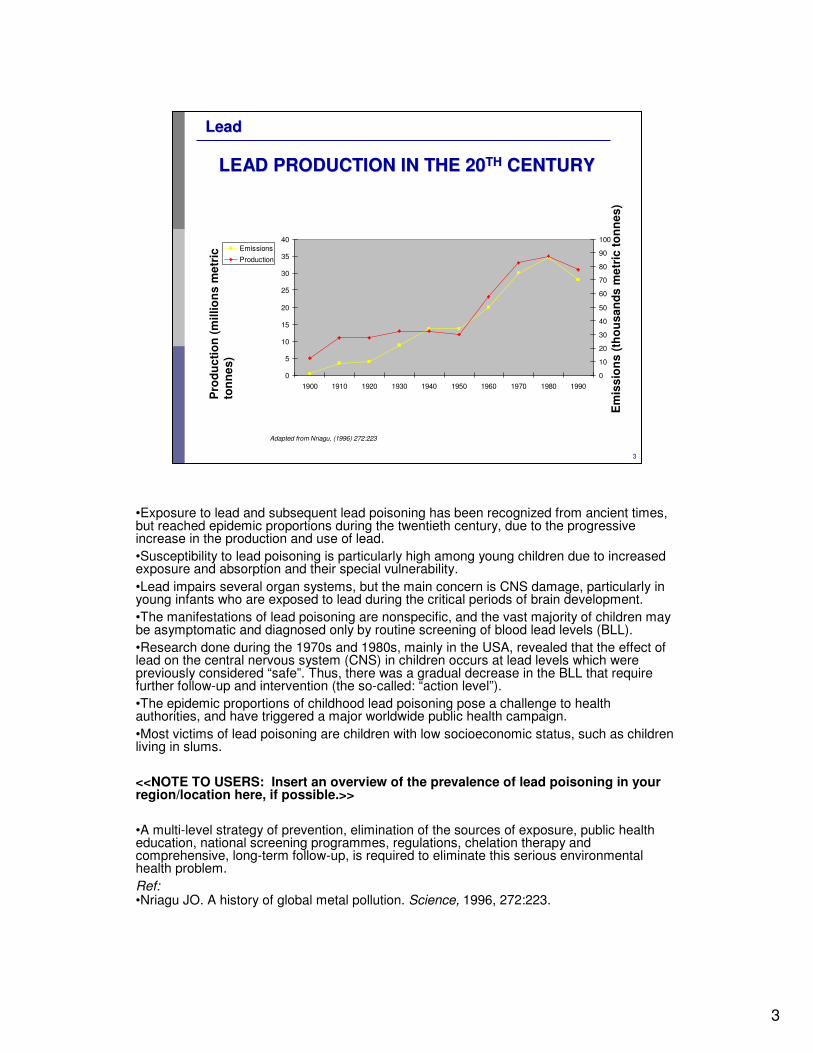
•Exposure to lead and subsequent lead poisoning has been recognized from ancient times, but reached epidemic proportions during the twentieth century, due to the progressive increase in the production and use of lead.•Susceptibility to lead poisoning is particularly high among young children due to increased exposure and absorption and their special vulnerability. •Lead impairs several organ systems, but the main concern is CNS damage, particularly in young infants who are exposed to lead during the critical periods of brain development.•The manifestations of lead poisoning are nonspecific, and the vast majority of children may be asymptomatic and diagnosed only by routine screening of blood lead levels (BLL).•Research done during the 1970s and 1980s, mainly in the USA, revealed that the effect of lead on the central nervous system (CNS) in children occurs at lead levels which were previously considered “safe”. Thus, there was a gradual decrease in the BLL that require further follow-up and intervention (the so-called: “action level”). •The epidemic proportions of childhood lead poisoning pose a challenge to health authorities, and have triggered a major worldwide public health campaign.•Most victims of lead poisoning are children with low socioeconomic status, such as children living in slums.
<<NOTE TO USERS: Insert an overview of the prevalence of lead poisoning in your region/location here, if possible.>>
•A multi-level strategy of prevention, elimination of the sources of exposure, public health education, national screening programmes, regulations, chelation therapy and comprehensive, long-term follow-up, is required to eliminate this serious environmental health problem.Ref:•Nriagu JO. A history of global metal pollution. Science, 1996, 272:223.
4
4
LeadLead
EVIDENCE OF INCREASED ACCUMULATION EVIDENCE OF INCREASED ACCUMULATION
OF LEAD OVER THE YEARSOF LEAD OVER THE YEARS
Deposition of lead in Greenland ice (µµµµg/kg)
Sharp increase since 1940 attributed mainly to combustion of lead alkyl additives in petrol
0
0.05
0.1
0.15
0.2
0.25
0.3
1600
1650
1700
1750
1800
1850
1900
1950
.
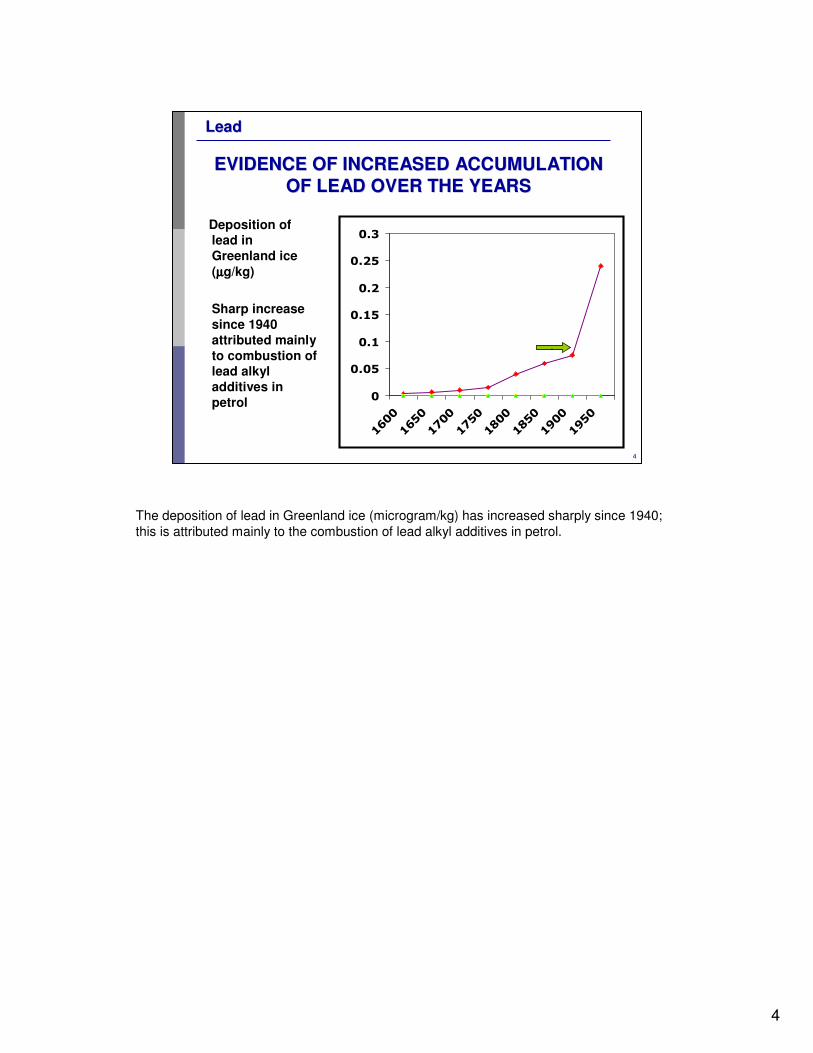
The deposition of lead in Greenland ice (microgram/kg) has increased sharply since 1940; this is attributed mainly to the combustion of lead alkyl additives in petrol.
5
5
LeadLead
WHO ESTIMATESWHO ESTIMATES
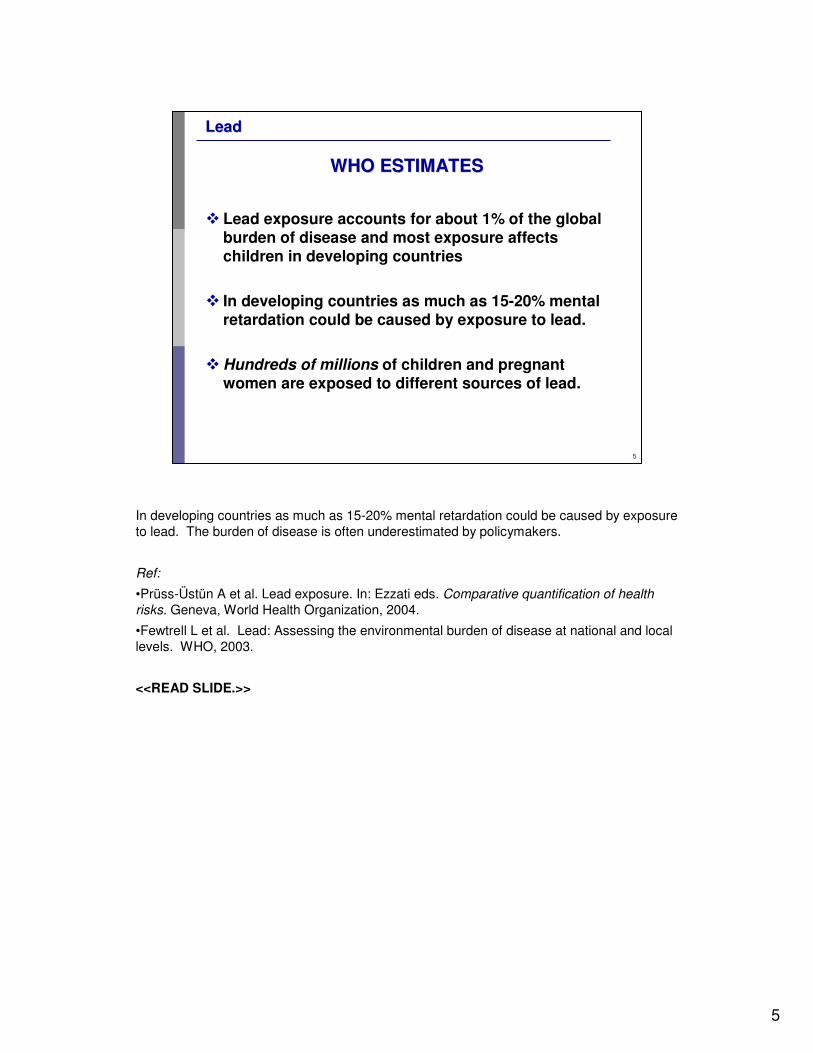
� Lead exposure accounts for about 1% of the global burden of disease and most exposure affects children in developing countries
� In developing countries as much as 15-20% mental retardation could be caused by exposure to lead.
�Hundreds of millions of children and pregnant women are exposed to different sources of lead.
In developing countries as much as 15-20% mental retardation could be caused by exposure to lead. The burden of disease is often underestimated by policymakers.
Ref:
•Prüss-Üstün A et al. Lead exposure. In: Ezzati eds. Comparative quantification of health risks. Geneva, World Health Organization, 2004.
•Fewtrell L et al. Lead: Assessing the environmental burden of disease at national and local levels. WHO, 2003.
<<READ SLIDE.>>
6
6
LeadLead
MORBIDITY, MORTALITY AND ESTIMATED COSTS MORBIDITY, MORTALITY AND ESTIMATED COSTS
OF LEAD POISONING AMONG US CHILDRENOF LEAD POISONING AMONG US CHILDREN
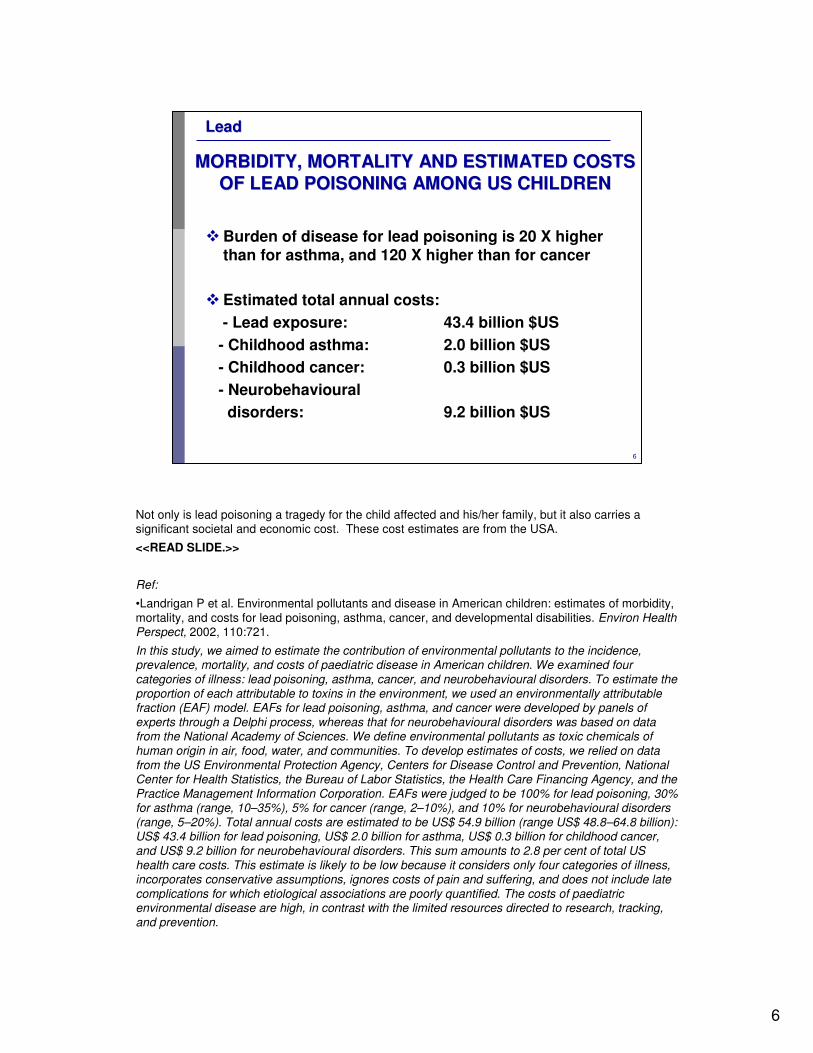
�Burden of disease for lead poisoning is 20 X higher than for asthma, and 120 X higher than for cancer
�Estimated total annual costs:
- Lead exposure: 43.4 billion $US
- Childhood asthma: 2.0 billion $US
- Childhood cancer: 0.3 billion $US
- Neurobehavioural
disorders: 9.2 billion $US
Not only is lead poisoning a tragedy for the child affected and his/her family, but it also carries a significant societal and economic cost. These cost estimates are from the USA.
<<READ SLIDE.>>
Ref:
•Landrigan P et al. Environmental pollutants and disease in American children: estimates of morbidity, mortality, and costs for lead poisoning, asthma, cancer, and developmental disabilities. Environ Health Perspect, 2002, 110:721.
In this study, we aimed to estimate the contribution of environmental pollutants to the incidence, prevalence, mortality, and costs of paediatric disease in American children. We examined four categories of illness: lead poisoning, asthma, cancer, and neurobehavioural disorders. To estimate the proportion of each attributable to toxins in the environment, we used an environmentally attributable fraction (EAF) model. EAFs for lead poisoning, asthma, and cancer were developed by panels of experts through a Delphi process, whereas that for neurobehavioural disorders was based on data from the National Academy of Sciences. We define environmental pollutants as toxic chemicals of human origin in air, food, water, and communities. To develop estimates of costs, we relied on data from the US Environmental Protection Agency, Centers for Disease Control and Prevention, National Center for Health Statistics, the Bureau of Labor Statistics, the Health Care Financing Agency, and the Practice Management Information Corporation. EAFs were judged to be 100% for lead poisoning, 30% for asthma (range, 10–35%), 5% for cancer (range, 2–10%), and 10% for neurobehavioural disorders (range, 5–20%). Total annual costs are estimated to be US$ 54.9 billion (range US$ 48.8–64.8 billion): US$ 43.4 billion for lead poisoning, US$ 2.0 billion for asthma, US$ 0.3 billion for childhood cancer, and US$ 9.2 billion for neurobehavioural disorders. This sum amounts to 2.8 per cent of total US health care costs. This estimate is likely to be low because it considers only four categories of illness, incorporates conservative assumptions, ignores costs of pain and suffering, and does not include late complications for which etiological associations are poorly quantified. The costs of paediatric environmental disease are high, in contrast with the limited resources directed to research, tracking, and prevention.
7
7
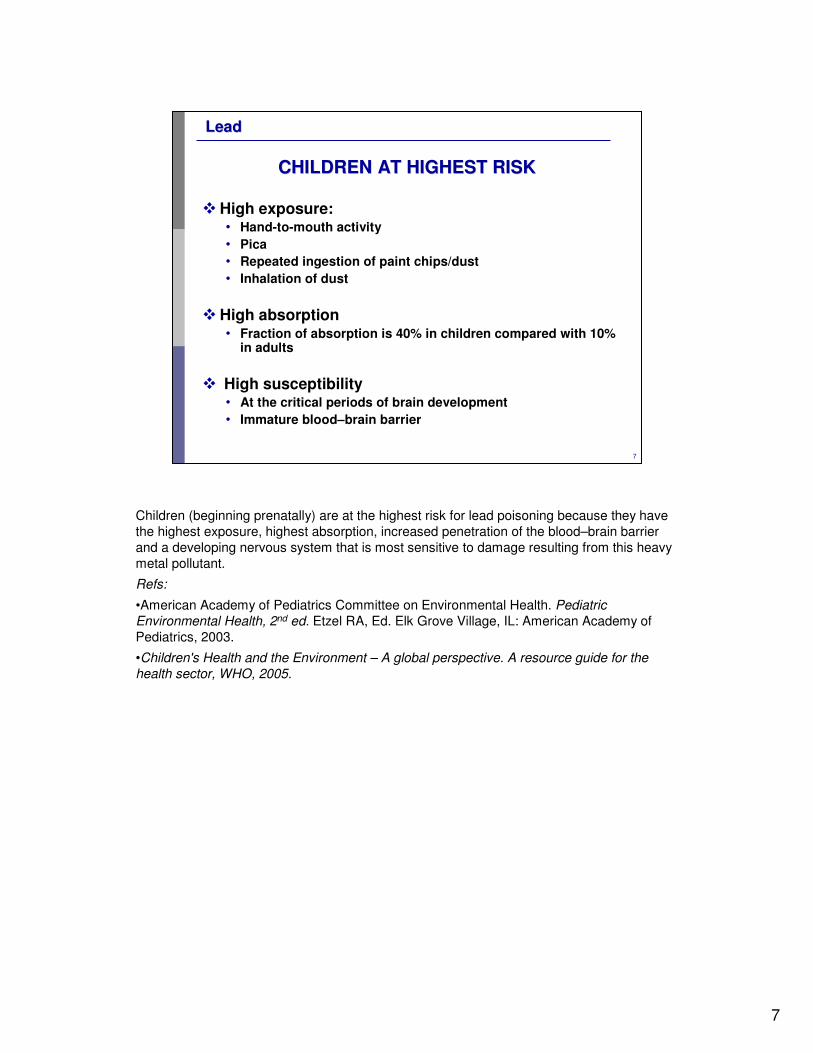
LeadLead
CHILDREN AT HIGHEST RISK CHILDREN AT HIGHEST RISK
�High exposure:• Hand-to-mouth activity
• Pica
• Repeated ingestion of paint chips/dust
• Inhalation of dust
�High absorption• Fraction of absorption is 40% in children compared with 10%
in adults
� High susceptibility• At the critical periods of brain development
• Immature blood–brain barrier
Children (beginning prenatally) are at the highest risk for lead poisoning because they have the highest exposure, highest absorption, increased penetration of the blood–brain barrier and a developing nervous system that is most sensitive to damage resulting from this heavy metal pollutant.
Refs:
•American Academy of Pediatrics Committee on Environmental Health. Pediatric Environmental Health, 2nd ed. Etzel RA, Ed. Elk Grove Village, IL: American Academy of Pediatrics, 2003.
•Children's Health and the Environment – A global perspective. A resource guide for the health sector, WHO, 2005.
8
8
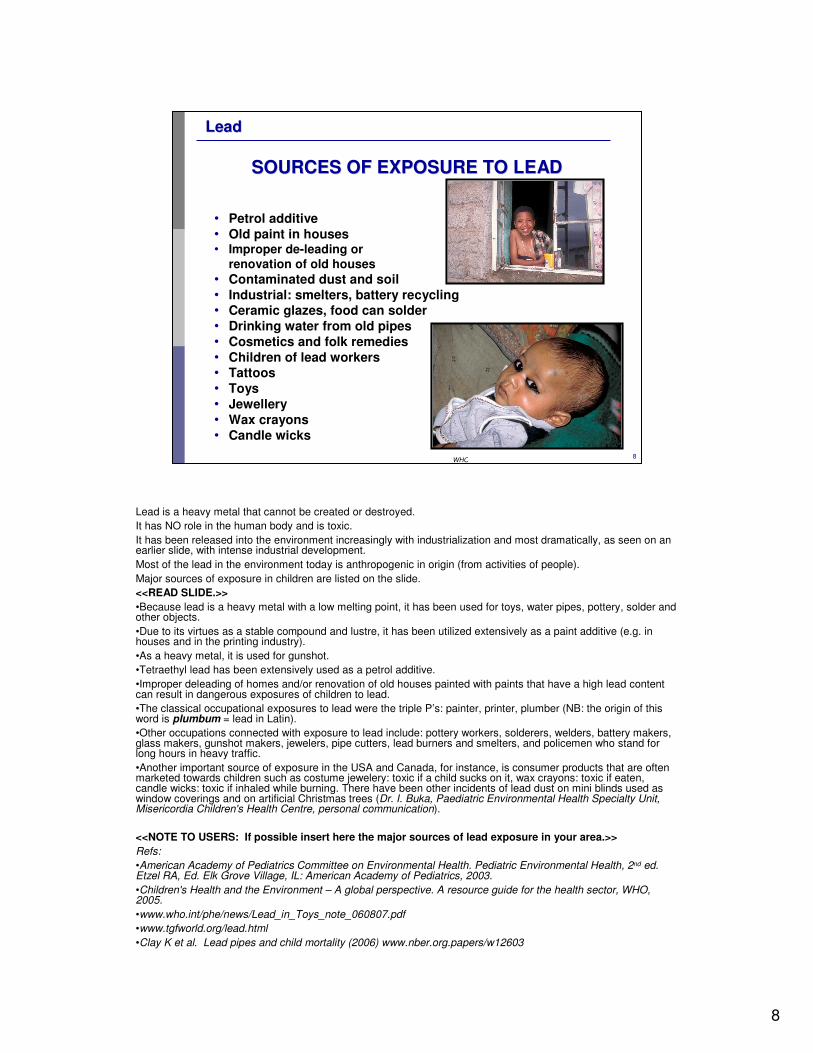
LeadLead
SOURCES OF EXPOSURE TO LEADSOURCES OF EXPOSURE TO LEAD
• Petrol additive • Old paint in houses• Improper de-leading or
renovation of old houses
• Contaminated dust and soil• Industrial: smelters, battery recycling• Ceramic glazes, food can solder• Drinking water from old pipes• Cosmetics and folk remedies• Children of lead workers• Tattoos • Toys• Jewellery • Wax crayons • Candle wicks
WHO
Lead is a heavy metal that cannot be created or destroyed. It has NO role in the human body and is toxic. It has been released into the environment increasingly with industrialization and most dramatically, as seen on an earlier slide, with intense industrial development. Most of the lead in the environment today is anthropogenic in origin (from activities of people). Major sources of exposure in children are listed on the slide. <<READ SLIDE.>>
•Because lead is a heavy metal with a low melting point, it has been used for toys, water pipes, pottery, solder and other objects. •Due to its virtues as a stable compound and lustre, it has been utilized extensively as a paint additive (e.g. in houses and in the printing industry).•As a heavy metal, it is used for gunshot. •Tetraethyl lead has been extensively used as a petrol additive.•Improper deleading of homes and/or renovation of old houses painted with paints that have a high lead content can result in dangerous exposures of children to lead.•The classical occupational exposures to lead were the triple P’s: painter, printer, plumber (NB: the origin of this word is plumbum = lead in Latin). •Other occupations connected with exposure to lead include: pottery workers, solderers, welders, battery makers, glass makers, gunshot makers, jewelers, pipe cutters, lead burners and smelters, and policemen who stand for long hours in heavy traffic.•Another important source of exposure in the USA and Canada, for instance, is consumer products that are often marketed towards children such as costume jewelery: toxic if a child sucks on it, wax crayons: toxic if eaten, candle wicks: toxic if inhaled while burning. There have been other incidents of lead dust on mini blinds used as window coverings and on artificial Christmas trees (Dr. I. Buka, Paediatric Environmental Health Specialty Unit, Misericordia Children's Health Centre, personal communication).
<<NOTE TO USERS: If possible insert here the major sources of lead exposure in your area.>>
Refs:
•American Academy of Pediatrics Committee on Environmental Health. Pediatric Environmental Health, 2nd ed. Etzel RA, Ed. Elk Grove Village, IL: American Academy of Pediatrics, 2003.
•Children's Health and the Environment – A global perspective. A resource guide for the health sector, WHO, 2005.
•www.who.int/phe/news/Lead_in_Toys_note_060807.pdf
•www.tgfworld.org/lead.html
•Clay K et al. Lead pipes and child mortality (2006) www.nber.org.papers/w12603
9
9
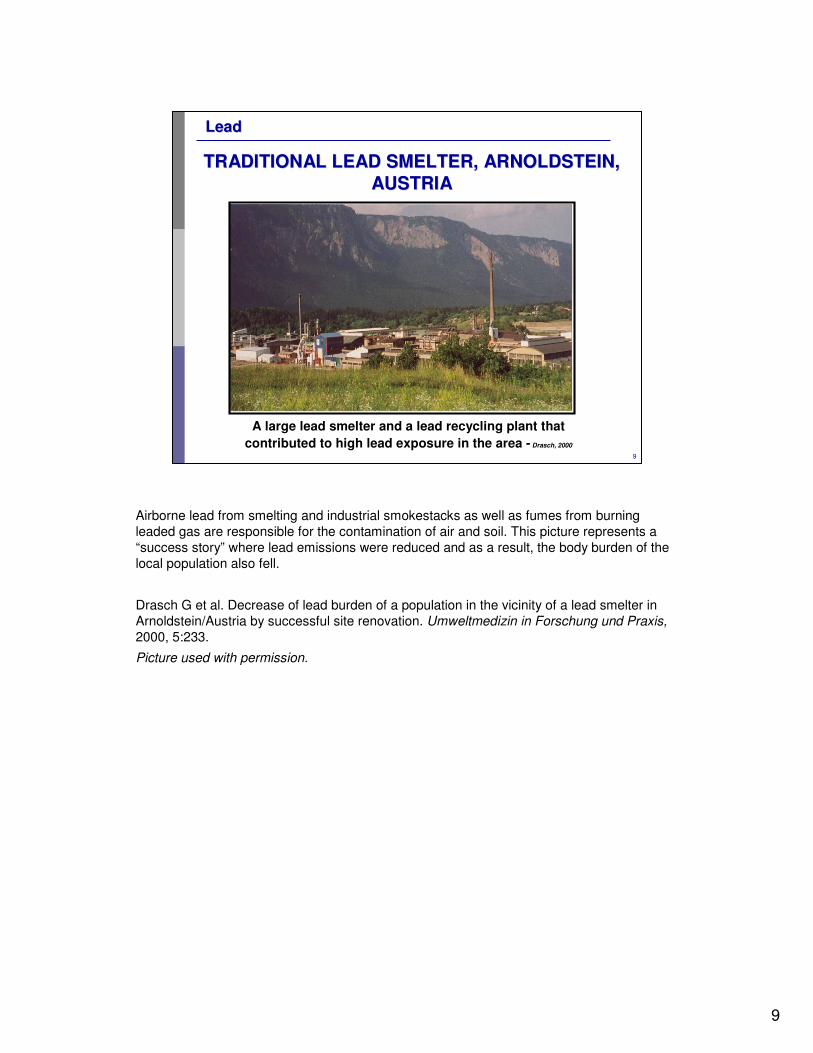
LeadLead
TRADITIONAL LEAD SMELTER, ARNOLDSTEIN, TRADITIONAL LEAD SMELTER, ARNOLDSTEIN,
AUSTRIAAUSTRIA
A large lead smelter and a lead recycling plant that
contributed to high lead exposure in the area - Drasch, 2000
Airborne lead from smelting and industrial smokestacks as well as fumes from burning leaded gas are responsible for the contamination of air and soil. This picture represents a “success story” where lead emissions were reduced and as a result, the body burden of the local population also fell.
Drasch G et al. Decrease of lead burden of a population in the vicinity of a lead smelter in Arnoldstein/Austria by successful site renovation. Umweltmedizin in Forschung und Praxis, 2000, 5:233.
Picture used with permission.
10
10
LeadLead
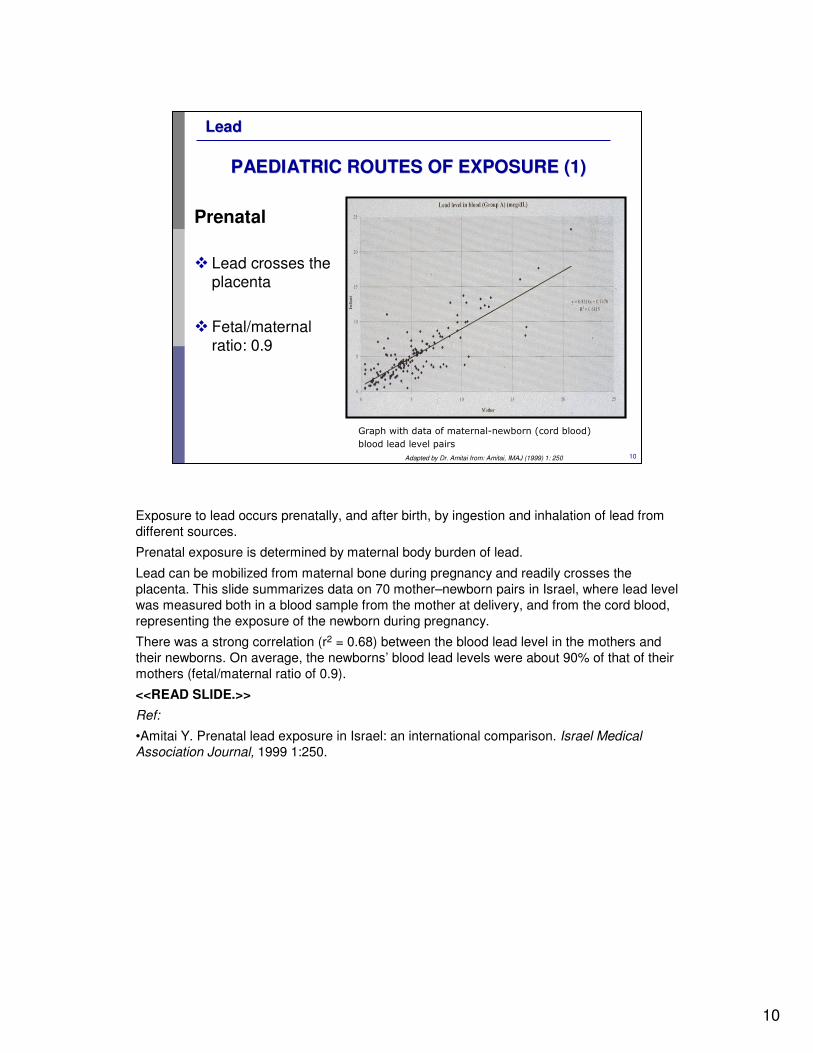
PAEDIATRIC ROUTES OF EXPOSURE (1)PAEDIATRIC ROUTES OF EXPOSURE (1)
Prenatal
� Lead crosses the placenta
� Fetal/maternal ratio: 0.9
Graph with data of maternal-newborn (cord blood)
blood lead level pairs
Adapted by Dr. Amitai from: Amitai, IMAJ (1999) 1: 250
Exposure to lead occurs prenatally, and after birth, by ingestion and inhalation of lead from different sources.
Prenatal exposure is determined by maternal body burden of lead.
Lead can be mobilized from maternal bone during pregnancy and readily crosses the placenta. This slide summarizes data on 70 mother–newborn pairs in Israel, where lead level was measured both in a blood sample from the mother at delivery, and from the cord blood, representing the exposure of the newborn during pregnancy.
There was a strong correlation (r2 = 0.68) between the blood lead level in the mothers and their newborns. On average, the newborns’ blood lead levels were about 90% of that of their mothers (fetal/maternal ratio of 0.9).
<<READ SLIDE.>>
Ref:
•Amitai Y. Prenatal lead exposure in Israel: an international comparison. Israel Medical Association Journal, 1999 1:250.
11
11
LeadLead
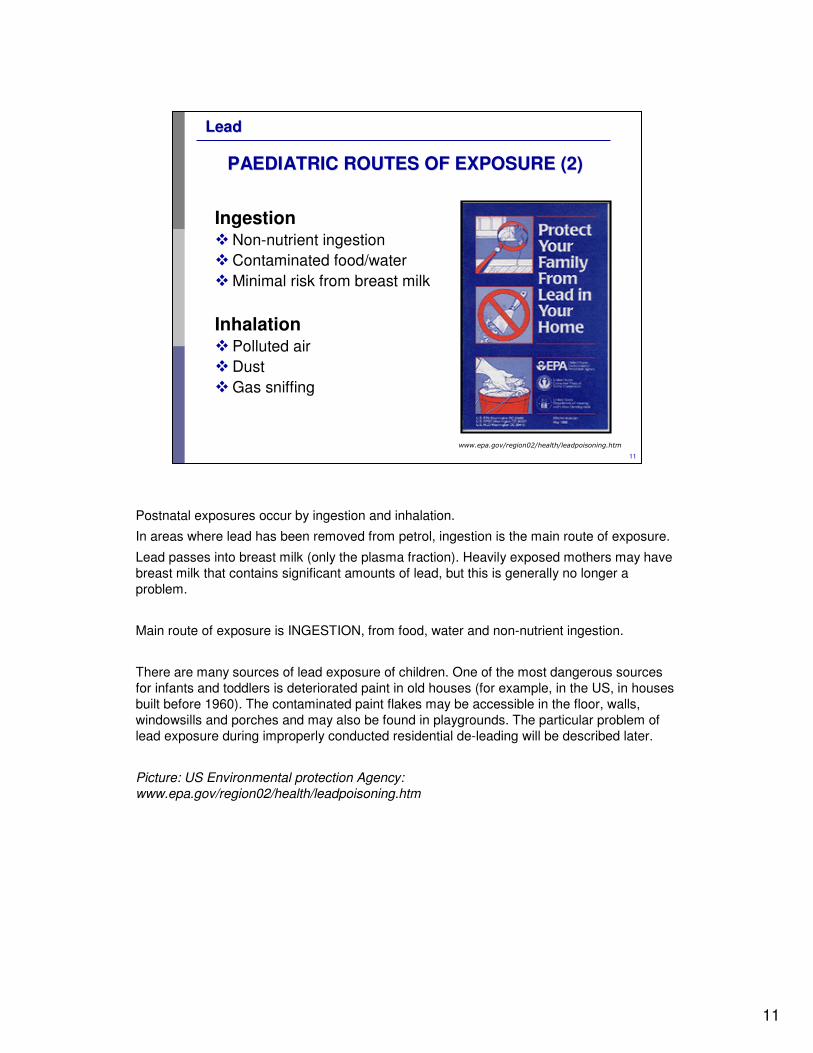
PAEDIATRIC ROUTES OF EXPOSURE (2)PAEDIATRIC ROUTES OF EXPOSURE (2)
Ingestion�Non-nutrient ingestion�Contaminated food/water�Minimal risk from breast milk
Inhalation�Polluted air�Dust�Gas sniffing
www.epa.gov/region02/health/leadpoisoning.htm
Postnatal exposures occur by ingestion and inhalation.
In areas where lead has been removed from petrol, ingestion is the main route of exposure.
Lead passes into breast milk (only the plasma fraction). Heavily exposed mothers may have breast milk that contains significant amounts of lead, but this is generally no longer a problem.
Main route of exposure is INGESTION, from food, water and non-nutrient ingestion.
There are many sources of lead exposure of children. One of the most dangerous sources for infants and toddlers is deteriorated paint in old houses (for example, in the US, in houses built before 1960). The contaminated paint flakes may be accessible in the floor, walls, windowsills and porches and may also be found in playgrounds. The particular problem of lead exposure during improperly conducted residential de-leading will be described later.
Picture: US Environmental protection Agency: www.epa.gov/region02/health/leadpoisoning.htm
12
12
LeadLead
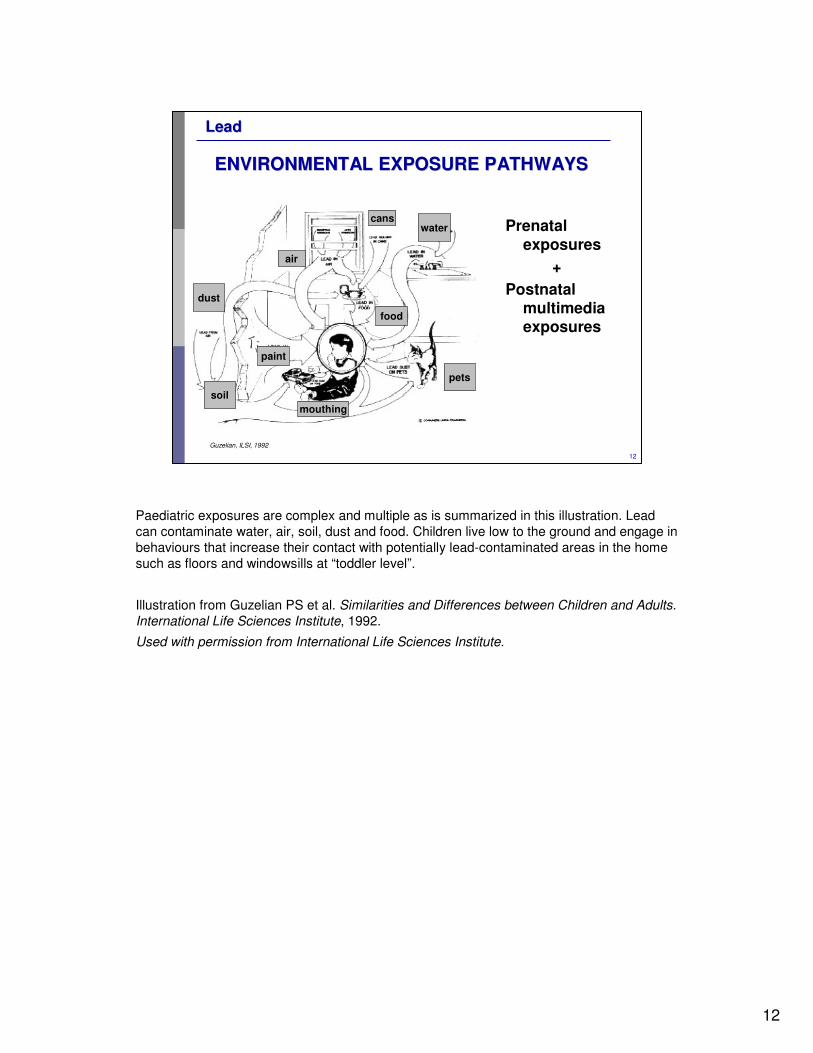
ENVIRONMENTAL EXPOSURE PATHWAYSENVIRONMENTAL EXPOSURE PATHWAYS
Prenatal exposures
+
Postnatal multimedia exposures
paint
soil
dust
air
cans
pets
water
food
mouthing
Guzelian, ILSI, 1992
Paediatric exposures are complex and multiple as is summarized in this illustration. Lead can contaminate water, air, soil, dust and food. Children live low to the ground and engage in behaviours that increase their contact with potentially lead-contaminated areas in the home such as floors and windowsills at “toddler level”.
Illustration from Guzelian PS et al. Similarities and Differences between Children and Adults. International Life Sciences Institute, 1992.
Used with permission from International Life Sciences Institute.
13
13
LeadLead
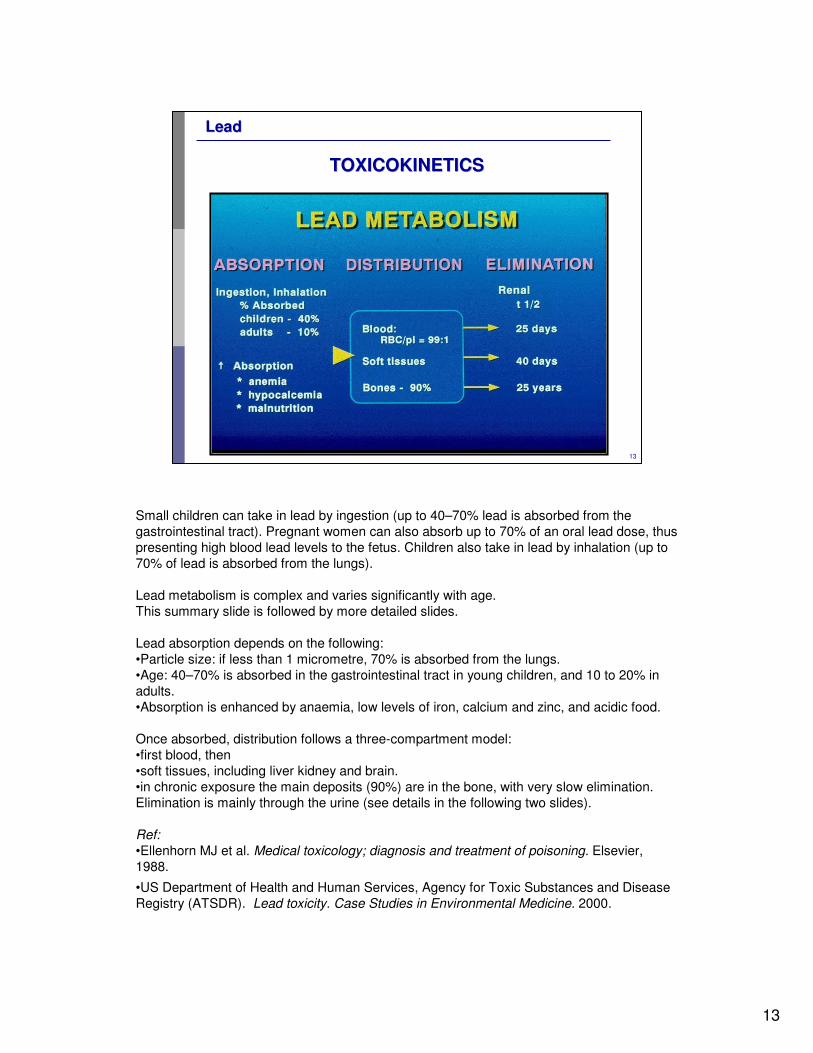
TOXICOKINETICSTOXICOKINETICS
Small children can take in lead by ingestion (up to 40–70% lead is absorbed from the gastrointestinal tract). Pregnant women can also absorb up to 70% of an oral lead dose, thus presenting high blood lead levels to the fetus. Children also take in lead by inhalation (up to 70% of lead is absorbed from the lungs).
Lead metabolism is complex and varies significantly with age. This summary slide is followed by more detailed slides.
Lead absorption depends on the following:•Particle size: if less than 1 micrometre, 70% is absorbed from the lungs.•Age: 40–70% is absorbed in the gastrointestinal tract in young children, and 10 to 20% in adults.•Absorption is enhanced by anaemia, low levels of iron, calcium and zinc, and acidic food.
Once absorbed, distribution follows a three-compartment model: •first blood, then•soft tissues, including liver kidney and brain.•in chronic exposure the main deposits (90%) are in the bone, with very slow elimination.Elimination is mainly through the urine (see details in the following two slides).
Ref: •Ellenhorn MJ et al. Medical toxicology; diagnosis and treatment of poisoning. Elsevier, 1988.
•US Department of Health and Human Services, Agency for Toxic Substances and Disease Registry (ATSDR). Lead toxicity. Case Studies in Environmental Medicine. 2000.
14
14
LeadLead
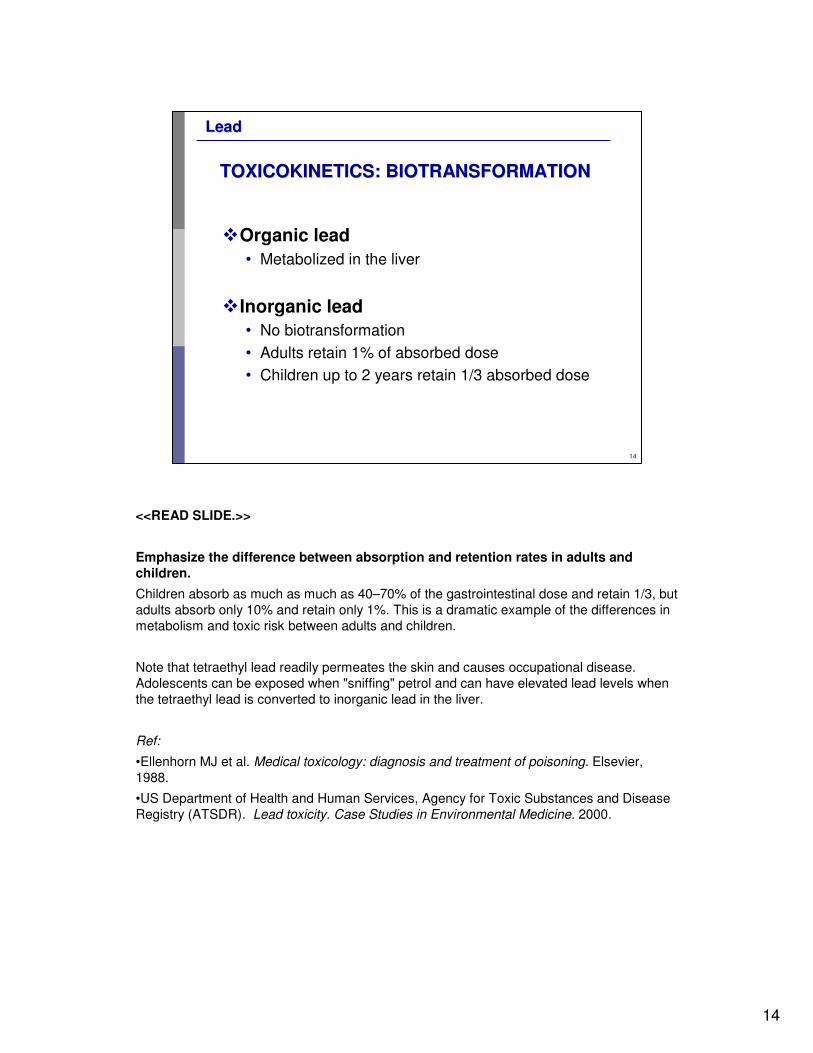
TOXICOKINETICS: BIOTRANSFORMATIONTOXICOKINETICS: BIOTRANSFORMATION
�Organic lead
• Metabolized in the liver
�Inorganic lead
• No biotransformation
• Adults retain 1% of absorbed dose
• Children up to 2 years retain 1/3 absorbed dose
<<READ SLIDE.>>
Emphasize the difference between absorption and retention rates in adults and children.
Children absorb as much as much as 40–70% of the gastrointestinal dose and retain 1/3, but adults absorb only 10% and retain only 1%. This is a dramatic example of the differences in metabolism and toxic risk between adults and children.
Note that tetraethyl lead readily permeates the skin and causes occupational disease. Adolescents can be exposed when "sniffing" petrol and can have elevated lead levels when the tetraethyl lead is converted to inorganic lead in the liver.
Ref:
•Ellenhorn MJ et al. Medical toxicology: diagnosis and treatment of poisoning. Elsevier, 1988.
•US Department of Health and Human Services, Agency for Toxic Substances and Disease Registry (ATSDR). Lead toxicity. Case Studies in Environmental Medicine. 2000.
15
15
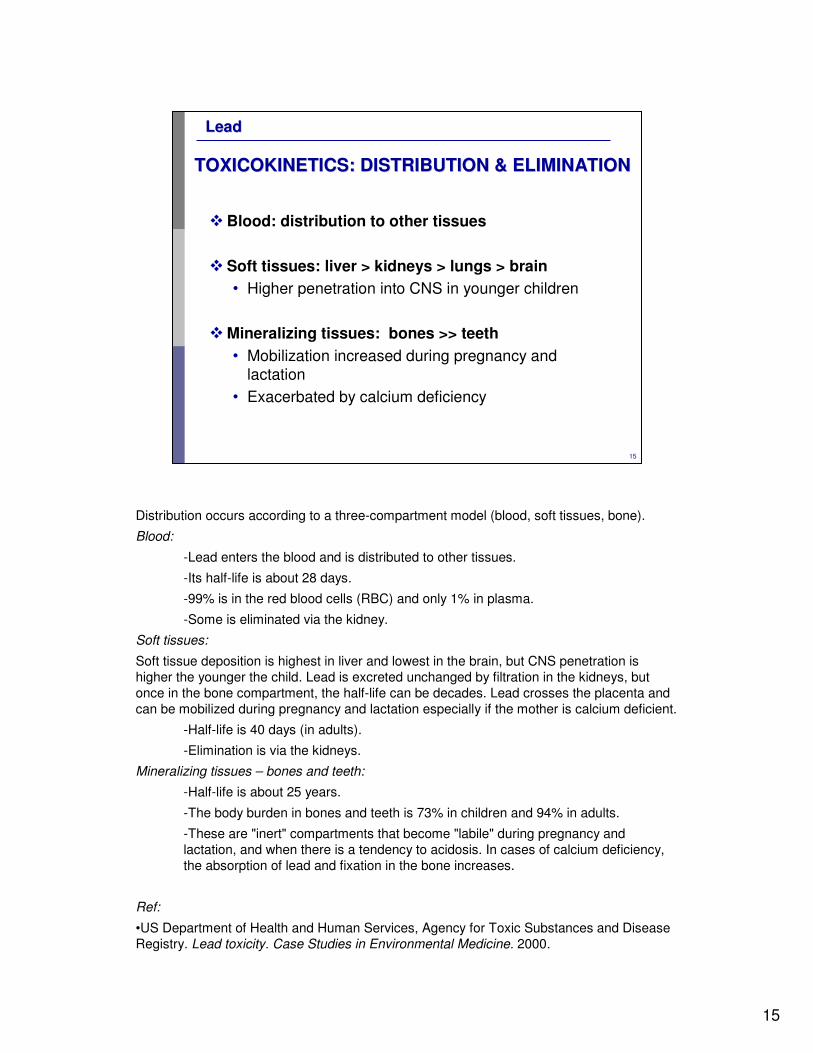
LeadLead
TOXICOKINETICS: DISTRIBUTION & ELIMINATIONTOXICOKINETICS: DISTRIBUTION & ELIMINATION
�Blood: distribution to other tissues
�Soft tissues: liver > kidneys > lungs > brain
• Higher penetration into CNS in younger children
�Mineralizing tissues: bones >> teeth
• Mobilization increased during pregnancy and lactation
• Exacerbated by calcium deficiency
Distribution occurs according to a three-compartment model (blood, soft tissues, bone).
Blood:
-Lead enters the blood and is distributed to other tissues.
-Its half-life is about 28 days.
-99% is in the red blood cells (RBC) and only 1% in plasma.
-Some is eliminated via the kidney.
Soft tissues:
Soft tissue deposition is highest in liver and lowest in the brain, but CNS penetration is higher the younger the child. Lead is excreted unchanged by filtration in the kidneys, but once in the bone compartment, the half-life can be decades. Lead crosses the placenta and can be mobilized during pregnancy and lactation especially if the mother is calcium deficient.
-Half-life is 40 days (in adults).
-Elimination is via the kidneys.
Mineralizing tissues – bones and teeth:
-Half-life is about 25 years.
-The body burden in bones and teeth is 73% in children and 94% in adults.
-These are "inert" compartments that become "labile" during pregnancy and lactation, and when there is a tendency to acidosis. In cases of calcium deficiency, the absorption of lead and fixation in the bone increases.
Ref:
•US Department of Health and Human Services, Agency for Toxic Substances and Disease Registry. Lead toxicity. Case Studies in Environmental Medicine. 2000.
16
16
LeadLead
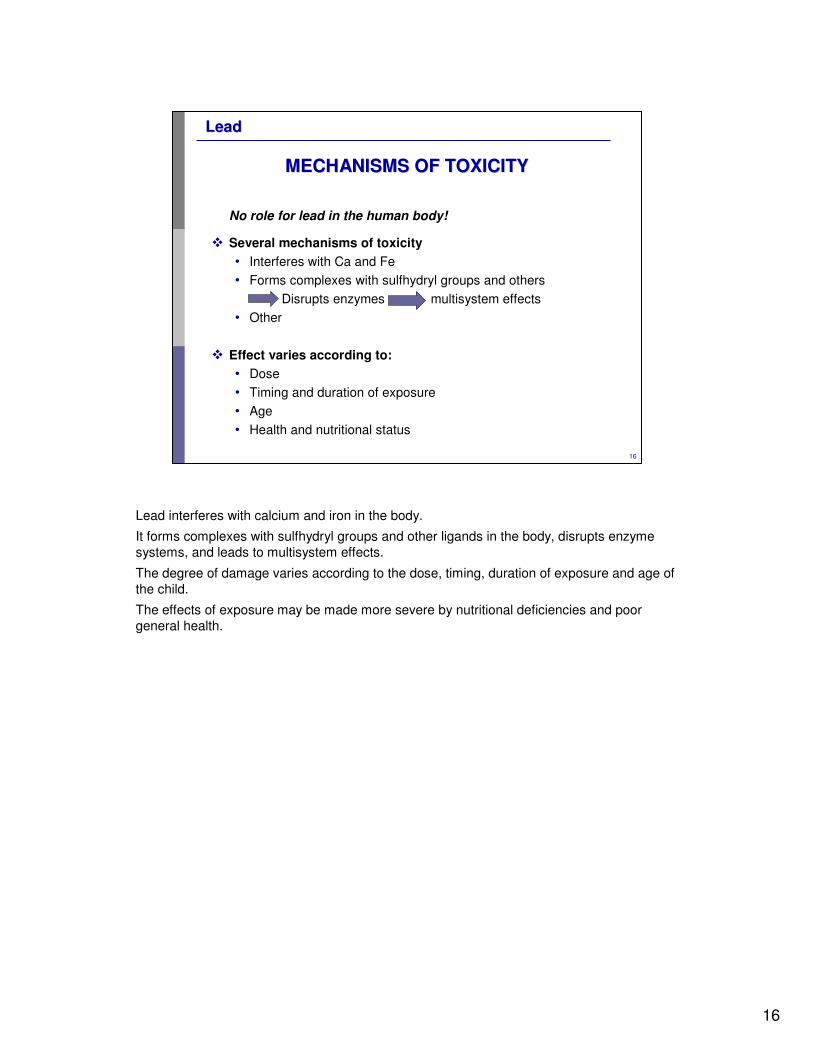
MECHANISMS OF TOXICITYMECHANISMS OF TOXICITY
No role for lead in the human body!
� Several mechanisms of toxicity
• Interferes with Ca and Fe
• Forms complexes with sulfhydryl groups and others
Disrupts enzymes multisystem effects
• Other
� Effect varies according to:
• Dose
• Timing and duration of exposure
• Age
• Health and nutritional status
Lead interferes with calcium and iron in the body.
It forms complexes with sulfhydryl groups and other ligands in the body, disrupts enzyme systems, and leads to multisystem effects.
The degree of damage varies according to the dose, timing, duration of exposure and age of the child.
The effects of exposure may be made more severe by nutritional deficiencies and poor general health.
17
17
LeadLead
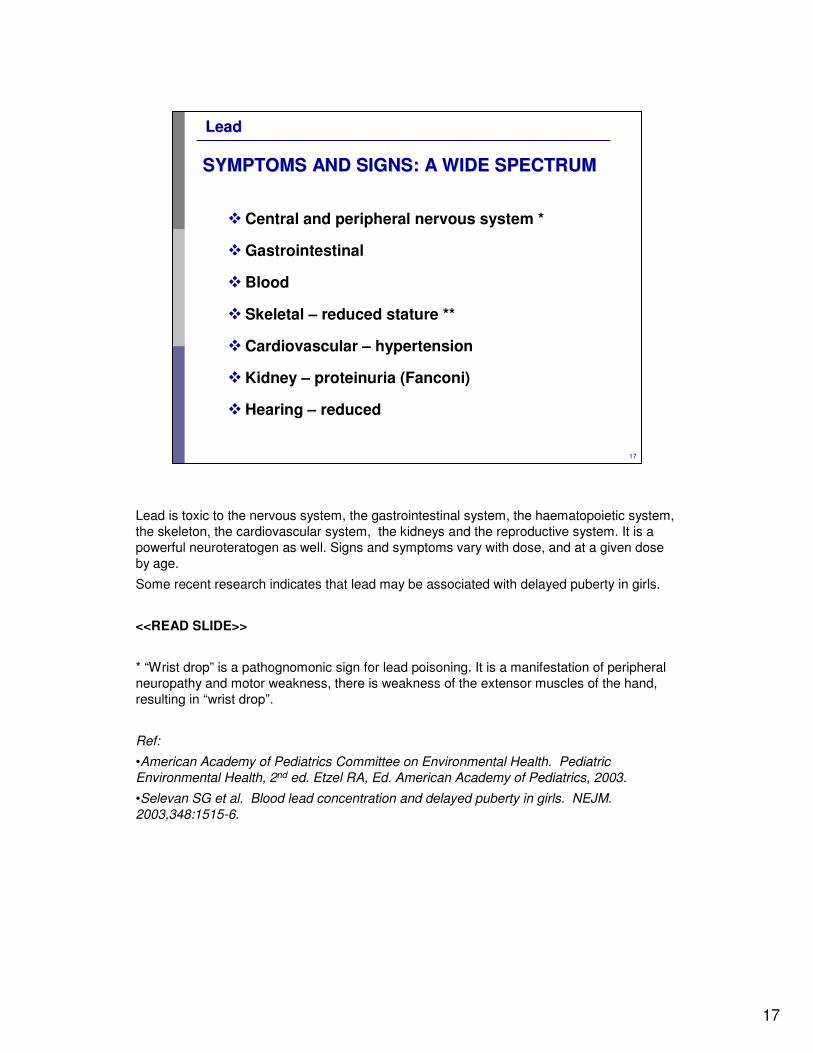
SYMPTOMS AND SIGNS: A WIDE SPECTRUMSYMPTOMS AND SIGNS: A WIDE SPECTRUM
�Central and peripheral nervous system *
�Gastrointestinal
�Blood
�Skeletal – reduced stature **
�Cardiovascular – hypertension
�Kidney – proteinuria (Fanconi)
�Hearing – reduced
Lead is toxic to the nervous system, the gastrointestinal system, the haematopoietic system, the skeleton, the cardiovascular system, the kidneys and the reproductive system. It is a powerful neuroteratogen as well. Signs and symptoms vary with dose, and at a given doseby age.
Some recent research indicates that lead may be associated with delayed puberty in girls.
<<READ SLIDE>>
* “Wrist drop” is a pathognomonic sign for lead poisoning. It is a manifestation of peripheral neuropathy and motor weakness, there is weakness of the extensor muscles of the hand, resulting in “wrist drop”.
Ref:
•American Academy of Pediatrics Committee on Environmental Health. Pediatric Environmental Health, 2nd ed. Etzel RA, Ed. American Academy of Pediatrics, 2003.
•Selevan SG et al. Blood lead concentration and delayed puberty in girls. NEJM. 2003,348:1515-6.

18
18
LeadLead
SYMPTOMS AND SIGNS: A WIDE SPECTRUMSYMPTOMS AND SIGNS: A WIDE SPECTRUM
�CNS: - Hyperactivity, restlessness
- Behavioural disturbances
- Learning disabilities (low score in cognitive tests) ***
- BLL > 70 (rare): headache, lethargy, coma, seizures
�PNS - Neuropathy (in adults!)
�GI : - Anorexia, vomiting, constipation
- Abdominal pain ****
�Blood: - Anaemia, basophilic stippling
<<READ SLIDE>>
**** Abdominal pain occurs with BLL > 45 micrograms/dL: pains are colicky (porphyria like).
CNS: central nervous system
PNS: peripheral nervous system
GI: gastrointestinal
BLL: blood lead level
19
19
LeadLead
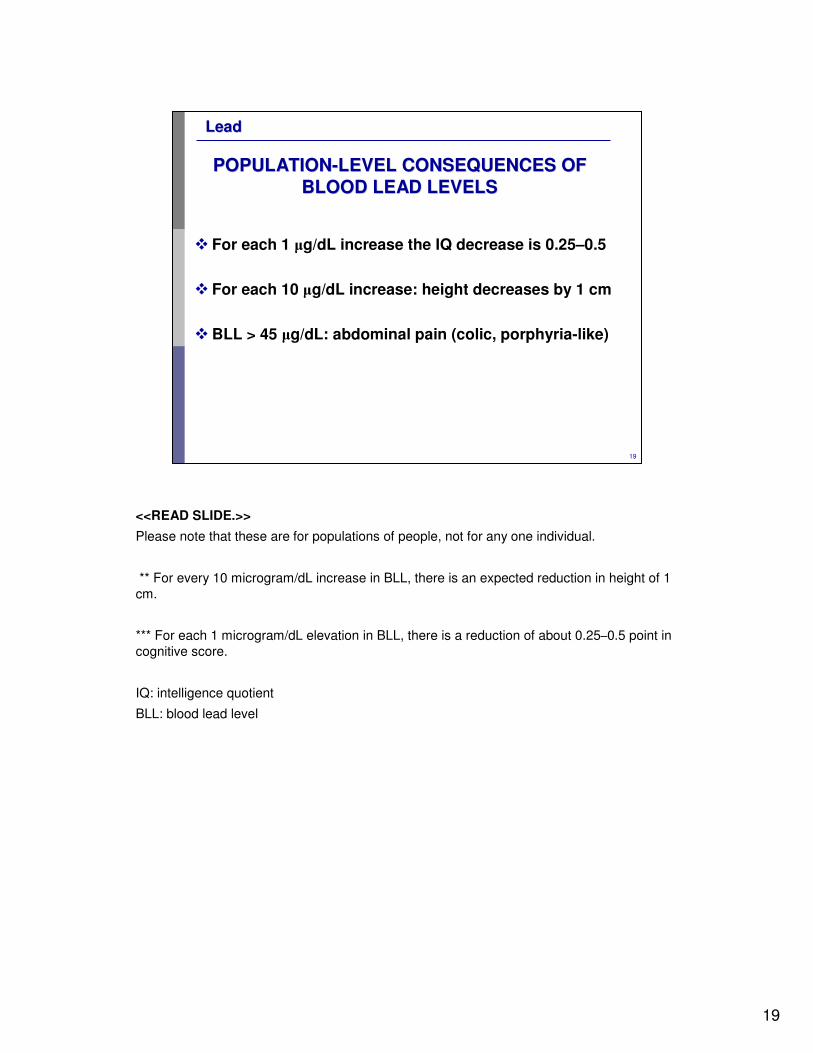
POPULATIONPOPULATION--LEVEL CONSEQUENCES OF LEVEL CONSEQUENCES OF
BLOOD LEAD LEVELSBLOOD LEAD LEVELS
� For each 1 µg/dL increase the IQ decrease is 0.25–0.5
� For each 10 µg/dL increase: height decreases by 1 cm
�BLL > 45 µg/dL: abdominal pain (colic, porphyria-like)
<<READ SLIDE.>>
Please note that these are for populations of people, not for any one individual.
** For every 10 microgram/dL increase in BLL, there is an expected reduction in height of 1 cm.
*** For each 1 microgram/dL elevation in BLL, there is a reduction of about 0.25–0.5 point in cognitive score.
IQ: intelligence quotient
BLL: blood lead level

20
20
LeadLead
TARGET TARGET
ORGAN ORGAN
TOXICITYTOXICITY
• Toxicity at lower exposures
• Unique toxicities due to developmental immaturity
Lead poisoning can be acute (or rather acute-on-chronic) and more often chronic, due to high exposure levels.
•Children experience toxic effects at lower levels of exposure than adults.
•Children experience unique toxicities different from those of adults, due to developmental immaturity.
The signs and symptoms include: abdominal pain, encephalopathy, seizures, coma and death.
Poisoning may also be much more subtle, leading to metabolic abnormalities and anaemia, but no overt symptomatology.
<<READ SLIDE>>
Ref:
•US Department of Health and Human Services, Agency for Toxic Substances and Disease Registry. Lead toxicity. Case Studies in Environmental Medicine. 2000

21
21
LeadLead
RADIOGRAPH: RECENT RADIOGRAPH: RECENT
LEAD INGESTIONLEAD INGESTION
A plain (flat) abdominal film of a toddler with a recent ingestion of lead-containing paint chips
Lead particles are evident as radiopacities
Courtesy of John Graef, MD, Boston Children's Hospital
The diagnosis of lead poisoning requires a high index of suspicion and it is confirmed by measurement of blood lead level.
Plain radiograph of the abdomen can confirm the source of recent lead paint chip ingestion. Lead is radiopaque.
High-dose poisoning occurs in children when they ingest lead from sources such as leaded paint chips, toys or mini-blinds painted with lead paint or when they eat food from ceramic pots and jars with lead-containing glazes.
<<READ SLIDE.>>
22
22
LeadLead
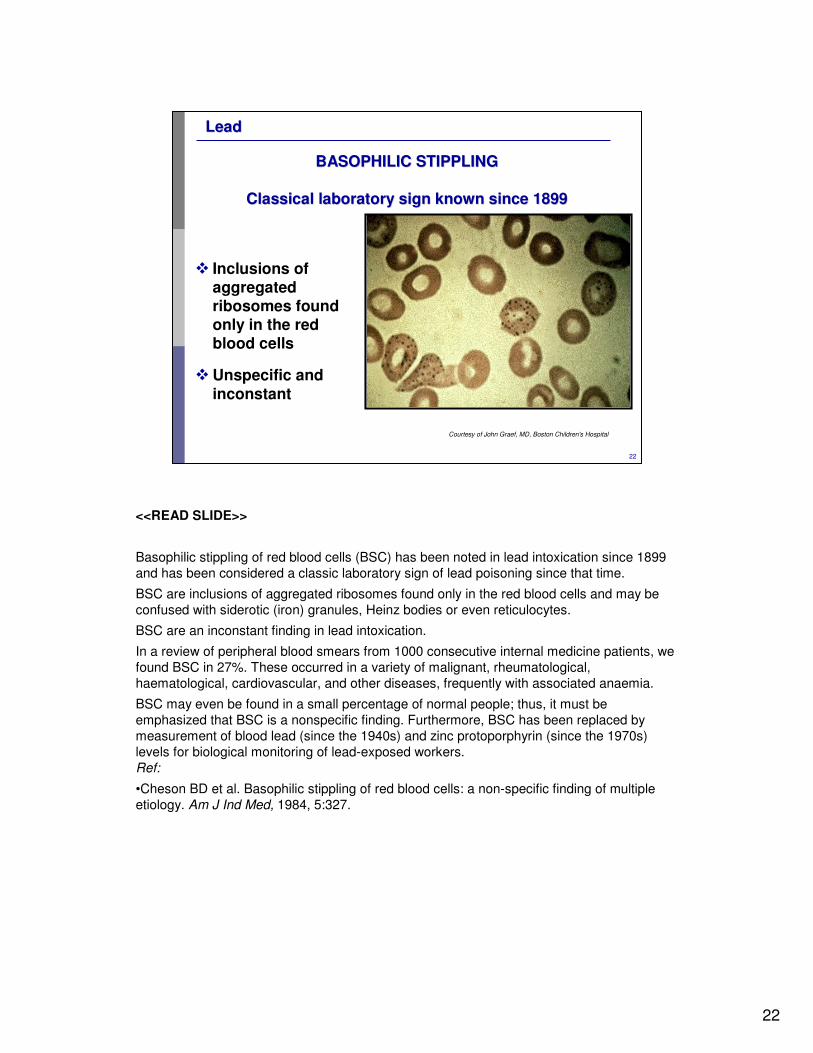
BASOPHILIC STIPPLING BASOPHILIC STIPPLING
Classical laboratory sign known since 1899Classical laboratory sign known since 1899
� Inclusions of aggregated ribosomes found only in the red blood cells
�Unspecific and inconstant
Courtesy of John Graef, MD, Boston Children's Hospital
<<READ SLIDE>>
Basophilic stippling of red blood cells (BSC) has been noted in lead intoxication since 1899 and has been considered a classic laboratory sign of lead poisoning since that time.
BSC are inclusions of aggregated ribosomes found only in the red blood cells and may be confused with siderotic (iron) granules, Heinz bodies or even reticulocytes.
BSC are an inconstant finding in lead intoxication.
In a review of peripheral blood smears from 1000 consecutive internal medicine patients, we found BSC in 27%. These occurred in a variety of malignant, rheumatological, haematological, cardiovascular, and other diseases, frequently with associated anaemia.
BSC may even be found in a small percentage of normal people; thus, it must be emphasized that BSC is a nonspecific finding. Furthermore, BSC has been replaced by measurement of blood lead (since the 1940s) and zinc protoporphyrin (since the 1970s) levels for biological monitoring of lead-exposed workers.Ref:
•Cheson BD et al. Basophilic stippling of red blood cells: a non-specific finding of multiple etiology. Am J Ind Med, 1984, 5:327.
23
23
LeadLead
EFFECTS OF LEAD ON HEFFECTS OF LEAD ON HAEM AEM SYNTHESISSYNTHESIS
Cou
rtesy
of Jo
hn
Gra
ef, M
D, B
osto
n C
hild
ren
's H
osp
ital
1
2
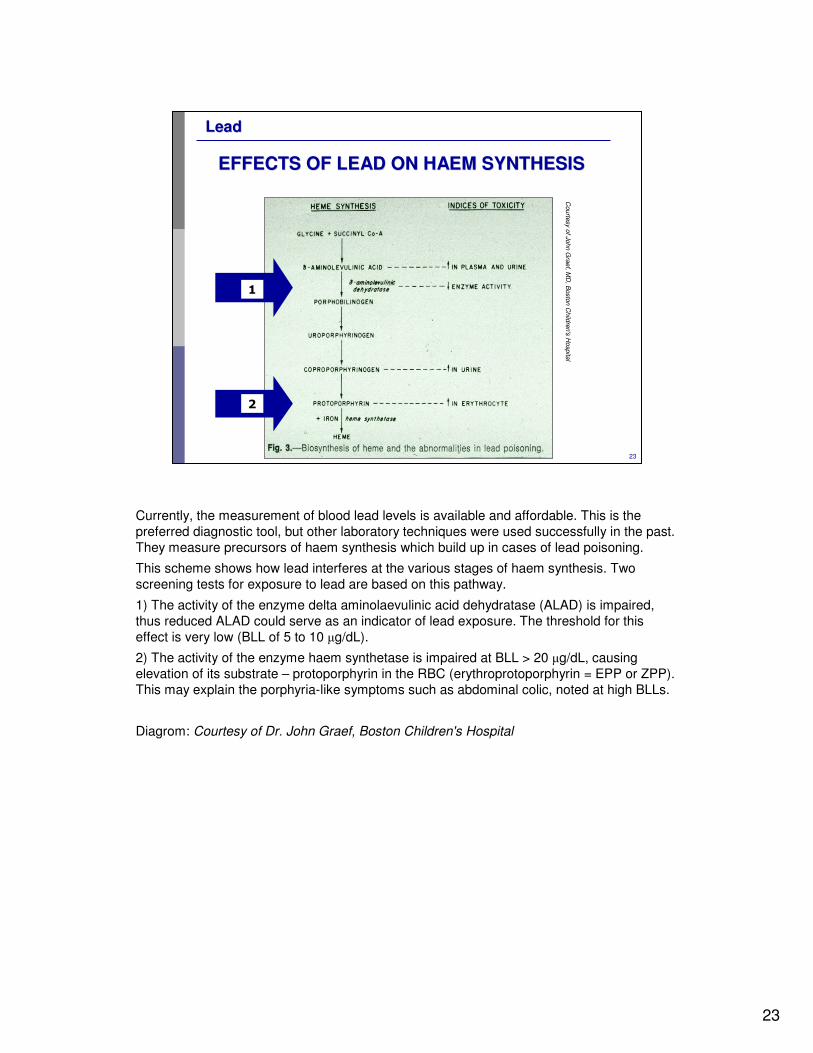
Currently, the measurement of blood lead levels is available and affordable. This is the preferred diagnostic tool, but other laboratory techniques were used successfully in the past. They measure precursors of haem synthesis which build up in cases of lead poisoning.
This scheme shows how lead interferes at the various stages of haem synthesis. Two screening tests for exposure to lead are based on this pathway.
1) The activity of the enzyme delta aminolaevulinic acid dehydratase (ALAD) is impaired, thus reduced ALAD could serve as an indicator of lead exposure. The threshold for this effect is very low (BLL of 5 to 10 µg/dL).
2) The activity of the enzyme haem synthetase is impaired at BLL > 20 µg/dL, causing elevation of its substrate – protoporphyrin in the RBC (erythroprotoporphyrin = EPP or ZPP). This may explain the porphyria-like symptoms such as abdominal colic, noted at high BLLs.
Diagrom: Courtesy of Dr. John Graef, Boston Children's Hospital

24
24
LeadLead
THE THE ““LEAD LINELEAD LINE”” SIGNSIGN
Abnormally heavy mineralization of the growth plate of long bones in radiographs
The width and density of “lead lines”reflect chronic exposure
Courtesy of John Graef, MD, Boston Children's Hospital
<<READ SLIDE>>
Lead lines are a sign of significant chronic exposure to lead.
The threshold for the occurrence of “lead lines” is a BLL of about 45 µg/dL.
Bone is the long-term "sink" for lead and builds up at areas of high bone metabolism during growth.
This radiograph shows heavy “lead lines” at the distal part of the femur, and the proximal side of the tibia and fibula in a child.
Picture: Courtesy of Dr. John Graef, Boston Children's Hospital
25
25
LeadLead
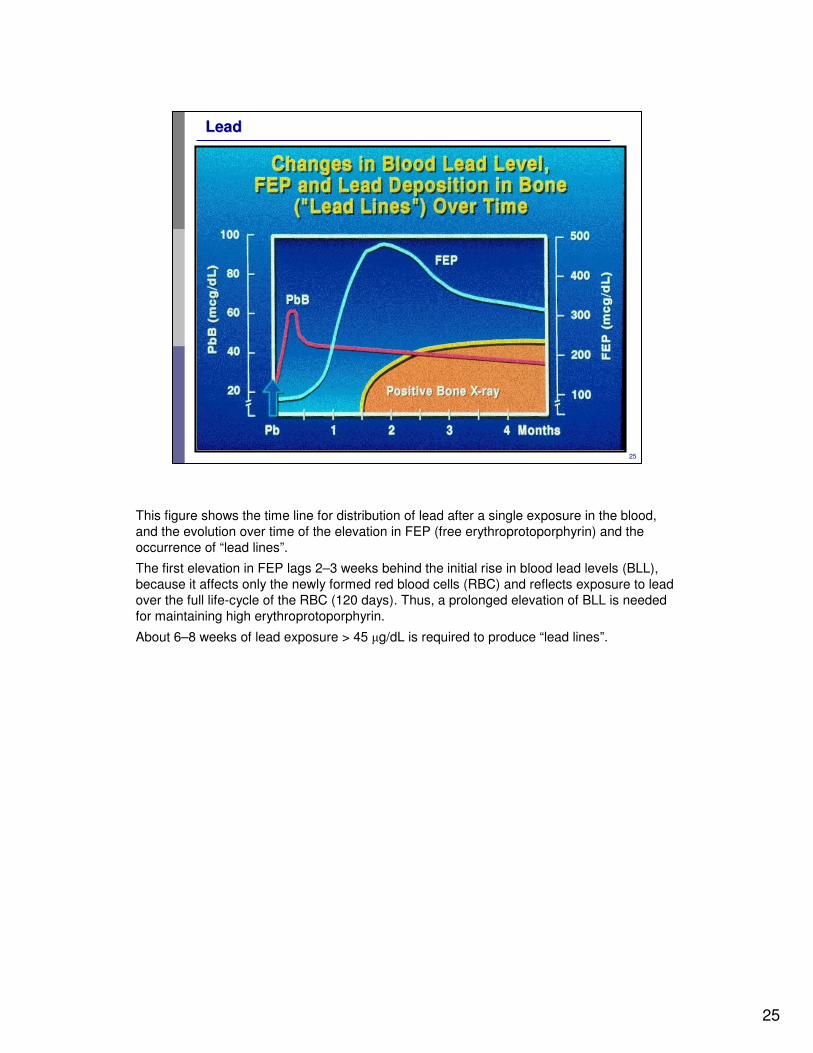
This figure shows the time line for distribution of lead after a single exposure in the blood, and the evolution over time of the elevation in FEP (free erythroprotoporphyrin) and the occurrence of “lead lines”.
The first elevation in FEP lags 2–3 weeks behind the initial rise in blood lead levels (BLL), because it affects only the newly formed red blood cells (RBC) and reflects exposure to lead over the full life-cycle of the RBC (120 days). Thus, a prolonged elevation of BLL is needed for maintaining high erythroprotoporphyrin.
About 6–8 weeks of lead exposure > 45 µg/dL is required to produce “lead lines”.
26
26
LeadLead
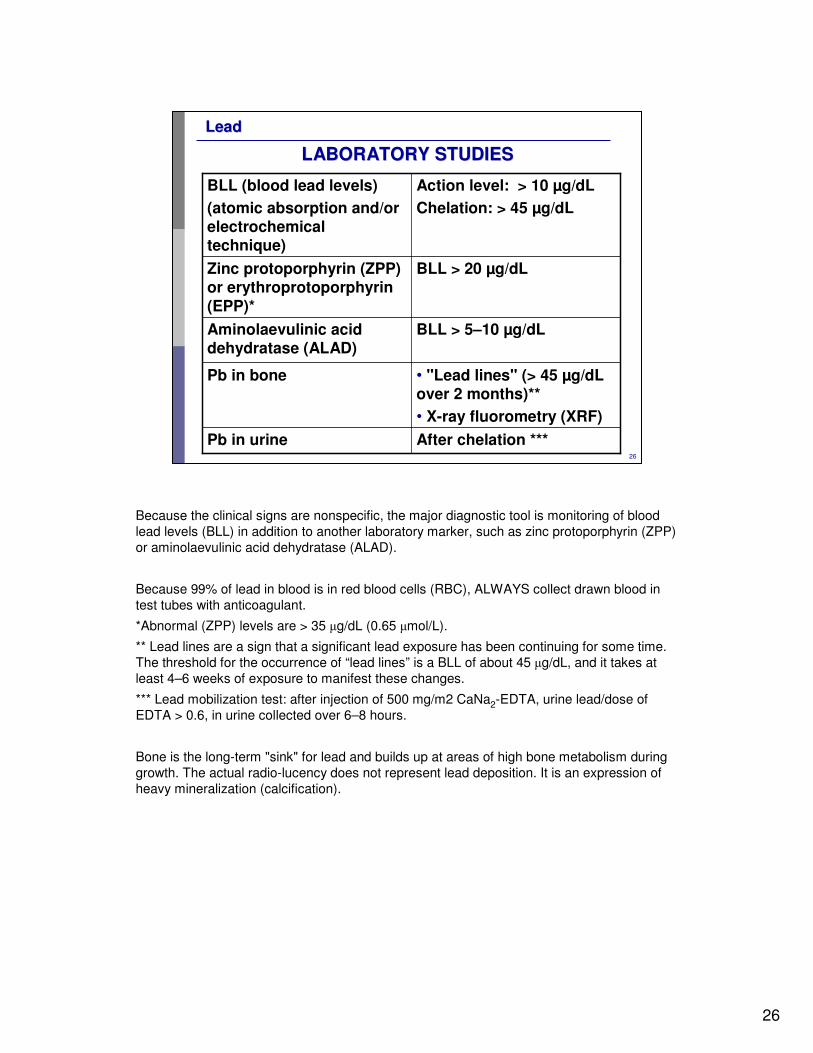
LABORATORY STUDIESLABORATORY STUDIES
After chelation ***Pb in urine
• "Lead lines" (> 45 µg/dLover 2 months)**
• X-ray fluorometry (XRF)
Pb in bone
BLL > 5–10 µg/dLAminolaevulinic acid dehydratase (ALAD)
BLL > 20 µg/dLZinc protoporphyrin (ZPP) or erythroprotoporphyrin (EPP)*
Action level: > 10 µg/dL
Chelation: > 45 µg/dL
BLL (blood lead levels)
(atomic absorption and/or electrochemicaltechnique)
Because the clinical signs are nonspecific, the major diagnostic tool is monitoring of blood lead levels (BLL) in addition to another laboratory marker, such as zinc protoporphyrin (ZPP) or aminolaevulinic acid dehydratase (ALAD).
Because 99% of lead in blood is in red blood cells (RBC), ALWAYS collect drawn blood in test tubes with anticoagulant.
*Abnormal (ZPP) levels are > 35 µg/dL (0.65 µmol/L).
** Lead lines are a sign that a significant lead exposure has been continuing for some time. The threshold for the occurrence of “lead lines” is a BLL of about 45 µg/dL, and it takes at least 4–6 weeks of exposure to manifest these changes.
*** Lead mobilization test: after injection of 500 mg/m2 CaNa2-EDTA, urine lead/dose of EDTA > 0.6, in urine collected over 6–8 hours.
Bone is the long-term "sink" for lead and builds up at areas of high bone metabolism during growth. The actual radio-lucency does not represent lead deposition. It is an expression of heavy mineralization (calcification).
27
27
LeadLead
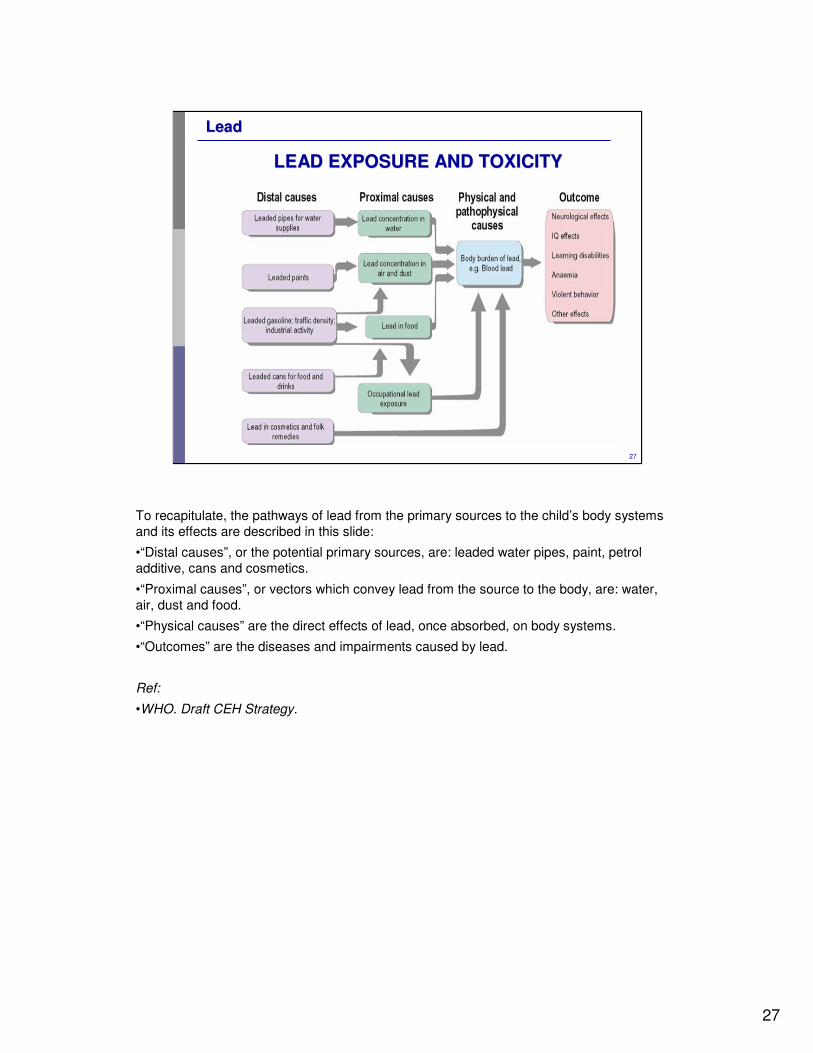
LEAD EXPOSURE AND TOXICITYLEAD EXPOSURE AND TOXICITY
To recapitulate, the pathways of lead from the primary sources to the child’s body systems and its effects are described in this slide:
•“Distal causes”, or the potential primary sources, are: leaded water pipes, paint, petrol additive, cans and cosmetics.
•“Proximal causes”, or vectors which convey lead from the source to the body, are: water, air, dust and food.
•“Physical causes” are the direct effects of lead, once absorbed, on body systems.
•“Outcomes” are the diseases and impairments caused by lead.
Ref:
•WHO. Draft CEH Strategy.
28
28
LeadLead
IMPORTANCE OF SCREENINGIMPORTANCE OF SCREENING
�Lead poisoning is often SUBCLINICAL
�Has NONSPECIFIC symptoms
�Diagnosis relies on laboratory screening
•Lead poisoning is usually chronic or subacute.
•Acute poisoning is now quite rare in most countries, but may still occur, after massive exposure. For example, in Senegal 18 children died after exposure to lead from lead battery recycling in the neighbrohood.
•In such a case, the child is comatose, with signs of increased intracranial pressure (lethargy, vomiting) and may have bradycardia and seizures.
•Some children may present with abdominal colic, constipation, anaemia and learning disabilities.
•In most industrialized countries, where lead poisoning is usually mild-to-moderate and chronic, poisoned children are identified by screening BLL and not by their clinical manifestations!

29
29
LeadLead
CORD BLL AND CORD BLL AND
MENTAL MENTAL
DEVELOPMENT INDEXDEVELOPMENT INDEX
Bellinger, N Eng J Med. (1987)316:1037
When lead poisoning begins in the womb, the most critical system is the central nervous system of the fetus. This article, published in 1987, was essential in increasing understanding of the potential for lead to cause damage at levels much lower than those that cause overt symptoms. It showed a high correlation between blood lead level in the umbilical cord and mental development index at 2 years of age. Ref:
•Bellinger D et al. Longitudinal analyses of prenatal and postnatal lead exposure and early cognitive development. N Engl J Med, 1987, 316:1037. In a prospective cohort study of 249 children from birth to two years of age, we assessed the relation between prenatal and postnatal lead exposure and early cognitive development. On the basis of lead levels in umbilical-cord blood, children were assigned to one of three prenatal-exposure groups: low (less than 3 micrograms per decilitre), medium (6 to 7 micrograms per decilitre), or high (greater than or equal to 10 micrograms per decilitre). Development was assessed semiannually, beginning at the age of six months, with use of the Mental Development Index of the Bayley Scales of Infant Development (mean +/- SD, 100 +/- 16). Capillary-blood samples obtained at the same times provided measures of postnatal lead exposure. At all ages, infants in the high-prenatal-exposure group scored lower than infants in the other two groups. The estimated difference between the overall performance of the low-exposure and high-exposure groups was 4.8 points (95 per cent confidence interval, 2.3 to 7.3). Between the medium- and high-exposure groups, the estimated difference was 3.8 points (95 per cent confidence interval, 1.3 to 6.3). Scores were not related to infants' postnatal blood lead levels. It appears that the fetus may be adversely affected at blood lead concentrations well below 25 micrograms per decilitre, the level currently defined by the Centers for Disease Control as the highest acceptable level for young children.
Picture: Copyright (1987) Massachussets Medical Society, All rights reserved. Used with permission.
30
30
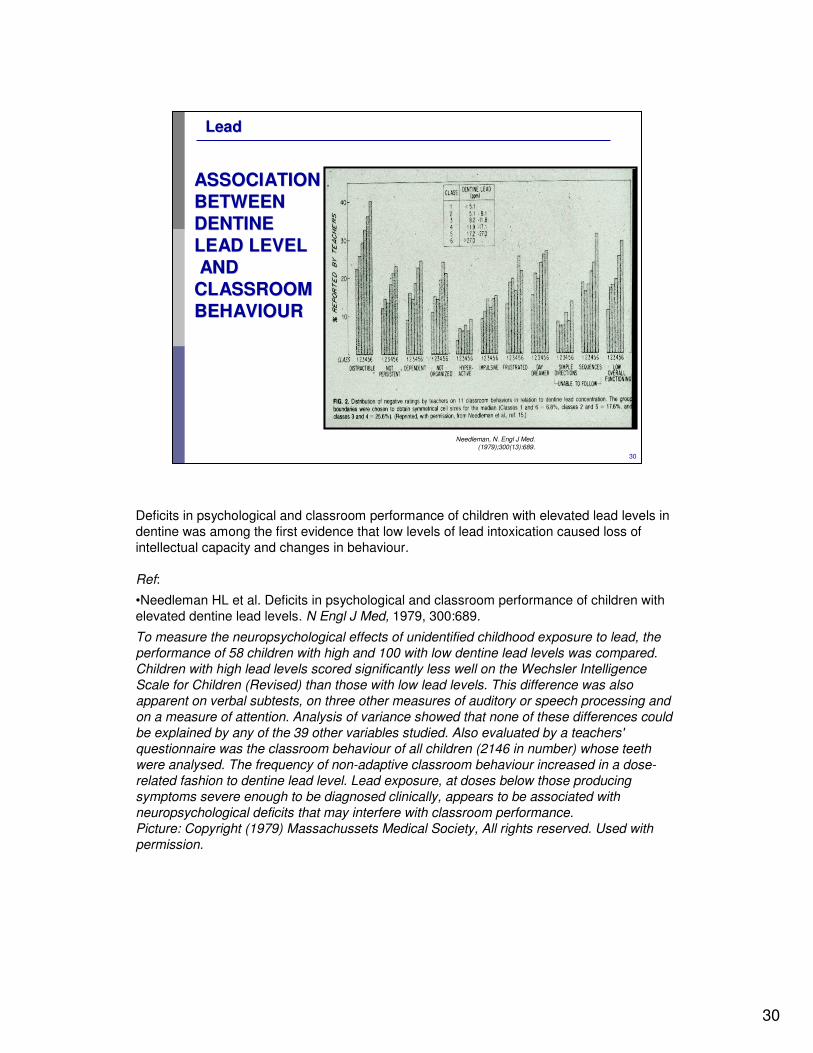
LeadLead
ASSOCIATION ASSOCIATION
BETWEEN BETWEEN
DENTINE DENTINE
LEAD LEVELLEAD LEVEL
AND AND
CLASSROOM CLASSROOM
BEHAVIOURBEHAVIOUR
Needleman, N. Engl J Med. (1979);300(13):689.
Deficits in psychological and classroom performance of children with elevated lead levels in dentine was among the first evidence that low levels of lead intoxication caused loss of intellectual capacity and changes in behaviour.
Ref:
•Needleman HL et al. Deficits in psychological and classroom performance of children with elevated dentine lead levels. N Engl J Med, 1979, 300:689.
To measure the neuropsychological effects of unidentified childhood exposure to lead, the performance of 58 children with high and 100 with low dentine lead levels was compared. Children with high lead levels scored significantly less well on the Wechsler Intelligence Scale for Children (Revised) than those with low lead levels. This difference was also apparent on verbal subtests, on three other measures of auditory or speech processing and on a measure of attention. Analysis of variance showed that none of these differences could be explained by any of the 39 other variables studied. Also evaluated by a teachers' questionnaire was the classroom behaviour of all children (2146 in number) whose teeth were analysed. The frequency of non-adaptive classroom behaviour increased in a dose-related fashion to dentine lead level. Lead exposure, at doses below those producing symptoms severe enough to be diagnosed clinically, appears to be associated with neuropsychological deficits that may interfere with classroom performance.Picture: Copyright (1979) Massachussets Medical Society, All rights reserved. Used with permission.
31
31
LeadLead
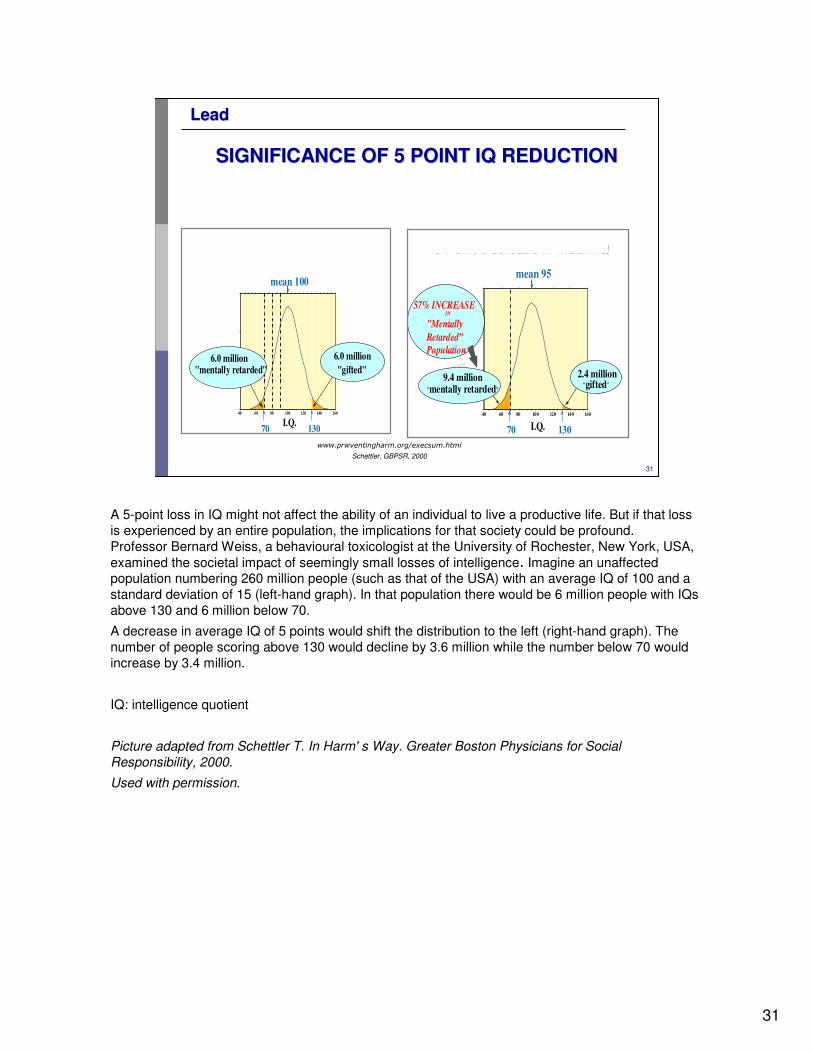
SIGNIFICANCE OF 5 POINT IQ REDUCTIONSIGNIFICANCE OF 5 POINT IQ REDUCTION
www.prwventingharm.org/execsum.html
Schettler, GBPSR, 2000
5 Point Decrease in Mean IQ
160140120100806040
mean 95
70 130
2.4 million
"gifted"
9.4 million
"mentally retarded"
57% INCREASE IN
"Mentally
Retarded”
Population
I.Q.
The Significance of Small Effects:EFFECTS OF A SMALL SHIFT IN IQ DISTRIBUTION IN A
POPULATION OF 260 MILLION
160140120100806040
70 130I.Q.
mean 100
6.0 million
"gifted"6.0 million
"mentally retarded"
A 5-point loss in IQ might not affect the ability of an individual to live a productive life. But if that loss is experienced by an entire population, the implications for that society could be profound.Professor Bernard Weiss, a behavioural toxicologist at the University of Rochester, New York, USA, examined the societal impact of seemingly small losses of intelligence. Imagine an unaffected population numbering 260 million people (such as that of the USA) with an average IQ of 100 and a standard deviation of 15 (left-hand graph). In that population there would be 6 million people with IQs above 130 and 6 million below 70.
A decrease in average IQ of 5 points would shift the distribution to the left (right-hand graph). The number of people scoring above 130 would decline by 3.6 million while the number below 70 would increase by 3.4 million.
IQ: intelligence quotient
Picture adapted from Schettler T. In Harm' s Way. Greater Boston Physicians for Social Responsibility, 2000.
Used with permission.
32
32
LeadLead
TRENDS IN LEVEL OF CONCERN (ACTION TRENDS IN LEVEL OF CONCERN (ACTION
LEVEL) FOR CHILDHOOD LEAD POISONING LEVEL) FOR CHILDHOOD LEAD POISONING
(1970(1970––1990, CDC, USA)1990, CDC, USA)
0
5
10
15
20
25
30
35
40
REDUCTION IN BLL (UG/Dl) ACTION LEVELS
1970
1975
1985
1990
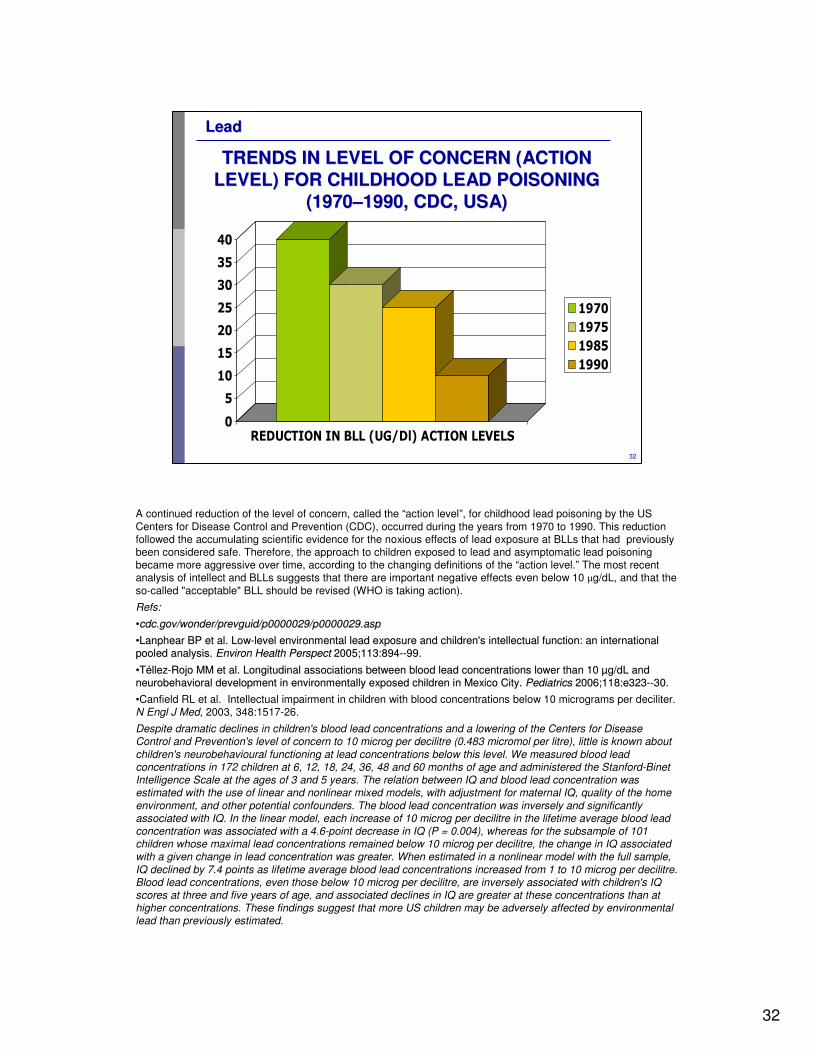
A continued reduction of the level of concern, called the “action level”, for childhood lead poisoning by the US Centers for Disease Control and Prevention (CDC), occurred during the years from 1970 to 1990. This reduction followed the accumulating scientific evidence for the noxious effects of lead exposure at BLLs that had previously been considered safe. Therefore, the approach to children exposed to lead and asymptomatic lead poisoning became more aggressive over time, according to the changing definitions of the “action level.” The most recent analysis of intellect and BLLs suggests that there are important negative effects even below 10 µg/dL, and that the so-called "acceptable" BLL should be revised (WHO is taking action).
Refs:
••cdc.gov/wonder/prevguid/p0000029/p0000029.aspcdc.gov/wonder/prevguid/p0000029/p0000029.asp
••Lanphear BP et al. LowLanphear BP et al. Low--level environmental lead exposure and children's intellectual fulevel environmental lead exposure and children's intellectual function: an international nction: an international pooled analysis. pooled analysis. Environ Health Environ Health PerspectPerspect 2005;113:8942005;113:894----99. 99.
••TTééllezllez--RojoRojo MM et al. Longitudinal associations between blood lead concentrMM et al. Longitudinal associations between blood lead concentrations lower than 10 ations lower than 10 µµg/dLg/dL and and neurobehavioral development in environmentally exposed children neurobehavioral development in environmentally exposed children in Mexico City.in Mexico City. Pediatrics Pediatrics 2006;118:e3232006;118:e323----30.30.
•Canfield RL et al. Intellectual impairment in children with blood concentrations below 10 micrograms per deciliter.N Engl J Med, 2003, 348:1517-26.
Despite dramatic declines in children's blood lead concentrations and a lowering of the Centers for Disease Control and Prevention's level of concern to 10 microg per decilitre (0.483 micromol per litre), little is known about children's neurobehavioural functioning at lead concentrations below this level. We measured blood lead concentrations in 172 children at 6, 12, 18, 24, 36, 48 and 60 months of age and administered the Stanford-Binet Intelligence Scale at the ages of 3 and 5 years. The relation between IQ and blood lead concentration was estimated with the use of linear and nonlinear mixed models, with adjustment for maternal IQ, quality of the home environment, and other potential confounders. The blood lead concentration was inversely and significantly associated with IQ. In the linear model, each increase of 10 microg per decilitre in the lifetime average blood lead concentration was associated with a 4.6-point decrease in IQ (P = 0.004), whereas for the subsample of 101 children whose maximal lead concentrations remained below 10 microg per decilitre, the change in IQ associated with a given change in lead concentration was greater. When estimated in a nonlinear model with the full sample, IQ declined by 7.4 points as lifetime average blood lead concentrations increased from 1 to 10 microg per decilitre. Blood lead concentrations, even those below 10 microg per decilitre, are inversely associated with children's IQ scores at three and five years of age, and associated declines in IQ are greater at these concentrations than at higher concentrations. These findings suggest that more US children may be adversely affected by environmental lead than previously estimated.
33
33
LeadLead
OUTCOME-EFFECTS:neurodevelopmental
impairment, learning disabilities, anaemia, GI upset
SUSCEPTIBILITIES
fetus, infant, toddler,
anaemia
ENVIRONMENTAL LEAD HAZARDS AND ENVIRONMENTAL LEAD HAZARDS AND
POISONING IN CHILDRENPOISONING IN CHILDREN
HAZARDS:
old paint,
leaded petrol,
lead pipes,
water, soil
MEDIA: air, water, food, dust, cosmetics, traditional medicines
SETTINGS:
home,
playground, renovation of old houses
ACTIVITIES: hand–mouth activity, "pica", playing,
ingestion of paint, dust inhalation, chewing on windowsills
(photo credit US NIEHS CERHR logo)
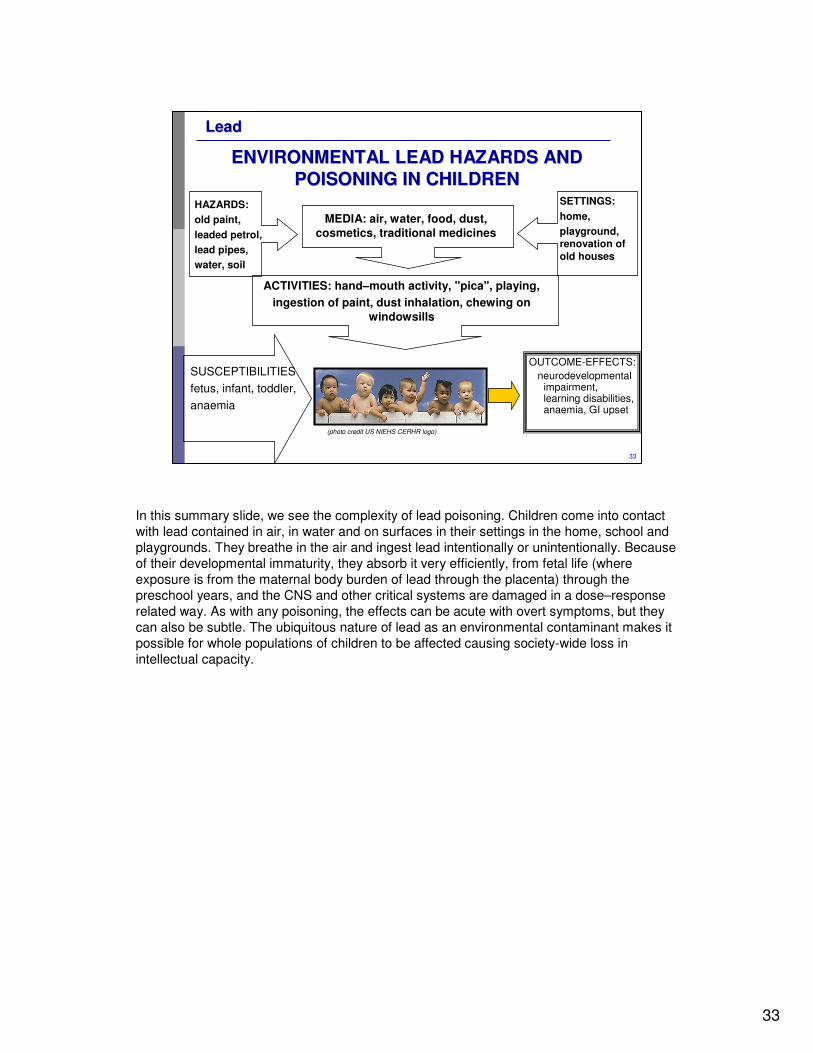
In this summary slide, we see the complexity of lead poisoning. Children come into contact with lead contained in air, in water and on surfaces in their settings in the home, school and playgrounds. They breathe in the air and ingest lead intentionally or unintentionally. Because of their developmental immaturity, they absorb it very efficiently, from fetal life (where exposure is from the maternal body burden of lead through the placenta) through the preschool years, and the CNS and other critical systems are damaged in a dose–response related way. As with any poisoning, the effects can be acute with overt symptoms, but they can also be subtle. The ubiquitous nature of lead as an environmental contaminant makes it possible for whole populations of children to be affected causing society-wide loss in intellectual capacity.
34
34
LeadLead
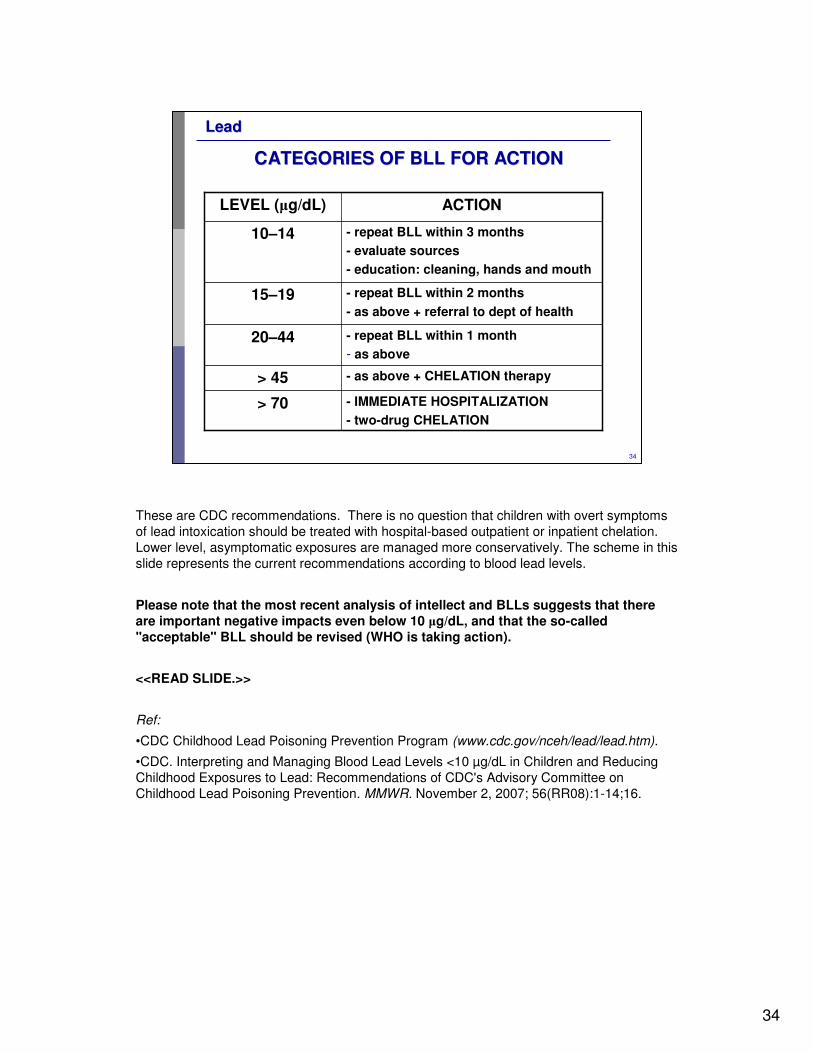
CATEGORIES OF BLL FOR ACTION CATEGORIES OF BLL FOR ACTION
ACTIONLEVEL (µg/dL)
- IMMEDIATE HOSPITALIZATION
- two-drug CHELATION
> 70
- as above + CHELATION therapy> 45
- repeat BLL within 1 month
- as above
20–44
- repeat BLL within 2 months
- as above + referral to dept of health
15–19
- repeat BLL within 3 months
- evaluate sources
- education: cleaning, hands and mouth
10–14
These are CDC recommendations. There is no question that children with overt symptoms of lead intoxication should be treated with hospital-based outpatient or inpatient chelation. Lower level, asymptomatic exposures are managed more conservatively. The scheme in this slide represents the current recommendations according to blood lead levels.
Please note that the most recent analysis of intellect and BLLs suggests that there are important negative impacts even below 10 µg/dL, and that the so-called "acceptable" BLL should be revised (WHO is taking action).
<<READ SLIDE.>>
Ref:
•CDC Childhood Lead Poisoning Prevention Program (www.cdc.gov/nceh/lead/lead.htm).
•CDC. Interpreting and Managing Blood Lead Levels <10 µg/dL in Children and Reducing Childhood Exposures to Lead: Recommendations of CDC's Advisory Committee on Childhood Lead Poisoning Prevention. MMWR. November 2, 2007; 56(RR08):1-14;16.
35
35
LeadLead
MANAGEMENT (1)MANAGEMENT (1)
�Complete assessment
�Remove from source of exposure
�Correct nutritional/iron deficiencies
�Consider chelation
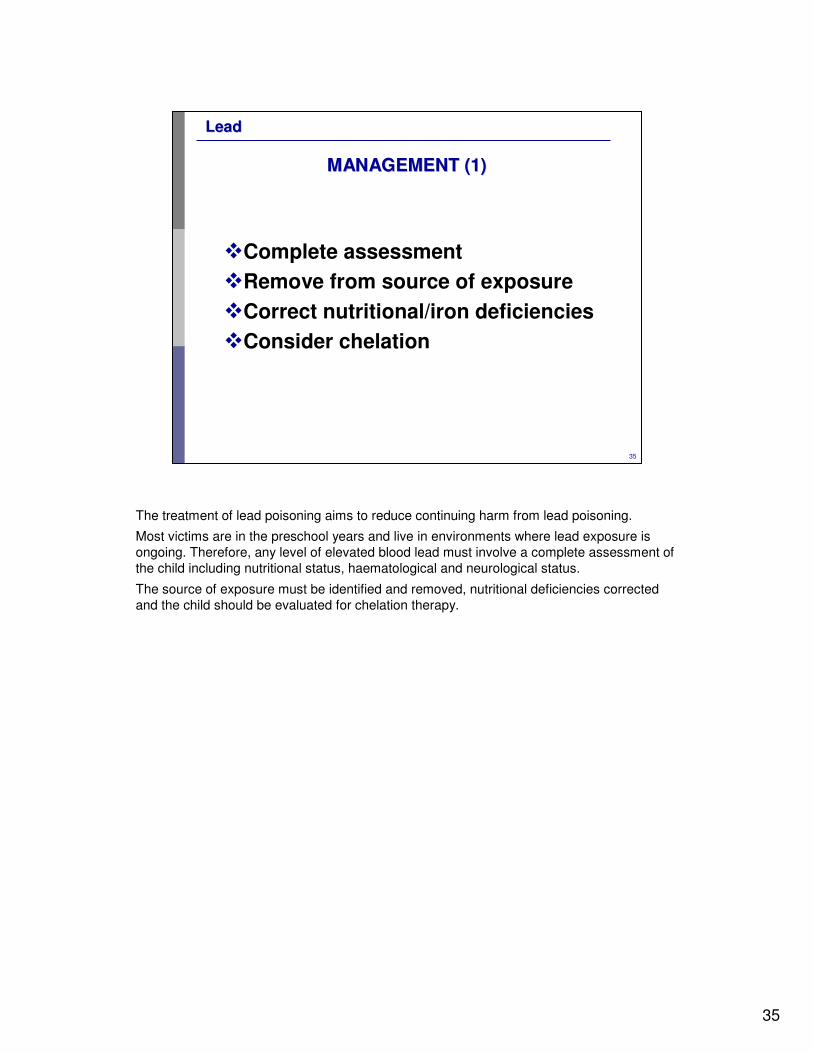
The treatment of lead poisoning aims to reduce continuing harm from lead poisoning.
Most victims are in the preschool years and live in environments where lead exposure is ongoing. Therefore, any level of elevated blood lead must involve a complete assessment of the child including nutritional status, haematological and neurological status.
The source of exposure must be identified and removed, nutritional deficiencies corrected and the child should be evaluated for chelation therapy.
36
36
LeadLead
MANAGEMENT (2) MANAGEMENT (2)
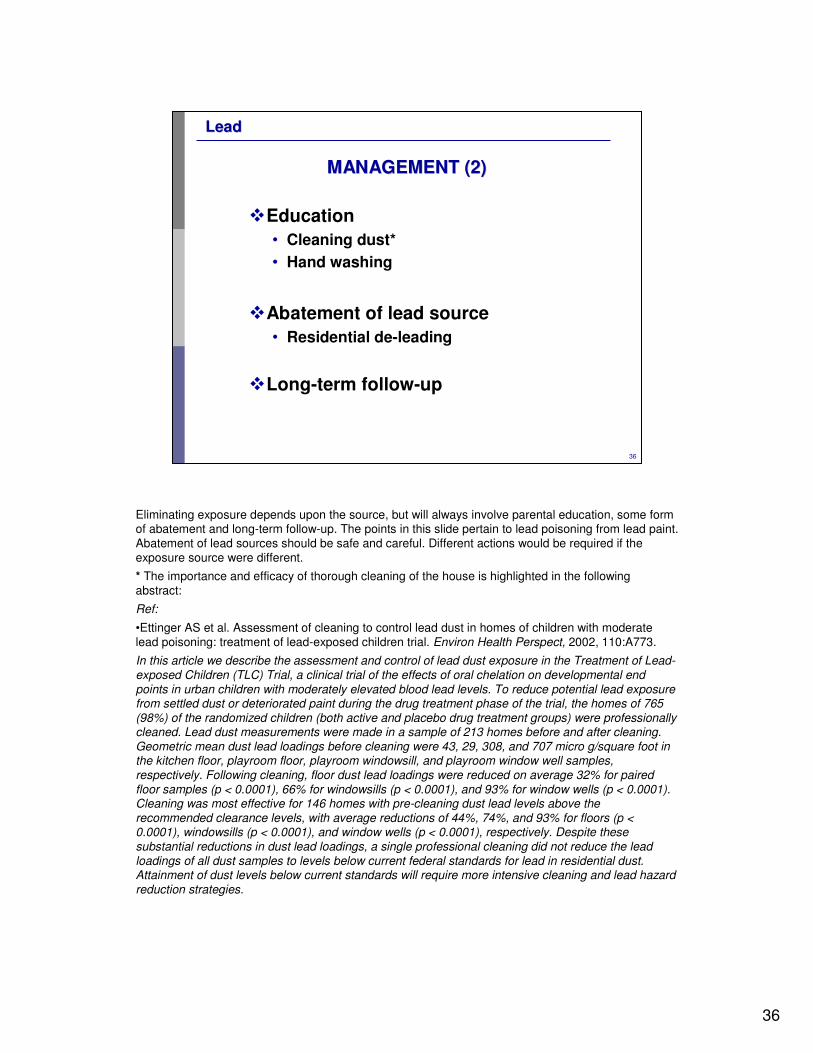
�Education
• Cleaning dust*
• Hand washing
�Abatement of lead source
• Residential de-leading
�Long-term follow-up
Eliminating exposure depends upon the source, but will always involve parental education, some form of abatement and long-term follow-up. The points in this slide pertain to lead poisoning from lead paint. Abatement of lead sources should be safe and careful. Different actions would be required if the exposure source were different.
* The importance and efficacy of thorough cleaning of the house is highlighted in the following abstract:
Ref:
•Ettinger AS et al. Assessment of cleaning to control lead dust in homes of children with moderate lead poisoning: treatment of lead-exposed children trial. Environ Health Perspect, 2002, 110:A773.
In this article we describe the assessment and control of lead dust exposure in the Treatment of Lead-exposed Children (TLC) Trial, a clinical trial of the effects of oral chelation on developmental end points in urban children with moderately elevated blood lead levels. To reduce potential lead exposure from settled dust or deteriorated paint during the drug treatment phase of the trial, the homes of 765 (98%) of the randomized children (both active and placebo drug treatment groups) were professionally cleaned. Lead dust measurements were made in a sample of 213 homes before and after cleaning. Geometric mean dust lead loadings before cleaning were 43, 29, 308, and 707 micro g/square foot in the kitchen floor, playroom floor, playroom windowsill, and playroom window well samples, respectively. Following cleaning, floor dust lead loadings were reduced on average 32% for paired floor samples (p < 0.0001), 66% for windowsills (p < 0.0001), and 93% for window wells (p < 0.0001). Cleaning was most effective for 146 homes with pre-cleaning dust lead levels above the recommended clearance levels, with average reductions of 44%, 74%, and 93% for floors (p < 0.0001), windowsills (p < 0.0001), and window wells (p < 0.0001), respectively. Despite these substantial reductions in dust lead loadings, a single professional cleaning did not reduce the lead loadings of all dust samples to levels below current federal standards for lead in residential dust. Attainment of dust levels below current standards will require more intensive cleaning and lead hazard reduction strategies.
37
37
LeadLead
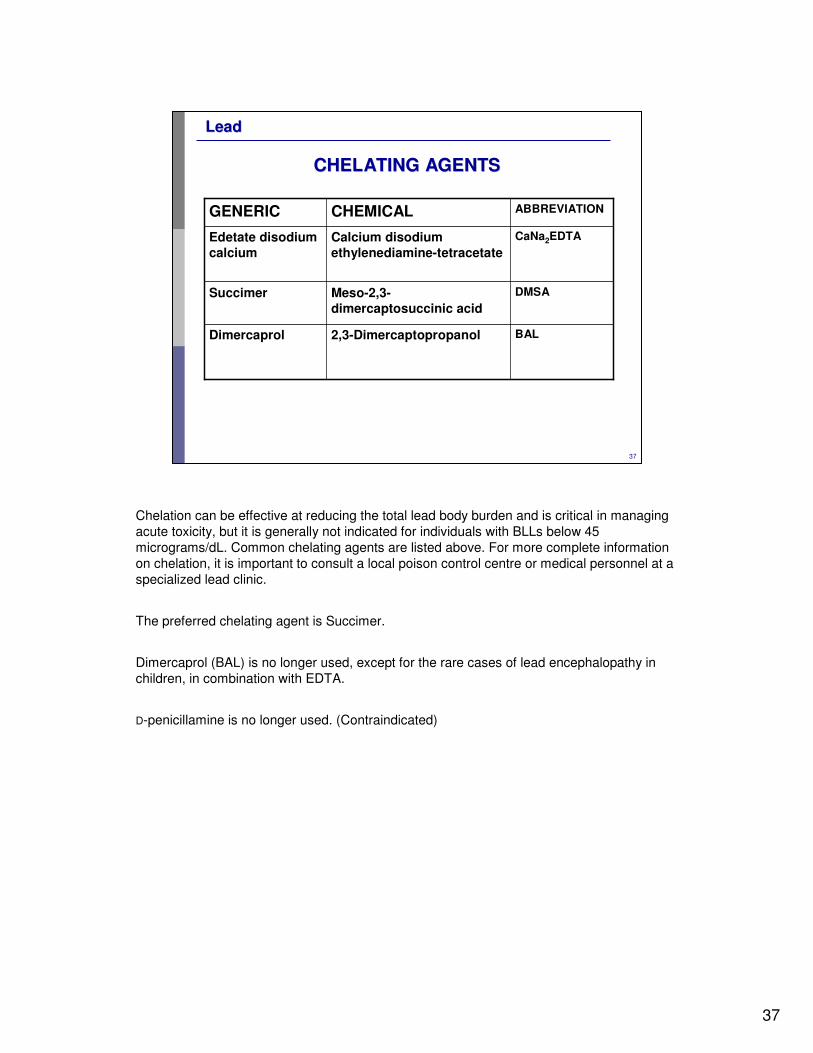
CHELATING AGENTSCHELATING AGENTS
DMSAMeso-2,3-dimercaptosuccinic acid
Succimer
BAL2,3-DimercaptopropanolDimercaprol
CaNa2EDTACalcium disodiumethylenediamine-tetracetate
Edetate disodiumcalcium
ABBREVIATIONCHEMICALGENERIC
Chelation can be effective at reducing the total lead body burden and is critical in managing acute toxicity, but it is generally not indicated for individuals with BLLs below 45 micrograms/dL. Common chelating agents are listed above. For more complete information on chelation, it is important to consult a local poison control centre or medical personnel at a specialized lead clinic.
The preferred chelating agent is Succimer.
Dimercaprol (BAL) is no longer used, except for the rare cases of lead encephalopathy in children, in combination with EDTA.
D-penicillamine is no longer used. (Contraindicated)
38
38
LeadLead
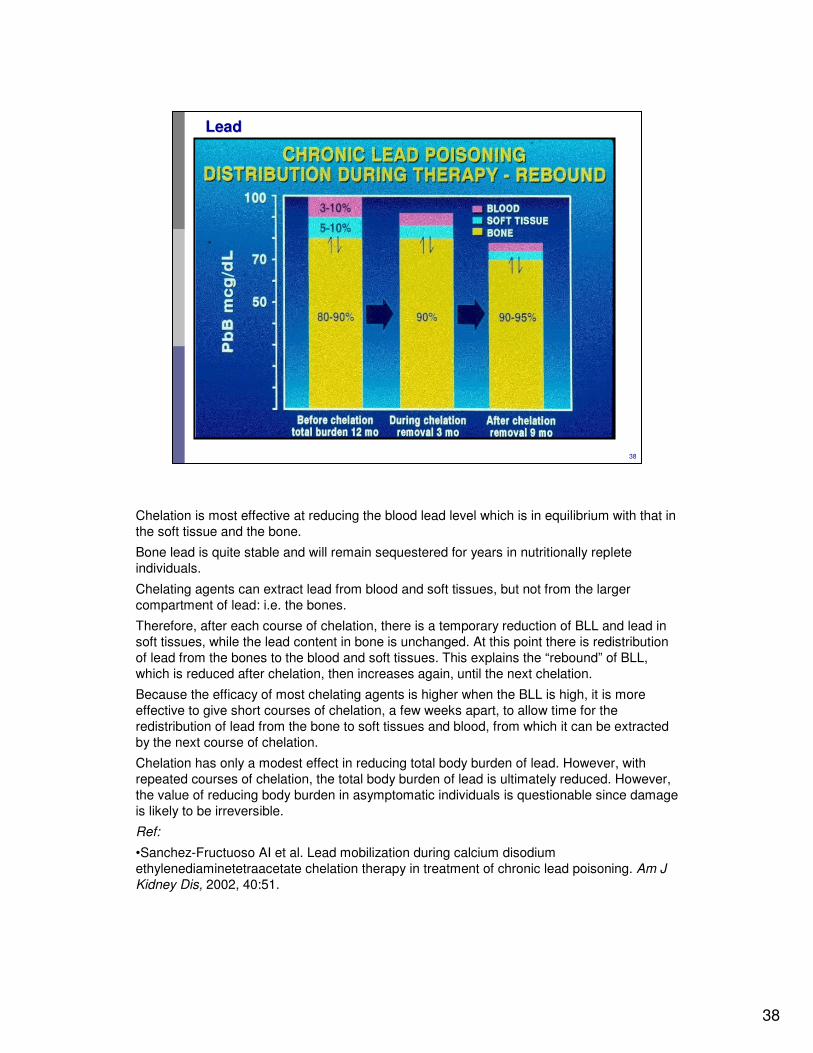
Chelation is most effective at reducing the blood lead level which is in equilibrium with that in the soft tissue and the bone.
Bone lead is quite stable and will remain sequestered for years in nutritionally replete individuals.
Chelating agents can extract lead from blood and soft tissues, but not from the larger compartment of lead: i.e. the bones.
Therefore, after each course of chelation, there is a temporary reduction of BLL and lead in soft tissues, while the lead content in bone is unchanged. At this point there is redistribution of lead from the bones to the blood and soft tissues. This explains the “rebound” of BLL, which is reduced after chelation, then increases again, until the next chelation.
Because the efficacy of most chelating agents is higher when the BLL is high, it is more effective to give short courses of chelation, a few weeks apart, to allow time for the redistribution of lead from the bone to soft tissues and blood, from which it can be extracted by the next course of chelation.
Chelation has only a modest effect in reducing total body burden of lead. However, with repeated courses of chelation, the total body burden of lead is ultimately reduced. However, the value of reducing body burden in asymptomatic individuals is questionable since damage is likely to be irreversible.
Ref:
•Sanchez-Fructuoso AI et al. Lead mobilization during calcium disodiumethylenediaminetetraacetate chelation therapy in treatment of chronic lead poisoning. Am J Kidney Dis, 2002, 40:51.

39
39
LeadLead
IMPACT OF CHELATION ON IQIMPACT OF CHELATION ON IQ
NO SIGNIFICANT DIFFERENCE SUCCIMER vs PLACEBO� Behaviour slightly worse in treated children� Neurodevelopmental testing slightly better� PRIMARY PREVENTION IS KEY
Rogan, NEJM (2001) 344:1421
This study by Rogan et al. looked carefully at the effects of oral chelation therapy in children with only mildly elevated lead levels on cognitive development. The investigators were interested in determining whether early treatment and lowering of the BLL would improve IQ scores. Unfortunately, they found no significant difference between treatment with placebo and treatment with chelation in children’s test results, although they were successful in significantly reducing blood lead levels. This strongly supports the concept of primary prevention (elimination of exposure).
Ref:
•Rogan W et al. The effect of chelation therapy with succimer on neuropsychological development in children exposed to lead. N Engl J Med, 2001, 10;344:1421.
We enrolled 780 children with blood lead levels of 20 to 44 µg per decilitre (1.0 to 2.1 µmol per litre) in a randomized, placebo-controlled, double-blind trial of up to three 26-day courses of treatment with succimer, a lead chelator that is administered orally. The children lived in deteriorating inner-city housing and were 12 to 33 months of age at enrolment; 77 per cent were black, and 5 per cent were Hispanic. Follow-up included tests of cognitive, motor, behavioural, and neuropsychological function over a period of 36 months.
During the first six months of the trial, the mean blood lead level in the children given succimer was 4.5 µg perdecilitre (0.2 µmol per litre) lower than the mean level in the children given placebo (95 per cent confidence interval, 3.7 to 5.3 µg per decilitre [0.2 to 0.3 µmol per litre]). At 36 months of follow-up, the mean IQ score of children given succimer was 1 point lower than that of children given placebo, and the behaviour of children given succimer was slightly worse as rated by a parent. However, the children given succimer scored slightly better on the Developmental Neuropsychological Assessment, a battery of tests designed to measure neuropsychologicaldeficits thought to interfere with learning. All these differences were small, and none were statistically significant.
Observational data suggest that the effect on IQ of an increase in the blood lead level from 10 to 20 µg per decilitre is a decrease of about 2 to 3 points. The difference in blood lead levels between the children given succimer and those given placebo exceeded 10 µg per decilitre only briefly, and the mean difference was 4.5 µg per decilitre (0.2 µmol per liter) during the six months after the initiation of treatment. Thus, it could be that the failure of our study to demonstrate a difference in test scores is due to the small difference in blood lead levels that we observed. However, succimer is as effective as any chelating agent currently available, and we used it for 26 days per course rather than the usual 19 days. We also used the (higher) loading dose for the first seven days,rather than the first five days, of each course, with the dose calculated according to body-surface area rather than weight. When the pills were counted, 76 per cent were gone, so adherence to therapy was as high as has been reported among children in trials lasting longer than a week. We believe it is unlikely that another chelation regimen would have been more effective.
Picture: Copyright (2001) Massachussets Medical Society, All rights reserved. Used with permission.
40
40
LeadLead
CASE STUDY ICASE STUDY I
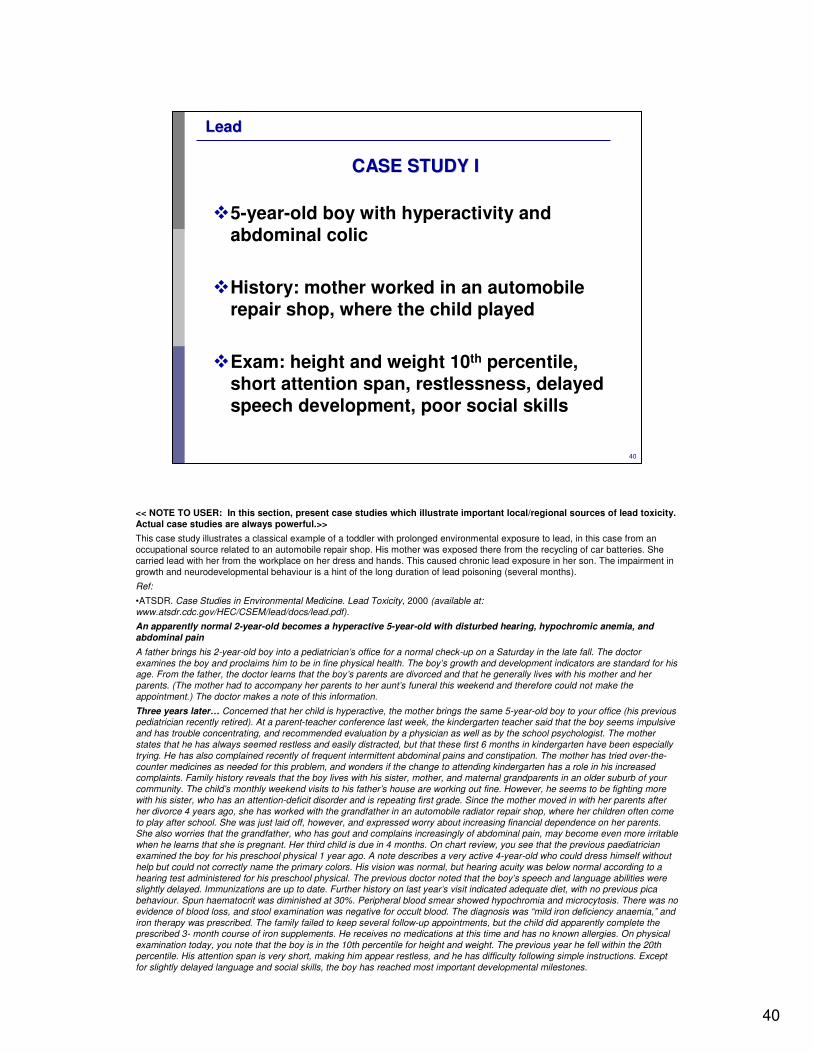
�5-year-old boy with hyperactivity and abdominal colic
�History: mother worked in an automobile repair shop, where the child played
�Exam: height and weight 10th percentile, short attention span, restlessness, delayed speech development, poor social skills
<< NOTE TO USER: In this section, present case studies which illustrate important local/regional sources of lead toxicity. Actual case studies are always powerful.>>
This case study illustrates a classical example of a toddler with prolonged environmental exposure to lead, in this case from anoccupational source related to an automobile repair shop. His mother was exposed there from the recycling of car batteries. She carried lead with her from the workplace on her dress and hands. This caused chronic lead exposure in her son. The impairment ingrowth and neurodevelopmental behaviour is a hint of the long duration of lead poisoning (several months).
Ref:
•ATSDR. Case Studies in Environmental Medicine. Lead Toxicity, 2000 (available at: www.atsdr.cdc.gov/HEC/CSEM/lead/docs/lead.pdf).
An apparently normal 2-year-old becomes a hyperactive 5-year-old with disturbed hearing, hypochromic anemia, and
abdominal pain
A father brings his 2-year-old boy into a pediatrician’s office for a normal check-up on a Saturday in the late fall. The doctor examines the boy and proclaims him to be in fine physical health. The boy’s growth and development indicators are standard for his age. From the father, the doctor learns that the boy’s parents are divorced and that he generally lives with his mother and her parents. (The mother had to accompany her parents to her aunt’s funeral this weekend and therefore could not make the appointment.) The doctor makes a note of this information.
Three years later… Concerned that her child is hyperactive, the mother brings the same 5-year-old boy to your office (his previous pediatrician recently retired). At a parent-teacher conference last week, the kindergarten teacher said that the boy seems impulsive and has trouble concentrating, and recommended evaluation by a physician as well as by the school psychologist. The mother states that he has always seemed restless and easily distracted, but that these first 6 months in kindergarten have been especially trying. He has also complained recently of frequent intermittent abdominal pains and constipation. The mother has tried over-the-counter medicines as needed for this problem, and wonders if the change to attending kindergarten has a role in his increased complaints. Family history reveals that the boy lives with his sister, mother, and maternal grandparents in an older suburb of your community. The child’s monthly weekend visits to his father’s house are working out fine. However, he seems to be fighting more with his sister, who has an attention-deficit disorder and is repeating first grade. Since the mother moved in with her parents after her divorce 4 years ago, she has worked with the grandfather in an automobile radiator repair shop, where her children often come to play after school. She was just laid off, however, and expressed worry about increasing financial dependence on her parents. She also worries that the grandfather, who has gout and complains increasingly of abdominal pain, may become even more irritablewhen he learns that she is pregnant. Her third child is due in 4 months. On chart review, you see that the previous paediatrician examined the boy for his preschool physical 1 year ago. A note describes a very active 4-year-old who could dress himself without help but could not correctly name the primary colors. His vision was normal, but hearing acuity was below normal according to a hearing test administered for his preschool physical. The previous doctor noted that the boy’s speech and language abilities were slightly delayed. Immunizations are up to date. Further history on last year’s visit indicated adequate diet, with no previous pica behaviour. Spun haematocrit was diminished at 30%. Peripheral blood smear showed hypochromia and microcytosis. There was no evidence of blood loss, and stool examination was negative for occult blood. The diagnosis was “mild iron deficiency anaemia,” and iron therapy was prescribed. The family failed to keep several follow-up appointments, but the child did apparently complete the prescribed 3- month course of iron supplements. He receives no medications at this time and has no known allergies. On physical examination today, you note that the boy is in the 10th percentile for height and weight. The previous year he fell within the 20th percentile. His attention span is very short, making him appear restless, and he has difficulty following simple instructions. Except for slightly delayed language and social skills, the boy has reached most important developmental milestones.
41
41
LeadLead
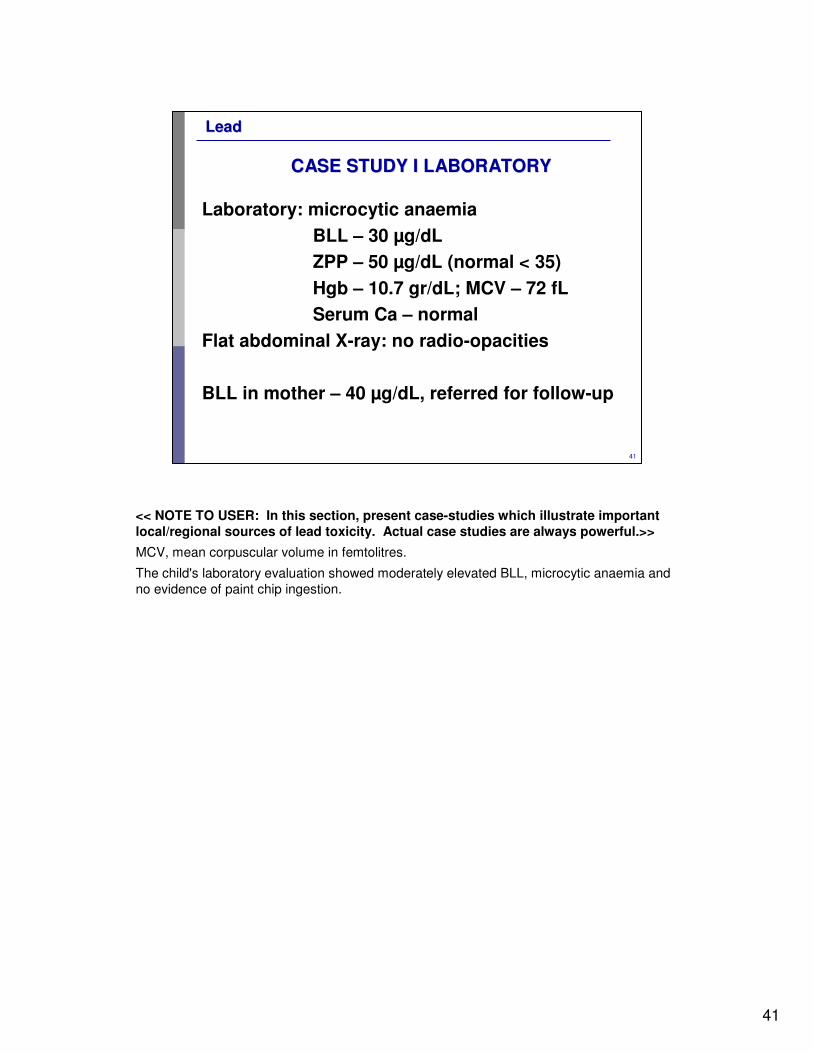
CASE STUDY I LABORATORY CASE STUDY I LABORATORY
Laboratory: microcytic anaemia
BLL – 30 µg/dL
ZPP – 50 µg/dL (normal < 35)
Hgb – 10.7 gr/dL; MCV – 72 fL
Serum Ca – normal
Flat abdominal X-ray: no radio-opacities
BLL in mother – 40 µg/dL, referred for follow-up
<< NOTE TO USER: In this section, present case-studies which illustrate important local/regional sources of lead toxicity. Actual case studies are always powerful.>>
MCV, mean corpuscular volume in femtolitres.
The child's laboratory evaluation showed moderately elevated BLL, microcytic anaemia and no evidence of paint chip ingestion.
42
42
LeadLead
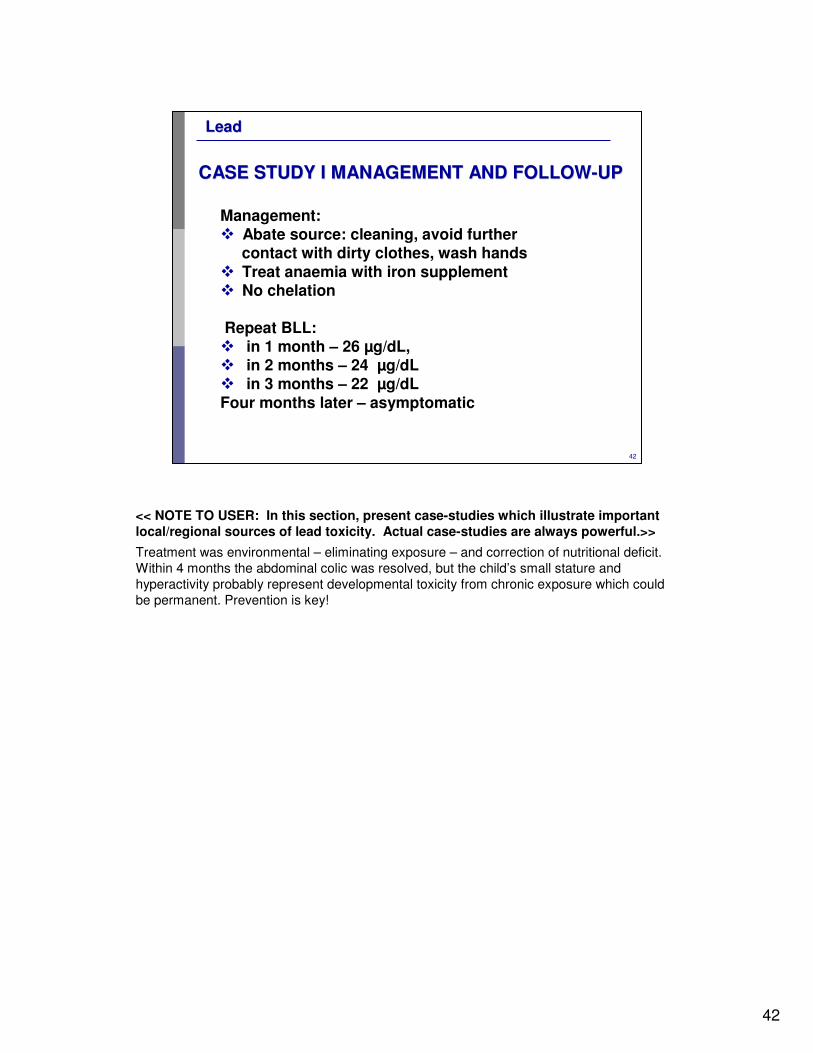
CASE STUDY I MANAGEMENT AND FOLLOWCASE STUDY I MANAGEMENT AND FOLLOW--UPUP
Management: � Abate source: cleaning, avoid further
contact with dirty clothes, wash hands� Treat anaemia with iron supplement� No chelation
Repeat BLL:� in 1 month – 26 µg/dL, � in 2 months – 24 µg/dL� in 3 months – 22 µg/dLFour months later – asymptomatic
<< NOTE TO USER: In this section, present case-studies which illustrate important local/regional sources of lead toxicity. Actual case-studies are always powerful.>>
Treatment was environmental – eliminating exposure – and correction of nutritional deficit. Within 4 months the abdominal colic was resolved, but the child’s small stature and hyperactivity probably represent developmental toxicity from chronic exposure which could be permanent. Prevention is key!

43
43
LeadLead
CASE STUDY IICASE STUDY II
�7-year-old girl with anaemia
�History: lives in Durban with parents, who say that she peels paint off the wall and digs putty out of the window frames and eats them
�Exam: height and weight 20th percentile, otherwise appears normal
<< NOTE TO USER: In this section, present case studies which illustrate important local/regional sources of lead toxicity. Actual case studies are always powerful.>>
Ref:
•Mathee A et al. Lead in paint: Three decades later and still a hazard for African children? Environemtnal Health Perspectives 2007;115: 321-322.
•Montgomery M et al. A preliminary study of residential paint lead concentrations in Johannesburg. Environ Res 2005;98:279-283.
44
44
LeadLead
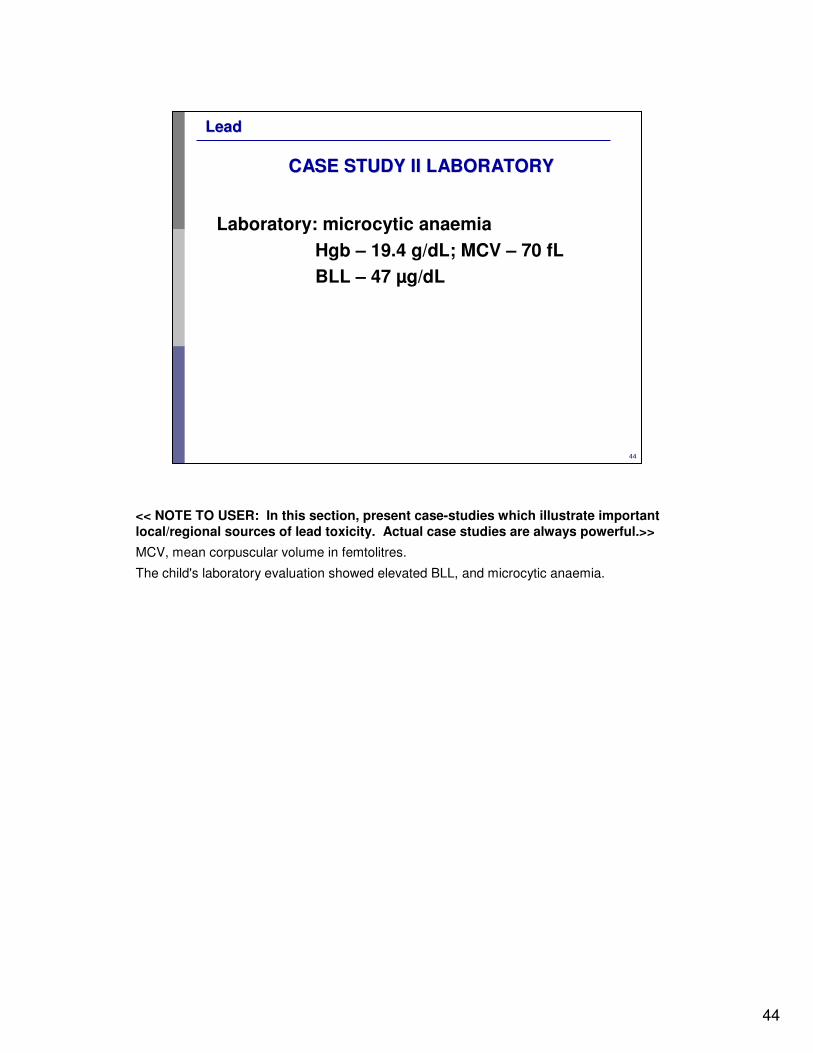
CASE STUDY II LABORATORY CASE STUDY II LABORATORY
Laboratory: microcytic anaemia
Hgb – 19.4 g/dL; MCV – 70 fL
BLL – 47 µg/dL
<< NOTE TO USER: In this section, present case-studies which illustrate important local/regional sources of lead toxicity. Actual case studies are always powerful.>>
MCV, mean corpuscular volume in femtolitres.
The child's laboratory evaluation showed elevated BLL, and microcytic anaemia.
45
45
LeadLead
CASE STUDY II MANAGEMENT AND FOLLOWCASE STUDY II MANAGEMENT AND FOLLOW--UPUP
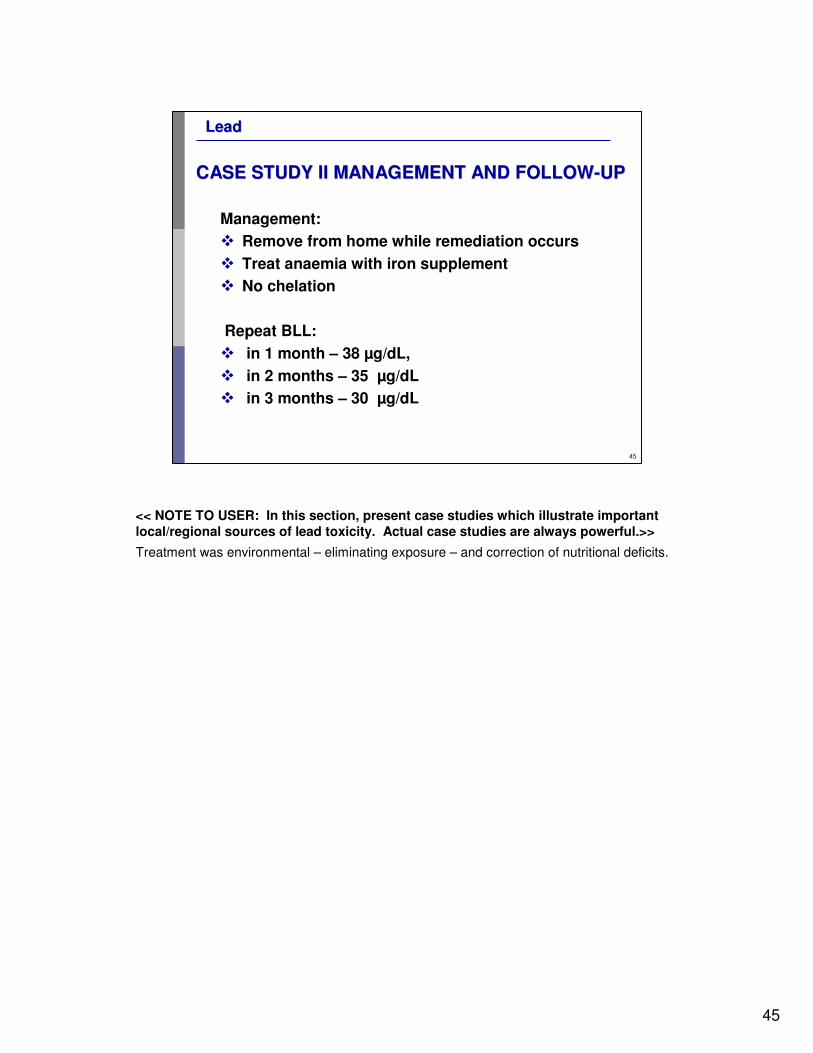
Management:
� Remove from home while remediation occurs
� Treat anaemia with iron supplement
� No chelation
Repeat BLL:
� in 1 month – 38 µg/dL,
� in 2 months – 35 µg/dL
� in 3 months – 30 µg/dL
<< NOTE TO USER: In this section, present case studies which illustrate important local/regional sources of lead toxicity. Actual case studies are always powerful.>>
Treatment was environmental – eliminating exposure – and correction of nutritional deficits.
46
46
LeadLead
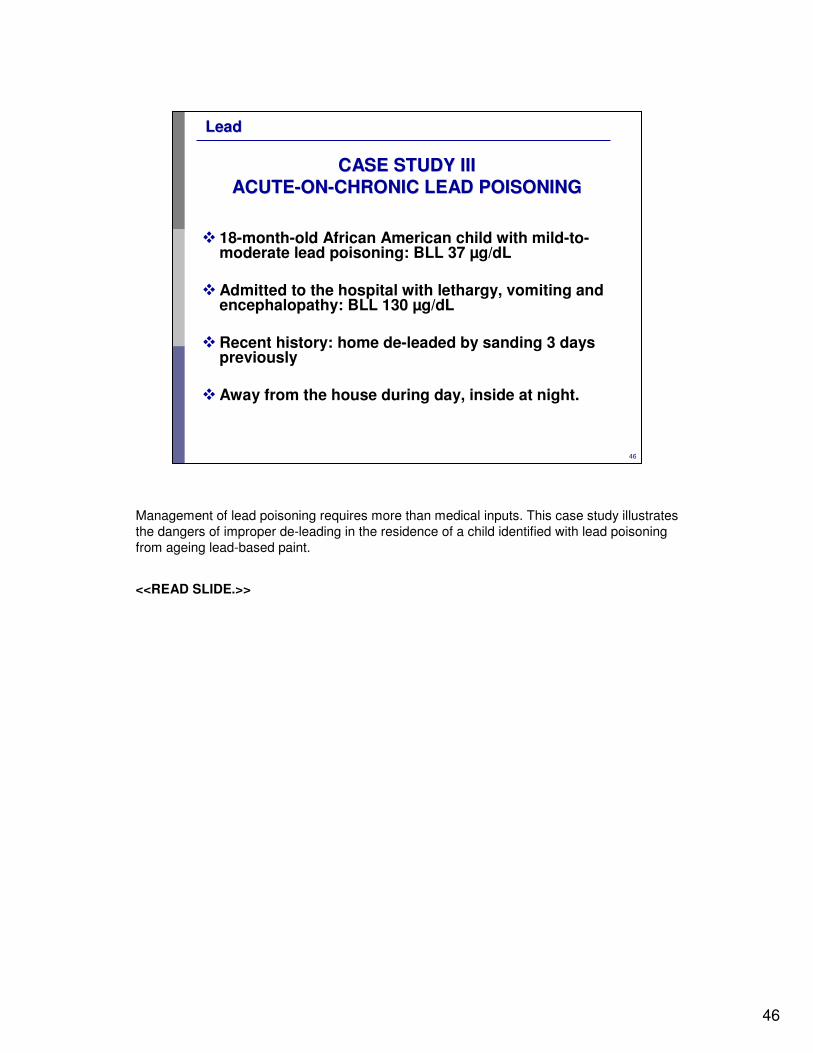
CASE STUDY IIICASE STUDY III
ACUTEACUTE--ONON--CHRONIC LEAD POISONINGCHRONIC LEAD POISONING
� 18-month-old African American child with mild-to-moderate lead poisoning: BLL 37 µg/dL
�Admitted to the hospital with lethargy, vomiting and encephalopathy: BLL 130 µg/dL
�Recent history: home de-leaded by sanding 3 days previously
�Away from the house during day, inside at night.
Management of lead poisoning requires more than medical inputs. This case study illustrates the dangers of improper de-leading in the residence of a child identified with lead poisoning from ageing lead-based paint.
<<READ SLIDE.>>

47
47
LeadLead
CASE STUDY III CASE STUDY III –– FOLLOWFOLLOW--UP AND BLLUP AND BLL
Rey-A
lva
rez, P
ed
iatric
s, 1
98
7, 7
9(2
):214
.
In this case, an existing chronic exposure to lead became acute poisoning during the process of source mitigation.
The child was admitted to hospital with lethargy and vomiting and was treated with several courses of chelating agents: first with BAL (IM) and then CaNaEDTA with fluid restriction due to concern about increased intracranial pressure. This combined therapy was given for 5 days, with daily monitoring of liver and kidney function, and electrolytes.
The child became alert and was discharged after 1 week, with a marked reduction in BLL, but suffered a subsequent rebound, which required several courses of chelation (see slide). The rebound phenomenon is explained in another slide.
Ref:
•Rey-Alvarez S et al. Deleading dilemma: pitfall in the management of childhood lead poisoning, Pediatrics, 1987, 79:214.
De-leading is a dangerous process which, if improperly done, can result in acute lead intoxication. This case report illustrates what happened to an already-lead-poisoned child's lead level when he was not excluded from his apartment during de-leading. Supportive evidence is provided from 12 additional cases recently seen by the same paediatric practice. The issues behind the failure of these families to vacate their apartments during de-leading are discussed, and the need for lead-poisoning prevention programmes to address these issues, particularly that of providing alternative shelter during de-leading, is stressed. Society should adequately fund such programmes so that they become a reality.
Picture used with permission
48
48
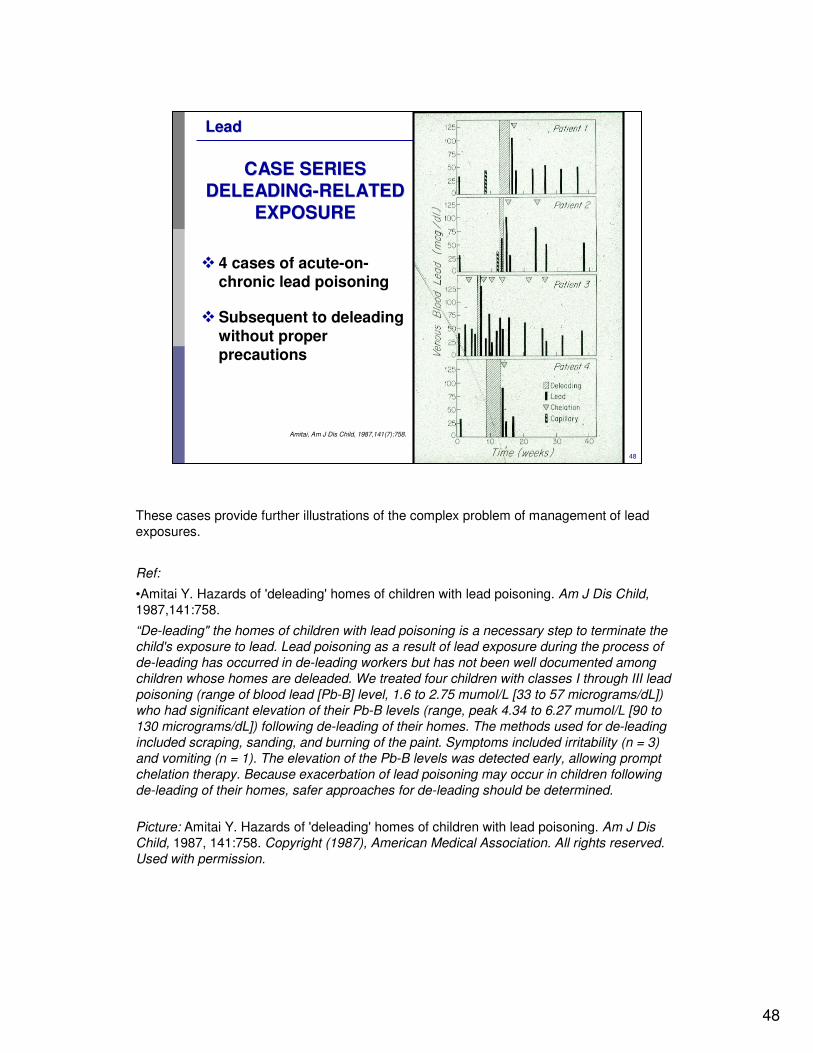
LeadLead
CASE SERIES CASE SERIES
DELEADINGDELEADING--RELATED RELATED
EXPOSUREEXPOSURE
� 4 cases of acute-on-chronic lead poisoning
�Subsequent to deleadingwithout proper precautions
Amitai, Am J Dis Child, 1987,141(7):758.
These cases provide further illustrations of the complex problem of management of lead exposures.
Ref:
•Amitai Y. Hazards of 'deleading' homes of children with lead poisoning. Am J Dis Child, 1987,141:758.
“De-leading" the homes of children with lead poisoning is a necessary step to terminate the child's exposure to lead. Lead poisoning as a result of lead exposure during the process of de-leading has occurred in de-leading workers but has not been well documented among children whose homes are deleaded. We treated four children with classes I through III lead poisoning (range of blood lead [Pb-B] level, 1.6 to 2.75 mumol/L [33 to 57 micrograms/dL]) who had significant elevation of their Pb-B levels (range, peak 4.34 to 6.27 mumol/L [90 to 130 micrograms/dL]) following de-leading of their homes. The methods used for de-leading included scraping, sanding, and burning of the paint. Symptoms included irritability (n = 3) and vomiting (n = 1). The elevation of the Pb-B levels was detected early, allowing prompt chelation therapy. Because exacerbation of lead poisoning may occur in children following de-leading of their homes, safer approaches for de-leading should be determined.
Picture: Amitai Y. Hazards of 'deleading' homes of children with lead poisoning. Am J DisChild, 1987, 141:758. Copyright (1987), American Medical Association. All rights reserved. Used with permission.
49
49
LeadLead
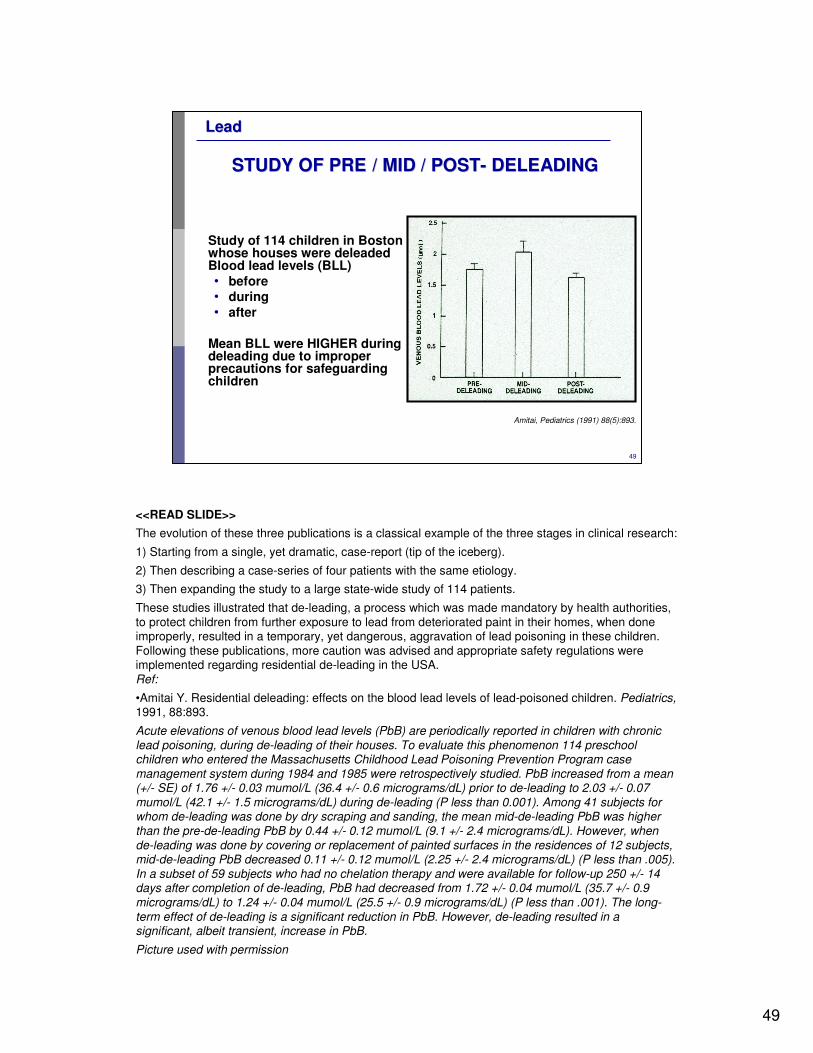
STUDY OF PRESTUDY OF PRE / MID / POST/ MID / POST-- DELEADINGDELEADING
Study of 114 children in Boston whose houses were deleadedBlood lead levels (BLL)• before• during• after
Mean BLL were HIGHER during deleading due to improper precautions for safeguarding children
Amitai, Pediatrics (1991) 88(5):893.
<<READ SLIDE>>
The evolution of these three publications is a classical example of the three stages in clinical research:
1) Starting from a single, yet dramatic, case-report (tip of the iceberg).
2) Then describing a case-series of four patients with the same etiology.
3) Then expanding the study to a large state-wide study of 114 patients.
These studies illustrated that de-leading, a process which was made mandatory by health authorities, to protect children from further exposure to lead from deteriorated paint in their homes, when done improperly, resulted in a temporary, yet dangerous, aggravation of lead poisoning in these children. Following these publications, more caution was advised and appropriate safety regulations were implemented regarding residential de-leading in the USA. Ref:
•Amitai Y. Residential deleading: effects on the blood lead levels of lead-poisoned children. Pediatrics, 1991, 88:893.
Acute elevations of venous blood lead levels (PbB) are periodically reported in children with chronic lead poisoning, during de-leading of their houses. To evaluate this phenomenon 114 preschool children who entered the Massachusetts Childhood Lead Poisoning Prevention Program case management system during 1984 and 1985 were retrospectively studied. PbB increased from a mean (+/- SE) of 1.76 +/- 0.03 mumol/L (36.4 +/- 0.6 micrograms/dL) prior to de-leading to 2.03 +/- 0.07 mumol/L (42.1 +/- 1.5 micrograms/dL) during de-leading (P less than 0.001). Among 41 subjects for whom de-leading was done by dry scraping and sanding, the mean mid-de-leading PbB was higher than the pre-de-leading PbB by 0.44 +/- 0.12 mumol/L (9.1 +/- 2.4 micrograms/dL). However, when de-leading was done by covering or replacement of painted surfaces in the residences of 12 subjects, mid-de-leading PbB decreased 0.11 +/- 0.12 mumol/L (2.25 +/- 2.4 micrograms/dL) (P less than .005). In a subset of 59 subjects who had no chelation therapy and were available for follow-up 250 +/- 14 days after completion of de-leading, PbB had decreased from 1.72 +/- 0.04 mumol/L (35.7 +/- 0.9 micrograms/dL) to 1.24 +/- 0.04 mumol/L (25.5 +/- 0.9 micrograms/dL) (P less than .001). The long-term effect of de-leading is a significant reduction in PbB. However, de-leading resulted in a significant, albeit transient, increase in PbB.
Picture used with permission
50
50
LeadLead
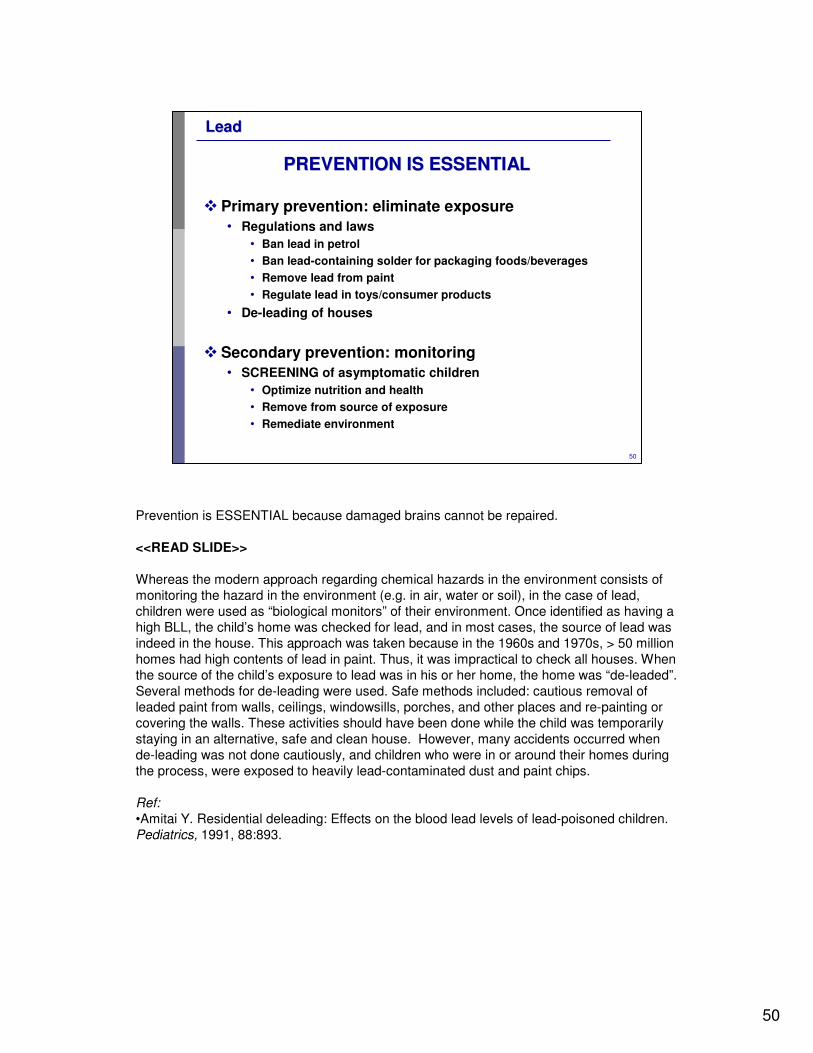
PREVENTION IS ESSENTIALPREVENTION IS ESSENTIAL
�Primary prevention: eliminate exposure
• Regulations and laws
• Ban lead in petrol
• Ban lead-containing solder for packaging foods/beverages
• Remove lead from paint
• Regulate lead in toys/consumer products
• De-leading of houses
�Secondary prevention: monitoring
• SCREENING of asymptomatic children
• Optimize nutrition and health
• Remove from source of exposure
• Remediate environment
Prevention is ESSENTIAL because damaged brains cannot be repaired.
<<READ SLIDE>>
Whereas the modern approach regarding chemical hazards in the environment consists of monitoring the hazard in the environment (e.g. in air, water or soil), in the case of lead, children were used as “biological monitors” of their environment. Once identified as having a high BLL, the child’s home was checked for lead, and in most cases, the source of lead was indeed in the house. This approach was taken because in the 1960s and 1970s, > 50 million homes had high contents of lead in paint. Thus, it was impractical to check all houses. When the source of the child’s exposure to lead was in his or her home, the home was “de-leaded”. Several methods for de-leading were used. Safe methods included: cautious removal of leaded paint from walls, ceilings, windowsills, porches, and other places and re-painting or covering the walls. These activities should have been done while the child was temporarily staying in an alternative, safe and clean house. However, many accidents occurred when de-leading was not done cautiously, and children who were in or around their homes during the process, were exposed to heavily lead-contaminated dust and paint chips.
Ref:•Amitai Y. Residential deleading: Effects on the blood lead levels of lead-poisoned children.Pediatrics, 1991, 88:893.
51
51
LeadLead
LEADED PETROL LEADED PETROL –– MAJOR SOURCEMAJOR SOURCE
Institute of Medicine, EPA, 1996
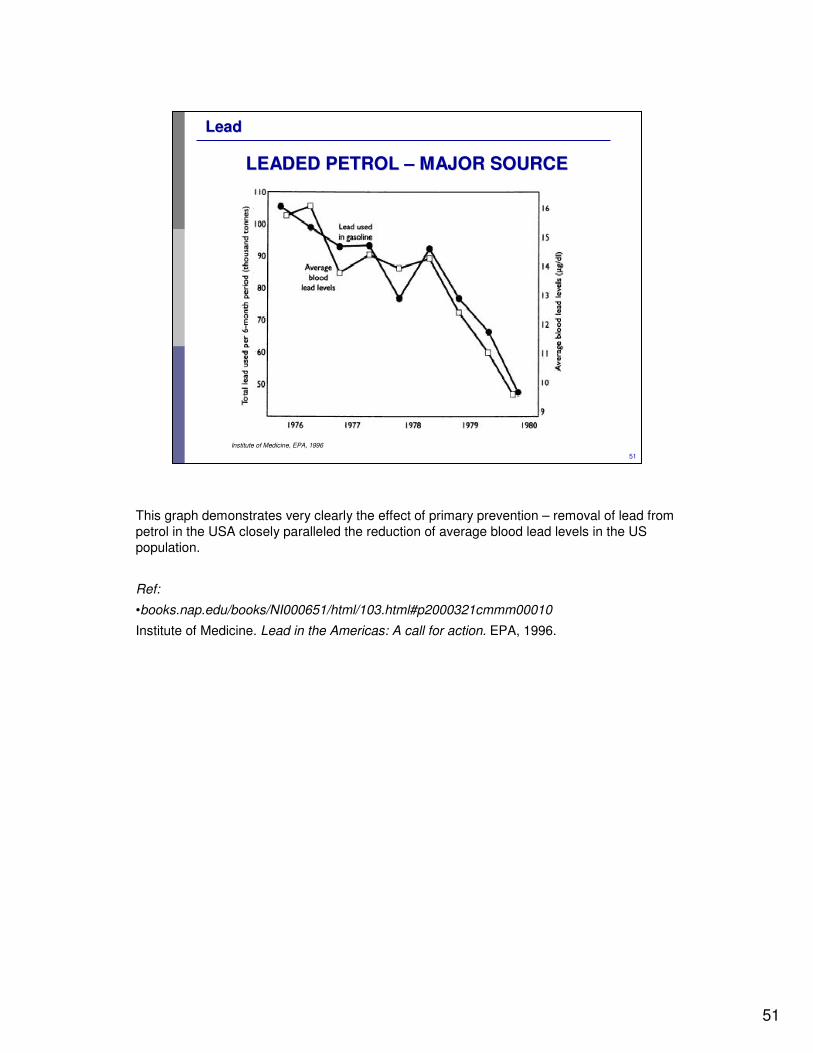
This graph demonstrates very clearly the effect of primary prevention – removal of lead from petrol in the USA closely paralleled the reduction of average blood lead levels in the US population.
Ref:
•books.nap.edu/books/NI000651/html/103.html#p2000321cmmm00010
Institute of Medicine. Lead in the Americas: A call for action. EPA, 1996.
52
52
LeadLead
TRENDS IN BLOOD LEAD LEVELS AMONGTRENDS IN BLOOD LEAD LEVELS AMONG
CHILDREN AGES 1 CHILDREN AGES 1 –– 5 YEARS (USA)5 YEARS (USA)
310 0001.61.91999–2002
890 0004.42.71991–1994
1 700 0008.63.61988–1991
13 500 00088.214.91976–1980
Estimated no. of children >10 µg/dL
% BLL >10µg/dL
Mean BLL µg/dL
Years
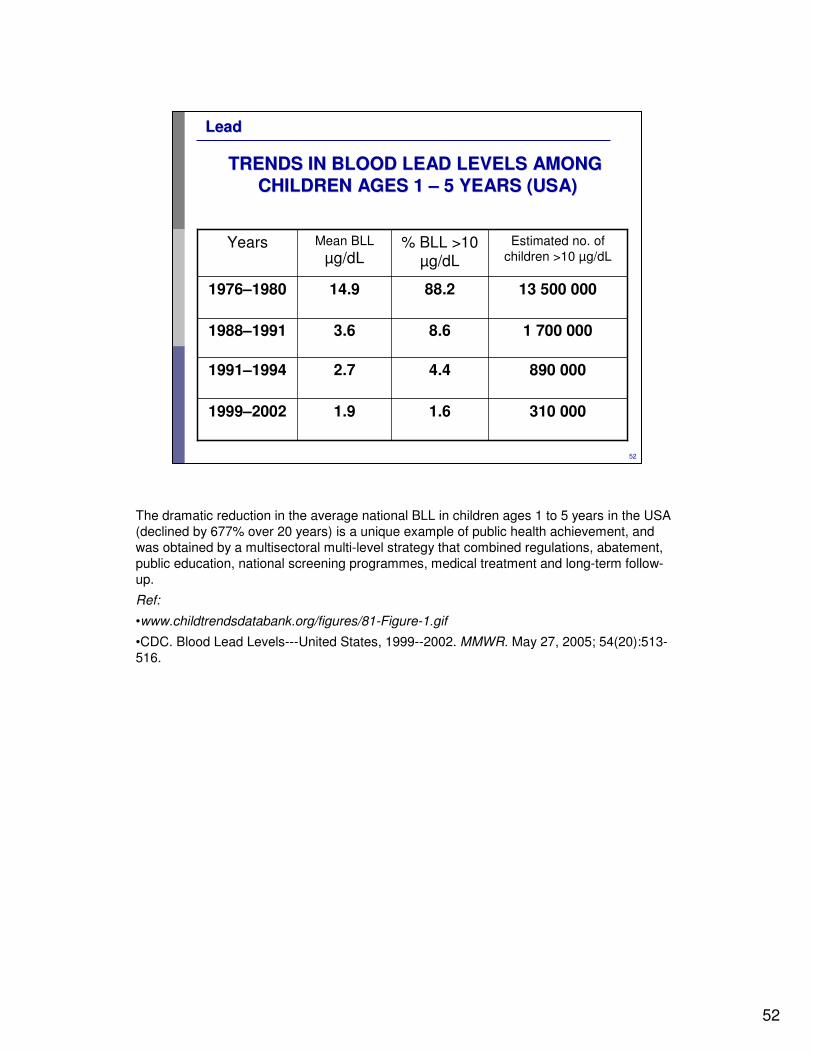
The dramatic reduction in the average national BLL in children ages 1 to 5 years in the USA (declined by 677% over 20 years) is a unique example of public health achievement, and was obtained by a multisectoral multi-level strategy that combined regulations, abatement, public education, national screening programmes, medical treatment and long-term follow-up.
Ref:
•www.childtrendsdatabank.org/figures/81-Figure-1.gif
•CDC. Blood Lead Levels---United States, 1999--2002. MMWR. May 27, 2005; 54(20):513-516.
53
53
LeadLead
GLOBAL SITUATIONGLOBAL SITUATION
16 countries still using leaded petrol (July 2008)
Afghanistan Algeria Bosnia-Herzegovina Iraq FYR Macedonia Laos Mongolia Montenegro Morocco Myanmar North Korea Palestine Serbia Tajikistan Tunisia Uzbekistan Yemen
<<READ SLIDE.>>
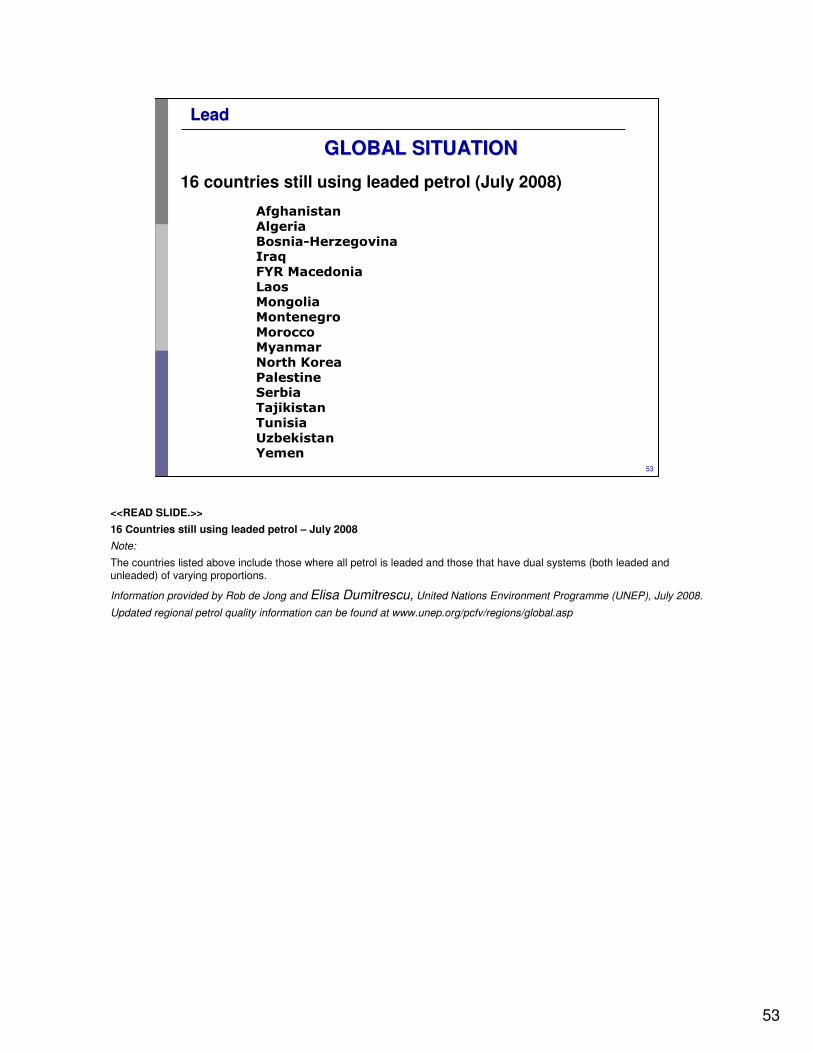
16 Countries still using leaded petrol – July 2008
Note:
The countries listed above include those where all petrol is leaded and those that have dual systems (both leaded and unleaded) of varying proportions.
Information provided by Rob de Jong and Elisa Dumitrescu, United Nations Environment Programme (UNEP), July 2008.
Updated regional petrol quality information can be found at www.unep.org/pcfv/regions/global.asp
54
54
LeadLead
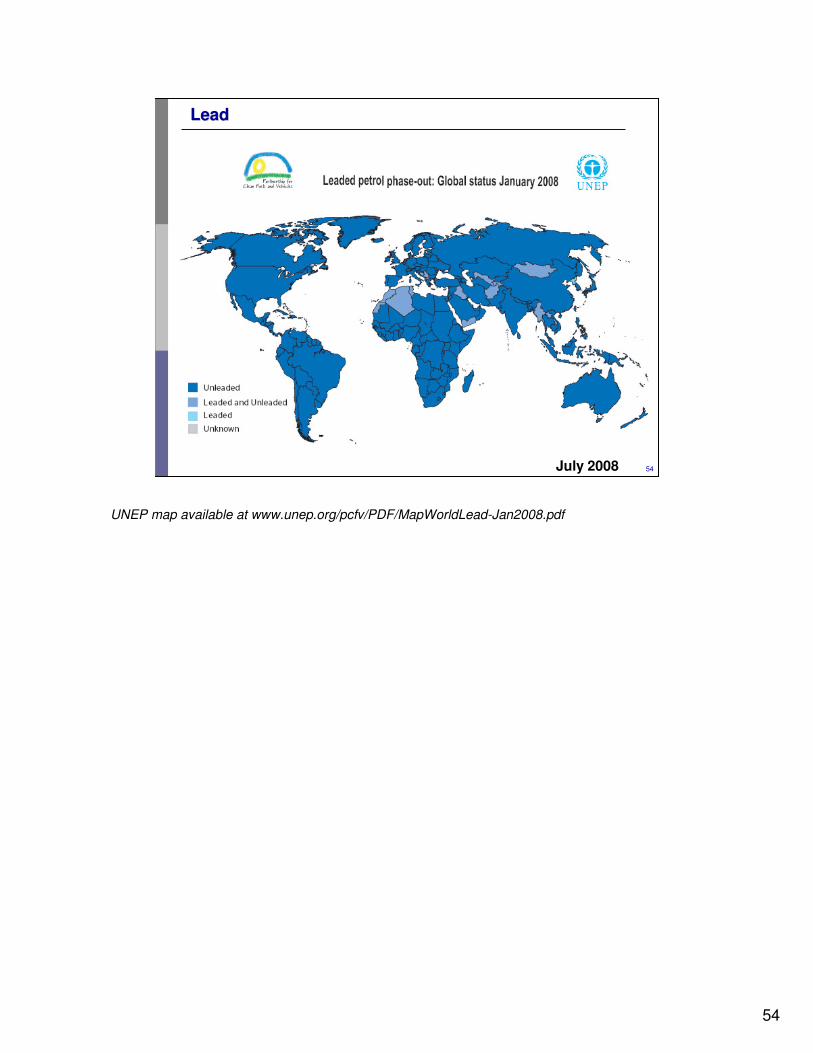
July 2008
UNEP map available at www.unep.org/pcfv/PDF/MapWorldLead-Jan2008.pdf
55
55
LeadLead
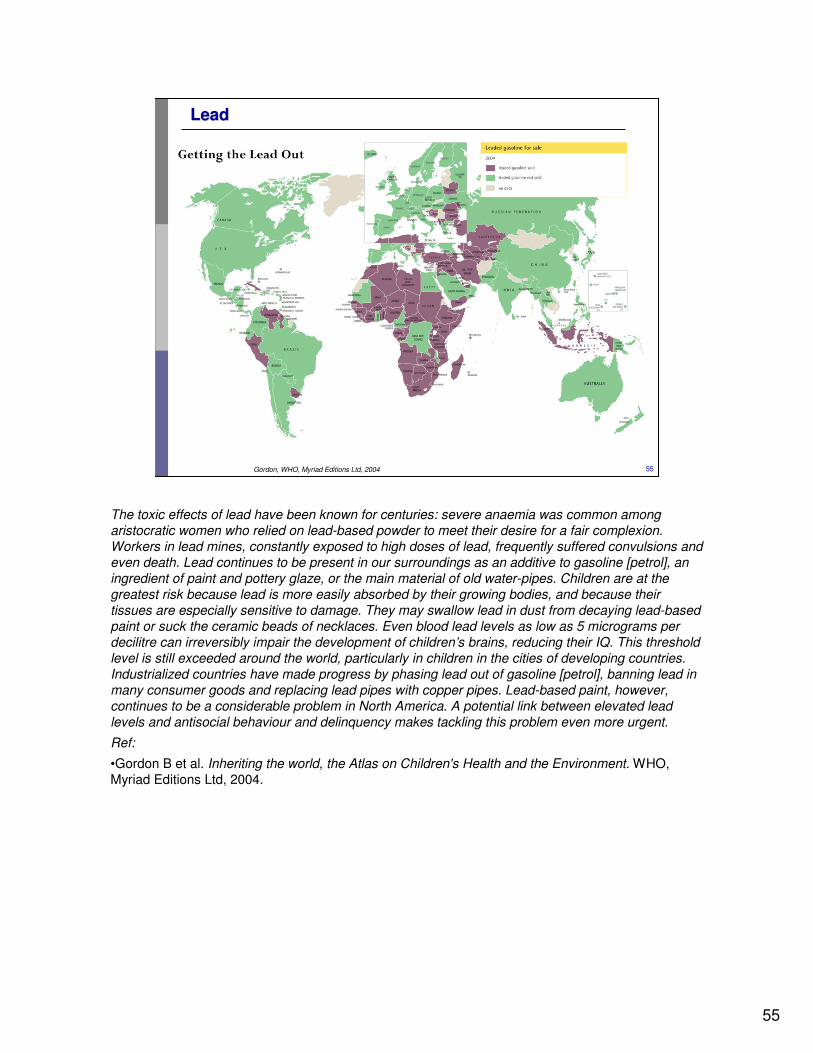
Gordon, WHO, Myriad Editions Ltd, 2004
The toxic effects of lead have been known for centuries: severe anaemia was common among aristocratic women who relied on lead-based powder to meet their desire for a fair complexion. Workers in lead mines, constantly exposed to high doses of lead, frequently suffered convulsions and even death. Lead continues to be present in our surroundings as an additive to gasoline [petrol], an ingredient of paint and pottery glaze, or the main material of old water-pipes. Children are at the greatest risk because lead is more easily absorbed by their growing bodies, and because their tissues are especially sensitive to damage. They may swallow lead in dust from decaying lead-based paint or suck the ceramic beads of necklaces. Even blood lead levels as low as 5 micrograms per decilitre can irreversibly impair the development of children’s brains, reducing their IQ. This threshold level is still exceeded around the world, particularly in children in the cities of developing countries. Industrialized countries have made progress by phasing lead out of gasoline [petrol], banning lead in many consumer goods and replacing lead pipes with copper pipes. Lead-based paint, however, continues to be a considerable problem in North America. A potential link between elevated lead levels and antisocial behaviour and delinquency makes tackling this problem even more urgent.
Ref:
•Gordon B et al. Inheriting the world, the Atlas on Children's Health and the Environment. WHO, Myriad Editions Ltd, 2004.
56
56
LeadLead
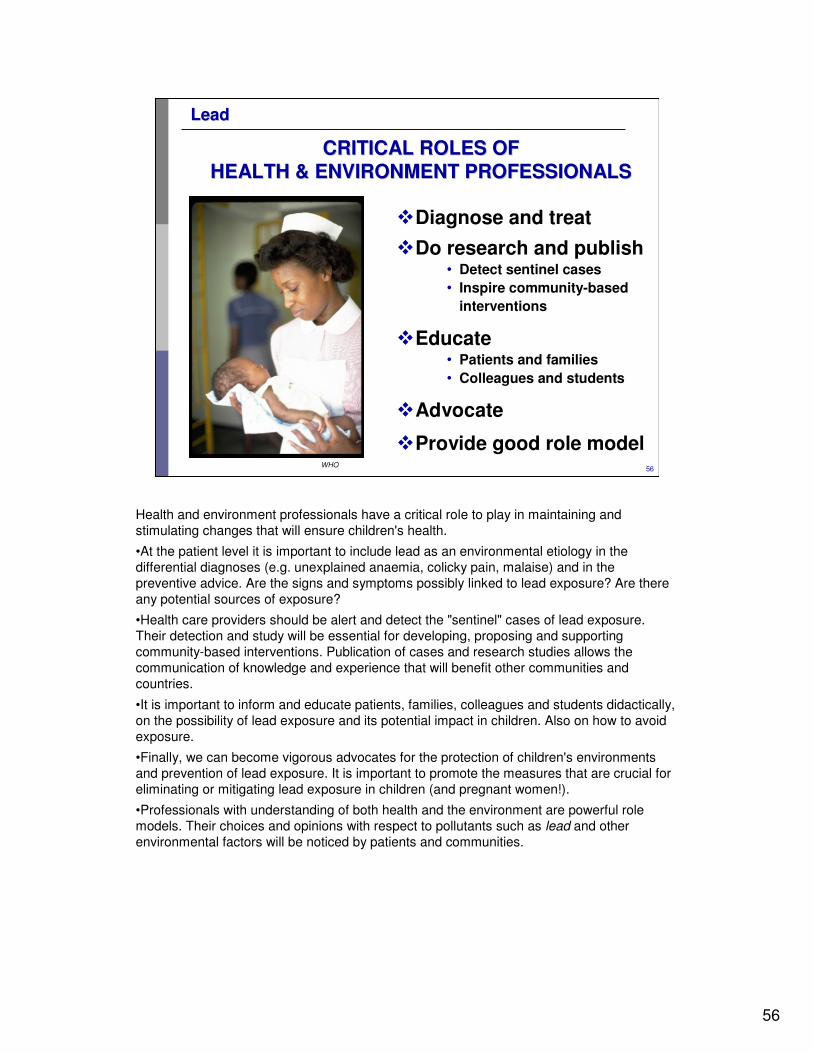
�Diagnose and treat
�Do research and publish• Detect sentinel cases
• Inspire community-based
interventions
�Educate• Patients and families
• Colleagues and students
�Advocate
�Provide good role model
CRITICAL ROLES OFCRITICAL ROLES OF
HEALTH & ENVIRONMENT PROFESSIONALSHEALTH & ENVIRONMENT PROFESSIONALS
WHO
Health and environment professionals have a critical role to play in maintaining and stimulating changes that will ensure children's health.
•At the patient level it is important to include lead as an environmental etiology in the differential diagnoses (e.g. unexplained anaemia, colicky pain, malaise) and in the preventive advice. Are the signs and symptoms possibly linked to lead exposure? Are there any potential sources of exposure?
•Health care providers should be alert and detect the "sentinel" cases of lead exposure. Their detection and study will be essential for developing, proposing and supporting community-based interventions. Publication of cases and research studies allows the communication of knowledge and experience that will benefit other communities and countries.
•It is important to inform and educate patients, families, colleagues and students didactically, on the possibility of lead exposure and its potential impact in children. Also on how to avoid exposure.
•Finally, we can become vigorous advocates for the protection of children's environments and prevention of lead exposure. It is important to promote the measures that are crucial for eliminating or mitigating lead exposure in children (and pregnant women!).
•Professionals with understanding of both health and the environment are powerful role models. Their choices and opinions with respect to pollutants such as lead and other environmental factors will be noticed by patients and communities.
57
57
LeadLead
POINTS FOR DISCUSSIONPOINTS FOR DISCUSSION
<<NOTE TO USER: Add points for discussion according to the needs of your audience.>>
58
58
LeadLead
First draft prepared by Yona Amitai MD MPH (Israel)
With the advice of the Working Group on Training Package for the Health Sector: Cristina Alonzo MD (Uruguay); Yona Amitai MD MPH (Israel); Stephan Boese-O’Reilly MD MPH (Germany); Irena Buka MD (Canada); Lilian Corra MD (Argentina), Ruth A. Etzel MD PhD (USA); Amalia Laborde MD (Uruguay); Ligia Fruchtengarten MD (Brazil); Leda Nemer TO (WHO/EURO); R. Romizzi MD (ISDE, Italy); S. Borgo MD (ISDE, Italy)
Reviewers: D. Beltramino MD (Argentina); S. Boese O'Reilly MD MPH (Germany); I. Buka MD (Canada); Ruth A. Etzel, MD, PhD (USA)
Update July 2008WHO CEH Training Project Coordination: Jenny Pronczuk MDMedical Consultant: Katherine M. Shea MD MPH USATechnical Assistance: Marie-Noel Bruné MSc
ACKNOWLEDGEMENTSACKNOWLEDGEMENTS
WHO is grateful to the US EPA Office of ChildrenWHO is grateful to the US EPA Office of Children’’s Health Protection for the s Health Protection for the financial support that made this project possible and for some ofinancial support that made this project possible and for some of the data, f the data,
graphics and text used in preparing these materials.graphics and text used in preparing these materials.
59
59
LeadLead
DISCLAIMERDISCLAIMER• The designations employed and the presentation of the material in this publication do not imply
the expression of any opinion whatsoever on the part of the World Health Organization concerning the legal status of any country, territory, city or area or of its authorities, or concerning the delimitation of its frontiers or boundaries. Dotted lines on maps represent approximate border lines for which there may not yet be full agreement.
• The mention of specific companies or of certain manufacturers’ products does not imply that they are endorsed or recommended by the World Health Organization in preference to others of a similar nature that are not mentioned. Errors and omissions excepted, the names of proprietary products are distinguished by initial capital letters.
• The opinions and conclusions expressed do not necessarily represent the official position of the World Health Organization.
• This publication is being distributed without warranty of any kind, either express or implied. In no event shall the World Health Organization be liable for damages, including any general, special, incidental, or consequential damages, arising out of the use of this publication
• The contents of this training module are based upon references available in the published literature as of the last update. Users are encouraged to search standard medical databases for updates in the science for issues of particular interest or sensitivity in their regions and areas of specific concern.
• If users of this training module should find it necessary to make any modifications (abridgement, addition or deletion) to the presentation, the adaptor shall be responsible for all modifications made. The World Health Organization disclaims all responsibility for adaptations made by others. All modifications shall be clearly distinguished from the original WHO material.


![1 TRAINING FOR HEALTH CARE PROVIDERS [Date …Place …Event…Sponsor…Organizer] LEAD Children's Health and the Environment WHO Training Package for the Health.](https://static.fdocuments.us/doc/165x107/56649cdc5503460f949a72c8/1-training-for-health-care-providers-date-place-eventsponsororganizer.jpg)