LEACHING METHODS FOR SOIL, SLUDGE AND … · 6 HORIZONTAL - 23 SUMMARY This desk study on LEACHING...
76
February 2004 HORIZONTAL - 23 LEACHING METHODS FOR SOIL, SLUDGE AND TREATED BIOWASTE H.A. van der Sloot, R.N.J. Comans, J.C.L. Meeussen and J.J. Dijkstra ECN Environmental Risk Assessment Final report
Transcript of LEACHING METHODS FOR SOIL, SLUDGE AND … · 6 HORIZONTAL - 23 SUMMARY This desk study on LEACHING...

February 2004
HORIZONTAL - 23
LEACHING METHODS FOR SOIL, SLUDGE AND TREATED BIOWASTE
H.A. van der Sloot, R.N.J. Comans, J.C.L. Meeussen and J.J. Dijkstra
ECN Environmental Risk Assessment
Final report


HORIZONTAL - 23 3
Acknowledgement This work has been carried out with financial support from the following EU Member States: UK, Germany, France, Italy, Spain, Nordic countries, Netherlands, Denmark, Austria, EU DG XI and JRC, Ispra. Following an unprecedented consultation among national standsardisation bodies (NSB’s), CEN and ISO TC’s covering the fields of sludge , soil, biowaste, waste and soil improvers, the comments have been addressed in the modified final text.
A significant part of this work is derived from work carried out before in EU projects related to Harmonisation of Leaching/Extraction tests (SMT4-CT96-2066 and SMT4-CT97-7512) and has in part been published in Harmonization of leaching/extraction tests. Studies in Environmental Science, Volume 70. Eds H.A. van der Sloot, L. Heasman, Ph Quevauviller, Elsevier Science, Amsterdam, 292 pp, 1997 and in Methodologies for Soil and sediment fractionation studies. Ed. P. Quevauviller. Chapter 7. H.A. van der Sloot Harmonisation of leaching/extraction procedures for sludge, compost, soil and sediment analyses. Royal Society of Chemistry.2002. pg 142-170.
.

4 HORIZONTAL - 23
CONTENTS
SUMMARY 6 1. INTRODUCTION 7 2. LEACHING VERSUS TOTAL COMPOSITION 9 3. SCENARIO APPROACH VERSUS LIMITED APPROACHES OF ASSESSMENT 15 3.1 Limitations of simple test procedures 15 3.2 Key questions in the leaching of soil, sludge and treated biowaste 16 4. CHARACTERISATION OF SOIL, SLUDGE AND BIOWASTE LEACHING 17 4.1 Release controlling factors (e.g. pH, organic matter, redox potential) 17 4.1.1 pH and redox 17 4.1.2 Organic matter characteristics 18 4.2 Leaching as a function of time 19 4.3 Surface area related release 20 5. HIERARCHY IN TESTING AND DEVELOPMENT OF A FRAMEWORK FOR
JUDGEMENT OF QUALITY 22 5.1 Characterisation of leaching behaviour 22 5.2 Comparison of test methods 23 5.3 Comparison of sewage sludge amended soils and sewage sludge 25 5.4 Quality control system 27 5.5 Judgement of test results and regulatory developments. 28 6. MODELLING OF CHEMICAL SPECIATION AND CONTAMINANT RELEASE 28 6.1 Geochemical modeling 28 6.2 Prediction of release under different exposure conditions 33 7. CONCLUSIONS ON TESTING RESULTS AND DATA INTERPRETATION
POTENTIAL 33 8. EXISTING STANDARDS AND DRAFT STANDARDS 34 8.1 Issues in relation to horizontal standardisation 34 8.2 Available CEN and ISO Standards 35 9. EVALUATION OF DRAFTING (A) HORIZONTAL STANDARD(S) FOR
LEACHING 35 10. CRITICAL POINTS AND RECOMMENDATIONS TO CEN 38 REFERENCES 40 ANNEX I - TOTAL COMPOSITION ANALYSIS PLACED IN PERSPECTIVE TO LEACHING (LINEAR SCALE) 47
HORIZONTAL - 23 5
Abbreviations CEN – European standardization organization CGLT – Compacted granular leach test ISO – International Standardization Organization DIN – German standardization organization AFNOR – French standardization organization NEN – Dutch standardization organization EN – European standard ENV - European experimental standard TC – Technical Committee WG – Working group L/S – liquid to solid ratio (litre/kg) DOC - dissolved organic carbon TOC - total organic carbon LOI - loss on ignition EPTOX - Environmental Protection Agency Toxicity test (USA) NICCA – Non-Ideal Consistent Competitive Adsorption.
6 HORIZONTAL - 23
SUMMARY
This desk study on LEACHING METHODS FOR SOIL, SLUDGE AND TREATED BIOWASTE has been carried out in the framework of project HORIZONTAL. It focuses on the possible development of horizontal standards on leaching of sludge, soil and biowaste. The results obtained in EU funded projects on Harmonisation of Leaching/Extraction Tests, in which leaching test methods on a wide range of matrices have been compared, have demonstrated the potential for adopting horizontal standards for characterisation leaching tests. The methods developed for waste are sufficiently generic to be applicable to sludge, soil and biowaste, as has been demonstrated in the afore mentioned EU project. The methods to be considered are a pH dependent leaching test, a percolation test and batch leaching tests for compliance purposes. In particular, the pH dependence leaching test has been identified as a tool that can be used as a basis of reference for a wide range of single step extraction methods and sequential chemical extractions used in soil and sediment studies. Recently developed geochemical modelling tools allow a quantification of the chemical speciation of contaminants in leachates, most notably the important partitioning between free and dissolved organic carbon (DOC)-bound metal in solution as a function of pH or liquid/solid ratio (percolation test). In addition, the pH dependence leaching test provides a good indication of total dissolved concentrations in pH domains relevant for plant uptake and inhalation/ingestion (bioavailability). From a comparison of (pseudo) total content and the (generally limited) metal leachability from soil, sludge and biowaste, the use of total composition for regulatory measures to protect the environment can be questioned. Rather than judging sewage sludge or biowaste on their total metal content, the leaching properties of the specific utilisation scenario, i.e. soil-sludge or soil-biowaste mixtures using the intended dosage, should be judged. In view of the wide applicability of the characterisation leaching methods, validation of the horizontal procedures for a wide range of materials is recommended as it will provide a more environmentally relevant and cost effective means of obtaining harmonised, horizontal standards.
HORIZONTAL - 23 7
1. INTRODUCTION
In the framework of the Standards, Measurement & Testing Programme (European Commission), a Network for the Harmonisation of Leaching/Extraction Tests was initiated in 1995 [1]. The background for starting this network was the increased use of leaching test methods in different areas - waste treatment and disposal, incineration of waste, burning of waste fuels, soil clean-up and reuse of cleaned soil, sludge treatment, use of compost from different sources and use of secondary raw materials in construction [2-9]. In the first phase of the Network, a first step has been made towards harmonisation of leaching/extraction tests by bringing together experts and discussing differences and similarities in testing between different fields. The direct results from this activity is a book published in 1997 on “Harmonisation of Leaching/Extraction Tests”[10]. As follow up the project “Technical Work in Support of the Network”(SMT4-CT96-2066) [11,12] and the project “Leaching of Organic contaminants” (SMT4-CT97-2160) [13-14] were initiated. The Network on Harmonisation of Leaching/ Extraction Tests received further support from the European Commission to organise expert meetings on specialised topics - leaching of organic contaminants, modelling of leaching, lab field relationships. In addition, intensive interactions at CEN and ISO level have been taken on to broaden the experience in using more elaborate methods of leaching to assess material behaviour. The revision of the Sewage Sludge Directive [15] (86/278/EEC; draft April 2000) and the Working Document on Biowaste [16] (draft Feb 2001) call for standards on sampling, on hygienic and biological parameters, on methods for inorganic and organic contaminants and for mechanical properties of these materials. When materials cannot be utilised based on current regulations, treatment or disposal becomes important, in which case leaching becomes an issue as stipulated by the Council Directive 1999/31/EC on Landfill of Waste [17 ]. Use of sludge and treated biowaste can lead to release of contaminants towards the groundwater. The prevention of contamination and preservation of the groundwater quality are key element of the European Water Framework Directive [18]. The EC communication COM (2002) 179 “Towards an EU Thematic strategy for Soil protection”[19] identifies the lack of reliable and updated information on the status of the major threats to soils as the major problem. These threats include: erosion, decline in organic matter, salinization, contamination, desertification, compaction, sealing, etc, resulting from a wide range of human activities (e.g. agriculture, construction, disposal, diffuse atmospheric inputs). Regarding soil protection issues, existing soil policies are largely based on total composition of materials. However, leaching/extraction tests may provide a better insight in the mechanisms controlling release of contaminants to the environment. Project HORIZONTAL has been initiated to provide horizontal standards for the topics listed above starting from existing standards developed for the same property in the fields of sludge, soil and treated biowaste or develop standards directly with a wider field of application. In relation to leaching, important standardisation work has primarily been carried out in the field of waste (in support of the EU Directive on Landfill of Waste [17] (1999/31/EC)), the characterisation leaching tests are as relevant for other materials, as construction materials and “organic” materials such as sludge, soil and biowaste. These latter materials have a common characteristic – namely the role of particulate organic matter and dissolved organic matter (DOC), which is has proven to be a key factor in the transfer of both inorganic and organic contaminants to the water phase (uptake in plants and soil organims) and subsequent transport to soil and groundwater. In addition, organic matter plays an important role in the speciation and bioavailability of contaminants in these materials. In this desk study on leaching of soil, sludge and treated biowaste, the methods are placed in a wider context of soil quality issues, of impact to groundwater and soil functions. Besides an evaluation of the potential for developing horizontal standards, a scenario approach and framework for judgement of soil, sludge and biowaste use is discussed, in which the subsequent methods are placed that fulfil a specific

8 HORIZONTAL - 23
function in the overall evaluation process. The issue of “total” composition versus characterisation by leaching for soil quality issues is discussed. Relevant aspects of leaching are addressed, such as characterisation of leaching behaviour, comparison of existing test methods, modelling of chemical speciation and modelling release, prediction of release under different exposure conditions, examples of systematic leaching behaviour of sludge, soil and biowaste, judgement of test results, hierarchy in testing, quality control issues, and regulatory developments. Finally draft horizontal standards for judgement of sludge, soil and biowaste by leaching are discussed and recommendations to CEN formulated.

HORIZONTAL - 23 9
2. LEACHING VERSUS TOTAL COMPOSITION
In many regulations, particularly in the field of sludge, compost, soil and sediments, total composition or a partial dissolution is often used as basis of reference. From an impact and long-term environmental behaviour point of view also for these matrices, an approach based on leaching might be more suitable. It is argued that degradation of organic matter leads to mineralization and subsequently a different uptake by plants and organisms. Using total composition would therefore provide better safety measure than leaching. The underlying misconception is that metals, if freed by degradation of organic matter are 100 % available for uptake, whereas in reality metals are immediately re-speciated over available active surfaces (aluminumoxide, ironoxide and particulate non-degradable organic matter). This aspect of metal distribution over available sorbing phases is addressed in section 6. In a meeting organised in relation to the preparation of the network Harmonisation of Leaching/Extraction Tests held in Maastricht in 1997 the issue of total composition versus leaching was addressed [20]. It was stated that different levels could be distinguished, which each have their own role in the overall assessment:
- total composition or "partial" total - available or potentially leachable and - actual leaching under specified conditions.
In figure 1 a graphical presentation is given of the different levels of release. Dependent on the constituent of interest, significant differences may exist between the three levels. In this case, total composition is compared with potential leachability and release as a function of pH and as a function of liquid to solid ratio (L/S in l/kg) as obtained from a percolation test. The results obtained as a function of L/S can be related to a time scale. Percolation-controlled release occurs when water flows through a layer of material with a low infiltration rate and thus low liquid to solid ratio, in which case local equilibrium at field pH is assumed to exist. The information required to estimate constituent release during this scenario is the field geometry, the field density, the anticipated infiltration rate, the anticipated field pH, the anticipated site-specific liquid to solid ratio, and the constituent solubility at the anticipated field pH. The anticipated site-specific liquid to solid (L/S) ratio represents the cumulative liquid to solid ratio that can be expected to contact the material layer over the estimated time period. It is based on the infiltration rate, the contact time, the bulk density and the application geometry and can be determined according to Hjelmar [21] and Kosson et al.[22]:
Ht (inf)
1000 LSFill
yearSite ×
××=
ρ
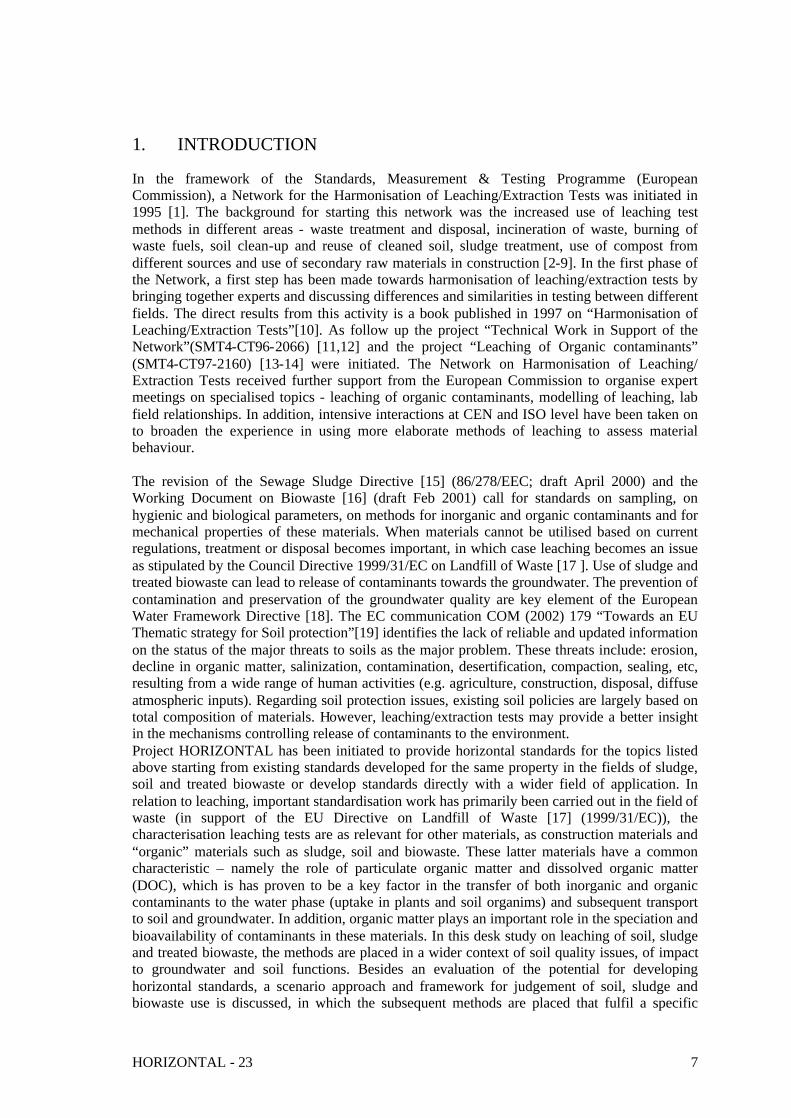
where, anticipated site-specific liquid to solid ratio [L/kg]; anticipated infiltration rate [cm/year]; estimated time period [year]; material density [kg/m3]; and, material depth [m]. Over an interval of 100 years or longer, L/S values greater than 10 may be obtained for cases that have relatively high rates of infiltration or limited placement depth. An illustration of the factors controlling release in different matrices is given in figure 2. This schematic behaviour is generally applicable to different matrices. It is clear that as a function of pH order of magnitude differences in actual leachability can occur. In case of normal soil pH, which ranges from 5 to 7, one or several orders of difference in actual leaching may occur

10 HORIZONTAL - 23
depending on the element under consideration.
Figure 1 Relationship between total, potentially leachable and actual leaching from
“granular” materials. Left: pH-dependence test. Right: percolation test.
P b0.01
0.1
1
10
100
1000
10000
100000
3 5 7 9 11 13pH
Con
cent
ratio
n (m
g/kg
)
Pb Slag
TOTAL
POTENTIALLY LEACHABLE
ACTUAL
Column pH range
pH Dependence leaching test
P b
0.01
0.1
1
10
100
1000
10000
100000
0.1 1 10L/S (l/kg)
Cum
ulat
ive
rele
ase
(mg/
kg)
Solubility control
TOTAL
POTENTIALLY LEACHABLE
ACTUAL
Percolation test
HORIZONTAL - 23 11
Figure 2 Factors controlling release from a material as a function of pH [10]. There are various extraction methods for analysis of total elemental composition of soils, sludges, sediments and biowastes. They may vary from true totals using complete dissolution of the solid matrix to methods assessing a “partial” total leaving a residual fraction unaffected. Several of these methods have been developed and described. Alternative destruction methods are and may be developed in the future to provide a quicker or easier dissolution of the matrix with less chemical consumption. Due to inherent limitations of extraction fluids as opposed to instrumental analysis methods, the “partial” composition methods, as well as the true total methods for that matter, will be adequate for some elements and may have limitations for other elements. The key question in relation to judging the suitability of a specific method for a particular purpose is what type of information the method should provide. Whether it is acceptable to apply only one or more specific methods for problems with specific elements. This all has to be weighed against the repeatability of a given method. If the between laboratory variability for different digestion methods can not really be distinguished from the variability between laboratories for one digestion method, then the question arises if it is justified to specify more than one method. Another aspect is to identify the purpose of the method. If it is developed to assess the environmental properties of a material in relation to exposure of humans or the ecosystem to elevated concentrations of undesirable constituents, then the key question is whether the composition analysis is the proper assessment tool, considering that the composition is in no way related to the release of substances from soil, sludge or biowaste under any given set of
12 HORIZONTAL - 23
environmental exposure conditions. In that case, the release of contaminants or bioavailability of constituents is a more appropriate measure. To put the latter aspect in a context for discussion, data on total and partial destruction methods applied to soil, sediment, compost and sewage sludge (from the EU project on Harmonization of Leaching/extraction tests [11,12]) have been plotted in linear and log scale relative to leaching as a function of pH. This has been done for a range of metals, oxyanions, major and minor components. The latter are not relevant from a regulatory point of view, but certainly provide some insight in the relationship between total, partial and leaching. The relevant pH range for normal practice can be considered to range from around pH 4 (acidic conditions, plant generated environments) to pH 8. In figures 3 to 6 examples have been selected for each matrix. In all figures, leaching as a function of imposed pH is presented together with data obtained from four extraction methods used for “total” composition [23,24,25,26], availability as obtained with NEN 7341 [27] and actual leaching as obtained by a pH dependence leaching test (PrEn 14429 [28]). All figures are given with the y-axis in linear and log-scale. In Annex I, data on the elements As, B, Ba, Ca, Cd, Cr, Cu, Fe, Mg, Mn, Mo, Ni, Pb, Si, V, Zn and TOC for the matrices soil, sediment, sludge and biowaste (compost) are given. Sample codes are:
CSO2 Heavily sewage sludge amended soil, Hagen, Germany MAL Contaminated harbour sediment (Rhine, Arnhem The Netherlands) CW5 Compost from source separated organic matter from MSW (JRC, Ispra, Italy) RWZS Sewage sludge from a rural facility (Alkmaar, The Netherlands)
The variability in composition of several constituents is relatively small even for different destruction methods when judged in the broader context of environmental effects. There are some typical elements that are very sensitive to certain extractants. Obviously Si is very responsive to HF digestion. Because of their partial incorporation in the Si matrix, V and Cr may vary with the extent to which Si is dissolved by a specific “partial” method. As is more variable due to its specific chemistry (difference for nitric, sulfate or Cl based extractants). By comparing the total, partial, potentially leachable and leaching with water at controlled pH, it is clear that from an environmental impact evaluation perspective the total composition is hardly relevant, as several orders of magnitude difference may exist between the total composition and the leachable fraction in the relevant pH range for the materials. From this perspective, the choice of the partial destruction method may be less critical than deciding what information is really important from an environmental impact evaluation perspective. At a given total content (so judged as being the same based on total content), the leachability may vary significantly from one sample to another, which would imply that the judgement of environmental impact would be different. Therefore, it is important to adopt and/or develop leaching methods for the proper assessment of the questions relevant for the matrices sludge, compost, soil and sediment.

HORIZONTAL - 23 13
0.01
0.1
1
10
100
1 3 5 7 9 11 13pH
[Cd]
(mg/
kg)
CSO2:1:4:1SCE1SCE2Aqua RegiaHNO3 Bomb95%HNO3/5%HCLO4Aqua Regia/HF/ Boric acid MicrowaveNEN 7341 AVAIL
Own pH
Sewage sludge amended soil CSO2
0
10
20
30
40
50
60
70
80
90
1 3 5 7 9 11 13pH
[Cd]
(mg/
kg)
CSO2:1:4:1SCE1SCE2Aqua RegiaHNO3 Bomb95%HNO3/5%HCLO4Aqua Regia/HF/ Boric acid MicrowaveNEN 7341 AVAIL
Own pH
Cd
Figure 3. Comparison of "total" composition methods with availability and actual leaching for Cd in heavily sewage sludge amended soil as a function of pH on a log (left) and a linear (right) scale.
0.1
1
10
100
2 4 6 8 10 12
pH
[V] (
mg/
kg)
CW5:1:1:1Aqua RegiaHNO3 Bomb95%HNO3/5%HCLO4Aqua Regia/HF/ Boric acid MicrowaveNEN 7341 AVAIL
Own pH
Compost CW5
0
5
10
15
20
25
30
35
40
45
2 4 6 8 10 12
pH
[V] (
mg/
kg)
CW5:1:1:1Aqua RegiaHNO3 Bomb95%HNO3/5%HCLO4Aqua Regia/HF/ Boric acid MicrowaveNEN 7341 AVAIL
Ow n pH
V
Figure 4. Comparison of "total" composition methods with availability and actual leaching for V in compost prepared from source separated MSW as a function of pH on a log (left) and a linear (right) scale.

14 HORIZONTAL - 23
0.01
0.1
1
10
100
1000
2 4 6 8 10 12pH
[Cu]
(mg/
kg)
RWZS:1:1:1Aqua RegiaHNO3 Bomb95%HNO3/5%HCLO4Aqua Regia/HF/ Boric acid MicrowaveNEN 7341 AVAIL
Own pH
Sewage sludge RWZS
050
100
150
200250
300
350400
450
500
2 4 6 8 10 12pH
[Cu]
(mg/
kg)
RWZS:1:1:1Aqua RegiaHNO3 Bomb95%HNO3/5%HCLO4Aqua Regia/HF/ Boric acid MicrowaveNEN 7341 AVAIL
Own pH
Cu
Figure 5. Comparison of "total" composition methods with availability and actual leaching for Cu in sewage sludge from rural origin as a function of pH on a log (left) and a linear (right) scale.
Figure 6. Comparison of "total" composition methods with availability and actual leaching for Si in heavily contaminated river sediment as a function of pH on a log (left) and a linear (right) scale.
10
100
1000
10000
100000
1000000
1 3 5 7 9 11 13pH
[Si]
(mg/
kg)
MAL:1:1:1MAL:1:11:1SCE2SCE1pHstatAqua RegiaHNO3 Bomb95%HNO3/5%HCLO4Aqua Regia/HF/ Boric acid MicrowaveNEN 7341 AVAIL
Ow n pH
River sediment MAL
0
20000
40000
60000
80000
100000
120000
140000
160000
180000
200000
1 3 5 7 9 11 13pH
[Si]
(mg/
kg)
MAL:1:1:1MAL:1:11:1SCE2SCE1pHstatAqua RegiaHNO3 Bomb95%HNO3/5%HCLO4Aqua Regia/HF/ Boric acid MicrowaveNEN 7341 AVAIL
Own pH
Si

HORIZONTAL - 23 15
3. SCENARIO APPROACH VERSUS LIMITED APPROACHES OF ASSESSMENT
3.1 Limitations of simple test procedures Recent developments in environmental impact assessment focus on short and long term release from materials taking as much as possible material behaviour and external influences on release under realistic field conditions into account [29-34]. The total composition is no longer a suitable parameter, as in many cases, this will lead to a non-realistic overestimate of environmental impact. In instances where leaching has been applied as a basis for regulatory control, simple methods [35-37] have frequently been promoted that address only a very limited scenario. The EPTOX, later developed into the TCLP test [35], focussed on a co-disposal scenario of waste with municipal solid waste is an example of such a limited approach. The primary development of DIN 38414 S4 (DEVS4) [36] was focussed on the release from sediments, which by the nature of the materials tested was focussed at leaching at neutral pH values. In both cases the tests were applied beyond their original context and used for totally different purposes. The TCLP has been applied in a general manner to test waste for disposal, in which the test was disconnected from its primary aim. This has led to unjustified acceptance of wastes for disposal in monofill situations [38]. In case of the DEV S4, alkaline material may show leaching behaviour, which would lead to unjust acceptance or rejection under conditions where the material undergoes significant changes in leaching properties after carbonation. There are many extraction methods for soil [39-43], however, few of them have been formally standardised (EN14870, [44]). Many extraction methods for soil suffer from the fact that generally pH is not a mandatory parameter. In addition, some methods are applied on dried soil, which does nor reflect actual behaviour under field conditions. Soil test can be grouped in tests aiming at availability (DTPA, EDTA, HAc) and test focussed at actual conditions (CaCl2, NaNO3, NH4NO3). For sediments [45] and more recently soils [46] sequential chemical extraction methods have been developed to address chemical speciation issues and association with specific mineral phases, such as carbonate fraction, organic matter fraction, ironoxide fraction. However, the complex extraction mixtures applied cannot be linked uniquely to these phases. This leads often to rather imprecise descriptions. The “misuses” of regulatory tests are a result of their design for a narrower scope and the wish for simplicity. The increased understanding of the complexity of factors playing a role in assessing long-term behaviour of materials has led to the development and standardisation of tests that reflect more closely the behaviour in practice. When release under realistic conditions is the main basis for assessment, then the emphasis will shift to the development of methods that provide information on mechanistic aspects of leaching. In CEN/TC 292 Characterisation of waste, this has led to development of a guideline ENV 12920 [47], in which waste specific properties and scenario conditions are taken into account. The methodology contains several steps, some of which are using chemical, biological, physical and leaching test methods. A selection of tests is to be made depending on the question(s) to be answered, the material under consideration and the scenario to be evaluated. Consequently, the tests developed in CEN TC 292 comprise a percolation test [48], a pH dependence leaching test [28,49] and, recently, a dynamic method for release from monolithic materials [50]. In the context of the development of criteria and methods as specified in Annex II of the EU landfill Directive [17], this scenario approach has shown very promising possibilities [31]. The tests developed in CEN TC 292 are based on a hierarchy in testing – characterisation (understanding of processes and controls), compliance (verification against criteria) and on-site verification (production control). This approach is equally applicable to other fields outside the waste area. Therefore, a similar basis of testing and the using of a scenario type of approach is suggested for the fields of sludge, compost, soil and sediment evaluation as well. The proper question to be asked is what information a test should provide and how the results will ultimately be used in a regulatory framework and in the context of daily control. The need for a straight-forward and rapid compliance test for quality control is recognised and addressed in close relationship with characterisation tests.
16 HORIZONTAL - 23
3.2 Key questions in the leaching of soil, sludge and treated biowaste A range of questions can be asked in relation to sludge amendment, compost application, (contaminated) soil use, incineration of biowaste and disposal of all of these materials in case the quality is not acceptable for normal utilisation. For example:
• How can a limit for repeated application of sewage sludge or compost be derived based on accumulation of contaminants in soil?
• What method will provide a good measure for contaminant uptake in plants? • How to assess the long-term release from contaminated soil in-situ? • What is the release of contaminants from sediments undisturbed at the bottom of a
waterway, when applied on land or disposed off? In the latter case, the main material properties do not change dramatically, but the exposure conditions of the same material are changing very significantly.
• Are different tests needed for these different exposure conditions or can the same test be used to assess different conditions?
• How to evaluate treatment methods to improve the environmental quality of sludge, compost, soil or sediments?
A specific treatment may improve the leaching behaviour of a material, but it may not affect the total composition at all, which would lead to non-acceptance of such treatment in case a regulation based on total composition is applied. All of these questions require an evaluation of factors influencing the release of constituents and the main release mechanisms involved. The test methods, which are currently being standardized [28,48-50], provide such answers. In the framework of the Network Harmonisation of Leaching Extraction Tests, the importance of pH, redox potential and inorganic and organic complexants such as dissolved organic matter have been identified [10,11,12]. As will be discussed below, the main release-controlling factors for the materials discussed in the context of this study are the role of particulate and dissolved organic matter (DOC) and pH. Redox changes may be relevant in a number of specific conditions where degradation is taking place in confined conditions (e.g. landfill, storage pile). In relation to different types of judgement for the same material, the pH dependence test provides a basis as illustrated in figure 7. The leaching characteristic for Cd from this heavily sewage sludge amended soil illustrates the Cd leachability under a range of different exposure conditions, which may be relevant for the material. In case of inhalation/ingestion, the low pH domain is the most relevant condition to judge possible uptake. When exposed to acidic conditions, for instance by an overlying soil with a more acidic character, the leachability is very sensitive to small pH changes. The effects of treatments such as liming or cement stabilisation (applied to reduce release) can be derived from the pH dependence test data. Cement stabilisation is not favourable for Cd due to the induced mobilisation of DOC with increasing pH, which can facilitate the mobilisation of Cd as illustrated by the pH dependence test data in the pH range pH > 9. The user of the test data should be aware of the order of magnitude changes as a result of changes in the pH are important to be realised. For sludge soil and biowaste, the pH conditions normally encountered fall in a narrower range. The understanding of chemical speciation and controlling factors that results from evaluating a wider pH range provides a significantly improved understanding, which is almost impossible to from narrow focussed studies. The fact that in soil extraction studies often pH is not reported forms a serious limitation in comparing data obtained by different extraction methods [40-44]. Sometimes pH buffering is applied, which also jeopardizes a proper assessment. Given the illustrated effect of pH on contaminant leaching (Fig. 7), it is an absolute requirement to report
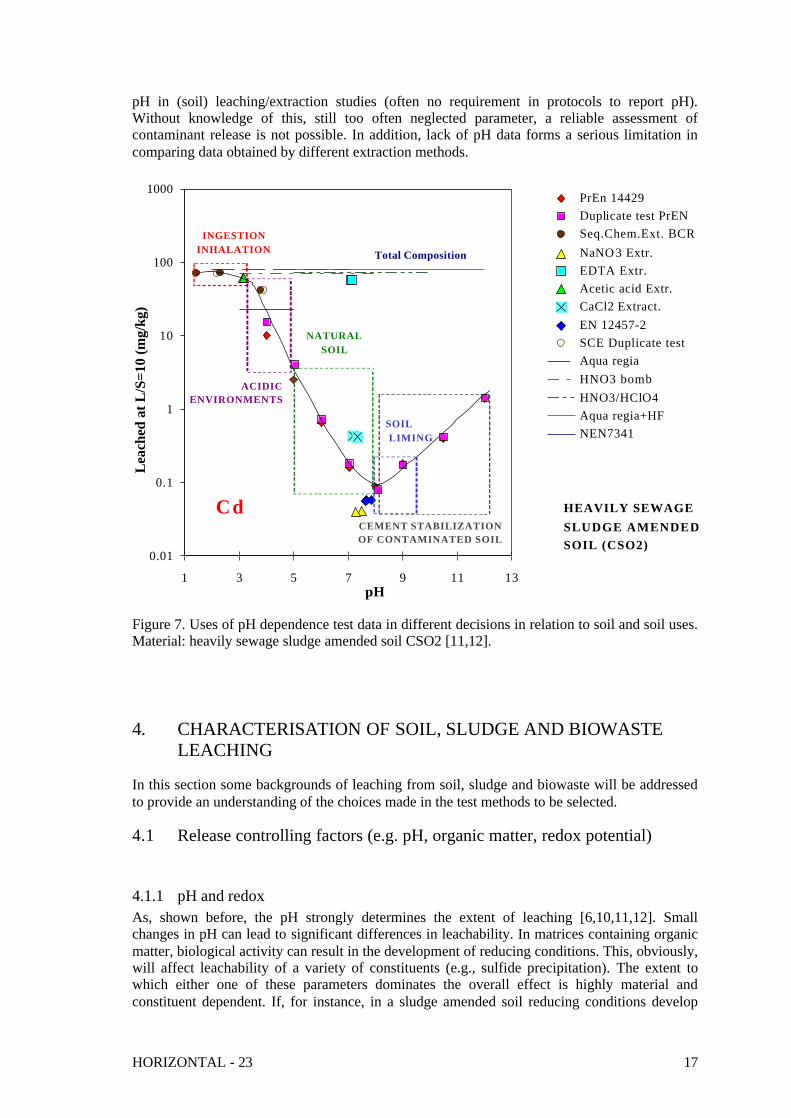
HORIZONTAL - 23 17
pH in (soil) leaching/extraction studies (often no requirement in protocols to report pH). Without knowledge of this, still too often neglected parameter, a reliable assessment of contaminant release is not possible. In addition, lack of pH data forms a serious limitation in comparing data obtained by different extraction methods.
Figure 7. Uses of pH dependence test data in different decisions in relation to soil and soil uses. Material: heavily sewage sludge amended soil CSO2 [11,12].
4. CHARACTERISATION OF SOIL, SLUDGE AND BIOWASTE LEACHING
In this section some backgrounds of leaching from soil, sludge and biowaste will be addressed to provide an understanding of the choices made in the test methods to be selected.
4.1 Release controlling factors (e.g. pH, organic matter, redox potential)
4.1.1 pH and redox As, shown before, the pH strongly determines the extent of leaching [6,10,11,12]. Small changes in pH can lead to significant differences in leachability. In matrices containing organic matter, biological activity can result in the development of reducing conditions. This, obviously, will affect leachability of a variety of constituents (e.g., sulfide precipitation). The extent to which either one of these parameters dominates the overall effect is highly material and constituent dependent. If, for instance, in a sludge amended soil reducing conditions develop
0.01
0.1
1
10
100
1000
1 3 5 7 9 11 13pH
Lea
ched
at L
/S=1
0 (m
g/kg
)
PrEn 14429Duplicate test PrENSeq.Chem.Ext. BCRNaNO3 Extr.EDTA Extr.Acetic acid Extr.CaCl2 Extract.EN 12457-2SCE Duplicate testAqua regiaHNO3 bombHNO3/HClO4Aqua regia+HFNEN7341
Cd
INGESTIONINHALATION
CEMENT STABILIZATION OF CONTAMINATED SOIL
NATURAL SOIL
ACIDIC ENVIRONMENTS
SOIL LIMING
Total Composition
HEAVILY SEWAGE SLUDGE AMENDED SOIL (CSO2)
18 HORIZONTAL - 23
during a percolation test, then that test reflects the conditions occurring for that particular material. Since redox potential is not a mandatory parameter, as yet, it may be hoped that the lab technician has the foresight to measure the redox potential in the eluates. A suitable approach to address reducing versus oxidised conditions of a material is to test the material under both extremes (imposed oxidation of a reducing material and imposed reducing conditions on a n oxidised material that under given conditions may turn anoxic.
4.1.2 Organic matter characteristics In matrices that contain organic matter, both particulate organic matter and dissolved organic matter play a key role in the potential for either mobilisation or sorption of constituents. Organic matter has an important but not an unambiguous influence on the concentration, availability and transport of metal ions in the environment. On the one hand organic matter lowers the metal concentration by its strong affinity while at the other hand it enhances the total concentration of soluble metals, when a fraction of the organic matter is dissolved in water (DOC). It is the soluble fraction of the organic matter (DOC) that can lead to a high mobility of the metal ions while the metal ion activity is low to very low in solution. Characteristic for natural organic matter is the high heterogeneity of its affinity for ions and its complex composition. As organic matter plays an important role for many constituents, it is important to know more about the behaviour of organic matter in leaching. For instance, the degradability of the organic matter in sludge, compost, soil or sediment is an important aspect that determines to what extent DOC may be formed (see desk study 7 on “stability”). The nature of the DOC is also very dependent on the status of degradation. In the initial phases of degradation of organic matter rich materials (e.g sewage sludge and compost), low molecular weight organic acids and sugars are formed. After extended degradation, fulvic and humic substances are generated with significantly different properties in terms of metal interaction. Hence the nature of the DOC will differ between matrices containing organic matter both in level and in type. Clearly, this important subdivision of DOC implies that generic parameters such as loss on ignition (LOI) and total organic carbon analysed in the solid (TOC) are not sufficiently discriminating in identifying truly degradable organic matter [51,52]. Pure carbon and plastics are partially included in a TOC analysis. The analysis of DOC (= TOC in water) is considered to be more discriminating, as the DOC measured at different pH values can also discriminate between types of DOC. At neutral pH, only low molecular weight DOC can be mobilised. At high pH, high molecular weight organic matter, such as humic substances are mobilised. Particularly, the latter can act as carrier for both metals and organic contaminants. In the framework of the technical work in support of the Network Harmonisation Leaching/Extraction tests [11,12], DOC leachability as a function of pH has been measured for materials with different levels of organic matter. In figure 8 the DOC concentration as a function of pH for natural soil, contaminated soil, sewage sludge, compost and sediment is given. It shows that sewage sludge is still a highly reactive material with a very high DOC level even at neutral pH. In natural soil and also in mildly contaminated soil degradation has been active for a long time and a level of residual degradation is observed in which only limited amounts of low molecular materials are formed. This is an indication of the level of degradation reached. The measurement of DOC at neutral pH has been proposed as a means of assessing the status of degradation of a material [53,54]. Other related properties have recently been suggested [55]. In this case, sewage sludge is more reactive than compost, which in turn is more reactive than soil. Work on the highly degradable fraction of municipal solid waste has shown that the final stage of degradation of organic rich material points at a similarity of DOC leaching with that of natural soil [53]. The emphasis on DOC measurement and its further fractionation [56] is important to be able to quantify effects on metal and organic contaminant mobility. The information on DOC as a function pH in conjunction with information on site densities of particulate and dissolved organic matter provides the basis for modelling such interaction (see section 7.6). The nature of the organic matter from sewage sludge, compost and soil may differ in terms of site densities and nature of sorption sites. This aspect is as yet not sufficiently covered for sewage sludge and compost as data for peat [57] and a range of soils [58,59] are now available.

HORIZONTAL - 23 19
4.2 Leaching as a function of time As indicated in section 3, percolation reflects the time dependent leaching behaviour of a material through the relationship between L/S and time.
Figure 8. Relationships between DOC in a wide range of materials indicating different
stages of degradation of (natural) organic matter. Indications of different nature of DOC released in different pH ranges (SMT4-CT96-2066 [11,12,56]).
In figure 9 the relationship between the pH dependence leaching tests and the percolation leaching test is illustrated for Cr and Cd in the case of heavily sewage sludge amended soil (CSO2). For comparison the total composition is also given by the broken line in the left hand graph. As indicated before the release as function of L/S can be related to a time scale through the infiltration rate, the height and density of the material. The dotted line in the right hand graph indicates solubility control. When the data points start to deviate strongly from this slope 1 (e.g. Cd) and start to approach a slope 0, then depletion of a soluble form is observed. As the chemical environment may be different from on case to another, the behaviour may vary between materials and between constituents.
10
100
1000
10000
100000
2 4 6 8 10 12 14
pH
DO
C (m
g/kg
)
BIOREACTOR INPUT (MSOR)
SEWAGE SLUDGE
PREDOMINANTLY INORGANIC WASTE MIX
BIOREACTORAFTER DEGRADATION
RED
OX
WASHED
10
100
1000
10000
100000
2 4 6 8 10 12 14pH
DO
C (m
g/kg
)
COMPOST CW5
COMPOST CW1
PRESERVED WOOD
SEDIMENT
PREDOMINANTLY INORGANIC WASTE MIX
SOIL B HORIZON
SOILA HORIZON
CONTAMINATED SOIL
SEWAGE SLUDGE

20 HORIZONTAL - 23
Figure 9. Relationship between percolation test and pH dependence test for contaminated soil (CSO2) resulting from excessive sewage sludge amendment (SMT4-CT96-2066) [11,12]. Dotted line in right graph indicates solubility control. Broken line in left graph: Total composition. This information is important to assess long term leaching behaviour and to identify release controlling mechanisms. The pH dependence test provides information on changes in conditions, whereas the release as a function of L/S covers the time dependent aspect.
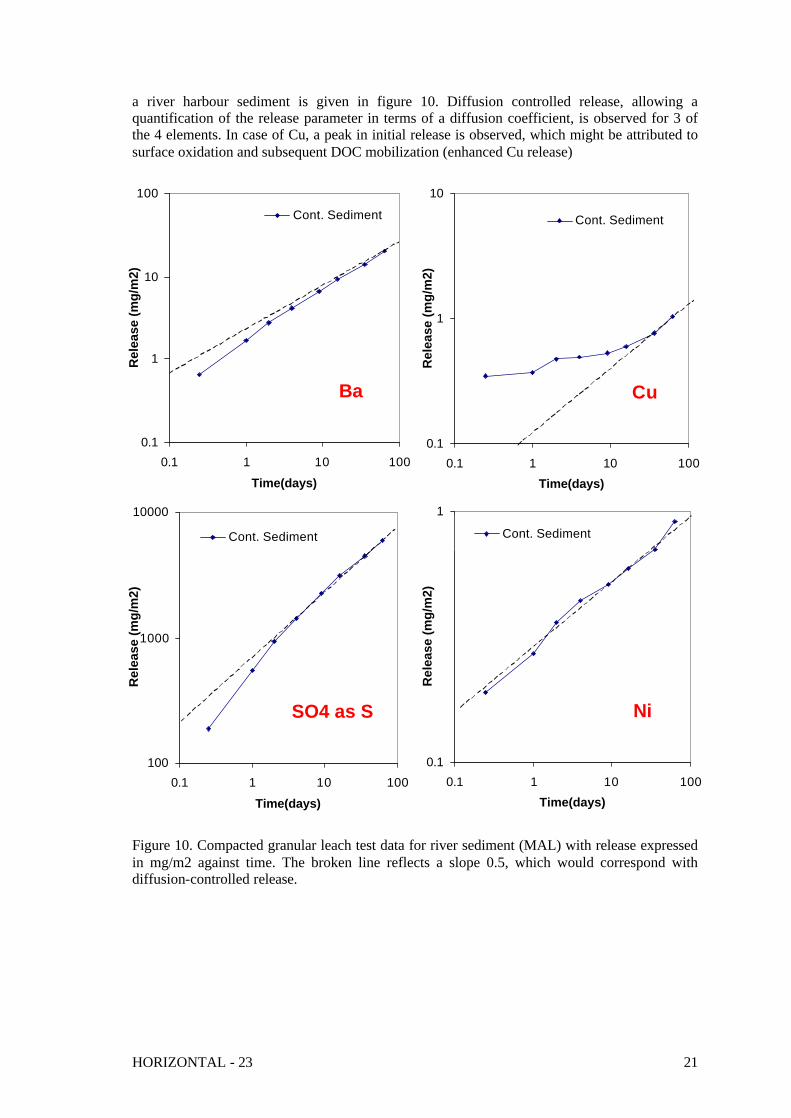
4.3 Surface area related release In some cases, release from a soil material is not at all percolation driven, but rather governed by surface related release phenomena. Such situations occur, when the material under consideration has a much lower permeability than the material surrounding it. A clay lense in a sandy soil would represent such an exposure situation. In that case, a time dependent release process based on percolation is not feasible (clogging of the column) and therefore surface area related release as obtained in a compacted granular leach test (CGLT [43]) is more appropriate. Also a stable sediment layer releasing constituents to the overlying water column would be a scenario that is represented by this type of test. An example of CGLT for Ba, Cu, SO4 and Ni in
0.01
0.1
1
10
100
3 5 7 9 11 13pH
Lea
ched
(mg/
kg)
Cd
L/S=10< 4 mm
Own pH
0.001
0.01
0.1
1
10
100
1000
3 5 7 9 11 13pH
Lea
ched
(mg/
kg)
pH dependence testduplicate test
Total
Cr
Cr0.001
0.01
0.1
1
10
100
1000
0.1 1 10
LS (l/kg)
Lea
ched
(mg/
kg)
Heavily sewage s ludge amended soil
Cd
0.01
0.1
1
10
100
0.1 1 10
LS (l/kg)
Lea
ched
(mg/
kg)
Solubility control
HORIZONTAL - 23 21
a river harbour sediment is given in figure 10. Diffusion controlled release, allowing a quantification of the release parameter in terms of a diffusion coefficient, is observed for 3 of the 4 elements. In case of Cu, a peak in initial release is observed, which might be attributed to surface oxidation and subsequent DOC mobilization (enhanced Cu release)
Figure 10. Compacted granular leach test data for river sediment (MAL) with release expressed in mg/m2 against time. The broken line reflects a slope 0.5, which would correspond with diffusion-controlled release.
0.1
1
10
100
0.1 1 10 100
Time(days)
Rel
ease
(mg/
m2)
Cont. Sediment
Ba
0.1
1
10
0.1 1 10 100Time(days)
Rel
ease
(mg/
m2)
Cont. Sediment
Cu
100
1000
10000
0.1 1 10 100
Time(days)
Rel
ease
(mg/
m2)
Cont. Sediment
SO4 as S
0.1
1
0.1 1 10 100Time(days)
Rel
ease
(mg/
m2)
Cont. Sediment
Ni

22 HORIZONTAL - 23
5. HIERARCHY IN TESTING AND DEVELOPMENT OF A FRAMEWORK FOR JUDGEMENT OF QUALITY
As a result of discussions in CEN/TC 292 a hierarchy of tests was identified, each with their specific function in the entire process of material behaviour evaluation. Tests to characterise materials and their behaviour can generally be divided into three categories: 1) "Basic Characterisation" tests are used to obtain information on the short and long term
leaching behaviour and characteristics properties of materials. Liquid/solid (L/S) ratios, leachant composition, factors controlling leachability such as pH, redox potential, complexing capacity and physical parameters are addressed in these tests. These tests may generally take longer to perform.
2) "Compliance" tests are used to determine whether the material complies with specific reference values. The tests focus on key variables and leaching behaviour identified by basic characterisation tests. These tests are generally carried out within a few days at most.
3) "On-site verification" tests are used as a rapid check to confirm that the material at hand is very much the same as that which has been subjected to the compliance test(s). These types of tests are quick quality checks, which need to be available within minutes up to a few hours at most.
The main reason for developing a system with tests at different levels is a pragmatic one. For understanding, it is not a problem to perform a more detailed test a limited number of times. However, once the understanding of key factors is there, there is no need for the full testing any more and proper selection of most discriminating and practical test condition can be made for regular control purposes. Although this testing philosophy was developed in relation to waste testing, it is equally applicable to construction materials [7,60], preserved wood [9] and sludge and soil judgement [12]. Recently another level of test classification was identified, which has partly been addressed in section 2, namely a distinction between total composition, potentially leachable, solubility controlled and dynamic test data.
5.1 Characterisation of leaching behaviour The types of characterisation tests that provide very useful information to assess sludge, soil and biowaste leaching behaviour under a variety of exposure conditions are: - the pH dependence leaching test, which provides a relationship of element mobilisation as a
function of pH (see Annex 1), - a percolation leaching test, which mimics percolation behaviour (see Annex 2) and - a dynamic leaching test for monolithic materials or materials which behave as monolith in
their application (see Annex 3). This method addresses the surface related phenomena relevant for such materials.
These three characterisation leaching tests cover more than 80 % of the cases to be addressed. More specific aspects to be addressed relate to leaching influenced by reducing conditions and inorganic or organic complexants. These can best be evaluated in relation to pH as well, as these parameters are often also very pH dependent. Recent work [12,34,61] has addressed the mutual relationships between these characterisation tests and relationships between characterisation tests and single step extraction methods (see section 5.2). Since the characterisation methods consist of more than one observation, the relationship between the data must be logical. This provides a basis to eliminate outliers or untrustworthy data. Within a material class, the major element chemistry generally does not change dramatically from one charge to another. This implies that the solubility controls are likely to be similar. This inherently leads to systematic behaviour within a materials class. Even for a waste mixture consisting of soil-like materials, very systematic behaviour between laboratory tests, lysimeter tests and field data from a 12,000 m3 pilot cell was obtained [62]. The chemistry of a particular element is determined by a limited number of key parameters. Although theoretically many minerals can be formed, in practice this number is very limited for a given element. This leads to the conclusion, that the

HORIZONTAL - 23 23
generic leaching behaviour of a particular constituent should also show some generic features between different material classes with the exception of specific leachability modifying factors such as DOC, redox, etc. In the matrices discussed in the context of this desk study for example, the role of DOC is crucial. Another aspect that works in favour of this type of characterisation testing is that the information generated can be used more than once for different purposes and different questions, whereas the result of a single extraction test is generally short lived. Whereas results from, for instance, sequential chemical extractions are more susceptible to variation, the results of pH dependence tests are much more internally consistent and repeatable. This implies that it will be important to make this information generally available, for instance in the form of a leaching database [61].
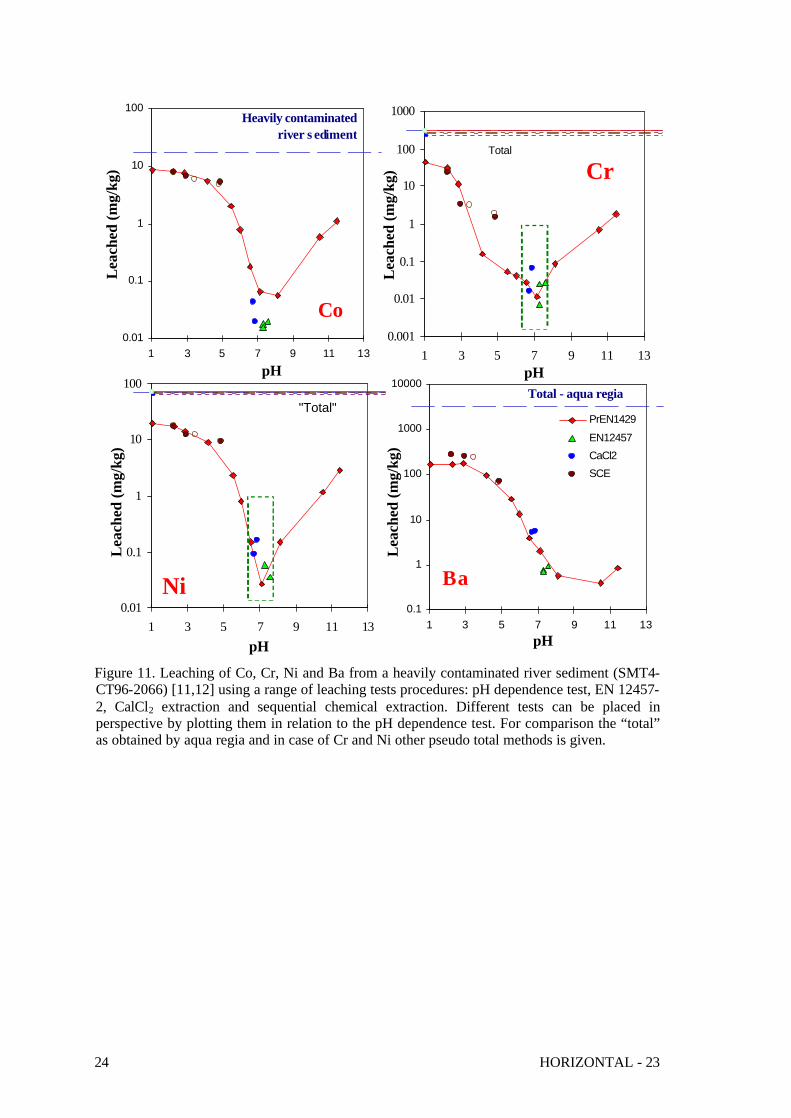
5.2 Comparison of test methods The pH dependence test has been marked as a method that allows mutual comparison of different test methods[10]. This aspect of the method is illustrated in figure 11 and figure 12 for a random selection of elements from contaminated harbour sediment (MAL) and from mildly and heavily sewage sludge amended soil (CSO1, CSO2 and SRM 483). The agreement between the different tests – CaCl2 extraction [40], EN 12457 [63], NaNO3 extraction [41], acetic acid extraction [42] and sequential chemical extraction [46]- carried out on the same materials is highly encouraging. Obviously, the EDTA extraction [44] does not fit the pH pattern as EDTA complexation is almost independent of pH. In fact, very similar results to EDTA extraction can be obtained at low pH, so if the aim is to assess an availability level just extraction at low pH would suffice. The latter option is even better as EDTA is not equally effective for all constituents of interest (e.g. oxyanions) and an extraction at low pH is more effective for a wide range of elements. The results from the sequential chemical extraction are calculated as a cumulative leached quantity at the pH corresponding to the subsequent more aggressive extraction step. Particularly, in the case of the sediment, where the pH dependence test was carried out over the full pH range covered by all other test methods the agreement is very good. For comparison purposes the total composition is included as a horizontal broken line. The curve obtained with the pH dependence test can thus be seen as a material characteristic. This applies to metals, oxyanions, major and minor elements and DOC. Here only a limited number of parameters are shown, but the same observation extends a wide range of other constituents [11,12]. In case of the sludge amended soil, it is striking to note the consistent Cd leaching behaviour for mildly and heavily amended soil. The leaching pattern as function of pH is very similar. The levels differ, however, which implies that largely the same factors are controlling metal mobility. In section 6, the modelling of chemical speciation in eluates from column and pH dependence leaching test is addressed.
24 HORIZONTAL - 23
Figure 11. Leaching of Co, Cr, Ni and Ba from a heavily contaminated river sediment (SMT4-CT96-2066) [11,12] using a range of leaching tests procedures: pH dependence test, EN 12457-2, CalCl2 extraction and sequential chemical extraction. Different tests can be placed in perspective by plotting them in relation to the pH dependence test. For comparison the “total” as obtained by aqua regia and in case of Cr and Ni other pseudo total methods is given.
0.01
0.1
1
10
100
1 3 5 7 9 11 13
pH
Lea
ched
(mg/
kg)
Co
Heavily contaminated river s ediment
0.1
1
10
100
1000
10000
1 3 5 7 9 11 13pH
Lea
ched
(mg/
kg)
PrEN1429
EN12457CaCl2SCE
Ba
Total - aqua regia
0.001
0.01
0.1
1
10
100
1000
1 3 5 7 9 11 13pH
Lea
ched
(mg/
kg) Cr
Total
0.01
0.1
1
10
100
1 3 5 7 9 11 13pH
Lea
ched
(mg/
kg)
Ni
"Total"

HORIZONTAL - 23 25
Figure 12. Leaching of Cd from three soils amended with sewage sludge to different degrees (SMT4-CT96-2066 [11,12]; SRM 483 data from Lopez-Sanchez et al [63]) using a range of leaching tests procedures: pH dependence test, EN 12457-2, CalCl2 extraction, NaNO3 extraction, Acetic acid extraction, EDTA extraction and sequential chemical extraction. Different tests can be placed in perspective by plotting them in relation to the pH dependence test. For comparison the “total” as obtained by aqua regia (AR) is given.
5.3 Comparison of sewage sludge amended soils and sewage sludge From an environmental impact point of view, it is interesting to be able to relate the quality of sewage sludge to its impact when mixed in a certain proportion with soil. This impact is twofold. It relates to uptake of possible contaminants from sludge by plants, which may enter the food chain by this route. The other option is the release of contaminants from sludge amended soil, which may affect the underlying soil system and ultimately may affect groundwater. The leaching tests results as obtained by the pH dependence leaching tests and the associated modelling provide a means of quantifying the relationship between sludge composition and the sludge amended soil. The key factor is the nature of the organic matter and the interaction of metals with particulate and dissolved organic matter. A first comparison given in figure 12 is the comparison of two sludge amended soils (CSO2 – heavily sewage sludge amended soil [11,12], CRM 483 [63] and mildly sludge amended soil - CSO1 [11,12]). The comparison of sewage sludge amended soil with the leachability of sewage sludge as shown in figure 13 illustrates significant differences in rural sludge leaching behaviour and heavily sludge amended soil behaviour. The rural sludge is characterised by a significantly higher degradable and dissolved organic matter content. At low pH (pH < 4) the leachability of Zn is definitely lower in sludge than in sludge treated soil. The explanation seems that there is an abundance of particulate organic matter in the rural sludge, which is very effective in scavenging metals from solution even at low pH.
0.001
0.01
0.1
1
10
100
1 3 5 7 9 11 13pH
Leac
hed
at L
/S=1
0 (m
g/kg
)
PrEn 14429 CSO2Duplicate test PrENSCE CSO2NaNO3 CSO2EDTA CSO2Hac CSO2CaCl2 CSO2CEN CSO2SCE2 CSO2Total CSO2 AREDTA 483HAC 483CaCl2 483NaNO3 483NH4NO3 483Step1 SCE 483Step2 SCE 483Step 3 SCE 483PrEN 14429 SRM483PrEN 14429 CSO1Hac CSO1EDTA CSO1CEN CSO1SCE CSO1SCE2 CSO1Total CSO1 ARTotal 483 AR
Cd

26 HORIZONTAL - 23
100
1000
10000
100000
2 4 6 8 10 12 14
pH
Lea
ched
(mg/
kg)
DOC
Sewage sludge amended soil
0.1
1
10
100
1000
1 3 5 7 9 11 13
pH
Lea
ched
(mg/
kg)
Zn
Sewage sludge
Figure 13. Comparison of leaching of Zn and DOC from sewage sludge amended soil and leaching from raw rural sewage sludge [11,12]. Based on the modelling [11,12,64] and the results for the various materials containing organic matter, it follows that the mobilisation of metals at low pH (pH<5) is largely governed by the sorption capacity on particulate organic matter. As soon as the metal loading increases the metals show an increase in the order of least affinity for the organic matter sorption sites. This implies that, for instance, Zn is released first and Cu last. At the intermediate pH level (pH 5-7) mobilisation is already affected by DOC. In the high pH range (pH > 7) metal mobilisation is largely controlled by association with DOC. Increased DOC levels in materials is reflected in the degree of metal mobilisation. The metal mobilisation as a function of pH proceeds parallel to the increase in DOC. The metal loading and the relative proportion of the metals dictates the extent of DOC mobilisation for a specific element. This implies that there is no direct proportionality between individual metal mobilisation and DOC level changes. Another conclusion that can be drawn from these observations is that the capacity of soil to take sewage sludge can not be judged on the composition of sewage sludge, but must be based on the soil characteristics taking into account the proportion of the intended sewage sludge amendment. The major changes as a result of a specific treatment can be visualised by applying a characterisation leaching test. In figure 14 the consequences of incineration on the leachability of constituents present in sewage sludge is shown by comparing the leachability from raw sewage sludge with that of the incinerated sewage sludge ash [11,12]. The high leachability of metals at high pH due to DOC complexation in raw sewage sludge is eliminated completely after incineration. The own pH of sludge is around pH 7, whereas the pH of incinerated sludge is pH 11-12. The removal of organic matter leads to an increase in Cu leachability at low pH after incineration, as the binding of Cu by particulate organic matter is eliminated. The leachability of Ba (and SO4) is increased after incineration, as all sulphur normally tied up in organic compounds is liberated after incineration.
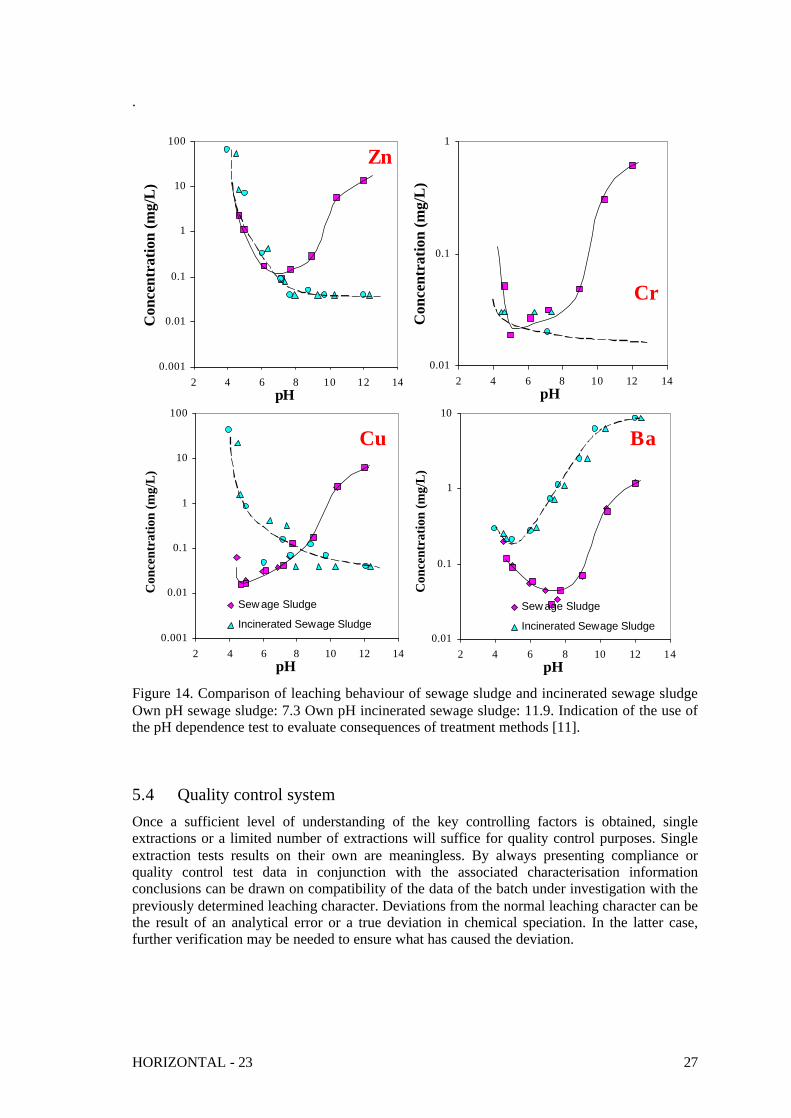
HORIZONTAL - 23 27
.
Zn
0.001
0.01
0.1
1
10
100
2 4 6 8 10 12 14pH
Con
cent
ratio
n (m
g/L
)
Cu
0.001
0.01
0.1
1
10
100
2 4 6 8 10 12 14pH
Con
cent
ratio
n (m
g/L
) .
Sew age Sludge
Incinerated Sewage Sludge
Cr
0.01
0.1
1
2 4 6 8 10 12 14pH
Con
cent
ratio
n (m
g/L
)Ba
0.01
0.1
1
10
2 4 6 8 10 12 14pH
Con
cent
ratio
n (m
g/L
) .
Sew age Sludge
Incinerated Sewage Sludge
Figure 14. Comparison of leaching behaviour of sewage sludge and incinerated sewage sludge Own pH sewage sludge: 7.3 Own pH incinerated sewage sludge: 11.9. Indication of the use of the pH dependence test to evaluate consequences of treatment methods [11].
5.4 Quality control system Once a sufficient level of understanding of the key controlling factors is obtained, single extractions or a limited number of extractions will suffice for quality control purposes. Single extraction tests results on their own are meaningless. By always presenting compliance or quality control test data in conjunction with the associated characterisation information conclusions can be drawn on compatibility of the data of the batch under investigation with the previously determined leaching character. Deviations from the normal leaching character can be the result of an analytical error or a true deviation in chemical speciation. In the latter case, further verification may be needed to ensure what has caused the deviation.
28 HORIZONTAL - 23
5.5 Judgement of test results and regulatory developments. The use of leaching tests for regulatory purposes has traditionally been limited to single extraction test data. As a consequence a lot of studies to evaluate material quality has been limited to these simple tests, which provide no information on key controlling factors. Characterisation leaching tests as standardised now in CEN/TC 292 provide insight in such factors and offer a better potential for treatment of material, which would otherwise not be obvious. A concise test has been developed [65,66], in which key aspects of leaching (pH and L/S dependence) are covered in a just a few extractions. The fear, that characterisation is too costly, is misplaced as characterisation is not carried out with the same frequency as quick screening tests. In addition, the characterisation tests provide a better basis for the decisions that need to be made and provide a key to previously unexplained differences in the single step tests. A cost effective solution would be to apply characterisation testing to a material class and use that information as basis of reference for single step compliance or screening tests. The development of environmental criteria for biomaterials relates to the utilisation of sludge and compost as fertilisers, as biofuel and, in case these materials are too contaminated for such beneficial application, disposal in landfills. In each of these scenarios regulations are in force or in development [15,16,17]. A key aspect of efficiency is that materials tested for one application do not have to be tested extensively to verify their acceptability for other uses or disposal. This harmonisation of methods across different fields is gaining interest as lack of consistency is a source of dispute and a major source of additional cost. The relevant European directives for the various applications of soil and biowaste are the EU Sludge Directive [15] and the Working Document on Biowaste [16] as basis for the new Biowaste Directive, the Council Directive 1999/31/EC on Landfill of Waste [17] and a Biofuel directive (in preparation). The Sludge and Biowaste directives focus mainly at total composition, whereas the Landfill Directive focuses mainly at leaching. It can be questioned whether total composition analysis is the proper approach to address the complex issues of soil quality in the long-term.
6. MODELLING OF CHEMICAL SPECIATION AND CONTAMINANT RELEASE
In the previous section several test results and their interrelationship have been discussed. To answer several of the questions posed in section 3, information is needed on long-term behaviour of material. As relatively short term testing cannot cover all aspects, modeling will be required to provide a better understanding of the chemical speciation aspects controlling release in the long term. Using the recently developed JAVA-based modeling tool ORCHESTRA [67] coupled to a database/expert system, modeling can be carried out to identify the solubility controlling phases and partitioning between free ion and complexed metal species in solution. For evaluation of release in a given scenario, modeling the dynamic release from a material under specific exposure conditions will be relevant. In this case, dedicated models focussed on a combination of chemical reaction and transport are relevant [68,75]. Both types of modeling are important to reach the understanding of processes controlling release in a given scenario. First geochemical equilibrium modeling will be addressed and then an example of chemical reaction/transport modeling will be addressed.
6.1 Geochemical modeling For organic matter rich matrices the interaction of metal ions with particulate and dissolved organic matter is crucial to describe metal leachability. A number of mechanistic models recently developed in soil science, are capable of describing these complex interactions. Examples are model V [69] and Model VI [70] and NICA-Donnan [71,72]. There are currently only a few chemical speciation programs in which such models are incorporated, such as Model

HORIZONTAL - 23 29
V and VI in WHAM [73], NICA-Donnan in ECOSAT [74] and the recently developed code ORCHESTRA [67]. Also a very comprehensive "generic" set of parameters has become available for the NICA-Donnan model [59]. The solid/solution partitioning of heavy metals in natural and contaminated soils is often controlled by sorption (e.g., to organic matter and/or metal (hydr)oxides). An example of the current possibilities of taking all these interactions into account using state of the art mechanistic models, is given in Figure 15. The leaching of Ni, Cu, Zn and Pb from a contaminated soil is calculated with ORCHESTRA [67], in which sorption processes on (dissolved and particulate) organic matter are described with the NICA-Donnan approach, specific sorption to metal (hydr)oxides with the model of Dzombak and Morel [76] and cation sorption on clays with an ion-exchange model.
Figure 15. Total concentrations (indicated by a horizontal line) and leached concentrations (symbols) and model curves of Ni, Cu, Cd and Pb from a contaminated soil (source of data and modelling. The model predictions are obtained using state-of-the-art mechanistic models (see text) using published thermodynamic data, and no parameters are adjusted or "fitted" to the data [77 ]. The model curves shown are actually predictions rather than descriptions, because only published thermodynamic data were used and no parameters were adjusted or "fitted" to the
Ni1.00E-08
1.00E-07
1.00E-06
1.00E-05
1.00E-04
0 2 4 6 8 10 12 14
pH
Con
cent
ratio
n (m
ol/L
)
Data
DTL
MODEL
Total
Cu1.00E-08
1.00E-07
1.00E-06
1.00E-05
1.00E-04
0 2 4 6 8 10 12 14
pH
Cd1.00E-09
1.00E-08
1.00E-07
1.00E-06
1.00E-05
1.00E-04
0 2 4 6 8 10 12 14
pH
Con
cent
ratio
n (m
ol/L
)
Pb
1.00E-09
1.00E-08
1.00E-07
1.00E-06
1.00E-05
0 2 4 6 8 10 12 14
pH
30 HORIZONTAL - 23
data. The result is of similar quality for a set of 8 soils of different origin and degree of contamination [77]. The modelling shows that sorption to dissolved and particulate organic matter is the dominant sorption mechanism [77]. Below the modelling of mineral and metal-organic matter interactions for two contaminated soils is presented [78]. The ion activities were calculated using the Davies equation based on the pH dependence leaching tests data and percolation test results as input to the model. The modeling approach consisted of calculating the saturation indices (SI) of all available minerals using ORCHESTRA [67]. Potentially solubility controlling minerals were selected on the basis of the calculated saturation indices (-1.5<SI<1.5). The minerals that gave the best prediction of the experimental pH dependent solubility curve were selected. Lines have been drawn assuming equilibrium (ceq) with minerals by calculating the quotient of the experimental concentration (cdet) of an element and the calculated saturation index as 10SI: ceq = cdet / 10SI = c det (IAP/K)-1 (IAP is the calculated ion activity product on the basis of the experimental data). The model curves shown are calculated assuming only inorganic processes. The metal association with DOC and particulate organic matter was calculated separately using the NICCA-Donnan model incorporated in ORCHESTRA. In figure 16 the results of the modeling is given in comparison with the original data from the pH dependence leaching test and percolation test for these two soils. From the percent association of Zn with DOC as calculated from the modeling in both pH dependence test and percolation test, the association of Zn with DOC can be judged as very prominent.

HORIZONTAL - 23 31
Figure 16. Modelling results for contaminated soils tested by pH dependence and percolation test showing potential mineral and Zn-DOC association as controlling factors. The percent association of Zn with DOC is given as function of pH and as function of L/S. The match between the model prediction and the measured data is within the specified SI range for the pH domain of pH 5 to 7 for Willemite and ZnSiO3. For Soil A, Zn is fully associated with DOC from pH > 9 and for Soil B from pH > 7.5 (DOC higher from Soil B). In the percolation test (only for Soil A), Zn is fully associated with DOC up to L/S=10. Only in the first fraction a slightly lower association is observed. This observation of DOC association is important as many organisms and plants cannot take up DOC associated metals. When a solubility controlling phase or mechanism can be identified, more realistic predictions of long- term behaviour of the material can be made.
1.0E-08
1.0E-07
1.0E-06
1.0E-05
1.0E-04
1.0E-03
1.0E-02
2 4 6 8 10 12
pH
[Zn]
(mol
/l)
SOIL_A AUSOIL_B AUDOCWillemiteZnSiO3
1.0E-09
1.0E-08
1.0E-07
1.0E-06
1.0E-05
1.0E-04
1.0E-03
0.1 1 10
L/S (l/kg)
[Zn]
(mol
/l)
SOIL_A Column
DOC
ZnSiO3
0
20
40
60
80
100
120
3 4 5 6 7 8 9 10 11 12
pH
% Z
n B
ound
to D
OC
SOIL_B AU
SOIL_A AU
Ow n pH Soil AOw n pH Soil B
80
85
90
95
100
105
0.1 1 10pH
% Z
n B
ound
to D
OC
SOIL_A Column
32 HORIZONTAL - 23
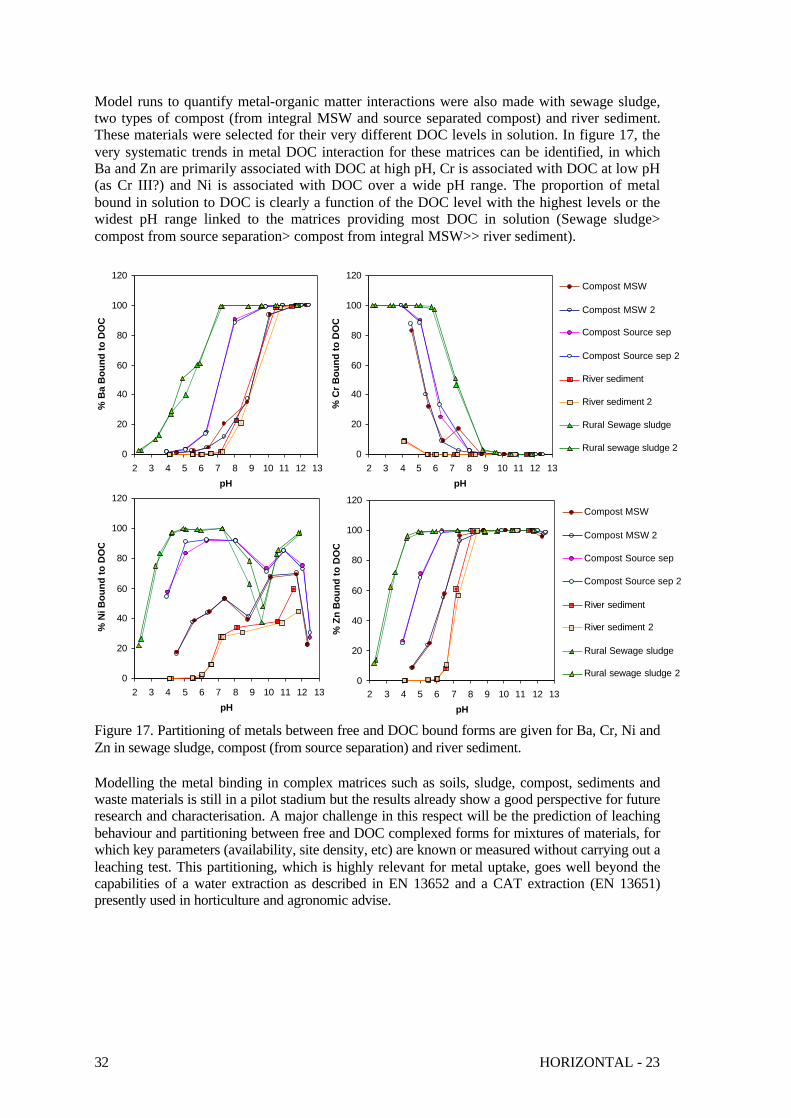
Model runs to quantify metal-organic matter interactions were also made with sewage sludge, two types of compost (from integral MSW and source separated compost) and river sediment. These materials were selected for their very different DOC levels in solution. In figure 17, the very systematic trends in metal DOC interaction for these matrices can be identified, in which Ba and Zn are primarily associated with DOC at high pH, Cr is associated with DOC at low pH (as Cr III?) and Ni is associated with DOC over a wide pH range. The proportion of metal bound in solution to DOC is clearly a function of the DOC level with the highest levels or the widest pH range linked to the matrices providing most DOC in solution (Sewage sludge> compost from source separation> compost from integral MSW>> river sediment).
Figure 17. Partitioning of metals between free and DOC bound forms are given for Ba, Cr, Ni and Zn in sewage sludge, compost (from source separation) and river sediment. Modelling the metal binding in complex matrices such as soils, sludge, compost, sediments and waste materials is still in a pilot stadium but the results already show a good perspective for future research and characterisation. A major challenge in this respect will be the prediction of leaching behaviour and partitioning between free and DOC complexed forms for mixtures of materials, for which key parameters (availability, site density, etc) are known or measured without carrying out a leaching test. This partitioning, which is highly relevant for metal uptake, goes well beyond the capabilities of a water extraction as described in EN 13652 and a CAT extraction (EN 13651) presently used in horticulture and agronomic advise.
0
20
40
60
80
100
120
2 3 4 5 6 7 8 9 10 11 12 13pH
% B
a B
ound
to D
OC
0
20
40
60
80
100
120
2 3 4 5 6 7 8 9 10 11 12 13pH
% C
r Bou
nd to
DO
C
Compost MSW
Compost MSW 2
Compost Source sep
Compost Source sep 2
River sediment
River sediment 2
Rural Sewage sludge
Rural sewage sludge 2
0
20
40
60
80
100
120
2 3 4 5 6 7 8 9 10 11 12 13pH
% N
i Bou
nd to
DO
C
0
20
40
60
80
100
120
2 3 4 5 6 7 8 9 10 11 12 13pH
% Z
n B
ound
to D
OC
Compost MSW
Compost MSW 2
Compost Source sep
Compost Source sep 2
River sediment
River sediment 2
Rural Sewage sludge
Rural sewage sludge 2
HORIZONTAL - 23 33
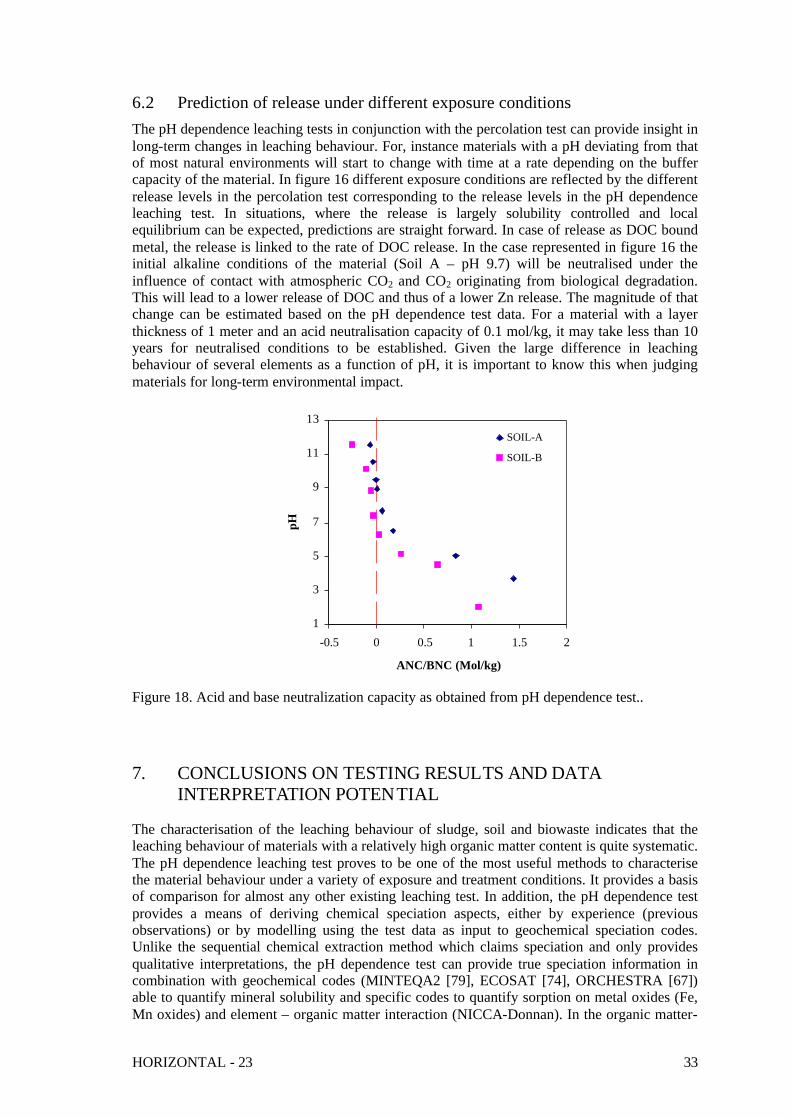
6.2 Prediction of release under different exposure conditions The pH dependence leaching tests in conjunction with the percolation test can provide insight in long-term changes in leaching behaviour. For, instance materials with a pH deviating from that of most natural environments will start to change with time at a rate depending on the buffer capacity of the material. In figure 16 different exposure conditions are reflected by the different release levels in the percolation test corresponding to the release levels in the pH dependence leaching test. In situations, where the release is largely solubility controlled and local equilibrium can be expected, predictions are straight forward. In case of release as DOC bound metal, the release is linked to the rate of DOC release. In the case represented in figure 16 the initial alkaline conditions of the material (Soil A – pH 9.7) will be neutralised under the influence of contact with atmospheric CO2 and CO2 originating from biological degradation. This will lead to a lower release of DOC and thus of a lower Zn release. The magnitude of that change can be estimated based on the pH dependence test data. For a material with a layer thickness of 1 meter and an acid neutralisation capacity of 0.1 mol/kg, it may take less than 10 years for neutralised conditions to be established. Given the large difference in leaching behaviour of several elements as a function of pH, it is important to know this when judging materials for long-term environmental impact.
Figure 18. Acid and base neutralization capacity as obtained from pH dependence test..
7. CONCLUSIONS ON TESTING RESULTS AND DATA INTERPRETATION POTENTIAL
The characterisation of the leaching behaviour of sludge, soil and biowaste indicates that the leaching behaviour of materials with a relatively high organic matter content is quite systematic. The pH dependence leaching test proves to be one of the most useful methods to characterise the material behaviour under a variety of exposure and treatment conditions. It provides a basis of comparison for almost any other existing leaching test. In addition, the pH dependence test provides a means of deriving chemical speciation aspects, either by experience (previous observations) or by modelling using the test data as input to geochemical speciation codes. Unlike the sequential chemical extraction method which claims speciation and only provides qualitative interpretations, the pH dependence test can provide true speciation information in combination with geochemical codes (MINTEQA2 [79], ECOSAT [74], ORCHESTRA [67]) able to quantify mineral solubility and specific codes to quantify sorption on metal oxides (Fe, Mn oxides) and element – organic matter interaction (NICCA-Donnan). In the organic matter-
1
3
5
7
9
11
13
-0.5 0 0.5 1 1.5 2
ANC/BNC (Mol/kg)
pH
SOIL-A
SOIL-B
34 HORIZONTAL - 23
rich matrices, the role of DOC is one of the most dominant factors controlling release of metals (and organic contaminants). The pH dependence test in combination with DOC analysis and modelling provides the possibility to quantify metal-DOC association, which is very important as many organisms and plants cannot take up DOC associated metals. In such case, metals may be mobilized and thus relevant for soil and groundwater contamination, but not bioavailable. The level of agreement between metal leaching behaviour as obtained in the pH dependence test and modelling of metal-particulate matter and metal-dissolved organic matter interactions using model parameters, which were not obtained for the materials studied, holds promise for the future, when such material specific parameters (e.g. site density) have been established. When the agreement can be further improved, then predictions beforehand are possible on certain levels of organic matter and DOC. This allows setting targets for required performance of treatment methods such as composting, biological degradation, etc. The prediction of the long-term behaviour of materials containing organic matter has long been considered impossible. These recent developments in combination with dynamic testing (percolation test) and associated modelling provide the basis for more detailed long-term assessment of impact from sludge use, compost application, contaminated sites and new applications and reuse of (contaminated) soil. From an efficiency point of view and the need for consistent methods to be referenced in regulation horizontal standardisation will be a major issue in the next decade. A multitude of tests for different matrices will not lead to a workable situation for industry nor for the regulatory agencies as regulations in adjacent fields cannot be developed independently of one another. The basic characterisation leaching tests as described here, are not restricted in their use to waste or soil, but can be applied on a wide range of matrices. There are virtually no limitations for the pH dependence leaching test as described in PrEn 14429. In case of percolation a limitations may be encountered for materials with low permeabilities. In such cases the compact granular leach test may provide the required dynamic release information needed. This may lead to the conclusion that the methods specified as characterisation leaching tests should be developed as true horizontal standards applicable to many different fields (soil, waste, sludge, compost, construction materials, etc). The validation needed for such a standard can be carried out much more cost effectively, when the field of application can indeed be defined rather broadly.
8. EXISTING STANDARDS AND DRAFT STANDARDS
Standardised test methods for evaluation of material behaviour are important to produce comparable results in testing. World wide many leaching tests are available [10,80]. However, to address release of constituents from materials to assess environmental impact does not require a multitude of test methods. As mentioned before (section 3) a scenario approach involving a limited number of tests addressing the relevant issues for the scenario under consideration in conjunction with a hierarchy in testing to deal with compliance type issues provides better means to assess environmental impact and long term behaviour.
8.1 Issues in relation to horizontal standardisation The CEN and ISO TC’s are organised vertically. This implies that relatively little interaction may occur between committee’s working on similar subjects. In the field of sludge, biowaste and soil, the relevant Committees today are: ISO TC 190/SC3. EN 14870 DTPA extraction method. ISO/TC 190 Soil - Sub Committee 7 Soil and Site assessment - Working group 6 Leaching. In this group three methods are developed, a percolation test for soil and two batch leaching methods at low and higher liquid to solid (L/S) ratio. CEN/TC 308 Characterisation of Sludge, which has adopted the batch leaching tests developed by CEN TC 292 and CEN/TC 292 Characterisation of Waste, where leaching tests are developed at the three hierarchical levels
HORIZONTAL - 23 35
mentioned before. In Working group 2, the compliance leaching tests EN 12457 has been developed in 4 parts (different L/S ratios and two particle size ranges), which has recently been validated with more than 50 participating European laboratories [84]. In Working group 6 basic characterisation methods are developed. A percolation test for granular waste is about to become a formal European standard [47]. The same applies for a pH dependence leaching test as a series of batch extractions with different initial acid/base additions to generate a full pH dependence leaching curve [28]. A dynamic leaching test for monolithic materials is still in preparation[50]. Characterisation without interpretation and modelling is not very useful. So an important aspect of characterisation test data is their use as input to modelling.
8.2 Available CEN and ISO Standards The following standards on leaching are currently available in ISO: ISO/TC190/SC3:
ISO 14870 - DTPA method extraction method [81] ISO/TC190/SC7/WG6:
ISO/AWI 21268 – 1 and 21268-2 – Batch leaching tests for soil at L/S=2 and L/S=10 ISO/AWI 21269-3 – Up-flow percolation test for soil
The following standards on leaching are currently available in CEN: CEN/TC 292/WG6:
PrEN 14405 – Leaching behaviour test - Up-flow percolation test PrEN 14429 – Leaching behaviour test – pH dependence leaching test with initial acid.base addition.
CEN/TC 292/WG2: EN 12457 (parts 1-4) – Compliance leaching test for granular material [84] This method has also been validated for sludge.
In table I the test conditions for these official CEN and ISO standards are summarized. There several other methods in use in the soil field. These comprise methods such as
CaCl2 - extraction [40] NaNO3 - extraction [41] HAc - extraction [42] EDTA – extraction [44] Sequential chemical extraction – BCR protocol [46,63].
All of these methods have in common that the designers had the intent to assess the availability for uptake or the actual uptake in plants. Studies to compare uptake and leaching are generally not unambiguous. This is in part due to the fact that actual pH conditions during uptake are not known and leachability of metals in the pH domain from pH 4 to 8 may vary over orders of magnitude. Testing of dried soil and limited relationship between pH in soil extracts (if measured) and actual conditions in the field have not been helpful in that respect.
9. EVALUATION OF DRAFTI NG (A) HORIZONTAL STANDARD(S) FOR LEACHING
Characterisation leaching tests As shown in many publications in recent years the standards developed in CEN TC 292 WG6 as general characterisation leaching methods are much more widely applicable than just for waste [ ]. This implies that these standards can be changed to horizontal standards fairly rapidly by
36 HORIZONTAL - 23
modifying the title and making adjustments needed to suit the needs in the soil, sludge and biowaste field. For the leaching of organic contaminants the same basic approach of testing can be applied, but the implementation may take longer than for inorganic constituents. For soil, sludge and biowaste in principle only minor adjustments are needed as long as the documents are restricted to leaching of inorganic parameters. A key issue to be dealt with is how to address the issue of biodegradation in materials that are still highly bioactive. A means to deal with this aspect it is to sterilize material by radiation prior to testing. Chemical sterilization (e.g. addition of NaN3) and heat treatment may lead to substantial modification of the leaching behaviour and are therefore less desirable. The pH dependence test (ANC mode) is less sensitive to this aspect due to the relatively short duration of the test. Percolation test is more sensitive as it last for about 21 days, in which time frame changes due to biological activity may take place. An alternative option is to test material as received and after full off-line degradation of a material. [82]. Although apart from ISO 14870 no other EN or ISO standards on leaching of soil and sediments exist, the standard methods most frequently used in soil and sediment studies can not cover the wide range of possible exposure conditions that the combination of pH dependence test and percolation test can cover. This implies that when this test combination is available a wide spectrum of exposure conditions can be evaluated with the same dataset. As mentioned before a limitation may exist for the percolation test in the case of poor permeability of the material to be tested (e.g. clays). In that case, the compacted granular leach test is an alternative, when time dependent release information is needed in a scenario description. An other option is the mixing of material to be tested with an “inert” coarse granular materials (sand). The applicability of the test for both inorganic and organic contaminants has been an issue of debate in ISO/TC190/SC7/WG6. The conditions specified in that document for, in particular, material requirements can be adopted. Further work will be needed to verify how the repeatability in testing can be improved when leaching of organic contaminants is largely dictated by dissolved organic matter and colloid mobilization. This is very clear from a comparison between batch leaching tests (high degree of DOC and colloid mobilization) versus a percolation leaching test which much less DOC and colloid mobilization at comparable liquid to solid ratios. In ISO/TC 190 the use of a very low concentration of CaCl2 (0.001 M) has been suggested to limit the mobilization of DOC in both batch and column leaching tests. Batch leaching test For quality control purposes relatively simple batch tests are most appropriate. The key to a successful system is to select batch test methods that reflect as closely the behaviour as observed in a characterisation leaching test, which in turn should be as representative as possible for the conditions in the field. As mentioned in section 5.4, the batch test should be presented preferably in close relationship with characterisation test data. Additional points raised from an end user point of view: 1. Is the property assessed also the property that is needed? Yes, very much so. 2. Are there different methods in the different fields? Several single extraction methods
exist. A few standardised internationally others used in limited circles as national methods only. Comparability is poor as many different procedures are used to assess largely the same property. The characterisation methods described here allow placing the single methods into perspective. In addition, they cover a wide range of possible exposure scenarios.
3. Is formulation of a horizontal standard covering sludge, soil and biowaste based on these different tests feasible? Yes, the characterisation leaching methods provided have an even

HORIZONTAL - 23 37
wider horizontal applicability than sludge, soil and biowaste. Between CEN TC 292 WG6 and ISO TC 190 SC7 WG6 already a horizontal link has been formed.
4. If no, why not? If yes, what remaining points need to be resolved in ruggedness testing? Use of 0.001 M CaCl2 to reduce DOC mobilisation by demineralised water. Validation for the range of materials to which the methods can be applied to obtain performance characteristics of the methods for soil, sludge and biowaste
5. What is the working range of the methods? pH = 1 – 12; L/S = 0.1 – 10; oxidised or reducing conditions as required. This implies that many environmental exposure conditions are covered.
6. How much work will be needed to take them to Horizontal standards? About 2 years 7. What is the rate of throughput like, how long do they take? pH dependence test: 3-4
days; percolation test : 3-4 weeks. For characterisation purposes this is not a limitation.
38 HORIZONTAL - 23
10. CRITICAL POINTS AND RECOMMENDATIONS TO CEN
- It is highly recommended to adopt the hierarchy in testing as developed in CENTC 292 -
characterisation leaching test - compliance leaching tests and verification tests in the fields of soil, sludge and biowaste. In soil studies methods can be identified that fall in each of these categories.
- Adopt characterisation leaching tests as developed for waste - pH dependence leaching test and percolation test - after modification of title, scope and specific text elements to a more generally applicable horizontal method for a wider field of application. The characterisation methods were standardised first in the field of waste for no other reason than that there was a need in relation to the development of methods for the EU Landfill Directive. Before such characterisation methods were already applied in the fields of granular construction materials, sediments, and soils in the framework of an EU funded project on Harmonisation of Leaching/Extraction tests and many other situations. The methods are generic and not limited to a specific matrix as they address aspects of leaching that are equally applicable to almost any granular material. A modification of the leachant with e.g. 0.001 M CaCl2 for soil and soil-like matrices may be required to avoid unrealistic mobilisation of dissolved organic matter due to the use of demineralised water that will not be encountered in the soil environment.
- The aspect of leaching of organic contaminants is not addressed in this report other than in side notes. Discussion of the distinction between leaching tests for inorganic and/or organic contaminants must be focussed on material requirements for equipment and on the consequences of irreversible organic contaminant mobilization due to dissolved organic matter mobilization and bringing colloids into solution in batch leaching tests. The test approaches to assess release needed for organic contaminant leaching are no different from those of inorganic contaminants.
- So far redox aspects have not been addressed specifically. This aspects is relevant for sediments, for water-logged soils and for degradable waste stored in a closed environment (e.g. in a landfill). In the future more attention should be given to this aspect of leaching. It is also highly relevant for mining waste falling outside the scope of the current evaluation.
- Application of combination of the pH dependence leaching test and the percolation test as tools for development of regulatory criteria, forming the core of a scenario-type approach of judging a wide variety of questions related to the use and disposal of soil, sludge and biowaste. The scenario approach allows a link to be established between test result and impact at a specified target, in a similar manner as the approach followed in developing criteria for landfill of waste. It is recommended to develop a similar approach for different (contaminated) soil impact scenarios [32].
- This combination of the characterisation tests as highlighted above also provides a good basis for the assessment of bioavailability in relation to human exposure (inhalation/uptake) and in relation to plant uptake (pH and time dependent).
- Utilisation of pH dependence leaching test as basis of reference for the wide range of single extraction methods used on soil. In soil extraction methods, it is highly recommended to measure pH, conductivity and DOC, as such parameters are not required at present and are vital for an understanding of the processes controlling mobilization.
- Sampling of sludge soil and biowaste is covered in another desk study. In leaching studies on waste, more consistent results were obtained from leaching than from total composition analysis, as the solubility-controlling mechanisms and factors may be less variable in a given soil than the total composition. It is recommended to evaluate this aspect of testing when sampling studies are designed.
- Total composition and leaching properties of sewage sludge and compost do not relate directly to the behaviour of these materials when mixed with soil in a given proportion. This

HORIZONTAL - 23 39
implies that judging impact by either total composition or leaching of the pure material is not adequate. An assessment based on the leaching properties of the relevant scenario, i.e. an appropriate mixture of sludge/compost with soil, would provide more realistic information on potential effects on plant uptake and mobility of contaminants. A similar rational goes for soil improvers, fertilizers and growing media.
- For quality control purposes batch tests are generally preferred. They have the limitation that in particular in soil, a significant mobilisation of DOC and fine particulates may occur, which is not reversible. Ruggedness testing is needed to verify, what options are available to minimise such effects, e.g. the use of a 0.001 M CaCl2 leachant. This aspect should be part of ruggedness work in preparation for subsequent validation.
- Modelling of metal mobilisation by DOC has been shown to be very versatile. The combination of the pH dependence leaching test with DOC measurement in the eluates allows calculation of the percentage of DOC-bound metals and other elements (e.g. alkaline earth elements). This may be very relevant information to assess potential uptake by plants and transfer of mobilized metals to groundwater.
- Dissolved concentrations are very strongly controlled by matrix properties in soil, sludge and biowaste. This leads to a situation where because of such controls more consistent results can be expected from leaching than from composition analysis.
- Developing a leaching database/expert system for soil, soil-like materials and sediments may prove very beneficial in the environmental risk assessment of these materials. Such a tool can particularly facilitate the modelling of contaminant speciation and mobility and thus the assessment of similarities and dissimilarities in soil and sediment characteristics.
- Validation of the characterisation leaching tests developed in CEN TC 292 as true horizontal standards with a much wider scope than just waste is recommended to be more efficient (horizontal approach) and economic (validation for a wide range of matrices in one go). The aspects to be addressed in such evaluation relate primarily to the performance characteristics of the methods, but in addition need to clarify specific aspects of parameter conditions selected in the standard protocols. Particularly in the pH dependence leaching tests some of the aspects can be derived from the validation of the compliance leaching tests EN 12457 part 1- 4 [84], as liquid solid ratio aspects and extraction time aspects are rather similar.
pH dependence test: * variability/ comparability in manual and automatic pH control * sensitivity to pH drift at high pH in automated pH control systems percolation test:
* limit of permeability which still allows a percolation test to be performed * effect of rate of percolation on the outcome * mode of compaction (linked to the first point) * role of dissolved organic matter during percolation ((use of 0.001 M CaCl2) * possibilities and limitations for degradable organic matter in percolation * role of reducing conditions during percolation

40 HORIZONTAL - 23
REFERENCES
1. Thematic Network Harmonisation of Leaching/Extraction tests 1995 –2001.
2. Waste Materials in Construction. J.J.J.M.Goumans, H.A. van der Sloot, Th.G. Aalbers,
Eds. Studies in Environmental Science 48. Elsevier Science Publishers, Amsterdam,
672 pp, 1991.
3. Environmental Aspects of Construction with Waste Materials. J.J.J.M.Goumans, H.A.
van der Sloot, Th.G. Aalbers, Eds. Studies in Environmental Science 60. Elsevier
Science Publishers, Amsterdam, 988 pp, 1993.
4. Waste Materials In Construction - Putting Theory into Practice. Studies in
Environmental Science 71. Eds. J.J.J.M. Goumans, G.J. Senden, H.A. van der Sloot.
Elsevier Science Publishers, Amsterdam, 886 pp, 1997.
5. Hans A. van der Sloot, O. Hjelmar, J.Mehu, N. Blakey, in: Proceedings Sardinia 99,
Seventh International Landfill Symposium, S. Margharita di Pula, Cagliari, Italy, 4-8
October 1999, pp. 3-10, 1999.
6. IAWG (International Ash Working Group; A.J.Chandler, T.T.Eighmy, J.Hartlen,
O.Hjelmar, D.S.Kosson, S.E.Sawell, H.A.van der Sloot, J.Vehlow). Municipal Solid
Waste Incinerator Residues . Studies in Environmental Science 67, Elsevier Science,
Amsterdam, 974 pp, 1997.
7. H.A. van der Sloot, Cement & Concrete Res., 2000, 30, 1079.
8. H.A. van der Sloot, R.N.J. Comans and O. Hjelmar, Sci. Total Environ., 1996, 178, 111.
9. P.M. Esser, H. A. van der Sloot, and W.L.D. Suitela. Harmonization of leaching tests:
leaching behaviour of wood. Heron, 2002, 46 (4), 15 - 29.
10. Harmonization of leaching/extraction tests. Studies in Environmental Science, Volume 70.
Eds H.A. van der Sloot, L. Heasman, Ph Quevauviller, Elsevier Science, Amsterdam, 292
pp, 1997.
11. Technical Work in Support of the Network “Harmonisation of leaching/extraction tests”
Contract SMT4-CT96-2066, European Commission, Brussels, Belgium.
12. H.A. van der Sloot Harmonisation of leaching/extraction procedures for sludge,
compost, soil and sediment analyses. In: Methodologies for Soil and sediment
fractionation studies. Ed. P. Quevauviller. Royal Society of Chemistry.2002. pag 142-
170.
13. Comans, R.N.J. (ed.) (2001) Development of standard leaching tests for organic
pollutants in soils, sediments and granular waste materials. Final Report EU project
HORIZONTAL - 23 41
SMT-4-CT97-2160. ECN-C--01-121.
14. Comans, R.N.J. and G. Roskam. Leaching procedure for the availability of polycyclic
aromatic hydrocarbons (PAHs) in contaminated soil and waste materials. In:
Methodologies for Soil and sediment fractionation studies. Ed. P. Quevauviller. Royal
Society of Chemistry.2002. pag 123- 141.
15. EU Sludge Directive 86/278/EEC up for revision. Draft April 2000.
16. Working Document on Biowaste, EU DG Environment, February 2001.
17. Council Directive 1999/31/EC of April 26, 1999 on the landfill of waste. DGXI, 16-7-
1999, L182/1 – 19.
18. EU Water Framework Directive.
19. EU Communication 179 (2000).
20. Ph. Quevauviller, W. Cofino, R. Cornelis, P. Fernandez, R. Morabito and H.A. van der
Sloot, Intern. J. Environ. Anal. Chem. 1997, 67, 173.
21. O. Hjelmar, Waste Manag. Res., 1990, 8, 429.
22. D.S. Kosson, H.A. van der Sloot and T.T. Eighmy, J. Hazard. Mat., 1996, 47, 43.
23. Aqua regia destruction
24. Nitric acid bomb destruction
25. Nitric acid/ perchloric acid destruction
26. Aqua regia/HF destruction in a microwave
27. NEN 7341 Determination of the availability for leaching from granular and monolithic
contruction materials and waste materials. Sept 1993.
28. Characterization of waste – leaching behaviour test – influence of pH on leaching with
initial acid/base addition. CEN/TC 292 Working Group 6. PrEN14429. Formal vote
2002.
29. H.A. van der Sloot, Waste Manag., 1996, 16, 65.
30. P. Moscowitz, R. Barna, F. Sanchez, H.R. Bae and J.Mehu. Models for leaching of
porous materials. In: Waste Materials In Construction - Putting Theory into Practice.
Studies in Environmental Science 71. Eds. J.J.J.M. Goumans, G.J. Senden, H.A. van der
Sloot. Elsevier Science Publishers, Amsterdam, 1997, 491-500.
31. O. Hjelmar, H.A. van der Sloot, D. Guyonnet, R.P.J.J. Rietra, A. Brun and D. Hall, in:
8th Waste management and Landfill Symposium, October 2001. Volume III, 771-721.
32. Grathwohl, P. , Bonilla,A., Broholm, M., Burganos, V., Christophersen, M., Comans,
R.N.J., Gaganis, P., Gorostiza, I., Höhener, P., Kjeldsen, P., Van der Sloot, H.A.
Guideline for Groundwater Risk Assessment at Contaminated Sites
(GRACOS).GRACOS project (EVK1-CT-1999-00029) , University of Tübingen, 2003.
33. Building Materials Decree. Staatsblad van het Koninkrijk der Nederlanden, 567, 1995.

42 HORIZONTAL - 23
34. D.S. Kosson, H.A. van der Sloot, F. Sanchez and A.C. Garrabrants, 2002. An
integrated framework for evaluating leaching in waste management and utilization of
secondary materials. Environmental Engineering Science (19) 3, 159-204.
35. EPA Toxicity Test Procedure (EP-tox), Appendix II, Federal register, Vol 45(98), 1980,
33127 - 33128. Government Printing Office, Washington D.C. later changed to Toxicity
Characteristic Leaching Procedure (TCLP). Federal Register Vol 51 No 114, Friday,
June 13, 1986, 21685-21693 (proposed rules). Federal Register, Vol No 261, March
29, 1990 (final version).
36. DIN 38414 S4: German standard procedure for water, wastewater and sediment testing
- group S (sludge and sediment); determination of leachability (S4). Institüt für
Normung, Berlin, 1984.
37. Déchets: Essai de Lixiviation X 31-210, 1988. Association Française de Normalisation
(AFNOR), Paris.
38. US EPA - Landfill Disposal Restrictions: 62 FR 41005 July 31, 1997 and 62 FR 63458
December 1, 1997.
39. I. Novozamski, Th. M. Lexmond and V.J.G. Houba. J. Environ. Anal. Chem. 51,
47 – 58 (1993) 40. V.J.G. Houba en I. Novozamsky. 1998. Fres. J. Anal. Chem. 360: 362-365.
41. S.K. Gupta and C. Aten. Inter. J. Environ. Anal. Chem. 51, 65 – 84 (1993)
42. A.M. Ure, R. Thomas and D. Litlejohn. J. Environ. Anal. Chem. 51, 25 – 46 (1993)
43. Compacted granular leach test (CGLT) NVN 7347. NEN. 2002.
44. ISO EN 14870 DTPA extraction method. ISO TC 190, SC3
45. Tessier, A, Campbell, P G C; Bisson, M Sequential extraction procedure for the
speciation of particulate trace metals. Analytical Chemistry, 51 (7), 844-851.
46. G. Rauret, J.F. López-Sánchez, A. Sahuquillo, R. Rubio, C. M. Davison, A.M. Ure, Ph.
Quevauviller. Improvement of the BCR three step sequential extraction procedure prior
to the certification of new sediment and soil reference materials. J. Environ. Monit. 1
(1999) 57.
47. Characterisation of waste - Methodology guideline for the determination of the leaching
behaviour of waste under specified conditions. PrENV 12920, CEN/TC 292. CEN (1996).
48. Characterisation leaching test - Percolation test - Upflow. CEN/TC 292 Working Group
6 Work item 292016. PrEn 14405 Formal vote 2003.
49. Characterization of waste – leaching behaviour test – influence of pH on leaching with
continuous pH control. CEN/TC 292 Working Group 6 in preparation. CEN enquiry
2002.
50. Characterization of waste – leaching behaviour test – Dynamic leach test for monolithic

HORIZONTAL - 23 43
materials. CEN/TC 292 Working Group 6. Work item in preparation 2001.
51. Ferrari, S. (1997) Chemische Charakterisierung des Kohlenstoffes in Rückständen von
Mühlverbrennungsanlagen: Methoden und Anwendungen. Dissertation ETH Nr. 12200,
Zürich, 128 p.
52. Van Zomeren, A. & Comans, R.N.J. (2002) Contribution of natural organic matter to
copper leaching from municipal solid waste incinerator bottom ash. In: Proceedings of
the international Humic substances society twentieth anniversary conference, July 21-
26, 2002, Boston, USA, pp. 424-426.
53. H.A. van der Sloot, R.P.J.J. Rietra , R.C. Vroon, H. Scharff and J.A.Woelders.
Similarities in the long term leaching behaviour of predominantly inorganic waste,
mswi bottom ash, degraded MSW and bioreactor residues. Proceedings of the 8th Waste
management and Landfill Symposium, Eds. T.H. Christensen, R. Cossu and R.
Stegmann, Vol I , 2001, 199-208.
54. State of the art document on dissolved organic matter (DOC). CEN TC 292, 2003 (draft
for discussion)
55. R. Cossu, R. Laraia, F. Adani and R. Raga. Test methods for the characterization of
biological stability of pretreated MSW in compliance with EU Directives. Proceedings
of the 8th Waste management and Landfill Symposium, Eds. T.H. Christensen, R.
Cossu and R. Stegmann, Vol I , 2001, 545-554.
56. R.N.J. Comans, J. Filius (LUW), A. van Zomeren, H.A. van der Sloot.
Haalbaarheidsstudie naar genormaliseerde methoden voor de bepaling van de
beschikbaarheid en rol van organische stof in grond, afval- en bouwstoffen m.b.t.
verhoging van de uitloging van slecht water-oplosbare verontreinigingen. ECN-C--00-
060, 2000
57. D.G. Kinniburgh, W.H. van Riemdijk, L.K. Koopal, M. Borkovec, M.F. Benedetti and
M.J. Avena, Ion binding to natural organic matter: competition, heterogeneity,
stoichiometry and thermodynamic consistency. Colloids and Surf. A., 147-166, 1999.
58. M.F. Benedetti, W.H. van Riemdijk, L.K. Koopal, D.G. Kinniburgh, D. Gooddy and
C.J. Milne, Geochim. Cosmochim. Acta., 1996, 60, 2503.
59. Milne,C.J., Kinniburgh,D.G., van Riemsdijk,W.H. & Tipping,E. 2003. Generic NICA-
Donnan model parameters for metal-ion binding by humic substances. Environmental
Science and Technology, 37, 958-971.
60. Van der Sloot, H.A., & Kosson, D.S. A unified approach for the judgement of
environmental properties of construction materials (cement-based, asphaltic, unbound
aggregates, soil) in different stages of their life cycle. Proceedings WASCON 2003
Conference, San Sebastian, Spain, 2003.

44 HORIZONTAL - 23
61. Van der Sloot, H.A., P. Seignette, R.N.J. Comans, A. van Zomeren, J.J.Dijkstra,
H.Meeussen, D.S. Kosson, O. Hjelmar (2003): Evaluation of environmental aspects of
alternative materials using an integrated approach assisted by a database/expert system.
Proceedings of the Conference "Advances in Waste Management and Recycling",
Dundee, September 2003.
62. H.A. van der Sloot, A. van Zomeren, J.J. Dijkstra, D. Hoede, J. Jacobs, H. Scharff.
Prediction of long term leachate quality and chemical speciation for a predominantly
inorganic waste landfill. 9th International Waste management and Landfill Symposium,
6-10 October 2003, Sardinia.
63. Lopez-Sanchez et al Extraction procedures for soil analysis. In: P. Quevauviller (ed.)
Methodologies for Soil and Sediment Fractionation Studies - Single and Sequential
Extraction Procedures. Royal Society of Chemistry, Cambridge. pag 28-65
63. Compliance leach test CEN TC 292 Working Group 2 (1996): Characterisation of
waste. Leaching. Compliance test for leaching of granular waste materials.
Determination of the leaching of constituents from granular waste materials and
sludges. Draft European Standard prEN 12457 Parts 1-4.
64. Dijkstra, J..J., J.C.L. Meeussen, H. A. van der Sloot and R.N.J. Comans (2003).
Modelling speciation and transport in MSWI bottom ash. Proceedings of the WASCON
Conference, San Sebastian, June 2003.
65. H.A. van der Sloot, D.S. Kosson, T.T. Eighmy, R.N.J. Comans and O. Hjelmar, in:
Environmental aspects of Construction with waste materials, Eds. J.J.J.M. Goumans,
H.A. van der Sloot, Th.G. Aalbers, Elsevier Science Publishers, Amsterdam, 453-466,
1994.
66. D.S. Kosson and H.A. Van der Sloot, in: Waste Materials In Construction - Putting
Theory into Practice, Studies in Environmental Science 71. Eds. J.J.J.M. Goumans. G.J.
Senden. H.A. van der Sloot. Elsevier Science Publishers. Amsterdam, 201-216, 1997.
67. Meeussen, J.C.L., ORCHESTRA: an object-oriented framework for implementing
chemical equilibrium models. Environ. Sci. Technol. 2003, 37, 1175-1182.
68. J.J. Dijkstra, H.A. van der Sloot, and R.N.J. Comans, Process identification and model
development of contaminant transport in MSWI bottom ash. In press: Proceedings of
WASCON 2000, Harrowgate, U.K., May/June 2000.
69. Tipping,E.& Hurley,M.A. 1992. A unifying model of cation binding by humic
substances. Geochimica et Cosmochimica Acta, 56, 3627-3641.
70. Tipping,E. 1998. Humic ion binding model VI: an improved description of the
interactions of protons and metal ions with humic substances. Aquatic Geochemistry, 4,
3-48.
HORIZONTAL - 23 45
71. Kinniburgh,D.G., Milne,C.J., Benedetti,M.F., Pinheiro,J.P., Filius,J., Koopal,L.K. &
van Riemsdijk,W.H. 1996. Metal ion binding by humic acid: application of the NICA-
Donnan model. Environmental Science and Technology, 30, 1687-1698.
72. Kinniburgh,D.G., van Riemsdijk,W.H., Koopal,L.K., Borkovec,M., Benedetti,M.F. &
Avena,M.J. 1999. Ion binding to natural organic matter: competition, heterogeneity,
stoichiometry and thermodynamic consistency. Colloids and Surfaces A:
Physicochemical and Engineering Aspects, 151, 147-166.
73. Tipping,E. 1994. WHAM - A chemical equilibrium model and computer code for
waters, sediments, and soil incorporating a discrete site/electrostatic model of ion-
binding by humic substances. Computers & Geosciences, 20, 973-1023.
74. M.G. Keizer and W.H. van Riemsdijk, W. H., ECOSAT. Department of Environmental
Sciences, Subdepartment Soil Science and Plant Nutrition, Wageningen Agricultural
Univ., Netherlands, 1998.
75. Comans, R.N.J., Dijkstra, J.J. & Meeussen, J.C.L. (2003) Modelling processes
controlling metal leaching from contaminated and remediated soils. In: D. Halm & P.
Grathwohl (2003) Proceedings 2nd Workshop on groundwater risk assessment at
contaminated sites (GRACOS) and integrated soil and water protection (SOWA).
Report university of tübingen, pp. 5-8.
76. Dzombak,D.A.& Morel,F.M.M. 1990. Surface complexation modeling: hydrous ferric
oxide. John Wiley & Sons, Inc., New York.
77. Dijkstra,J.J.& Comans,R.N.J. 2003. Application of mechanistic sorption modelling to
metal-contaminated soils. European Journal of Soil Science, submitted.
78. H.A. van der Sloot, R.P.J.J. Rietra, D. Hoede. Evaluation of leaching behaviour of
selected wastes designated as hazardous by means of basic characterisation tests. ECN-
C--00-050, 2000.
79. J.D. Allison, D.S. Brown, K.J. Novo-Gradac and C.J. MinteQA2 /PRODEFA2: A
geochemical assessment model for environmental systems. EPA/600/3-91/021. US-
Environmental Protection Agency, Athens GA 30613. 106 pp, 1991.
80. Environment Canada, Compendium of waste leaching tests. Environmental Protection
series. Report EPS 3/HA/7, 1990.
81. Hans van der Sloot, Hans Woelders. Leaching behaviour of Essent bioreactor rest
product at different stages of degradation in lab and pilot scale to assess potential
utilization options. Int. Landfill Research Symposium, Lulea, Sweden, 2000.
82. Alexander. Bioavailability 2003
83. ISO/TC190/SC7/WG 8 Guidance Standard on bioavailability, 2003 (in preparation).
84. H.A. van der Sloot, O. Hjelmar, J. Bjerre Hansen, P. Woitke, P. Lepom, R. Leschber, B.
46 HORIZONTAL - 23
Bartet, N. Debrucker (2001): Validation of CEN/TC 292 Leaching Tests and Eluate
Analysis Methods PrEN 12457 part 1- 4, ENV 13370 and ENV 12506 in Co-operation
with CEN/TC 308. 2001. ECN-C-01-117.

HORIZONTAL - 23 47
ANNEX I - TOTAL COMPOSITION ANALYSIS PLACED IN PERSPECTIVE TO LEACHING (LINEAR SCALE)
0
10
20
30
40
50
60
70
80
90
1 3 5 7 9 11 13pH
[Cd]
(mg/
kg)
CSO2:1:4:1SCE1SCE2Aqua RegiaHNO3 Bomb95%HNO3/5%HCLO4Aqua Regia/HF/ Boric acid MicrowaveNEN 7341 AVAIL
Own pH
0
3
6
9
12
15
18
21
24
1 3 5 7 9 11 13pH[C
d] (m
g/kg
)
MAL:1:1:1MAL:1:11:1SCE2SCE1pHstatAqua RegiaHNO3 Bomb95%HNO3/5%HCLO4Aqua Regia/HF/ Boric acid MicrowaveNEN 7341 AVAIL
Own pH
0
2000
4000
6000
8000
10000
12000
14000
1 3 5 7 9 11 13pH
[Mg]
(mg/
kg)
MAL:1:1:1MAL:1:11:1SCE2SCE1pHstatAqua RegiaHNO3 Bomb95%HNO3/5%HCLO4Aqua Regia/HF/ Boric acid MicrowaveNEN 7341 AVAIL
Own pH
0
500
10001500
20002500
30003500
40004500
5000
1 3 5 7 9 11 13pH
[Mg]
(mg/
kg)
Aqua Regia
HNO3 Bomb
95%HNO3/5%HCLO4
Aqua Regia/HF/ Boric acid Microwave
NEN 7341 AVAIL
Own pHCSO2
0
0.1
0.2
0.3
0.4
0.5
0.6
0.7
0.8
2 4 6 8 10 12pH
[Cd]
(mg/
kg)
CW5:1:1:1
Aqua Regia
HNO3 Bomb
95%HNO3/5%HCLO4
Aqua Regia/HF/ Boric acid Microwave
Own pH
00.2
0.4
0.6
0.8
11.2
1.4
1.6
1.82
2 4 6 8 10 12pH
[Cd]
(mg/
kg)
RWZS:1:1:1Aqua RegiaHNO3 Bomb95%HNO3/5%HCLO4Aqua Regia/HF/ Boric acid MicrowaveNEN 7341 AVAIL
Own pH
0
2000
4000
6000
8000
10000
12000
2 4 6 8 10 12pH
[Mg]
(mg/
kg)
CW5:1:1:1Aqua RegiaHNO3 Bomb95%HNO3/5%HCLO4Aqua Regia/HF/ Boric acid MicrowaveNEN 7341 AVAIL
Own pH
0
1000
2000
3000
4000
5000
6000
7000
8000
2 4 6 8 10 12pH
[Mg]
(mg/
kg)
RWZS:1:1:1Aqua RegiaHNO3 Bomb95%HNO3/5%HCLO4Aqua Regia/HF/ Boric acid MicrowaveNEN 7341 AVAIL
Own pH
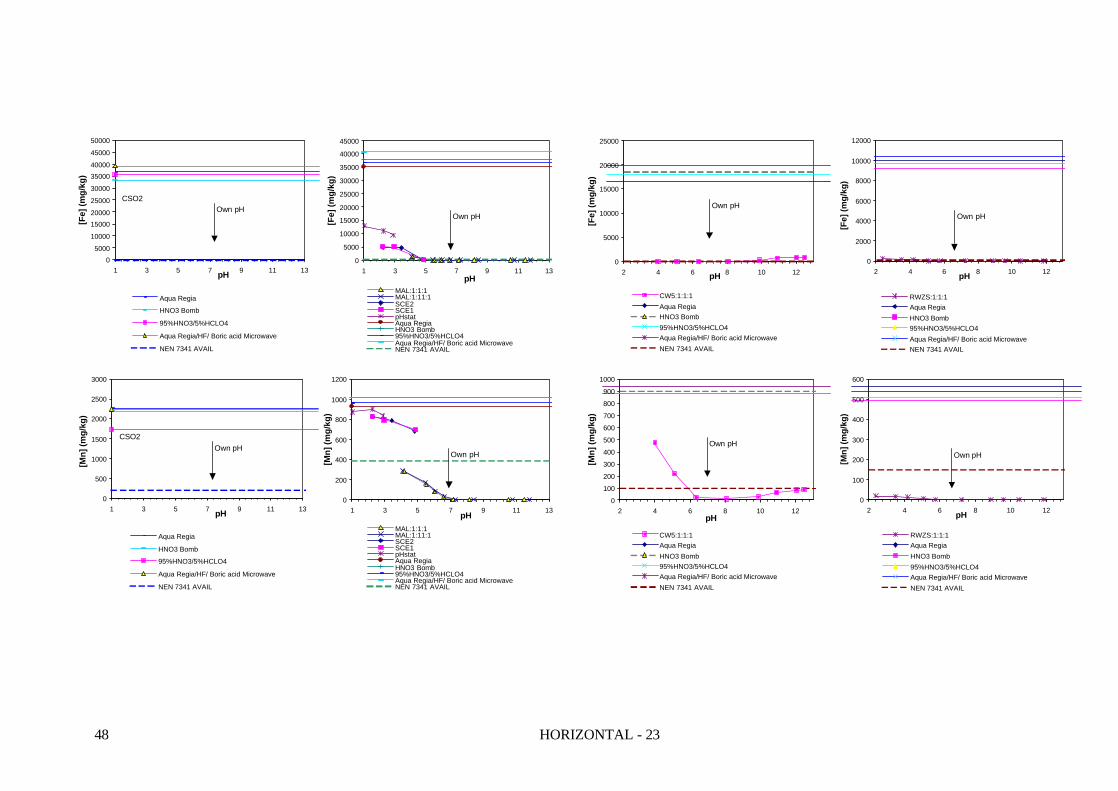
48 HORIZONTAL - 23
0
5000
10000
15000
20000
25000
30000
35000
40000
45000
1 3 5 7 9 11 13pH
[Fe]
(mg/
kg)
MAL:1:1:1MAL:1:11:1SCE2SCE1pHstatAqua RegiaHNO3 Bomb95%HNO3/5%HCLO4Aqua Regia/HF/ Boric acid MicrowaveNEN 7341 AVAIL
Own pH
0
200
400
600
800
1000
1200
1 3 5 7 9 11 13pH
[Mn]
(mg/
kg)
MAL:1:1:1MAL:1:11:1SCE2SCE1pHstatAqua RegiaHNO3 Bomb95%HNO3/5%HCLO4Aqua Regia/HF/ Boric acid MicrowaveNEN 7341 AVAIL
Own pH
05000
10000
1500020000
25000
30000
3500040000
45000
50000
1 3 5 7 9 11 13pH
[Fe]
(mg/
kg)
Aqua Regia
HNO3 Bomb
95%HNO3/5%HCLO4
Aqua Regia/HF/ Boric acid Microwave
NEN 7341 AVAIL
Own pHCSO2
0
500
1000
1500
2000
2500
3000
1 3 5 7 9 11 13pH
[Mn]
(mg/
kg)
Aqua Regia
HNO3 Bomb
95%HNO3/5%HCLO4
Aqua Regia/HF/ Boric acid Microwave
NEN 7341 AVAIL
Own pHCSO2
0
5000
10000
15000
20000
25000
2 4 6 8 10 12pH
[Fe]
(mg/
kg)
CW5:1:1:1Aqua RegiaHNO3 Bomb95%HNO3/5%HCLO4Aqua Regia/HF/ Boric acid MicrowaveNEN 7341 AVAIL
Own pH
0
2000
4000
6000
8000
10000
12000
2 4 6 8 10 12pH
[Fe]
(mg/
kg)
RWZS:1:1:1Aqua RegiaHNO3 Bomb95%HNO3/5%HCLO4Aqua Regia/HF/ Boric acid MicrowaveNEN 7341 AVAIL
Own pH
0
100
200
300
400
500
600
700
800
900
1000
2 4 6 8 10 12pH
[Mn]
(mg/
kg)
CW5:1:1:1Aqua RegiaHNO3 Bomb95%HNO3/5%HCLO4Aqua Regia/HF/ Boric acid MicrowaveNEN 7341 AVAIL
Own pH
0
100
200
300
400
500
600
2 4 6 8 10 12pH
[Mn]
(mg/
kg)
RWZS:1:1:1Aqua RegiaHNO3 Bomb95%HNO3/5%HCLO4Aqua Regia/HF/ Boric acid MicrowaveNEN 7341 AVAIL
Own pH
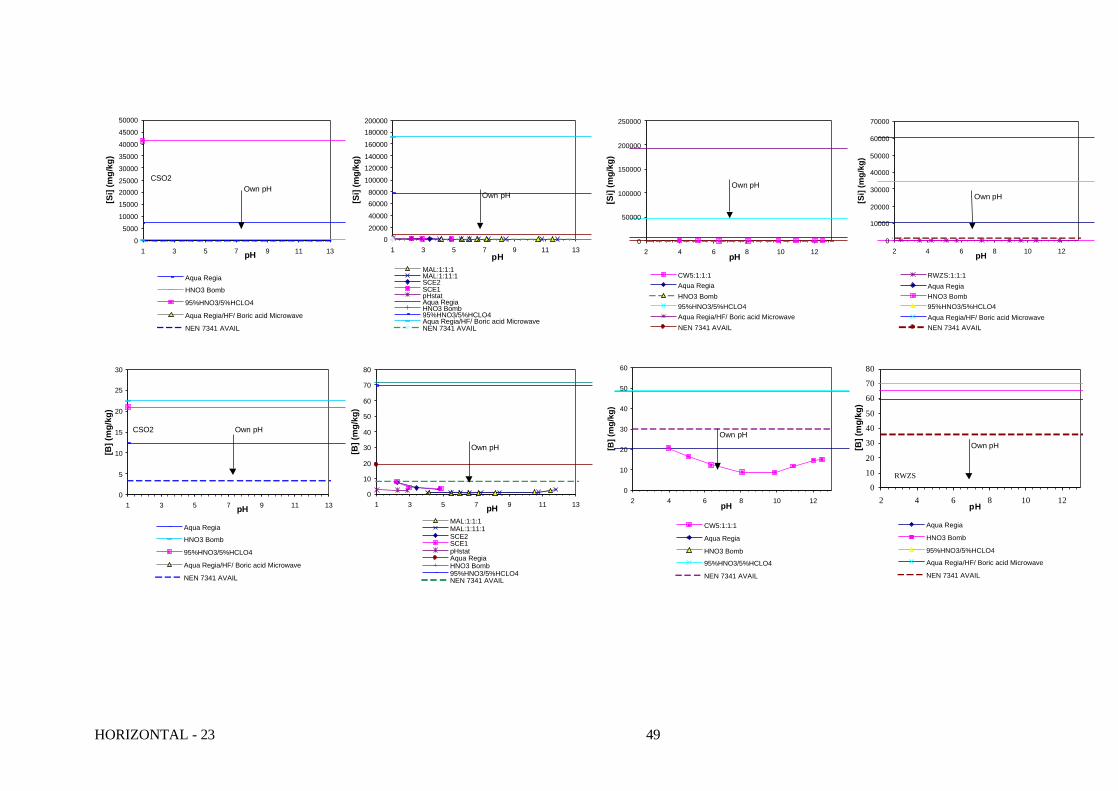
HORIZONTAL - 23 49
020000
40000
6000080000
100000
120000140000
160000
180000200000
1 3 5 7 9 11 13pH
[Si]
(mg/
kg)
MAL:1:1:1MAL:1:11:1SCE2SCE1pHstatAqua RegiaHNO3 Bomb95%HNO3/5%HCLO4Aqua Regia/HF/ Boric acid MicrowaveNEN 7341 AVAIL
Own pH
0
10
20
30
40
50
60
70
80
1 3 5 7 9 11 13pH
[B] (
mg/
kg)
MAL:1:1:1MAL:1:11:1SCE2SCE1pHstatAqua RegiaHNO3 Bomb95%HNO3/5%HCLO4NEN 7341 AVAIL
Own pH
0
5000
10000
15000
2000025000
30000
35000
40000
45000
50000
1 3 5 7 9 11 13pH
[Si]
(mg/
kg)
Aqua Regia
HNO3 Bomb
95%HNO3/5%HCLO4
Aqua Regia/HF/ Boric acid Microwave
NEN 7341 AVAIL
Own pHCSO2
0
5
10
15
20
25
30
1 3 5 7 9 11 13pH
[B] (
mg/
kg)
Aqua Regia
HNO3 Bomb
95%HNO3/5%HCLO4
Aqua Regia/HF/ Boric acid Microwave
NEN 7341 AVAIL
Own pHCSO2
0
50000
100000
150000
200000
250000
2 4 6 8 10 12pH
[Si]
(mg/
kg)
CW5:1:1:1Aqua RegiaHNO3 Bomb95%HNO3/5%HCLO4Aqua Regia/HF/ Boric acid MicrowaveNEN 7341 AVAIL
Own pH
0
10000
20000
30000
40000
50000
60000
70000
2 4 6 8 10 12pH
[Si]
(mg/
kg)
RWZS:1:1:1Aqua RegiaHNO3 Bomb95%HNO3/5%HCLO4Aqua Regia/HF/ Boric acid MicrowaveNEN 7341 AVAIL
Own pH
0
10
20
30
40
50
60
2 4 6 8 10 12pH
[B] (
mg/
kg)
CW5:1:1:1
Aqua Regia
HNO3 Bomb
95%HNO3/5%HCLO4
NEN 7341 AVAIL
Own pH
0
10
20
30
40
50
60
70
80
2 4 6 8 10 12pH
[B] (
mg/
kg)
Aqua Regia
HNO3 Bomb
95%HNO3/5%HCLO4
Aqua Regia/HF/ Boric acid Microwave
NEN 7341 AVAIL
Own pH
RWZS
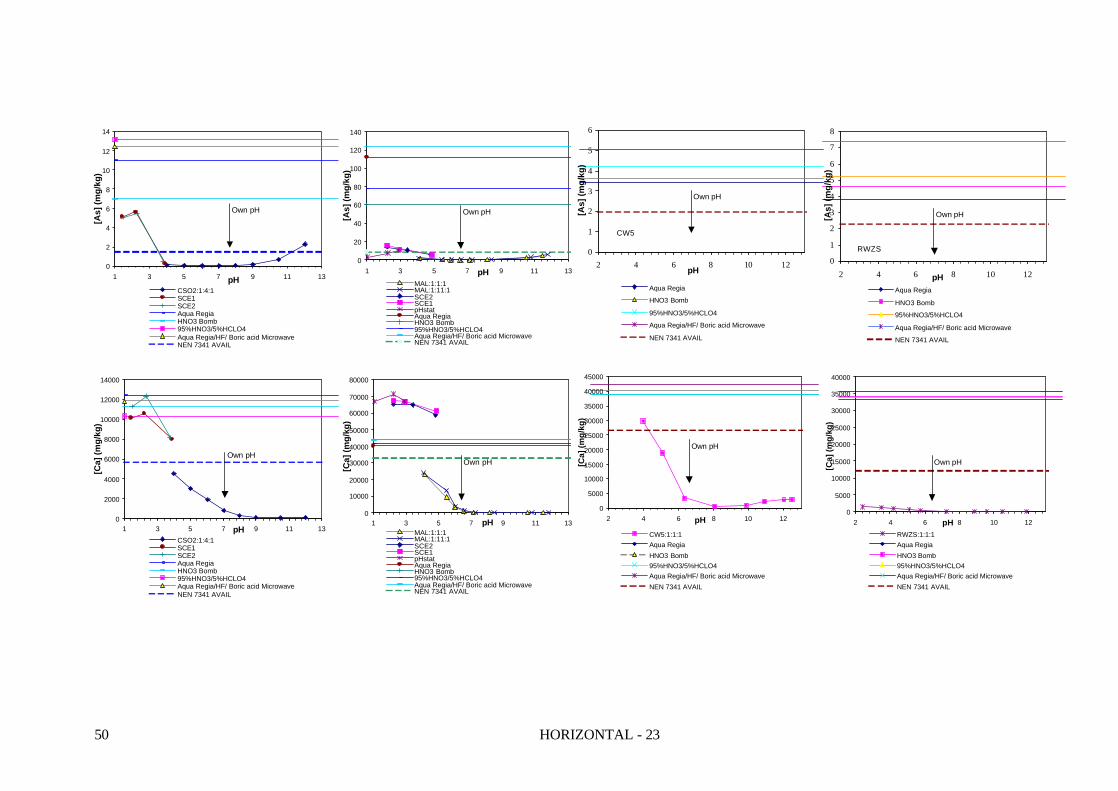
50 HORIZONTAL - 23
0
2
4
6
8
10
12
14
1 3 5 7 9 11 13pH
[As]
(mg/
kg)
CSO2:1:4:1SCE1SCE2Aqua RegiaHNO3 Bomb95%HNO3/5%HCLO4Aqua Regia/HF/ Boric acid MicrowaveNEN 7341 AVAIL
Own pH
0
20
40
60
80
100
120
140
1 3 5 7 9 11 13pH
[As]
(mg/
kg)
MAL:1:1:1MAL:1:11:1SCE2SCE1pHstatAqua RegiaHNO3 Bomb95%HNO3/5%HCLO4Aqua Regia/HF/ Boric acid MicrowaveNEN 7341 AVAIL
Own pH
0
2000
4000
6000
8000
10000
12000
14000
1 3 5 7 9 11 13pH
[Ca]
(mg/
kg)
CSO2:1:4:1SCE1SCE2Aqua RegiaHNO3 Bomb95%HNO3/5%HCLO4Aqua Regia/HF/ Boric acid MicrowaveNEN 7341 AVAIL
Own pH
0
10000
20000
30000
40000
50000
60000
70000
80000
1 3 5 7 9 11 13pH
[Ca]
(mg/
kg)
MAL:1:1:1MAL:1:11:1SCE2SCE1pHstatAqua RegiaHNO3 Bomb95%HNO3/5%HCLO4Aqua Regia/HF/ Boric acid MicrowaveNEN 7341 AVAIL
Own pH
0
5000
10000
15000
20000
25000
30000
35000
40000
45000
2 4 6 8 10 12pH
[Ca]
(mg/
kg)
CW5:1:1:1Aqua RegiaHNO3 Bomb95%HNO3/5%HCLO4Aqua Regia/HF/ Boric acid MicrowaveNEN 7341 AVAIL
Own pH
0
5000
10000
15000
20000
25000
30000
35000
40000
2 4 6 8 10 12pH
[Ca]
(mg/
kg)
RWZS:1:1:1Aqua RegiaHNO3 Bomb95%HNO3/5%HCLO4Aqua Regia/HF/ Boric acid MicrowaveNEN 7341 AVAIL
Own pH
0
1
2
3
4
5
6
7
8
2 4 6 8 10 12pH
[As]
(mg/
kg)
Aqua Regia
HNO3 Bomb
95%HNO3/5%HCLO4
Aqua Regia/HF/ Boric acid Microwave
NEN 7341 AVAIL
Own pH
RWZS0
1
2
3
4
5
6
2 4 6 8 10 12pH
[As]
(mg/
kg)
Aqua Regia
HNO3 Bomb
95%HNO3/5%HCLO4
Aqua Regia/HF/ Boric acid Microwave
NEN 7341 AVAIL
Own pH
CW5
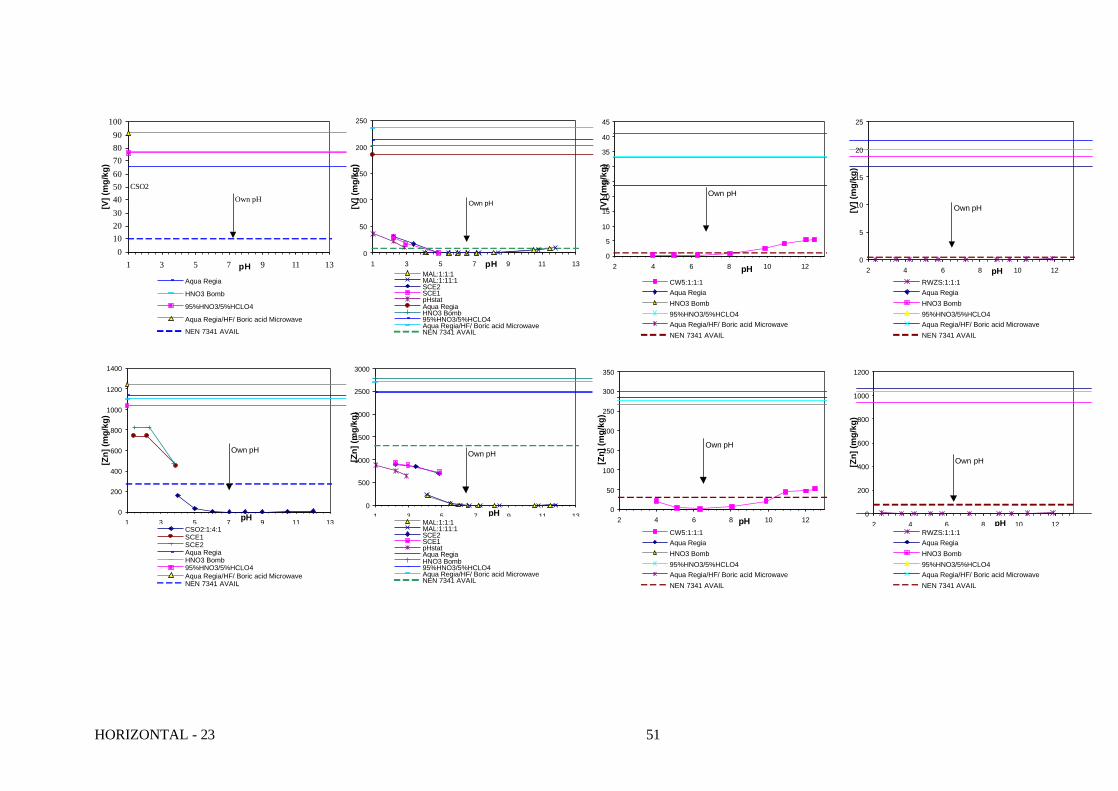
HORIZONTAL - 23 51
0
50
100
150
200
250
1 3 5 7 9 11 13pH
[V] (
mg/
kg)
MAL:1:1:1MAL:1:11:1SCE2SCE1pHstatAqua RegiaHNO3 Bomb95%HNO3/5%HCLO4Aqua Regia/HF/ Boric acid MicrowaveNEN 7341 AVAIL
Own pH
0
200
400
600
800
1000
1200
1400
1 3 5 7 9 11 13pH
[Zn]
(mg/
kg)
CSO2:1:4:1SCE1SCE2Aqua RegiaHNO3 Bomb95%HNO3/5%HCLO4Aqua Regia/HF/ Boric acid MicrowaveNEN 7341 AVAIL
Own pH
0
500
1000
1500
2000
2500
3000
1 3 5 7 9 11 13pH
[Zn]
(mg/
kg)
MAL:1:1:1MAL:1:11:1SCE2SCE1pHstatAqua RegiaHNO3 Bomb95%HNO3/5%HCLO4Aqua Regia/HF/ Boric acid MicrowaveNEN 7341 AVAIL
Own pH
0102030405060708090
100
1 3 5 7 9 11 13pH
[V] (
mg/
kg)
Aqua Regia
HNO3 Bomb
95%HNO3/5%HCLO4
Aqua Regia/HF/ Boric acid Microwave
NEN 7341 AVAIL
Own pHCSO2
0
5
10
15
20
25
30
35
40
45
2 4 6 8 10 12pH
[V] (
mg/
kg)
CW5:1:1:1Aqua RegiaHNO3 Bomb95%HNO3/5%HCLO4Aqua Regia/HF/ Boric acid MicrowaveNEN 7341 AVAIL
Own pH
0
5
10
15
20
25
2 4 6 8 10 12pH
[V] (
mg/
kg)
RWZS:1:1:1Aqua RegiaHNO3 Bomb95%HNO3/5%HCLO4Aqua Regia/HF/ Boric acid MicrowaveNEN 7341 AVAIL
Own pH
0
50
100
150
200
250
300
350
2 4 6 8 10 12
pH
[Zn]
(mg/
kg)
CW5:1:1:1Aqua RegiaHNO3 Bomb95%HNO3/5%HCLO4Aqua Regia/HF/ Boric acid MicrowaveNEN 7341 AVAIL
Own pH
pH0
200
400
600
800
1000
1200
2 4 6 8 10 12pH
[Zn]
(mg/
kg)
RWZS:1:1:1Aqua RegiaHNO3 Bomb95%HNO3/5%HCLO4Aqua Regia/HF/ Boric acid MicrowaveNEN 7341 AVAIL
Own pH

52 HORIZONTAL - 23
0
50
100
150
200
250
1 3 5 7 9 11 13pH
[Pb]
(mg/
kg)
CSO2:1:4:1SCE1SCE2Aqua RegiaHNO3 Bomb95%HNO3/5%HCLO4Aqua Regia/HF/ Boric acid MicrowaveNEN 7341 AVAIL
Own pH
0
500
1000
1500
2000
2500
1 3 5 7 9 11 13pH
[Pb]
(mg/
kg)
MAL:1:1:1MAL:1:11:1SCE2SCE1pHstatAqua RegiaHNO3 Bomb95%HNO3/5%HCLO4Aqua Regia/HF/ Boric acid MicrowaveNEN 7341 AVAIL
Own pH
0
20
40
60
80
100
120
2 4 6 8 10 12
pH
[Pb]
(mg/
kg)
CW5:1:1:1Aqua RegiaHNO3 Bomb95%HNO3/5%HCLO4Aqua Regia/HF/ Boric acid MicrowaveNEN 7341 AVAIL
Own pH
pH0
20
40
60
80
100
120
140
160
2 4 6 8 10 12pH
[Pb]
(mg/
kg)
RWZS:1:1:1Aqua RegiaHNO3 Bomb95%HNO3/5%HCLO4Aqua Regia/HF/ Boric acid MicrowaveNEN 7341 AVAIL
Own pH
0
200
400
600
800
1000
1200
1 3 5 7 9 11 13pH
[Mn]
(mg/
kg)
MAL:1:1:1MAL:1:11:1SCE2SCE1pHstatAqua RegiaHNO3 Bomb95%HNO3/5%HCLO4Aqua Regia/HF/ Boric acid MicrowaveNEN 7341 AVAIL
Own pH
0
500
1000
1500
2000
2500
3000
1 3 5 7 9 11 13pH
[Mn]
(mg/
kg)
Aqua Regia
HNO3 Bomb
95%HNO3/5%HCLO4
Aqua Regia/HF/ Boric acid Microwave
NEN 7341 AVAIL
Own pHCSO2
0
100
200
300
400
500
600
700
800
900
1000
2 4 6 8 10 12pH
[Mn]
(mg/
kg)
CW5:1:1:1Aqua RegiaHNO3 Bomb95%HNO3/5%HCLO4Aqua Regia/HF/ Boric acid MicrowaveNEN 7341 AVAIL
Own pH
0
100
200
300
400
500
600
2 4 6 8 10 12pH
[Mn]
(mg/
kg)
RWZS:1:1:1Aqua RegiaHNO3 Bomb95%HNO3/5%HCLO4Aqua Regia/HF/ Boric acid MicrowaveNEN 7341 AVAIL
Own pH
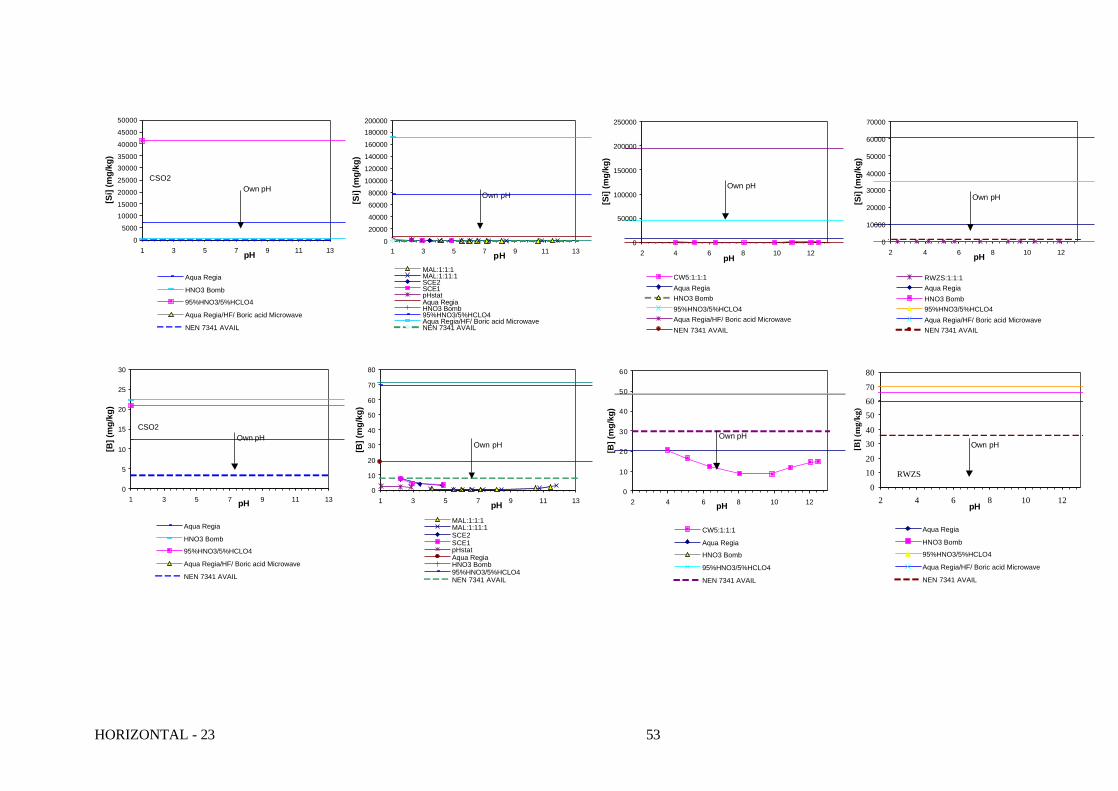
HORIZONTAL - 23 53
0
20000
40000
60000
80000
100000
120000
140000
160000
180000200000
1 3 5 7 9 11 13pH
[Si]
(mg/
kg)
MAL:1:1:1MAL:1:11:1SCE2SCE1pHstatAqua RegiaHNO3 Bomb95%HNO3/5%HCLO4Aqua Regia/HF/ Boric acid MicrowaveNEN 7341 AVAIL
Own pH
0
10
20
30
40
50
60
70
80
1 3 5 7 9 11 13pH
[B] (
mg/
kg)
MAL:1:1:1MAL:1:11:1SCE2SCE1pHstatAqua RegiaHNO3 Bomb95%HNO3/5%HCLO4NEN 7341 AVAIL
Own pH
0
5000
1000015000
20000
25000
3000035000
40000
45000
50000
1 3 5 7 9 11 13pH
[Si]
(mg/
kg)
Aqua Regia
HNO3 Bomb
95%HNO3/5%HCLO4
Aqua Regia/HF/ Boric acid Microwave
NEN 7341 AVAIL
Own pHCSO2
0
5
10
15
20
25
30
1 3 5 7 9 11 13pH
[B] (
mg/
kg)
Aqua Regia
HNO3 Bomb
95%HNO3/5%HCLO4
Aqua Regia/HF/ Boric acid Microwave
NEN 7341 AVAIL
Own pHCSO2
0
50000
100000
150000
200000
250000
2 4 6 8 10 12pH
[Si]
(mg/
kg)
CW5:1:1:1Aqua RegiaHNO3 Bomb95%HNO3/5%HCLO4Aqua Regia/HF/ Boric acid MicrowaveNEN 7341 AVAIL
Own pH
0
10000
20000
30000
40000
50000
60000
70000
2 4 6 8 10 12pH
[Si]
(mg/
kg)
RWZS:1:1:1Aqua RegiaHNO3 Bomb95%HNO3/5%HCLO4Aqua Regia/HF/ Boric acid MicrowaveNEN 7341 AVAIL
Own pH
0
10
20
30
40
50
60
2 4 6 8 10 12pH
[B] (
mg/
kg)
CW5:1:1:1
Aqua Regia
HNO3 Bomb
95%HNO3/5%HCLO4
NEN 7341 AVAIL
Own pH
0
1020
3040
506070
80
2 4 6 8 10 12pH
[B] (
mg/
kg)
Aqua Regia
HNO3 Bomb
95%HNO3/5%HCLO4
Aqua Regia/HF/ Boric acid Microwave
NEN 7341 AVAIL
Own pH
RWZS

54 HORIZONTAL - 23
0
2
4
6
8
10
12
14
1 3 5 7 9 11 13pH
[As]
(mg/
kg)
CSO2:1:4:1SCE1SCE2Aqua RegiaHNO3 Bomb95%HNO3/5%HCLO4Aqua Regia/HF/ Boric acid MicrowaveNEN 7341 AVAIL
Own pH
0
20
40
60
80
100
120
140
1 3 5 7 9 11 13pH
[As]
(mg/
kg)
MAL:1:1:1MAL:1:11:1SCE2SCE1pHstatAqua RegiaHNO3 Bomb95%HNO3/5%HCLO4Aqua Regia/HF/ Boric acid MicrowaveNEN 7341 AVAIL
Own pH
0
2000
4000
6000
8000
10000
12000
14000
1 3 5 7 9 11 13pH
[Ca]
(mg/
kg)
CSO2:1:4:1SCE1SCE2Aqua RegiaHNO3 Bomb95%HNO3/5%HCLO4Aqua Regia/HF/ Boric acid MicrowaveNEN 7341 AVAIL
Own pH
0
10000
20000
30000
40000
50000
60000
70000
80000
1 3 5 7 9 11 13pH
[Ca]
(mg/
kg)
MAL:1:1:1MAL:1:11:1SCE2SCE1pHstatAqua RegiaHNO3 Bomb95%HNO3/5%HCLO4Aqua Regia/HF/ Boric acid MicrowaveNEN 7341 AVAIL
Own pH
0
5000
10000
15000
20000
25000
30000
35000
40000
45000
2 4 6 8 10 12pH
[Ca]
(mg/
kg)
CW5:1:1:1Aqua RegiaHNO3 Bomb95%HNO3/5%HCLO4Aqua Regia/HF/ Boric acid MicrowaveNEN 7341 AVAIL
Own pH
0
5000
10000
15000
20000
25000
30000
35000
40000
2 4 6 8 10 12pH
[Ca]
(mg/
kg)
RWZS:1:1:1Aqua RegiaHNO3 Bomb95%HNO3/5%HCLO4Aqua Regia/HF/ Boric acid MicrowaveNEN 7341 AVAIL
Own pH
012
34
56
78
2 4 6 8 10 12pH
[As]
(mg/
kg)
Aqua Regia
HNO3 Bomb
95%HNO3/5%HCLO4
Aqua Regia/HF/ Boric acid Microwave
NEN 7341 AVAIL
Own pH
RWZS0
1
2
3
4
5
6
2 4 6 8 10 12pH
[As]
(mg/
kg)
Aqua Regia
HNO3 Bomb
95%HNO3/5%HCLO4
Aqua Regia/HF/ Boric acid Microwave
NEN 7341 AVAIL
Own pH
CW5

HORIZONTAL - 23 55
0
50
100
150
200
250
1 3 5 7 9 11 13pH
[V] (
mg/
kg)
MAL:1:1:1MAL:1:11:1SCE2SCE1pHstatAqua RegiaHNO3 Bomb95%HNO3/5%HCLO4Aqua Regia/HF/ Boric acid MicrowaveNEN 7341 AVAIL
Own pH
0
200
400
600
800
1000
1200
1400
1 3 5 7 9 11 13pH
[Zn]
(mg/
kg)
CSO2:1:4:1SCE1SCE2Aqua RegiaHNO3 Bomb95%HNO3/5%HCLO4Aqua Regia/HF/ Boric acid MicrowaveNEN 7341 AVAIL
Own pH
0
500
1000
1500
2000
2500
3000
1 3 5 7 9 11 13pH
[Zn]
(mg/
kg)
MAL:1:1:1MAL:1:11:1SCE2SCE1pHstatAqua RegiaHNO3 Bomb95%HNO3/5%HCLO4Aqua Regia/HF/ Boric acid MicrowaveNEN 7341 AVAIL
Own pH
0102030405060708090
100
1 3 5 7 9 11 13pH
[V] (
mg/
kg)
Aqua Regia
HNO3 Bomb
95%HNO3/5%HCLO4
Aqua Regia/HF/ Boric acid Microwave
NEN 7341 AVAIL
Own pHCSO2
0
5
10
15
20
25
30
35
40
45
2 4 6 8 10 12pH
[V] (
mg/
kg)
CW5:1:1:1Aqua RegiaHNO3 Bomb95%HNO3/5%HCLO4Aqua Regia/HF/ Boric acid MicrowaveNEN 7341 AVAIL
Own pH
0
5
10
15
20
25
2 4 6 8 10 12pH
[V] (
mg/
kg)
RWZS:1:1:1Aqua RegiaHNO3 Bomb95%HNO3/5%HCLO4Aqua Regia/HF/ Boric acid MicrowaveNEN 7341 AVAIL
Own pH
0
50
100
150
200
250
300
350
2 4 6 8 10 12pH
[Zn]
(mg/
kg)
CW5:1:1:1Aqua RegiaHNO3 Bomb95%HNO3/5%HCLO4Aqua Regia/HF/ Boric acid MicrowaveNEN 7341 AVAIL
Own pH
0
200
400
600
800
1000
1200
2 4 6 8 10 12pH
[Zn]
(mg/
kg)
RWZS:1:1:1Aqua RegiaHNO3 Bomb95%HNO3/5%HCLO4Aqua Regia/HF/ Boric acid MicrowaveNEN 7341 AVAIL
Own pH

56 HORIZONTAL - 23
0
50
100
150
200
250
1 3 5 7 9 11 13pH
[Pb]
(mg/
kg)
CSO2:1:4:1SCE1SCE2Aqua RegiaHNO3 Bomb95%HNO3/5%HCLO4Aqua Regia/HF/ Boric acid MicrowaveNEN 7341 AVAIL
Own pH
0
500
1000
1500
2000
2500
1 3 5 7 9 11 13pH
[Pb]
(mg/
kg)
MAL:1:1:1MAL:1:11:1SCE2SCE1pHstatAqua RegiaHNO3 Bomb95%HNO3/5%HCLO4Aqua Regia/HF/ Boric acid MicrowaveNEN 7341 AVAIL
Own pH
0
50
100
150
200
250
300
350
1 3 5 7 9 11 13pH
[Ni]
(mg/
kg)
CSO2:1:4:1SCE1SCE2Aqua RegiaHNO3 Bomb95%HNO3/5%HCLO4Aqua Regia/HF/ Boric acid MicrowaveNEN 7341 AVAIL
Own pH
0
500
1000
1500
2000
2500
1 3 5 7 9 11 13pH
[Ni]
(mg/
kg)
MAL:1:1:1MAL:1:11:1SCE2SCE1pHstatAqua RegiaHNO3 Bomb95%HNO3/5%HCLO4Aqua Regia/HF/ Boric acid MicrowaveNEN 7341 AVAIL
Own pH
0
20
40
60
80
100
120
2 4 6 8 10 12pH
[Pb]
(mg/
kg)
CW5:1:1:1Aqua RegiaHNO3 Bomb95%HNO3/5%HCLO4Aqua Regia/HF/ Boric acid MicrowaveNEN 7341 AVAIL
Own pH
0
20
40
60
80
100
120
140
160
2 4 6 8 10 12pH
[Pb]
(mg/
kg)
RWZS:1:1:1Aqua RegiaHNO3 Bomb95%HNO3/5%HCLO4Aqua Regia/HF/ Boric acid MicrowaveNEN 7341 AVAIL
Own pH
0
50
100
150
200
250
2 4 6 8 10 12pH
[Ni]
(mg/
kg)
CW5:1:1:1Aqua RegiaHNO3 Bomb95%HNO3/5%HCLO4Aqua Regia/HF/ Boric acid MicrowaveNEN 7341 AVAIL
Own pH
0
20
40
60
80
100
120
2 4 6 8 10 12pH
[Ni]
(mg/
kg)
RWZS:1:1:1Aqua RegiaHNO3 Bomb95%HNO3/5%HCLO4Aqua Regia/HF/ Boric acid MicrowaveNEN 7341 AVAIL
Own pH
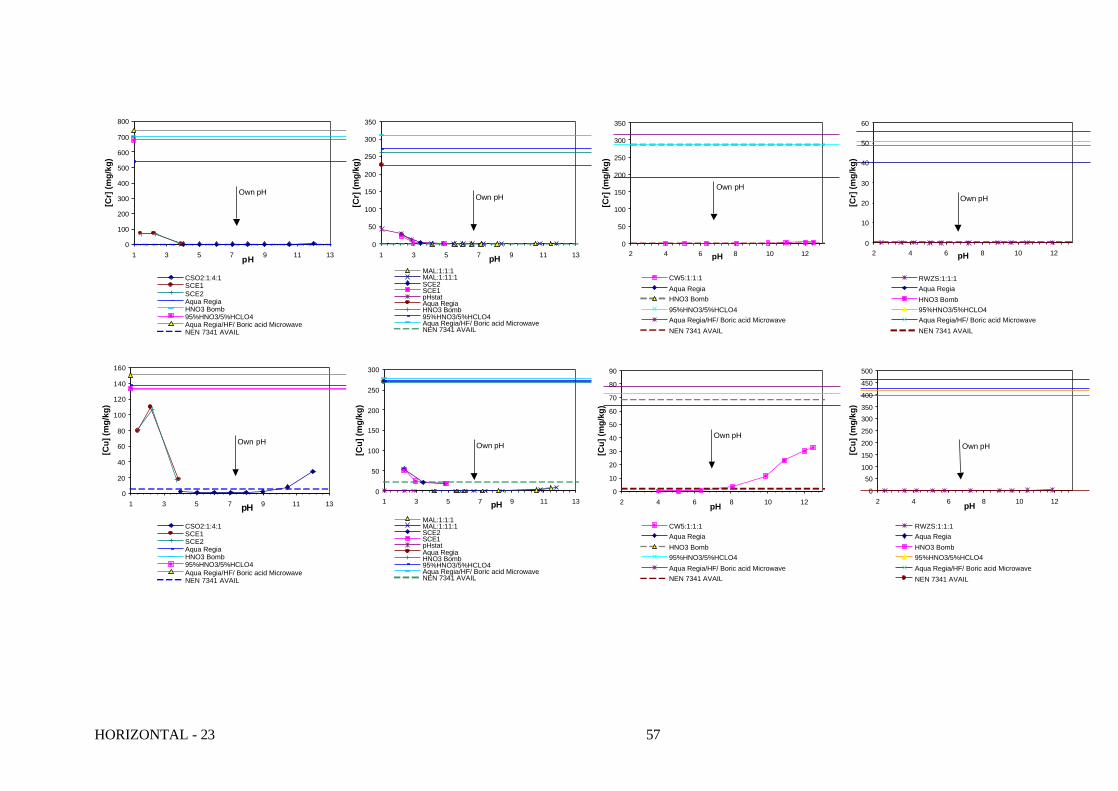
HORIZONTAL - 23 57
0
100
200
300
400
500
600
700
800
1 3 5 7 9 11 13pH
[Cr]
(mg/
kg)
CSO2:1:4:1SCE1SCE2Aqua RegiaHNO3 Bomb95%HNO3/5%HCLO4Aqua Regia/HF/ Boric acid MicrowaveNEN 7341 AVAIL
Own pH
0
50
100
150
200
250
300
350
1 3 5 7 9 11 13pH
[Cr]
(mg/
kg)
MAL:1:1:1MAL:1:11:1SCE2SCE1pHstatAqua RegiaHNO3 Bomb95%HNO3/5%HCLO4Aqua Regia/HF/ Boric acid MicrowaveNEN 7341 AVAIL
Own pH
0
20
40
60
80
100
120
140
160
1 3 5 7 9 11 13pH
[Cu]
(mg/
kg)
CSO2:1:4:1SCE1SCE2Aqua RegiaHNO3 Bomb95%HNO3/5%HCLO4Aqua Regia/HF/ Boric acid MicrowaveNEN 7341 AVAIL
Own pH
0
50
100
150
200
250
300
1 3 5 7 9 11 13pH
[Cu]
(mg/
kg)
MAL:1:1:1MAL:1:11:1SCE2SCE1pHstatAqua RegiaHNO3 Bomb95%HNO3/5%HCLO4Aqua Regia/HF/ Boric acid MicrowaveNEN 7341 AVAIL
Own pH
0
50
100
150
200
250
300
350
2 4 6 8 10 12pH
[Cr]
(mg/
kg)
CW5:1:1:1Aqua RegiaHNO3 Bomb95%HNO3/5%HCLO4Aqua Regia/HF/ Boric acid MicrowaveNEN 7341 AVAIL
Own pH
0
10
20
30
40
50
60
2 4 6 8 10 12pH
[Cr]
(mg/
kg)
RWZS:1:1:1Aqua RegiaHNO3 Bomb95%HNO3/5%HCLO4Aqua Regia/HF/ Boric acid MicrowaveNEN 7341 AVAIL
Own pH
0
10
20
30
40
50
60
70
80
90
2 4 6 8 10 12pH
[Cu]
(mg/
kg)
CW5:1:1:1Aqua RegiaHNO3 Bomb95%HNO3/5%HCLO4Aqua Regia/HF/ Boric acid MicrowaveNEN 7341 AVAIL
Own pH
0
50100
150
200
250
300350
400
450
500
2 4 6 8 10 12pH
[Cu]
(mg/
kg)
RWZS:1:1:1Aqua RegiaHNO3 Bomb95%HNO3/5%HCLO4Aqua Regia/HF/ Boric acid MicrowaveNEN 7341 AVAIL
Own pH
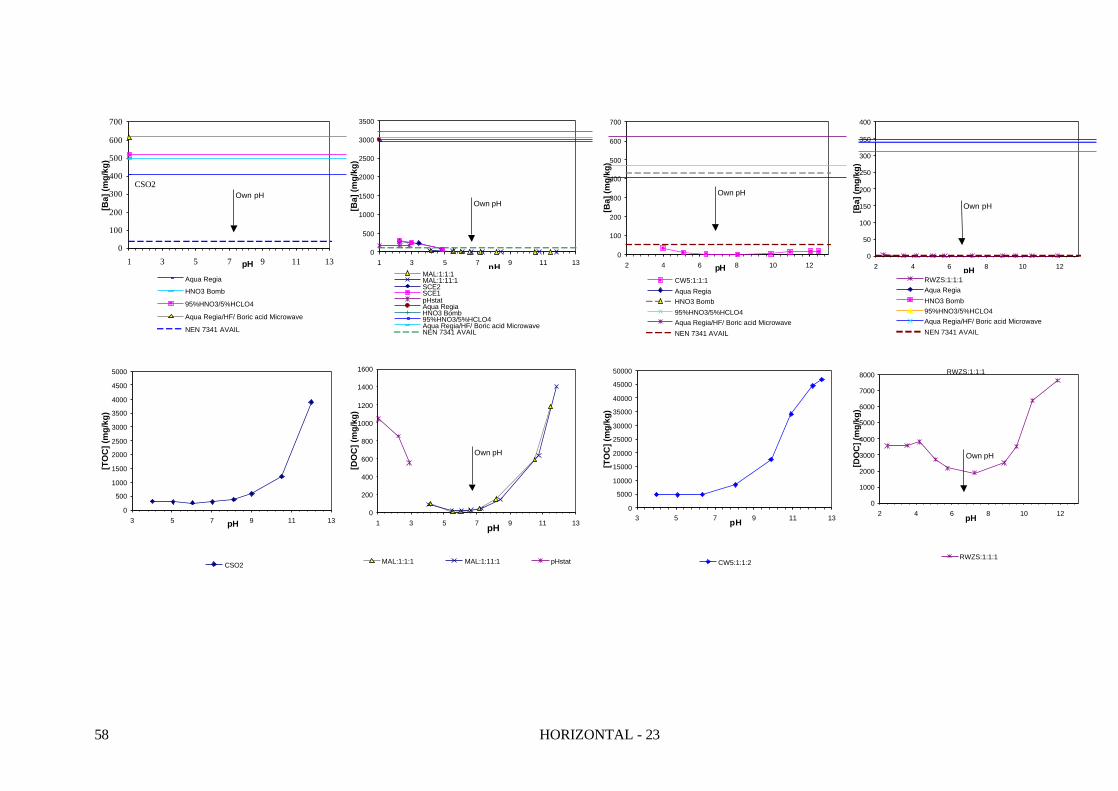
58 HORIZONTAL - 23
0
500
1000
1500
2000
2500
3000
3500
1 3 5 7 9 11 13pH
[Ba]
(mg/
kg)
MAL:1:1:1MAL:1:11:1SCE2SCE1pHstatAqua RegiaHNO3 Bomb95%HNO3/5%HCLO4Aqua Regia/HF/ Boric acid MicrowaveNEN 7341 AVAIL
Own pH
0
200
400
600
800
1000
1200
1400
1600
1 3 5 7 9 11 13pH
[DO
C] (
mg/
kg)
MAL:1:1:1 MAL:1:11:1 pHstat
Own pH
0
500
1000
1500
2000
2500
3000
3500
4000
4500
5000
3 5 7 9 11 13pH
[TO
C] (
mg/
kg)
CSO2
0
100
200
300
400
500
600
700
1 3 5 7 9 11 13pH
[Ba]
(mg/
kg)
Aqua Regia
HNO3 Bomb
95%HNO3/5%HCLO4
Aqua Regia/HF/ Boric acid Microwave
NEN 7341 AVAIL
Own pHCSO2
0
100
200
300
400
500
600
700
2 4 6 8 10 12pH
[Ba]
(mg/
kg)
CW5:1:1:1Aqua RegiaHNO3 Bomb95%HNO3/5%HCLO4Aqua Regia/HF/ Boric acid MicrowaveNEN 7341 AVAIL
Own pH
0
50
100
150
200
250
300
350
400
2 4 6 8 10 12pH
[Ba]
(mg/
kg)
RWZS:1:1:1Aqua RegiaHNO3 Bomb95%HNO3/5%HCLO4Aqua Regia/HF/ Boric acid MicrowaveNEN 7341 AVAIL
Own pH
RWZS:1:1:1
0
1000
2000
3000
4000
5000
6000
7000
8000
2 4 6 8 10 12pH
[DO
C] (
mg/
kg)
RWZS:1:1:1
Own pH
0
5000
10000
15000
20000
25000
30000
35000
40000
45000
50000
3 5 7 9 11 13pH
[TO
C] (
mg/
kg)
CW5:1:1:2
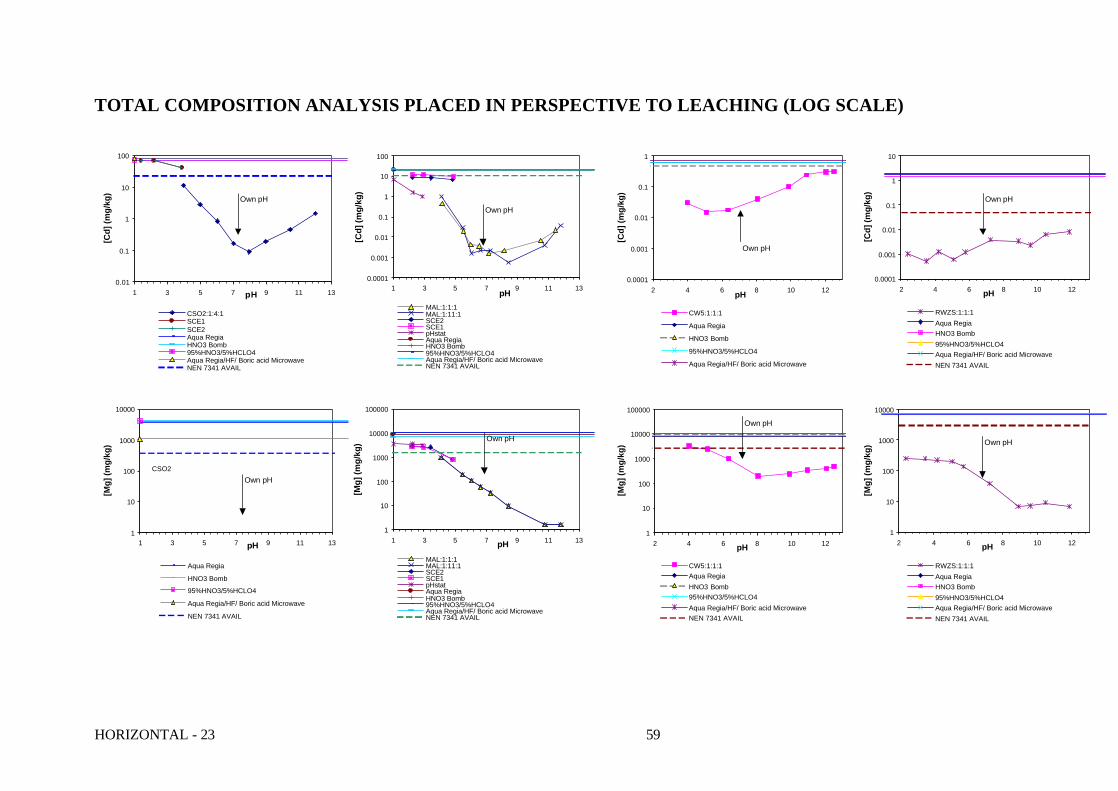
HORIZONTAL - 23 59
TOTAL COMPOSITION ANALYSIS PLACED IN PERSPECTIVE TO LEACHING (LOG SCALE)
0.01
0.1
1
10
100
1 3 5 7 9 11 13pH
[Cd]
(mg/
kg)
CSO2:1:4:1SCE1SCE2Aqua RegiaHNO3 Bomb95%HNO3/5%HCLO4Aqua Regia/HF/ Boric acid MicrowaveNEN 7341 AVAIL
Own pH
0.0001
0.001
0.01
0.1
1
10
100
1 3 5 7 9 11 13pH
[Cd]
(mg/
kg)
MAL:1:1:1MAL:1:11:1SCE2SCE1pHstatAqua RegiaHNO3 Bomb95%HNO3/5%HCLO4Aqua Regia/HF/ Boric acid MicrowaveNEN 7341 AVAIL
Own pH
1
10
100
1000
10000
100000
1 3 5 7 9 11 13pH
[Mg]
(mg/
kg)
MAL:1:1:1MAL:1:11:1SCE2SCE1pHstatAqua RegiaHNO3 Bomb95%HNO3/5%HCLO4Aqua Regia/HF/ Boric acid MicrowaveNEN 7341 AVAIL
Own pH
1
10
100
1000
10000
1 3 5 7 9 11 13pH
[Mg]
(mg/
kg)
Aqua Regia
HNO3 Bomb
95%HNO3/5%HCLO4
Aqua Regia/HF/ Boric acid Microwave
NEN 7341 AVAIL
Own pHCSO2
0.0001
0.001
0.01
0.1
1
2 4 6 8 10 12pH
[Cd]
(mg/
kg)
CW5:1:1:1
Aqua Regia
HNO3 Bomb
95%HNO3/5%HCLO4
Aqua Regia/HF/ Boric acid Microwave
Own pH
0.0001
0.001
0.01
0.1
1
10
2 4 6 8 10 12pH
[Cd]
(mg/
kg)
RWZS:1:1:1Aqua RegiaHNO3 Bomb95%HNO3/5%HCLO4Aqua Regia/HF/ Boric acid MicrowaveNEN 7341 AVAIL
Own pH
1
10
100
1000
10000
100000
2 4 6 8 10 12pH
[Mg]
(mg/
kg)
CW5:1:1:1Aqua RegiaHNO3 Bomb95%HNO3/5%HCLO4Aqua Regia/HF/ Boric acid MicrowaveNEN 7341 AVAIL
Own pH
1
10
100
1000
10000
2 4 6 8 10 12pH
[Mg]
(mg/
kg)
RWZS:1:1:1Aqua RegiaHNO3 Bomb95%HNO3/5%HCLO4Aqua Regia/HF/ Boric acid MicrowaveNEN 7341 AVAIL
Own pH

60 HORIZONTAL - 23
0.001
0.01
0.1
1
10
100
1000
10000
100000
1 3 5 7 9 11 13pH
[Fe]
(mg/
kg)
MAL:1:1:1MAL:1:11:1SCE2SCE1pHstatAqua RegiaHNO3 Bomb95%HNO3/5%HCLO4Aqua Regia/HF/ Boric acid MicrowaveNEN 7341 AVAIL
Own pH
0.1
1
10
100
1000
10000
1 3 5 7 9 11 13pH
[Mn]
(mg/
kg)
MAL:1:1:1MAL:1:11:1SCE2SCE1pHstatAqua RegiaHNO3 Bomb95%HNO3/5%HCLO4Aqua Regia/HF/ Boric acid MicrowaveNEN 7341 AVAIL
Own pH
0.001
0.01
0.1
1
10
100
1000
10000
100000
1 3 5 7 9 11 13pH
[Fe]
(mg/
kg)
Aqua Regia
HNO3 Bomb
95%HNO3/5%HCLO4
Aqua Regia/HF/ Boric acid Microwave
NEN 7341 AVAIL
Own pH
CSO2
1
10
100
1000
10000
1 3 5 7 9 11 13pH
[Mn]
(mg/
kg)
Aqua Regia
HNO3 Bomb
95%HNO3/5%HCLO4
Aqua Regia/HF/ Boric acid Microwave
NEN 7341 AVAIL
Own pHCSO2
0.001
0.01
0.1
1
10
100
1000
10000
100000
2 4 6 8 10 12pH
[Fe]
(mg/
kg)
CW5:1:1:1Aqua RegiaHNO3 Bomb95%HNO3/5%HCLO4Aqua Regia/HF/ Boric acid MicrowaveNEN 7341 AVAIL
Own pH
0.001
0.01
0.1
1
10
100
1000
10000
100000
2 4 6 8 10 12pH
[Fe]
(mg/
kg)
RWZS:1:1:1Aqua RegiaHNO3 Bomb95%HNO3/5%HCLO4Aqua Regia/HF/ Boric acid MicrowaveNEN 7341 AVAIL
Own pH
10
100
1000
2 4 6 8 10 12pH
[Mn]
(mg/
kg)
CW5:1:1:1Aqua RegiaHNO3 Bomb95%HNO3/5%HCLO4Aqua Regia/HF/ Boric acid MicrowaveNEN 7341 AVAIL
Own pH
0.1
1
10
100
1000
2 4 6 8 10 12pH
[Mn]
(mg/
kg)
RWZS:1:1:1Aqua RegiaHNO3 Bomb95%HNO3/5%HCLO4Aqua Regia/HF/ Boric acid MicrowaveNEN 7341 AVAIL
Own pH

HORIZONTAL - 23 61
10
100
1000
10000
100000
1000000
1 3 5 7 9 11 13pH
[Si]
(mg/
kg)
MAL:1:1:1MAL:1:11:1SCE2SCE1pHstatAqua RegiaHNO3 Bomb95%HNO3/5%HCLO4Aqua Regia/HF/ Boric acid MicrowaveNEN 7341 AVAIL
Own pH
0.1
1
10
100
1 3 5 7 9 11 13pH
[B] (
mg/
kg)
MAL:1:1:1MAL:1:11:1SCE2SCE1pHstatAqua RegiaHNO3 Bomb95%HNO3/5%HCLO4NEN 7341 AVAIL
Own pH
1
10
100
1000
10000
100000
1 3 5 7 9 11 13pH
[Si]
(mg/
kg)
Aqua Regia
HNO3 Bomb
95%HNO3/5%HCLO4
Aqua Regia/HF/ Boric acid Microwave
NEN 7341 AVAIL
Own pHCSO2
0
5
10
15
20
25
30
1 3 5 7 9 11 13pH
[B] (
mg/
kg)
Aqua Regia
HNO3 Bomb
95%HNO3/5%HCLO4
Aqua Regia/HF/ Boric acid Microwave
NEN 7341 AVAIL
Own pHCSO2
10
100
1000
10000
100000
1000000
2 4 6 8 10 12pH
[Si]
(mg/
kg)
CW5:1:1:1Aqua RegiaHNO3 Bomb95%HNO3/5%HCLO4Aqua Regia/HF/ Boric acid MicrowaveNEN 7341 AVAIL
Own pH
1
10
100
1000
10000
100000
2 4 6 8 10 12pH
[Si]
(mg/
kg)
RWZS:1:1:1Aqua RegiaHNO3 Bomb95%HNO3/5%HCLO4Aqua Regia/HF/ Boric acid MicrowaveNEN 7341 AVAIL
Own pH
1
10
100
2 4 6 8 10 12pH
[B] (
mg/
kg)
CW5:1:1:1
Aqua Regia
HNO3 Bomb
95%HNO3/5%HCLO4
NEN 7341 AVAIL
Own pH
1
10
100
2 4 6 8 10 12pH
[B] (
mg/
kg)
Aqua Regia
HNO3 Bomb
95%HNO3/5%HCLO4
Aqua Regia/HF/ Boric acid Microwave
NEN 7341 AVAIL
Own pH
RWZS

62 HORIZONTAL - 23
0.01
0.1
1
10
100
1 3 5 7 9 11 13pH
[As]
(mg/
kg)
CSO2:1:4:1SCE1SCE2Aqua RegiaHNO3 Bomb95%HNO3/5%HCLO4Aqua Regia/HF/ Boric acid MicrowaveNEN 7341 AVAIL
Own pH
0.01
0.1
1
10
100
1000
1 3 5 7 9 11 13pH
[As]
(mg/
kg)
MAL:1:1:1MAL:1:11:1SCE2SCE1pHstatAqua RegiaHNO3 Bomb95%HNO3/5%HCLO4Aqua Regia/HF/ Boric acid MicrowaveNEN 7341 AVAIL
Own pH
1
10
100
1000
10000
100000
1 3 5 7 9 11 13pH
[Ca]
(mg/
kg)
CSO2:1:4:1SCE1SCE2Aqua RegiaHNO3 Bomb95%HNO3/5%HCLO4Aqua Regia/HF/ Boric acid MicrowaveNEN 7341 AVAIL
Own pH
1
10
100
1000
10000
100000
1 3 5 7 9 11 13pH
[Ca]
(mg/
kg)
MAL:1:1:1MAL:1:11:1SCE2SCE1pHstatAqua RegiaHNO3 Bomb95%HNO3/5%HCLO4Aqua Regia/HF/ Boric acid MicrowaveNEN 7341 AVAIL
Own pH
1
10
100
1000
10000
100000
2 4 6 8 10 12pH
[Ca]
(mg/
kg)
CW5:1:1:1Aqua RegiaHNO3 Bomb95%HNO3/5%HCLO4Aqua Regia/HF/ Boric acid MicrowaveNEN 7341 AVAIL
Own pH
1
10
100
1000
10000
100000
2 4 6 8 10 12pH
[Ca]
(mg/
kg)
RWZS:1:1:1Aqua RegiaHNO3 Bomb95%HNO3/5%HCLO4Aqua Regia/HF/ Boric acid MicrowaveNEN 7341 AVAIL
Own pH
0.01
0.1
1
10
2 4 6 8 10 12pH
[As]
(mg/
kg)
Aqua Regia
HNO3 Bomb
95%HNO3/5%HCLO4
Aqua Regia/HF/ Boric acid Microwave
NEN 7341 AVAIL
Own pH
RWZS
0.01
0.1
1
10
2 4 6 8 10 12pH
[As]
(mg/
kg)
Aqua Regia
HNO3 Bomb
95%HNO3/5%HCLO4
Aqua Regia/HF/ Boric acid Microwave
NEN 7341 AVAIL
Own pH
CW5

HORIZONTAL - 23 63
0.01
0.1
1
10
100
1000
1 3 5 7 9 11 13pH
[V] (
mg/
kg)
MAL:1:1:1MAL:1:11:1SCE2SCE1pHstatAqua RegiaHNO3 Bomb95%HNO3/5%HCLO4Aqua Regia/HF/ Boric acid MicrowaveNEN 7341 AVAIL
Own pH
0.1
1
10
100
1000
10000
1 3 5 7 9 11 13pH
[Zn]
(mg/
kg)
CSO2:1:4:1SCE1SCE2Aqua RegiaHNO3 Bomb95%HNO3/5%HCLO4Aqua Regia/HF/ Boric acid MicrowaveNEN 7341 AVAIL
Own pH
0.1
1
10
100
1000
10000
1 3 5 7 9 11 13pH
[Zn]
(mg/
kg)
MAL:1:1:1MAL:1:11:1SCE2SCE1pHstatAqua RegiaHNO3 Bomb95%HNO3/5%HCLO4Aqua Regia/HF/ Boric acid MicrowaveNEN 7341 AVAIL
Own pH
0.1
1
10
100
1000
1 3 5 7 9 11 13pH
[V] (
mg/
kg)
Aqua Regia
HNO3 Bomb
95%HNO3/5%HCLO4
Aqua Regia/HF/ Boric acid Microwave
NEN 7341 AVAIL
Own pH
CSO2
0.1
1
10
100
2 4 6 8 10 12pH
[V] (
mg/
kg)
CW5:1:1:1Aqua RegiaHNO3 Bomb95%HNO3/5%HCLO4Aqua Regia/HF/ Boric acid MicrowaveNEN 7341 AVAIL
Own pH
0.001
0.01
0.1
1
10
100
2 4 6 8 10 12pH
[V] (
mg/
kg)
RWZS:1:1:1Aqua RegiaHNO3 Bomb95%HNO3/5%HCLO4Aqua Regia/HF/ Boric acid MicrowaveNEN 7341 AVAIL
Own pH
1
10
100
1000
2 4 6 8 10 12pH
[Zn]
(mg/
kg)
CW5:1:1:1Aqua RegiaHNO3 Bomb95%HNO3/5%HCLO4Aqua Regia/HF/ Boric acid MicrowaveNEN 7341 AVAIL
Own pH
0.1
1
10
100
1000
10000
2 4 6 8 10 12pH
[Zn]
(mg/
kg)
RWZS:1:1:1Aqua RegiaHNO3 BombAqua Regia/HF/ Boric acid MicrowaveNEN 7341 AVAIL95%HNO3/5%HCLO4
Own pH

64 HORIZONTAL - 23
0.001
0.01
0.1
1
10
100
1000
1 3 5 7 9 11 13pH
[Pb]
(mg/
kg)
CSO2:1:4:1SCE1SCE2Aqua RegiaHNO3 Bomb95%HNO3/5%HCLO4Aqua Regia/HF/ Boric acid MicrowaveNEN 7341 AVAIL
Own pH
0.01
0.1
1
10
100
1000
10000
1 3 5 7 9 11 13pH
[Pb]
(mg/
kg)
MAL:1:1:1MAL:1:11:1SCE2SCE1pHstatAqua RegiaHNO3 Bomb95%HNO3/5%HCLO4Aqua Regia/HF/ Boric acid MicrowaveNEN 7341 AVAIL
Own pH
1
10
100
1000
1 3 5 7 9 11 13pH
[Ni]
(mg/
kg)
CSO2:1:4:1SCE1SCE2Aqua RegiaHNO3 Bomb95%HNO3/5%HCLO4Aqua Regia/HF/ Boric acid MicrowaveNEN 7341 AVAIL
Own pH
0.001
0.01
0.1
1
10
100
1000
10000
1 3 5 7 9 11 13pH
[Ni]
(mg/
kg)
MAL:1:1:1MAL:1:11:1SCE2SCE1pHstatAqua RegiaHNO3 Bomb95%HNO3/5%HCLO4Aqua Regia/HF/ Boric acid MicrowaveNEN 7341 AVAIL
Own pH
0.1
1
10
100
2 4 6 8 10 12pH
[Pb]
(mg/
kg)
CW5:1:1:1Aqua RegiaHNO3 Bomb95%HNO3/5%HCLO4Aqua Regia/HF/ Boric acid MicrowaveNEN 7341 AVAIL
Own pH
0.01
0.1
1
10
100
1000
2 4 6 8 10 12pH
[Pb]
(mg/
kg)
RWZS:1:1:1Aqua RegiaHNO3 Bomb95%HNO3/5%HCLO4Aqua Regia/HF/ Boric acid MicrowaveNEN 7341 AVAIL
Own pH
0.1
1
10
100
1000
2 4 6 8 10 12pH
[Ni]
(mg/
kg)
CW5:1:1:1Aqua RegiaHNO3 Bomb95%HNO3/5%HCLO4Aqua Regia/HF/ Boric acid MicrowaveNEN 7341 AVAIL
Own pH
0.01
0.1
1
10
100
1000
2 4 6 8 10 12pH
[Ni]
(mg/
kg)
RWZS:1:1:1Aqua RegiaHNO3 Bomb95%HNO3/5%HCLO4Aqua Regia/HF/ Boric acid MicrowaveNEN 7341 AVAIL
Own pH

HORIZONTAL - 23 65
10
100
1000
10000
100000
1000000
1 3 5 7 9 11 13pH
[Si]
(mg/
kg)
MAL:1:1:1MAL:1:11:1SCE2SCE1pHstatAqua RegiaHNO3 Bomb95%HNO3/5%HCLO4Aqua Regia/HF/ Boric acid MicrowaveNEN 7341 AVAIL
Own pH
0.1
1
10
100
1 3 5 7 9 11 13pH
[B] (
mg/
kg)
MAL:1:1:1MAL:1:11:1SCE2SCE1pHstatAqua RegiaHNO3 Bomb95%HNO3/5%HCLO4NEN 7341 AVAIL
Own pH
1
10
100
1000
10000
100000
1 3 5 7 9 11 13pH
[Si]
(mg/
kg)
Aqua Regia
HNO3 Bomb
95%HNO3/5%HCLO4
Aqua Regia/HF/ Boric acid Microwave
NEN 7341 AVAIL
Own pH
CSO2
0
5
10
15
20
25
30
1 3 5 7 9 11 13pH
[B] (
mg/
kg)
Aqua Regia
HNO3 Bomb
95%HNO3/5%HCLO4
Aqua Regia/HF/ Boric acid Microwave
NEN 7341 AVAIL
Own pHCSO2
10
100
1000
10000
100000
1000000
2 4 6 8 10 12pH
[Si]
(mg/
kg)
CW5:1:1:1Aqua RegiaHNO3 Bomb95%HNO3/5%HCLO4Aqua Regia/HF/ Boric acid MicrowaveNEN 7341 AVAIL
Own pH
1
10
100
1000
10000
100000
2 4 6 8 10 12pH
[Si]
(mg/
kg)
RWZS:1:1:1Aqua RegiaHNO3 Bomb95%HNO3/5%HCLO4Aqua Regia/HF/ Boric acid MicrowaveNEN 7341 AVAIL
Own pH
1
10
100
2 4 6 8 10 12pH
[B] (
mg/
kg)
CW5:1:1:1
Aqua Regia
HNO3 Bomb
95%HNO3/5%HCLO4
NEN 7341 AVAIL
Own pH
1
10
100
2 4 6 8 10 12pH
[B] (
mg/
kg)
Aqua Regia
HNO3 Bomb
95%HNO3/5%HCLO4
Aqua Regia/HF/ Boric acid Microwave
NEN 7341 AVAIL
Own pH
RWZS

66 HORIZONTAL - 23
0.01
0.1
1
10
100
1 3 5 7 9 11 13pH
[As]
(mg/
kg)
CSO2:1:4:1SCE1SCE2Aqua RegiaHNO3 Bomb95%HNO3/5%HCLO4Aqua Regia/HF/ Boric acid MicrowaveNEN 7341 AVAIL
Own pH
0.01
0.1
1
10
100
1000
1 3 5 7 9 11 13pH
[As]
(mg/
kg)
MAL:1:1:1MAL:1:11:1SCE2SCE1pHstatAqua RegiaHNO3 Bomb95%HNO3/5%HCLO4Aqua Regia/HF/ Boric acid MicrowaveNEN 7341 AVAIL
Own pH
1
10
100
1000
10000
100000
1 3 5 7 9 11 13pH
[Ca]
(mg/
kg)
CSO2:1:4:1SCE1SCE2Aqua RegiaHNO3 Bomb95%HNO3/5%HCLO4Aqua Regia/HF/ Boric acid MicrowaveNEN 7341 AVAIL
Own pH
1
10
100
1000
10000
100000
1 3 5 7 9 11 13pH
[Ca]
(mg/
kg)
MAL:1:1:1MAL:1:11:1SCE2SCE1pHstatAqua RegiaHNO3 Bomb95%HNO3/5%HCLO4Aqua Regia/HF/ Boric acid MicrowaveNEN 7341 AVAIL
Own pH
1
10
100
1000
10000
100000
2 4 6 8 10 12pH
[Ca]
(mg/
kg)
CW5:1:1:1Aqua RegiaHNO3 Bomb95%HNO3/5%HCLO4Aqua Regia/HF/ Boric acid MicrowaveNEN 7341 AVAIL
Own pH
1
10
100
1000
10000
100000
2 4 6 8 10 12pH
[Ca]
(mg/
kg)
RWZS:1:1:1Aqua RegiaHNO3 Bomb95%HNO3/5%HCLO4Aqua Regia/HF/ Boric acid MicrowaveNEN 7341 AVAIL
Own pH
0.01
0.1
1
10
2 4 6 8 10 12pH
[As]
(mg/
kg)
Aqua Regia
HNO3 Bomb
95%HNO3/5%HCLO4
Aqua Regia/HF/ Boric acid Microwave
NEN 7341 AVAIL
Own pH
RWZS
0.01
0.1
1
10
2 4 6 8 10 12pH
[As]
(mg/
kg)
Aqua Regia
HNO3 Bomb
95%HNO3/5%HCLO4
Aqua Regia/HF/ Boric acid Microwave
NEN 7341 AVAIL
Own pH
CW5
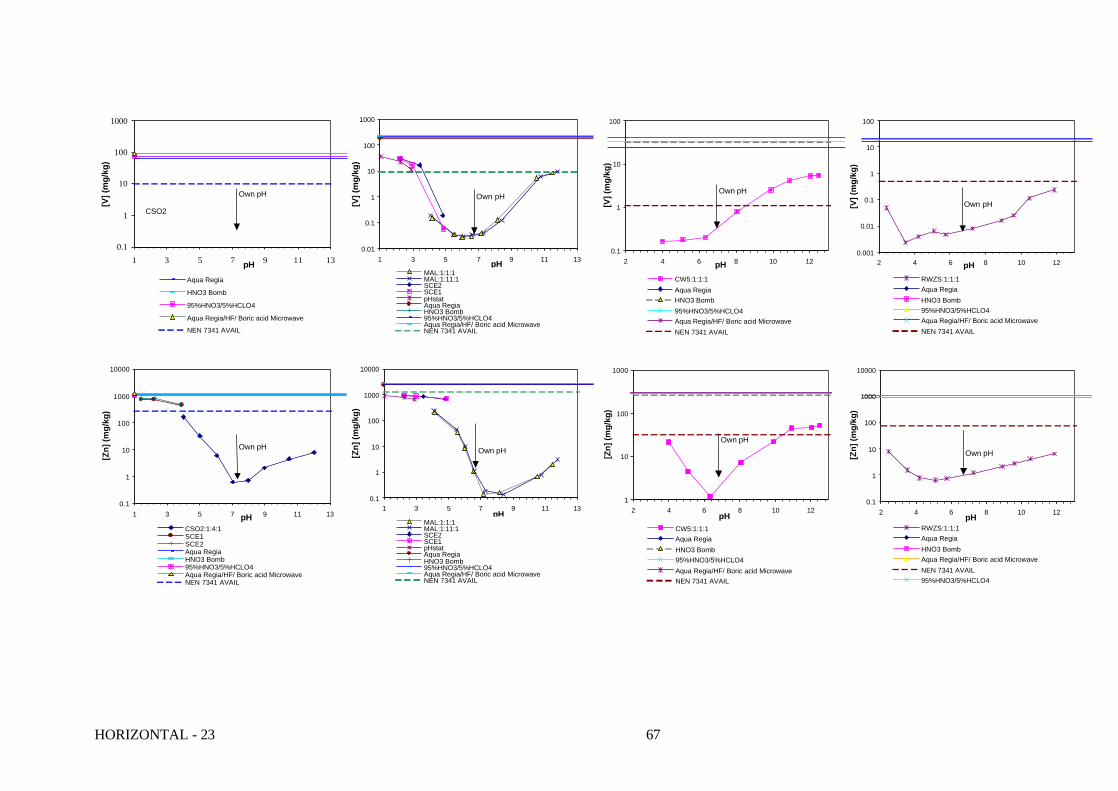
HORIZONTAL - 23 67
0.01
0.1
1
10
100
1000
1 3 5 7 9 11 13pH
[V] (
mg/
kg)
MAL:1:1:1MAL:1:11:1SCE2SCE1pHstatAqua RegiaHNO3 Bomb95%HNO3/5%HCLO4Aqua Regia/HF/ Boric acid MicrowaveNEN 7341 AVAIL
Own pH
0.1
1
10
100
1000
10000
1 3 5 7 9 11 13pH
[Zn]
(mg/
kg)
CSO2:1:4:1SCE1SCE2Aqua RegiaHNO3 Bomb95%HNO3/5%HCLO4Aqua Regia/HF/ Boric acid MicrowaveNEN 7341 AVAIL
Own pH
0.1
1
10
100
1000
10000
1 3 5 7 9 11 13pH
[Zn]
(mg/
kg)
MAL:1:1:1MAL:1:11:1SCE2SCE1pHstatAqua RegiaHNO3 Bomb95%HNO3/5%HCLO4Aqua Regia/HF/ Boric acid MicrowaveNEN 7341 AVAIL
Own pH
0.1
1
10
100
1000
1 3 5 7 9 11 13pH
[V] (
mg/
kg)
Aqua Regia
HNO3 Bomb
95%HNO3/5%HCLO4
Aqua Regia/HF/ Boric acid Microwave
NEN 7341 AVAIL
Own pH
CSO2
0.1
1
10
100
2 4 6 8 10 12pH
[V] (
mg/
kg)
CW5:1:1:1Aqua RegiaHNO3 Bomb95%HNO3/5%HCLO4Aqua Regia/HF/ Boric acid MicrowaveNEN 7341 AVAIL
Own pH
0.001
0.01
0.1
1
10
100
2 4 6 8 10 12pH
[V] (
mg/
kg)
RWZS:1:1:1Aqua RegiaHNO3 Bomb95%HNO3/5%HCLO4Aqua Regia/HF/ Boric acid MicrowaveNEN 7341 AVAIL
Own pH
1
10
100
1000
2 4 6 8 10 12pH
[Zn]
(mg/
kg)
CW5:1:1:1Aqua RegiaHNO3 Bomb95%HNO3/5%HCLO4Aqua Regia/HF/ Boric acid MicrowaveNEN 7341 AVAIL
Own pH
0.1
1
10
100
1000
10000
2 4 6 8 10 12pH
[Zn]
(mg/
kg)
RWZS:1:1:1Aqua RegiaHNO3 BombAqua Regia/HF/ Boric acid MicrowaveNEN 7341 AVAIL95%HNO3/5%HCLO4
Own pH

68 HORIZONTAL - 23
0.001
0.01
0.1
1
10
100
1000
1 3 5 7 9 11 13pH
[Pb]
(mg/
kg)
CSO2:1:4:1SCE1SCE2Aqua RegiaHNO3 Bomb95%HNO3/5%HCLO4Aqua Regia/HF/ Boric acid MicrowaveNEN 7341 AVAIL
Own pH
0.01
0.1
1
10
100
1000
10000
1 3 5 7 9 11 13pH
[Pb]
(mg/
kg)
MAL:1:1:1MAL:1:11:1SCE2SCE1pHstatAqua RegiaHNO3 Bomb95%HNO3/5%HCLO4Aqua Regia/HF/ Boric acid MicrowaveNEN 7341 AVAIL
Own pH
1
10
100
1000
1 3 5 7 9 11 13pH
[Ni]
(mg/
kg)
CSO2:1:4:1SCE1SCE2Aqua RegiaHNO3 Bomb95%HNO3/5%HCLO4Aqua Regia/HF/ Boric acid MicrowaveNEN 7341 AVAIL
Own pH
0.001
0.01
0.1
1
10
100
1000
10000
1 3 5 7 9 11 13pH
[Ni]
(mg/
kg)
MAL:1:1:1MAL:1:11:1SCE2SCE1pHstatAqua RegiaHNO3 Bomb95%HNO3/5%HCLO4Aqua Regia/HF/ Boric acid MicrowaveNEN 7341 AVAIL
Own pH
0.1
1
10
100
2 4 6 8 10 12pH
[Pb]
(mg/
kg)
CW5:1:1:1Aqua RegiaHNO3 Bomb95%HNO3/5%HCLO4Aqua Regia/HF/ Boric acid MicrowaveNEN 7341 AVAIL
Own pH
0.01
0.1
1
10
100
1000
2 4 6 8 10 12pH
[Pb]
(mg/
kg)
RWZS:1:1:1Aqua RegiaHNO3 Bomb95%HNO3/5%HCLO4Aqua Regia/HF/ Boric acid MicrowaveNEN 7341 AVAIL
Own pH
0.1
1
10
100
1000
2 4 6 8 10 12pH
[Ni]
(mg/
kg)
CW5:1:1:1Aqua RegiaHNO3 Bomb95%HNO3/5%HCLO4Aqua Regia/HF/ Boric acid MicrowaveNEN 7341 AVAIL
Own pH
0.01
0.1
1
10
100
1000
2 4 6 8 10 12pH
[Ni]
(mg/
kg)
RWZS:1:1:1Aqua RegiaHNO3 Bomb95%HNO3/5%HCLO4Aqua Regia/HF/ Boric acid MicrowaveNEN 7341 AVAIL
Own pH

HORIZONTAL - 23 69
0.1
1
10
100
1000
1 3 5 7 9 11 13pH
[Cr]
(mg/
kg)
CSO2:1:4:1SCE1SCE2Aqua RegiaHNO3 Bomb95%HNO3/5%HCLO4Aqua Regia/HF/ Boric acid MicrowaveNEN 7341 AVAIL
Own pH
0.001
0.01
0.1
1
10
100
1000
1 3 5 7 9 11 13pH
[Cr]
(mg/
kg)
MAL:1:1:1MAL:1:11:1SCE2SCE1pHstatAqua RegiaHNO3 Bomb95%HNO3/5%HCLO4Aqua Regia/HF/ Boric acid MicrowaveNEN 7341 AVAIL
Own pH
0.1
1
10
100
1000
1 3 5 7 9 11 13pH
[Cu]
(mg/
kg)
CSO2:1:4:1SCE1SCE2Aqua RegiaHNO3 Bomb95%HNO3/5%HCLO4Aqua Regia/HF/ Boric acid MicrowaveNEN 7341 AVAIL
Own pH
0.001
0.01
0.1
1
10
100
1000
1 3 5 7 9 11 13pH
[Cu]
(mg/
kg)
MAL:1:1:1MAL:1:11:1SCE2SCE1pHstatAqua RegiaHNO3 Bomb95%HNO3/5%HCLO4Aqua Regia/HF/ Boric acid MicrowaveNEN 7341 AVAIL
Own pH
0.1
1
10
100
1000
2 4 6 8 10 12pH
[Cr]
(mg/
kg)
CW5:1:1:1Aqua RegiaHNO3 Bomb95%HNO3/5%HCLO4Aqua Regia/HF/ Boric acid MicrowaveNEN 7341 AVAIL
Own pH
0.01
0.1
1
10
100
2 4 6 8 10 12pH
[Cr]
(mg/
kg)
RWZS:1:1:1Aqua RegiaHNO3 Bomb95%HNO3/5%HCLO4Aqua Regia/HF/ Boric acid MicrowaveNEN 7341 AVAIL
Own pH
0.1
1
10
100
2 4 6 8 10 12pH
[Cu]
(mg/
kg)
CW5:1:1:1Aqua RegiaHNO3 Bomb95%HNO3/5%HCLO4Aqua Regia/HF/ Boric acid MicrowaveNEN 7341 AVAIL
Own pH
0.01
0.1
1
10
100
1000
2 4 6 8 10 12pH
[Cu]
(mg/
kg)
RWZS:1:1:1Aqua RegiaHNO3 Bomb95%HNO3/5%HCLO4Aqua Regia/HF/ Boric acid MicrowaveNEN 7341 AVAIL
Own pH

70 HORIZONTAL - 23
0.1
1
10
100
1000
10000
1 3 5 7 9 11 13pH
[Ba]
(mg/
kg)
MAL:1:1:1MAL:1:11:1SCE2SCE1pHstatAqua RegiaHNO3 Bomb95%HNO3/5%HCLO4Aqua Regia/HF/ Boric acid MicrowaveNEN 7341 AVAIL
Own pH
1
10
100
1000
10000
1 3 5 7 9 11 13pH
[DO
C] (
mg/
kg)
MAL:1:1:1 MAL:1:11:1 pHstat
Own pH
100
1000
10000
3 5 7 9 11 13pH
[TO
C] (
mg/
kg)
CSO2
0.1
1
10
100
1000
1 3 5 7 9 11 13pH
[Ba]
(mg/
kg)
Aqua Regia
HNO3 Bomb
95%HNO3/5%HCLO4
Aqua Regia/HF/ Boric acid Microwave
NEN 7341 AVAIL
Own pHCSO2
1
10
100
1000
2 4 6 8 10 12pH
[Ba]
(mg/
kg)
CW5:1:1:1Aqua RegiaHNO3 Bomb95%HNO3/5%HCLO4Aqua Regia/HF/ Boric acid MicrowaveNEN 7341 AVAIL
Own pH
0.01
0.1
1
10
100
1000
2 4 6 8 10 12pH
[Ba]
(mg/
kg)
RWZS:1:1:1Aqua RegiaHNO3 Bomb95%HNO3/5%HCLO4Aqua Regia/HF/ Boric acid MicrowaveNEN 7341 AVAIL
Own pH
RWZS:1:1:1
100
1000
10000
2 4 6 8 10 12pH
[DO
C] (
mg/
kg)
RWZS:1:1:1
Own pH
1000
10000
100000
3 5 7 9 11 13pH
[TO
C] (
mg/
kg)
CW5:1:1:2
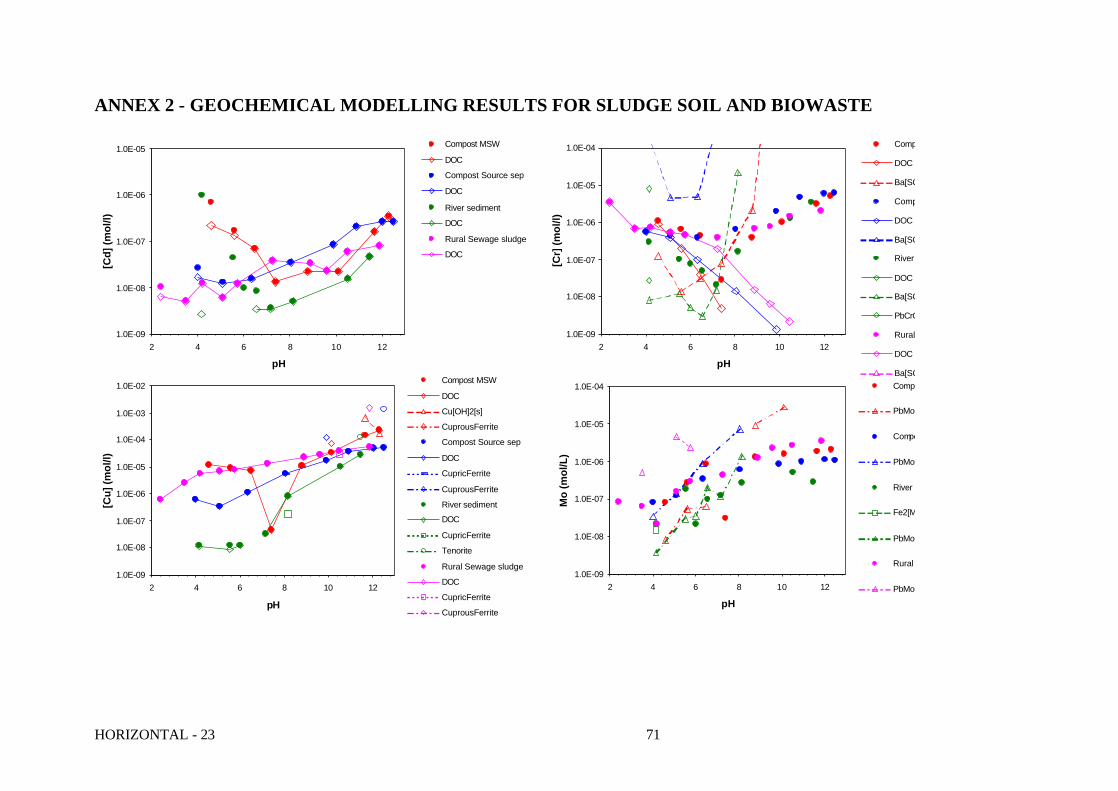
HORIZONTAL - 23 71
ANNEX 2 - GEOCHEMICAL MODELLING RESULTS FOR SLUDGE SOIL AND BIOWASTE
1.0E-09
1.0E-08
1.0E-07
1.0E-06
1.0E-05
2 4 6 8 10 12
pH
[Cd]
(mol
/l)
Compost MSW
DOC
Compost Source sep
DOC
River sediment
DOC
Rural Sewage sludge
DOC
1.0E-09
1.0E-08
1.0E-07
1.0E-06
1.0E-05
1.0E-04
2 4 6 8 10 12
pH
[Cr]
(mol
/l)
Compost MSW
DOC
Ba[SCr]O4[77%SO4]
Compost Source sep
DOC
Ba[SCr]O4[77%SO4]
River sediment
DOC
Ba[SCr]O4[77%SO4]
PbCrO4
Rural Sewage sludge
DOC
Ba[SCr]O4[77%SO4]
1.0E-09
1.0E-08
1.0E-07
1.0E-06
1.0E-05
1.0E-04
1.0E-03
1.0E-02
2 4 6 8 10 12
pH
[Cu]
(mol
/l)
Compost MSW
DOC
Cu[OH]2[s]
CuprousFerrite
Compost Source sep
DOC
CupricFerrite
CuprousFerrite
River sediment
DOC
CupricFerrite
Tenorite
Rural Sewage sludge
DOC
CupricFerrite
CuprousFerrite
1.0E-09
1.0E-08
1.0E-07
1.0E-06
1.0E-05
1.0E-04
2 4 6 8 10 12
pH
Mo
(mol
/L)
Compost MSW
PbMoO4[c]
Compost Source sep
PbMoO4[c]
River sediment
Fe2[MoO4]3[1]
PbMoO4[c]
Rural Sewage sludge
PbMoO4[c]
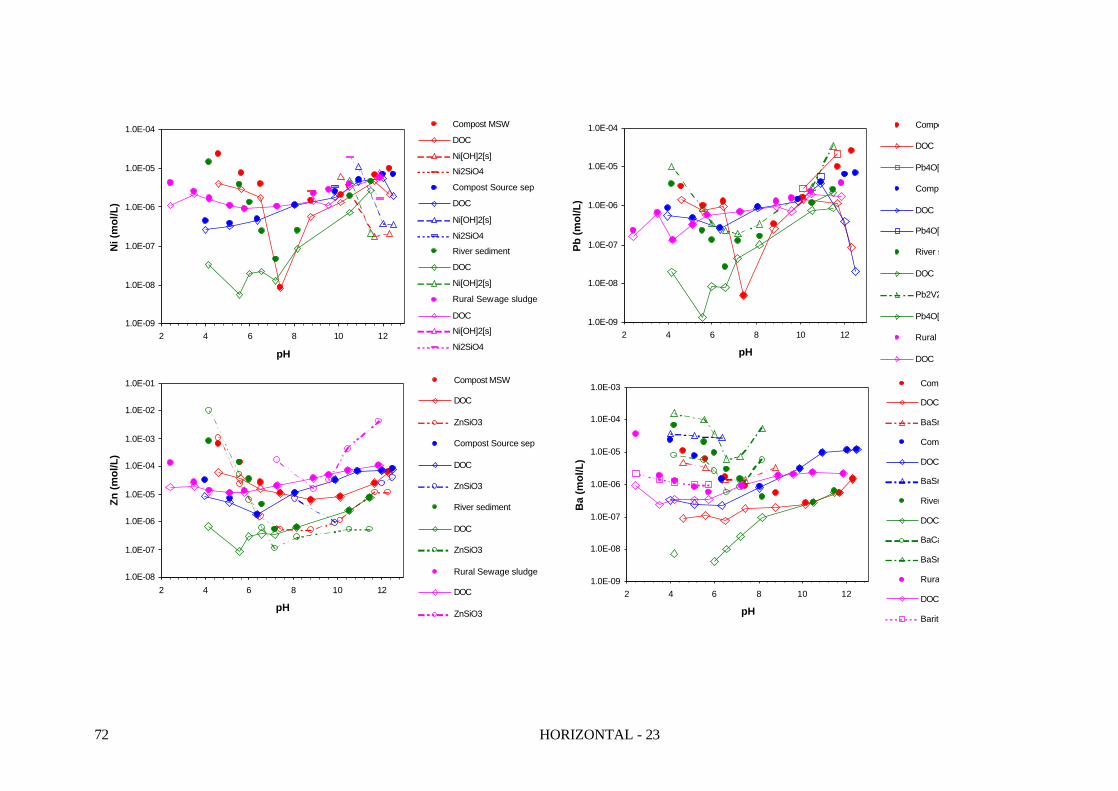
72 HORIZONTAL - 23
1.0E-09
1.0E-08
1.0E-07
1.0E-06
1.0E-05
1.0E-04
2 4 6 8 10 12
pH
Ni (
mol
/L)
Compost MSW
DOC
Ni[OH]2[s]
Ni2SiO4
Compost Source sep
DOC
Ni[OH]2[s]
Ni2SiO4
River sediment
DOC
Ni[OH]2[s]
Rural Sewage sludge
DOC
Ni[OH]2[s]
Ni2SiO4
1.0E-09
1.0E-08
1.0E-07
1.0E-06
1.0E-05
1.0E-04
2 4 6 8 10 12
pH
Pb (m
ol/L
)
Compost MSW
DOC
Pb4O[PO4]2[1]
Compost Source sep
DOC
Pb4O[PO4]2[1]
River sediment
DOC
Pb2V2O7
Pb4O[PO4]2[1]
Rural Sewage sludge
DOC
1.0E-08
1.0E-07
1.0E-06
1.0E-05
1.0E-04
1.0E-03
1.0E-02
1.0E-01
2 4 6 8 10 12
pH
Zn (m
ol/L
)
Compost MSW
DOC
ZnSiO3
Compost Source sep
DOC
ZnSiO3
River sediment
DOC
ZnSiO3
Rural Sewage sludge
DOC
ZnSiO3
1.0E-09
1.0E-08
1.0E-07
1.0E-06
1.0E-05
1.0E-04
1.0E-03
2 4 6 8 10 12
pH
Ba
(mol
/L)
Compost MSW
DOC
BaSrSO4[50%Ba]
Compost Source sep
DOC
BaSrSO4[50%Ba]
River sediment
DOC
BaCaSO4[50%Ba]
BaSrSO4[50%Ba]
Rural Sewage sludge
DOC
Barite
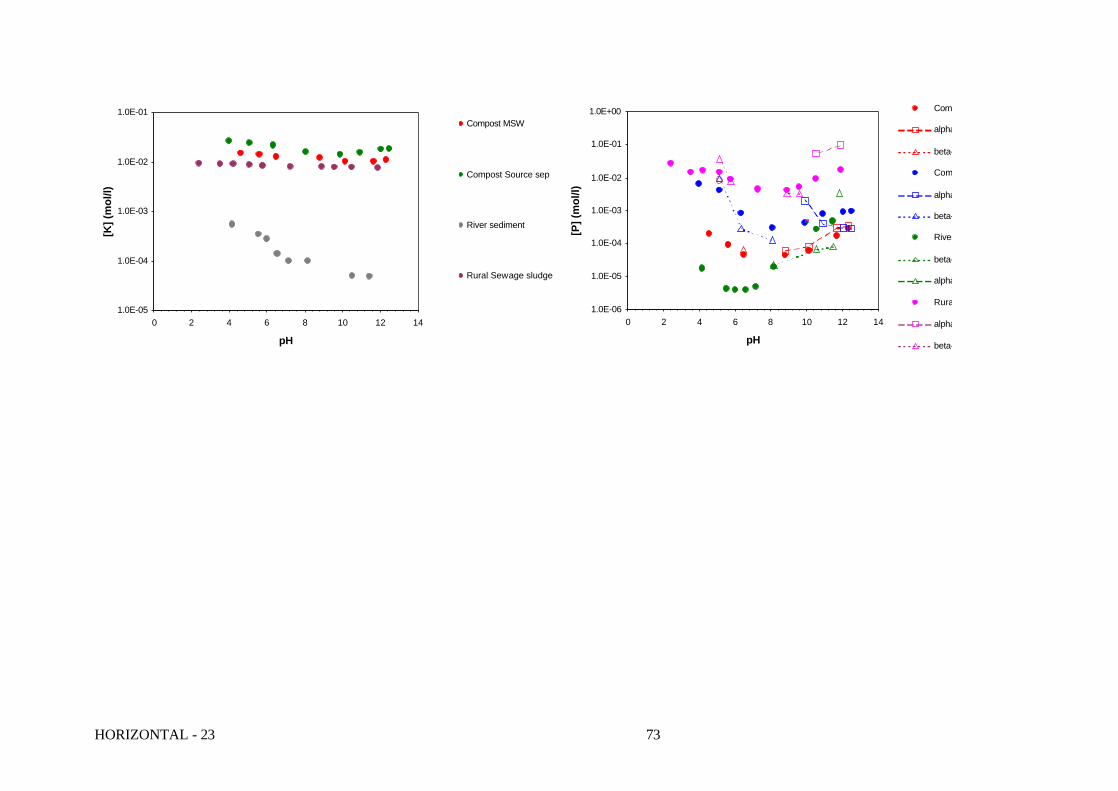
HORIZONTAL - 23 73
1.0E-05
1.0E-04
1.0E-03
1.0E-02
1.0E-01
0 2 4 6 8 10 12 14
pH
[K] (
mol
/l)Compost MSW
Compost Source sep
River sediment
Rural Sewage sludge
1.0E-06
1.0E-05
1.0E-04
1.0E-03
1.0E-02
1.0E-01
1.0E+00
0 2 4 6 8 10 12 14
pH
[P] (
mol
/l)
Compost MSW
alpha-TCP
beta-TCP
Compost Source sep
alpha-TCP
beta-TCP
River sediment
beta-TCP
alpha-TCP
Rural Sewage sludge
alpha-TCP
beta-TCP

74 HORIZONTAL - 23
0
20
40
60
80
100
120
2 3 4 5 6 7 8 9 10 11 12 13pH
% A
l Bou
nd to
DO
C
0
20
40
60
80
100
120
2 3 4 5 6 7 8 9 10 11 12 13
pH
% C
a B
ound
to D
OC
0
20
40
60
80
100
120
2 3 4 5 6 7 8 9 10 11 12 13pH
% F
e B
ound
to D
OC
0
20
40
60
80
100
120
2 3 4 5 6 7 8 9 10 11 12 13pH
% B
a B
ound
to D
OC
0
20
40
60
80
100
120
2 3 4 5 6 7 8 9 10 11 12 13
pH
% M
n B
ound
to D
OC
Compost MSW
Compost MSW 2
Compost Source sep
Compost Source sep 2
River sediment
River sediment 2
Rural Sewage sludge
Rural sewage sludge 2
0
20
40
60
80
100
120
2 3 4 5 6 7 8 9 10 11 12 13
pH
% M
g B
ound
to D
OC
Compost MSW
Compost MSW 2
Compost Source sep
Compost Source sep 2
River sediment
River sediment 2
Rural Sewage sludge
Rural sewage sludge 2

HORIZONTAL - 23 75
70
75
80
85
90
95
100
105
110
2 3 4 5 6 7 8 9 10 11 12 13
pH
% C
u B
ound
to D
OC
0
20
40
60
80
100
120
2 3 4 5 6 7 8 9 10 11 12 13
pH
% C
r Bou
nd to
DO
C
Compost MSW
Compost MSW 2
Compost Source sep
Compost Source sep 2
River sediment
River sediment 2
Rural Sewage sludge
Rural sewage sludge 20
20
40
60
80
100
120
2 3 4 5 6 7 8 9 10 11 12 13pH
% C
d B
ound
to D
OC
0
20
40
60
80
100
120
2 3 4 5 6 7 8 9 10 11 12 13
pH
% Z
n B
ound
to D
OC
Compost MSW
Compost MSW 2
Compost Source sep
Compost Source sep 2
River sediment
River sediment 2
Rural Sewage sludge
Rural sewage sludge 2
0
20
40
60
80
100
120
2 3 4 5 6 7 8 9 10 11 12 13pH
% S
r Bou
nd to
DO
C
0
10
20
30
40
50
60
70
80
90
100
2 3 4 5 6 7 8 9 10 11 12 13pH
% K
Bou
nd to
DO
C

76 HORIZONTAL - 23
0
20
40
60
80
100
120
2 3 4 5 6 7 8 9 10 11 12 13pH
% N
i Bou
nd to
DO
C0
20
40
60
80
100
120
2 3 4 5 6 7 8 9 10 11 12 13
pH
% P
b B
ound
to D
OC
Compost MSW
Compost MSW 2
Compost Source sep
Compost Source sep 2
River sediment
River sediment 2
Rural Sewage sludge
Rural sewage sludge 20
20
40
60
80
100
120
2 3 4 5 6 7 8 9 10 11 12 13pH
% C
o B
ound
to D
OC