Leaching Kinetics of As, Mo, and Se from Acidic Coal Fly...
19
Journal of Water Resource and Protection, 2017, 9, 890-907 http://www.scirp.org/journal/jwarp ISSN Online: 1945-3108 ISSN Print: 1945-3094 DOI: 10.4236/jwarp.2017.98060 July 3, 2017 Leaching Kinetics of As, Mo, and Se from Acidic Coal Fly Ash Samples Ghanashyam Neupane 1,2* , Rona J. Donahoe 3 , Siddhartha Bhattacharyya 3 , Prakash Dhakal 4 1 Idaho National Laboratory, Idaho Falls, Idaho, USA 2 Center for Advanced Energy Studies, Idaho Falls, Idaho, USA 3 Department of Geological Sciences, University of Alabama, Tuscaloosa, Alabama, USA 4 Department of Soil, Water and Environmental Sciences, University of Arizona, Tucson, Arizona, USA Abstract Annually, coal-fired electric power plants produce large volumes of potential- ly hazardous coal combustion products (CCPs) including fly ash. Since ma- jority of the coal fly ash and other CCPs deposited in dry land fills or wet la- goons, they pose risk of contamination to local environment. In this study, we present results of leaching kinetics for As, Mo, and Se from three acidic fly ash samples collected from coal-fired power plants in the southeastern United States. This study shows that the leachate concentrations of As, Mo, and Se increase over time. Three kinetics equations, pseudo-second order, Elovich, and power-function, are able to adequately describe the experimental leaching kinetics data. Experimental leaching data and modeling results indicate that the rate limiting leaching of As, Mo, and Se is controlled by the diffusional process responsible for transferring these elements from interior to the surface of the particles as well as the dissolution of the fly ash particles. Therefore, it is important to adopt effective containment/treatment schemes to avoid poten- tial and persistent dispersion of trace elements from ash disposal facilities to surrounding environment for a long time. Keywords Coal Fly Ash, Arsenic, Molybdenum, Selenium, Kinetics, Leaching 1. Introduction Coal-fired electric power plants generate large volumes of coal combustion products (CCPs) such as fly ash, bottom ash, boiler slag, flue gas desulfurization (FGD) materials, and various gases. Fly ash is the most voluminous fraction, ac- counting almost 53.0% (in 2013) and projected to increase to 55.0% (2022) of the How to cite this paper: Neupane, G., Donahoe, R.J., Bhattacharyya, S. and Dhak- al, P. (2017) Leaching Kinetics of As, Mo, and Se from Acidic Coal Fly Ash Samples. Journal of Water Resource and Protection, 9, 890-907. https://doi.org/10.4236/jwarp.2017.98060 Received: May 18, 2017 Accepted: June 30, 2017 Published: July 3, 2017 Copyright © 2017 by authors and Scientific Research Publishing Inc. This work is licensed under the Creative Commons Attribution International License (CC BY 4.0). http://creativecommons.org/licenses/by/4.0/ Open Access
Transcript of Leaching Kinetics of As, Mo, and Se from Acidic Coal Fly...

Journal of Water Resource and Protection, 2017, 9, 890-907 http://www.scirp.org/journal/jwarp
ISSN Online: 1945-3108 ISSN Print: 1945-3094
DOI: 10.4236/jwarp.2017.98060 July 3, 2017
Leaching Kinetics of As, Mo, and Se from Acidic Coal Fly Ash Samples
Ghanashyam Neupane1,2*, Rona J. Donahoe3, Siddhartha Bhattacharyya3, Prakash Dhakal4
1Idaho National Laboratory, Idaho Falls, Idaho, USA 2Center for Advanced Energy Studies, Idaho Falls, Idaho, USA 3Department of Geological Sciences, University of Alabama, Tuscaloosa, Alabama, USA 4Department of Soil, Water and Environmental Sciences, University of Arizona, Tucson, Arizona, USA
Abstract Annually, coal-fired electric power plants produce large volumes of potential-ly hazardous coal combustion products (CCPs) including fly ash. Since ma-jority of the coal fly ash and other CCPs deposited in dry land fills or wet la-goons, they pose risk of contamination to local environment. In this study, we present results of leaching kinetics for As, Mo, and Se from three acidic fly ash samples collected from coal-fired power plants in the southeastern United States. This study shows that the leachate concentrations of As, Mo, and Se increase over time. Three kinetics equations, pseudo-second order, Elovich, and power-function, are able to adequately describe the experimental leaching kinetics data. Experimental leaching data and modeling results indicate that the rate limiting leaching of As, Mo, and Se is controlled by the diffusional process responsible for transferring these elements from interior to the surface of the particles as well as the dissolution of the fly ash particles. Therefore, it is important to adopt effective containment/treatment schemes to avoid poten-tial and persistent dispersion of trace elements from ash disposal facilities to surrounding environment for a long time.
Keywords Coal Fly Ash, Arsenic, Molybdenum, Selenium, Kinetics, Leaching
1. Introduction
Coal-fired electric power plants generate large volumes of coal combustion products (CCPs) such as fly ash, bottom ash, boiler slag, flue gas desulfurization (FGD) materials, and various gases. Fly ash is the most voluminous fraction, ac-counting almost 53.0% (in 2013) and projected to increase to 55.0% (2022) of the
How to cite this paper: Neupane, G., Donahoe, R.J., Bhattacharyya, S. and Dhak-al, P. (2017) Leaching Kinetics of As, Mo, and Se from Acidic Coal Fly Ash Samples. Journal of Water Resource and Protection, 9, 890-907. https://doi.org/10.4236/jwarp.2017.98060 Received: May 18, 2017 Accepted: June 30, 2017 Published: July 3, 2017 Copyright © 2017 by authors and Scientific Research Publishing Inc. This work is licensed under the Creative Commons Attribution International License (CC BY 4.0). http://creativecommons.org/licenses/by/4.0/
Open Access

G. Neupane et al.
891
total of CCPs produced in the United Sates [1]. While recycling of fly ash for beneficial use in the United States alone has increased from 30% in 2000 [2] to nearly 54% in 2015 [3], the majority of the ash is impounded in lagoons and landfills located throughout the country [1] [4]. Fly ash contains large quantities of major element constituents as oxides, hydroxides and sulfates. It also contains environmentally significant quantities of hazardous leachable trace elements such as As, Mo, and Se [5] [6]. During combustion, the organic matter in coal is destroyed and, as a result, the concentrations of trace elements in fly ash are en-hanced relative to the source coal [7].
The release of trace elements to the environment is of concern because of their potential toxicity. Several studies show that coal fly ash with elevated concentra-tion of trace elements can readily release these elements into the environment [5] [6] [7]. The leaching behavior of major and trace elements in fly ash varies with the properties of the ash, such as pH, composition, and the leachant. Owing to the production and deposition of large volumes of fly ash in landfills each year, the risk associated with potential release of fly ash into local environment is real. For example, an incident that was occurred on December 22, 2008 with the rupture of a containment structure spilled over 3.7 million cubic meters of wet coal ash at the Kingston coal-fired power plant of Tennessee Valley Authority (TVA) in Tennessee [8]. Additionally, seepage and leakage of toxic elements such as As, Mo, Se etc. from coal ash ponds have been recently reported, and, in some cases, contaminating nearby water sources and creating health hazard risk to numerous parts of the southern US [9].
Total leachable amount as well as overall leaching behavior of hazardous trace elements from fly ash samples is important for determining the environmental consequences of potential release of fly ash into local environment. A large number of studies on dissolution kinetics have been conducted in the past for several minerals [10]; however, there have been very few studies on leaching ki-netics of trace elements from contaminated geomedia [11] [12]. Even there is no uniformity among several regulatory leaching protocols for leachant-solid ma-terial interaction period [13]. Similarly, most of the laboratory leaching schemes also use a leaching period in the range of 3 to 168 h [14]. In this situation, leach-ing kinetics, particularly, leaching behavior over time and factors controlling the rate limiting leaching of trace elements are very important for understanding the leaching persistency of trace elements from coal fly ash. In this study, we present results evaluating the leaching kinetics of As, Mo, and Se from three acidic fly ash samples derived from the Eastern Bituminous coals in the United States.
2. Materials and Methods 2.1. Fly Ash Samples and Characterization
Fresh acidic fly ash samples (HA, HB and MA) were collected from three electric power plants located in the southeastern USA. These fly ash samples were the combustion products of the Eastern Bituminous coals. All three fly ash samples were collected dry and were homogenized in the laboratory before using them

G. Neupane et al.
892
for kinetics experiments. The pH of the acidic fly ash samples are reported in the range of slightly acidic
to neutral. Details on physical and chemical properties of these fly ash were de-scribed elsewhere [6]. In general, these fly samples are more acidic at the surface than their bulk composition. The specific surface area of these fly ash samples measured with single-point Brunauer-Emmet-Teller (BET) method was re-ported to be 3.18, 2.11, and 3.46 m2/g for HA, HB, and MA, respectively. Simi-larly, the carbon contents in these fly ash samples are reported to be 6.74%, 6.37%, and 14.7% for HA, HB, and MA, respectively. Concentrations of As, Mo, and Se along with some major elements determined with microwave assisted acid digestion [15] are presented in Table 1. The concentrations of several other trace elements and their leachabilities have been reported elsewhere [6] [16] [17] [18] [19].
2.2. Kinetics Experiments
Leaching kinetics of As, Mo, and Se from acidic fly ash samples were conducted using jar leaching and batch leaching experiments. For both schemes of experi-ments, Barnstead nanopure water (18.2 MΩ) was used as leachant.
Jar leaching experiments for kinetic study were performed using 2 L high den-sity polyethylene (HDPE) bottles at a 1:30 solid:liquid ratio. For these experi-ments, 60 g of each fly ash was mixed with 1.8 L of nanopure water and agitated on an orbital platform shaker at 200 rpm. About 20 mL of the leachate solution was withdrawn at each sampling event from each experimental bottle at 1, 4, 8, 12, 24, 36, 48, 72, 96, and 120 h. The leachate supernatants were separated by centrifugation at 8500 rpm for 10 minutes and filtration through 0.2 μm syringe filters. After the separation, leachate solutions were acidified to 2% with ultra-pure OPTIMA nitric acid and stored in refrigerator until chemical analysis with a Perkin Elmer Optima 3000DV inductively coupled plasma optical emission spectrometer (ICP-OES).
In compliment to the Jar leaching experiment, a separate experimental scheme Table 1. Environmentally available concentrations (mg/kg) of major elements, As, Mo, and Se in fly ash samples.
Elements HA HB MA LODa
Al 21,800 14,010 9310 0.001
As 82 167 158 0.009
Ca 4860 7580 5730 0.015
Fe 19,590 18,310 12,110 0.003
K 3160 1690 1570 0.077
Mg 1890 1300 1130 0.001
Mo 13 20 12 0.002
Na 722 460 616 0.009
Se 7.7 23 14 0.004
Si 7290 2180 3880 0.015
aICP-OES limit of detection (LOD) values are given in mg/L.
G. Neupane et al.
893
was also employed to evaluate the leaching kinetics of As, Mo, and Se from acid-ic fly ash samples with a long-period leaching. A different (1:15) solid: liquid ra-tio was selected for this series of experiments to investigate whether the initial loading scheme has any effect on leaching kinetics. For each fly ash sample, mul-tiple batch leaching sets were prepared by mixing 3 g fly ash and 45 mL of na-nopure water in 50 mL centrifuge tubes. The fly ash-water mixtures were conti-nuously agitated until sample collection. At each sampling time, duplicate ali-quots of each fly ash leachate solution were collected for chemical analysis by sacrificing two tubes. The last samples for this series of experiments were col-lected after a leaching period of 30 weeks. Concentration of As, Mo, Se, and pH from leaching experiment is presented in Supplementary Table S1 & Table S2.
2.3. Kinetic Modeling of Leaching
Leaching of trace elements from fly ash could be explained by assuming that this process is similar to desorption/dissolution of elements from solid surface/ma- terials (Ash et al., 2013). Desorption kinetics of different sorbates from several sorbents including soils, metal oxides, and others have been previously described using zero order, first order, second order, and their derivative equations [20] [21] [22]. An additional suite of kinetic models such as Elovich equation [23], power function equation [24] [25], and parabolic diffusion equation [20] were also used previously for modeling desorption kinetics. The selection of kinetic models could depend on several factors such as simplicity to determine fitting parameters and its ability to describe the experimental data. For example, Evans and Jurinak (1976) used multiple simultaneous first order reactions while Chien and Clayton (1980) used Elovich equation to adequately describe the release and sorption kinetics of phosphate in soils [26] [27].
In this study, leaching kinetics of As, Mo, and Se are analyzed using three ki-netic equations: pseudo-second order, Elovich, and power-function equations. The attempt of using other kinetic models failed because of their inability to adequately describe the experimental data. Kinetic equations with their linear forms and fitting parameters are presented in Table 2. Kinetic parameters for pseudo-second order equation were obtained by plotting t versus t/qt. The qe was the reciprocal of the slope while k and h were obtained from intercept. If Table 2. Kinetic equations, their linear forms, and model fitting parameters.
Kinetic equations linear form Kinetic parameters
Pseudo-second ordera ( )2dd
te t
q k q qt= − 2
1 1
t e e
t tq kq q
= + k, 2eh kq=
Elovichb ( )dexp
dt
t
q qt
α β= − ( ) ( )1 1ln lntq tαββ β
= + α, β
Power functionc ntq at= log log logtq a n t= + a, n
aHo and McKay (1999) [21]; bLow (1960) [23]; cAharoni and Sparks (1991) [25]; qe is equilibrium concen- tration of leaching element, qt is concentration of leaching element at any time t. The units of various model parameters (e.g., k, h, α, β, a, and n) are given in Tables 3-5.
G. Neupane et al.
894
leaching kinetics of As were to obey the Elovich equation, the plot of qt vs. ln(t) should yield a linear relation with a slope of (1/β) and an intercept of (1/β) ln(αβ). Similarly, if log transformed kinetic data plotted as log(qt) vs. log(t) result in a linear line, then the leaching kinetic was said to be in compliance with pow-er function equation. Power function rate constant and its order were then ob-tained from slope (n) and intercept (logα) of the fit. The coefficient of determi-nation (R2) for each model was obtained by using experimental and model de-rived data. The goodness of model fit was also evaluated by calculating two addi-tional parameters, normalized deviation (ND) and normalized standard devia-tion (NSD) using Equations (1) and (2), respectively [28].
( ) ( )( ) ( )exp model expND 100 t t tn q q q= −∑ (1)
( ) ( )( ) ( )( )2
exp model expND 100 t t tq q q n= −∑ (2)
where n is number of experimental measurements, qt(exp) is the experimental concentration of element at time t, and qt(model) is the model predicted concentra-tion of element at time t. The smaller the values of ND and NSD, the better is the fit of experimental data for the kinetic model.
3. Results and Discussion 3.1. Results of Jar Leaching Kinetic Experiments
Figure 1 shows solution pH trends and concentrations of As, Mo, and Se re-leased during jar leaching tests of the fly ash samples. Leachate pH slightly in-creased until 20 hours and stabilized thereafter for HB and MA fly ash samples. The leachate pH for HA fly ash decreased slightly during the early stage of leaching and increased to about 7 after 30 hours. For all fly ash samples, leaching of As, Mo, and Se was relatively faster at the early stage; however, their leaching trend became slightly sluggish or plateaued in the later part of the experiment (Figure 1).
3.2. Results of Batch Leaching Kinetic Experiments
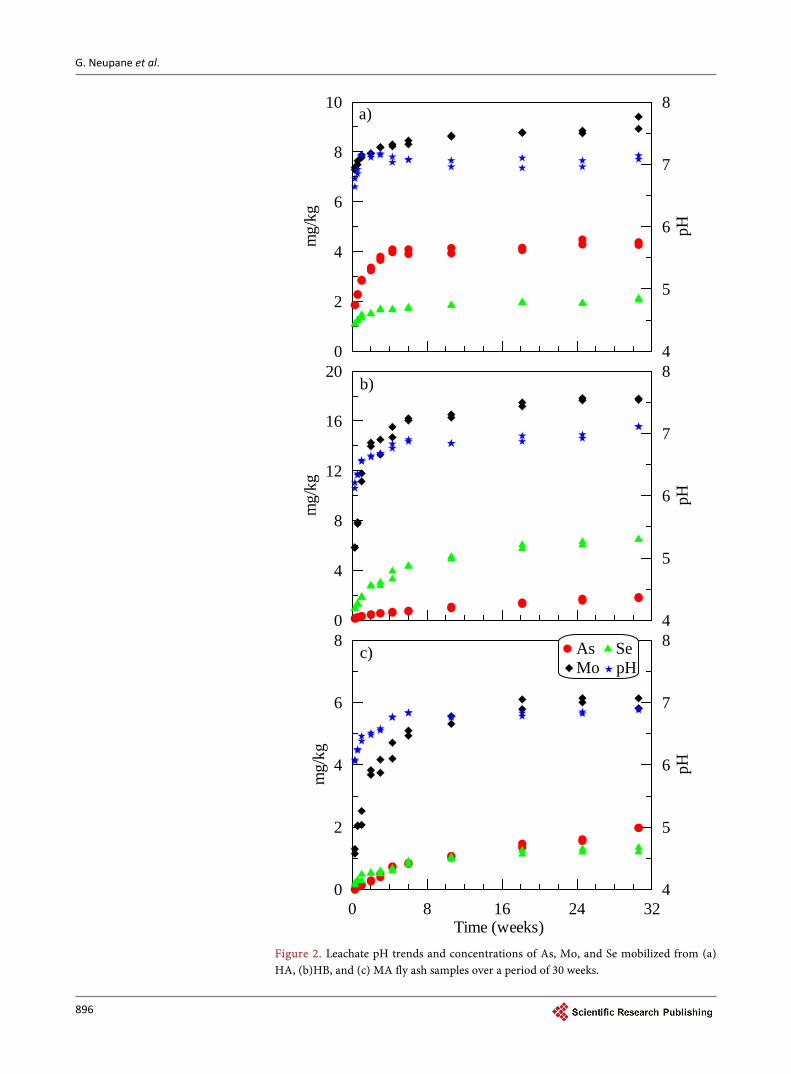
The leachate pH and concentrations of As, Mo, and Se mobilized during long- term leaching kinetic experiments are presented in Figure 2. All fly ash samples showed increasing leachate pH until 10 weeks and it remained near-neutral over time. Although the trend is visible in results after Jar leaching tests (Figure 1), the results of long-term leaching experiments clearly illustrate the early rapid re-lease followed by a slow but persistent increase in leachate concentration of these elements until 18 weeks (Figure 2). At the latter part of the experiment (after 18 week, leaching trend became slightly sluggish, and or plateaued.
The early relatively rapid leaching of As, Mo, and Se from these acidic fly ash samples are potentially related to their mobility from fly ash particles’ surface enrichment or association of these elements in the finest fraction of the fly ash. It has been well established in literature that such early rapid mobility of elements

G. Neupane et al.
895
Figure 1. Leachate pH trends and concentrations of As, Mo, and Se elements mobilized during fly ash jar leaching tests: a) HA fly ash, b) HB fly ash, and c) MA fly ash.
0
2
4
6
8
mg/
kg
4
5
6
7
8
pH
0
2
4
6
8
10
mg/
kg
4
5
6
7
8
pH
0 20 40 60 80 100 120Time (h)
0
2
4
6
8
mg/
kg
4
5
6
7
8
pH
a)
b)
c) As SeMo pH
G. Neupane et al.
896
Figure 2. Leachate pH trends and concentrations of As, Mo, and Se mobilized from (a) HA, (b)HB, and (c) MA fly ash samples over a period of 30 weeks.
0
2
4
6
8
10
mg/
kg
4
5
6
7
8
pH
0
4
8
12
16
20
mg/
kg
4
5
6
7
8
pH
0 8 16 24 32Time (weeks)
0
2
4
6
8
mg/
kg
4
5
6
7
8
pH
a)
b)
c) As SeMo pH
G. Neupane et al.
897
generally associates with fast dissolution of sub-micron sized particles in the sample during mineral-water interaction [29]. However, slow but persistent in-creases in the concentrations of these elements with increasing contact time could be related to slow dissolution of or solid-medium diffusion from the par-ticle interior. In coal fly ash, As, Mo, and Se are reported to be present as surface enrichment and remain within solid particles either as impurities in crystalline phases or as heterogeneous/homogeneous mixture in glassy phases [5] [30]. Glassy aluminosilicate particles in fly ash are less stable phases in aqueous envi-ronment than mullite and quartz [31] [32]. Such amorphous particles in fly ash samples could gradually dissolved during leaching experiments releasing trace elements over time. In our previous study, we observed that fly ash leachates produced with comparable interaction period are undersaturated with respect to quartz, mullite, and amorphous silica [6]. Therefore, the increasing leachate concentrations of As, Mo, and Se with time measured in this study is likely a re-sult from the slow dissolution of fly ash particles.
3.3. Modeling Results
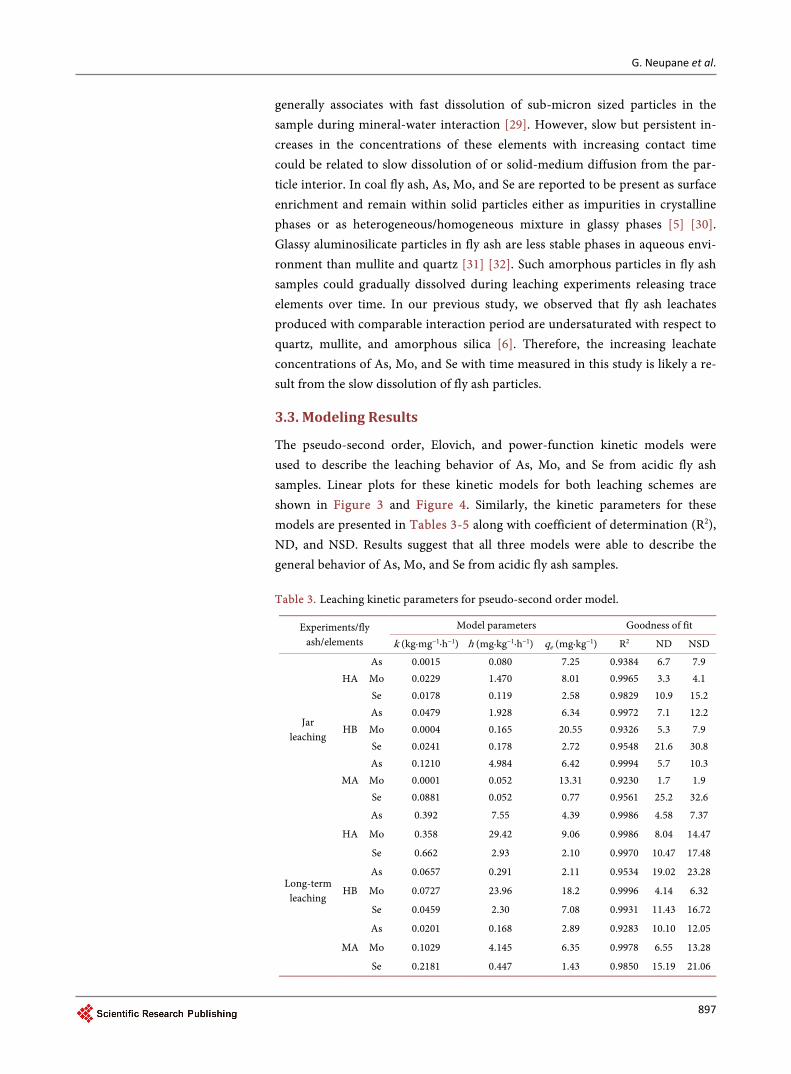
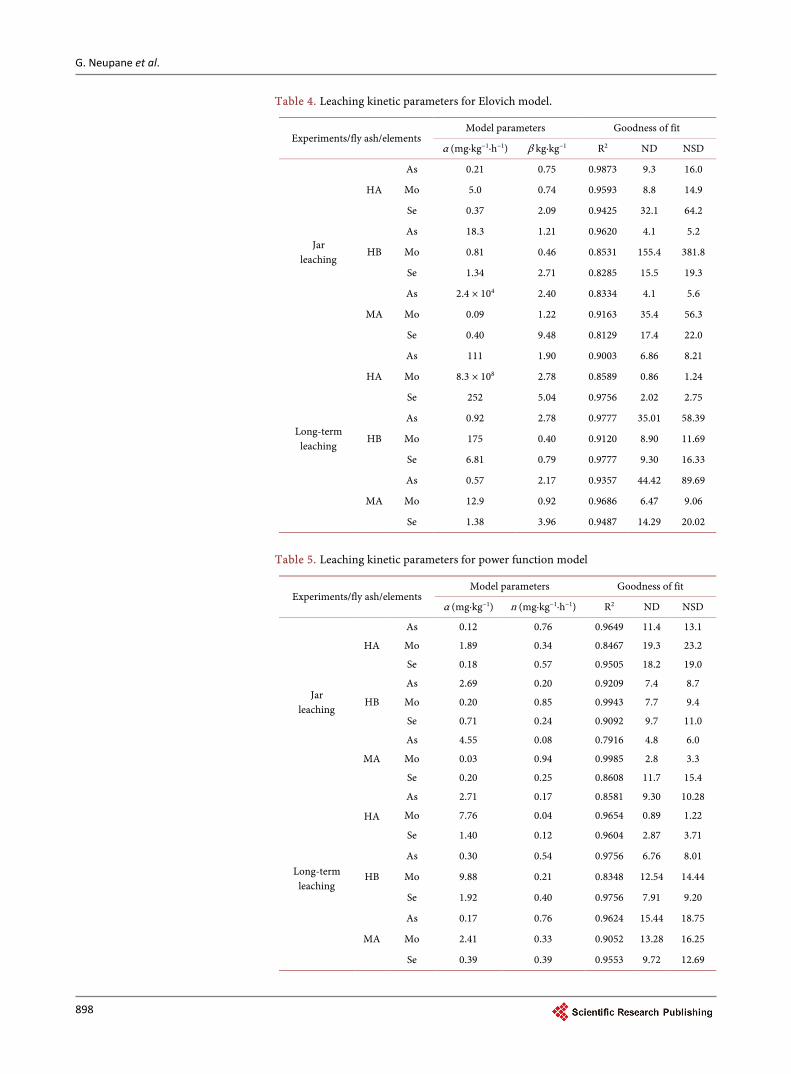
The pseudo-second order, Elovich, and power-function kinetic models were used to describe the leaching behavior of As, Mo, and Se from acidic fly ash samples. Linear plots for these kinetic models for both leaching schemes are shown in Figure 3 and Figure 4. Similarly, the kinetic parameters for these models are presented in Tables 3-5 along with coefficient of determination (R2), ND, and NSD. Results suggest that all three models were able to describe the general behavior of As, Mo, and Se from acidic fly ash samples. Table 3. Leaching kinetic parameters for pseudo-second order model.
Experiments/fly ash/elements
Model parameters Goodness of fit
k (kg∙mg−1∙h−1) h (mg∙kg−1∙h−1) qe (mg∙kg−1) R2 ND NSD
Jar leaching
HA As 0.0015 0.080 7.25 0.9384 6.7 7.9 Mo 0.0229 1.470 8.01 0.9965 3.3 4.1 Se 0.0178 0.119 2.58 0.9829 10.9 15.2
HB As 0.0479 1.928 6.34 0.9972 7.1 12.2 Mo 0.0004 0.165 20.55 0.9326 5.3 7.9 Se 0.0241 0.178 2.72 0.9548 21.6 30.8
MA As 0.1210 4.984 6.42 0.9994 5.7 10.3 Mo 0.0001 0.052 13.31 0.9230 1.7 1.9 Se 0.0881 0.052 0.77 0.9561 25.2 32.6
Long-term leaching
HA
As 0.392 7.55 4.39 0.9986 4.58 7.37
Mo 0.358 29.42 9.06 0.9986 8.04 14.47
Se 0.662 2.93 2.10 0.9970 10.47 17.48
HB
As 0.0657 0.291 2.11 0.9534 19.02 23.28
Mo 0.0727 23.96 18.2 0.9996 4.14 6.32
Se 0.0459 2.30 7.08 0.9931 11.43 16.72
MA
As 0.0201 0.168 2.89 0.9283 10.10 12.05
Mo 0.1029 4.145 6.35 0.9978 6.55 13.28
Se 0.2181 0.447 1.43 0.9850 15.19 21.06
G. Neupane et al.
898
Table 4. Leaching kinetic parameters for Elovich model.
Experiments/fly ash/elements Model parameters Goodness of fit
α (mg∙kg−1∙h−1) β kg∙kg−1 R2 ND NSD
Jar leaching
HA
As 0.21 0.75 0.9873 9.3 16.0
Mo 5.0 0.74 0.9593 8.8 14.9
Se 0.37 2.09 0.9425 32.1 64.2
HB
As 18.3 1.21 0.9620 4.1 5.2
Mo 0.81 0.46 0.8531 155.4 381.8
Se 1.34 2.71 0.8285 15.5 19.3
MA
As 2.4 × 10⁴ 2.40 0.8334 4.1 5.6
Mo 0.09 1.22 0.9163 35.4 56.3
Se 0.40 9.48 0.8129 17.4 22.0
Long-term leaching
HA
As 111 1.90 0.9003 6.86 8.21
Mo 8.3 × 10⁸ 2.78 0.8589 0.86 1.24
Se 252 5.04 0.9756 2.02 2.75
HB
As 0.92 2.78 0.9777 35.01 58.39
Mo 175 0.40 0.9120 8.90 11.69
Se 6.81 0.79 0.9777 9.30 16.33
MA
As 0.57 2.17 0.9357 44.42 89.69
Mo 12.9 0.92 0.9686 6.47 9.06
Se 1.38 3.96 0.9487 14.29 20.02
Table 5. Leaching kinetic parameters for power function model
Experiments/fly ash/elements Model parameters Goodness of fit
α (mg∙kg−1) n (mg∙kg−1∙h−1) R2 ND NSD
Jar leaching
HA
As 0.12 0.76 0.9649 11.4 13.1
Mo 1.89 0.34 0.8467 19.3 23.2
Se 0.18 0.57 0.9505 18.2 19.0
HB
As 2.69 0.20 0.9209 7.4 8.7
Mo 0.20 0.85 0.9943 7.7 9.4
Se 0.71 0.24 0.9092 9.7 11.0
MA
As 4.55 0.08 0.7916 4.8 6.0
Mo 0.03 0.94 0.9985 2.8 3.3
Se 0.20 0.25 0.8608 11.7 15.4
Long-term leaching
HA
As 2.71 0.17 0.8581 9.30 10.28
Mo 7.76 0.04 0.9654 0.89 1.22
Se 1.40 0.12 0.9604 2.87 3.71
HB
As 0.30 0.54 0.9756 6.76 8.01
Mo 9.88 0.21 0.8348 12.54 14.44
Se 1.92 0.40 0.9756 7.91 9.20
MA
As 0.17 0.76 0.9624 15.44 18.75
Mo 2.41 0.33 0.9052 13.28 16.25
Se 0.39 0.39 0.9553 9.72 12.69
G. Neupane et al.
899
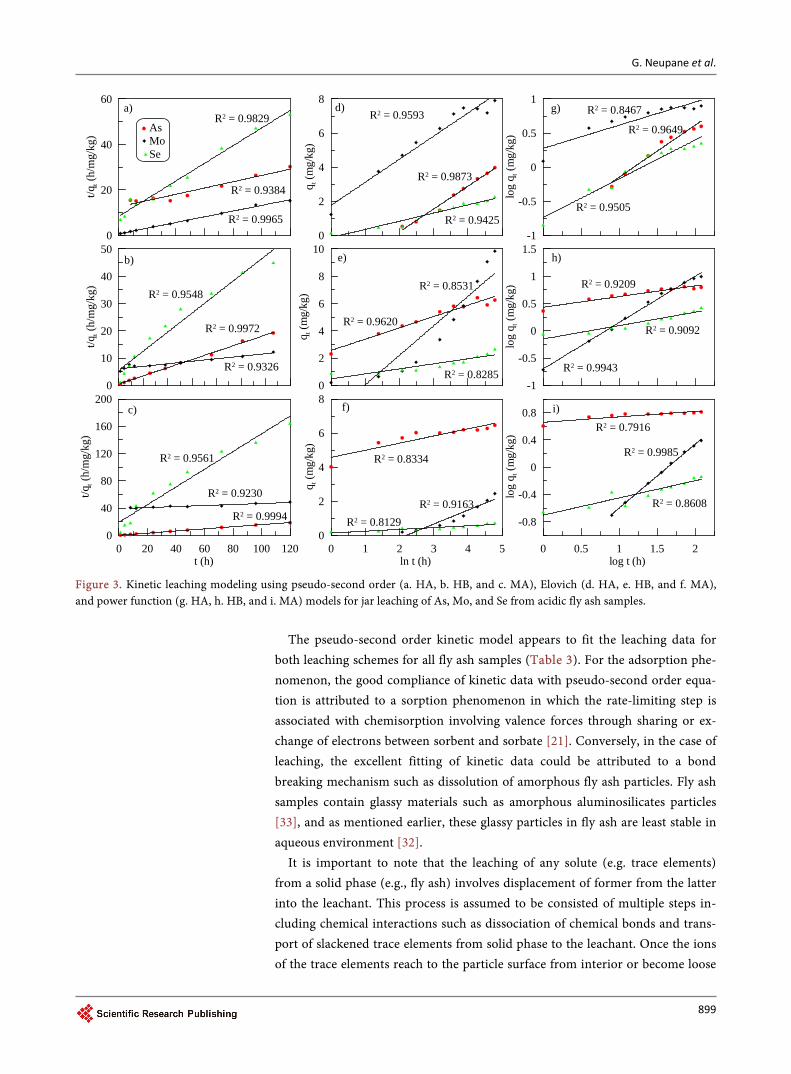
Figure 3. Kinetic leaching modeling using pseudo-second order (a. HA, b. HB, and c. MA), Elovich (d. HA, e. HB, and f. MA), and power function (g. HA, h. HB, and i. MA) models for jar leaching of As, Mo, and Se from acidic fly ash samples.
The pseudo-second order kinetic model appears to fit the leaching data for
both leaching schemes for all fly ash samples (Table 3). For the adsorption phe-nomenon, the good compliance of kinetic data with pseudo-second order equa-tion is attributed to a sorption phenomenon in which the rate-limiting step is associated with chemisorption involving valence forces through sharing or ex-change of electrons between sorbent and sorbate [21]. Conversely, in the case of leaching, the excellent fitting of kinetic data could be attributed to a bond breaking mechanism such as dissolution of amorphous fly ash particles. Fly ash samples contain glassy materials such as amorphous aluminosilicates particles [33], and as mentioned earlier, these glassy particles in fly ash are least stable in aqueous environment [32].
It is important to note that the leaching of any solute (e.g. trace elements) from a solid phase (e.g., fly ash) involves displacement of former from the latter into the leachant. This process is assumed to be consisted of multiple steps in-cluding chemical interactions such as dissociation of chemical bonds and trans-port of slackened trace elements from solid phase to the leachant. Once the ions of the trace elements reach to the particle surface from interior or become loose
0
20
40
60t/q
t (h/
mg/
kg)
a)
b)
c)
AsMoSe
0
10
20
30
40
50
t/qt (
h/m
g/kg
)
0 20 40 60 80 100 120t (h)
0
40
80
120
160
200
t/qt (
h/m
g/kg
)
0 1 2 3 4 5ln t (h)
0
2
4
6
8
q t (m
g/kg
)
0
2
4
6
8
10
q t (m
g/kg
)
0 0.5 1 1.5 2log t (h)
-0.8
-0.4
0
0.4
0.8
log
q t (m
g/kg
)
0
2
4
6
8
q t (m
g/kg
)
-1
-0.5
0
0.5
1
1.5
log
q t (m
g/kg
)
-1
-0.5
0
0.5
1
log
q t (m
g/kg
)
R2 = 0.9548
R2 = 0.9972
R2 = 0.9326
R2 = 0.9829
R2 = 0.9384
R2 = 0.9965
R2 = 0.9230
R2 = 0.9561
R2 = 0.9994
R2 = 0.8334
R2 = 0.9163R2 = 0.8129
R2 = 0.9593
R2 = 0.9873
R2 = 0.9425
R2 = 0.8467
R2 = 0.9505
R2 = 0.9649
R2 = 0.9209
R2 = 0.9092
R2 = 0.9943
R2 = 0.7916
R2 = 0.8608
R2 = 0.9985
R2 = 0.8531
R2 = 0.9620
R2 = 0.8285
d)
e)
f)
g)
h)
i)
G. Neupane et al.
900
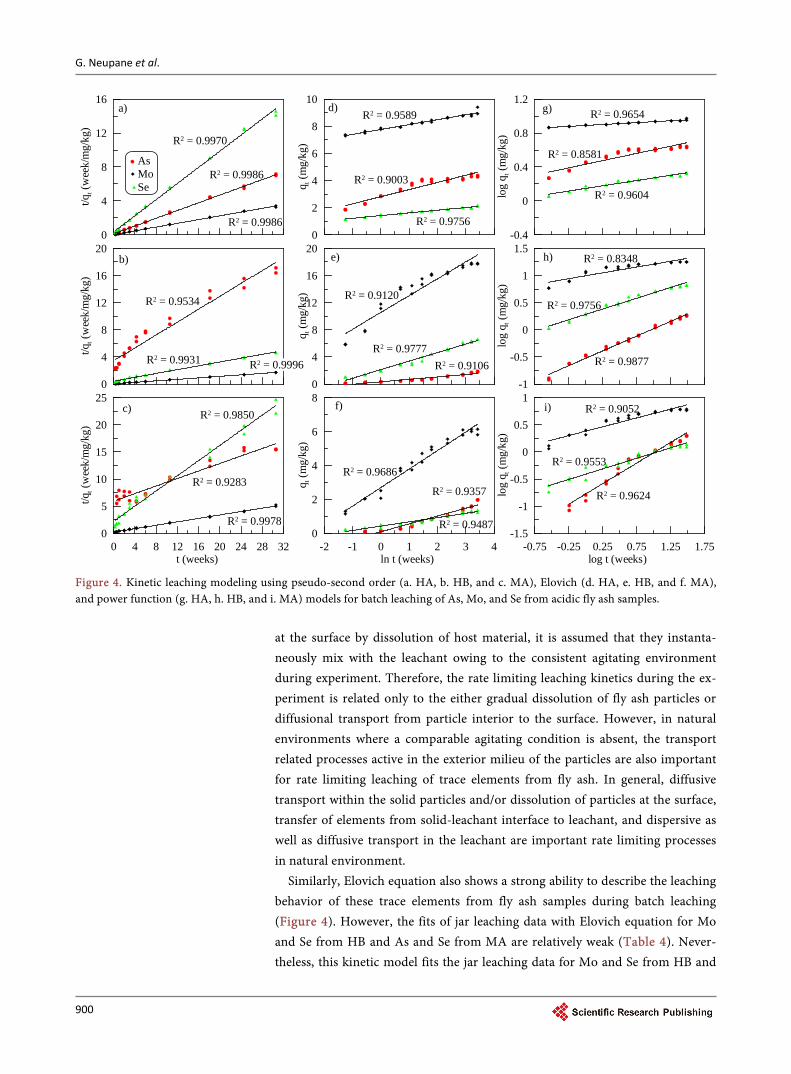
Figure 4. Kinetic leaching modeling using pseudo-second order (a. HA, b. HB, and c. MA), Elovich (d. HA, e. HB, and f. MA), and power function (g. HA, h. HB, and i. MA) models for batch leaching of As, Mo, and Se from acidic fly ash samples.
at the surface by dissolution of host material, it is assumed that they instanta-neously mix with the leachant owing to the consistent agitating environment during experiment. Therefore, the rate limiting leaching kinetics during the ex-periment is related only to the either gradual dissolution of fly ash particles or diffusional transport from particle interior to the surface. However, in natural environments where a comparable agitating condition is absent, the transport related processes active in the exterior milieu of the particles are also important for rate limiting leaching of trace elements from fly ash. In general, diffusive transport within the solid particles and/or dissolution of particles at the surface, transfer of elements from solid-leachant interface to leachant, and dispersive as well as diffusive transport in the leachant are important rate limiting processes in natural environment.
Similarly, Elovich equation also shows a strong ability to describe the leaching behavior of these trace elements from fly ash samples during batch leaching (Figure 4). However, the fits of jar leaching data with Elovich equation for Mo and Se from HB and As and Se from MA are relatively weak (Table 4). Never-theless, this kinetic model fits the jar leaching data for Mo and Se from HB and
0
4
8
12
16t/q
t (w
eek/
mg/
kg)
a)
b)
c)
AsMoSe
0
4
8
12
16
20
t/qt (
wee
k/m
g/kg
)
0 4 8 12 16 20 24 28 32t (weeks)
0
5
10
15
20
25
t/qt (
wee
k/m
g/kg
)
-2 -1 0 1 2 3 4ln t (weeks)
0
2
4
6
8
q t (m
g/kg
)
0
4
8
12
16
20
q t (m
g/kg
)
-0.75 -0.25 0.25 0.75 1.25 1.75log t (weeks)
-1.5
-1
-0.5
0
0.5
1
log
q t (m
g/kg
)
0
2
4
6
8
10
q t (m
g/kg
)
-1
-0.5
0
0.5
1
1.5
log
q t (m
g/kg
)
-0.4
0
0.4
0.8
1.2
log
q t (m
g/kg
)
R2 = 0.9534
R2 = 0.9931 R2 = 0.9996
R2 = 0.9970
R2 = 0.9986
R2 = 0.9986
R2 = 0.9283
R2 = 0.9850
R2 = 0.9978
R2 = 0.9686
R2 = 0.9357
R2 = 0.9487
R2 = 0.9589
R2 = 0.9003
R2 = 0.9756
R2 = 0.9654
R2 = 0.9604
R2 = 0.8581
R2 = 0.8348
R2 = 0.9756
R2 = 0.9877
R2 = 0.9052
R2 = 0.9624
R2 = 0.9553
R2 = 0.9120
R2 = 0.9777R2 = 0.9106
d)
e)
f)
g)
h)
i)
G. Neupane et al.
901
As and Se from MA far better than other kinetic equations (e.g., first order and second order kinetic equations). The Elovich equation, which is based on as-sumption that the adsorption energy increases with surface coverage [23], has been previously also used to describe the kinetics of desorption of oxyanions from soils and soil constituents [27]. In their study, Chein and Clayton (1980) suggested that an increase in α with or without change in β would indicate a rel-atively rapid reaction [27]. In this perspective, the α values are relatively larger for the same elements during long-term leaching experiments, and could indi-cate a relatively faster leaching than during jar leaching experiments [27]. How-ever, these two experiments were conducted at different solid: liquid ratio and different time scales, and could not be directly comparable. Furthermore, such inference drawn from nature of α and β variation could be questionable at dif-ferent situations [22].
The power-function equation is also able to describe most of the leaching data for both leaching schemes with few exceptions (Figure 3 and Figure 4; Table 5). Particularly, the model fits for Mo (from HA) and As and Se (from MA) are rel-atively poor for jar leaching data. Similarly, this model resulted in weak fits for As leached from HA and Se leached from HB (Table 5).
The good agreement of experimental data with the model equations indicate the presence of one or multiple rate limiting mechanisms controlling the release of trace elements from fly ash samples [21] [25]. As indicated above, one of such potential mechanism could be dissolution of glassy fly ash particles where these trace elements are disseminated. Similarly, another likely mechanism for rate-limiting process is migration of these elements from particle interior to the surface. A similar diffusion controlled rate limiting kinetics has been previously reported for late-stage sorption/desorption of phosphate and arsenate to/from ferric hydroxide particles [34] [35] [36]. However, because these fly ash samples are rich in glassy constituents and our previous observation of increasing SiO2(aq) concentration over time [6], we propose that long-term kinetics of As, Mo, and Se release from these fly ash samples occur largely via dissolution of fly ash particles. During both (jar and long-term) experiments, the leachate pH shows, in general, an increasing trend with time. The proton consumption dur-ing dissolution of aluminosilicates is a well-documented phenomena in wa-ter-rock interactions [29] [37]. Therefore, the increasing pH with increasing du-ration of fly ash-leachant interaction is a manifestation of ongoing dissolution of aluminosilicate fly ash particles, and such dissolution is attributed to be the ma-jor factor for slow but persistent increase in leachate concentrations of As, Mo, and Se over time.
4. Summary and Conclusions
The leaching tests of three acidic fly ash samples collected from coal-fired power plants in the southeastern United States show the increasing leachate concentra-tions of As, Mo, and Se with time. The jar leaching experiments show that the leachate concentrations of these elements are relatively low during the early

G. Neupane et al.
902
phase of leaching; however, their concentrations increase with increasing time. Similar leaching trends are observed during long-term leaching experiments.
Kinetic leaching of As, Mo, and Se from acidic fly ash samples can be de-scribed by pseudo-second order, Elovich, and power function kinetic equations. Although all three kinetic equations are able to fit experimental data, relatively, pseudo-second order model represents the experimental data strongly than the other two models. The experimental as well as modeling results indicate that the rate limiting release of As, Mo, and Se from fly ash samples is largely controlled by dissolution of fly ash particles. Such leaching behavior could make fly ash a persistent source of contaminates in the environment should a catastrophic event akin the TVA fly ash spill occur either from operational or old fly ash dis-posal facility. Therefore, it is desirable to adopt containment as well as treatment plans for fly ash deposited in present/past fly ash disposal facilities.
Acknowledgements
We would like to thank Dr. Z. Yue and Ms. E.Y. Graham for their help during laboratory experiments and analytical work. Funding for this research was par-tially provided by Hooks Fund (Department of Geological Sciences), Geological Society of America (GSA), Gulf Coast Association of Geological Societies (GCAGS), and Graduate Student Association (GSA) at UA. The Graduate School at UA also provided one year research fellowship to GN to conduct a part of this research.
Conflicts of Interest
The authors declare no competing financial interest.
References [1] Black, A.P. (2015) Production and Use of Coal Combustion Products in the U.S.
Market Forecast through 2033. Report, American Road & Transportation Builders Association (ARTBA), and American Coal Ash Association (ACAA), USA. https://www.acaa-usa.org/Portals/9/Files/PDFs/ReferenceLibrary/ARTBA-final-forecast.compressed.pdf
[2] American Coal Ash Association (ACAA) (2000) Coal Combustion Product (CCP) Production & Use Survey Results, Report, Farmington Hills, MI, USA. https://www.acaa-usa.org/Publications/Production-Use-Reports
[3] American Coal Ash Association (ACAA) (2015) Coal Combustion Product (CCP) Production & Use Survey Results. Report, Farmington Hills, MI, USA. https://www.acaa-usa.org/Publications/Production-Use-Reports
[4] United States Environmental Protection Agency (US-EPA) (2015) Hazardous and Solid Waste Management System; Disposal of Coal Combustion Residuals from Electric Utilities: Final Rule. Report: EPA-HQ-RCRA-2009-0640-11970, Washing-ton DC, USA. https://www.regulations.gov/document?D=EPA-HQ-RCRA-2009-0640-11970
[5] Jankowski, J., Ward, C.R., French, D. and Groves, S. (2006) Mobility of Trace Ele-ments from Selected Australian Fly Ashes and Its Potential Impact on Aquatic Eco-systems. Fuel, 85, 243-256.

G. Neupane et al.
903
[6] Neupane, G. and Donahoe, R.J. (2013) Leachability of Elements in Alkaline and Acidic Coal Fly Ash Samples during Batch and Column Leaching Tests. Fuel, 104, 758-770.
[7] Fernández-Turiel, J.L., de Carvalho, W., Cabañas, M., Querol, X. and López-Soler, A. (1994) Mobility of Heavy Metals from Coal Fly Ash. Environmental Geology, 23, 264-270. https://doi.org/10.1007/BF00766741
[8] Ruhl, L., Vengosh, A., Dwyer, G.S., Hsu-Kim, H. and Deonarine, A. (2010) Envi-ronmental Impacts of the Coal Ash Spill in Kingston, Tennessee: An 18-Month Survey. Environmental Science & Technology, 44, 9272-9278. https://doi.org/10.1021/es1026739
[9] Harkness, J.S., Sulkin, B. and Vengosh, A. (2016) Evidence for Coal Ash Ponds Leaking in the Southeastern United States. Environmental Science & Technology, 50, 6583-6592. https://doi.org/10.1021/acs.est.6b01727
[10] Palandri, J.L. and Kharaka, Y.K. (2004) A Compilation of Rate Parameters of Wa-ter-Mineral Interctions Kinetics for Application to Geochemical Modeling. USGS- Report (2004-1068), Menlo Park, California, USA.
[11] Desboeufs, K.V., Sofikitis, A., Losno, R., Colin, J.L. and Ausset, P. (2005) Dissolu-tion and Solubility of Trace Metals from Natural and Anthropogenic Aerosol Parti- culate Matter. Chemosphere, 58, 195-203.
[12] Fedotov, P.S., Wennrich, R., Stark, H.J. and Spivakov, B.Y. (2005) Continuous-Flow Fractionation of Trace Metals in Environmental Solids Using Rotating Coiled Co- lumns. Some Kinetic Aspects and Applicability of Three-Step BCR Leaching Schemes. Journal of Environmental Monitoring, 7, 22-28. https://doi.org/10.1039/B413611J
[13] Becker, J.L. (2010) Evaluation of Leaching Protocols for the Testing of Coal Com-bustion Byproducts. PhD Dissertation, University of Maryland.
[14] Dijkstra, J.J., van der Sloot, H.A. and Comans, R.N.J. (2006) The Leaching of Major and Trace Elements from MSWI Bottom Ash as a Function of pH and Time. Ap-plied Geochemistry, 21, 335-351.
[15] United States Environmental Protection Agency (US-EPA) (2007) Method 3051A: Microwave-Assisted Acid Digestion of Sediments, Sludges, Soils and Oils. Wash-ington DC.
[16] Donahoe, R.J., Bhattacharyya, S., Patel, D. and Ladwig, K.J. (2007) Chemical Fixa-tion of Trace Elements in Coal Fly Ash, Proceedings World of Coal Ash (WOCA) Conference, Northern Kentucky, 1-19.
[17] Bhattacharyya, S., Donahoe, R.J. and Patel, D. (2009) Experimental Study of Chem-ical Treatment of Coal Fly Ash to Reduce the Mobility of Priority Trace Elements. Fuel, 88, 1173-1184.
[18] Neupane, G. and Donahoe, R.J. (2009) Potential Use of Surfactant-Modified Zeolite for Attenuation of Trace Elements in Fly Ash Leachate. Proceedings World of Coal Ash (WOCA) Conference, Lexington, 1-19.
[19] Neupane, G. and Donahoe, R.J. (2012) Attenuation of Trace Elements in Coal Fly Ash Leachates by Surfactant-Modified Zeolite. Journal of Hazardous Materials, 229- 230, 201-208.
[20] Jardine, P.M. and Sparks, D.L. (1984) Potassium-Calcium Exchange in a Multi Re- active Soil System: I. Kinetics. Soil Science Society of America Journal, 48, 39-45. https://doi.org/10.2136/sssaj1984.03615995004800010007x
[21] Ho, Y.S. and McKay, G. (1999) Pseudo-Second Order Model for Sorption Processes. Process Biochemistry, 34, 451-465.

G. Neupane et al.
904
[22] Sparks, D.L. (1989) Kinetics of Soil Chemical Processes. Academic Press, San Diego, 1-210.
[23] Low, M.J.D. (1960) Kinetics of Chemisorption of Gases on Solids. Chemical Re-views, 60, 267-312. https://doi.org/10.1021/cr60205a003
[24] Kuo, S. and Lotse, E.G. (1973) Kinetics of Phosphate Adsorption and Desorption by Hematite and Gibbsite. Soil Science, 116, 400-406. https://doi.org/10.1097/00010694-197312000-00002
[25] Aharoni, C. and Sparks, D.L. (1991) Kinetics of Soil Chemical Reactions—A Theo-retical Treatment. In: Sparks, D.L. and Suarez, D.L., Ed., Rates of Soil Chemical Pro- cesses, Soil Science Society of America, Madison, 1-18.
[26] Evans, R.L. and Jurinak, J.J. (1976) Kinetics of Phosphate Release from a Desert Soil. Soil Science, 121, 205-211. https://doi.org/10.1097/00010694-197604000-00003
[27] Chien, S.H. and Clayton, W.R. (1980) Application of Elovich Equation to the Kine- tics of Phosphate Release and Sorption in Soils. Soil Science Society of America Journal, 44, 265-268. https://doi.org/10.2136/sssaj1980.03615995004400020013x
[28] Singh, R.K., Kumar, S., Kumar, S. and Kumar, A. (2008) Development of Parthe-nium Based Activated Carbon and Its Utilization for Adsorptive Removal of p-Cre- sol from Aqueous Solution. Journal of Hazardous Materials, 155, 523-535.
[29] Lasaga, A.C. (1984) Chemical Kinetics of Water-Rock Interactions. Journal of Geo-physical Research: Solid Earth, 89, 4009-4025. https://doi.org/10.1029/JB089iB06p04009
[30] Linton, R.W., Loh, A., Natusch, D.F., Evans, C.A. and Williams, P. (1976) Surface Predominance of Trace Elements in Airborne Particles. Science, 191, 852-854. https://doi.org/10.1126/science.1251197
[31] Querol, X., Moreno, N., Umaña, J.C., Alastuey, A., Hernández, E., López-Soler, A. and Plana, F. (2002) Synthesis of Zeolites from Coal Fly Ash: An Overview. Interna-tional Journal of Coal Geology, 50, 413-423.
[32] Donahoe, R.J. (2004) Secondary Mineral Formation in Coal Combustion Byproduct Disposal Facilities: Implications for Trace Element Sequestration. Geological Socie-ty, London, Special Publication, 236, 641-658. https://doi.org/10.1144/GSL.SP.2004.236.01.36
[33] Fisher, G.L., Chang, D.P.Y. and Brummer, M. (1976) Fly Ash Collected from Elec-trostatic Precipitators: Microcrystalline Structures and the Mystery of the Spheres. Science, 192, 553-555. https://doi.org/10.1126/science.192.4239.553
[34] Willett, I.R., Chartres, C.J. and Nguyen, T.T. (1988) Migration of Phosphate into Aggregated Particles of Ferrihydrite. European Journal of Soil Science, 39, 275-282. https://doi.org/10.1111/j.1365-2389.1988.tb01214.x
[35] Strauss, R., BrÜMmer, G.W. and Barrow, N.J. (1997) Effects of Crystallinity of Goethite: II. Rates of Sorption and Desorption of Phosphate. European Journal of Soil Science, 48, 101-114. https://doi.org/10.1111/j.1365-2389.1997.tb00189.x
[36] Neupane, G., Donahoe, R.J. and Arai, Y. (2014) Kinetics of Competitive Adsorp-tion/Desorption of Arsenate and Phosphate at the Ferrihydrite-Water Interface. Chemical Geology, 368, 31-38.
[37] Giggenbach, W.F. (1984) Mass Transfer in Hydrothermal Alteration Systems—A Conceptual Approach. Geochimica et Cosmochimica Acta, 48, 2693-2711.

G. Neupane et al.
905
Supplementary
Table S1. Concentrations of As, Mo, and Se during Jar leaching tests.
ID Time (hours) pH Concentrations (mg/kg)
As Mo Se
HA
1 7.19 0.00 1.22 0.14
4 6.83 0.00 3.74 0.47
8 6.74 0.52 4.70 0.50
12 6.71 0.79 5.44 0.87
24 6.85 1.47 6.27 1.49
36 7.05 2.36 7.12 1.64
48 7.09 2.74 7.47 1.88
72 7.12 3.32 7.42 1.87
96 7.11 3.64 7.18 2.03
120 7.15 3.97 7.91 2.25
HB
1 4.53 2.30 0.19 0.87
4 4.86 3.78 0.64 0.90
8 5.17 4.36 1.05 1.13
12 5.25 4.65 1.70 1.12
24 5.76 5.40 3.35 1.38
36 5.78 5.81 4.82 1.65
48 5.97 5.76 5.83 1.71
72 6.01 6.43 7.62 2.13
96 6.08 5.90 9.07 2.32
120 6.15 6.25 9.84 2.66
MA
1 4.91 4.02 0.00 0.22
4 5.25 5.44 0.00 0.26
8 5.45 5.72 0.20 0.43
12 5.40 6.02 0.30 0.27
24 5.68 6.01 0.58 0.39
36 5.83 6.05 0.84 0.48
48 5.89 6.20 1.14 0.51
72 5.99 6.18 1.67 0.58
96 6.04 6.27 2.05 0.70
120 6.06 6.46 2.45 0.73

G. Neupane et al.
906
Table S2. Concentrations of As, Mo, and Se during long-term batch leaching tests.
ID Time (week) pH Concentrations (mg/kg)
As Mo Se
HA
0.29 6.64 1.86 7.38 1.13
0.29 6.77 1.85 7.28 1.14
0.57 6.85 2.27 7.49 1.29
0.57 6.92 2.29 7.63 1.28
1.00 7.14 2.86 7.87 1.51
1.00 7.15 2.83 7.78 1.38
2.00 7.11 3.25 7.93 1.56
2.00 7.17 3.36 7.94 1.55
3.00 7.15 3.66 8.19 1.70
3.00 7.17 3.79 8.18 1.74
4.29 7.03 3.97 8.30 1.72
4.29 7.12 4.08 8.23 1.71
6.00 7.07 4.09 8.45 1.80
6.00 7.08 3.90 8.31 1.76
10.57 6.96 4.14 8.61 1.88
10.57 7.06 3.93 8.65 1.89
18.14 6.94 4.15 8.76 2.01
18.14 7.10 4.06 8.78 2.00
24.57 6.96 4.48 8.75 1.98
24.57 7.06 4.28 8.85 1.96
30.57 7.08 4.37 9.41 2.17
30.57 7.14 4.27 8.93 2.10
ID Time (week) pH Concentrations (mg/kg)
As Mo Se
HB
0.29 6.21 0.13 5.83 1.06
0.29 6.12 0.17 5.86 1.06
0.57 6.35 0.24 7.88 1.46
0.57 6.33 0.24 7.74 1.36
1.00 6.57 0.33 11.15 1.90
1.00 6.55 0.34 11.80 2.00
2.00 6.62 0.44 13.98 2.84
2.00 6.64 0.49 14.26 2.91
3.00 6.68 0.56 13.31 2.88
3.00 6.68 0.57 14.50 3.13
4.29 6.76 0.62 14.70 3.40

G. Neupane et al.
907
Continued
4.29 6.83 0.68 15.52 4.05
6.00 6.87 0.72 16.04 4.45
6.00 6.90 0.77 16.22 4.44
10.57 6.84 0.98 16.27 5.01
10.57 6.84 1.09 16.52 5.20
18.14 6.87 1.32 17.19 5.84
18.14 6.96 1.43 17.48 6.15
24.57 6.92 1.73 17.84 6.40
24.57 6.98 1.58 17.66 6.16
30.57 7.11 1.87 17.80 6.59
30.57 7.11 1.78 17.70 6.58
ID Time (week) pH Concentrations (mg/kg)
As Mo Se
MA
0.29 6.08 0.00 1.15 0.18
0.29 6.06 0.00 1.30 0.24
0.57 6.25 0.08 2.04 0.33
0.57 6.23 0.10 2.04 0.31
1.00 6.46 0.13 2.52 0.52
1.00 6.38 0.16 2.07 0.31
2.00 6.51 0.29 3.83 0.55
2.00 6.48 0.26 3.68 0.56
3.00 6.58 0.39 4.17 0.63
3.00 6.55 0.50 3.75 0.54
4.29 6.76 0.72 4.71 0.71
4.29 6.77 0.74 4.20 0.63
6.00 6.84 0.85 4.93 0.83
6.00 6.83 0.82 5.10 0.94
10.57 6.78 1.02 5.31 1.01
10.57 6.76 1.08 5.56 1.08
18.14 6.83 1.47 6.10 1.29
18.14 6.78 1.35 5.79 1.17
24.57 6.85 1.56 6.01 1.24
24.57 6.82 1.61 6.14 1.34
30.57 6.90 1.97 6.14 1.38
30.57 6.88 1.98 5.82 1.24

Submit or recommend next manuscript to SCIRP and we will provide best service for you:
Accepting pre-submission inquiries through Email, Facebook, LinkedIn, Twitter, etc. A wide selection of journals (inclusive of 9 subjects, more than 200 journals) Providing 24-hour high-quality service User-friendly online submission system Fair and swift peer-review system Efficient typesetting and proofreading procedure Display of the result of downloads and visits, as well as the number of cited articles Maximum dissemination of your research work
Submit your manuscript at: http://papersubmission.scirp.org/ Or contact [email protected]