LDCs in Global and regional value chains-witada-no text · in services or investment areas,...
23
Global and regional value chains: Opportunities, challenges and way forward for Asia-Pacific LDCs Dr. Mia Mikic Dr Witada Anukoonwattaka with Pedro j. Martinez Edo (research assistance) Trade and Investment Division, ESCAP ESCAP/OHRLLS Asia-Pacific Regional Meeting on Implementing the Istanbul Programme of Action (IPoA) Bangkok, 14-16 Dec 2011
Transcript of LDCs in Global and regional value chains-witada-no text · in services or investment areas,...

Global and regional value chains: Opportunities, challenges and way forward for Asia-Pacific LDCs
Dr. Mia MikicDr Witada Anukoonwattaka
with Pedro j. Martinez Edo (research assistance)Trade and Investment Division, ESCAP
ESCAP/OHRLLS Asia-Pacific Regional Meeting on Implementing the Istanbul Programme of Action (IPoA)
Bangkok, 14-16 Dec 2011
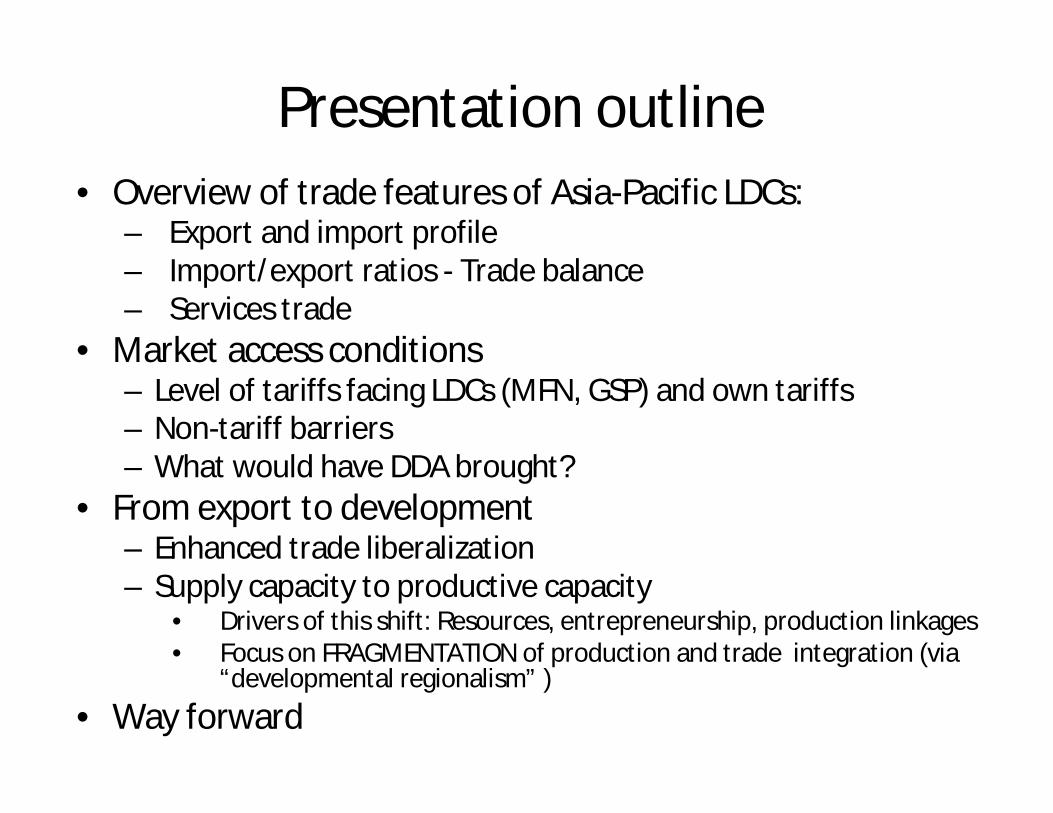
Presentation outline
• Overview of trade features of Asia-Pacific LDCs:– Export and import profile – Import/export ratios - Trade balance – Services trade
• Market access conditions – Level of tariffs facing LDCs (MFN, GSP) and own tariffs– Non-tariff barriers– What would have DDA brought?
• From export to development– Enhanced trade liberalization– Supply capacity to productive capacity
• Drivers of this shift: Resources, entrepreneurship, production linkages • Focus on FRAGMENTATION of production and trade integration (via
“developmental regionalism” )
• Way forward

Trade profiles for 14 Asia-Pacific LDCs
• Crisis finally caught up with LDCs as a group in 2009 and caused huge drop in goods and services export (24%); in 2010 the trade in goods and service rebounded at almost 27%
• A-P LDCs followed closely the trade collapse and recovery , despite the fact that they are not so heavily dependent of export of natural gas and oil, as the rest of LDCs
• Evolution of LDCs' exports of goods and commercial services, 2000-2010 (Index, 2000=100)
0
100
200
300
400
500
600
700
800
900
2000 2001 2002 2003 2004 2005 2006 2007 2008 2009 2010
Commercial services Other goods Fuels and Mining

Export propensity & import dependence
In principle, export propensity is lower for LDCs than developing countries (except in case of India and other similarly large countries).Import dependence on the other hand is comparable or in some cases higher than in developing countries/. Relative to world average, LDCs’ export /GDP is lower, and import/GDP higher than for the world

Coverage ratios of imports by exports
Source: WTO 2011

Who is importing what from the LDCs*?
Source: WTO 2011, * All LDCs

Services trade
Services/merchandise exportRatio, 2000-2009
• Averaging 18.25% while the world was almost close to 25% (but the whole Asia-Pacific was also around 18%) => shows Asia’s relative dependence on merchandise exports
Tourism as the largest export sector, 2000-2008
• Maldives (76.6%)
• Samoa (69.8%)
• Vanuatu (52.1%)
• Tuvalu (34.8%)
• Nepal (19.6%)
2nd or 3rd larges in:
• Cambodia (19.2%)
Source: WTO (2011)- Gross tourism earnings in % of total exports of goods and services in 2008

Market access conditions – effective margin of preference (developed markets)
Source: WTO 2011, All LDCs

Utilization of preferencesMarket a Per cent of total LDC imports Imports entering under
preferential regime as a per cent of eligible imports
Eligible to any preference
Entering under any preference
Australia 66.1 59.1 89.4Canada 36.7 32.7 89.1EU (low estimate) b, 48.2 40.1 81.9EU (high estimate) 49.0 41.4 85.9US c 69.5 60.9 87.5
a Results are not directly comparable between preferential schemes, due to difference in coverage and reporting.b Includes GSP and other preferential schemes.
C includes all schemes
Source: WTO.

Market conditions in selected developing countries with DFQF access• Countries offering some schemes: Brazil, Chile,
China (60% of all tariff lines*), Hong Kong, China; India (85%of tariff lines to be covered under DFQF in 2012), Kenya, Republic of Korea (72% of tariff lines in 2009), Malaysia, Mexico, Pakistan, Singapore, South Africa, Taiwan Province of China, (32% of tariff lines in 2009), Thailand and Turkey (80% of tariff lines in 2009)
• ARTNeT provided a study of access in RoK and India
• Most recent changes in Chinese scheme
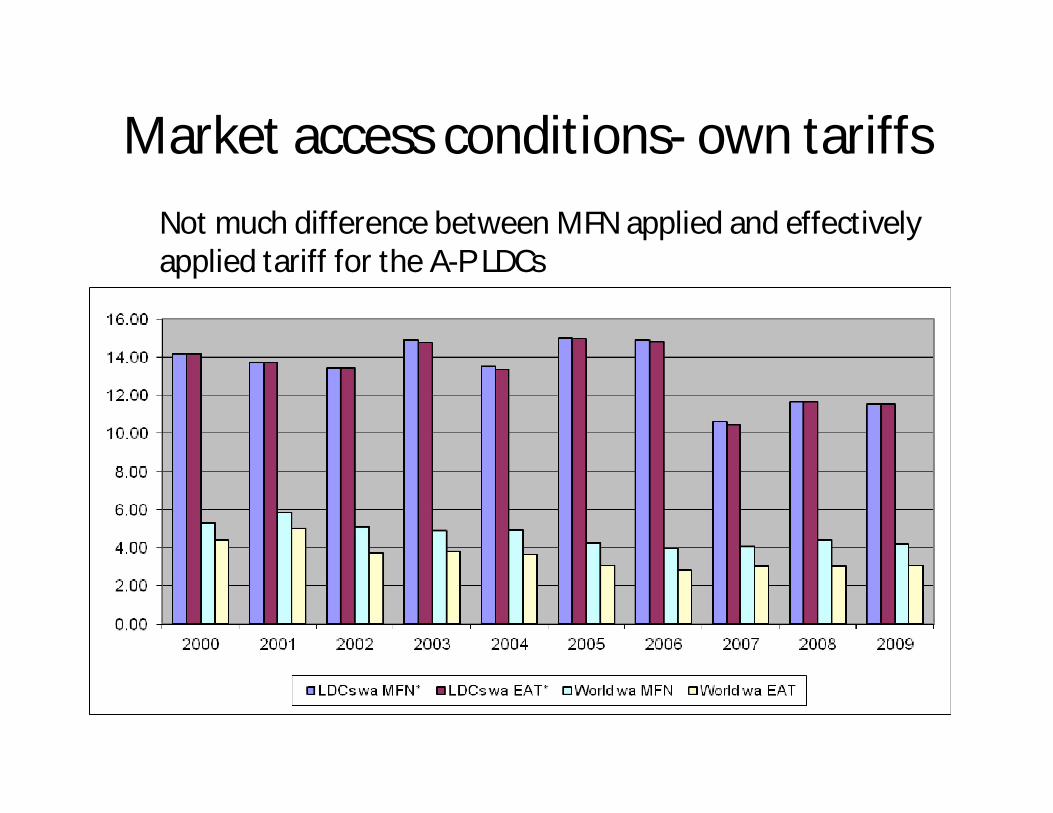
Market access conditions- own tariffs
Not much difference between MFN applied and effectively applied tariff for the A-P LDCs

Non-tariff barriers
• Old NTB – SPS, TBT, AD and similar safeguards
• New NTB – regulatory (behind the border) often in services or investment areas, procurement (public purchases), domestic support etc
• BRICs said to be using “industrialization policies”– combine industrial support and trade restrictive measures
• Large proportion of costs in trade is associated with this measure

Promise of DDA
• A decade of “stop-go” negotiations did not produce much to show for
• DFQF preferences for LDCs discussed in Hong Kong MC in 2005, still not certainty
• LDCs are not being asked to reduce their tariff, just to increase tariff bindings; some see this as a problem
• Benefits from the DDA:– Agriculture– NAMA– Services– trade facilitation– some other smaller deals

From export to development ≈enhanced trade liberalization
• International trade can expand markets, facilitate competition and disseminate knowledge which can catalyze economic growth and human development. Trade can also raise productivity and increase exposure to new technologies, which can also drive growth. However, none of this is automatic or inevitable
• Liberalization needs a support to deliver benefits, UNCTAD proposes 3 type of policy measures:
• General support• LDC-specific support• South-South cooperation

From supply capacity to productive capacity
• Drivers of this shift:
– Productive resources,
– Entrepreneurship,
– Production linkages
• Focus on FRAGMENTATION of production with trade integration


One way to support IPNs is through so-called deep FTAs
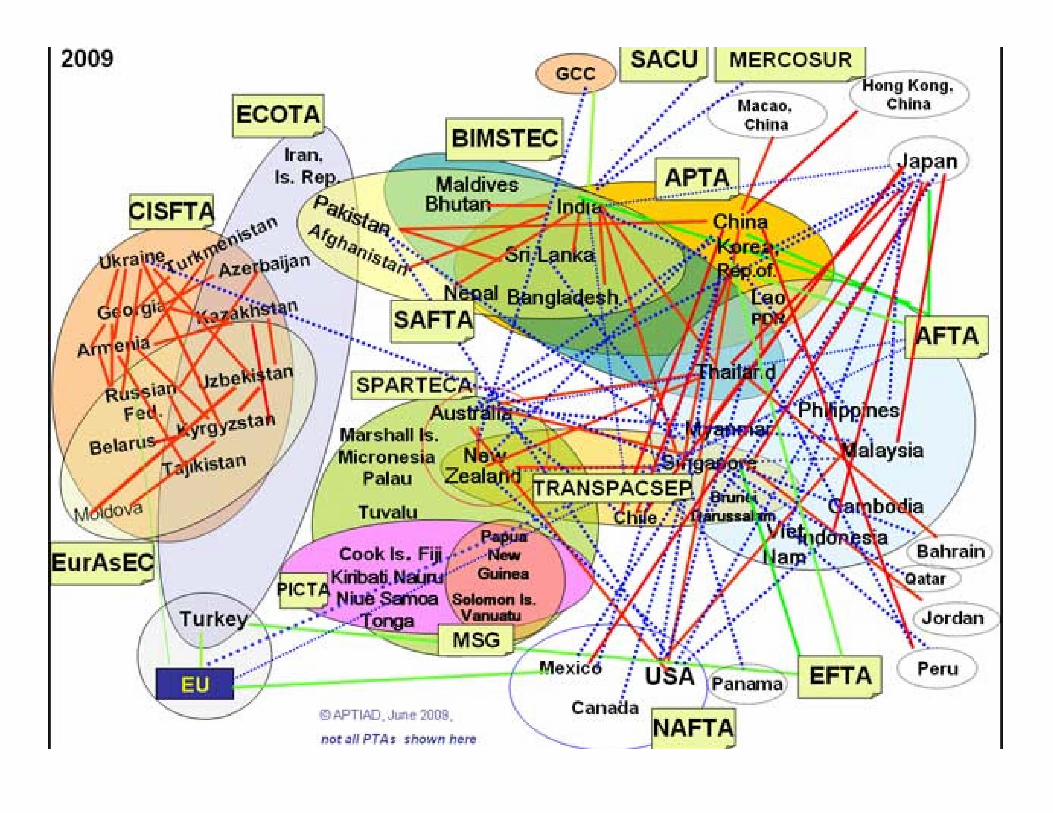
Asia-Pacific regionalism:
•Main problem for AP LDCs is that trade might be diverted to countries who sign many more agreements (given that LDCs are not too involved in agreements)
•Number of deals for the LDC from 0 to 8 (Lao PDR has max number due to ASEAN’s activity)
•Coverage of trade varies from little to almost all of trade done only with PTA partners
•However, are these PTAs of the type helping to integrate LDCs in the IPNs- do they cover desired areas (competition, investment, GP, etc)?

ECOTA
APTA
Vanuatu
Afghanistan
CambodiaButhan
Nepal
Myanmar
Maldives
Lao PDR
Kiribati
Tuvalu
Timor LesteSamoa
Bangladesh
MSG
Solomon Islands
PICTA
GSTP
SAFTA
IndiaAustralia -
New Zealand
Japan
ThailandRep. OfKorea
China
ASEAN
“Noodle bowl” for AP LDCs

Impact of WTO and PTAs on exports of LDCs and Non-LDCs(preliminary results from the gravity model)
Variables (1) (2) (3)
Dummies Baier & Bergstrand Heckman
PTA non LDC 0.207*** 0.417*** 0.417***
(0.0396) (0.0400) (0.0401)
PTA LDC 0.146 0.220 0.226
(0.287) (0.339) (0.340)
GATT non LDC 0.671*** 0.596*** 0.593***
(0.0912) (0.0941) (0.0940)
GATT LDC 2.353*** 2.765*** 2.784***
(0.361) (0.415) (0.416)
•Non-LDC countries with a PTA trade 23%-52% more than without PTA
• PTAs (reciprocal) don’t contribute to a bilateral increase on trade for LDCs. LDCs benefit more from unilateral GSP schemes.
•Positive impacts of GATT/WTO membership on exports of a country seem to be higher than that of PTAs, especially in the case of LDCs
•GATT/WTO membership multiplies trade by 10 times in case of LDCs and 2 times in the case of non-LDCs

MTS or PTAs ? Or “Developmental regionalism”?
• Quantitative analysis supports MTS over PTAs especially when MTS is strengthened with additional preferences through GSP and GSPplus
• However, given the complexity of getting deals under MTS, UNCTAD (2011) suggests “Developmental regionalism”.
• “Developmental regionalism” goes beyond the domain of trade per se, and includes other, more ambitious forms of intervention, such as industrial policy
• The region has had flirtation with industrial policy for many years; results are still under discussion (ARTNeTsymposium 2011)

Way forward
• Necessary to continue work on MTS-based solutions
• National reforms and regional initiatives to create environment and generate resources for deeper economic diversification in LDCs, enabling them to benefit more from integration in the regional and world economy
• ESCAP has important role in securing analytical and normative work and offering a forum for exchange of experiences, networking and generation of new knowledge relevant for the region