
LCMS-IT-TOF - ecopharm.ru · Pulsed Ar CID In the LCMS-IT-TOF ... The LCMS-IT-TOF ... Expected...
16
C146-E093B LCMS-IT-TOF ® Shimadzu High-Speed Liquid Chromatograph Mass Spectrometer LCMS-IT-TOF ® Shimadzu High-Speed Liquid Chromatograph Mass Spectrometer LCMS-IT-TOF ® LCMS-IT-TOF ®
-
Upload
hoangduong -
Category
Documents
-
view
241 -
download
0
Transcript of LCMS-IT-TOF - ecopharm.ru · Pulsed Ar CID In the LCMS-IT-TOF ... The LCMS-IT-TOF ... Expected...
C146-E093B
LCMS-IT-TOF ®
ShimadzuHigh-Speed Liquid Chromatograph Mass SpectrometerLCMS-IT-TOF®
ShimadzuHigh-Speed Liquid Chromatograph Mass SpectrometerLCMS-IT-TOF®
LCMS-IT-TOF ®
L C M S - I T- T O F ® ,
a s i g n i f i c a n t l y a d v a n c e d M S d e t e c t o r e n a b l i n g
L C / M S n h i g h - p r e c i s i o n m a s s a n a l y s i s
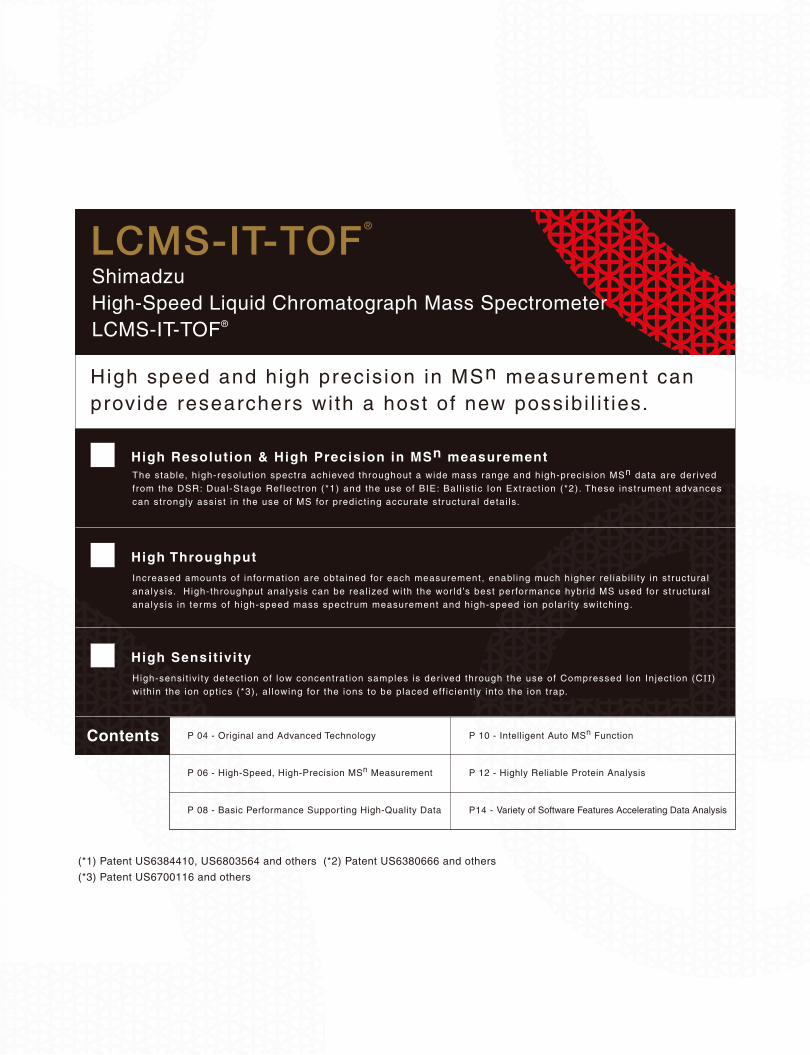
High speed and high precis ion in MSn measurement can provide researchers wi th a host of new possibi l i t ies.
Contents
Shimadzu High-Speed Liquid Chromatograph Mass SpectrometerLCMS-IT-TOF®
LCMS-IT-TOF®
The stable, h igh-resolut ion spectra achieved throughout a wide mass range and high-precis ion MSn data are der ived from the DSR: Dual-Stage Ref lectron (*1) and the use of BIE: Bal l is t ic Ion Extract ion (*2). These instrument advances can strongly assist in the use of MS for predict ing accurate structural detai ls.
High Resolution & High Precision in MSn measurement
Increased amounts of informat ion are obtained for each measurement, enabl ing much higher rel iabi l i ty in structural analysis. High-throughput analysis can be real ized with the wor ld ’s best performance hybr id MS used for structural analysis in terms of h igh-speed mass spectrum measurement and high-speed ion polar i ty switching.
High Throughput
High-sensi t iv i ty detect ion of low concentrat ion samples is der ived through the use of Compressed Ion Inject ion (CII) wi th in the ion opt ics (*3), a l lowing for the ions to be placed ef f ic ient ly into the ion t rap.
High Sensit ivity
P 04 - Original and Advanced Technology
P 06 - High-Speed, High-Precision MSn Measurement
P 08 - Basic Performance Supporting High-Quality Data
P 10 - Intelligent Auto MSn Function
P 12 - Highly Reliable Protein Analysis
P14 - Variety of Software Features Accelerating Data Analysis
(*1) Patent US6384410, US6803564 and others (*2) Patent US6380666 and others
(*3) Patent US6700116 and others
Original and Advanced TechnologyWhat is the IT-TOF?
LCMS-IT-TOF®
Compressed Ion Introduction (CII™)
4
There are several types of LC/MS instruments in the market current ly. The single-quadrupole and tr iple quadrupole instruments are pr imarily used for quantitative analysis, while the ion trap, LC-TOF and Qq-TOF instruments are pr imarily used for qualitative analysis. Tr iple quadrupoles are excellent instruments for quantitative analysis, although they falter in comparison to other types of mass spectrometers in terms of mass accuracy and resolution. Ion traps excel in structural analysis due to their ability to perform MSn; however, the mass accuracy and resolution, like with a tr iple quadrupole MS, are l imited. On the other hand, the Qq-TOF features excellent resolution and mass accuracy compared to the above-mentioned types of instruments. They do exhibit a downside in that it is not possible for Qq-TOF instruments to perform MS3 or greater as their construction does not suppor t MSn.Shimadzu developed a new type of hybrid mass spectrometer, the LCMS-IT-TOF®, which possesses both the MSn abil i ty of an ion trap and the excellent resolution and mass accuracy of a TOF. The LCMS-IT-TOF® opens new doors to the prediction of elemental composition and structural analysis.
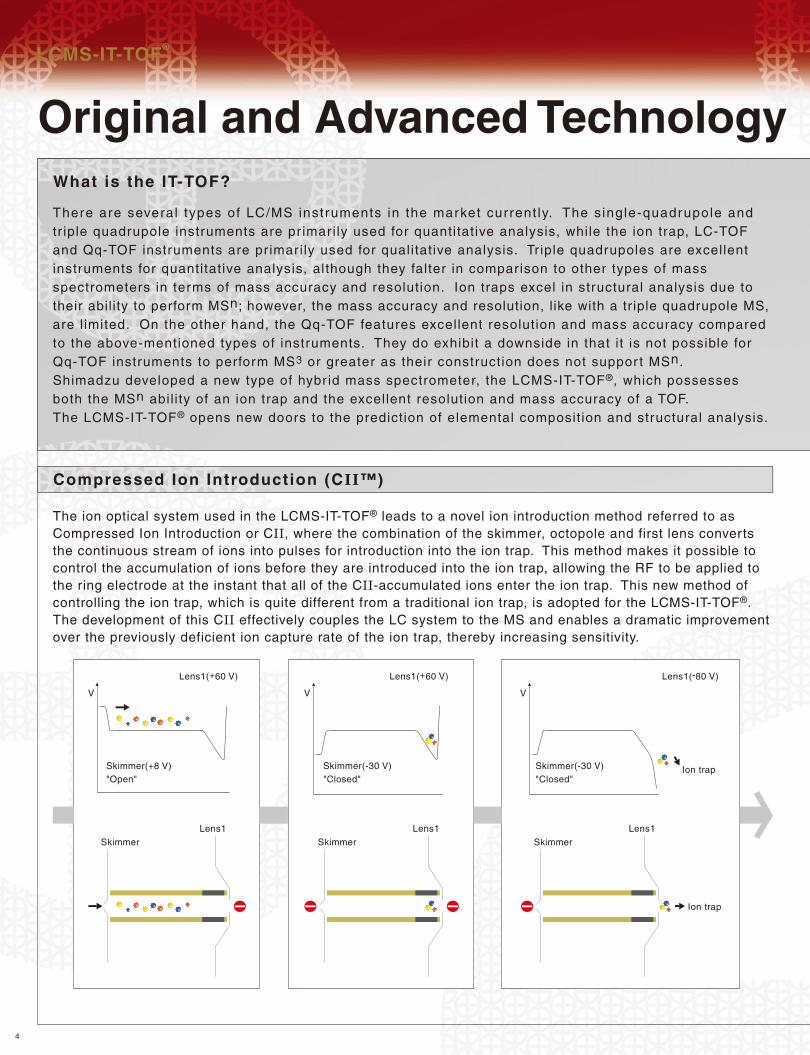
The ion optical system used in the LCMS-IT-TOF® leads to a novel ion introduction method referred to as Compressed Ion Introduction or CII, where the combination of the skimmer, octopole and first lens converts the continuous stream of ions into pulses for introduction into the ion trap. This method makes it possible to control the accumulation of ions before they are introduced into the ion trap, allowing the RF to be applied to the ring electrode at the instant that all of the CII-accumulated ions enter the ion trap. This new method of controlling the ion trap, which is quite different from a traditional ion trap, is adopted for the LCMS-IT-TOF®. The development of this CII effectively couples the LC system to the MS and enables a dramatic improvement over the previously deficient ion capture rate of the ion trap, thereby increasing sensitivity.
Skimmer(-30 V)"Closed"
Lens 1(+60 V)
Skimmer(+8 V)"Open"
Skimmer
Lens 1(+60 V)
Lens 1
V V
Skimmer(-30 V)"Closed"
Lens 1(-80 V)
V
Skimmer
Lens 1
Skimmer
Lens 1
Ion trap
Ion trap
5
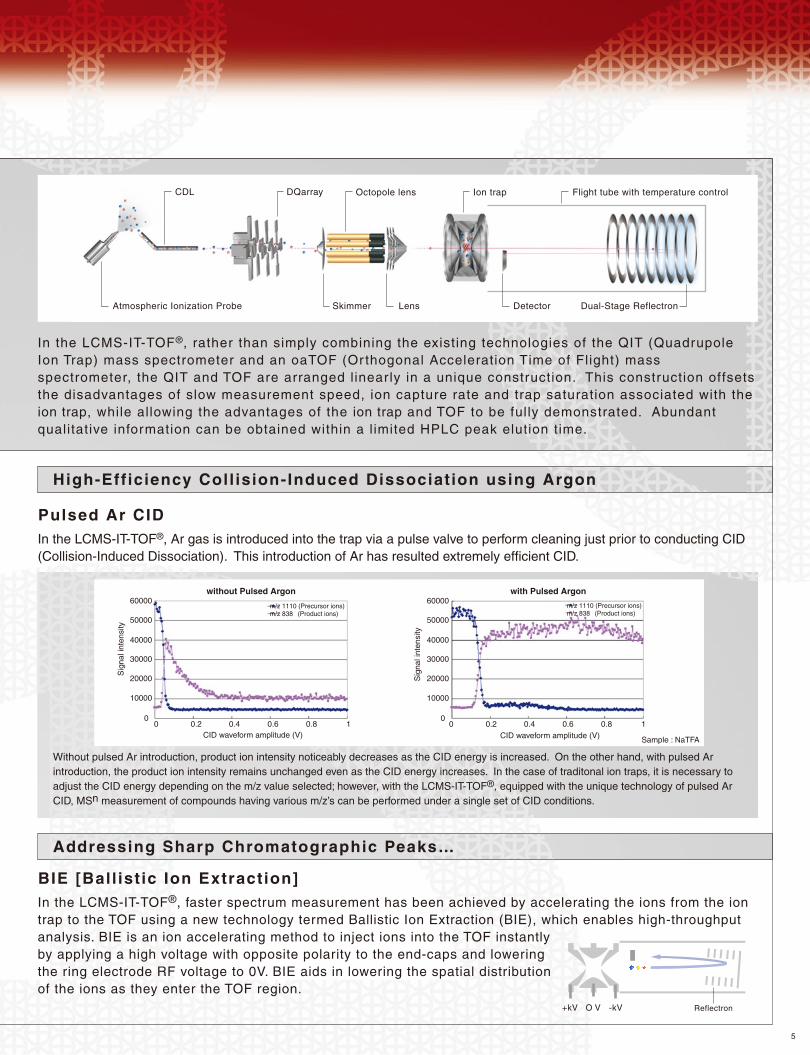
High-Efficiency Coll ision-Induced Dissociation using Argon
Pulsed Ar CIDIn the LCMS-IT-TOF®, Ar gas is introduced into the trap via a pulse valve to perform cleaning just prior to conducting CID (Collision-Induced Dissociation). This introduction of Ar has resulted extremely efficient CID.
Addressing Sharp Chromatographic Peaks…
BIE [Ball ist ic Ion Extraction]
In the LCMS-IT-TOF®, rather than simply combining the existing technologies of the QIT (Quadrupole Ion Trap) mass spectrometer and an oaTOF (Or thogonal Acceleration Time of Flight) mass spectrometer, the QIT and TOF are arranged linearly in a unique construction. This construction offsets the disadvantages of slow measurement speed, ion capture rate and trap saturation associated with the ion trap, while allowing the advantages of the ion trap and TOF to be fully demonstrated. Abundant qualitative information can be obtained within a l imited HPLC peak elution time.
CDL DQarray Octopole lens
SkimmerAtmospheric Ionization Probe Lens Detector Dual-Stage Reflectron
Flight tube with temperature controlIon trap
Without pulsed Ar introduction, product ion intensity noticeably decreases as the CID energy is increased. On the other hand, with pulsed Ar introduction, the product ion intensity remains unchanged even as the CID energy increases. In the case of traditonal ion traps, it is necessary to adjust the CID energy depending on the m/z value selected; however, with the LCMS-IT-TOF®, equipped with the unique technology of pulsed Ar CID, MSn measurement of compounds having various m/z’s can be performed under a single set of CID conditions.
60000
50000
40000
30000
20000
10000
00 0.2 0.4 0.6 0.8 1
CID waveform amplitude (V)
m/z 1110 (Precursor ions)m/z 838 (Product ions)
Sig
nal i
nten
sity
60000
50000
40000
30000
20000
10000
00 0.2 0.4 0.6 0.8 1
CID waveform amplitude (V)
Sig
nal i
nten
sity
without Pulsed Argon with Pulsed Argon
+kV O V -kV Reflectron
In the LCMS-IT-TOF®, faster spectrum measurement has been achieved by accelerating the ions from the ion trap to the TOF using a new technology termed Ballistic Ion Extraction (BIE), which enables high-throughput analysis. BIE is an ion accelerating method to inject ions into the TOF instantly by applying a high voltage with opposite polarity to the end-caps and lowering the ring electrode RF voltage to 0V. BIE aids in lowering the spatial distribution of the ions as they enter the TOF region.
m/z 1110 (Precursor ions)
Sample : NaTFA
m/z 838 (Product ions)
High-Speed, High-Accuracy MSn MeHigh-Speed, High-Accuracy MSn Measurement Example
6
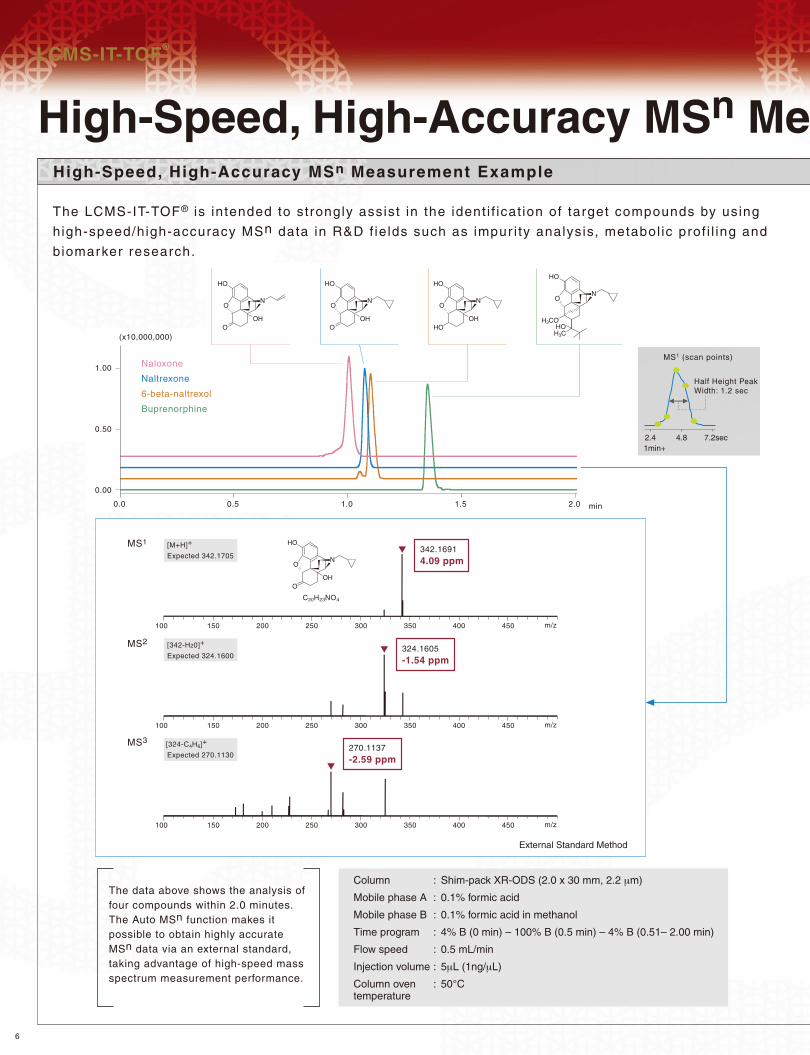
The LCMS-IT-TOF® is intended to strongly assist in the ident i f icat ion of target compounds by using
high-speed/high-accuracy MSn data in R&D f ie lds such as impur i ty analysis, metabol ic prof i l ing and
biomarker research.
Naloxone
Naltrexone
6-beta-naltrexol
Buprenorphine
(x10,000,000)
1.00
0.50
0.00
0.0 0.5 1.0 1.5 2.0 min
N
OH
O
O
HO
N
OH
O
O
HO
N
OH
O
O
HO
N
OH
O
HO
HO
MS1
MS2
MS3
MS1 (scan points)
2.4 4.8 7.2sec
Half Height Peak Width: 1.2 sec
1min+
N
HO
O
H3CO
H3C
HO
100 200150 300 400 m/z250 350 450
100 200150 300 400 m/z250 350 450
100 200150 300 400 m/z250 350 450
270.1137-2.59 ppm
324.1605-1.54 ppm
342.16914.09 ppm
[324-C4H6]+
Expected 270.1130
[342-H20]+
Expected 324.1600
[M+H]+
Expected 342.1705
C20H23NO4
The data above shows the analysis of four compounds within 2.0 minutes. The Auto MSn function makes it possible to obtain highly accurate MSn data via an external standard, taking advantage of high-speed mass spectrum measurement performance.
Column
Mobile phase A
Mobile phase B
Time program
Flow speed
Injection volume
Column oventemperature
:
:
:
:
:
:
:
Shim-pack XR-ODS (2.0 x 30 mm, 2.2 μm)
0.1% formic acid
0.1% formic acid in methanol
4% B (0 min) – 100% B (0.5 min) – 4% B (0.51– 2.00 min)
0.5 mL/min
5μL (1ng/μL)
50°C
LCMS-IT-TOF®
External Standard Method
asurement
7
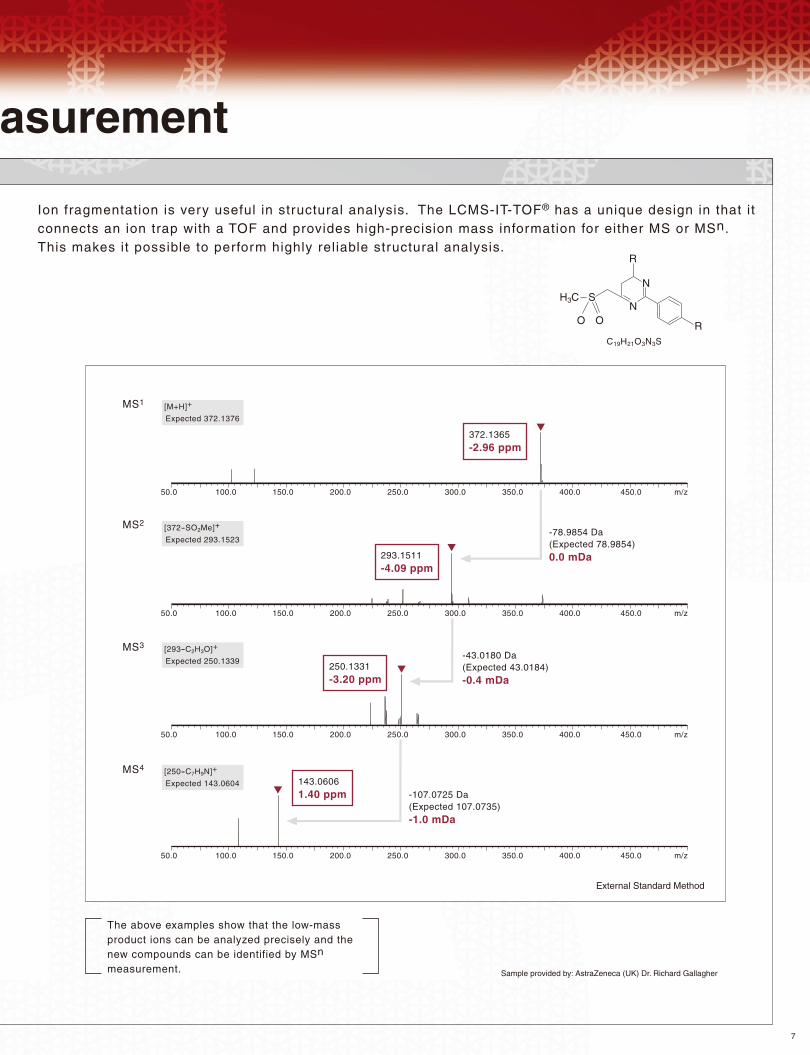
Ion fragmentation is very useful in structural analysis. The LCMS-IT-TOF® has a unique design in that it connects an ion trap with a TOF and provides high-precision mass information for either MS or MSn. This makes it possible to perform highly reliable structural analysis.
The above examples show that the low-mass product ions can be analyzed precisely and the new compounds can be identified by MSn measurement.
MS4
143.06061.40 ppm -107.0725 Da
(Expected 107.0735)-1.0 mDa
-43.0180 Da(Expected 43.0184)-0.4 mDa
-78.9854 Da(Expected 78.9854)0.0 mDa
250.1331-3.20 ppm
293.1511-4.09 ppm
372.1365-2.96 ppm
[250--C7H9N]+
Expected 143.0604
MS3 [293--C2H3O]+
Expected 250.1339
MS2[372--SO2Me]+
Expected 293.1523
MS1
50.0 150.0100.0 250.0 400.0 m/z200.0 300.0 350.0 450.0
50.0 150.0100.0 250.0 400.0 m/z200.0 300.0 350.0 450.0
50.0 150.0100.0 250.0 400.0 m/z200.0 300.0 350.0 450.0
50.0 150.0100.0 250.0 400.0 m/z200.0 300.0 350.0 450.0
[M+H]+
Expected 372.1376
C19H21O3N3S
R
R
N
NS
O O
H3C
Sample provided by: AstraZeneca (UK) Dr. Richard Gallagher
External Standard Method
Basic Performance Supporting HighCompatibi l i ty of High Sensit ivity and Mass Accuracy
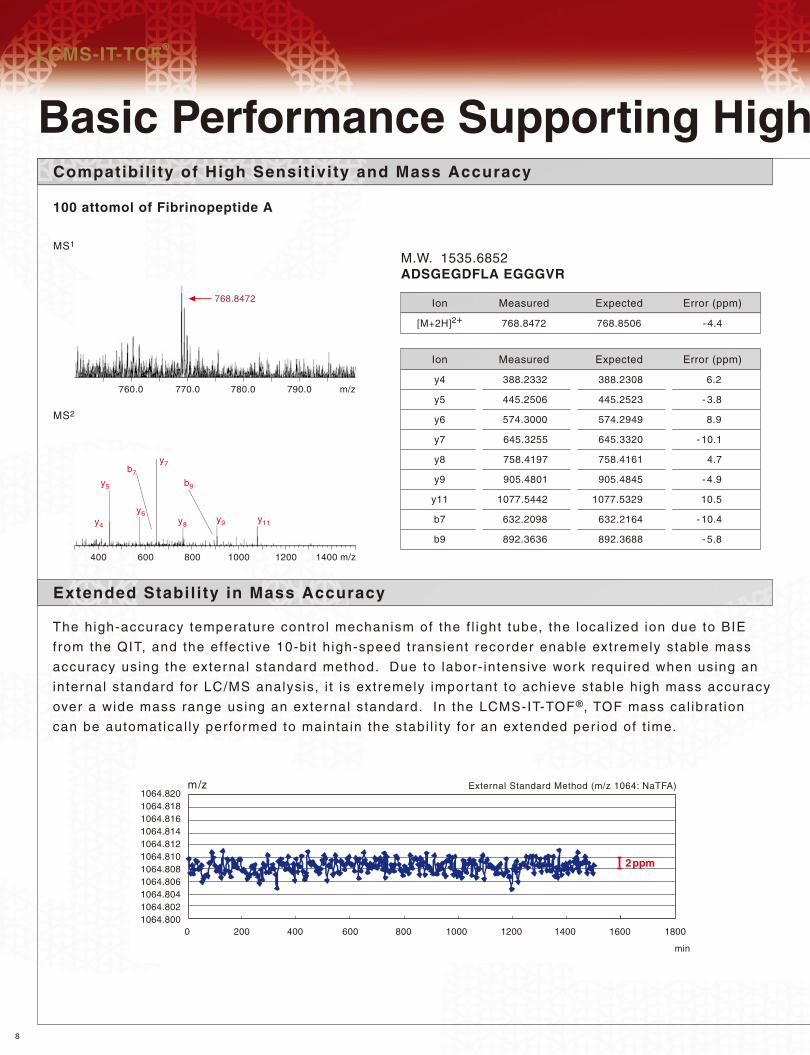
100 attomol of Fibrinopeptide A
Extended Stabil i ty in Mass Accuracy
8
The high-accuracy temperature control mechanism of the f l ight tube, the local ized ion due to BIE
from the QIT, and the ef fect ive 10-bi t h igh-speed transient recorder enable extremely stable mass
accuracy using the external standard method. Due to labor- intensive work required when using an
internal standard for LC/MS analysis, i t is extremely impor tant to achieve stable high mass accuracy
over a wide mass range using an external standard. In the LCMS-IT-TOF®, TOF mass cal ibrat ion
can be automat ical ly performed to maintain the stabi l i ty for an extended per iod of t ime.
M.W. 1535.6852ADSGEGDFLA EGGGVR
MS1
MS2
768.8472
760.0 770.0 780.0 790.0 m/z
y4
y5
b7
y6
400 600 800 1000 1200 1400 m/z
y8y9
b9
y11
y7
Ion
[M+2H]2+
Measured
768.8472
Expected
768.8506
Error (ppm)
- 4.4
Ion
y4
y5
y6
y7
y8
y9
y11
b7
b9
Measured
388.2332
445.2506
574.3000
645.3255
758.4197
905.4801
1077.5442
632.2098
892.3636
Expected
388.2308
445.2523
574.2949
645.3320
758.4161
905.4845
1077.5329
632.2164
892.3688
Error (ppm)
6.2
- 3.8
8.9
- 10.1
4.7
- 4.9
10.5
- 10.4
- 5.8
2ppm
m/z
0 200 400 600 800 1000 1200 1400 1600 1800
min
1064.8201064.8181064.8161064.8141064.8121064.8101064.8081064.8061064.8041064.8021064.800
External Standard Method (m/z 1064: NaTFA)
LCMS-IT-TOF®
-Quality Data
9
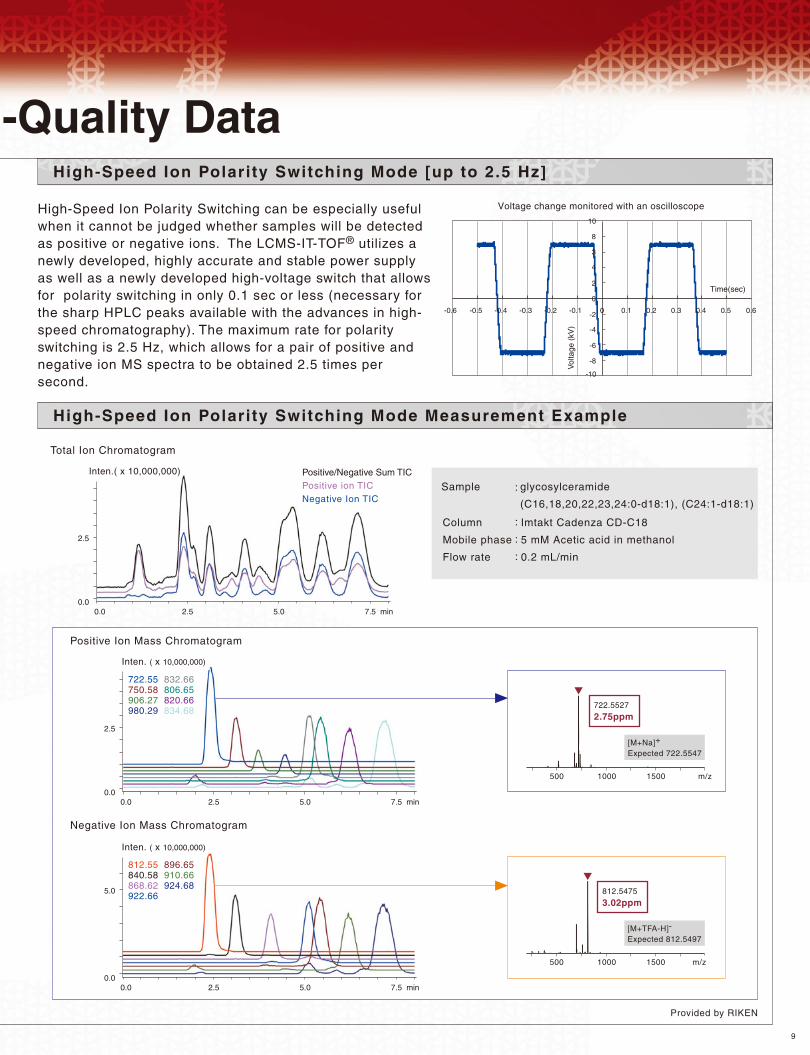
High-Speed Ion Polarity Switching Mode [up to 2.5 Hz]
High-Speed Ion Polarity Switching Mode Measurement Example
High-Speed Ion Polarity Switching can be especially useful when it cannot be judged whether samples will be detected as positive or negative ions. The LCMS-IT-TOF® utilizes a newly developed, highly accurate and stable power supply as well as a newly developed high-voltage switch that allows for polarity switching in only 0.1 sec or less (necessary for the sharp HPLC peaks available with the advances in high-speed chromatography). The maximum rate for polarity switching is 2.5 Hz, which allows for a pair of positive and negative ion MS spectra to be obtained 2.5 times per second.
Voltage change monitored with an oscilloscope
0
0
-2
-4
-6
-8
-10
2
4
3
8
10
0.1-0.1-0.2-0.3-0.4-0.5-0.6 0.2 0.3 0.4 0.5 0.6
Vol
tage
(kV
)
Time(sec)
[M+Na]+
Expected 722.5547
[M+TFA-H]-
Expected 812.5497
500 1000 1500 m/z
Total Ion Chromatogram
Negative Ion Mass Chromatogram
Positive Ion Mass Chromatogram
Inten.( x 10,000,000) Positive/Negative Sum TIC Positive ion TICNegative Ion TIC
2.5
0.00.0 2.5 5.0 7.5 min
Inten. ( x 10,000,000)
2.5
0.00.0 2.5 5.0 7.5 min
Inten. ( x 10,000,000)
5.0
0.00.0 2.5 5.0 7.5 min
722.55 832.66750.58 806.65906.27 820.66980.29 834.68
812.55 896.65840.58 910.66868.62 924.68922.66
500 1000 1500 m/z
722.5527
2.75ppm
812.5475
3.02ppm
Sample glycosylceramide
(C16,18,20,22,23,24:0-d18:1), (C24:1-d18:1)
Column
Mobile phase
Flow rate
:
:
:
:
Imtakt Cadenza CD-C18
5 mM Acetic acid in methanol
0.2 mL/min
Provided by RIKEN
Intelligent Auto MSn FunctionWhat is the Auto MSn Function?
10
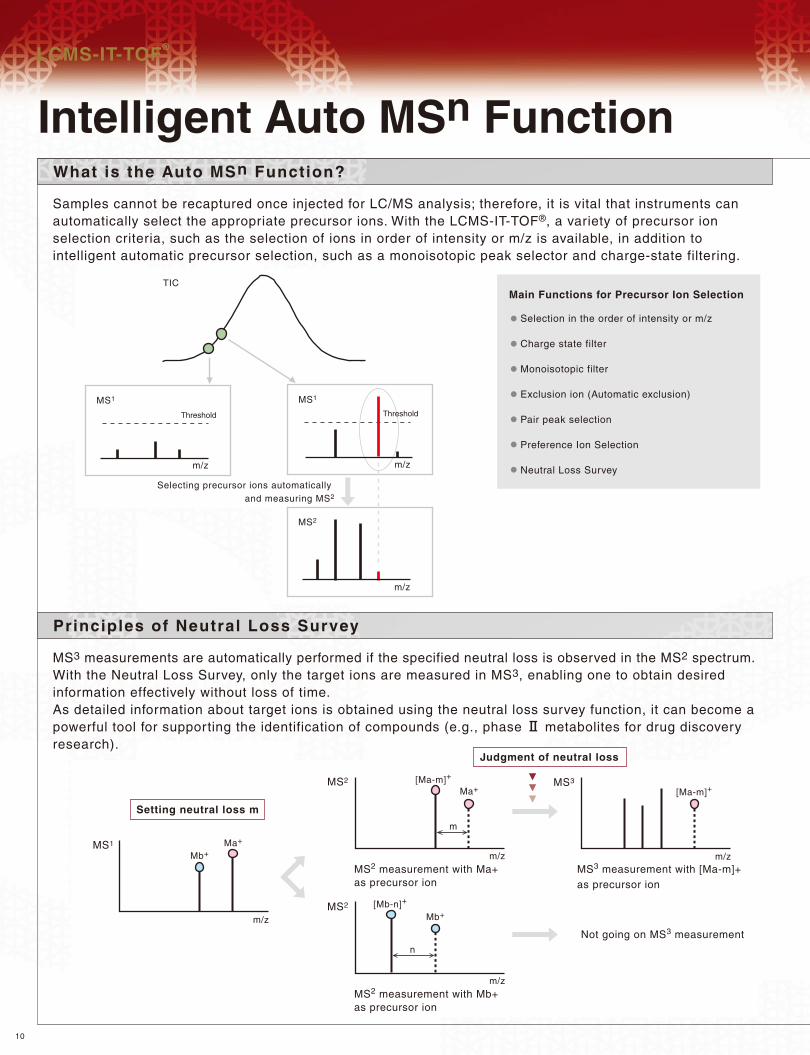
Samples cannot be recaptured once injected for LC/MS analysis; therefore, it is vital that instruments can automatically select the appropriate precursor ions. With the LCMS-IT-TOF®, a variety of precursor ion selection criteria, such as the selection of ions in order of intensity or m/z is available, in addition to intelligent automatic precursor selection, such as a monoisotopic peak selector and charge-state filtering.
Principles of Neutral Loss Survey
MS3 measurements are automatically performed if the specified neutral loss is observed in the MS2 spectrum. With the Neutral Loss Survey, only the target ions are measured in MS3, enabling one to obtain desired information effectively without loss of time.As detailed information about target ions is obtained using the neutral loss survey function, it can become a powerful tool for supporting the identification of compounds (e.g., phase @ metabolites for drug discovery research).
TIC
MS1
m/z
Threshold
Selecting precursor ions automatically and measuring MS2
MS2
m/z
MS1
m/z
Selection in the order of intensity or m/z
Charge state filter
Monoisotopic filter
Exclusion ion (Automatic exclusion)
Pair peak selection
Preference Ion Selection
Neutral Loss Survey
Main Functions for Precursor Ion Selection
Threshold
m/z
MS1
Mb+Ma+
Not going on MS3 measurement
MS3 measurement with [Ma-m]+ as precursor ion
m/z
MS3
[Ma-m]+
MS2 measurement with Ma+ as precursor ion
m/z
MS2 [Ma-m]+
Ma+
m
MS2 measurement with Mb+ as precursor ion
m/z
MS2
Mb+[Mb-n]+
n
Setting neutral loss m
LCMS-IT-TOF®
Judgment of neutral loss
100 200 300 400 500 600 700 800 900 m/z
100 200 300 400 500 600 700 800 900 m/z
100 200 300 400 500 600 700 800 900 m/z
11
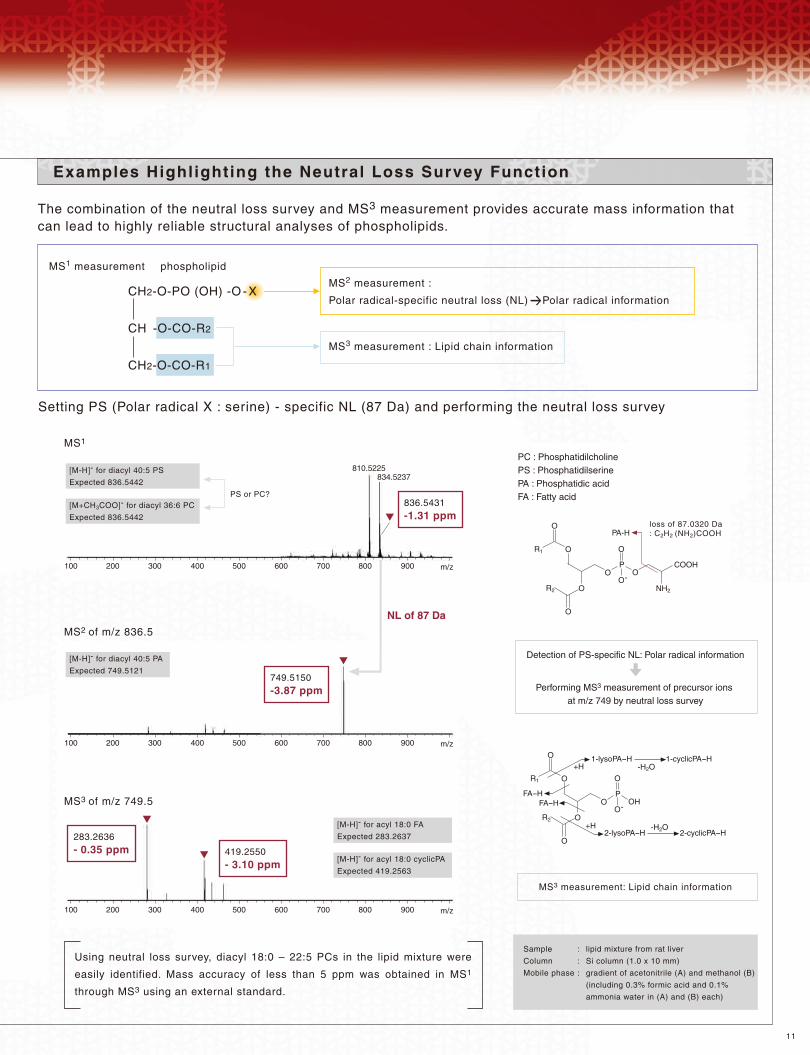
Examples Highlighting the Neutral Loss Survey Function
The combination of the neutral loss survey and MS3 measurement provides accurate mass information that can lead to highly reliable structural analyses of phospholipids.
CH2-O-CO-R1
CH -O-CO-R2
CH2-O-PO (OH) -O - X
810.5225834.5237
NL of 87 Da
PC : PhosphatidilcholinePS : Phosphatidilserine PA : Phosphatidic acidFA : Fatty acid
O
O
O
P COOH
PA-H
O NH2
O
O
loss of 87.0320 Da: C2H2 (NH2)COOH
R1
R2
OO-
R1
O
O
O
P
O
O
OH
-H2O
R2+H
1-lysoPA--H 1-cyclicPA--H+H
FA--HFA--H O
O-
-H2O2-lysoPA--H 2-cyclicPA--H
836.5431-1.31 ppm
749.5150-3.87 ppm
283.2636- 0.35 ppm 419.2550
- 3.10 ppm
[M-H]- for diacyl 40:5 PS
Expected 836.5442
[M+CH3COO]- for diacyl 36:6 PC
Expected 836.5442
[M-H]- for diacyl 40:5 PA
Expected 749.5121
[M-H]- for acyl 18:0 FA
Expected 283.2637
[M-H]- for acyl 18:0 cyclicPA
Expected 419.2563
PS or PC?
Detection of PS-specific NL: Polar radical information
Performing MS3 measurement of precursor ions at m/z 749 by neutral loss survey
MS3 measurement: Lipid chain information
Using neutral loss survey, diacyl 18:0 – 22:5 PCs in the lipid mixture were
easily identified. Mass accuracy of less than 5 ppm was obtained in MS1
through MS3 using an external standard.
MS1
MS2 of m/z 836.5
MS3 of m/z 749.5
Sample
Column
Mobile phase
lipid mixture from rat liver
Si column (1.0 x 10 mm)
gradient of acetonitrile (A) and methanol (B)
(including 0.3% formic acid and 0.1%
ammonia water in (A) and (B) each)
:
:
:
MS1 measurement phospholipid
MS2 measurement :
Polar radical-specific neutral loss (NL) Polar radical information
MS3 measurement : Lipid chain information
Setting PS (Polar radical X : serine) - specific NL (87 Da) and performing the neutral loss survey
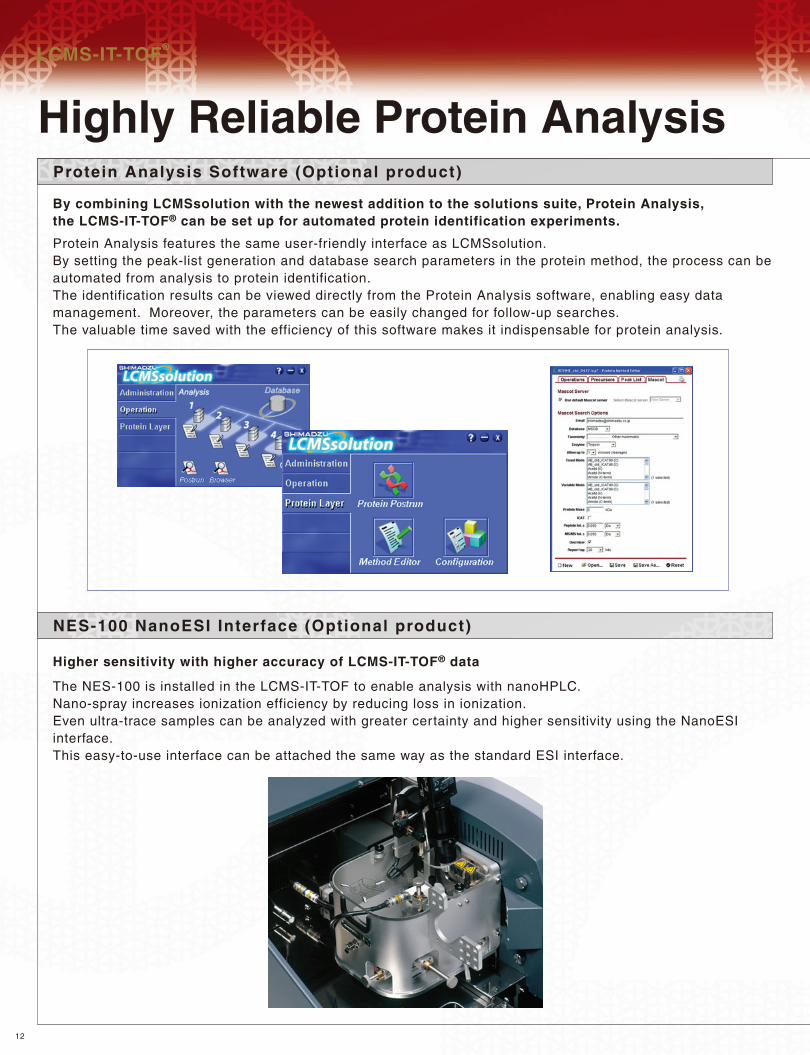
Highly Reliable Protein AnalysisProtein Analysis Software (Optional product)
12
By combining LCMSsolution with the newest addition to the solutions suite, Protein Analysis, the LCMS-IT-TOF® can be set up for automated protein identification experiments.
Protein Analysis features the same user-friendly interface as LCMSsolution.By setting the peak-list generation and database search parameters in the protein method, the process can be automated from analysis to protein identification.The identification results can be viewed directly from the Protein Analysis software, enabling easy data management. Moreover, the parameters can be easily changed for follow-up searches. The valuable time saved with the efficiency of this software makes it indispensable for protein analysis.
Higher sensitivity with higher accuracy of LCMS-IT-TOF® data
The NES-100 is installed in the LCMS-IT-TOF to enable analysis with nanoHPLC. Nano-spray increases ionization efficiency by reducing loss in ionization.Even ultra-trace samples can be analyzed with greater certainty and higher sensitivity using the NanoESI interface.This easy-to-use interface can be attached the same way as the standard ESI interface.
NES-100 NanoESI Interface (Optional product)
LCMS-IT-TOF®
13
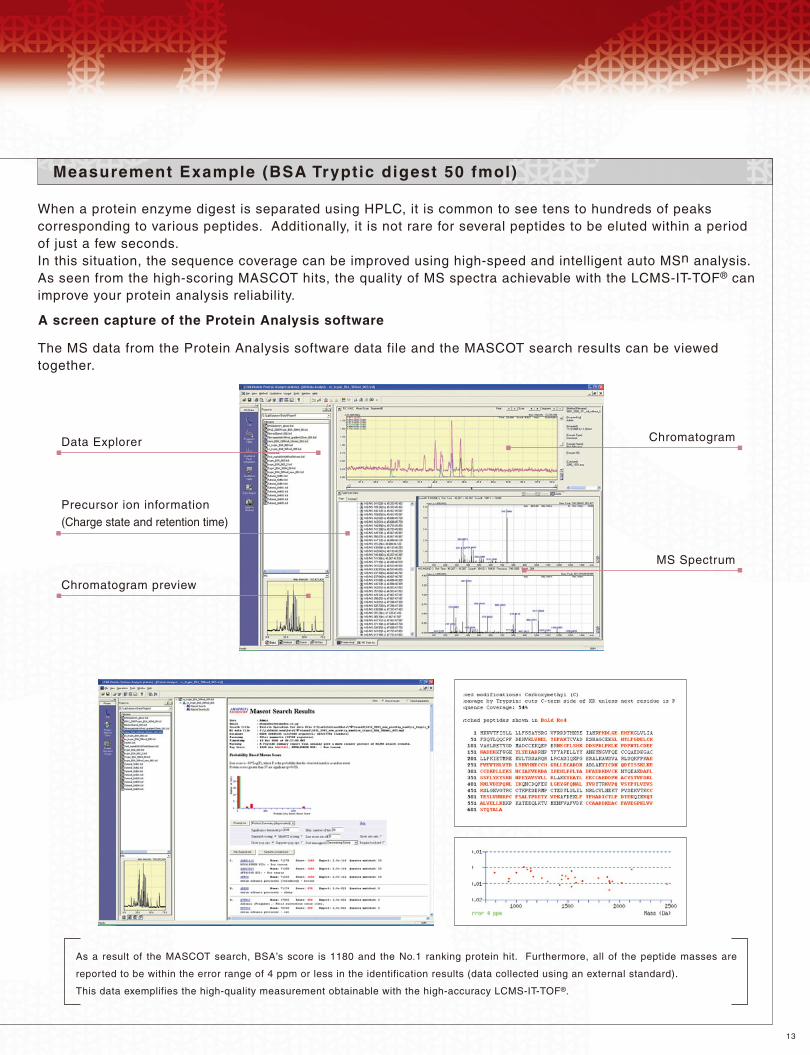
Measurement Example (BSA Tryptic digest 50 fmol)
When a protein enzyme digest is separated using HPLC, it is common to see tens to hundreds of peaks corresponding to various peptides. Additionally, it is not rare for several peptides to be eluted within a period of just a few seconds. In this situation, the sequence coverage can be improved using high-speed and intelligent auto MSn analysis.As seen from the high-scoring MASCOT hits, the quality of MS spectra achievable with the LCMS-IT-TOF® can improve your protein analysis reliability.
The MS data from the Protein Analysis software data file and the MASCOT search results can be viewed together.
A screen capture of the Protein Analysis software
Data Explorer Chromatogram
Chromatogram preview
Precursor ion information(Charge state and retention time)
MS Spectrum
As a result of the MASCOT search, BSA’s score is 1180 and the No.1 ranking protein hit. Furthermore, all of the peptide masses are
reported to be within the error range of 4 ppm or less in the identification results (data collected using an external standard).
This data exemplifies the high-quality measurement obtainable with the high-accuracy LCMS-IT-TOF®.
Software to Accelerate Data AnalysisComposition Prediction Software (Optional product)
14
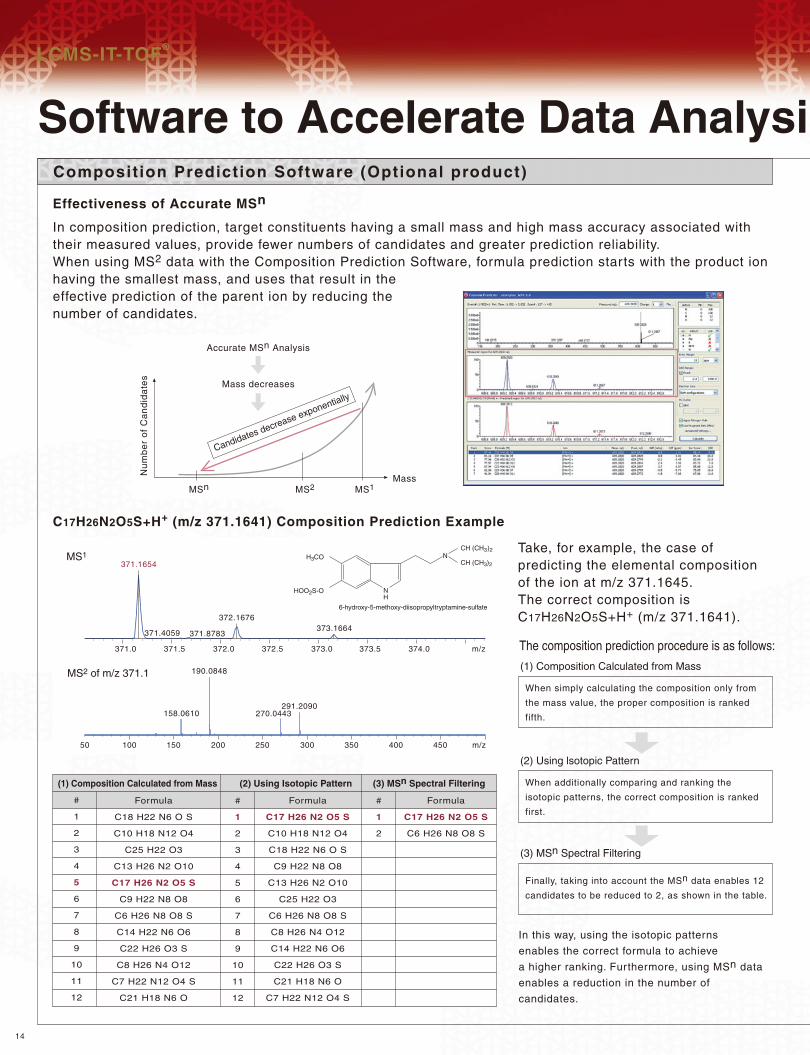
Effectiveness of Accurate MSn
C17H26N2O5S+H+ (m/z 371.1641) Composition Prediction Example
Nu
mb
er
of
Ca
nd
ida
tes
Accurate MSn Analysis
Mass decreases
Candidates decrease exponentially
MassMSn MS2 MS1
Take, for example, the case of predicting the elemental composition of the ion at m/z 371.1645. The correct composition is C17H26N2O5S+H+ (m/z 371.1641).
Formula
C18 H22 N6 O S
C10 H18 N12 O4
C25 H22 O3
C13 H26 N2 O10
C17 H26 N2 O5 S
C9 H22 N8 O8
C6 H26 N8 O8 S
C14 H22 N6 O6
C22 H26 O3 S
C8 H26 N4 O12
C7 H22 N12 O4 S
C21 H18 N6 O
Formula
C17 H26 N2 O5 S
C10 H18 N12 O4
C18 H22 N6 O S
C9 H22 N8 O8
C13 H26 N2 O10
C25 H22 O3
C6 H26 N8 O8 S
C8 H26 N4 O12
C14 H22 N6 O6
C22 H26 O3 S
C21 H18 N6 O
C7 H22 N12 O4 S
Formula
C17 H26 N2 O5 S
C6 H26 N8 O8 S
#
1
2
3
4
5
6
7
8
9
10
11
12
#
1
2
#
1
2
3
4
5
6
7
8
9
10
11
12
(1) Composition Calculated from Mass (2) Using Isotopic Pattern (3) MSn Spectral Filtering
371.0 371.5 372.0 372.5 373.0 373.5 374.0 m/z
371.1654
371.4059 371.8783
372.1676373.1664
100 150 200 250 300 350 400 450 m/z50
158.0610
190.0848
270.0443291.2090
MS1
MS2 of m/z 371.1
6-hydroxy-5-methoxy-diisopropyltryptamine-sulfate
H3CO NCH (CH3)2
CH (CH3)2
NH
HOO2S-O
In composition prediction, target constituents having a small mass and high mass accuracy associated with their measured values, provide fewer numbers of candidates and greater prediction reliability.When using MS2 data with the Composition Prediction Software, formula prediction starts with the product ion having the smallest mass, and uses that result in the effective prediction of the parent ion by reducing the number of candidates.
LCMS-IT-TOF®
The composition prediction procedure is as follows:
(1) Composition Calculated from Mass
When simply calculating the composition only from
the mass value, the proper composition is ranked
fifth.
(2) Using lsotopic Pattern
When additionally comparing and ranking the
isotopic patterns, the correct composition is ranked
first.
(3) MSn Spectral Filtering
Finally, taking into account the MSn data enables 12
candidates to be reduced to 2, as shown in the table.
In this way, using the isotopic patterns
enables the correct formula to achieve
a higher ranking. Furthermore, using MSn data
enables a reduction in the number of
candidates.
s
15
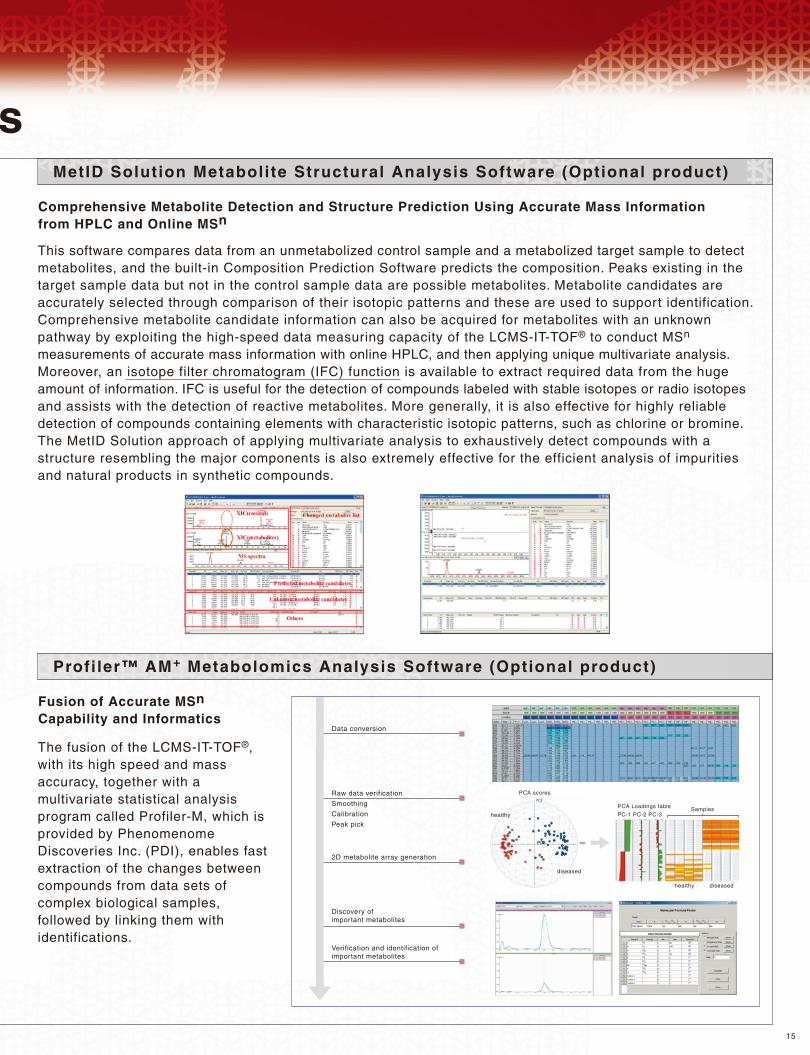
MetID Solution Metabolite Structural Analysis Software (Optional product)
This software compares data from an unmetabolized control sample and a metabolized target sample to detect metabolites, and the built-in Composition Prediction Software predicts the composition. Peaks existing in the target sample data but not in the control sample data are possible metabolites. Metabolite candidates are accurately selected through comparison of their isotopic patterns and these are used to support identification. Comprehensive metabolite candidate information can also be acquired for metabolites with an unknown pathway by exploiting the high-speed data measuring capacity of the LCMS-IT-TOF® to conduct MSn measurements of accurate mass information with online HPLC, and then applying unique multivariate analysis. Moreover, an isotope filter chromatogram (IFC) function is available to extract required data from the huge amount of information. IFC is useful for the detection of compounds labeled with stable isotopes or radio isotopes and assists with the detection of reactive metabolites. More generally, it is also effective for highly reliable detection of compounds containing elements with characteristic isotopic patterns, such as chlorine or bromine. The MetID Solution approach of applying multivariate analysis to exhaustively detect compounds with a structure resembling the major components is also extremely effective for the efficient analysis of impurities and natural products in synthetic compounds.
Comprehensive Metabolite Detection and Structure Prediction Using Accurate Mass Information from HPLC and Online MSn
Profi ler™ AM+ Metabolomics Analysis Software (Optional product)
The fusion of the LCMS-IT-TOF®, with its high speed and mass accuracy, together with a multivariate statistical analysis program called Profiler-M, which is provided by Phenomenome Discoveries Inc. (PDI), enables fast extraction of the changes between compounds from data sets of complex biological samples, followed by linking them with identifications.
Fusion of Accurate MSn Capability and Informatics
Raw data verification
Smoothing
Calibration
Peak pick
2D metabolite array generation
Discovery of important metabolites
Data conversion
Verification and identification of important metabolites
PCA Loadings table
PC-1 PC-2 PC-3
PCA scores
Sampleshealthy
healthy
diseased
diseased
The contents of this brochure are subject to change without notice.
SHIMADZU CORPORATION. International Marketing Division3. Kanda-Nishikicho 1-chome, Chiyoda-ku, Tokyo 101-8448, Japan Phone: 81(3)3219-5641 Fax. 81(3)3219-5710URL http://www.shimadzu.com
JQA-0376
Founded in 1875, Shimadzu Corporation, a leader in the development of advanced technologies, has a distinguished history of innovation built on the foundation of contributing to society through science and technology. We maintain a global network of sales, service, technical support and applications centers on six continents, and have established long-term relationships with a host of highly trained distributors located in over 100 countries. For information about Shimadzu, and to contact your local office, please visit our Web site at www.shimadzu.com
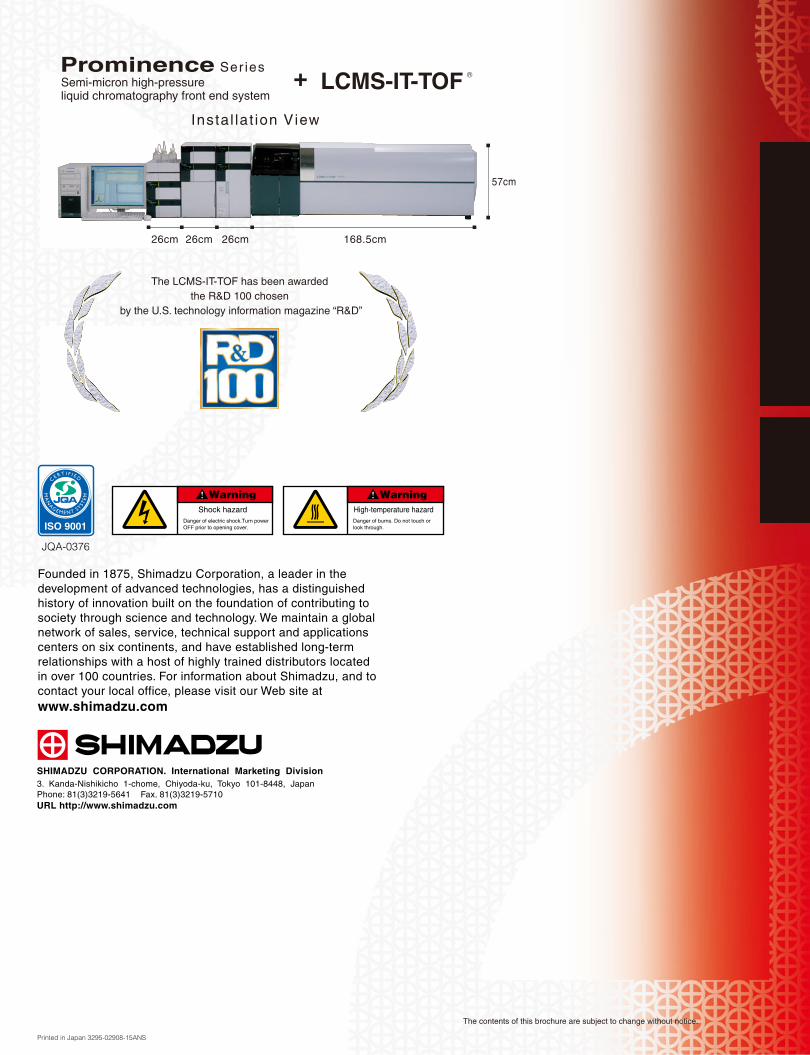
ShimadzuHigh-Speed Liquid Chromatograph Mass SpectrometerLCMS-IT-TOF®
Semi-micron high-pressure liquid chromatography front end system
Ser ies +
Instal lat ion View
26cm 26cm 26cm 168.5cm
57cm
LCMS-IT-TOF
The LCMS-IT-TOF has been awarded the R&D 100 chosen
by the U.S. technology information magazine “R&D”
Printed in Japan 3295-02908-15ANS
WarningHigh-temperature hazardDanger of burns. Do not touch or look through.
WarningShock hazard
Danger of electric shock.Turn power OFF prior to opening cover.