Quantitative Analysis of Bleomycin in Rat Plasma by LC-MS/MS
LC-MS/MS Quantitative Analysis of the Vitamin K’s and their Metabolites in Serum for Research Use
AuthorsRory M Doyle and Alexander CherkasskyThermo Fisher Scienti� c, Somerset, New Jersey, USA
POSTER NOTE 64920
ABSTRACT Purpose: An LC-MS/MS analytical method was developed and verified for the quantitation of the Vitamin K’s in serum for research use. Simple sample preparation techniques including protein crash and liquid-liquid extraction were evaluated. A Thermo ScientificTM TSQ Endura triple quadrupole mass spectrometer in positive Electrospray mode with a Thermo ScientificTM DionexTM VanquishTM Horizon HPLC system was used.
Methods: 200 mL (PPX) and 500 mL (LLE) of serum were used for the analysis of the Vitamin K’s and their metabolites. Various columns were evaluated and a Thermo ScientificTM AccucoreTM PFP, 100 x 2.1 mm, 2.6 mm with 0.1% Formic Acid and 5mM Ammonium Formate in water and 0.1% Formic Acid in methanol mobile phases achieved baseline chromatographic separation in approximately 4 minutes run time. Quantitative analysis was performed using scheduled reactive monitoring (SRM) transition pairs for each Vitamin K and internal standard in positive mode and accuracy of the analytical method was verified using pooled reference samples.
Results: Good linearity and reproducibility were obtained across the dynamic range of the Vitamin K’s with a coefficient of determination R2>0.95 or better for all compounds in the various matrices. The limits of detection and quantitation were determined to range initially from 50 pg/ml to 1 ng/ml with very good reproducibility observed for all compounds.
INTRODUCTION The Vitamin K’s are a group of structurally similar fat soluble compounds that the body requires in order to maintain good physiological function. There are two natural forms - K1 and K2 of which K2 consists of a number of sub types that differ in the length of their carbon side chains and each has a significant influence on the body.
In this case, we evaluated various columns and solvent combinations as well as simple and easy sample preparation techniques in order to develop an LC-MS/MS analytical method that can demonstrate the chromatographic separation, detection and quantification of the Vitamin K’s and their metabolites in serum. The Vitamin K’s analyzed include Vitamin K1 (Phylloquinone), Vitamin K1-2,3-Epoxide, Vitamin K2-MK4 (Menaquinone-4), Vitamin K2-MK7 (Menaquinone-7), Vitamin K2-2,3-Epoxide and Vitamin K3 (Menadione). The sample preparation choices were kept simple and included protein crash and a one step liquid-liquid extraction. The methodologies were developed on a TSQ Endura triple quadrupole mass spectrometer in positive Electrospray ionization modes with a Vanquish Horizon HPLC system with a 4 minute analytical gradient.
MATERIALS AND METHODS
Standards The following analytical reference standards and Internal standards were obtained from -
Isosciences, Inc., King of Prussia, PA
Vitamin K1 (Phylloquinone): 1 mg Vitamin K1-D7: 1 mg Vitamin K1-2,3-Epoxide: 1 mg Vitamin K3 (Menadione): 1 mg Vitamin K3-D8: 1 mg
Cerilliant Corp., Round Rock, TX-
Vitamin K2-MK-4 (Menaquinone-4): 1mg Vitamin K2-MK-7 (Menaquinone-7): 1 mg
Sigma-Aldrich Corp. St Louis, MO-
Vitamin K2-2,3-Epoxide: 10 mg
Reagents The following Fisher Scientific™ acids, reagents and solvents were used HPLC grade Water Ethanol Methanol Hexane Ammonium Formate Formic Acid
Sample Preparation- Protein Crash • 200 mL of Serum/BSA mixture calibrators, controls and serum sample were added to 1.5 ml eppendorf tubes and
20 mL of Vitamin K ISTD at 1000 ng/mL were added to each tube and vortexed briefly • 400 mL of Acetonitrile was added to each tube and vortexed for 1 min prior to centrifugation for 10 minutes at
13000 rpm • The supernatant was transferred to an MS vial and capped. • All in-house calibrators were prepared in drug-free serum and bovine serum albumin mixture (Golden West
Biological, Inc, Temecula, CA)
Sample Preparation- Liquid-Liquid Extraction • 500 mL of Serum/BSA mixture calibrators, controls and serum samples were added to a test tube and 50 mL of
Vitamin K ISTD at 1000 ng/mL were added to each and vortexed briefly • 1.5 mL of Ethanol was added to each tube and vortexed for 1 min followed by 4 ml of Hexane and again vortexed
for 1 min. • The tubes were centrifugation for 10 minutes at 13000 rpm • The upper organic layer was transferred to a new test tube and dried down under nitrogen at room temperature • The extract was reconstituted in 200 mL of 1:3 water and methanol • The supernatant was transferred to an MS vial and capped.
The calibration curves ranged from 0.1 ng/mL to 1000 ng/mL and various pooled samples were used as control material.
Data Analysis The software used included for this method included the Thermo Scientific™ Xcalibur™ 3.1 SW, Thermo Scientific™ TSQ Endura Tune™ 2.1 SW, and Thermo Scientific™ Tracefinder™ 4.1 SW
Method
HPLC Conditions- Vanquish Horizon HPLC binary pump, well plate, thermostatted column compartment
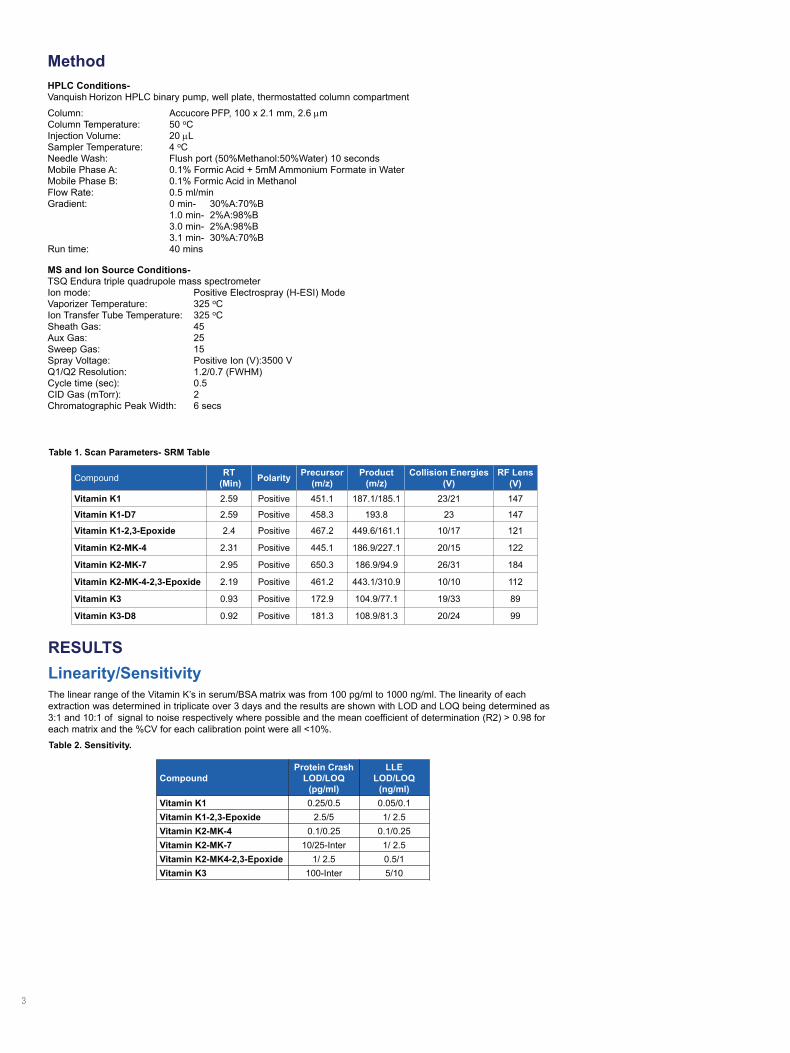
Column: Accucore PFP, 100 x 2.1 mm, 2.6 mm Column Temperature: 50 oC Injection Volume: 20 mL Sampler Temperature: 4 oC Needle Wash: Flush port (50%Methanol:50%Water) 10 seconds Mobile Phase A: 0.1% Formic Acid + 5mM Ammonium Formate in Water Mobile Phase B: 0.1% Formic Acid in Methanol Flow Rate: 0.5 ml/min Gradient: 0 min- 30%A:70%B 1.0 min- 2%A:98%B 3.0 min- 2%A:98%B 3.1 min- 30%A:70%B Run time: 40 mins
MS and Ion Source Conditions- TSQ Endura triple quadrupole mass spectrometer Ion mode: Positive Electrospray (H-ESI) Mode Vaporizer Temperature: 325 oC Ion Transfer Tube Temperature: 325 oC Sheath Gas: 45 Aux Gas: 25 Sweep Gas: 15 Spray Voltage: Positive Ion (V):3500 V Q1/Q2 Resolution: 1.2/0.7 (FWHM) Cycle time (sec): 0.5 CID Gas (mTorr): 2 Chromatographic Peak Width: 6 secs
Table 1. Scan Parameters- SRM Table
Compound Protein Crash
LOD/LOQ (pg/ml)
LLE LOD/LOQ
(ng/ml) Vitamin K1 0.25/0.5 0.05/0.1 Vitamin K1-2,3-Epoxide 2.5/5 1/ 2.5 Vitamin K2-MK-4 0.1/0.25 0.1/0.25 Vitamin K2-MK-7 10/25-Inter 1/ 2.5 Vitamin K2-MK4-2,3-Epoxide 1/ 2.5 0.5/1 Vitamin K3 100-Inter 5/10
Compound RT (Min) Polarity Precursor
(m/z) Product
(m/z) Collision Energies
(V) RF Lens
(V) Vitamin K1 2.59 Positive 451.1 187.1/185.1 23/21 147
Vitamin K1-D7 2.59 Positive 458.3 193.8 23 147
Vitamin K1-2,3-Epoxide 2.4 Positive 467.2 449.6/161.1 10/17 121
Vitamin K2-MK-4 2.31 Positive 445.1 186.9/227.1 20/15 122
Vitamin K2-MK-7 2.95 Positive 650.3 186.9/94.9 26/31 184
Vitamin K2-MK-4-2,3-Epoxide 2.19 Positive 461.2 443.1/310.9 10/10 112
Vitamin K3 0.93 Positive 172.9 104.9/77.1 19/33 89
Vitamin K3-D8 0.92 Positive 181.3 108.9/81.3 20/24 99
Table 2. Sensitivity.
RESULTS Linearity/Sensitivity The linear range of the Vitamin K’s in serum/BSA matrix was from 100 pg/ml to 1000 ng/ml. The linearity of each extraction was determined in triplicate over 3 days and the results are shown with LOD and LOQ being determined as 3:1 and 10:1 of signal to noise respectively where possible and the mean coefficient of determination (R2) > 0.98 for each matrix and the %CV for each calibration point were all <10%.
Rory M Doyle, Alexander Cherkassky*, Thermo Scientific, Inc, 265 Davidson Avenue, Somerset, New Jersey 08873
LC-MS/MS Quantitative Analysis of the Vitamin K’s and their Metabolites in Serum for Research Use
Accuracy The accuracy was determined by the analysis of pooled sample control material as the percentage deviation from the targeted mean and the results were <10% for all levels. The serum pooled control material concentrations were 25 ng/nl and 250 ng/ml. Therefore, the analytical method can achieve the research laboratory required accuracy for the analysis of the Vitamin K’s in serum.
Precision/Specificity The intra–assay precision (%CV) of the Vitamin K’s in serum were determined by extracting and quantifying three replicates of the pooled sample control material. The inter-assay precision was determined over 3 consecutive days and was found to have a %CV <10% for each Vitamin K within their respective linear range for the pooled serum sample control material respectively. Therefore, the analytical method can achieve the required precision for the analysis of the Vitamin K’s in serum. Due to the similarity between the Vitamin K’s and that it is present in all biological matrices, there were interferences and ion suppression from endogenous lipids which shown in the protein crash chromatogram. Vitamin K’s are very sensitive to light and the nitrogen must be passed through steel tubing to avoid loss of compounds.
CONCLUSIONS • Baseline separation of the Vitamin K’s with good LOD/LOQ was achieved in serum particularly by LLE
• Simple sample preparation achieved desirable LOD/LOQ to the relevant levels with further work to be carried out to fine tune these techniques to obtain more sensitive results and to remove the interferences and achieve better sensitivity while maintaining ease of use and low cost
• Good linearity of calibration curves with acceptable accuracy, precision and reproducibility in positive and negative mode was achieved <10% for %CV for each Vitamin K particularly by LLE within their linear range and the sample preparation techniques and analytical methodologies will be further verified and optimized
REFERENCES 1. A Validated HPLC Method for the Determination of Vitamin K in Human Serum – First Application in a Pharmacological Study The Open Clinical Chemistry Journal, 2011, 4, 17-27 Milka Maranova et al 2. Method for the Determination of Vitamin K Homologues in Human Plasma Using High-Performance Liquid Chromatography-Tandem Mass Spectrometry Anal. Chem., 2005, 77 (3), pp 757–763 Yoshitomo Suhara, et al
TRADEMARKS/LICENSING © 2017 Thermo Fisher Scientific Inc. All rights reserved. All trademarks are the property of Thermo Fisher Scientific and its subsidiaries. This information is not intended to encourage use of these products in any manner that might infringe the intellectual property rights of others.
For research use only. Not for use in diagnostic procedures.
PO64920EN
Figure 2: PPX Chromatograms, Curves and LOD
l
Figure 1: LLE Chromatograms, Curves and LOD
K3
K2-MK-4
K1
K2-MK-4-Epox
K1-Epox
K2-MK-7
G:\Data\Vitamin K-1-15-2017-LLE\50ngml 01/18/17 13:49:41 50ngml
RT: 0.00 - 3.44
0.0 0.5 1.0 1.5 2.0 2.5 3.0Time (min)
0
50
1000
50
1000
50
1000
50
100
Rel
ativ
e A
bund
ance 0
50
1000
50
1000
50
100 2.632.622.342.36 2.642.33
2.602.662.222.21 2.43 2.980.96 2.010.750.62 1.04 1.41 3.06 3.27
0.75 0.97
0.62 1.411.26
2.34
2.23 2.52 2.602.092.63
2.52 2.82 2.902.142.22
2.011.87 2.33 2.652.43
1.95 2.21 2.68 2.762.98
2.56 2.74 3.27
NL: 4.67E5TIC MS 50ngml
NL: 6.95E3TIC F: + c ESI SRM ms2 172.945 [76.999-77.001, 104.874-104.876, 144.928-144.930] MS 50ngml
NL: 4.30E5TIC F: + c ESI SRM ms2 445.138 [186.945-186.947, 227.070-227.072, 363.471-363.473] MS 50ngml
NL: 3.88E5TIC F: + c ESI SRM ms2 451.092 [184.914-184.916, 186.999-187.001, 196.820-196.822, 227.070-227.072] MS 50ngml
NL: 7.98E4TIC F: + c ESI SRM ms2 461.155 [310.985-310.987, 379.039-379.041, 443.110-443.112] MS 50ngml
NL: 2.60E4TIC F: + c ESI SRM ms2 467.192 [161.017-161.019, 307.150-307.152, 449.596-449.598] MS 50ngml
NL: 1.39E4TIC F: + c ESI SRM ms2 650.325 [94.985-94.987, 186.985-186.987, 464.707-464.709] MS 50ngml
*
G:\Data\...\50ngml_170118164338 01/18/17 16:43:38 50ngml
RT: 0.00 - 3.44
0.0 0.5 1.0 1.5 2.0 2.5 3.0Time (min)
0
50
1000
50
1000
50
1000
50
100
Rel
ativ
e A
bund
ance 0
50
1000
50
1000
50
1002.62
2.34 2.632.33 2.602.642.21 2.37 2.662.200.82 2.421.410.48 0.89 2.982.01 3.04
1.410.48
1.02
0.82
2.34
2.152.08 2.53 2.762.61
2.43 2.80 3.002.152.21
2.011.86 2.29 2.54 2.682.42
2.152.69 2.81
2.98
2.873.092.52 3.39
NL: 1.70E5TIC MS 50ngml_170118164338
NL: 9.68E3TIC F: + c ESI SRM ms2 172.945 [76.999-77.001, 104.874-104.876, 144.928-144.930] MS 50ngml_170118164338
NL: 1.40E5TIC F: + c ESI SRM ms2 445.138 [186.945-186.947, 227.070-227.072, 363.471-363.473] MS 50ngml_170118164338
NL: 9.18E4TIC F: + c ESI SRM ms2 451.092 [184.914-184.916, 186.999-187.001, 196.820-196.822, 227.070-227.072] MS 50ngml_170118164338
NL: 6.18E4TIC F: + c ESI SRM ms2 461.155 [310.985-310.987, 379.039-379.041, 443.110-443.112] MS 50ngml_170118164338
NL: 9.70E3TIC F: + c ESI SRM ms2 467.192 [161.017-161.019, 307.150-307.152, 449.596-449.598] MS 50ngml_170118164338
NL: 6.01E3TIC F: + c ESI SRM ms2 650.325 [94.985-94.987, 186.985-186.987, 464.707-464.709] MS 50ngml_170118164338
K3
K2-MK-4
K1
K2-MK-4-Epox
K1-Epox
K2-MK-7

2
ABSTRACT Purpose: An LC-MS/MS analytical method was developed and verified for the quantitation of the Vitamin K’s in serum for research use. Simple sample preparation techniques including protein crash and liquid-liquid extraction were evaluated. A Thermo ScientificTM TSQ Endura triple quadrupole mass spectrometer in positive Electrospray mode with a Thermo ScientificTM DionexTM VanquishTM Horizon HPLC system was used.
Methods: 200 mL (PPX) and 500 mL (LLE) of serum were used for the analysis of the Vitamin K’s and their metabolites. Various columns were evaluated and a Thermo ScientificTM AccucoreTM PFP, 100 x 2.1 mm, 2.6 mm with 0.1% Formic Acid and 5mM Ammonium Formate in water and 0.1% Formic Acid in methanol mobile phases achieved baseline chromatographic separation in approximately 4 minutes run time. Quantitative analysis was performed using scheduled reactive monitoring (SRM) transition pairs for each Vitamin K and internal standard in positive mode and accuracy of the analytical method was verified using pooled reference samples.
Results: Good linearity and reproducibility were obtained across the dynamic range of the Vitamin K’s with a coefficient of determination R2>0.95 or better for all compounds in the various matrices. The limits of detection and quantitation were determined to range initially from 50 pg/ml to 1 ng/ml with very good reproducibility observed for all compounds.
INTRODUCTION The Vitamin K’s are a group of structurally similar fat soluble compounds that the body requires in order to maintain good physiological function. There are two natural forms - K1 and K2 of which K2 consists of a number of sub types that differ in the length of their carbon side chains and each has a significant influence on the body.
In this case, we evaluated various columns and solvent combinations as well as simple and easy sample preparation techniques in order to develop an LC-MS/MS analytical method that can demonstrate the chromatographic separation, detection and quantification of the Vitamin K’s and their metabolites in serum. The Vitamin K’s analyzed include Vitamin K1 (Phylloquinone), Vitamin K1-2,3-Epoxide, Vitamin K2-MK4 (Menaquinone-4), Vitamin K2-MK7 (Menaquinone-7), Vitamin K2-2,3-Epoxide and Vitamin K3 (Menadione). The sample preparation choices were kept simple and included protein crash and a one step liquid-liquid extraction. The methodologies were developed on a TSQ Endura triple quadrupole mass spectrometer in positive Electrospray ionization modes with a Vanquish Horizon HPLC system with a 4 minute analytical gradient.
MATERIALS AND METHODS
Standards The following analytical reference standards and Internal standards were obtained from -
Isosciences, Inc., King of Prussia, PA
Vitamin K1 (Phylloquinone): 1 mg Vitamin K1-D7: 1 mg Vitamin K1-2,3-Epoxide: 1 mg Vitamin K3 (Menadione): 1 mg Vitamin K3-D8: 1 mg
Cerilliant Corp., Round Rock, TX-
Vitamin K2-MK-4 (Menaquinone-4): 1mg Vitamin K2-MK-7 (Menaquinone-7): 1 mg
Sigma-Aldrich Corp. St Louis, MO-
Vitamin K2-2,3-Epoxide: 10 mg
Reagents The following Fisher Scientific™ acids, reagents and solvents were used HPLC grade Water Ethanol Methanol Hexane Ammonium Formate Formic Acid
Sample Preparation- Protein Crash • 200 mL of Serum/BSA mixture calibrators, controls and serum sample were added to 1.5 ml eppendorf tubes and
20 mL of Vitamin K ISTD at 1000 ng/mL were added to each tube and vortexed briefly • 400 mL of Acetonitrile was added to each tube and vortexed for 1 min prior to centrifugation for 10 minutes at
13000 rpm • The supernatant was transferred to an MS vial and capped. • All in-house calibrators were prepared in drug-free serum and bovine serum albumin mixture (Golden West
Biological, Inc, Temecula, CA)
Sample Preparation- Liquid-Liquid Extraction • 500 mL of Serum/BSA mixture calibrators, controls and serum samples were added to a test tube and 50 mL of
Vitamin K ISTD at 1000 ng/mL were added to each and vortexed briefly • 1.5 mL of Ethanol was added to each tube and vortexed for 1 min followed by 4 ml of Hexane and again vortexed
for 1 min. • The tubes were centrifugation for 10 minutes at 13000 rpm • The upper organic layer was transferred to a new test tube and dried down under nitrogen at room temperature • The extract was reconstituted in 200 mL of 1:3 water and methanol • The supernatant was transferred to an MS vial and capped.
The calibration curves ranged from 0.1 ng/mL to 1000 ng/mL and various pooled samples were used as control material.
Data Analysis The software used included for this method included the Thermo Scientific™ Xcalibur™ 3.1 SW, Thermo Scientific™ TSQ Endura Tune™ 2.1 SW, and Thermo Scientific™ Tracefinder™ 4.1 SW
Method
HPLC Conditions- Vanquish Horizon HPLC binary pump, well plate, thermostatted column compartment
Column: Accucore PFP, 100 x 2.1 mm, 2.6 mm Column Temperature: 50 oC Injection Volume: 20 mL Sampler Temperature: 4 oC Needle Wash: Flush port (50%Methanol:50%Water) 10 seconds Mobile Phase A: 0.1% Formic Acid + 5mM Ammonium Formate in Water Mobile Phase B: 0.1% Formic Acid in Methanol Flow Rate: 0.5 ml/min Gradient: 0 min- 30%A:70%B 1.0 min- 2%A:98%B 3.0 min- 2%A:98%B 3.1 min- 30%A:70%B Run time: 40 mins
MS and Ion Source Conditions- TSQ Endura triple quadrupole mass spectrometer Ion mode: Positive Electrospray (H-ESI) Mode Vaporizer Temperature: 325 oC Ion Transfer Tube Temperature: 325 oC Sheath Gas: 45 Aux Gas: 25 Sweep Gas: 15 Spray Voltage: Positive Ion (V):3500 V Q1/Q2 Resolution: 1.2/0.7 (FWHM) Cycle time (sec): 0.5 CID Gas (mTorr): 2 Chromatographic Peak Width: 6 secs
Table 1. Scan Parameters- SRM Table
Compound Protein Crash
LOD/LOQ (pg/ml)
LLE LOD/LOQ
(ng/ml) Vitamin K1 0.25/0.5 0.05/0.1 Vitamin K1-2,3-Epoxide 2.5/5 1/ 2.5 Vitamin K2-MK-4 0.1/0.25 0.1/0.25 Vitamin K2-MK-7 10/25-Inter 1/ 2.5 Vitamin K2-MK4-2,3-Epoxide 1/ 2.5 0.5/1 Vitamin K3 100-Inter 5/10
Compound RT (Min) Polarity Precursor
(m/z) Product
(m/z) Collision Energies
(V) RF Lens
(V) Vitamin K1 2.59 Positive 451.1 187.1/185.1 23/21 147
Vitamin K1-D7 2.59 Positive 458.3 193.8 23 147
Vitamin K1-2,3-Epoxide 2.4 Positive 467.2 449.6/161.1 10/17 121
Vitamin K2-MK-4 2.31 Positive 445.1 186.9/227.1 20/15 122
Vitamin K2-MK-7 2.95 Positive 650.3 186.9/94.9 26/31 184
Vitamin K2-MK-4-2,3-Epoxide 2.19 Positive 461.2 443.1/310.9 10/10 112
Vitamin K3 0.93 Positive 172.9 104.9/77.1 19/33 89
Vitamin K3-D8 0.92 Positive 181.3 108.9/81.3 20/24 99
Table 2. Sensitivity.
RESULTS Linearity/Sensitivity The linear range of the Vitamin K’s in serum/BSA matrix was from 100 pg/ml to 1000 ng/ml. The linearity of each extraction was determined in triplicate over 3 days and the results are shown with LOD and LOQ being determined as 3:1 and 10:1 of signal to noise respectively where possible and the mean coefficient of determination (R2) > 0.98 for each matrix and the %CV for each calibration point were all <10%.
Rory M Doyle, Alexander Cherkassky*, Thermo Scientific, Inc, 265 Davidson Avenue, Somerset, New Jersey 08873
LC-MS/MS Quantitative Analysis of the Vitamin K’s and their Metabolites in Serum for Research Use
Accuracy The accuracy was determined by the analysis of pooled sample control material as the percentage deviation from the targeted mean and the results were <10% for all levels. The serum pooled control material concentrations were 25 ng/nl and 250 ng/ml. Therefore, the analytical method can achieve the research laboratory required accuracy for the analysis of the Vitamin K’s in serum.
Precision/Specificity The intra–assay precision (%CV) of the Vitamin K’s in serum were determined by extracting and quantifying three replicates of the pooled sample control material. The inter-assay precision was determined over 3 consecutive days and was found to have a %CV <10% for each Vitamin K within their respective linear range for the pooled serum sample control material respectively. Therefore, the analytical method can achieve the required precision for the analysis of the Vitamin K’s in serum. Due to the similarity between the Vitamin K’s and that it is present in all biological matrices, there were interferences and ion suppression from endogenous lipids which shown in the protein crash chromatogram. Vitamin K’s are very sensitive to light and the nitrogen must be passed through steel tubing to avoid loss of compounds.
CONCLUSIONS • Baseline separation of the Vitamin K’s with good LOD/LOQ was achieved in serum particularly by LLE
• Simple sample preparation achieved desirable LOD/LOQ to the relevant levels with further work to be carried out to fine tune these techniques to obtain more sensitive results and to remove the interferences and achieve better sensitivity while maintaining ease of use and low cost
• Good linearity of calibration curves with acceptable accuracy, precision and reproducibility in positive and negative mode was achieved <10% for %CV for each Vitamin K particularly by LLE within their linear range and the sample preparation techniques and analytical methodologies will be further verified and optimized
REFERENCES 1. A Validated HPLC Method for the Determination of Vitamin K in Human Serum – First Application in a Pharmacological Study The Open Clinical Chemistry Journal, 2011, 4, 17-27 Milka Maranova et al 2. Method for the Determination of Vitamin K Homologues in Human Plasma Using High-Performance Liquid Chromatography-Tandem Mass Spectrometry Anal. Chem., 2005, 77 (3), pp 757–763 Yoshitomo Suhara, et al
TRADEMARKS/LICENSING © 2017 Thermo Fisher Scientific Inc. All rights reserved. All trademarks are the property of Thermo Fisher Scientific and its subsidiaries. This information is not intended to encourage use of these products in any manner that might infringe the intellectual property rights of others.
For research use only. Not for use in diagnostic procedures.
PO64920EN
Figure 2: PPX Chromatograms, Curves and LOD
l
Figure 1: LLE Chromatograms, Curves and LOD
K3
K2-MK-4
K1
K2-MK-4-Epox
K1-Epox
K2-MK-7
G:\Data\Vitamin K-1-15-2017-LLE\50ngml 01/18/17 13:49:41 50ngml
RT: 0.00 - 3.44
0.0 0.5 1.0 1.5 2.0 2.5 3.0Time (min)
0
50
1000
50
1000
50
1000
50
100
Rel
ativ
e A
bund
ance 0
50
1000
50
1000
50
100 2.632.622.342.36 2.642.33
2.602.662.222.21 2.43 2.980.96 2.010.750.62 1.04 1.41 3.06 3.27
0.75 0.97
0.62 1.411.26
2.34
2.23 2.52 2.602.092.63
2.52 2.82 2.902.142.22
2.011.87 2.33 2.652.43
1.95 2.21 2.68 2.762.98
2.56 2.74 3.27
NL: 4.67E5TIC MS 50ngml
NL: 6.95E3TIC F: + c ESI SRM ms2 172.945 [76.999-77.001, 104.874-104.876, 144.928-144.930] MS 50ngml
NL: 4.30E5TIC F: + c ESI SRM ms2 445.138 [186.945-186.947, 227.070-227.072, 363.471-363.473] MS 50ngml
NL: 3.88E5TIC F: + c ESI SRM ms2 451.092 [184.914-184.916, 186.999-187.001, 196.820-196.822, 227.070-227.072] MS 50ngml
NL: 7.98E4TIC F: + c ESI SRM ms2 461.155 [310.985-310.987, 379.039-379.041, 443.110-443.112] MS 50ngml
NL: 2.60E4TIC F: + c ESI SRM ms2 467.192 [161.017-161.019, 307.150-307.152, 449.596-449.598] MS 50ngml
NL: 1.39E4TIC F: + c ESI SRM ms2 650.325 [94.985-94.987, 186.985-186.987, 464.707-464.709] MS 50ngml
*
G:\Data\...\50ngml_170118164338 01/18/17 16:43:38 50ngml
RT: 0.00 - 3.44
0.0 0.5 1.0 1.5 2.0 2.5 3.0Time (min)
0
50
1000
50
1000
50
1000
50
100
Rel
ativ
e A
bund
ance 0
50
1000
50
1000
50
1002.62
2.34 2.632.33 2.602.642.21 2.37 2.662.200.82 2.421.410.48 0.89 2.982.01 3.04
1.410.48
1.02
0.82
2.34
2.152.08 2.53 2.762.61
2.43 2.80 3.002.152.21
2.011.86 2.29 2.54 2.682.42
2.152.69 2.81
2.98
2.873.092.52 3.39
NL: 1.70E5TIC MS 50ngml_170118164338
NL: 9.68E3TIC F: + c ESI SRM ms2 172.945 [76.999-77.001, 104.874-104.876, 144.928-144.930] MS 50ngml_170118164338
NL: 1.40E5TIC F: + c ESI SRM ms2 445.138 [186.945-186.947, 227.070-227.072, 363.471-363.473] MS 50ngml_170118164338
NL: 9.18E4TIC F: + c ESI SRM ms2 451.092 [184.914-184.916, 186.999-187.001, 196.820-196.822, 227.070-227.072] MS 50ngml_170118164338
NL: 6.18E4TIC F: + c ESI SRM ms2 461.155 [310.985-310.987, 379.039-379.041, 443.110-443.112] MS 50ngml_170118164338
NL: 9.70E3TIC F: + c ESI SRM ms2 467.192 [161.017-161.019, 307.150-307.152, 449.596-449.598] MS 50ngml_170118164338
NL: 6.01E3TIC F: + c ESI SRM ms2 650.325 [94.985-94.987, 186.985-186.987, 464.707-464.709] MS 50ngml_170118164338
K3
K2-MK-4
K1
K2-MK-4-Epox
K1-Epox
K2-MK-7
3
ABSTRACT Purpose: An LC-MS/MS analytical method was developed and verified for the quantitation of the Vitamin K’s in serum for research use. Simple sample preparation techniques including protein crash and liquid-liquid extraction were evaluated. A Thermo ScientificTM TSQ Endura triple quadrupole mass spectrometer in positive Electrospray mode with a Thermo ScientificTM DionexTM VanquishTM Horizon HPLC system was used.
Methods: 200 mL (PPX) and 500 mL (LLE) of serum were used for the analysis of the Vitamin K’s and their metabolites. Various columns were evaluated and a Thermo ScientificTM AccucoreTM PFP, 100 x 2.1 mm, 2.6 mm with 0.1% Formic Acid and 5mM Ammonium Formate in water and 0.1% Formic Acid in methanol mobile phases achieved baseline chromatographic separation in approximately 4 minutes run time. Quantitative analysis was performed using scheduled reactive monitoring (SRM) transition pairs for each Vitamin K and internal standard in positive mode and accuracy of the analytical method was verified using pooled reference samples.
Results: Good linearity and reproducibility were obtained across the dynamic range of the Vitamin K’s with a coefficient of determination R2>0.95 or better for all compounds in the various matrices. The limits of detection and quantitation were determined to range initially from 50 pg/ml to 1 ng/ml with very good reproducibility observed for all compounds.
INTRODUCTION The Vitamin K’s are a group of structurally similar fat soluble compounds that the body requires in order to maintain good physiological function. There are two natural forms - K1 and K2 of which K2 consists of a number of sub types that differ in the length of their carbon side chains and each has a significant influence on the body.
In this case, we evaluated various columns and solvent combinations as well as simple and easy sample preparation techniques in order to develop an LC-MS/MS analytical method that can demonstrate the chromatographic separation, detection and quantification of the Vitamin K’s and their metabolites in serum. The Vitamin K’s analyzed include Vitamin K1 (Phylloquinone), Vitamin K1-2,3-Epoxide, Vitamin K2-MK4 (Menaquinone-4), Vitamin K2-MK7 (Menaquinone-7), Vitamin K2-2,3-Epoxide and Vitamin K3 (Menadione). The sample preparation choices were kept simple and included protein crash and a one step liquid-liquid extraction. The methodologies were developed on a TSQ Endura triple quadrupole mass spectrometer in positive Electrospray ionization modes with a Vanquish Horizon HPLC system with a 4 minute analytical gradient.
MATERIALS AND METHODS
Standards The following analytical reference standards and Internal standards were obtained from -
Isosciences, Inc., King of Prussia, PA
Vitamin K1 (Phylloquinone): 1 mg Vitamin K1-D7: 1 mg Vitamin K1-2,3-Epoxide: 1 mg Vitamin K3 (Menadione): 1 mg Vitamin K3-D8: 1 mg
Cerilliant Corp., Round Rock, TX-
Vitamin K2-MK-4 (Menaquinone-4): 1mg Vitamin K2-MK-7 (Menaquinone-7): 1 mg
Sigma-Aldrich Corp. St Louis, MO-
Vitamin K2-2,3-Epoxide: 10 mg
Reagents The following Fisher Scientific™ acids, reagents and solvents were used HPLC grade Water Ethanol Methanol Hexane Ammonium Formate Formic Acid
Sample Preparation- Protein Crash • 200 mL of Serum/BSA mixture calibrators, controls and serum sample were added to 1.5 ml eppendorf tubes and
20 mL of Vitamin K ISTD at 1000 ng/mL were added to each tube and vortexed briefly • 400 mL of Acetonitrile was added to each tube and vortexed for 1 min prior to centrifugation for 10 minutes at
13000 rpm • The supernatant was transferred to an MS vial and capped. • All in-house calibrators were prepared in drug-free serum and bovine serum albumin mixture (Golden West
Biological, Inc, Temecula, CA)
Sample Preparation- Liquid-Liquid Extraction • 500 mL of Serum/BSA mixture calibrators, controls and serum samples were added to a test tube and 50 mL of
Vitamin K ISTD at 1000 ng/mL were added to each and vortexed briefly • 1.5 mL of Ethanol was added to each tube and vortexed for 1 min followed by 4 ml of Hexane and again vortexed
for 1 min. • The tubes were centrifugation for 10 minutes at 13000 rpm • The upper organic layer was transferred to a new test tube and dried down under nitrogen at room temperature • The extract was reconstituted in 200 mL of 1:3 water and methanol • The supernatant was transferred to an MS vial and capped.
The calibration curves ranged from 0.1 ng/mL to 1000 ng/mL and various pooled samples were used as control material.
Data Analysis The software used included for this method included the Thermo Scientific™ Xcalibur™ 3.1 SW, Thermo Scientific™ TSQ Endura Tune™ 2.1 SW, and Thermo Scientific™ Tracefinder™ 4.1 SW
Method
HPLC Conditions- Vanquish Horizon HPLC binary pump, well plate, thermostatted column compartment
Column: Accucore PFP, 100 x 2.1 mm, 2.6 mm Column Temperature: 50 oC Injection Volume: 20 mL Sampler Temperature: 4 oC Needle Wash: Flush port (50%Methanol:50%Water) 10 seconds Mobile Phase A: 0.1% Formic Acid + 5mM Ammonium Formate in Water Mobile Phase B: 0.1% Formic Acid in Methanol Flow Rate: 0.5 ml/min Gradient: 0 min- 30%A:70%B 1.0 min- 2%A:98%B 3.0 min- 2%A:98%B 3.1 min- 30%A:70%B Run time: 40 mins
MS and Ion Source Conditions- TSQ Endura triple quadrupole mass spectrometer Ion mode: Positive Electrospray (H-ESI) Mode Vaporizer Temperature: 325 oC Ion Transfer Tube Temperature: 325 oC Sheath Gas: 45 Aux Gas: 25 Sweep Gas: 15 Spray Voltage: Positive Ion (V):3500 V Q1/Q2 Resolution: 1.2/0.7 (FWHM) Cycle time (sec): 0.5 CID Gas (mTorr): 2 Chromatographic Peak Width: 6 secs
Table 1. Scan Parameters- SRM Table
Compound Protein Crash
LOD/LOQ (pg/ml)
LLE LOD/LOQ
(ng/ml) Vitamin K1 0.25/0.5 0.05/0.1 Vitamin K1-2,3-Epoxide 2.5/5 1/ 2.5 Vitamin K2-MK-4 0.1/0.25 0.1/0.25 Vitamin K2-MK-7 10/25-Inter 1/ 2.5 Vitamin K2-MK4-2,3-Epoxide 1/ 2.5 0.5/1 Vitamin K3 100-Inter 5/10
Compound RT (Min) Polarity Precursor
(m/z) Product
(m/z) Collision Energies
(V) RF Lens
(V) Vitamin K1 2.59 Positive 451.1 187.1/185.1 23/21 147
Vitamin K1-D7 2.59 Positive 458.3 193.8 23 147
Vitamin K1-2,3-Epoxide 2.4 Positive 467.2 449.6/161.1 10/17 121
Vitamin K2-MK-4 2.31 Positive 445.1 186.9/227.1 20/15 122
Vitamin K2-MK-7 2.95 Positive 650.3 186.9/94.9 26/31 184
Vitamin K2-MK-4-2,3-Epoxide 2.19 Positive 461.2 443.1/310.9 10/10 112
Vitamin K3 0.93 Positive 172.9 104.9/77.1 19/33 89
Vitamin K3-D8 0.92 Positive 181.3 108.9/81.3 20/24 99
Table 2. Sensitivity.
RESULTS Linearity/Sensitivity The linear range of the Vitamin K’s in serum/BSA matrix was from 100 pg/ml to 1000 ng/ml. The linearity of each extraction was determined in triplicate over 3 days and the results are shown with LOD and LOQ being determined as 3:1 and 10:1 of signal to noise respectively where possible and the mean coefficient of determination (R2) > 0.98 for each matrix and the %CV for each calibration point were all <10%.
Rory M Doyle, Alexander Cherkassky*, Thermo Scientific, Inc, 265 Davidson Avenue, Somerset, New Jersey 08873
LC-MS/MS Quantitative Analysis of the Vitamin K’s and their Metabolites in Serum for Research Use
Accuracy The accuracy was determined by the analysis of pooled sample control material as the percentage deviation from the targeted mean and the results were <10% for all levels. The serum pooled control material concentrations were 25 ng/nl and 250 ng/ml. Therefore, the analytical method can achieve the research laboratory required accuracy for the analysis of the Vitamin K’s in serum.
Precision/Specificity The intra–assay precision (%CV) of the Vitamin K’s in serum were determined by extracting and quantifying three replicates of the pooled sample control material. The inter-assay precision was determined over 3 consecutive days and was found to have a %CV <10% for each Vitamin K within their respective linear range for the pooled serum sample control material respectively. Therefore, the analytical method can achieve the required precision for the analysis of the Vitamin K’s in serum. Due to the similarity between the Vitamin K’s and that it is present in all biological matrices, there were interferences and ion suppression from endogenous lipids which shown in the protein crash chromatogram. Vitamin K’s are very sensitive to light and the nitrogen must be passed through steel tubing to avoid loss of compounds.
CONCLUSIONS • Baseline separation of the Vitamin K’s with good LOD/LOQ was achieved in serum particularly by LLE
• Simple sample preparation achieved desirable LOD/LOQ to the relevant levels with further work to be carried out to fine tune these techniques to obtain more sensitive results and to remove the interferences and achieve better sensitivity while maintaining ease of use and low cost
• Good linearity of calibration curves with acceptable accuracy, precision and reproducibility in positive and negative mode was achieved <10% for %CV for each Vitamin K particularly by LLE within their linear range and the sample preparation techniques and analytical methodologies will be further verified and optimized
REFERENCES 1. A Validated HPLC Method for the Determination of Vitamin K in Human Serum – First Application in a Pharmacological Study The Open Clinical Chemistry Journal, 2011, 4, 17-27 Milka Maranova et al 2. Method for the Determination of Vitamin K Homologues in Human Plasma Using High-Performance Liquid Chromatography-Tandem Mass Spectrometry Anal. Chem., 2005, 77 (3), pp 757–763 Yoshitomo Suhara, et al
TRADEMARKS/LICENSING © 2017 Thermo Fisher Scientific Inc. All rights reserved. All trademarks are the property of Thermo Fisher Scientific and its subsidiaries. This information is not intended to encourage use of these products in any manner that might infringe the intellectual property rights of others.
For research use only. Not for use in diagnostic procedures.
PO64920EN
Figure 2: PPX Chromatograms, Curves and LOD
l
Figure 1: LLE Chromatograms, Curves and LOD
K3
K2-MK-4
K1
K2-MK-4-Epox
K1-Epox
K2-MK-7
G:\Data\Vitamin K-1-15-2017-LLE\50ngml 01/18/17 13:49:41 50ngml
RT: 0.00 - 3.44
0.0 0.5 1.0 1.5 2.0 2.5 3.0Time (min)
0
50
1000
50
1000
50
1000
50
100
Rel
ativ
e A
bund
ance 0
50
1000
50
1000
50
100 2.632.622.342.36 2.642.33
2.602.662.222.21 2.43 2.980.96 2.010.750.62 1.04 1.41 3.06 3.27
0.75 0.97
0.62 1.411.26
2.34
2.23 2.52 2.602.092.63
2.52 2.82 2.902.142.22
2.011.87 2.33 2.652.43
1.95 2.21 2.68 2.762.98
2.56 2.74 3.27
NL: 4.67E5TIC MS 50ngml
NL: 6.95E3TIC F: + c ESI SRM ms2 172.945 [76.999-77.001, 104.874-104.876, 144.928-144.930] MS 50ngml
NL: 4.30E5TIC F: + c ESI SRM ms2 445.138 [186.945-186.947, 227.070-227.072, 363.471-363.473] MS 50ngml
NL: 3.88E5TIC F: + c ESI SRM ms2 451.092 [184.914-184.916, 186.999-187.001, 196.820-196.822, 227.070-227.072] MS 50ngml
NL: 7.98E4TIC F: + c ESI SRM ms2 461.155 [310.985-310.987, 379.039-379.041, 443.110-443.112] MS 50ngml
NL: 2.60E4TIC F: + c ESI SRM ms2 467.192 [161.017-161.019, 307.150-307.152, 449.596-449.598] MS 50ngml
NL: 1.39E4TIC F: + c ESI SRM ms2 650.325 [94.985-94.987, 186.985-186.987, 464.707-464.709] MS 50ngml
*
G:\Data\...\50ngml_170118164338 01/18/17 16:43:38 50ngml
RT: 0.00 - 3.44
0.0 0.5 1.0 1.5 2.0 2.5 3.0Time (min)
0
50
1000
50
1000
50
1000
50
100
Rel
ativ
e A
bund
ance 0
50
1000
50
1000
50
1002.62
2.34 2.632.33 2.602.642.21 2.37 2.662.200.82 2.421.410.48 0.89 2.982.01 3.04
1.410.48
1.02
0.82
2.34
2.152.08 2.53 2.762.61
2.43 2.80 3.002.152.21
2.011.86 2.29 2.54 2.682.42
2.152.69 2.81
2.98
2.873.092.52 3.39
NL: 1.70E5TIC MS 50ngml_170118164338
NL: 9.68E3TIC F: + c ESI SRM ms2 172.945 [76.999-77.001, 104.874-104.876, 144.928-144.930] MS 50ngml_170118164338
NL: 1.40E5TIC F: + c ESI SRM ms2 445.138 [186.945-186.947, 227.070-227.072, 363.471-363.473] MS 50ngml_170118164338
NL: 9.18E4TIC F: + c ESI SRM ms2 451.092 [184.914-184.916, 186.999-187.001, 196.820-196.822, 227.070-227.072] MS 50ngml_170118164338
NL: 6.18E4TIC F: + c ESI SRM ms2 461.155 [310.985-310.987, 379.039-379.041, 443.110-443.112] MS 50ngml_170118164338
NL: 9.70E3TIC F: + c ESI SRM ms2 467.192 [161.017-161.019, 307.150-307.152, 449.596-449.598] MS 50ngml_170118164338
NL: 6.01E3TIC F: + c ESI SRM ms2 650.325 [94.985-94.987, 186.985-186.987, 464.707-464.709] MS 50ngml_170118164338
K3
K2-MK-4
K1
K2-MK-4-Epox
K1-Epox
K2-MK-7

4
ABSTRACT Purpose: An LC-MS/MS analytical method was developed and verified for the quantitation of the Vitamin K’s in serum for research use. Simple sample preparation techniques including protein crash and liquid-liquid extraction were evaluated. A Thermo ScientificTM TSQ Endura triple quadrupole mass spectrometer in positive Electrospray mode with a Thermo ScientificTM DionexTM VanquishTM Horizon HPLC system was used.
Methods: 200 mL (PPX) and 500 mL (LLE) of serum were used for the analysis of the Vitamin K’s and their metabolites. Various columns were evaluated and a Thermo ScientificTM AccucoreTM PFP, 100 x 2.1 mm, 2.6 mm with 0.1% Formic Acid and 5mM Ammonium Formate in water and 0.1% Formic Acid in methanol mobile phases achieved baseline chromatographic separation in approximately 4 minutes run time. Quantitative analysis was performed using scheduled reactive monitoring (SRM) transition pairs for each Vitamin K and internal standard in positive mode and accuracy of the analytical method was verified using pooled reference samples.
Results: Good linearity and reproducibility were obtained across the dynamic range of the Vitamin K’s with a coefficient of determination R2>0.95 or better for all compounds in the various matrices. The limits of detection and quantitation were determined to range initially from 50 pg/ml to 1 ng/ml with very good reproducibility observed for all compounds.
INTRODUCTION The Vitamin K’s are a group of structurally similar fat soluble compounds that the body requires in order to maintain good physiological function. There are two natural forms - K1 and K2 of which K2 consists of a number of sub types that differ in the length of their carbon side chains and each has a significant influence on the body.
In this case, we evaluated various columns and solvent combinations as well as simple and easy sample preparation techniques in order to develop an LC-MS/MS analytical method that can demonstrate the chromatographic separation, detection and quantification of the Vitamin K’s and their metabolites in serum. The Vitamin K’s analyzed include Vitamin K1 (Phylloquinone), Vitamin K1-2,3-Epoxide, Vitamin K2-MK4 (Menaquinone-4), Vitamin K2-MK7 (Menaquinone-7), Vitamin K2-2,3-Epoxide and Vitamin K3 (Menadione). The sample preparation choices were kept simple and included protein crash and a one step liquid-liquid extraction. The methodologies were developed on a TSQ Endura triple quadrupole mass spectrometer in positive Electrospray ionization modes with a Vanquish Horizon HPLC system with a 4 minute analytical gradient.
MATERIALS AND METHODS
Standards The following analytical reference standards and Internal standards were obtained from -
Isosciences, Inc., King of Prussia, PA
Vitamin K1 (Phylloquinone): 1 mg Vitamin K1-D7: 1 mg Vitamin K1-2,3-Epoxide: 1 mg Vitamin K3 (Menadione): 1 mg Vitamin K3-D8: 1 mg
Cerilliant Corp., Round Rock, TX-
Vitamin K2-MK-4 (Menaquinone-4): 1mg Vitamin K2-MK-7 (Menaquinone-7): 1 mg
Sigma-Aldrich Corp. St Louis, MO-
Vitamin K2-2,3-Epoxide: 10 mg
Reagents The following Fisher Scientific™ acids, reagents and solvents were used HPLC grade Water Ethanol Methanol Hexane Ammonium Formate Formic Acid
Sample Preparation- Protein Crash • 200 mL of Serum/BSA mixture calibrators, controls and serum sample were added to 1.5 ml eppendorf tubes and
20 mL of Vitamin K ISTD at 1000 ng/mL were added to each tube and vortexed briefly • 400 mL of Acetonitrile was added to each tube and vortexed for 1 min prior to centrifugation for 10 minutes at
13000 rpm • The supernatant was transferred to an MS vial and capped. • All in-house calibrators were prepared in drug-free serum and bovine serum albumin mixture (Golden West
Biological, Inc, Temecula, CA)
Sample Preparation- Liquid-Liquid Extraction • 500 mL of Serum/BSA mixture calibrators, controls and serum samples were added to a test tube and 50 mL of
Vitamin K ISTD at 1000 ng/mL were added to each and vortexed briefly • 1.5 mL of Ethanol was added to each tube and vortexed for 1 min followed by 4 ml of Hexane and again vortexed
for 1 min. • The tubes were centrifugation for 10 minutes at 13000 rpm • The upper organic layer was transferred to a new test tube and dried down under nitrogen at room temperature • The extract was reconstituted in 200 mL of 1:3 water and methanol • The supernatant was transferred to an MS vial and capped.
The calibration curves ranged from 0.1 ng/mL to 1000 ng/mL and various pooled samples were used as control material.
Data Analysis The software used included for this method included the Thermo Scientific™ Xcalibur™ 3.1 SW, Thermo Scientific™ TSQ Endura Tune™ 2.1 SW, and Thermo Scientific™ Tracefinder™ 4.1 SW
Method
HPLC Conditions- Vanquish Horizon HPLC binary pump, well plate, thermostatted column compartment
Column: Accucore PFP, 100 x 2.1 mm, 2.6 mm Column Temperature: 50 oC Injection Volume: 20 mL Sampler Temperature: 4 oC Needle Wash: Flush port (50%Methanol:50%Water) 10 seconds Mobile Phase A: 0.1% Formic Acid + 5mM Ammonium Formate in Water Mobile Phase B: 0.1% Formic Acid in Methanol Flow Rate: 0.5 ml/min Gradient: 0 min- 30%A:70%B 1.0 min- 2%A:98%B 3.0 min- 2%A:98%B 3.1 min- 30%A:70%B Run time: 40 mins
MS and Ion Source Conditions- TSQ Endura triple quadrupole mass spectrometer Ion mode: Positive Electrospray (H-ESI) Mode Vaporizer Temperature: 325 oC Ion Transfer Tube Temperature: 325 oC Sheath Gas: 45 Aux Gas: 25 Sweep Gas: 15 Spray Voltage: Positive Ion (V):3500 V Q1/Q2 Resolution: 1.2/0.7 (FWHM) Cycle time (sec): 0.5 CID Gas (mTorr): 2 Chromatographic Peak Width: 6 secs
Table 1. Scan Parameters- SRM Table
Compound Protein Crash
LOD/LOQ (pg/ml)
LLE LOD/LOQ
(ng/ml) Vitamin K1 0.25/0.5 0.05/0.1 Vitamin K1-2,3-Epoxide 2.5/5 1/ 2.5 Vitamin K2-MK-4 0.1/0.25 0.1/0.25 Vitamin K2-MK-7 10/25-Inter 1/ 2.5 Vitamin K2-MK4-2,3-Epoxide 1/ 2.5 0.5/1 Vitamin K3 100-Inter 5/10
Compound RT (Min) Polarity Precursor
(m/z) Product
(m/z) Collision Energies
(V) RF Lens
(V) Vitamin K1 2.59 Positive 451.1 187.1/185.1 23/21 147
Vitamin K1-D7 2.59 Positive 458.3 193.8 23 147
Vitamin K1-2,3-Epoxide 2.4 Positive 467.2 449.6/161.1 10/17 121
Vitamin K2-MK-4 2.31 Positive 445.1 186.9/227.1 20/15 122
Vitamin K2-MK-7 2.95 Positive 650.3 186.9/94.9 26/31 184
Vitamin K2-MK-4-2,3-Epoxide 2.19 Positive 461.2 443.1/310.9 10/10 112
Vitamin K3 0.93 Positive 172.9 104.9/77.1 19/33 89
Vitamin K3-D8 0.92 Positive 181.3 108.9/81.3 20/24 99
Table 2. Sensitivity.
RESULTS Linearity/Sensitivity The linear range of the Vitamin K’s in serum/BSA matrix was from 100 pg/ml to 1000 ng/ml. The linearity of each extraction was determined in triplicate over 3 days and the results are shown with LOD and LOQ being determined as 3:1 and 10:1 of signal to noise respectively where possible and the mean coefficient of determination (R2) > 0.98 for each matrix and the %CV for each calibration point were all <10%.
Rory M Doyle, Alexander Cherkassky*, Thermo Scientific, Inc, 265 Davidson Avenue, Somerset, New Jersey 08873
LC-MS/MS Quantitative Analysis of the Vitamin K’s and their Metabolites in Serum for Research Use
Accuracy The accuracy was determined by the analysis of pooled sample control material as the percentage deviation from the targeted mean and the results were <10% for all levels. The serum pooled control material concentrations were 25 ng/nl and 250 ng/ml. Therefore, the analytical method can achieve the research laboratory required accuracy for the analysis of the Vitamin K’s in serum.
Precision/Specificity The intra–assay precision (%CV) of the Vitamin K’s in serum were determined by extracting and quantifying three replicates of the pooled sample control material. The inter-assay precision was determined over 3 consecutive days and was found to have a %CV <10% for each Vitamin K within their respective linear range for the pooled serum sample control material respectively. Therefore, the analytical method can achieve the required precision for the analysis of the Vitamin K’s in serum. Due to the similarity between the Vitamin K’s and that it is present in all biological matrices, there were interferences and ion suppression from endogenous lipids which shown in the protein crash chromatogram. Vitamin K’s are very sensitive to light and the nitrogen must be passed through steel tubing to avoid loss of compounds.
CONCLUSIONS • Baseline separation of the Vitamin K’s with good LOD/LOQ was achieved in serum particularly by LLE
• Simple sample preparation achieved desirable LOD/LOQ to the relevant levels with further work to be carried out to fine tune these techniques to obtain more sensitive results and to remove the interferences and achieve better sensitivity while maintaining ease of use and low cost
• Good linearity of calibration curves with acceptable accuracy, precision and reproducibility in positive and negative mode was achieved <10% for %CV for each Vitamin K particularly by LLE within their linear range and the sample preparation techniques and analytical methodologies will be further verified and optimized
REFERENCES 1. A Validated HPLC Method for the Determination of Vitamin K in Human Serum – First Application in a Pharmacological Study The Open Clinical Chemistry Journal, 2011, 4, 17-27 Milka Maranova et al 2. Method for the Determination of Vitamin K Homologues in Human Plasma Using High-Performance Liquid Chromatography-Tandem Mass Spectrometry Anal. Chem., 2005, 77 (3), pp 757–763 Yoshitomo Suhara, et al
TRADEMARKS/LICENSING © 2017 Thermo Fisher Scientific Inc. All rights reserved. All trademarks are the property of Thermo Fisher Scientific and its subsidiaries. This information is not intended to encourage use of these products in any manner that might infringe the intellectual property rights of others.
For research use only. Not for use in diagnostic procedures.
PO64920EN
Figure 2: PPX Chromatograms, Curves and LOD
l
Figure 1: LLE Chromatograms, Curves and LOD
K3
K2-MK-4
K1
K2-MK-4-Epox
K1-Epox
K2-MK-7
G:\Data\Vitamin K-1-15-2017-LLE\50ngml 01/18/17 13:49:41 50ngml
RT: 0.00 - 3.44
0.0 0.5 1.0 1.5 2.0 2.5 3.0Time (min)
0
50
1000
50
1000
50
1000
50
100
Rel
ativ
e A
bund
ance 0
50
1000
50
1000
50
100 2.632.622.342.36 2.642.33
2.602.662.222.21 2.43 2.980.96 2.010.750.62 1.04 1.41 3.06 3.27
0.75 0.97
0.62 1.411.26
2.34
2.23 2.52 2.602.092.63
2.52 2.82 2.902.142.22
2.011.87 2.33 2.652.43
1.95 2.21 2.68 2.762.98
2.56 2.74 3.27
NL: 4.67E5TIC MS 50ngml
NL: 6.95E3TIC F: + c ESI SRM ms2 172.945 [76.999-77.001, 104.874-104.876, 144.928-144.930] MS 50ngml
NL: 4.30E5TIC F: + c ESI SRM ms2 445.138 [186.945-186.947, 227.070-227.072, 363.471-363.473] MS 50ngml
NL: 3.88E5TIC F: + c ESI SRM ms2 451.092 [184.914-184.916, 186.999-187.001, 196.820-196.822, 227.070-227.072] MS 50ngml
NL: 7.98E4TIC F: + c ESI SRM ms2 461.155 [310.985-310.987, 379.039-379.041, 443.110-443.112] MS 50ngml
NL: 2.60E4TIC F: + c ESI SRM ms2 467.192 [161.017-161.019, 307.150-307.152, 449.596-449.598] MS 50ngml
NL: 1.39E4TIC F: + c ESI SRM ms2 650.325 [94.985-94.987, 186.985-186.987, 464.707-464.709] MS 50ngml
*
G:\Data\...\50ngml_170118164338 01/18/17 16:43:38 50ngml
RT: 0.00 - 3.44
0.0 0.5 1.0 1.5 2.0 2.5 3.0Time (min)
0
50
1000
50
1000
50
1000
50
100
Rel
ativ
e A
bund
ance 0
50
1000
50
1000
50
1002.62
2.34 2.632.33 2.602.642.21 2.37 2.662.200.82 2.421.410.48 0.89 2.982.01 3.04
1.410.48
1.02
0.82
2.34
2.152.08 2.53 2.762.61
2.43 2.80 3.002.152.21
2.011.86 2.29 2.54 2.682.42
2.152.69 2.81
2.98
2.873.092.52 3.39
NL: 1.70E5TIC MS 50ngml_170118164338
NL: 9.68E3TIC F: + c ESI SRM ms2 172.945 [76.999-77.001, 104.874-104.876, 144.928-144.930] MS 50ngml_170118164338
NL: 1.40E5TIC F: + c ESI SRM ms2 445.138 [186.945-186.947, 227.070-227.072, 363.471-363.473] MS 50ngml_170118164338
NL: 9.18E4TIC F: + c ESI SRM ms2 451.092 [184.914-184.916, 186.999-187.001, 196.820-196.822, 227.070-227.072] MS 50ngml_170118164338
NL: 6.18E4TIC F: + c ESI SRM ms2 461.155 [310.985-310.987, 379.039-379.041, 443.110-443.112] MS 50ngml_170118164338
NL: 9.70E3TIC F: + c ESI SRM ms2 467.192 [161.017-161.019, 307.150-307.152, 449.596-449.598] MS 50ngml_170118164338
NL: 6.01E3TIC F: + c ESI SRM ms2 650.325 [94.985-94.987, 186.985-186.987, 464.707-464.709] MS 50ngml_170118164338
K3
K2-MK-4
K1
K2-MK-4-Epox
K1-Epox
K2-MK-7

5
ABSTRACT Purpose: An LC-MS/MS analytical method was developed and verified for the quantitation of the Vitamin K’s in serum for research use. Simple sample preparation techniques including protein crash and liquid-liquid extraction were evaluated. A Thermo ScientificTM TSQ Endura triple quadrupole mass spectrometer in positive Electrospray mode with a Thermo ScientificTM DionexTM VanquishTM Horizon HPLC system was used.
Methods: 200 mL (PPX) and 500 mL (LLE) of serum were used for the analysis of the Vitamin K’s and their metabolites. Various columns were evaluated and a Thermo ScientificTM AccucoreTM PFP, 100 x 2.1 mm, 2.6 mm with 0.1% Formic Acid and 5mM Ammonium Formate in water and 0.1% Formic Acid in methanol mobile phases achieved baseline chromatographic separation in approximately 4 minutes run time. Quantitative analysis was performed using scheduled reactive monitoring (SRM) transition pairs for each Vitamin K and internal standard in positive mode and accuracy of the analytical method was verified using pooled reference samples.
Results: Good linearity and reproducibility were obtained across the dynamic range of the Vitamin K’s with a coefficient of determination R2>0.95 or better for all compounds in the various matrices. The limits of detection and quantitation were determined to range initially from 50 pg/ml to 1 ng/ml with very good reproducibility observed for all compounds.
INTRODUCTION The Vitamin K’s are a group of structurally similar fat soluble compounds that the body requires in order to maintain good physiological function. There are two natural forms - K1 and K2 of which K2 consists of a number of sub types that differ in the length of their carbon side chains and each has a significant influence on the body.
In this case, we evaluated various columns and solvent combinations as well as simple and easy sample preparation techniques in order to develop an LC-MS/MS analytical method that can demonstrate the chromatographic separation, detection and quantification of the Vitamin K’s and their metabolites in serum. The Vitamin K’s analyzed include Vitamin K1 (Phylloquinone), Vitamin K1-2,3-Epoxide, Vitamin K2-MK4 (Menaquinone-4), Vitamin K2-MK7 (Menaquinone-7), Vitamin K2-2,3-Epoxide and Vitamin K3 (Menadione). The sample preparation choices were kept simple and included protein crash and a one step liquid-liquid extraction. The methodologies were developed on a TSQ Endura triple quadrupole mass spectrometer in positive Electrospray ionization modes with a Vanquish Horizon HPLC system with a 4 minute analytical gradient.
MATERIALS AND METHODS
Standards The following analytical reference standards and Internal standards were obtained from -
Isosciences, Inc., King of Prussia, PA
Vitamin K1 (Phylloquinone): 1 mg Vitamin K1-D7: 1 mg Vitamin K1-2,3-Epoxide: 1 mg Vitamin K3 (Menadione): 1 mg Vitamin K3-D8: 1 mg
Cerilliant Corp., Round Rock, TX-
Vitamin K2-MK-4 (Menaquinone-4): 1mg Vitamin K2-MK-7 (Menaquinone-7): 1 mg
Sigma-Aldrich Corp. St Louis, MO-
Vitamin K2-2,3-Epoxide: 10 mg
Reagents The following Fisher Scientific™ acids, reagents and solvents were used HPLC grade Water Ethanol Methanol Hexane Ammonium Formate Formic Acid
Sample Preparation- Protein Crash • 200 mL of Serum/BSA mixture calibrators, controls and serum sample were added to 1.5 ml eppendorf tubes and
20 mL of Vitamin K ISTD at 1000 ng/mL were added to each tube and vortexed briefly • 400 mL of Acetonitrile was added to each tube and vortexed for 1 min prior to centrifugation for 10 minutes at
13000 rpm • The supernatant was transferred to an MS vial and capped. • All in-house calibrators were prepared in drug-free serum and bovine serum albumin mixture (Golden West
Biological, Inc, Temecula, CA)
Sample Preparation- Liquid-Liquid Extraction • 500 mL of Serum/BSA mixture calibrators, controls and serum samples were added to a test tube and 50 mL of
Vitamin K ISTD at 1000 ng/mL were added to each and vortexed briefly • 1.5 mL of Ethanol was added to each tube and vortexed for 1 min followed by 4 ml of Hexane and again vortexed
for 1 min. • The tubes were centrifugation for 10 minutes at 13000 rpm • The upper organic layer was transferred to a new test tube and dried down under nitrogen at room temperature • The extract was reconstituted in 200 mL of 1:3 water and methanol • The supernatant was transferred to an MS vial and capped.
The calibration curves ranged from 0.1 ng/mL to 1000 ng/mL and various pooled samples were used as control material.
Data Analysis The software used included for this method included the Thermo Scientific™ Xcalibur™ 3.1 SW, Thermo Scientific™ TSQ Endura Tune™ 2.1 SW, and Thermo Scientific™ Tracefinder™ 4.1 SW
Method
HPLC Conditions- Vanquish Horizon HPLC binary pump, well plate, thermostatted column compartment
Column: Accucore PFP, 100 x 2.1 mm, 2.6 mm Column Temperature: 50 oC Injection Volume: 20 mL Sampler Temperature: 4 oC Needle Wash: Flush port (50%Methanol:50%Water) 10 seconds Mobile Phase A: 0.1% Formic Acid + 5mM Ammonium Formate in Water Mobile Phase B: 0.1% Formic Acid in Methanol Flow Rate: 0.5 ml/min Gradient: 0 min- 30%A:70%B 1.0 min- 2%A:98%B 3.0 min- 2%A:98%B 3.1 min- 30%A:70%B Run time: 40 mins
MS and Ion Source Conditions- TSQ Endura triple quadrupole mass spectrometer Ion mode: Positive Electrospray (H-ESI) Mode Vaporizer Temperature: 325 oC Ion Transfer Tube Temperature: 325 oC Sheath Gas: 45 Aux Gas: 25 Sweep Gas: 15 Spray Voltage: Positive Ion (V):3500 V Q1/Q2 Resolution: 1.2/0.7 (FWHM) Cycle time (sec): 0.5 CID Gas (mTorr): 2 Chromatographic Peak Width: 6 secs
Table 1. Scan Parameters- SRM Table
Compound Protein Crash
LOD/LOQ (pg/ml)
LLE LOD/LOQ
(ng/ml) Vitamin K1 0.25/0.5 0.05/0.1 Vitamin K1-2,3-Epoxide 2.5/5 1/ 2.5 Vitamin K2-MK-4 0.1/0.25 0.1/0.25 Vitamin K2-MK-7 10/25-Inter 1/ 2.5 Vitamin K2-MK4-2,3-Epoxide 1/ 2.5 0.5/1 Vitamin K3 100-Inter 5/10
Compound RT (Min) Polarity Precursor
(m/z) Product
(m/z) Collision Energies
(V) RF Lens
(V) Vitamin K1 2.59 Positive 451.1 187.1/185.1 23/21 147
Vitamin K1-D7 2.59 Positive 458.3 193.8 23 147
Vitamin K1-2,3-Epoxide 2.4 Positive 467.2 449.6/161.1 10/17 121
Vitamin K2-MK-4 2.31 Positive 445.1 186.9/227.1 20/15 122
Vitamin K2-MK-7 2.95 Positive 650.3 186.9/94.9 26/31 184
Vitamin K2-MK-4-2,3-Epoxide 2.19 Positive 461.2 443.1/310.9 10/10 112
Vitamin K3 0.93 Positive 172.9 104.9/77.1 19/33 89
Vitamin K3-D8 0.92 Positive 181.3 108.9/81.3 20/24 99
Table 2. Sensitivity.
RESULTS Linearity/Sensitivity The linear range of the Vitamin K’s in serum/BSA matrix was from 100 pg/ml to 1000 ng/ml. The linearity of each extraction was determined in triplicate over 3 days and the results are shown with LOD and LOQ being determined as 3:1 and 10:1 of signal to noise respectively where possible and the mean coefficient of determination (R2) > 0.98 for each matrix and the %CV for each calibration point were all <10%.
Rory M Doyle, Alexander Cherkassky*, Thermo Scientific, Inc, 265 Davidson Avenue, Somerset, New Jersey 08873
LC-MS/MS Quantitative Analysis of the Vitamin K’s and their Metabolites in Serum for Research Use
Accuracy The accuracy was determined by the analysis of pooled sample control material as the percentage deviation from the targeted mean and the results were <10% for all levels. The serum pooled control material concentrations were 25 ng/nl and 250 ng/ml. Therefore, the analytical method can achieve the research laboratory required accuracy for the analysis of the Vitamin K’s in serum.
Precision/Specificity The intra–assay precision (%CV) of the Vitamin K’s in serum were determined by extracting and quantifying three replicates of the pooled sample control material. The inter-assay precision was determined over 3 consecutive days and was found to have a %CV <10% for each Vitamin K within their respective linear range for the pooled serum sample control material respectively. Therefore, the analytical method can achieve the required precision for the analysis of the Vitamin K’s in serum. Due to the similarity between the Vitamin K’s and that it is present in all biological matrices, there were interferences and ion suppression from endogenous lipids which shown in the protein crash chromatogram. Vitamin K’s are very sensitive to light and the nitrogen must be passed through steel tubing to avoid loss of compounds.
CONCLUSIONS • Baseline separation of the Vitamin K’s with good LOD/LOQ was achieved in serum particularly by LLE
• Simple sample preparation achieved desirable LOD/LOQ to the relevant levels with further work to be carried out to fine tune these techniques to obtain more sensitive results and to remove the interferences and achieve better sensitivity while maintaining ease of use and low cost
• Good linearity of calibration curves with acceptable accuracy, precision and reproducibility in positive and negative mode was achieved <10% for %CV for each Vitamin K particularly by LLE within their linear range and the sample preparation techniques and analytical methodologies will be further verified and optimized
REFERENCES 1. A Validated HPLC Method for the Determination of Vitamin K in Human Serum – First Application in a Pharmacological Study The Open Clinical Chemistry Journal, 2011, 4, 17-27 Milka Maranova et al 2. Method for the Determination of Vitamin K Homologues in Human Plasma Using High-Performance Liquid Chromatography-Tandem Mass Spectrometry Anal. Chem., 2005, 77 (3), pp 757–763 Yoshitomo Suhara, et al
TRADEMARKS/LICENSING © 2017 Thermo Fisher Scientific Inc. All rights reserved. All trademarks are the property of Thermo Fisher Scientific and its subsidiaries. This information is not intended to encourage use of these products in any manner that might infringe the intellectual property rights of others.
For research use only. Not for use in diagnostic procedures.
PO64920EN
Figure 2: PPX Chromatograms, Curves and LOD
l l
Figure 1: LLE Chromatograms, Curves and LOD
K3
K2-MK-4
K1
K2-MK-4-Epox
K1-Epox
K2-MK-7
G:\Data\Vitamin K-1-15-2017-LLE\50ngml 01/18/17 13:49:41 50ngml
RT: 0.00 - 3.44
0.0 0.5 1.0 1.5 2.0 2.5 3.0Time (min)
0
50
1000
50
1000
50
1000
50
100
Rel
ativ
e A
bund
ance 0
50
1000
50
1000
50
100 2.632.622.342.36 2.642.33
2.602.662.222.21 2.43 2.980.96 2.010.750.62 1.04 1.41 3.06 3.27
0.75 0.97
0.62 1.411.26
2.34
2.23 2.52 2.602.092.63
2.52 2.82 2.902.142.22
2.011.87 2.33 2.652.43
1.95 2.21 2.68 2.762.98
2.56 2.74 3.27
NL: 4.67E5TIC MS 50ngml
NL: 6.95E3TIC F: + c ESI SRM ms2 172.945 [76.999-77.001, 104.874-104.876, 144.928-144.930] MS 50ngml
NL: 4.30E5TIC F: + c ESI SRM ms2 445.138 [186.945-186.947, 227.070-227.072, 363.471-363.473] MS 50ngml
NL: 3.88E5TIC F: + c ESI SRM ms2 451.092 [184.914-184.916, 186.999-187.001, 196.820-196.822, 227.070-227.072] MS 50ngml
NL: 7.98E4TIC F: + c ESI SRM ms2 461.155 [310.985-310.987, 379.039-379.041, 443.110-443.112] MS 50ngml
NL: 2.60E4TIC F: + c ESI SRM ms2 467.192 [161.017-161.019, 307.150-307.152, 449.596-449.598] MS 50ngml
NL: 1.39E4TIC F: + c ESI SRM ms2 650.325 [94.985-94.987, 186.985-186.987, 464.707-464.709] MS 50ngml
*
G:\Data\...\50ngml_170118164338 01/18/17 16:43:38 50ngml
RT: 0.00 - 3.44
0.0 0.5 1.0 1.5 2.0 2.5 3.0Time (min)
0
50
1000
50
1000
50
1000
50
100
Rel
ativ
e A
bund
ance 0
50
1000
50
1000
50
1002.62
2.34 2.632.33 2.602.642.21 2.37 2.662.200.82 2.421.410.48 0.89 2.982.01 3.04
1.410.48
1.02
0.82
2.34
2.152.08 2.53 2.762.61
2.43 2.80 3.002.152.21
2.011.86 2.29 2.54 2.682.42
2.152.69 2.81
2.98
2.873.092.52 3.39
NL: 1.70E5TIC MS 50ngml_170118164338
NL: 9.68E3TIC F: + c ESI SRM ms2 172.945 [76.999-77.001, 104.874-104.876, 144.928-144.930] MS 50ngml_170118164338
NL: 1.40E5TIC F: + c ESI SRM ms2 445.138 [186.945-186.947, 227.070-227.072, 363.471-363.473] MS 50ngml_170118164338
NL: 9.18E4TIC F: + c ESI SRM ms2 451.092 [184.914-184.916, 186.999-187.001, 196.820-196.822, 227.070-227.072] MS 50ngml_170118164338
NL: 6.18E4TIC F: + c ESI SRM ms2 461.155 [310.985-310.987, 379.039-379.041, 443.110-443.112] MS 50ngml_170118164338
NL: 9.70E3TIC F: + c ESI SRM ms2 467.192 [161.017-161.019, 307.150-307.152, 449.596-449.598] MS 50ngml_170118164338
NL: 6.01E3TIC F: + c ESI SRM ms2 650.325 [94.985-94.987, 186.985-186.987, 464.707-464.709] MS 50ngml_170118164338
K3
K2-MK-4
K1
K2-MK-4-Epox
K1-Epox
K2-MK-7

Find out more at thermofi sher.com
© 2017 Thermo Fisher Scienti� c Inc. All rights reserved. All trademarks are the property of Thermo Fisher Scienti� c and its subsidiaries unless otherwise speci� ed. PN64920 EN 0217S
For research use only. Not for use in diagnostic procedures.
ABSTRACT Purpose: An LC-MS/MS analytical method was developed and verified for the quantitation of the Vitamin K’s in serum for research use. Simple sample preparation techniques including protein crash and liquid-liquid extraction were evaluated. A Thermo ScientificTM TSQ Endura triple quadrupole mass spectrometer in positive Electrospray mode with a Thermo ScientificTM DionexTM VanquishTM Horizon HPLC system was used.
Methods: 200 mL (PPX) and 500 mL (LLE) of serum were used for the analysis of the Vitamin K’s and their metabolites. Various columns were evaluated and a Thermo ScientificTM AccucoreTM PFP, 100 x 2.1 mm, 2.6 mm with 0.1% Formic Acid and 5mM Ammonium Formate in water and 0.1% Formic Acid in methanol mobile phases achieved baseline chromatographic separation in approximately 4 minutes run time. Quantitative analysis was performed using scheduled reactive monitoring (SRM) transition pairs for each Vitamin K and internal standard in positive mode and accuracy of the analytical method was verified using pooled reference samples.
Results: Good linearity and reproducibility were obtained across the dynamic range of the Vitamin K’s with a coefficient of determination R2>0.95 or better for all compounds in the various matrices. The limits of detection and quantitation were determined to range initially from 50 pg/ml to 1 ng/ml with very good reproducibility observed for all compounds.
INTRODUCTION The Vitamin K’s are a group of structurally similar fat soluble compounds that the body requires in order to maintain good physiological function. There are two natural forms - K1 and K2 of which K2 consists of a number of sub types that differ in the length of their carbon side chains and each has a significant influence on the body.
In this case, we evaluated various columns and solvent combinations as well as simple and easy sample preparation techniques in order to develop an LC-MS/MS analytical method that can demonstrate the chromatographic separation, detection and quantification of the Vitamin K’s and their metabolites in serum. The Vitamin K’s analyzed include Vitamin K1 (Phylloquinone), Vitamin K1-2,3-Epoxide, Vitamin K2-MK4 (Menaquinone-4), Vitamin K2-MK7 (Menaquinone-7), Vitamin K2-2,3-Epoxide and Vitamin K3 (Menadione). The sample preparation choices were kept simple and included protein crash and a one step liquid-liquid extraction. The methodologies were developed on a TSQ Endura triple quadrupole mass spectrometer in positive Electrospray ionization modes with a Vanquish Horizon HPLC system with a 4 minute analytical gradient.
MATERIALS AND METHODS
Standards The following analytical reference standards and Internal standards were obtained from -
Isosciences, Inc., King of Prussia, PA
Vitamin K1 (Phylloquinone): 1 mg Vitamin K1-D7: 1 mg Vitamin K1-2,3-Epoxide: 1 mg Vitamin K3 (Menadione): 1 mg Vitamin K3-D8: 1 mg
Cerilliant Corp., Round Rock, TX-
Vitamin K2-MK-4 (Menaquinone-4): 1mg Vitamin K2-MK-7 (Menaquinone-7): 1 mg
Sigma-Aldrich Corp. St Louis, MO-
Vitamin K2-2,3-Epoxide: 10 mg
Reagents The following Fisher Scientific™ acids, reagents and solvents were used HPLC grade Water Ethanol Methanol Hexane Ammonium Formate Formic Acid
Sample Preparation- Protein Crash • 200 mL of Serum/BSA mixture calibrators, controls and serum sample were added to 1.5 ml eppendorf tubes and
20 mL of Vitamin K ISTD at 1000 ng/mL were added to each tube and vortexed briefly • 400 mL of Acetonitrile was added to each tube and vortexed for 1 min prior to centrifugation for 10 minutes at
13000 rpm • The supernatant was transferred to an MS vial and capped. • All in-house calibrators were prepared in drug-free serum and bovine serum albumin mixture (Golden West
Biological, Inc, Temecula, CA)
Sample Preparation- Liquid-Liquid Extraction • 500 mL of Serum/BSA mixture calibrators, controls and serum samples were added to a test tube and 50 mL of
Vitamin K ISTD at 1000 ng/mL were added to each and vortexed briefly • 1.5 mL of Ethanol was added to each tube and vortexed for 1 min followed by 4 ml of Hexane and again vortexed
for 1 min. • The tubes were centrifugation for 10 minutes at 13000 rpm • The upper organic layer was transferred to a new test tube and dried down under nitrogen at room temperature • The extract was reconstituted in 200 mL of 1:3 water and methanol • The supernatant was transferred to an MS vial and capped.
The calibration curves ranged from 0.1 ng/mL to 1000 ng/mL and various pooled samples were used as control material.
Data Analysis The software used included for this method included the Thermo Scientific™ Xcalibur™ 3.1 SW, Thermo Scientific™ TSQ Endura Tune™ 2.1 SW, and Thermo Scientific™ Tracefinder™ 4.1 SW
Method
HPLC Conditions- Vanquish Horizon HPLC binary pump, well plate, thermostatted column compartment
Column: Accucore PFP, 100 x 2.1 mm, 2.6 mm Column Temperature: 50 oC Injection Volume: 20 mL Sampler Temperature: 4 oC Needle Wash: Flush port (50%Methanol:50%Water) 10 seconds Mobile Phase A: 0.1% Formic Acid + 5mM Ammonium Formate in Water Mobile Phase B: 0.1% Formic Acid in Methanol Flow Rate: 0.5 ml/min Gradient: 0 min- 30%A:70%B 1.0 min- 2%A:98%B 3.0 min- 2%A:98%B 3.1 min- 30%A:70%B Run time: 40 mins
MS and Ion Source Conditions- TSQ Endura triple quadrupole mass spectrometer Ion mode: Positive Electrospray (H-ESI) Mode Vaporizer Temperature: 325 oC Ion Transfer Tube Temperature: 325 oC Sheath Gas: 45 Aux Gas: 25 Sweep Gas: 15 Spray Voltage: Positive Ion (V):3500 V Q1/Q2 Resolution: 1.2/0.7 (FWHM) Cycle time (sec): 0.5 CID Gas (mTorr): 2 Chromatographic Peak Width: 6 secs
Table 1. Scan Parameters- SRM Table
Compound Protein Crash
LOD/LOQ (pg/ml)
LLE LOD/LOQ
(ng/ml) Vitamin K1 0.25/0.5 0.05/0.1 Vitamin K1-2,3-Epoxide 2.5/5 1/ 2.5 Vitamin K2-MK-4 0.1/0.25 0.1/0.25 Vitamin K2-MK-7 10/25-Inter 1/ 2.5 Vitamin K2-MK4-2,3-Epoxide 1/ 2.5 0.5/1 Vitamin K3 100-Inter 5/10
Compound RT (Min) Polarity Precursor
(m/z) Product
(m/z) Collision Energies
(V) RF Lens
(V) Vitamin K1 2.59 Positive 451.1 187.1/185.1 23/21 147
Vitamin K1-D7 2.59 Positive 458.3 193.8 23 147
Vitamin K1-2,3-Epoxide 2.4 Positive 467.2 449.6/161.1 10/17 121
Vitamin K2-MK-4 2.31 Positive 445.1 186.9/227.1 20/15 122
Vitamin K2-MK-7 2.95 Positive 650.3 186.9/94.9 26/31 184
Vitamin K2-MK-4-2,3-Epoxide 2.19 Positive 461.2 443.1/310.9 10/10 112
Vitamin K3 0.93 Positive 172.9 104.9/77.1 19/33 89
Vitamin K3-D8 0.92 Positive 181.3 108.9/81.3 20/24 99
Table 2. Sensitivity.
RESULTS Linearity/Sensitivity The linear range of the Vitamin K’s in serum/BSA matrix was from 100 pg/ml to 1000 ng/ml. The linearity of each extraction was determined in triplicate over 3 days and the results are shown with LOD and LOQ being determined as 3:1 and 10:1 of signal to noise respectively where possible and the mean coefficient of determination (R2) > 0.98 for each matrix and the %CV for each calibration point were all <10%.
Rory M Doyle, Alexander Cherkassky*, Thermo Scientific, Inc, 265 Davidson Avenue, Somerset, New Jersey 08873
LC-MS/MS Quantitative Analysis of the Vitamin K’s and their Metabolites in Serum for Research Use
Accuracy The accuracy was determined by the analysis of pooled sample control material as the percentage deviation from the targeted mean and the results were <10% for all levels. The serum pooled control material concentrations were 25 ng/nl and 250 ng/ml. Therefore, the analytical method can achieve the research laboratory required accuracy for the analysis of the Vitamin K’s in serum.
Precision/Specificity The intra–assay precision (%CV) of the Vitamin K’s in serum were determined by extracting and quantifying three replicates of the pooled sample control material. The inter-assay precision was determined over 3 consecutive days and was found to have a %CV <10% for each Vitamin K within their respective linear range for the pooled serum sample control material respectively. Therefore, the analytical method can achieve the required precision for the analysis of the Vitamin K’s in serum. Due to the similarity between the Vitamin K’s and that it is present in all biological matrices, there were interferences and ion suppression from endogenous lipids which shown in the protein crash chromatogram. Vitamin K’s are very sensitive to light and the nitrogen must be passed through steel tubing to avoid loss of compounds.
CONCLUSIONS • Baseline separation of the Vitamin K’s with good LOD/LOQ was achieved in serum particularly by LLE
• Simple sample preparation achieved desirable LOD/LOQ to the relevant levels with further work to be carried out to fine tune these techniques to obtain more sensitive results and to remove the interferences and achieve better sensitivity while maintaining ease of use and low cost
• Good linearity of calibration curves with acceptable accuracy, precision and reproducibility in positive and negative mode was achieved <10% for %CV for each Vitamin K particularly by LLE within their linear range and the sample preparation techniques and analytical methodologies will be further verified and optimized
REFERENCES 1. A Validated HPLC Method for the Determination of Vitamin K in Human Serum – First Application in a Pharmacological Study The Open Clinical Chemistry Journal, 2011, 4, 17-27 Milka Maranova et al 2. Method for the Determination of Vitamin K Homologues in Human Plasma Using High-Performance Liquid Chromatography-Tandem Mass Spectrometry Anal. Chem., 2005, 77 (3), pp 757–763 Yoshitomo Suhara, et al
TRADEMARKS/LICENSING © 2017 Thermo Fisher Scientific Inc. All rights reserved. All trademarks are the property of Thermo Fisher Scientific and its subsidiaries. This information is not intended to encourage use of these products in any manner that might infringe the intellectual property rights of others.
For research use only. Not for use in diagnostic procedures.
PO64920EN
Figure 2: PPX Chromatograms, Curves and LOD
l
CONCLUSIONS• Baseline separation of the Vitamin K’s with
• Simple sample preparation achieved desirable LOD/LOQ out to fine tune these techniques to obtain more sensitive results and to remove the interferences and achieve better sensitivity while maintaining ease of use and low cost
• Good linearity of calibration curves with acceptable accuracy, precision and reproducibility in positive negative mode was achieved <10% for %and the sample preparation techniques and analytical methodologies will be further verified and optimized
REFERENCES1. A Validated HPLC Method for the Determination of Vitamin K in
Pharmacological StudyThe Open Clinical Chemistry Journal, 2011, 4, Milka Maranova et al
2. Method for the Determination of Vitamin K Homologues in Human Plasma Using HighLiquid Chromatography-Tandem Mass SpectrometryAnal. Chem., 2005, 77 (3), pp 757–Yoshitomo Suhara, et al
Figure 1: LLE Chromatograms, Curves and LOD
K3
K2-MK-4
K1
K2-MK-4-Epox
K1-Epox
K2-MK-7
G:\Data\Vitamin K-1-15-2017-LLE\50ngml 01/18/17 13:49:41 50ngml
RT: 0.00 - 3.44
0.0 0.5 1.0 1.5 2.0 2.5 3.0Time (min)
0
50
1000
50
1000
50
1000
50
100
Rel
ativ
e A
bund
ance 0
50
1000
50
1000
50
100 2.632.622.342.36 2.642.33
2.602.662.222.21 2.43 2.980.96 2.010.750.62 1.04 1.41 3.06 3.27
0.75 0.97
0.62 1.411.26
2.34
2.23 2.52 2.602.092.63
2.52 2.82 2.902.142.22
2.011.87 2.33 2.652.43
1.95 2.21 2.68 2.762.98
2.56 2.74 3.27
NL: 4.67E5TIC MS 50ngml
NL: 6.95E3TIC F: + c ESI SRM ms2 172.945 [76.999-77.001, 104.874-104.876, 144.928-144.930] MS 50ngml
NL: 4.30E5TIC F: + c ESI SRM ms2 445.138 [186.945-186.947, 227.070-227.072, 363.471-363.473] MS 50ngml
NL: 3.88E5TIC F: + c ESI SRM ms2 451.092 [184.914-184.916, 186.999-187.001, 196.820-196.822, 227.070-227.072] MS 50ngml
NL: 7.98E4TIC F: + c ESI SRM ms2 461.155 [310.985-310.987, 379.039-379.041, 443.110-443.112] MS 50ngml
NL: 2.60E4TIC F: + c ESI SRM ms2 467.192 [161.017-161.019, 307.150-307.152, 449.596-449.598] MS 50ngml
NL: 1.39E4TIC F: + c ESI SRM ms2 650.325 [94.985-94.987, 186.985-186.987, 464.707-464.709] MS 50ngml
*
G:\Data\...\50ngml_170118164338 01/18/17 16:43:38 50ngml
RT: 0.00 - 3.44
0.0 0.5 1.0 1.5 2.0 2.5 3.0Time (min)
0
50
1000
50
1000
50
1000
50
100
Rel
ativ
e A
bund
ance 0
50
1000
50
1000
50
1002.62
2.34 2.632.33 2.602.642.21 2.37 2.662.200.82 2.421.410.48 0.89 2.982.01 3.04
1.410.48
1.02
0.82
2.34
2.152.08 2.53 2.762.61
2.43 2.80 3.002.152.21
2.011.86 2.29 2.54 2.682.42
2.152.69 2.81
2.98
2.873.092.52 3.39
NL: 1.70E5TIC MS 50ngml_170118164338
NL: 9.68E3TIC F: + c ESI SRM ms2 172.945 [76.999-77.001, 104.874-104.876, 144.928-144.930] MS 50ngml_170118164338
NL: 1.40E5TIC F: + c ESI SRM ms2 445.138 [186.945-186.947, 227.070-227.072, 363.471-363.473] MS 50ngml_170118164338
NL: 9.18E4TIC F: + c ESI SRM ms2 451.092 [184.914-184.916, 186.999-187.001, 196.820-196.822, 227.070-227.072] MS 50ngml_170118164338
NL: 6.18E4TIC F: + c ESI SRM ms2 461.155 [310.985-310.987, 379.039-379.041, 443.110-443.112] MS 50ngml_170118164338
NL: 9.70E3TIC F: + c ESI SRM ms2 467.192 [161.017-161.019, 307.150-307.152, 449.596-449.598] MS 50ngml_170118164338
NL: 6.01E3TIC F: + c ESI SRM ms2 650.325 [94.985-94.987, 186.985-186.987, 464.707-464.709] MS 50ngml_170118164338
K3
K2-MK-4
K1
K2-MK-4-Epox
K1-Epox
K2-MK-7