LBWD’s Prototype-Scale Testing of NF Membranes for Seawater Desalination Robert C. Cheng, Tai J....
40
LBWD’s Prototype-Scale Testing LBWD’s Prototype-Scale Testing of NF Membranes for Seawater of NF Membranes for Seawater Desalination Desalination Robert C. Cheng, Tai J. Tseng, Kevin L. Wattier Robert C. Cheng, Tai J. Tseng, Kevin L. Wattier February 17, 2011 February 17, 2011 MSSC National Salinity Summit MSSC National Salinity Summit 1
-
Upload
marylou-bruce -
Category
Documents
-
view
222 -
download
3
Transcript of LBWD’s Prototype-Scale Testing of NF Membranes for Seawater Desalination Robert C. Cheng, Tai J....

LBWD’s Prototype-Scale Testing of NF LBWD’s Prototype-Scale Testing of NF Membranes for Seawater DesalinationMembranes for Seawater Desalination
Robert C. Cheng, Tai J. Tseng, Kevin L. WattierRobert C. Cheng, Tai J. Tseng, Kevin L. Wattier
February 17, 2011February 17, 2011
MSSC National Salinity SummitMSSC National Salinity Summit
11

Research Partners
US Bureau of Reclamation CA Dept. of Water Resources LA Department of Water and
Power Southern Nevada Water
Authority Tampa Bay Water Authority
UCLA University of New
Hampshire Clemson University University of Illinois Montana State University University of Central
Florida Virginia Tech University of Nevada, Reno University of Iowa
AcademiaGovernment
Industry DuPont Water Research Foundation
(AwwaRF) Black & Veatch CH2M Hill MWH

Water resources…under stress Los Angeles Aqueduct: reduction
California Aqueduct:“Southern California Loses Up to 30 Percent of Its Supplies from Delta Next Year and Possibly Longer”-Business Wire News
Colorado River Aqueduct: ~50% reduction
…more pressure to act
locally to reduce
dependence on importsCity of Long Beach
~500,000 residents

Reliability, at lowest reasonable rates
“New”
Conjunctive Use
Seawater
Consumers
Potable
“Traditional”
Groundwater
Surface water
Conservation
2007 Declaration
16+% decrease in use
“100 by 100” Initiative
Seawater barrier
Irrigation
Indirect recharge
Reclaimed
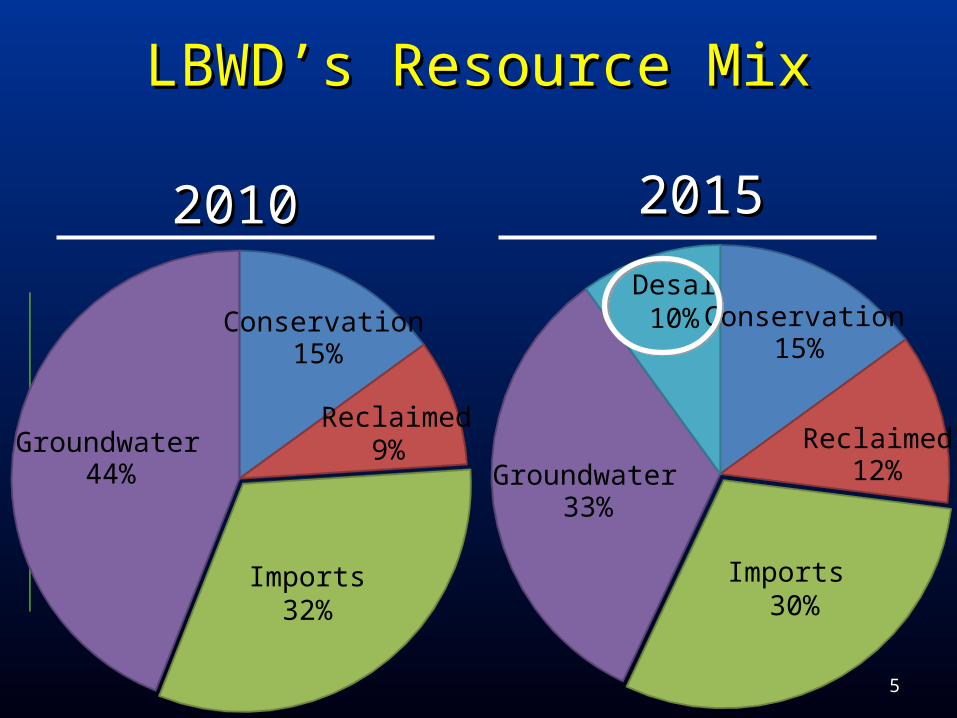
LBWD’s Resource MixLBWD’s Resource Mix
20102010 20152015
Conservation 15%
Reclaimed 9%
Imports32%
Groundwater 44%
Conservation 15%
Reclaimed12%
Imports 30%
Groundwater 33%
Desal 10%
55

Shifts in water resources
47%
20072007(declaration of drought)(declaration of drought)
20102010(shortage allocation)(shortage allocation)
53%53%
ImportsImports (MWD)(MWD)
Groundwater(LBWD)
$478 - $574/af$478 - $574/af
Groundwater
53%
< $400/af$300/af
47%47%
ImportsImports
$740 - $740 -
$3,134$3,134/af/af
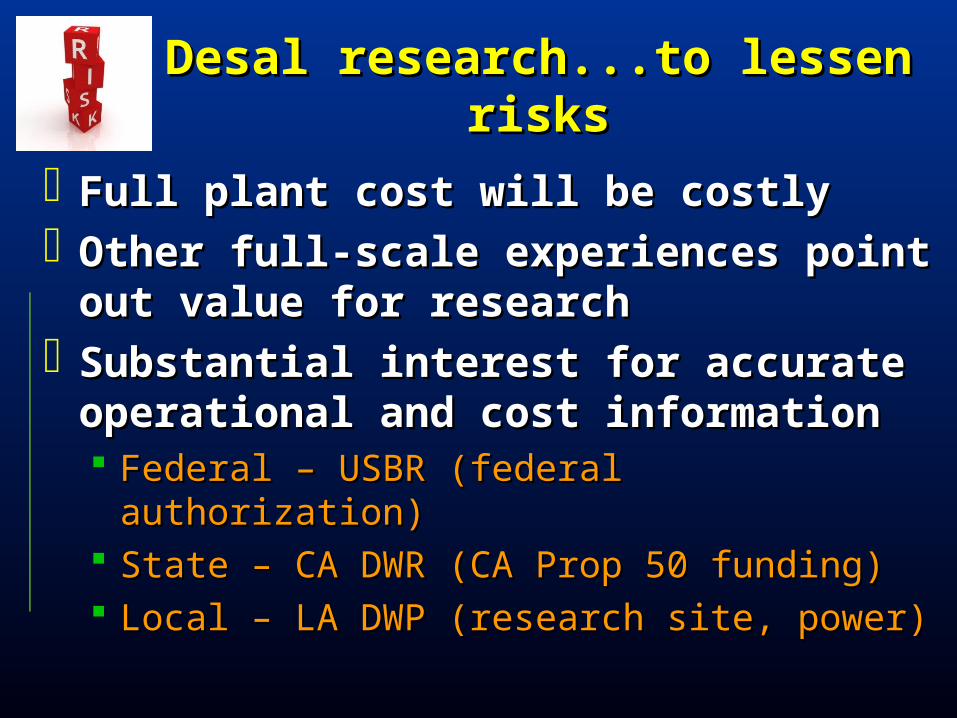
Desal research...to lessen risksDesal research...to lessen risks
Full plant cost will be costlyFull plant cost will be costly Other full-scale experiences point out Other full-scale experiences point out
value for researchvalue for research Substantial interest for accurate Substantial interest for accurate
operational and cost informationoperational and cost information Federal – USBR (federal authorization)Federal – USBR (federal authorization) State – CA DWR (CA Prop 50 funding)State – CA DWR (CA Prop 50 funding) Local – LA DWP (research site, power)Local – LA DWP (research site, power)

O&M- Electrical Power44%
Debt (Capital)37%
Membrane Replacement
5%Labor
4%
Maintenance & Parts
7%
Consumables3%
Federal Roadmap EstimatePower + Debt = 81%
Non-energy O&M = 19%Non-energy O&M = 19%
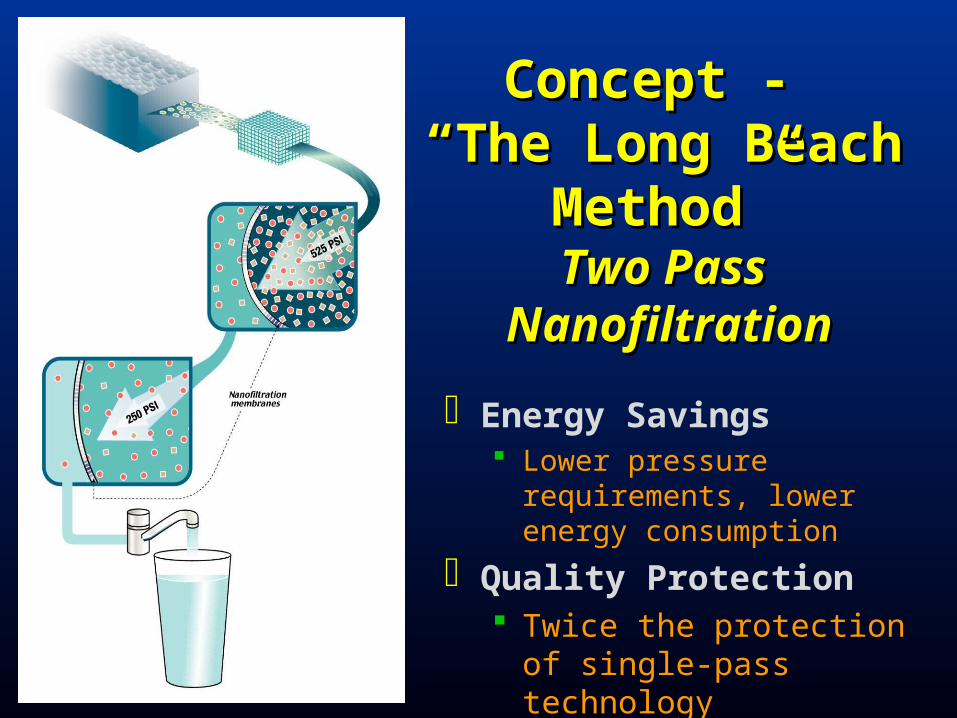
Concept - Concept - ““The Long Beach The Long Beach
Method”Method”Two PassTwo Pass
NanofiltrationNanofiltration
Energy Savings Lower pressure requirements,
lower energy consumption
Quality Protection Twice the protection of
single-pass technology
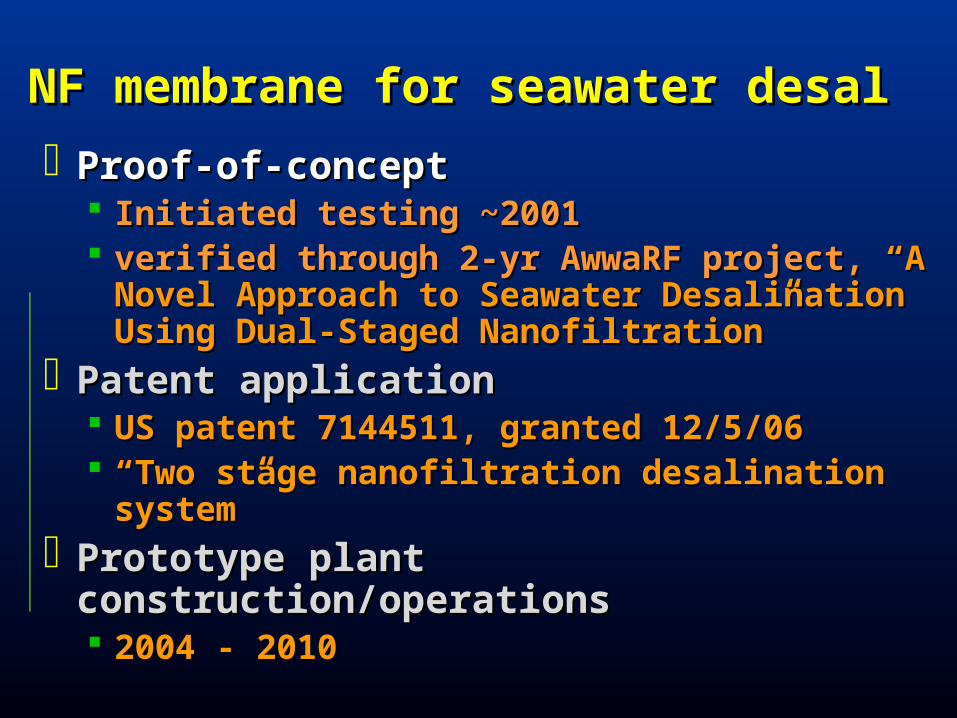
NF membrane for seawater desalNF membrane for seawater desal
Proof-of-conceptProof-of-concept Initiated testing ~2001Initiated testing ~2001 verified through 2-yr AwwaRF project, verified through 2-yr AwwaRF project, “A “A
Novel Approach to Seawater Desalination Novel Approach to Seawater Desalination Using Dual-Staged Nanofiltration”Using Dual-Staged Nanofiltration”
Patent applicationPatent application US patent 7144511, granted 12/5/06US patent 7144511, granted 12/5/06 ““Two stage nanofiltration desalination Two stage nanofiltration desalination
system”system” Prototype plant construction/operationsPrototype plant construction/operations
2004 - 20102004 - 2010
1111
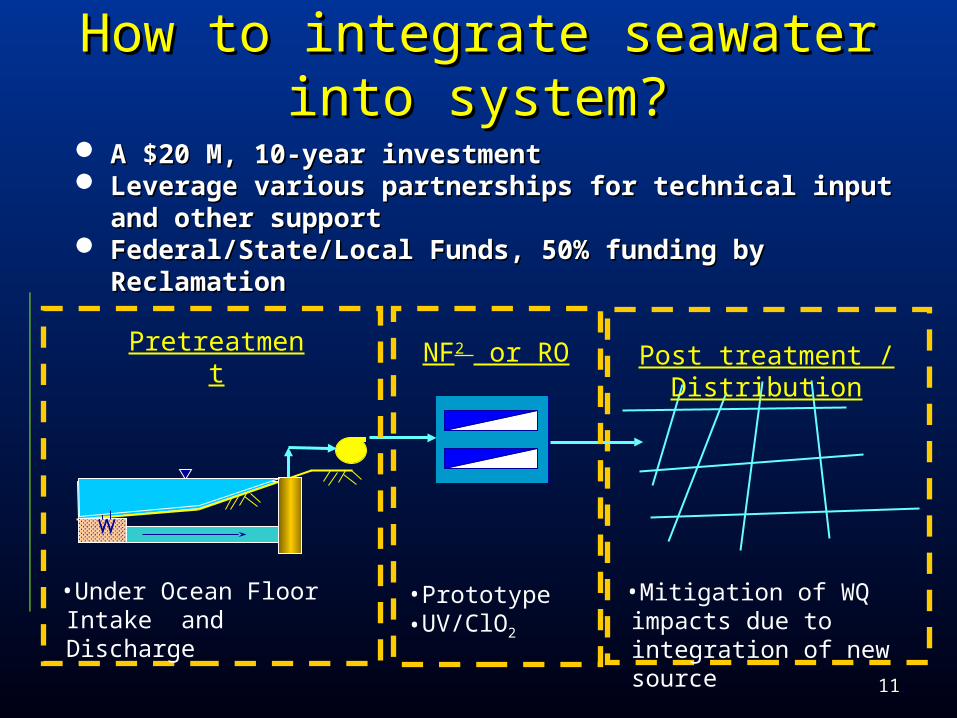
How to integrate seawater into How to integrate seawater into system?system?
Post treatment / DistributionPretreatment NF2 or RO
A $20 M, 10-year investment A $20 M, 10-year investment Leverage various partnerships for technical input and other Leverage various partnerships for technical input and other
supportsupport Federal/State/Local Funds, 50% funding by ReclamationFederal/State/Local Funds, 50% funding by Reclamation
•Under Ocean Floor Intake and Discharge
•Prototype•UV/ClO2
•Mitigation of WQ impacts due to integration of new source

Jul
07 -
Jan
04
-
Jul
04 -
Jan
05
-
Jul
05 -
Jan
06
-
Jul
06 -
Jan
07
-
Jan
08
-
ConstructionConstruction
Jan
09
-
Jul
08 -
Jan
10
-
Jul
09 -
Jul
10 -
DesignDesign
Desal Prototype Research
ClO2 and UV
Under Ocean Floor
Desal Site Alternative Study
SiteRestoration
Restoration(2012)
Post-treatmentDesignDesign
DesignDesign
Research schedule
Jan
11
-
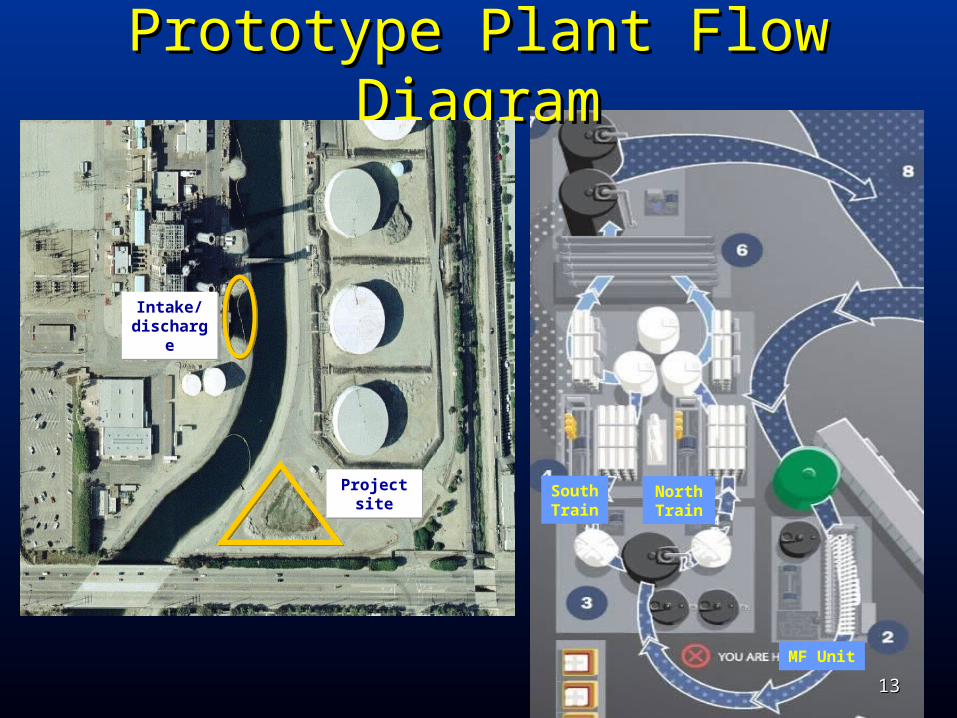
SouthTrain
North Train
MF Unit
Prototype Plant Flow DiagramPrototype Plant Flow Diagram
1313
Intake/discharge
Intake/discharge
Projectsite
Projectsite

Prototype PlantPrototype Plant 300,000 gpd facility, 8-in vessels300,000 gpd facility, 8-in vessels
1414
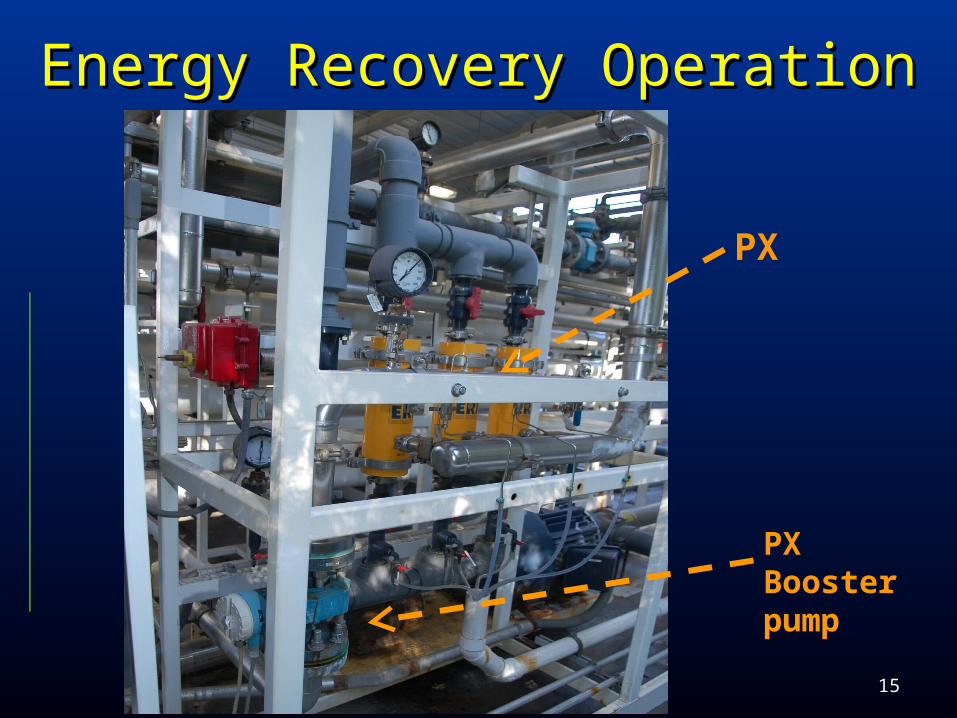
Energy Recovery OperationEnergy Recovery Operation
PX Booster pump
PX
1515

Other IssuesOther Issues
TechnicalTechnical Water quality met (boron, bromide, etc.)Water quality met (boron, bromide, etc.) Blending issues with existing waterBlending issues with existing water
EnvironmentalEnvironmental Impingement/entrainmentImpingement/entrainment DischargeDischarge
Public TrustPublic Trust Sound investmentSound investment TransparencyTransparency
PermittingPermitting
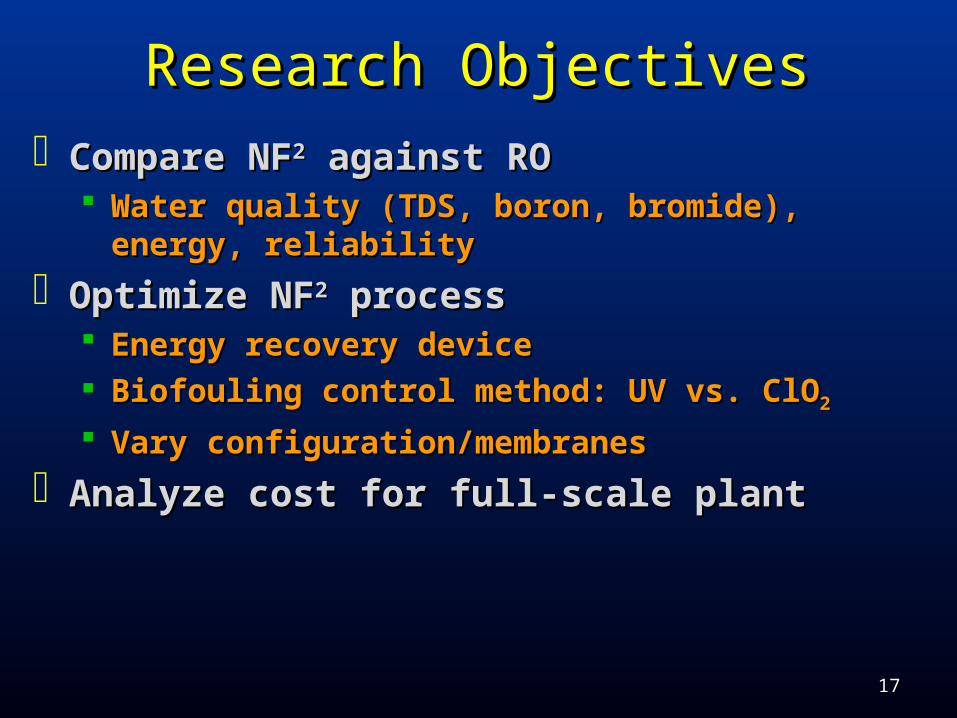
Research ObjectivesResearch Objectives Compare NFCompare NF22 against RO against RO
Water quality (TDS, boron, bromide), energy, Water quality (TDS, boron, bromide), energy, reliabilityreliability
Optimize NFOptimize NF22 process process Energy recovery deviceEnergy recovery device Biofouling control method: UV vs. ClOBiofouling control method: UV vs. ClO22
Vary configuration/membranesVary configuration/membranes
Analyze cost for full-scale plantAnalyze cost for full-scale plant
1717

Research ApproachResearch Approach
Phase I- NFPhase I- NF22 vs. RO vs. RO Short tests to determine trendsShort tests to determine trends General WQ and energy recovery monitoringGeneral WQ and energy recovery monitoring May ’06 – Dec ‘07May ’06 – Dec ‘07
Phase II-NFPhase II-NF22 vs. RO vs. RO 2+ weeks of selected conditions from Phase I2+ weeks of selected conditions from Phase I Detailed WQ analysesDetailed WQ analyses Jan ’08 – Dec ‘08Jan ’08 – Dec ‘08
Phase III and IV-NFPhase III and IV-NF22 optimization test optimization test 2+ weeks tests: NF 5 vs. 7, mixed membrane 2+ weeks tests: NF 5 vs. 7, mixed membrane UV vs. ClOUV vs. ClO22
Jan ’09 – Jan ‘10Jan ’09 – Jan ‘10
1818

NFNF22 vs. RO Process vs. RO Process
Membranes Pressure (psi) Recovery (%)
NF2 Pass 1 NF90 540 39%
NF2 Pass 2 NE90 184 72%
RO Pass 1 SWC3+ 756 40%
RO Pass 2 NE90 218 80% 1919
MF
Energy Recovery
1st Pass NF(South Train)
Cartridge Filter
Combined Effluent Tanks
Cartridge Filter
Backwash water
Influent Tank
Energy Recovery
2nd Pass NF(South Train)
2nd Pass NF(North Train)1st Pass RO or NF
(North Train)

Water Quality GoalWater Quality Goal
Total dissolved solids (TDS)Total dissolved solids (TDS) TDS <500 mg/L-secondary WQ standardTDS <500 mg/L-secondary WQ standard
Bromide - accelerate disinfectant decayBromide - accelerate disinfectant decay Bromide <0.4-0.5 mg/L to maintain residualBromide <0.4-0.5 mg/L to maintain residual
Boron - toxic to plants at high levelBoron - toxic to plants at high level California notification level = 1 mg/LCalifornia notification level = 1 mg/L
No “backsliding” of water quality from new No “backsliding” of water quality from new sourcesource
2020

Selecting appropriate base addition location is critical
Base Addition StrategyBase Addition Strategy
Base Injection PtOption 1
Base Injection PtOption 2
• More base required to alter pH
• HIGH potential for fouling
Alk = 122 mg/L
Ca2+ = 447 mg/LAlk = 10.4 mg/L
Ca2+ = 11.7 mg/L
• Less base required to alter pH
• 97% rejection of Ca2+. Decreased potential for fouling
Pass 1 Pass 2

NFNF22 vs. RO, Boron vs. RO, Boron
2222
0
1
2
3
4
5
6
7.4 gfd -34% 5.6 gfd -27% 8.5 gfd-37% 8.5 gfd -37%
Bo
ron
(mg
/L)
Flux-recovery
Raw Pass 1 (RO) Pass 2 (RO/NF )
CaNL

Specific Energy SummarySpecific Energy SummaryPermeate B <0.8 mg/LPermeate B <0.8 mg/L
10.1
11.2
11.6
9.3
8.2
9.7
8.0
8.5
9.0
9.5
10.0
10.5
11.0
11.5
12.0
NF2 SWRO (2 pass)
Sp
ecif
ic E
ner
gy
(kW
h/k
gal
)
Maximum
Minimum
50% value
75% value
25% value
50th percentile specific savings = 20%

NFNF22 vs. RO vs. RO
Two-pass RO required to meet all water quality objectives Boron < 1 mg/L Consistent with USBR DWPR Report 127
NF2 required less specific energy than RO/NF NF2 required 20% less energy (50th percentile)

Mixing Membranes in NFMixing Membranes in NF22
Pass 1 - two stage configurationStage 1 holds 5 elements/vessel
2525
ULP ROULP RO
Improve flux and water quality by changing membrane types within a vessel

NFNF22 Optimization Test Optimization Test
2626
Configuration Pressure FluxProd. TDS
kWh/1000 gal
Last elem flow
Last element pressure
Ranking
NF-NF-NF-NF-NF 573.9 7 4366 13.86 13 539.9 NF-NF-NF-NF-ULP 593 7 3699 14.32 13.2 536 ULP-NF-NF-NF-NF 588.9 7 3843 14.22 12 539.9 2
ULP-ULP-NF-NF-NF 604 7 3284 14.58 13.3 538 1NF-NF-NF-ULP-ULP 612.7 7 2987 14.79 14.4 499.6 3
ULP-ULP-ULP-NF-NF 623 7 2857 15.04 13.5 535.2 NF-NF-ULP-ULP-ULP 642.5 7 2336 15.51 12.6 565.5
BW-NF-NF-NF-NF 597 7 3882 14.42 12 534.4 BW-BW-NF-NF-NF 627.7 7 3200 15.15 13.5 522.8 BW-BW-BW-NF-NF 667.5 7 2512 16.13 11.9 518.2
Source: Trussell, R.S., Sharma, R.R., Trussell, R.R. 2009. Optimization modeling of nanofiltration membranes for seawater desalination: Scale-up from pilot to prototype scale. In AWWA Membrane Technology Conference (Memphis, TN).

NFNF22 Optimization Test – Energy Optimization Test – Energy
2727
0
2
4
6
8
10
12
NF 5 NF 7 2 ULP + 5 NF 90
1 ULP + 6 NF90
5 NF90 + 2 ULP
1 ULP + 4 NF90
2 ULP + 3 NF90
1 ULP + 6 NF90
NF 7 NE 7
7.2 gfd-39%
6.8 gfd-34%
5.5 gfd-33%
5.3 gfd-33%
5.2 gfd-33%
7.7 gfd-38%
7.1 gfd-35%
6.5 gfd-34%
5.0 gfd-29%
5.1gfd-30%
South North South South South North North South North North
n=793 n=2320 n=2561 n=3662 n=6417 n=2308 n=2185 n=7367 n=15034 n=1241
En
erg
y (k
wh
r/k
ga
l) No UV/ClO2
UV ClO2

NFNF22 Optimization Summary Optimization Summary
No clear difference in energy consumption No clear difference in energy consumption between 5 & 7 elements in seriesbetween 5 & 7 elements in series
More ULP membranes in lead position reduced More ULP membranes in lead position reduced energy consumptionenergy consumption
2828
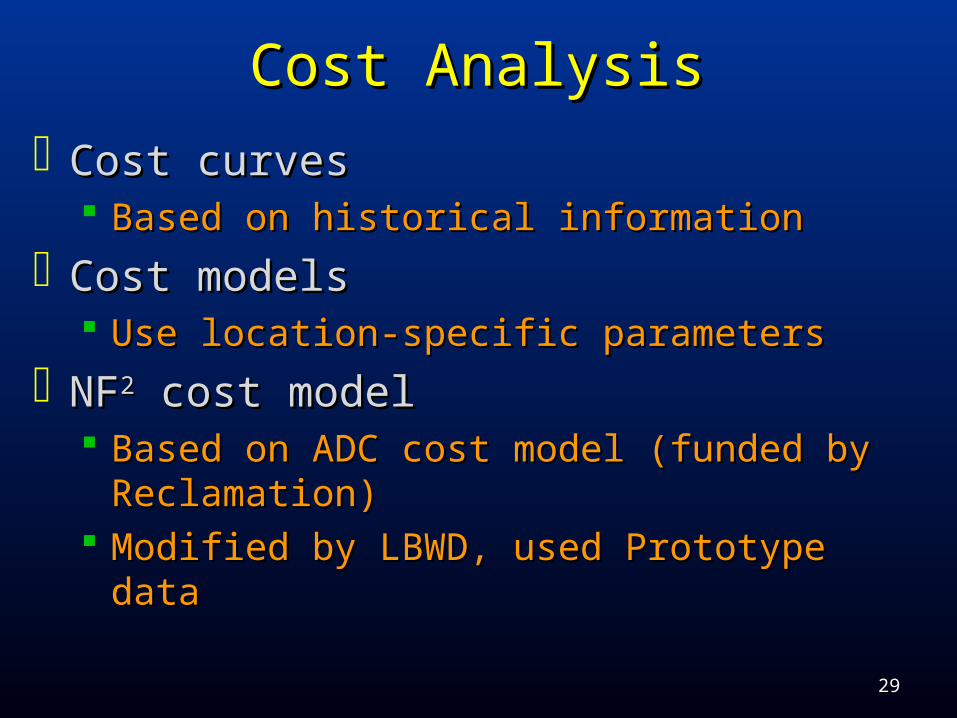
Cost AnalysisCost Analysis
Cost curvesCost curves Based on historical information Based on historical information
Cost modelsCost models Use location-specific parameters Use location-specific parameters
NFNF22 cost model cost model Based on ADC cost model (funded by Based on ADC cost model (funded by
Reclamation)Reclamation) Modified by LBWD, used Prototype dataModified by LBWD, used Prototype data
2929

NFNF2 2 Cost Model ScenariosCost Model Scenarios Scenarios testedScenarios tested
Highest overall system recoveryHighest overall system recovery Lowest specific energy (kWh/kgal)Lowest specific energy (kWh/kgal) Highest flux (gfd)Highest flux (gfd)
Different production rateDifferent production rate 50 mgd50 mgd 5 mgd5 mgd
3030

Variables analyzedVariables analyzed
Variable Baseline Variable EffectProject life 30 yrs 25 yrs Capital
Interest rate 5% 4%, 6% CapitalMembrane
life6.5 yrs 10 yrs Non-energy O&M
Energy cost $0.12/kWh $0.15/kWh Energy O&M

Cost AnalysisCost Analysis
Two pass RO NF NF2
Scenario 1 Scenario 2 Scenario 1 Scenario 2 Scenario 3
Pass 1
Pass 2 Pass 1
Pass 2
Pass 1
Pass 2
Pass 1
Pass 2
Pass 1
Pass 2
Flux (gfd) 6.91 15.89 5.41 11.47 6.65 19.55 6.29 15.35 7.05 15.17
Recovery (%) 42% 82% 35% 75% 46% 75% 45% 78% 44% 80%
Overall recovery (%) 34% 27% 38% 41% 39%
Energy (kWh/kgal) 9.3 1.7 9.8 1.3 6.6 1.6 7.0 2.2 7.4 2.3
Optimization parameter
Capital, energy Energy Capital Capital
3232

50 mgd vs. 5 mgd Energy O&M independent of size Capital and Non-Energy O&M
Capacity dependent items• Membrane replacements, solid disposal, maintenance, labor• Chemical cost
Capital reduction factors varied for 50 mgd vs 5 mgd• 20% – process piping, solid disposal, etc.• 32% - pumps, chemical systems, etc.• 44% – yard piping, site work, etc.
Capacity independent item • Permitting - $10M (15% of overall capital cost for 5 mgd, 3%
of overall capital cost for 50 mgd)

Cost AnalysisCost Analysis
3434
Baseline5 MGD - 30 Years, $0.12/kWh, 5% interest, 6.5 yrs membrane life
1.5
5
1.6
1
2.3
5
2.5
3
2.3
3
2.3
4
2.3
2
2.9
6 3.2
2
2.9
2 3.6
4
2.9
2
1.7
8
1.9
0
1.4
4
7.107.66
6.69
7.536.85
0
1
2
3
4
5
6
7
8
9
10
RONF 1 - 6.91gfd/31%
RONF 2 - 5.41gfd/27%
NFNF 1-6.65gfd/38%
NFNF 2-6.29gfd/41%
NFNF 3-7.05gfd/39%
Cos
t ($/
kgal
)
Energy O&M Component Non-Energy O&M ComponentCapital Cost
Double Pass NF NFDouble Pass RO NF

InflationInflation
Produced water cost can more than double Produced water cost can more than double over project lifeover project life Historical increase of 3% for goods (Historical increase of 3% for goods (www.bls.gov
)) Energy increased by 4%Energy increased by 4%
• Inflation projection for energy from historical dataInflation projection for energy from historical data
3535
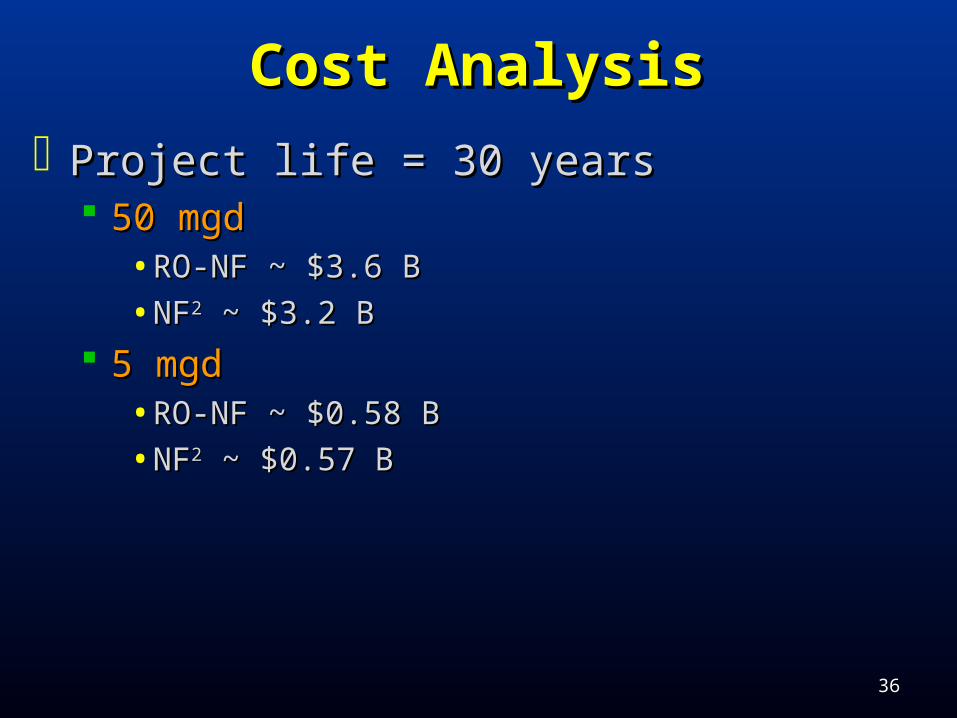
Cost AnalysisCost Analysis
Project life = 30 yearsProject life = 30 years 50 mgd 50 mgd
• RO-NF ~ $3.6 BRO-NF ~ $3.6 B
• NFNF22 ~ $3.2 B ~ $3.2 B
5 mgd 5 mgd • RO-NF ~ $0.58 B RO-NF ~ $0.58 B
• NFNF22 ~ $0.57 B ~ $0.57 B
3636

CostsCosts
ADC model usedADC model used Inputs modified to include research findings
Size of facility has significant impactsSize of facility has significant impacts Scaling down from 50 mgd to 5 mgd can increase
cost up to 100%
Sensitivity analysisSensitivity analysis Membrane life, power, interest rate, project life Most sensitive to interest rate and power
Cost of desalinated water (2010)Cost of desalinated water (2010) $1,350/AF for NF2, $1,640/AF for RO/NF (50 mgd) $2,454/AF for NF2, $2,496/AF for RO/NF (5 mgd)

Next stepsNext steps
??
Report for USBR in printReport for USBR in print

Research Presentations

www.lbwater.orgwww.lbwater.org
Questions?