
LBEX-SIPA 006539 - web.stanford.edujbulow/Lehmandocs/docs/SIPA TRUSTEE/LBEX...r OJ m ~ (f) "'U )> 0...
14
LBEX-SIPA 006539
Transcript of LBEX-SIPA 006539 - web.stanford.edujbulow/Lehmandocs/docs/SIPA TRUSTEE/LBEX...r OJ m ~ (f) "'U )> 0...

LBEX-SIPA 006539
r OJ m ~ (f)
"'U )> 0 0 (j) 01 ~ 0
--- ---~-----------------------;
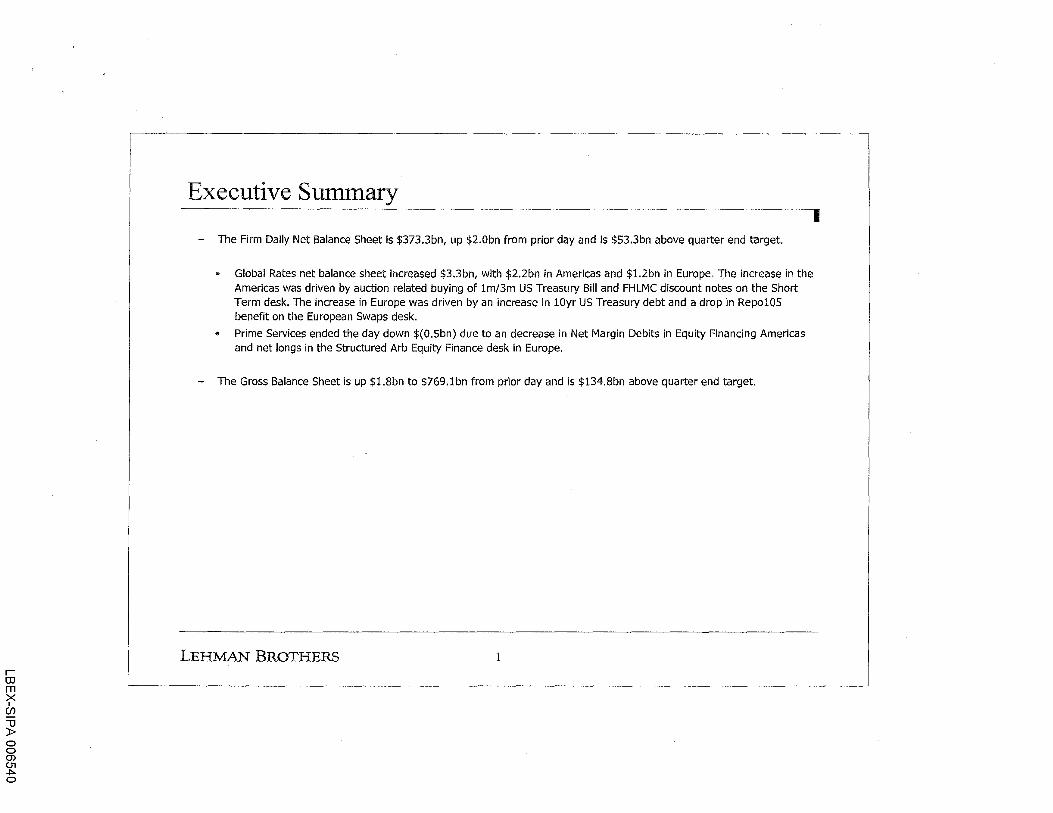
Executive Summary
- The Firm Daily Net Balance Sheet is $373.3bn, up $2.0bn from prior day and is $53.3bn above quarter end target.
Global Rates net balance sheet increased $3.3bn, with $2.2bn in Americas and $1.2bn in Europe. The increase in the Americas was driven by auction related buying of 1m/3m US Treasury Bill and FHLMC discount notes on the Short Term desk. The increase in Europe was driven by an increase in lOyr US Treasury debt and a drop in Repo105 benefit on the European Swaps desk.
" Prime Services ended the day down $(0.5bn) due to an decrease in Net Margin Debits in Equity Financing Americas and net longs in the Structured Arb Equity Finance desk in Europe.
- The Gross Balance Sheet is up $1.8bn to $769.1bn from prior day and is $134.8bn above quarter end target.
LEHMAN BROTHERS
I
r OJ m ~ (f)
"'U )> 0 0 (j) 01 ~ ......
I -- -- I
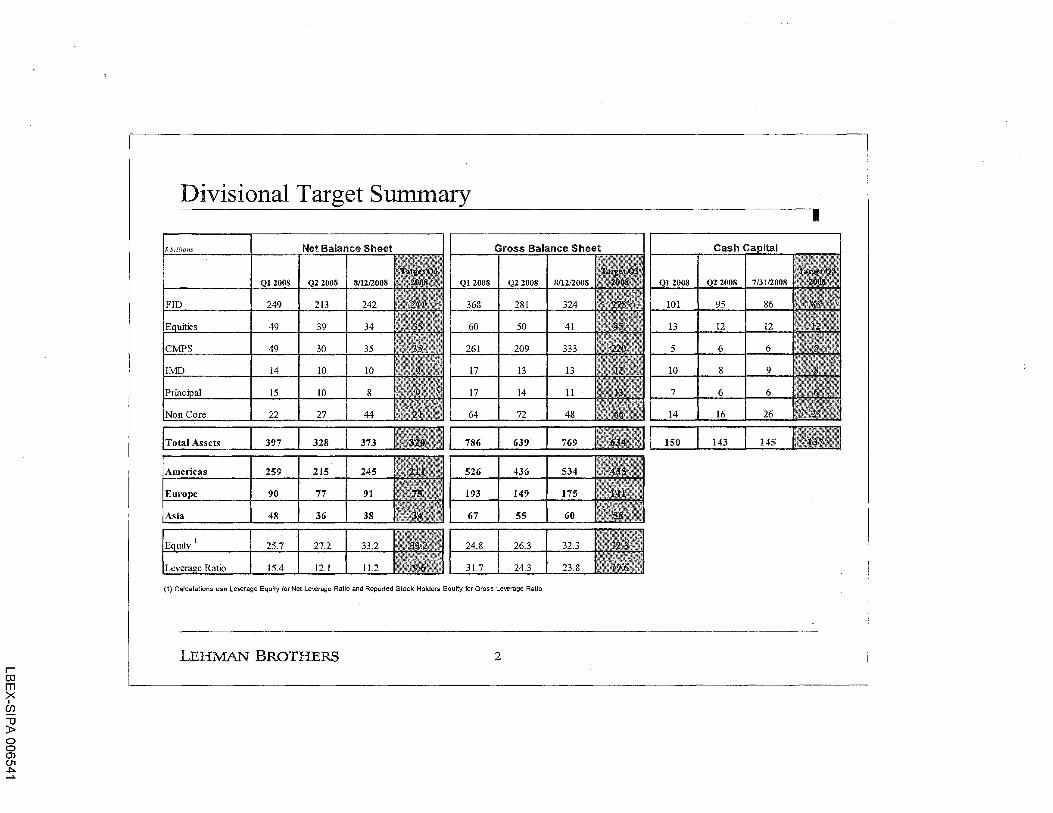
Divisional Target Summary I
Net Balance Sheet
30 I 35
10 I 10
10 I 8
15.4 I 12.1
(1) Calcalations use Lewrage Equity tor Net Leverage Ratio and Reported Stock Holders Equity for Gross Leverage Ratio
LEHMAN BROTHERS 2

r OJ m ~ (f)
"'U )> 0 0 (j) 01 ~ 1\J
I
Scorecard- Global
CONSOLIDATED NetBal;>nce Sheflt USOm1lliorn Cunent OaU Tar et Varlano:e Final Final
"'"""' Cl>o • .... QJETa • .... Q1'Q8
I Global Rates 14,76J 3,~ 52,500' 22,283 37,938 52,010 ~Grade Credit 9,916 8,500 1,416 8,600 11,335
8,417 ,,000 "7 7,619 8,000 SecuntizedProducts 55,,
": 44,500 10,849 57,435 65,135
Real Estate 55,252 55,000 262 58,242 64,969 High Yield 11,514 12,000 t4l"li) 15,047 14,599 Municipal Bonds 6,274 6,000 274 6,047 9,485 EnergyTradll'lQ 8,562 6,000 662 5,50< 3,716 Foreign Exchange 3,929 " 5,000 (1:''1) 4,171 6,348 FlO Corporate 1,551 4,000 •.?,<'Ail 2,973 2,244 FIDCorpLoans 2,882 3,000 (":1~; 3,705 3,299 lBO Loans 3,,.,
2,~; 3,500 :cn1 5,559 6,994 TotaJF/DCCie 241,788 210,000 31,788 212,897 248,130 TOlal FlO Pnme Sel'\llcss: 9,812 .274 5,500 4,312 3.283 11,351
TotaiFID(Consolldat•dl 251,600 2,815 215,500 36,100 216,180 "''""" Exec..-tlonSeNees/Liqo..idMarkm 6,"' " 7,356 9,261 CofM!rtible Products 1,397 . ..,-;- 2,153 2.743 Volat1my 20,28.9 23,150 29,219 Equ~ies StrategieS 2,759 d:?i 2,187 4.221 FirmRelatlonsh•pLoans 2,393 " 3,586 2,762 EqwtyCorporate '" ,n 4" '" TotaiEqiXIIasC:Y~ 33.637 c:::•t; 35,000 '\-~,,~, 38,862 48,768
TotaiEqUI!rtuPrim&Ssf'llcas 25,514 .,.,.~ 29,SW ·, ~.·lrlili 26,226 37,203
Tota!Squltln(Conwlldated) 59,151 (1,C1f:.: "'"'I !S,$.t, "·- 85,971
GlobaiPnncipaiStrategies 1,319 ;'!i 1,6ool 1,601 7.184 GlobaiTradwgStrategiee 4,529 ::<; 5,800 4,644 5,4;:14 GlobaiOpportUf1~1esGroup 1.106 1,200 979 942 DlrectPrinclpelln...-.slments 1,353 0 400 2.332 ''"" To<WPnncrpaJinvestmg ,,306 :_,.., 9,000 ::>:¥> 9,055 14,665 Asset Management 3,955 ;~:; 3,714 242 4,073 6,369 PI"M!teEquity '"6 2" 5,374 352 5,649 7,326
To<ai!MD 9,691 "4 9,"" 593 9,722 13,$95 Tctaii'Jcn..Coia 44,606 22.000 22,606 27,227 22,862
TotaiAJiother(Consolidlll•dl ..... '" 40,,. , .. "·"" 51,221
Gr11nd Totai~Consolld!'lled "'''"' ""' 320,088 63,257 327,773 3:96,674
Uqu,c!Mali<etsFinancir.g 6, ... "' ,,., 6,;;: 696 6,983 C<edtFmanc1ng 1,731 55 903 1,270 CleanngandExe!CLJtlon "' 2 t,~ 22
0 27 FIDStructl/iE"C!Transactions "' 0 2.: ~~:~~ '"' 233 FlO Futures ,,.. 0 ,,333 2,838
TotaJF/OPnmeSefVrcas 9,812 274 5,SW .:;;~ 3.263 11,351
Equ1tyFinancing 17,407 lf!('1
2:::!/ _';;i 18,929 29,330
EqurtySynthetie 7,881 " 6,856 7,658
~=~~e~~!~e:o~~': "' 5 4 3 405 0
"" "6 436 2" EqurtyFU:ure!i 0 0 "~ ,,,~~. 0 0
Tcta!E.quttie.sPnmaSsrvices 25,514 [!"•'il) 26,226 37,203
Total Prime Servie.s 35,327 I$W 35,000' m ,,.,. "'·"' r•M•y1,- ~
~ ~~ Stockhalders'Eqt.~ty(asreported) 32.340 26,276 24.~2 ewragaEquJ\y(SubjectToUmrts) 33,197 27,179 25,696
Gross Lewrage External (Tolaf Assets I SE) 19.6 24.3 31.7 NetLewra NetAssets/LIMlra Equoty 9 .• 121 15. 11\l>.""""n"'mT"r...,.lo.
LEHMAN BROTHERS
TradablelonglnveMo atRlslc CtJrrenl Oall Final
811:212008 Chane .... 33;;
56,006 18,052 8,934 7,294 1,935 ;: 2,747
37,623 40,325 44,243 :':h 47,521 11,018 12,968
2,133
,}~ 2,754
~;~I '" 1,490
:'"''1 0 ;~,::.:-~.;
2,882 3J05 3,349
2,:~ 5.558
171,654 141,442 7,581 1,278
179,236! 3,287 142,720
""I 5,117 1:374 2,112
'~::;I ~', 11,289
1,682
2,~~ ~.586
'" 21,650 :; 23,916 11,315 12.273
32,965 ~~~ 36,189
1.319 d~\
,,,., 4,394 4.318 ,,043 ;~; 945 1,353 0 2,:W7 8,108 '""' 9,038 1,673 i:sj 1,978 5,405 '" 6,"' 7,278 2" 7.367
24,080 ('{l). 8.370
"·"' '" 24,n5
251,0051 "" ""'"' "' 660
;:;;:I ':J) 522
" 0 0
" 0 '07
:~1 0 0
520 1,278 •,);;;, 6,213
' 6,114
' 0 0 ~~j 0
11.316 •.4<)'.) 12,273
18,1.196 "' 13,552
3
I Gro ... BalartceSheet casnca ltal
Final Curn:>nt 0.11 Tat et Variance Flr>al Final curre111 T:u et V;>ri:mc;e Final Final Q1'08 811212003 Cha • Q3'08 QIETou. .... Q1'08 7/31/2008 Q3'08 QJETa, .... ., ..
,,0~ '::~: 88,185 i 10,359 8,367 ;!7,661 141,604 101,000 153.~ 8,441
9,834 12,341 11,000 10,884 14,620 2,541
I
2,057 '"" 3,610 8,565 9,000 ,:'''" 7,785 8,175 3,688 2,922 4,S31 47,017 5ti,984 ,;; <>,ooo 61,2$2 68,073 13,771 17,06ll 14,982 54,576 56,885 55,000
:~ 59,852 65,880 34,631 34,728 42,067
14,223 12,369 ; 14,000 16,219 16,205 7,836 9,363 10,546 3,586 6,706 6,000 6,459 10,231 660 1,214 "' "' 8,853 6,000 5,&47 4,002 1,856 1,115 1,004 2,541 3,945
:~ 6,000 :;.;; 4,487 6,351 1,398
I 1,391 2,357
"6 9,034 11,750 10,237 9,121 8,160 12,498 12,6&4 3,m 2.921 3,260
,~'E 3,744 3,339 2,"" 1,754
6,9$4 3.358
4;~ 4,000 5,567 7,003 4" 590 1.125
174,372 323,354 2n,ooo 200.559 366,796 90.077 83,0001 3,077 95,062 101,231 1.206 238,34S 110,000 89,786 132,145 1,879 2,000 \ ·~·; 2,265 1,751
i 175,577 561,70$. '·"" 307,000 174,700 370,346 4SB,941 "·"' ] '"' 97,326, '"""'
6,900 8.356\ :; 11.481 14,881 1.069 1,239\ 1,175 2,611 1,929! 2.817 3,337 "' "'I 42'
17,105 2!:~~! I 27.770 33,159 5.854 5,813i 7.812
3,"" ··;; 2,979 5,351 622 4401 939 2.782 '"'· 3,586 2,782 0
3.935! 96 ass! ,:;. 1,361 647 4,177 2,634
32,678 41,230j 45,000 --· 49,994 60,356 12,165 "' 11,742! 12,9a1 14.806 94.520' ... :,,. 110,000 i"C' 4~C~ 119.354 128,395 3.897 3.0001 697 3,4151 3.423
i 47,485 135,7501 {2,&f'1; 156,000 !~9.2!;'(:; 169,348 188,751 ''"" 14,500! '·"" 15,158\ ,. ..... 7,115 3,480) ((f; 6,000 5,808 8,636 1.392 1,5761 4.018 5,333 4,770] p;<; 6,100 4.963 5,946 2,788 l 2.;;~ I 2.196
679 1,2491 2 1,500 1,127 ,,066 4" 5'3 ,,,. 1,353! 0 400
:•;;:' 2,332 1.084 ,,345 ! 1.430! 394
14,381 10,852! (2.::>; 13.000 14,229 16,734 6,006 6,0001 6 6,281[ 7,121 4,159 6.95~ I Cii5. 6.977 7.101 9,449 3,933 3,569! 3.881 6,125 5,943! 2" 5.374 _;:: 5,864 7,640 4.794 ::~:1. 5.789
10,284 ~~::~ l 206 12,351 12,965 16,989 8,727 s.ooo\ 727 9,670 4,590 \11 67,000 "'""'' 72,543 64,620 26,109 23,0001 3,109 15.511! 14,036
"·"' 71678' ! "' "3" r.zo,$7.", 99,737 ....... 40,642 37,0001 '"' 30,1571 30,6%7
25:Z,31B 769,137i 1,S:z9 11'34,$1 134,786 639,431 ""·"" 144,8&0 ,.,5001 .,.. 14%,841 150,223
"' 199,968! 4.232 76,600
":,:~ 58,356 92,264
676 31,751j 15~ 25,500 25,711 31.425 <,0<0 ,,,., 1,326 27 221 0 0 59 I "' 289i 500
;~Ji~ 252 340 232 ' 279 "' 0 6.316; 0 7,500 6,467 8,067 j
::E 1,206 2~::! \~·~r
110,000 89.786 132,145 1,879 2,0001 .. ·,, 1,761 8,131 ,.,., 104,604 114,849 2.347 1,450 6,522 12,889! (·•: 15,000
"''~ 13,555 13,328 1,550
I 1,969
0 :.1 : 0 5 4 ' ' 4
"3 500 '"; 1,1~ 21~ 0 " ·-~ 0
14,806 94,5201 ""'
110.000 ·····"' 119.354 128,395 3,897 3,0001 697 ,,,, 3,423
16,012. 332,8BS! .,,.., 220,000 11%,865 2.09,141 2<>0,640 <n< '·""' ns 5,680i .,..,

LBEX-SIPA 006543
r OJ m ~ (f)
"'U )> 0 0 (j) 01 ~ ~
1-- -~
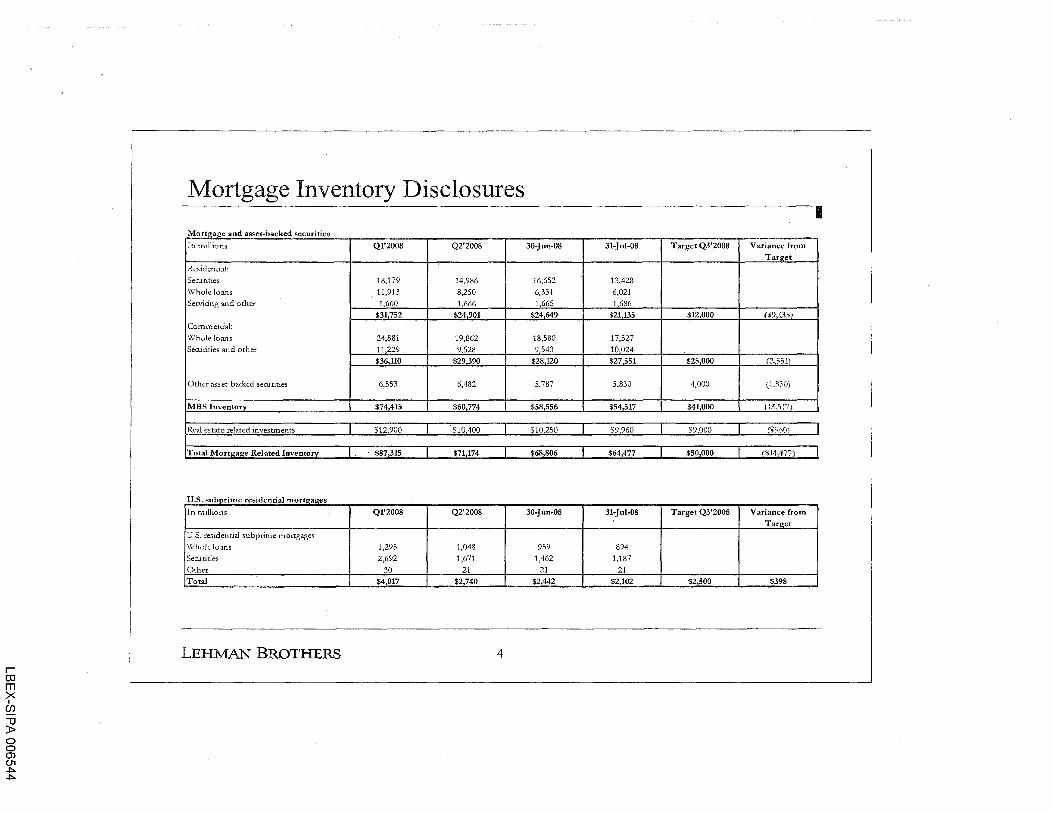
Mortgage Inventory Disclosures I
M .._,.._ ... ~ ..... "- A.IA d -- b ----d .,.._~ .... ••u ... <>
In millions Q1'2008 Q2'2008 30-Jun-08 31-Jul-08 Target Q3'2008 Variance from
Taqtet
Residential:
Serurities 18,179 14,986 16,652 13,428
Whole loans 11,913 8,250 6,331 6,021 Servicing and other 1 660 1 666 1,665 1 686
$31752 $24 901 $24 649 $21135 $12 000 ($9 1351
Commercial:
\X/hole loans 24,881 19,862 18,580 17,527 Serurities and other 11229 9,528 9 540 10024
$36110 $29,390 $28120 $27 551 $25 000 (!, 55.1.)
Other asset-backed seauities 6,553 6,482 5,787 5,830 4,000 (!J{'dj)
MBS Inventory $74 415 $60 774 $58 556 $54 517 $41000 (LH17)
Real estate-related investments j_ $12 900 I $10 400 J $10 250 I $9 960 I $9 000 I (S9601
Total Mortgage Related Inventory $87,315 I $71,174 $68,806 I $64,477 I $50,000 ($14,477) I
u.s ------- ---------------------------In millions Q1'2008 Q2'2008 30-Jun-08 31-Jul-08 Target Q3'2008 Variance from
Tar2:et
U.S. residential subprime mortgages
Whole loans 1,295 1,048 959 894
Serurities 2,692 1,671 1,462 1,187
Other 30 21 21 21
Total ___ $4,017 $2,740 $2,442 $2,102 $2,500 $398
LEHMAN BROTHERS 4
r OJ m ~ (f)
"'U )> 0 0 (j) 01 ~ 01
-~ -- -- --~~1
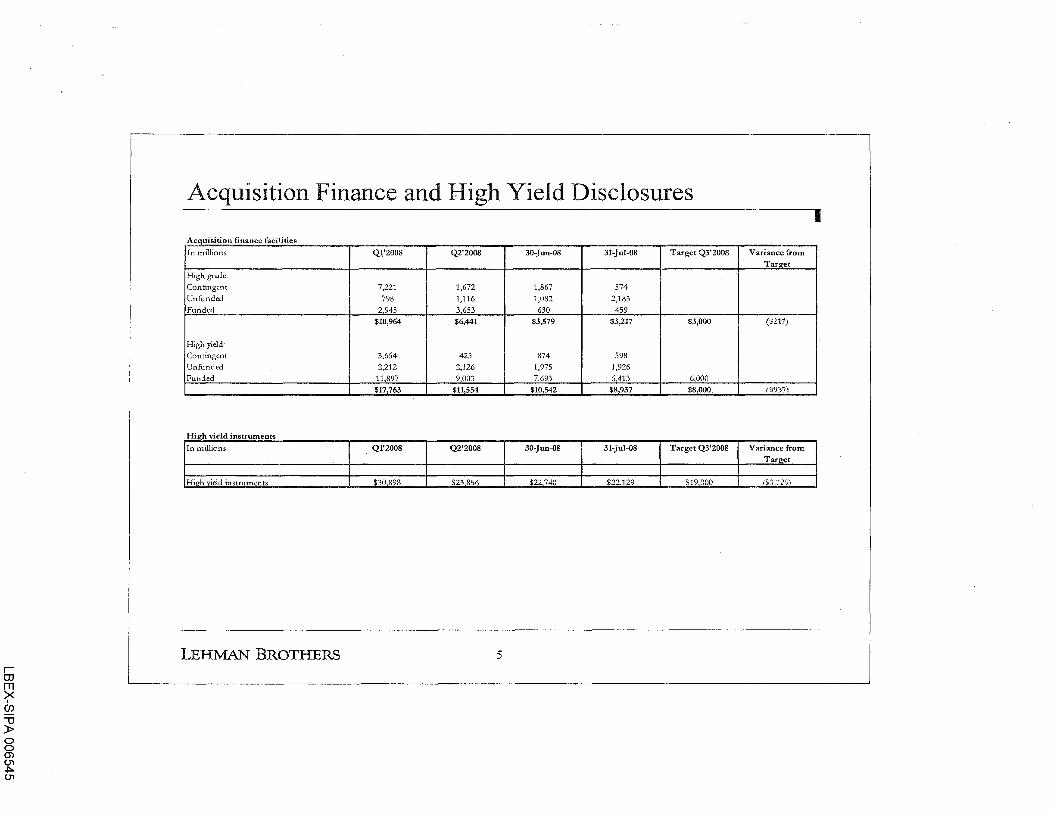
Acquisition Finance and High Yield Disclosures I
--- ----------------- ----~-----
In millions Q1'2008 Q2'2008 30-Jun-08 31-Jul-08 Target Q3'2008 Variance from Tar2:et
High grade:
Contingent 7,221 1,672 1,867 574
Unfunded 798 1,116 1,082 2,183
Funded 2 945 3 653 630 459
$10,964 $6,441 $3,579 $3,217 $3,000 ($217)
High yield:
Contingent 3,654 425 874 598
Unfunded 2,212 2,126 1,975 1,926
Funded 11 897 9 003 7 693 6 413 6 000
$17 763 $11554 $10 542 $8 937 $8000 ($937)
Hi2:h vield · ............. -. ............... In millions Q1'2008 Q2'2008 30-Jun-08 31-Jul-08 Target Q3'2008 Variance from
Tamet
Hi~h vield instruments $30 898 $23 856 $22 740 $22129 $19 000 f$.;.1 :?.~/)
LEHMAN BROTHERS 5
r OJ m ~ (f)
"'U )> 0 0 (j) 01 ~ (j)
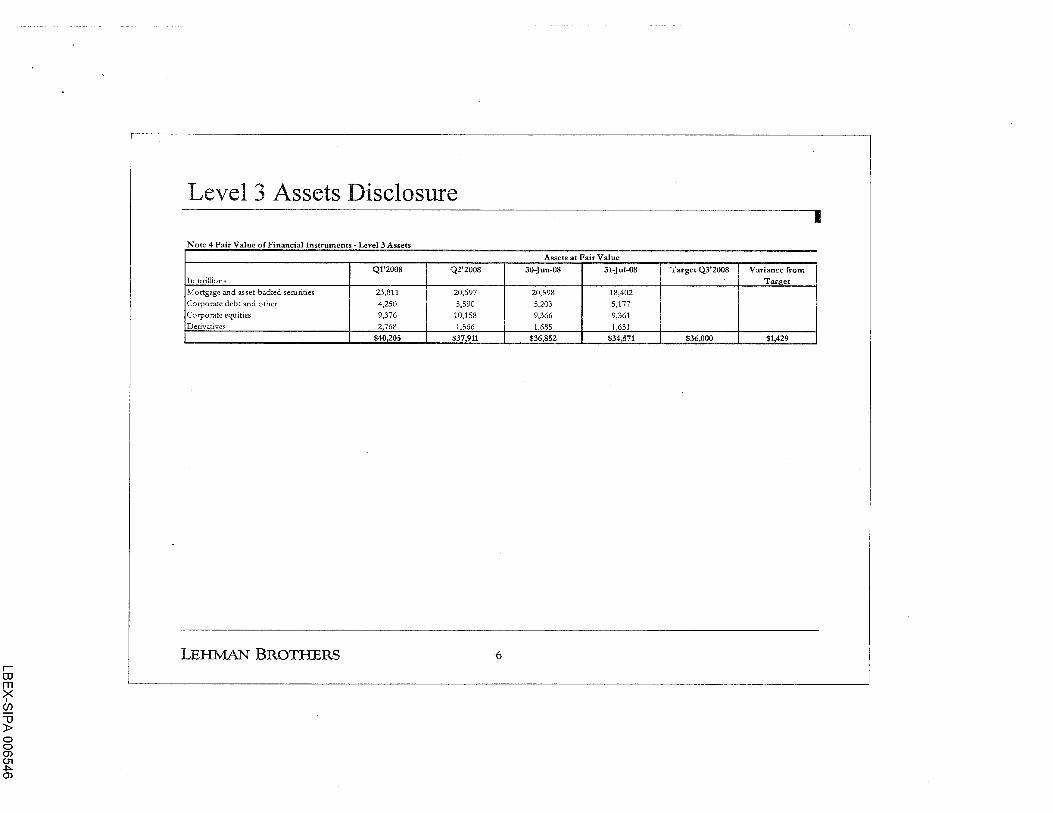
Level 3 Assets Disclosure
Note4FairVal fFi · l Instruments - Level 3 Assets ......... ~ ,._ .................
Q1'2008 Q2'2008 In millions Mortgage and asset-backed serurities 23,811 20,597 Corporate debt and other 4,250 5,590 Corporate equities 9,376 10,158 Derivatives 2 768 1 566
$40,205 $37 911
LEH:MAN BROTHERS
I
Assets at Fair Value
30-Jun-08 31-Jul-08 Target Q3'2008 Variance from Tar,et
20,598 18,402
5,203 5,177
9,366 9,361
1 685 1 631
$36,852 $34 571 $36 000 $1429
6
LBEX-SIPA 006547
r OJ m ~ (f)
"'U )> 0 0 (j) 01 ~ (X)
------------ I
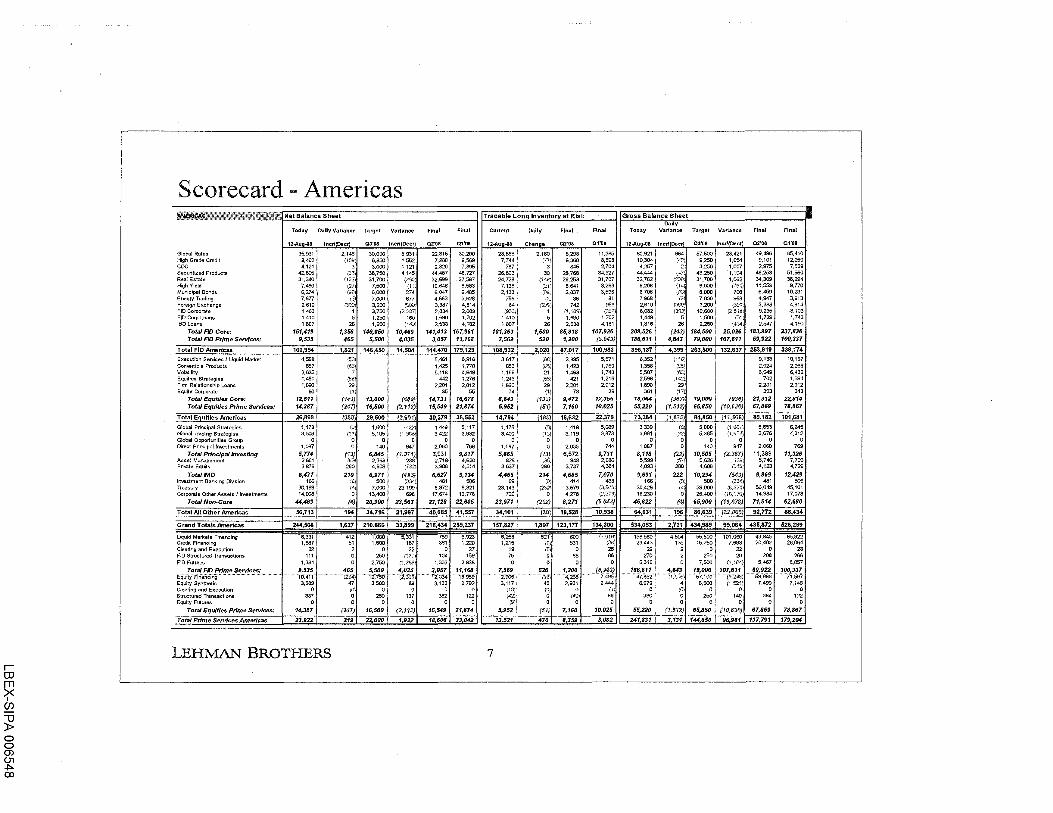
Scorecard - Americas ~~tfL%£li%:~~:g- ;~~tJP:~%'01 Net Balance Sheet II Tradable Long Inventory at Risk II Gross Balanc~~~~eet --- -,.
Today OallyVariance Target Variance Final Final Curre-nt Dally Final Final Today Variance Target Variance Final Final
12-Aug-08 lncr/(Decr) Q3'08 lncrf(Decr) Q2'08 Q1'08 1Z...Aug..Q8 Change Q2'08 Q1'08 UAug-08 lncr/{Deerj Q3'08 lncri(Decr) Q2'Q8 Q1'08
G!obal Rates 35,931 11 2,_1~ 30,~! 5,931 22,315 30,200 28,865) 2,1_~~- 8,298 11,365 80,921 ~ 57,500 j 23.421 49,496 85,410
~~~~de Credit ::~ (HY: ::~ ~:~;~ ~:~~ ~:;: 7,~~ i . o·;i 6,~ ~:~0: 1~:~; (4: ;:~I ~:~ ;:~~~ 1~:~ Secootoed P<oduot< 42,895 _{~<, 36,750 I 4,145 44,467 46,727 26,693; _3D 26,766 34,927 44,444 _;: 43,26DJ 1,194 46,253 51,560
~~~- ~~~~te 3~:: ~~?.1 3j:~~ j (::::~? ~~:= 3~::~ 2j:~: ~ ;~~~~~ 2;:~; 3~:~~ 3~:~ (~: 3~:;:! \~; ~:~~ 3::~ Mun1cipaiB~nds 6,274 'I (:i~ 6,000 I 274 6,047 9,485 2,133 1 {~·:~~ 2,837 3,596 6,706 \1 6,000! 706 6,459 10,231 Energy Trad1ng 7,677 . \t": 7,000 677 4,663 3,628 756; '{2:) 38 81 7,968 7,000 i 968 4,947 3,913 Foreign Exchange 2,610 r~u: 3,200 . t:YJ,>! 3,387 4,814 '~-; t3::.:)': . 7~~- .~:, 2,610 3,200) . ..,\;._y:; 3,388 4,814 FlO Corporate 1,463 3,750 I (.?:.?.137• 2,834 2,089 19c...1Ji 1 :,1, 1U:1J '·'·'''; 8,082 g: 10,6001 (~ ... ,1~: 9,235 8,103 FID Corp Loans 1,410 -~ 1,250! 160 1,690 1,702 1,410! 5 1,690 1,702 1,449 _: 1,500 ,
1
• 6o; 1,729 1,743 IBDLoans 1,807 26 1,950~ (~4~l) 2,538 4,182 1,807! 26 2,538 4,181 1,816 26 2,250! ;43t.; 2,547 4,190
Total FID C~re: • 151,4191 1,356 140,950 ! 10,469 141,413 167,961 101,363 j 1,500 85,818 107,926 209,526 {24j) 184,500 I 25,026 183,997 237,836 Total FID Prtme Setv1ces: 9,535 465 5,500 j 4,035 3,057 11,168 7,569 j 520 1,200 (6,943} 186,611 4,643 79,000 i 107,611 69,922 100,337
Total FID Americas 160,954. 1,821 146,450 14,504 144,470 179,129 108,932 i 2,020 87,017 100,983 396,137 4,399 2&3,500. 132,637 253,919 338,174
Execution Sel"\ices I Uquid Market Conwr1ible Products Volatility Equities Strategies FiiTTl Relationship Loans Equity Corporate
Total Equities Core: Total Equities Prime SetVices:
Total Equities Americas
Global Principal Strategies Global Trading Strategies Global Opportunities Group Direct Principal lnwstments
Total Principal Investing Asset Management Pri\ete Equity
Total lrfD lm.estment Banking Di'.ision Treasury Corporate Other Assets /Investments
Total Non--Core
Total AU Other Americas
Grand Totals Americas
Uquid Markets Financing Credit Financing Clearing and Execution FID Structured Transactions FlO Futures
Total FID Prime Services: E'i:jLifiY .. Fiii"iifiCi"ng··· ············ Equity Synthetic Clearing and Execution Structured Transactions Equity Futures
Total Equities Prime SetVices:
Total Prime Services Americas
4,598 15:l\ I 5,451 6,916 3,617! ~,Fli) 3,885 5,571 6,352 {1.~~ 9,133 10,167
3,~ 16~1 ! ~:~~ !:~~ 1,~; ';;} ~:~; ~:i: ~:;s~ . ;~ ~:~ ~:~; 1,451 (S8) I 442 1,276 1,243 i (':X.<.i 421 1,216 2,596 li:: 702 1,594 1,890 29 ' 2,201 2,012 1,890! 29 2,201 2,012 1,890 ~ 2,201 2,012
80 (1) l 85 5S 74 : {1} 78 39 361 ·- (_1? 303 343 12,511 (141} 13,000 ! (4$9j 14;731 16,678 8;843 i {133} 9,472 12,355 18,064 .. (:~~~ 19,000 (!135) 21,312 22,814 14,387 {247) 16,500 i 12, 113! 15,549 21,874 5,952 j {51! 7,160 10,o25 55,220 rt:st:i, 65,8S<J rw,sso; 67,869 78,867
26,899 {388} 29,500 i £2,601} 30,279 38,552 14,794 1 f1<J3} 16,632 22,379 73,284 (1,87$1 84,850 (11,5'l}S) 89,182 101,681
~:~ ,;~: ~:~~ 1 ,,<;;~; ~:~ ;~~~ ~:~I (;~; ~:i~~ ;:~~ ;:~~! ,~: ~:~ 1 r: ~~; ;:~~ ::;;~ 1,oa1 o 140 l 947 2.060 769 1.oa1 i o 2,035 744 1.os1 o 140 I 947 2,oso 769
s.n• {11! 6,845 'I (1,071.! 6,931 9,817 5,665 '_ (1SJ 6,572 9,711 8,118 (22J 1o,5o5 ·1
: rz,~!E 11,389 11,326 2,601 :o-<::i 2,363 238 2,718 4,620 828\ t.~S; 948 2,686 5,599 ;s·., 5,626 5,746 7,7oo 3,876 280 4,608! (; ... t!::} 3,908 4,514 3,637! 280 3,737 4,384 4,093 280 4,608 ! 4,123 4,729
6,4n 210 6,971 ·~- (49SJ 6,627 9,134 4,465 ; 214 4,685 1,010 9,691 222 10,234 ! (543J 9,869 12.429 166 :q 5oo (::-"!..%) 481 506 99: {O; 414 438 166 ::n; soo 1 p.~; 481 506
30,199 14) 7,000! 23,199 8,972 9,321 23,143! (2.2:;:> 3,579 ("3Jbi..V.}f 30,426 !4) 39,000 l (~.5!.4) 56,049 45,101 14,098 0 13,400! 698 17,674 12,778 729 j 0 4,278 C/.,~~7!)) 16,230 0 26,4~ j (hi.17t"l) 14,984 17,073
44,463 {4) 20,900 I 23,563 27,128 22,605 23,971 i (2:32) 8,271 (5.1U3} 46,822 (4} 65,900 I (19,078} 71,514 62,680
56,713 194 34,71&: 21,997 40,685 41,557 34,101 i f30l 19,528 10,938 64,631 i 196 86,639 i (22,ooa) 92,nz 86,434
244,566 1,627 210,666' 33,899 215,434 259,237 ~
~:~~ l 4~~ ~:::I s.~~~ ~ ~:~ ~:~ 1~ ~ 2~ j i1~-~ 10~ 1;; i~
1,384 o 2,750 J n.~~o,;) 1,333 2,838 o
·fb~~~··· · ~~i ······f.~~~·t···· 12~x;,) . f~~ ~r~!ts~ ........ ...?~~~··1 3,~ ~~~ 3.sogj ~ 3,13~ 2,79~ 3,~~~~;
387 0 250 i 137 382 122 (47:)i o I o o ~ o o o {9)1
14,387 rur; 16,500 1 12. 113) 15,549 21,874 5,952 :.
23.922 I 219 22,000 I 1,922 18,606 33,042 ~
1,8071 123,1n 1 134,3oo
521 {0)'
{OJ' D 0
520 (:j',l)
45 (0; D D
(Sf}
470
600 531
D .. D
.... 1~.~<!!! .. ~ .. 4,266 2,931
0 {4\!)
D
7,160
8,359
u.om {3G'
25 66
D
{6,943) . 7,"495
2,444
66 D
10,025
3,082
534,053 1 2,121 I 434,989 I 99,0641 435,872 I 52s,zss
156,560 i 23,443 i
22' 270!
6,316 i
· ··· 1·~1t~a1s~·f 6,979!
3~1 0!
55,220 i 241,831
4,504 135
2 2 D
·1~~11 \0}1 0 0
(1.512}
55-,-!illOT101 ,060 15,7~ j 7,6~
250! 20
7.500 1 ('.'""''
t~~1~.f .. !~.~;~J}si 6,500 ! (1 '501>
,.g I ,.g 01 0
65,850 l (10,6JfJ}
3,131 1 144,85o i 96,981
43,845 20,402
0 206
5,467
69,922 ·····s~i".'SSS
7,4$9 D
364 0
67,869
137.791
65,922 26,064
26 266
8,057
100,337 . ...... 7(597 7,148
D 122
0
78,867
179.204
LEHMAN BROTHERS 7
r OJ m ~ (f)
"'U )> 0 0 (j) 01 ~ c.o
1... -~ ---~~ \
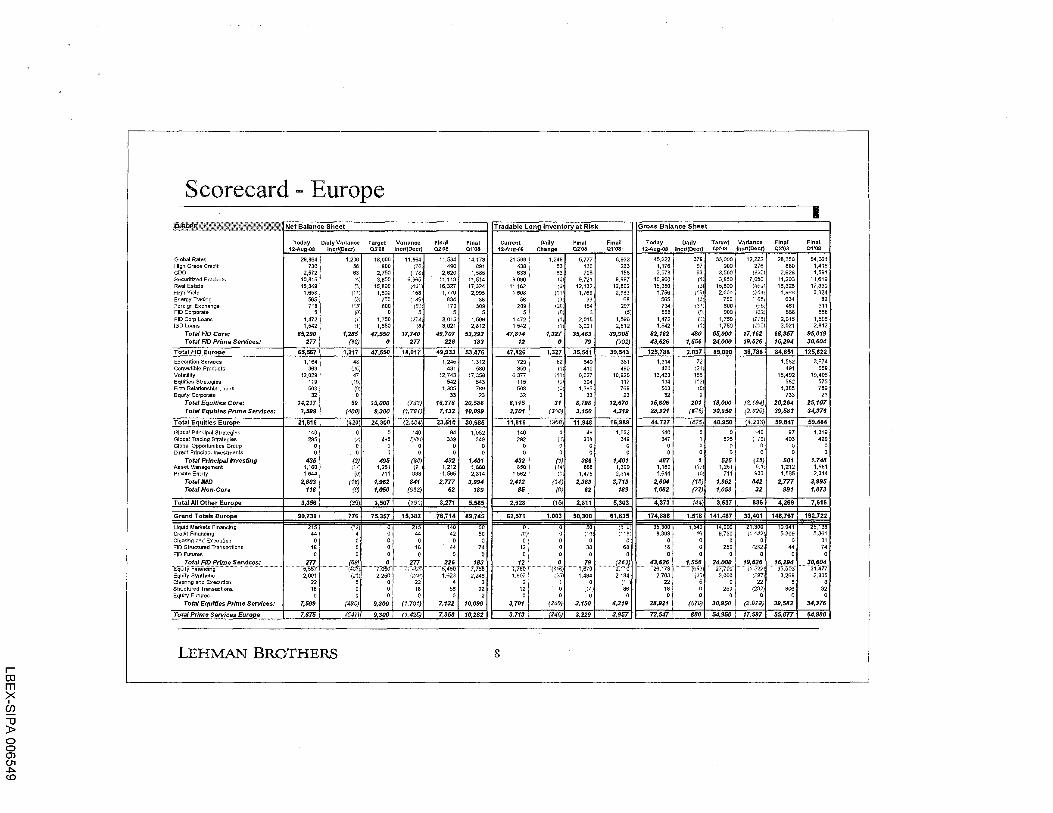
Scorecard - Europe I
Net Balance Sheet Tradable Long Inventory at Risk Gross Balance Sheet
Today Dally Variance Target Variance Final Final Current Dally Final Final Today Daily Target Variance Final Final 12-Aug-08 lncr/(Dect) Q3'08 lncr/(Decr) Q2'08 01'08 12-Aug-08 Change Q2'08 Q1'08 12-Aug-08 lncr/(Decr) Q3'08 lncri(Decr) Q2'08 Q1'08
Global Rates 29,864 1,206 18,000 I 11,864 11,534 14,173 21,599 1,249 5,777 8,933 45,2221 379 33,~~~ I 12,222 28,356 54,061
High Grade Credit 730 56 800 (10) 490 891 438 56 130 263 1,176 97 276 880 1,416 coo 2,572 63 2,750 !i78i 2,620 1,585 633 63 708 158 2,578 63 ~.sao! {~\!2\ 2,626 1,591 Securitized Products 10,815 !4) 3,850 6,965 11,113 11,514 9,090 '4' 9,721 9,997 10.900 I w 3,850 l 7,050 11,203 11,619 Real Estate 15,349 0) 15,800 :451) 16,327 17,324 14,162 \2} 12,132 12,802 15,350 {3) 15,8001 \4$1)' 16,328 17,330 High Yield 1,658 \ ~ 1) ,·;~~I 158 1,779 2,995 1,608 (11' 1,769 2,983 1,756 ~~ :;_; 2,000; (211·•: 1,966 3,324 Energy Trading 565 iJ) {l-35} 634 88 58 \3] 33 68 ~,!i (3) 750 I (1Qij0. 634 89 Foreign Exchange 718 iiSI 800 I (S:!} 170 309 209 ;:t.m 154 297 (3., 800 {136; 461 311 FlO Corporate 5 PI 0 5 5 5 5 (0/ 3 (5J a6al ("! 900 I (;~2) 868 868 FID Corp Loans 1,472 p; 1,750 '"':. 2,015 1,596 1,472 n: 2,015 1,596 ~:~;I ( =~ ~:~;~! rns; 2,015 1,596 IBD Loans 1,542 ~~; 1,550
17,7.:: 3,021 2,812 1,542 ~ 1 ) 3,021 2,812 (i; i:::Oe.) 3,021 2,812,
Total FID Core: 65,290 1,285 47,550 49,707 53,293 47,814 1,327 35,463 39,905 82,1621 480 6s,ooo I 11,162 68,357 95,01~ i
Total FID Prime Services: zn (SO) 0 2n 226 183 12 0 79 (.162} 43,626 ' 1,556 24,000! 19,626 16,294 30,604
Total FlO Europe 65,567 1,217 47 550 18,017 49,933 53,476 47,826 I 1,327 35,541 39,543 125,788 I 2,037 89,000 ! 36,788 84,651 125,622
Execution Sen.1ces 1,164 48 1,245 1,312 729 52 640 351 1,314 72
I
1,582 3,674 Conwrtible Products 369 I i:?t') 431 580 359 {"1) 410 490 400 (7,41 491 659 Volatility 12,029 47 12,743 17,358 6,377 111J 6,027 10,920 13,423 166 15,492 19,406' Equities Strategies 119 (~0) 542 543 115 {9) 304 117 134 r.~?\ 582 575 Firm Relationship Loans 503 iC) 1,385 769 503 ;0; 1,385 769 503 tO)
i 1,385 769
Equity Corporate 32 0 33 23 32 0 33 23 32 0 733 231 Total EquHies Core: 14,217 59 15.000 1 (783) 16,378 20,586 8,115 31 8,798 12,670 15,806 201 18,000 1 {2.194) 20,264 25,107. Total Equities Prime Services: 7,599 (4/JO) 9,300 (1,701.1 7,132 10,099 3,701 (340) 3,150 4,319 28,921 (<ilB) 30,950 1 (2.020} 39,583 34,376
Total Equities Europe 21,816 f420 24,300 12.484) 23,510 30,685 11,816 308 11,948 16,989 44,727. 47$ 48,950 4,223 59,847 59,484
Global Principal Strategies 140 0 0 140 94 1,052 140 0 48 1,052 140 0 I
140 97 1,319: Global Trading Strategies 295. Oi 495 qo~: 339 349 292 11} 338 349 347 1 s2~ I ("i78) 403
42~ I Global Opportunities Group o' 0 0 0 0 0 0 0 0 0 0 0 i 0 0 Direct Principal Investments 43~ I 0 0 0 0 0 0 0 0 0 0 0
sz: I 0 0 Total Principal krvesting {2) 495 (6~) 432 1,401 432 (1} 386 1,401 4117 1 {38} 501 1,748
Asset Management 1,160 I tFi 1,251 {91) 1,212 1,680 850 {14) 888 1,399 1,160 :Fi 1,251! 'p·j; 1,212 1,681 Private Equity 1,644 if;) 711 933 1,565 2,314 1,562 \OJ 1,475 2,314 1,644 tO) 711 1 933 1,565 2,314
TotaiiMD 2,8031 {18) 1,962 841 2,777 3,994 2,412 (14) 2,363 3,713 2,804 {18) 1,962 I 842 2,777 3,99~ I
Total No~Core 118 {0) 1,050 {932) 62 189 85 (V) 62 189 1,082 (27) 1,050 I 32 991 1,873
Total All Other Europe 3,356 20 3,507 1$1 3,271 5 585 2 928 fi51 2,811 5,303 4,373. {44 3,537 836 4,269 7 616
Grand Totals Europe 90,739 . 776 75,357 i 15,382 76,714 89,745 62,571 1,003 50,300 61,835 174,888 . 1,518 141,487. 33,401 148,767 192,722
Uquid Markets Financing 444 •,f:! ~~ ·~ ;~ ~~ (~>, ~~~) ;;;~ ·;:;;;j ·";~ ~:~~;I ·;:~~~
1
~:309 2;:;~~ Credit Financing 0 Clearing and Execution 1~ I 0 o 1 o 0 0 1~ I 0 0 0; 0
25~ i c;;~· 0 31 FID Structured Transactions 0 0 18 44 74 0 38 68 1~ I ~ 44 74 FID Futures 2;1 0
···· ···· r;osi I·· (i2.,;i; 0 0 0! 0 0 0 o I o 0 0
Total FID Prime Services: .... ~~8~ 226 183 12! 0 79 ..... ·f1~~ -~~~~~-·- ....... 1.!~~l; 2.~+?7~~ ~w~. 16,294 30,604
''E(jUJty··r:lfi3r!Cin·g-······································
. ;:~~~~ ........ :5;4-5iY ......... r;n;a ......... f,"'tSQ'T" ...... '{.~"it'Jj ·· ··,:·sr§ ·······~s:·s63. ......... 3.(417"
Equity Synthetic \·<~; 2.25g I i~~! 1,623 2,246 1.90~ 1 (2;' 1,484 2,134 3. 00~ 1 (2i~) 3,269 2,805 Clearing and Execution 4 3 0 {111 221 5 5 3 Structured Transactions
1~ I 0 56 92 12! a :1:!: 86 1~ I 0 25~ I (23:!) 806 92 Equity Futures
7,59: 0 9,3~1 0 0 0 0. 0 0 0 0 0 0 0
Total Equities Prime Services: (4$0) (1.701) 7,132 10,099 3,701 1 (:140) 3,150 4,319 28,921 I (676) 30,950 i (2.029) 39,583 34,376
Total Prime §i~ces Euroee 7,875 547 9,300! 11.425. 7,358 10,282 3,713 ! 340 3,229 3,957 72,547 ' 880 54,950 . 17,597 ss,8n 64,980
LEHMAN BROTHERS 8
r OJ m ~ (f)
"'U )> 0 0 (j) 01 01 0
I ---- ~- ~~- ---~ -~~---~ I
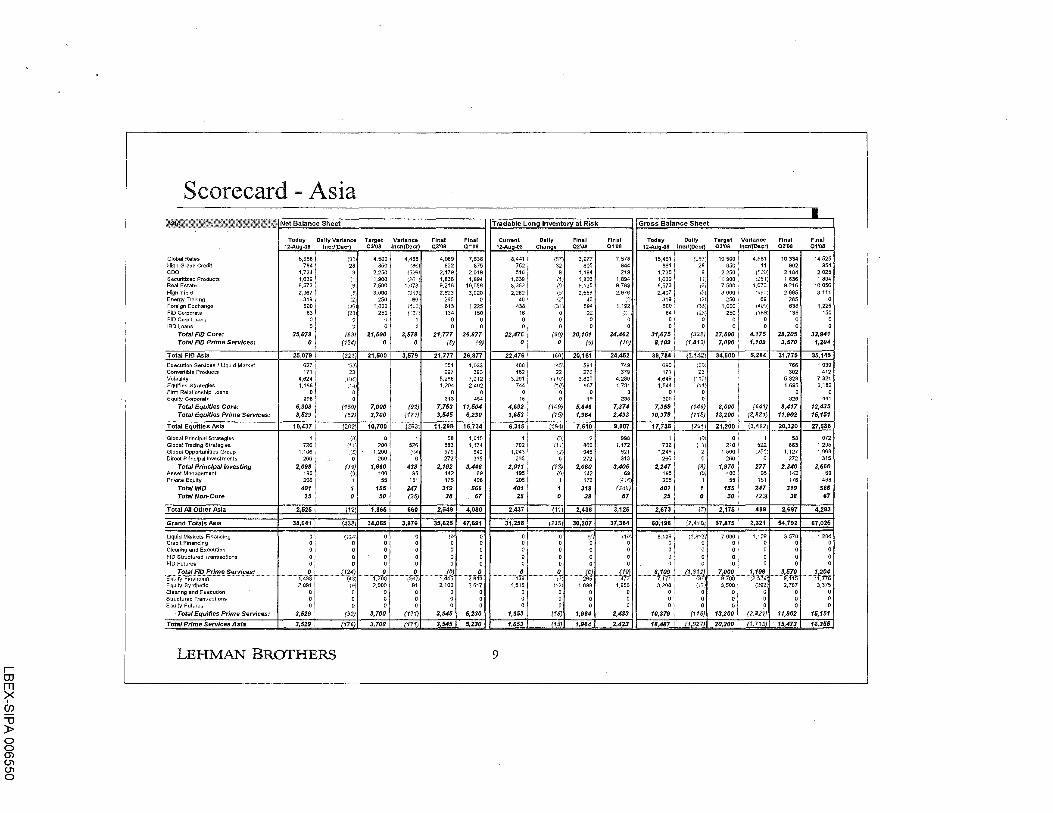
Scorecard - Asia A~!i'f@ !11
Global Rates High Grade Credit CDO Securitized Products Real Estate High Yield Energy Trading Foreign Exchange FID Corporate FlO Corp loans IBD Loans
Total FJD Core: Total FID Prime Serv;ces:
Total FlO Asia
Execution Se~ces f Liquid Market Convertible Products Volatility Equities Strategies Firm Relationship Loans Equity Corporate
Total Equities Core: Total Equities Prime Services:
Total ~rties Asia
Global Principal Strategies Global Trading Strategies Global Opportunities Group Direct Principal Investments
Total Principal Investing Asset Management Private Equity
Tota/IMD Total Non-Core
Net Balance Sheet
Today 12-Aug-08
8,988 784
1,724 1,639 8,573 2,367
319 600
83 0 0
25,079 0
25,079 l
627 171
4,624 1,188
0 298
6,908 3,529
10,437;
1 726
1,106 266
2,098 195 206
401 25
Dally Variance lncr/{Decr)
{G:5) 28
df>: {:;.3;
0 0
(Z2J)
0
{150) (52)
202
{0) ~~ n
i.~)
0
1 0
Target Q3'08
Variance lncr/(Decr)
4,500 850
2,250 1,900 7,500 3,000
250 1,000
250 0 0
21,500 0
21,500
7,000 3,700_1
10,700
0 I 200 1,200
260
1,660 100
55
155 50
0
3,579 0
3,579
--
263}
1 526 (9411
6
438 95
151
247 (25)
Final Q2'08
4,089 822
2,179 1,836 9,216 2,623
265 613 134
0 0
21,777 {Oj
21,777 651 297
5,288 1,204
0 313
7,753 3,545
11,298
58 883 979 272
2,192 142 176
319 38
Final Q1'08
7,638 875
2,019 1,894
10,056 3,020
0 1.225
150
0
26,877
M
26,877
1,033 393
7,212 2,402
464
11,504 5,230
16,734
1,015 1,174
942 315
3,446 69
496
566 67
Total AJI Other Asia 2,525 l (•12 1,865 660 2,549 1 4,o8o
Grand Totals Asia
liquid Markets Financing Credit Financing Clearing and Execution FID Structured Transactions FID Futures
Total FlO Prime Services: 'Eq'UiiY''Flfiaii·Clii'Q··········..,········· .. ····--········ ... Equity Synthetic Clearing and Execution Structured Transactions Equity Futures
Total Equities Prime Services:
Total Prime Services Asia
38,041 ' (433)1 34,065
0 '; (':';;<!\ 0 0 i 0 0 0 i 0 0 0: 0 0 0' 0 0
. ~·-~·-· ~..l... ... ...(g4) ........ o. 1,438 i (43) 1,700 2,091 i {9 2,000
~I ~ ~ 0 1 0 0
3,529 ; {52) 3,700
3,529 ! {17<Ji 3,700
LEHMAN BROTHERS
3,9761 35,625
0 lD->1 0 0 0 0 0 0 0 0
....... ~ .................. ..f9 •.. (2132i 1,445
91 2,100 0 0 0 0 0 0
(171) 3,545
_{171!1 3,545
47,691
0 0 0 0 0
0 ""!fiff3" 2,617
0 0 0
5,230
5,230
Tradable Long Inventory at Risk
Current 12-Aug-oS
Dally Change
Final 02'08
Final 01'08
9
8,441 752 516
1,639 8,352 2,282
40 438
16 0 0
22,476 0
22,_476 T
480 162
3,291 744
0 15
4,692 1,653
6,345 I 1
702 1,043
265
2,011 195 206
401 25
2,437!
31,2.58 i
:1
If·?) 32
;"'})1
\2}
0 0 0
{$0} 0
{60)
•45)1
22
i&4
:2}' 0
1 0
(11
3,977 805
1,194 1,836 9,135 2,558
40 594
22 0 0
20,161 (0)
20,161
591 279
3,800 957
0 19
5,646 1,964
7,610
2 860 945 272
2,080 142 176
319 38
2,436
235)1 30,207
7,578 844 219
1,894 9,783 2,976
\~ ~
1,192
0 0
24,462 (10)
24,452
749 379
4,280 1,731
0 235
7,374 2,433
9,807
998 1,172
921 313
3,405 69
;4 !i~}l
(348) 67
3,125
37,384
:I .~, 0 0 0 0
\1'>\' 0 0
0 0 1
~I o o o
.. "~I -~; 2~w ············· .. gf! 1,515j {~~ 1,699 1,956
~I ~ ~ ~ o 1 o o o
1,653 ' {15) 1,964 2,433
1,653 ! {15 1,964 2,423
Gross Balance Sheet
Today Dally 12--A.ug-os lncr/(Decr)
15,461 861
1,730 1,639 8,573 2,407
319 600
64 0 0
31,675 8,109
39,784
690 171
4,649 1,544
0 305
7,359 10,379
17,738
1 732
1,249 266
2,247 195 206
401 25
2,673!
60,196'
c.-:9:'!] 26
9 (;';
{0;} (5}1 t2\
1"_\:;)";i
1X<} 0 0
{329) '1,812)
{2.142)
0
(146) {115)
(2$1}
(i{!;i 0
(§) ((.f,
17
(2,410j
Target Variance Q3'08 Jncri(Oecr)
10,500 850
2,250 1,900 7,500 3,000
250 1,000
250 0 0
27,500 7,000
34,soo I
4,961 11
(520' 12i'J~)
1,073 iSt;J)
69
0
4,175 1,109
5,284
8,000 (541) 13,200 (2,221)
21 ,2oo r (3.4&2}
0 210
1,500 260
1,970 100 55
155 50
2,175!
1 522 i2f~ i
6
277 95
151
247 (25)
499
Final Q2'08
10,334 902
2,184 1,836 9,216 2,695
265 638 135
0 0
28,205 3,570
31,775
766 302
5,328 1,695
0 326
8,417 11,902
20,320
56 883
1,127 272
2,340 142 176
319 38
2,697
57,875 ! 2,321 1 54,792
8,10~ \ ;1.81~) 7,00~ l 1,10; 3,576
~~ ~ ~~ ~ ~ 0 i 0 0! 0 0
Y!:1l··u·~r{~; ·· Yf~l 11if~: ··Y~l· 0 I 0 0 I 0 0
~~ ~ ~! ~ ~ 1o,319 1 111s; 13,zoo i (2,s21; 11,902
18,487_1 __ (!;_!i'2( 20,200 ! (1.713!1 15,473
I
Final Q1'08
14,525 954
2,025 1,894
10,056 3,111
0 1,225
150
0
33,941 1,204
35,145 1,039
412 7,321 3,182
0 461
12,435 15,151
27,586
1,072 1,205 1,068
315
3,660 69
498
566 67
4,293
67,025
1,204 0 0 0 0
.. -:.~-~~~ 3,375
0
0
15,151
16,355

r OJ m ~ (f)
"'U )> 0 0 (j) 01 01 ......
Net Long Inventory Summary by GAAP Asset Class '' v' "u Ju • ., .. vmm.'''··M'~' ,,.u
Commercial Paper& Other Derivatives& Blank Money Market Other Contractual Adjustments I 1 Net Inventory Instruments Agreements
1,024 0 13,504 0 72,719 592 3,266 910 4 9,798 113 0 4,523 {15) 8,318 331 0 5,722 835 53,682
1,725 0 332 1,861 55,120 1,899 0 368 ta~:m 11,386
0 25 2,682 0 6,260 0 0 852 0 3 5,729 0 6,584 0 541 163 415 0 2,580 0 3,698
219 0 ~~_1l'j(l\ 8 0 41
1 17 0 0 0 1,253 2 0 0 0
0 0 0 19 0 0 25 0 63 0 0 0 0 9 0
1,254 44 0 92 0 57 4,738 0 163 29
13 35 6,474 0 636 1 0 2 0 0 0
!'}} 24
_____ 1) Blanks occur v.hen ~n adjustment is entered into GFS v.ithout sufficient product or asset categOI}' detail to create a GAAP asset class. Includes position and account level adjustments and Loan {Q adjust _______ _
LEHMAN BROTHERS 10
r OJ m ~ (f)
-u )> 0 0 (j) 01 01 1\J
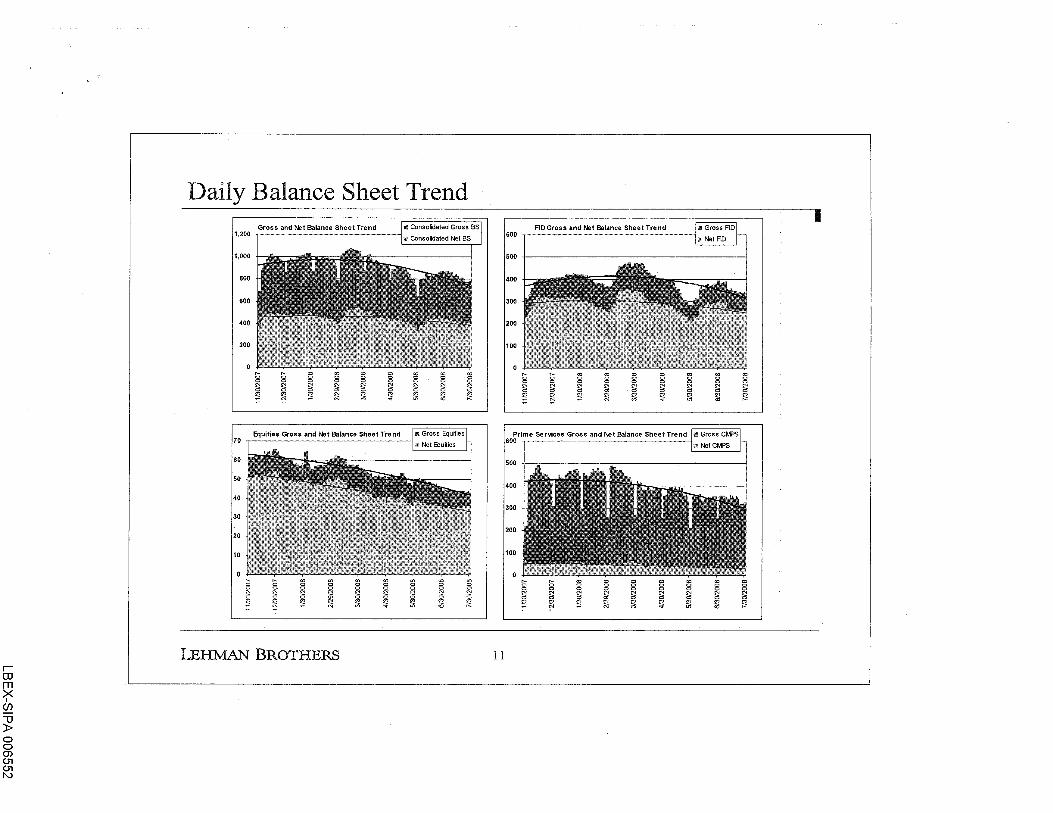
1,200 ,.... . ................ ·············!
1,000
800
600
400
200
70
60
50
40
30
20
10
0
§
§ ,.._ 0 0
~
,.._ 0 0
~ ., 0 0
~ ~
., "' 0 0
~ 0
~ s ~
LEHMAN BROTHERS
., 0 0 a ~
., 8 a !;I
., 0 0
~
., 8 a ~
"' 0 0
a ill
"' 8
§
., 8
~
,.._ ,.._ "'
., ., ., 0 0 0 0 0 0 0 0 0 0 0 0 a a ~ a ~ ~ s § ~ ~
Prime Services Gross and Net Balance Sheet Trend ill 600
500 -
400
300
200
100
,.._ ,.._ "' "' 0 0 0 0 0
~ 8 0 0 0
~ ~ a a ~ a ~ § ~ ~ !;I ~
11
"' 0 0
a ill
., 0 0
§
., 0 0 a ;3