Lazard Investment Research: Update on the Improving Foundations of the US House Prices (March 2013)
5
Investment Research Update on the Improving Foundations of US House Prices (March 2013) Ronald Temple, CFA, Managing Director, Portfolio Manager/Analyst The US housing market remains resilient, defying our expectations of seasonal weakness in the winter months. We expect moderate increases in prices on an aggregate level to continue, but with ongoing divergences among regions. In this paper, we examine these regional differences, based mainly on state-determined foreclosure processes. We also examine the implications for consumers’ balance sheets in relation to increased equity in residential real estate.
-
Upload
lazardlazard -
Category
Economy & Finance
-
view
271 -
download
1
Transcript of Lazard Investment Research: Update on the Improving Foundations of the US House Prices (March 2013)

Investment Research
Update on the Improving Foundations of US House Prices (March 2013)
Ronald Temple, CFA, Managing Director, Portfolio Manager/Analyst
The US housing market remains resilient, defying our expectations of seasonal weakness in the winter months. We expect moderate increases in prices on an aggregate level to continue, but with ongoing divergences among regions. In this paper, we examine these regional differences, based mainly on state-determined foreclosure processes. We also examine the implications for consumers’ balance sheets in relation to increased equity in residential real estate.
2
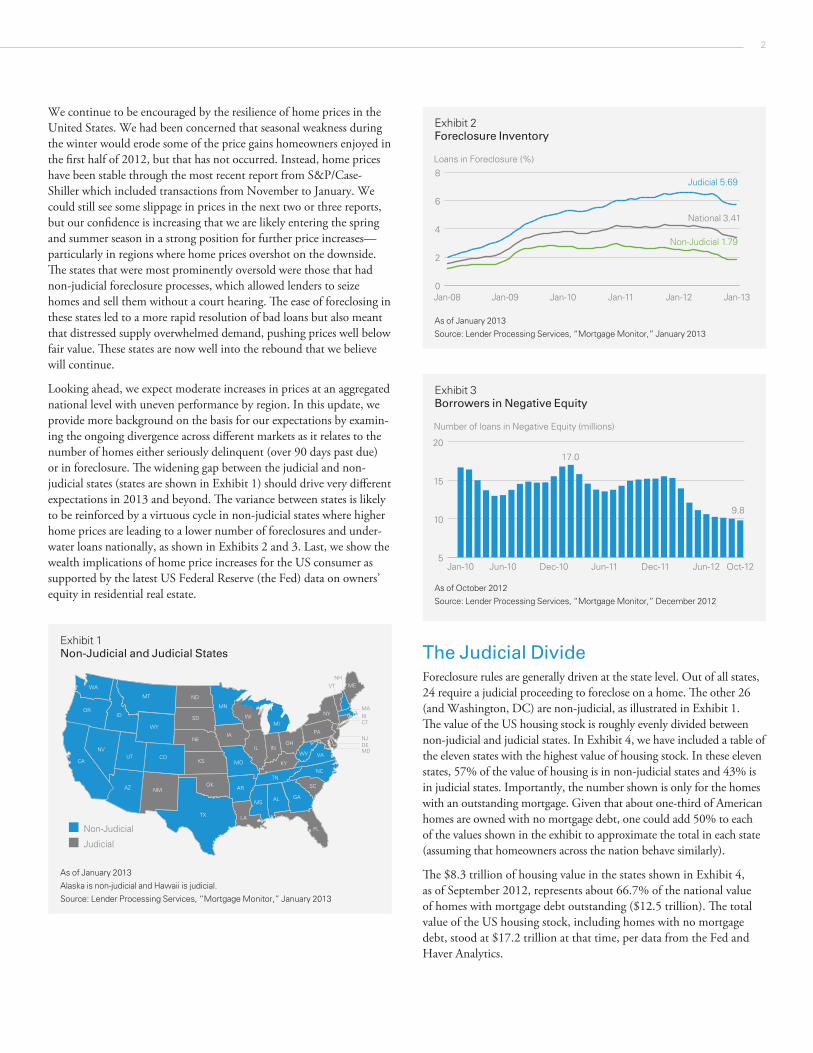
We continue to be encouraged by the resilience of home prices in the United States. We had been concerned that seasonal weakness during the winter would erode some of the price gains homeowners enjoyed in the first half of 2012, but that has not occurred. Instead, home prices have been stable through the most recent report from S&P/Case-Shiller which included transactions from November to January. We could still see some slippage in prices in the next two or three reports, but our confidence is increasing that we are likely entering the spring and summer season in a strong position for further price increases—particularly in regions where home prices overshot on the downside. The states that were most prominently oversold were those that had non-judicial foreclosure processes, which allowed lenders to seize homes and sell them without a court hearing. The ease of foreclosing in these states led to a more rapid resolution of bad loans but also meant that distressed supply overwhelmed demand, pushing prices well below fair value. These states are now well into the rebound that we believe will continue.
Looking ahead, we expect moderate increases in prices at an aggregated national level with uneven performance by region. In this update, we provide more background on the basis for our expectations by examin-ing the ongoing divergence across different markets as it relates to the number of homes either seriously delinquent (over 90 days past due) or in foreclosure. The widening gap between the judicial and non-judicial states (states are shown in Exhibit 1) should drive very different expectations in 2013 and beyond. The variance between states is likely to be reinforced by a virtuous cycle in non-judicial states where higher home prices are leading to a lower number of foreclosures and under-water loans nationally, as shown in Exhibits 2 and 3. Last, we show the wealth implications of home price increases for the US consumer as supported by the latest US Federal Reserve (the Fed) data on owners’ equity in residential real estate.
The Judicial DivideForeclosure rules are generally driven at the state level. Out of all states, 24 require a judicial proceeding to foreclose on a home. The other 26 (and Washington, DC) are non-judicial, as illustrated in Exhibit 1. The value of the US housing stock is roughly evenly divided between non-judicial and judicial states. In Exhibit 4, we have included a table of the eleven states with the highest value of housing stock. In these eleven states, 57% of the value of housing is in non-judicial states and 43% is in judicial states. Importantly, the number shown is only for the homes with an outstanding mortgage. Given that about one-third of American homes are owned with no mortgage debt, one could add 50% to each of the values shown in the exhibit to approximate the total in each state (assuming that homeowners across the nation behave similarly).
The $8.3 trillion of housing value in the states shown in Exhibit 4, as of September 2012, represents about 66.7% of the national value of homes with mortgage debt outstanding ($12.5 trillion). The total value of the US housing stock, including homes with no mortgage debt, stood at $17.2 trillion at that time, per data from the Fed and Haver Analytics.
Exhibit 1Non-Judicial and Judicial States
Judicial
Non-Judicial
WA
ORID
NV
AZ
UT
NM
TX
OK
CO
MN
WI
IA
LA
MSAL GA
SC
NC
VAWV
TN
KY
FL
NY
WY
ND
SD
NE
KS MO
AR
IL INOH
PA
MEVT
MI
MT
MD
NJ
NH
RIMA
CT
DE
CA
As of January 2013
Alaska is non-judicial and Hawaii is judicial.
Source: Lender Processing Services, “Mortgage Monitor,” January 2013
Exhibit 2Foreclosure Inventory
Loans in Foreclosure (%)
0
2
4
6
8Judicial 5.69
National 3.41
Non-Judicial 1.79
Jan-13Jan-12Jan-11Jan-10Jan-09Jan-08
As of January 2013
Source: Lender Processing Services, “Mortgage Monitor,” January 2013
Exhibit 3Borrowers in Negative Equity
Number of loans in Negative Equity (millions)
17.0
9.8
5
10
15
20
Oct-12Jun-12Dec-11Jun-11Dec-10Jun-10Jan-10
As of October 2012
Source: Lender Processing Services, “Mortgage Monitor,” December 2012
3
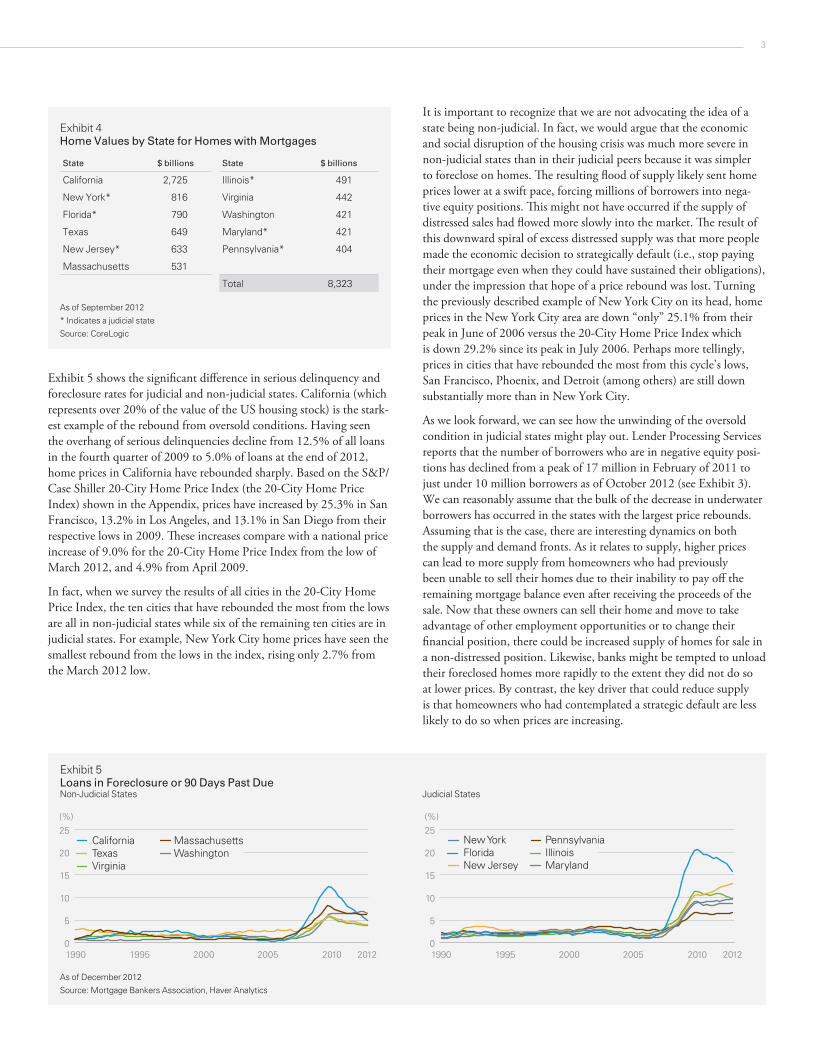
Exhibit 5 shows the significant difference in serious delinquency and foreclosure rates for judicial and non-judicial states. California (which represents over 20% of the value of the US housing stock) is the stark-est example of the rebound from oversold conditions. Having seen the overhang of serious delinquencies decline from 12.5% of all loans in the fourth quarter of 2009 to 5.0% of loans at the end of 2012, home prices in California have rebounded sharply. Based on the S&P/Case Shiller 20-City Home Price Index (the 20-City Home Price Index) shown in the Appendix, prices have increased by 25.3% in San Francisco, 13.2% in Los Angeles, and 13.1% in San Diego from their respective lows in 2009. These increases compare with a national price increase of 9.0% for the 20-City Home Price Index from the low of March 2012, and 4.9% from April 2009.
In fact, when we survey the results of all cities in the 20-City Home Price Index, the ten cities that have rebounded the most from the lows are all in non-judicial states while six of the remaining ten cities are in judicial states. For example, New York City home prices have seen the smallest rebound from the lows in the index, rising only 2.7% from the March 2012 low.
It is important to recognize that we are not advocating the idea of a state being non-judicial. In fact, we would argue that the economic and social disruption of the housing crisis was much more severe in non-judicial states than in their judicial peers because it was simpler to foreclose on homes. The resulting flood of supply likely sent home prices lower at a swift pace, forcing millions of borrowers into nega-tive equity positions. This might not have occurred if the supply of distressed sales had flowed more slowly into the market. The result of this downward spiral of excess distressed supply was that more people made the economic decision to strategically default (i.e., stop paying their mortgage even when they could have sustained their obligations), under the impression that hope of a price rebound was lost. Turning the previously described example of New York City on its head, home prices in the New York City area are down “only” 25.1% from their peak in June of 2006 versus the 20-City Home Price Index which is down 29.2% since its peak in July 2006. Perhaps more tellingly, prices in cities that have rebounded the most from this cycle’s lows, San Francisco, Phoenix, and Detroit (among others) are still down substantially more than in New York City.
As we look forward, we can see how the unwinding of the oversold condition in judicial states might play out. Lender Processing Services reports that the number of borrowers who are in negative equity posi-tions has declined from a peak of 17 million in February of 2011 to just under 10 million borrowers as of October 2012 (see Exhibit 3). We can reasonably assume that the bulk of the decrease in underwater borrowers has occurred in the states with the largest price rebounds. Assuming that is the case, there are interesting dynamics on both the supply and demand fronts. As it relates to supply, higher prices can lead to more supply from homeowners who had previously been unable to sell their homes due to their inability to pay off the remaining mortgage balance even after receiving the proceeds of the sale. Now that these owners can sell their home and move to take advantage of other employment opportunities or to change their financial position, there could be increased supply of homes for sale in a non-distressed position. Likewise, banks might be tempted to unload their foreclosed homes more rapidly to the extent they did not do so at lower prices. By contrast, the key driver that could reduce supply is that homeowners who had contemplated a strategic default are less likely to do so when prices are increasing.
Exhibit 5Loans in Foreclosure or 90 Days Past Due Non-Judicial States Judicial States
(%)
0
5
10
15
20
25
201220102005200019951990
VirginiaWashingtonTexasMassachusettsCalifornia
(%)
0
5
10
15
20
25
201220102005200019951990
MarylandNew JerseyIllinoisFloridaPennsylvania New York
As of December 2012
Source: Mortgage Bankers Association, Haver Analytics
Exhibit 4Home Values by State for Homes with Mortgages
State $ billions State $ billions
California 2,725 Illinois* 491
New York* 816 Virginia 442
Florida* 790 Washington 421
Texas 649 Maryland* 421
New Jersey* 633 Pennsylvania* 404
Massachusetts 531
Total 8,323
As of September 2012
* Indicates a judicial state
Source: CoreLogic
4
On the demand side we hold a positive view, as buyers who had been waiting for even cheaper prices might realize they missed the lows and should rush to take advantage of still very attractive valuations. As prices continue to increase, we would expect to see increased availabil-ity of credit for home purchases and even (at some point) home equity loans as borrowers move further into positive equity positions.
These factors are, overall, very positive for consumers as we expect their balance sheet improvement will lead to higher confidence levels for homeowners, even when they might not be enjoying price increases themselves.
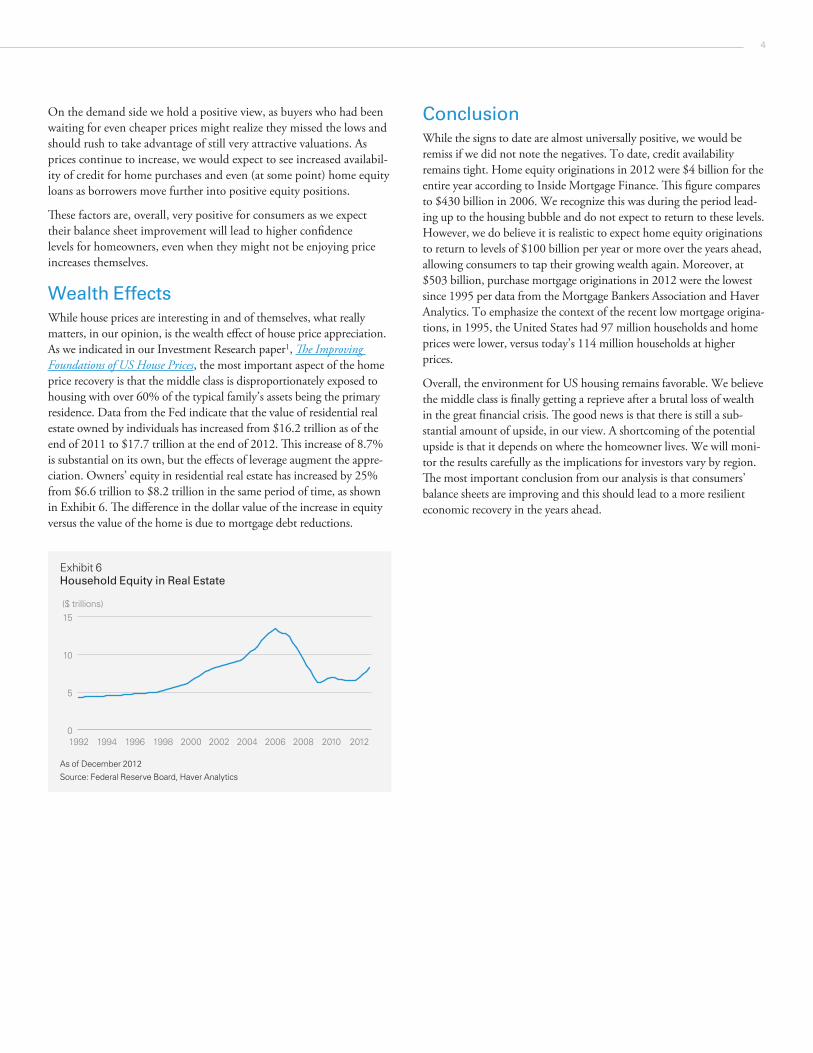
Wealth EffectsWhile house prices are interesting in and of themselves, what really matters, in our opinion, is the wealth effect of house price appreciation. As we indicated in our Investment Research paper1, The Improving Foundations of US House Prices, the most important aspect of the home price recovery is that the middle class is disproportionately exposed to housing with over 60% of the typical family’s assets being the primary residence. Data from the Fed indicate that the value of residential real estate owned by individuals has increased from $16.2 trillion as of the end of 2011 to $17.7 trillion at the end of 2012. This increase of 8.7% is substantial on its own, but the effects of leverage augment the appre-ciation. Owners’ equity in residential real estate has increased by 25% from $6.6 trillion to $8.2 trillion in the same period of time, as shown in Exhibit 6. The difference in the dollar value of the increase in equity versus the value of the home is due to mortgage debt reductions.
ConclusionWhile the signs to date are almost universally positive, we would be remiss if we did not note the negatives. To date, credit availability remains tight. Home equity originations in 2012 were $4 billion for the entire year according to Inside Mortgage Finance. This figure compares to $430 billion in 2006. We recognize this was during the period lead-ing up to the housing bubble and do not expect to return to these levels. However, we do believe it is realistic to expect home equity originations to return to levels of $100 billion per year or more over the years ahead, allowing consumers to tap their growing wealth again. Moreover, at $503 billion, purchase mortgage originations in 2012 were the lowest since 1995 per data from the Mortgage Bankers Association and Haver Analytics. To emphasize the context of the recent low mortgage origina-tions, in 1995, the United States had 97 million households and home prices were lower, versus today’s 114 million households at higher prices.
Overall, the environment for US housing remains favorable. We believe the middle class is finally getting a reprieve after a brutal loss of wealth in the great financial crisis. The good news is that there is still a sub-stantial amount of upside, in our view. A shortcoming of the potential upside is that it depends on where the homeowner lives. We will moni-tor the results carefully as the implications for investors vary by region. The most important conclusion from our analysis is that consumers’ balance sheets are improving and this should lead to a more resilient economic recovery in the years ahead.
Exhibit 6Household Equity in Real Estate
($ trillions)
0
5
10
15
20122010200820062004200220001998199619941992
As of December 2012
Source: Federal Reserve Board, Haver Analytics

5
Notes1 Paper available at: http://lazardnet.com/lam/global/investment_research.html
Important InformationPublished on 28 March 2013.
This paper is for informational purposes only. It is not intended to, and does not constitute, an offer to enter into any contract or investment agreement in respect of any product offered by Lazard Asset Management and shall not be considered as an offer or solicitation with respect to any product, security, or service in any jurisdiction or in any circumstances in which such offer or solicita-tion is unlawful or unauthorized or otherwise restricted or prohibited.
Information and opinions presented have been obtained or derived from sources believed by Lazard to be reliable. Lazard makes no representation as to their accuracy or completeness. All opin-ions expressed herein are as of the date of this presentation and are subject to change.
Past performance is not a reliable indicator of future results.
Australia: Issued by Lazard Asset Management Pacific Co., Level 39 Gateway, 1 Macquarie Place, Sydney NSW 2000. Germany: Issued by Lazard Asset Management (Deutschland) GmbH, Neue Mainzer Strasse 75, D-60311 Frankfurt am Main. Japan: Issued by Lazard Japan Asset Management K.K., ATT Annex, 7th Floor, 2-11-7 Akasaka, Minato-ku, Tokyo 107-0052. Korea: Issued by Lazard Korea Asset Management Co. Ltd., 10F Seoul Finance Center, Taepyeongno-1ga, Jung-gu, Seoul, 100-768. United Kingdom: For Professional Investors Only. Issued by Lazard Asset Management Ltd., 50 Stratton Street, London W1J 8LL. Registered in England Number 525667. Authorised and regulated by the Financial Services Authority (FSA). United States: Issued by Lazard Asset Management LLC, 30 Rockefeller Plaza, New York, NY 10112.
HB22962
AppendixS&P/Case Shiller 20-City Home Price Index (January 2000 = 100)
CityLow Since
December 2008 Date of LowHigh Since Inception
(January 1987) Date of High CurrentChange from Low
(%)Change from High
(%)
Phoenix 100.22 Sep-11 227.42 Jun-06 126.69 26.4 -44.3
San Francisco 117.71 Mar-09 218.37 May-06 147.45 25.3 -32.5
Detroit 64.47 Apr-11 127.05 Dec-05 80.01 24.1 -37.0
Minneapolis 105.77 Mar-11 171.12 Sep-06 124.95 18.1 -27.0
Atlanta 82.54 Mar-12 136.47 Jul-07 96.90 17.4 -29.0
Las Vegas 89.87 Mar-12 234.78 Aug-06 104.04 15.8 -55.7
Los Angeles 159.18 May-09 273.94 Sep-06 180.23 13.2 -34.2
San Diego 144.43 Apr-09 250.34 Nov-05 163.28 13.1 -34.8
Washington 165.94 Mar-09 251.07 May-06 187.42 12.9 -25.4
Miami 136.99 Apr-11 280.87 Dec-06 153.51 12.1 -45.3
Denver 120.21 Feb-09 140.28 Aug-06 134.17 11.6 -4.4
Seattle 128.99 Feb-12 192.30 Jul-07 141.30 9.5 -26.5
Tampa 123.91 Feb-12 238.09 Jul-06 135.20 9.1 -43.2
Portland 129.01 Mar-12 186.51 Jul-07 140.74 9.1 -24.5
Chicago 102.76 Mar-12 168.60 Sep-06 111.62 8.6 -33.8
Dallas 112.26 Feb-09 126.47 Jun-07 120.51 7.3 -4.7
Charlotte 108.23 Feb-12 135.88 Aug-07 115.15 6.4 -15.3
Cleveland 94.22 Feb-12 123.49 Jul-06 100.07 6.2 -19.0
Boston 145.83 Mar-09 182.45 Sep-05 153.80 5.5 -15.7
New York 157.43 Mar-12 215.83 Jun-06 161.64 2.7 -25.1
Composite-20 134.07 Mar-12 206.52 Jul-06 146.14 9.0 -29.2
As of 26 March 2013
Data include transactions from November 2012 to January 2013.
Source: Standard & Poor’s