Lazard Global Active Funds plc · Legal Advisers as to Irish Law William Fry 2 Grand Canal Square...
147
Lazard Global Active Funds plc Interim Report and Unaudited Financial Statements For the financial period ended 30 September 2019
Transcript of Lazard Global Active Funds plc · Legal Advisers as to Irish Law William Fry 2 Grand Canal Square...

Lazard Global Active Funds plc
Interim Report and Unaudited Financial Statements
For the financial period ended 30 September 2019

LA
ZA
RD
GL
OB
AL
AC
TIV
E F
UN
DS
PL
C
3Lazard Global Active Funds plc Financial period ended 30 September 2019
Contents
Directors and Other Information .................................................................................... 4
Investment Managers’ Reports ...................................................................................... 6
Statement of Comprehensive Income ......................................................................... 37
Statement of Financial Position ................................................................................... 44
Statement of Changes in Net Assets attributable to Redeemable Participating Shareholders ........................................................................................... 51
Notes to the Financial Statements ............................................................................... 58
Portfolios of Investments ............................................................................................. 92
Statement of Major Changes in Investments ............................................................. 127
LA
ZA
RD
GL
OB
AL
AC
TIV
E F
UN
DS
PL
C
4Lazard Global Active Funds plc Financial period ended 30 September 2019
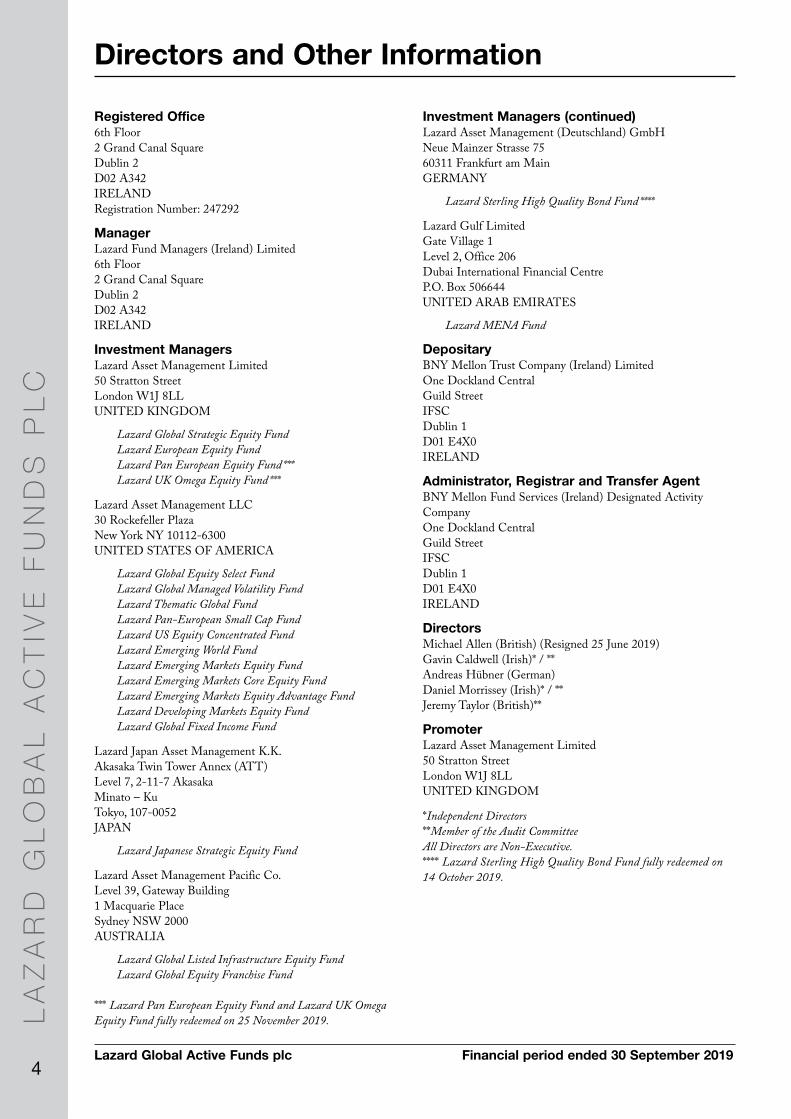
Directors and Other Information
Registered Office6th Floor2 Grand Canal SquareDublin 2D02 A342IRELANDRegistration Number: 247292
ManagerLazard Fund Managers (Ireland) Limited6th Floor2 Grand Canal SquareDublin 2D02 A342IRELAND
Investment ManagersLazard Asset Management Limited50 Stratton StreetLondon W1J 8LLUNITED KINGDOM
Lazard Global Strategic Equity FundLazard European Equity FundLazard Pan European Equity Fund ***Lazard UK Omega Equity Fund ***
Lazard Asset Management LLC30 Rockefeller PlazaNew York NY 10112-6300UNITED STATES OF AMERICA
Lazard Global Equity Select FundLazard Global Managed Volatility FundLazard Thematic Global FundLazard Pan-European Small Cap FundLazard US Equity Concentrated FundLazard Emerging World FundLazard Emerging Markets Equity FundLazard Emerging Markets Core Equity FundLazard Emerging Markets Equity Advantage FundLazard Developing Markets Equity FundLazard Global Fixed Income Fund
Lazard Japan Asset Management K.K.Akasaka Twin Tower Annex (ATT)Level 7, 2-11-7 AkasakaMinato – KuTokyo, 107-0052JAPAN
Lazard Japanese Strategic Equity Fund
Lazard Asset Management Pacific Co.Level 39, Gateway Building1 Macquarie PlaceSydney NSW 2000AUSTRALIA
Lazard Global Listed Infrastructure Equity FundLazard Global Equity Franchise Fund
*** Lazard Pan European Equity Fund and Lazard UK Omega Equity Fund fully redeemed on 25 November 2019.
Investment Managers (continued)Lazard Asset Management (Deutschland) GmbH Neue Mainzer Strasse 7560311 Frankfurt am Main GERMANY
Lazard Sterling High Quality Bond Fund ****
Lazard Gulf LimitedGate Village 1Level 2, Office 206Dubai International Financial CentreP.O. Box 506644UNITED ARAB EMIRATES
Lazard MENA Fund
DepositaryBNY Mellon Trust Company (Ireland) LimitedOne Dockland CentralGuild StreetIFSCDublin 1D01 E4X0IRELAND
Administrator, Registrar and Transfer AgentBNY Mellon Fund Services (Ireland) Designated Activity CompanyOne Dockland CentralGuild StreetIFSCDublin 1D01 E4X0IRELAND
DirectorsMichael Allen (British) (Resigned 25 June 2019) Gavin Caldwell (Irish)* / ** Andreas Hübner (German) Daniel Morrissey (Irish)* / **Jeremy Taylor (British)**
PromoterLazard Asset Management Limited50 Stratton StreetLondon W1J 8LLUNITED KINGDOM
*Independent Directors**Member of the Audit CommitteeAll Directors are Non-Executive.**** Lazard Sterling High Quality Bond Fund fully redeemed on 14 October 2019.
LA
ZA
RD
GL
OB
AL
AC
TIV
E F
UN
DS
PL
C
5Lazard Global Active Funds plc Financial period ended 30 September 2019
Directors and Other Information (continued)
This Interim Report and Unaudited Financial Statements (the "Report and Accounts") may be translated into other languages. Any such translation shall only contain the same information and have the same meaning as the English language Report and Accounts. To the extent that there is any inconsistency between the English language Report and Accounts and the Report and Accounts in another language, the English language Report and Accounts will prevail, except to the extent (and only to the extent) that it is required by law of any jurisdiction where the shares are sold, that in an action based upon disclosure in a Report and Accounts in a language other than English, the language of the Report and Accounts on which such action is based shall prevail. Any disputes as to the terms of the Report and Accounts, regardless of the language of the Report and Accounts, shall be governed by and construed in accordance with the laws of Ireland.
DistributorsLazard Asset Management Limited50 Stratton StreetLondon W1J 8LLUNITED KINGDOM
Lazard Asset Management (Deutschland) GmbH Neue Mainzer Strasse 7560311 Frankfurt am Main GERMANY
Lazard Asset Management Schweiz AGUsteristrasse 9Zürich CH-8001SWITZERLAND
Lazard Frères Gestion25 rue de Courcelles75008 ParisFRANCE
Lazard Asset Management (Singapore) Pte. Limited1 Raffles Place#15-02, One Raffles Place Tower 1SINGAPORE 048616
Lazard Asset Management (Hong Kong) LimitedLevel 201 Harbour View Street, Central HONG KONG
Lazard Fund Manager (Ireland) Limited, Spanish BranchPaseo De La Castellana 140Piso 1028046 MadridSPAIN
Lazard Fund Managers (Ireland) Limited, Belgian BranchAvenue Louise 3261050 BrusselsBELGIUM
Lazard Fund Managers (Ireland) Limited, Dutch BranchThe Office OperatorsMondrian TowerAmstelplein 541096 BC AmsterdamNETHERLANDS
Legal Advisers as to Irish LawWilliam Fry2 Grand Canal SquareDublin 2D02 A342IRELAND
Legal Advisers as to English Law MacFarlanes LLP20 Cursitor StreetLondon EC4A 1LTUNITED KINGDOM
SecretaryWilton Secretarial Limited6th Floor2 Grand Canal SquareDublin 2D02 A342IRELAND
Independent AuditorsPricewaterhouseCoopersChartered Accountants and Registered AuditorsOne Spencer DockNorth Wall QuayDublin 1D01 X9R7IRELAND
Paying Agent in SwitzerlandNPB Neue Privat Bank AGLimmatquai 1/am BellevueP.O. BoxCH-8022 ZürichSWITZERLAND
Authorised Representative in SwitzerlandACOLIN Fund Services AGAffolternstrasse 568050 ZürichSWITZERLAND
Currency ManagerThe Bank of New York Mellon46 Rue MontoyerstraatB-1000 BrusselsBELGIUM
LA
ZA
RD
GL
OB
AL
AC
TIV
E F
UN
DS
PL
C
6Lazard Global Active Funds plc Financial period ended 30 September 2019
Investment Managers’ Report
Lazard Global Listed Infrastructure Equity Fund
Investment ReviewOver the six-month period ended 30 September 2019, the Lazard Global Listed Infrastructure Equity Fund (the “Fund”) returned 7.68% in Pound Sterling terms, against the MSCI World Core Infrastructure Index, which returned 5.21% 1.
Market ReviewThe period covered a tumultuous period for markets, which still managed to post positive returns. Despite a strong economy, the political temperature continued to escalate in the United States, with the beginning of a formal impeachment inquiry by the Democratic-led House, and ongoing friction between the Federal Reserve Chairman Jerome Powell and President Donald Trump regarding the level of interest rate cuts. In Europe, there appeared to be a greater likelihood that an extension for Brexit would be granted for a third time. In the meantime, European economies struggled with negative interest rates and weak economic figures.
Portfolio Review
What Contributed to Returns:• Stock selection in industrials and consumer services • Satellite operator SES contributed to performance as comments from the US Federal Communication Commission (“FCC”)
suggested that a November FCC meeting may lead to a decision on 5G mobile data deployment• Concessions and construction company Vinci delivered solid first half 2019 results
What Detracted from Returns:• Stock selection in utilities• Australian regulated utility, Spark Infrastructure, fell slightly after reporting its first half 2019 results. The company indicated that
distributions to security holders will need to be reset to a lower base for the next five-year regulatory period• Red Eléctrica declined during the month after releasing its 2018-2022 plan, which called for lower capital expenditure than the
market had been expecting based on previous guidance
Outlook The strategy has enjoyed strong performance since 2009, exceeding its annual investment return objective in eight out of the past ten years. We have been informing investors for some time that we do not expect this level of performance to continue. Overall, we remain cautious about equity markets. In recent months, we have seen significant volatility in stock price movements, which is giving us cause for concern. Whilst we see some pockets of attractive value opportunities, particularly in Europe, the majority of global listed infrastructure stocks are US-listed utilities, which we believe as a cohort remain unattractive. This is why our strategy holds very few US utilities, and remains significantly underweight in this sector relative to the various infrastructure indices, and many of our listed infrastructure peer managers. In the current market conditions where we believe that value opportunities are scarce, we choose to concentrate the portfolio into positions where we believe the risk/return trade-off is favourable.
However, this concentration of stock positions brings a higher degree of stock-specific risk. We believe this is the correct portfolio positioning in the long-run and we have added to underperforming positions, where our assessment of risk/return trade-off has improved. Further, we believe that the returns available from the Fund will meet our performance objective of inflation +5% over rolling 5-year periods, and look relatively attractive when compared to a passive investment in infrastructure indices, bonds, or in broader equity markets.
All data contained herein is sourced by Lazard Asset Management Limited unless otherwise noted, as at 30 September 2019.
1 Source: Lazard Asset Management Limited, NAV to NAV Price, Net Income Reinvested in Pound Sterling, ‘A’ accumulation share class Net of fees, to 30 September 2019. Index returns shown on a total return basis.
Fund Manager: Warryn Robertson, John Mulquiney and team.
Figures refer to past performance, which is not a reliable indicator of future results.
Lazard Asset Management Pacific Co.

LA
ZA
RD
GL
OB
AL
AC
TIV
E F
UN
DS
PL
C
Investment Managers’ Report (continued)
7Lazard Global Active Funds plc Financial period ended 30 September 2019
Lazard Global Strategic Equity Fund
Investment ReviewOver the six-month period ended 30 September 2019, the Lazard Global Strategic Equity Fund (the “Fund”) returned 4.06% in US Dollar terms, against the MSCI All Country World Index, which returned 3.59% 1.
Market ReviewGlobal equities rose during the six-month period, continuing the rebound towards the highs of 2018, but then increasing in volatility in the latter half of the period.
Broadly, the macroeconomic data and corporate commentaries continued to point to slowing activity, while the announcement of further China tariffs from the United States, alongside a little-noticed dispute between Japan and South Korea, put further pressure on sentiment. Bond yields responded by declining sharply in the US and sinking to new (and often negative) lows in many markets. The relative valuation of growth versus value styles continued to expand, but a short period in September witnessed a sharp rotation back towards value, reducing the dispersion.
The North American, Continental Europe and Japan markets led performance, while the United Kingdom and Emerging Markets lagged. Sector performance was driven by information technology, together with the more defensive sectors of utilities and consumer staples. Energy was the weakest sector.
Portfolio Review
What Contributed to Returns:• Stock selection in healthcare, financials, consumer staples and North America was helpful• Intercontinental Exchange, the US operator of financial and commodity exchanges, continued to reach new highs, with an
accelerating data business and increase focus on cost management• Zoetis, a US animal health company, performed strongly. We continue to see growing demand in the companion and food
markets, and new product development should drive future growth
What Detracted from Returns:• Stock selection in communication services and Japan detracted• Elanco Animal Health declined as investors worried about an increase in company leverage for the acquisition of Bayer Animal
Health. Further industry consolidation, coupled with the potential for cost reduction, should support cash generation and the ability to accommodate the increase in debt
• Palo Alto Networks, a US cybersecurity firm, retreated from recent highs as billings disappointed with shorter contract lengths. We believe the company continues to build on its leadership position in firewalls and should benefit from investment in cloud platform integration

LA
ZA
RD
GL
OB
AL
AC
TIV
E F
UN
DS
PL
CInvestment Managers’ Report (continued)
8Lazard Global Active Funds plc Financial period ended 30 September 2019
Outlook While the earnings yield for equities maintains a positive spread over government bonds, the current environment points towards slower and more uneven equity market growth, as the continuing easing of monetary policy may not be sufficient to arrest slowing economic activity or the effect of US-China trade discussions. This has created a difficult construct in markets, where many stable, quality businesses are trading at very high valuations on the back of low interest rates, while more cyclical businesses with lower profitability facing short-term economic pressure are trading at increasingly low valuations.
Overall, the portfolio team remains confident that, by continuing to focus on stock selection, and seeking to find stocks with sustainably high or improving returns trading at attractive valuations, the Fund’s strong long-term track record will continue.
All data contained herein is sourced by Lazard Asset Management Limited unless otherwise noted, as at 30 September 2019.
1 Source: Lazard Asset Management Limited, NAV to NAV Price, Net Income Reinvested in US Dollars, ‘A’ accumulation share class Net of fees, to 30 September 2019. Index returns shown on a total return basis.
Fund Manager: Robin Jones, Mark Little and team.
Figures refer to past performance, which is not a reliable indicator of future results.
Lazard Asset Management Limited
Lazard Global Strategic Equity Fund (continued)
LA
ZA
RD
GL
OB
AL
AC
TIV
E F
UN
DS
PL
C
Investment Managers’ Report (continued)
9Lazard Global Active Funds plc Financial period ended 30 September 2019
Lazard Global Equity Select Fund
Investment ReviewOver the six-month period ended 30 September 2019, the Lazard Global Equity Select Fund (the “Fund”) returned 4.47% in US Dollar terms, against the MSCI All Country World Index, which returned 3.59% 1.
Market ReviewGlobal equities advanced on volatile risk sentiment stemming from mixed newsflow. The United States continued to play a dominant role in driving markets higher, as it benefitted from strong corporate earnings for the second and third quarters of 2019. The decision by the US Federal Reserve to lower interest rates twice during this period amid mixed domestic and global economic data provided an added boost. Fears of a recession in the Eurozone resulting in additional stimulus from the European Central Bank, and ongoing uncertainty about Brexit weighed on European markets in the third quarter of 2019. The main drag on financial markets continued to be the protracted trade war between the United States and China, which adversely affected emerging markets and export-dependent countries.
Utilities was the best performing sector in the period, as high dividend paying US stocks benefitted from investors chasing yield in a low-interest-rate environment. Information technology also outperformed the broader market index, helped by strong stock performances from Asian semiconductor companies. The energy and materials sectors both declined, reflecting concerns about a global economic slowdown.
Portfolio Review
What Contributed to Returns:• Stock selection and an overweight position in the consumer staples sector, and stock selection in healthcare• Coca-Cola rose after the beverage company reported quarterly earnings broadly above expectations, driven by solid organic sales
growth• Shares in animal health company, Zoetis, rose as the company reported strong quarterly results, helped by strength in the
Companion Animal segment
What Detracted from Returns:• Stock selection in the communication services sector• Ubisoft Entertainment fell after the videogame maker reported full-year results that were below expectations, affected by a higher
tax rate and management guidance for the current year disappointed• The position in Indian financial service conglomerate, Indiabulls, declined amid concerns about the lender’s funding
Outlook The increasingly dovish stance of central banks globally has driven equities higher. In this environment, we believe it has become even more important for investors to be discerning and to focus on fundamentals instead of short-term macroeconomic factors. We remain optimistic regarding the foundation of US economic growth, as improving household finances, healthy labour markets, and increasing wage growth should buoy consumer confidence and spending, sustaining growth there.
While the deepening of trade rifts globally has the potential to negatively impact equity markets, we believe that company-specific drivers such as revenue and earnings growth, as well as valuation, are likely to be a more significant determinant of total returns of financial assets in the longer run. We believe investors should consider concentrating capital in companies with high, sustainable returns on capital that trade at attractive valuations because these stocks are more likely to participate in rising markets while defending when markets decline.
All data contained herein is sourced by Lazard Asset Management Limited unless otherwise noted, as at 30 September 2019.
1 Source: Lazard Asset Management Limited, NAV to NAV Price, Net Income Reinvested in US Dollars, ‘A’ accumulation share class Net of fees, to 30 September 2019. Index returns shown on a total return basis.
Fund Manager: Andrew Lacey and team.
Figures refer to past performance, which is not a reliable indicator of future results.
Lazard Asset Management LLC

LA
ZA
RD
GL
OB
AL
AC
TIV
E F
UN
DS
PL
CInvestment Managers’ Report (continued)
10Lazard Global Active Funds plc Financial period ended 30 September 2019
Lazard Global Managed Volatility Fund
Investment ReviewOver the six-month period ended 30 September 2019, the Lazard Global Managed Volatility Fund (the “Fund”) returned 3.49% in US Dollar terms, against the MSCI World Index, which returned 4.56% 1.
Market ReviewThe United States continued to play a significant role in driving markets higher. The US equity market benefited from good employment and economic growth figures. The decision by the US Federal Reserve (the “Fed”) to lower interest rates twice during the six-month period amid mixed global economic data provided an added boost. In Europe, fears of a recession in the Eurozone and ongoing uncertainty about the fate of Brexit in the United Kingdom weighed on European equity markets during the third quarter. Meanwhile in Asia, the Hong Kong equity market suffered a significant decline in the six-month period as a result of ongoing civil unrest. The sharp rise in the price of gold was another notable feature during the period.
The greatest drag on the equity markets continues to be the protracted trade war between the United States and China, which weighed on emerging markets and export-dependent countries. Trade tensions between the United States on the one hand and Europe, Japan, and India on the other, as well as a limited trade war between Japan and Korea, have further undermined stock market confidence.
Central bank activity played a significant role in calming markets in the face of growing anxiety about a global economic slowdown, trade wars, and Brexit. In addition to the two 25 basis points (bps) cuts by the Fed, the European Central Bank further reduced negative rates from -40 to -50 bps, while the Bank of England indicated that it is ready to reduce rates to offset the impact of a possible Brexit.
Utilities was the best performing market sector in the period, and information technology also outperformed the broader market index. The energy and materials sectors both declined.
Portfolio Review
What Contributed to Returns:• Shares of US-based coffee company, Starbucks, increased significantly, with the company capitalising on China’s growing taste
for coffee, and its expanding middle class• US-based cosmetics company, Estee Lauder, performed well after projecting strong growth in 2020, thanks to sales in Asia and
higher demand for its premium skin care brands• Hershey gained on bullish sentiment after the US-based confectionery company strengthened its position as a snacking leader
after announcing its agreement to acquire ONE Brands
What Detracted from Returns:• Swire Pacific, which maintains significant retail property interests in Hong Kong, came under pressure due to the city’s ongoing
civil unrest• Eli Lilly fell after the US-based drugmaker reported lower-than-expected first-quarter sales for Trulicity, its top-selling diabetes
drug• Simon Property fell after the US-based real estate company reported disappointing first–quarter earnings
Outlook While the uncertainty of trade wars and other political issues are numerous, the global economic outlook is more balanced. Unemployment is low, inflation is largely non-existent, and central banks are highly accommodative toward providing economic stimulus. Nevertheless, equity valuations are high, especially in companies demonstrating even the slightest modicum of growth. Looking forward, the geopolitical environment looks highly uncertain.
LA
ZA
RD
GL
OB
AL
AC
TIV
E F
UN
DS
PL
C
Investment Managers’ Report (continued)
11Lazard Global Active Funds plc Financial period ended 30 September 2019
A lack of any meaningful progress on trade or Brexit would increase volatility and potentially trigger another market correction akin to the fourth quarter of 2018. While the odds of a global recession seem to be remote, corporate earnings are expected to see their third straight quarterly decline, though at a modest rate. We expect that any decline will be driven by a political rather than financial or economic shortcoming.
All data contained herein is sourced by Lazard Asset Management Limited, unless otherwise noted, as at 30 September 2019.
1 Source: Lazard Asset Management Limited, NAV to NAV Price, Net Income Reinvested in US Dollars, ‘A’ accumulation share class Net of fees, to 30 September 2019. Index returns shown on a total return basis.
Fund Manager: Susanne Willumsen and team.
Figures refer to past performance, which is not a reliable indicator of future results.
Lazard Asset Management LLC
Lazard Global Managed Volatility Fund (continued)
Outlook (continued)

LA
ZA
RD
GL
OB
AL
AC
TIV
E F
UN
DS
PL
CInvestment Managers’ Report (continued)
12Lazard Global Active Funds plc Financial period ended 30 September 2019
Lazard Thematic Global Fund
Investment ReviewOver the six-month period ended 30 September 2019, the Lazard Thematic Global Fund (the “Fund”) returned 6.30% in US Dollar terms, against the MSCI World Index, which returned 4.56% 1.
Market ReviewThe United States continued to play a significant role in driving markets higher. The US equity market benefitted from strong corporate earnings for the second and third quarters. The decision by the US Federal Reserve (the "Fed") to lower interest rates twice during the six-month period amid mixed domestic and global economic data provided an added boost. In Europe, fears of a recession in the Eurozone, resulting in further stimulus measures from the European Central Bank, and ongoing uncertainty about the fate of Brexit in the United Kingdom weighed on European equity markets, especially in the third quarter. Meanwhile in Asia, the Hong Kong equity market suffered a significant decline in the six-month period as a result of ongoing civil unrest.
The greatest drag on financial markets continued to be the protracted trade war between the United States and China, which adversely impacted emerging markets and export-dependent countries. China’s growth has been impacted negatively, exacerbating the global deceleration in economic activity.
Central bank activity played a significant role in calming markets in the face of growing anxiety about a global economic slowdown, trade wars, and Brexit. The world’s central banks, both in developed and developing countries, have resumed a coordinated monetary response. After the second of two recent 25 basis point reductions in the Federal Funds rate, the Fed cited the “deterioration in the global economic outlook” as the reason for its decision.
Portfolio Review
What Contributed to Returns:• Ten themes contributed to returns• The Extreme Risks theme performed the best, helped by gold and gold mining equities, which rose on rising geopolitical
uncertainty and the prospect of further monetary stimulus• Under Data Networks & Profits, strong growth in digital payments was reflected in positive returns from Worldpay, Mastercard
and Visa while in First World Health, Zoetis performed well on strong results with approvals for new treatments indicating further growth ahead
What Detracted from Returns:• The only theme to detract was gas & oil• Hydrocarbon exploration company Concho Resources declined the most, on oil drilling-well pad disappointments• Occidental fell as investors did not favour its acquisition of Anadarko Petroleum. Equinor, EOG, and Pioneer were weaker on
the movements in gas and oil prices
LA
ZA
RD
GL
OB
AL
AC
TIV
E F
UN
DS
PL
C
Investment Managers’ Report (continued)
13Lazard Global Active Funds plc Financial period ended 30 September 2019
Outlook We appear to be in an unusual situation where equity and bond markets are discounting contradictory outcomes. The equity markets, supported by historically low interest rates and accommodative monetary policies around the world, still anticipate modest earnings growth, while the bond markets reflect deep anxiety over the likelihood of recession and financial industry instability. If the world avoids a deep recession and growth, however modest, is sustained, then equity returns are likely to be superior. Intriguingly, we are now in a situation where dividend yields are greater than bond yields, which in parts of Continental Europe and Japan are negative in both nominal and real terms. Bond markets are now at levels where prices are very vulnerable should inflation, which in recent years has been subdued at very low levels, return.
All data contained herein is sourced by Lazard Asset Management Limited unless otherwise noted, as at 30 September 2019.
1 Source: Morningstar Direct, NAV to NAV Price, Net Income Reinvested in US Dollars, ‘A’ accumulation share class Net of fees, to 30 September 2019. Index returns shown on a total return basis.
Fund Manager: Nicholas Bratt, Steve Wreford and team.
Figures refer to past performance, which is not a reliable indicator of future results.
Lazard Asset Management LLC
Lazard Thematic Global Fund (continued)

LA
ZA
RD
GL
OB
AL
AC
TIV
E F
UN
DS
PL
CInvestment Managers’ Report (continued)
14Lazard Global Active Funds plc Financial period ended 30 September 2019
Lazard Global Equity Franchise Fund
Investment ReviewOver the six-month period ended 30 September 2019, the Lazard Global Equity Franchise Fund (the “Fund”) returned 6.14% in US Dollar terms, against the MSCI World Index, which returned 4.56% 1.
Market ReviewThe period covered a tumultuous period for markets, which still managed to post positive returns. Despite a strong economy, the political temperature continue to escalate in the United States, with the beginning of a formal impeachment inquiry by the Democratic-led House, and ongoing friction between the Federal Reserve Chairman, Jerome Powell and President Donald Trump regarding the level of interest rates. In Europe, there appeared to be a greater likelihood that an extension for Brexit will be granted for a third time. In the meantime, European economies struggled with negative interest rates and weak economic figures.
Portfolio Review
What Contributed to Returns:• Stocks in communications services, healthcare and no holdings energy helped• Qualcomm, which collects license fees from mobile phone manufacturers for using its patented enabling technology, rose after
announcing its legal disputes with Apple had been resolved• Leading satellite company, SES, reported first half 2019 results, and although revenues were slightly below consensus expectations,
margins rose, and earnings before interest, tax and depreciation were in-line
What Detracted from Returns:• Stock selection in industrials hurt• Tapestry’s share price fell following the release of its full year results and guidance for the year ending June 2020• Mednax provides specialist physician services in the US market, but revenue growth has not kept pace with labour cost inflation,
resulting in negative operating leverage
Outlook Following a period of continued strong market performance, the opportunity of attractively priced investments within our Global Equity Franchise universe remains limited, and as a result, the portfolio today is relatively concentrated. This concentration of stock positions brings a higher degree of stock-specific risk and is likely to bring more volatility to individual monthly and quarterly returns. However, we do believe the economic franchise characteristics we seek for all our investments will continue to serve our investors well over the longer term.
All data contained herein is sourced by Lazard Asset Management Limited unless otherwise noted, as at 30 September 2019.
1 Source: Lazard Asset Management Limited, NAV to NAV Price, Net Income Reinvested in US Dollars, ‘A’ accumulation share class Net of fees, to 30 September 2019. Index returns shown on a total return basis.
Fund Manager: Warryn Robertson, John Mulquiney and team.
Figures refer to past performance, which is not a reliable indicator of future results.
Lazard Asset Management Pacific Co.
LA
ZA
RD
GL
OB
AL
AC
TIV
E F
UN
DS
PL
C
Investment Managers’ Report (continued)
15Lazard Global Active Funds plc Financial period ended 30 September 2019
Lazard European Equity Fund
Investment ReviewOver the six-month period ended 30 September 2019, the Lazard European Equity Fund (the “Fund”) returned 6.89% in Euro terms, against the FTSE World Europe ex-UK Index, which returned 7.67% 1.
Market ReviewEuropean equities closed at their session high, supported by a strong rebound at the start of 2019, growing expectations that central bank policies would remain accommodative, hopes of a resolution to the US-China trade dispute, and the European Union’s decision to extend the United Kingdom’s departure date.
The US Federal Reserve cut interest rates in August 2019, its first reduction since 2008, as growth concerns became more pronounced, and the yield curve between the 2-year and 10-year US Treasuries inverted. The European Central Bank responded to the possibility of a recession in Germany, and accompanying lower regional growth and inflation prospects, by reviving its fiscal stimulus programme in September 2019, with a further reduction for already negative key interest rates, and the resumption of its bond buying exercise. The oil price staged a strong rally in mid-September following a terrorist attack on an oil refinery in Saudi Arabia, but subsequently retreated once it was established that significant supply could come back on-stream within weeks.
The consumer staples sector performed strongly, as the market perceived it as a beneficiary of the low interest rate environment. Perceived also as bond sensitive, the healthcare and utilities sectors also outperformed. Linked to the more cautious outlook for the global economy, oil & gas was the weakest sector over the period, while financials also underperformed, reflecting the decline in bond yields and the outlook for interest rates.
Portfolio Review
What Contributed to Returns:• Stock selection in basic materials• In industrials, aerospace and defence company, Safran, rose as management raised revenue growth guidance• Utility company, ENGIE, performed well following the release of first half earnings
What Detracted from Returns:• Stock selection and an underweight in healthcare, stock selection and an overweight in oil & gas, and stock selection in financials• Concerns about regulatory intervention in the Berlin rental market weighed on the share price of Deutsche Wohnen• German-listed healthcare company, Qiagen, downgraded 2019 guidance due to restructuring
Outlook Investors have become nervous since the start of the year, while market participants have grown increasingly pessimistic on the outlook for economic growth and geopolitical developments in Europe and abroad. This led to crowding in certain areas of the European market, in particular growth stocks, while flows into defensive and bond sensitive sectors relative to cyclicals also became stretched, reflecting the underlying cautious sentiment. As we have previously argued, the macro trade around bond-sensitive stocks has become overextended, and the backup in bond yields and sharp rotation that resulted in equity markets in September was evidence of this.

LA
ZA
RD
GL
OB
AL
AC
TIV
E F
UN
DS
PL
CInvestment Managers’ Report (continued)
16Lazard Global Active Funds plc Financial period ended 30 September 2019
We believe that asymmetry in the market continues to persist and that valuations remain attractive in a number of unloved sectors. Extremes in market positioning and investor sentiment means that even an incremental improvement in sentiment could be powerful enough to spark a further rotation of capital out of heavily crowded sectors in favour of those that have been neglected. Catalysts for another move could include an improvement in economic data, increased fiscal spending, or signs of an agreement between China and the United States, and between the United Kingdom and the European Union.
In this increasingly complex environment, we believe that our active, bottom-up stock selection approach focused on company fundamentals is best suited to uncovering investment opportunities at attractive valuations.
All data contained herein is sourced by Lazard Asset Management Limited unless otherwise noted, as at 30 September 2019.
1 Source: Lazard Asset Management Limited, NAV to NAV Price, Net Income Reinvested in Euro, ‘A’ accumulation share class Net of fees, to 30 September 2019. Index returns shown on a total return basis.
Fund Manager: Aaron Barnfather, Paul Selvey-Clinton and team.
Figures refer to past performance, which is not a reliable indicator of future results.
Lazard Asset Management Limited
Lazard European Equity Fund (continued)
Outlook (continued)

LA
ZA
RD
GL
OB
AL
AC
TIV
E F
UN
DS
PL
C
Investment Managers’ Report (continued)
17Lazard Global Active Funds plc Financial period ended 30 September 2019
Lazard Pan European Equity Fund
Investment ReviewOver the six-month period ended 30 September 2019, the Lazard Pan European Equity Fund (the “Fund”) returned 6.13% in Euro terms, against the MSCI Europe Index, which returned 5.67% 1.
Market ReviewEuropean equities closed at their session high, supported by a strong rebound at the start of 2019, growing expectations that central bank policies would remain accommodative, hopes of a resolution to the US-China trade dispute, and the European Union’s decision to extend the United Kingdom’s departure date.
The US Federal Reserve cut interest rates in August, its first reduction since 2008, as growth concerns became more pronounced, and the yield curve between the two-year and 10-year US Treasuries inverted. The European Central Bank responded to the possibility of a recession in Germany, and accompanying lower regional growth and inflation prospects, by reviving its fiscal stimulus programme in September, with a further reduction for already negative key interest rates, and the resumption of its bond buying exercise. The oil price staged a strong rally in mid-September following a terrorist attack on an oil refinery in Saudi Arabia, but subsequently retreated once it was established that significant supply could come back on-stream within weeks.
The European Union (EU) agreed to extend the United Kingdom’s departure date, but renewed fears of a no-deal Brexit departure, or the increased possibility of a UK general election, contributed to sterling weakness against the US Dollar. This provided a translation benefit to UK corporate generating overseas revenues and earnings. The Bank of England kept interest rates unchanged.
The consumer staples sector performed strongly, as the market perceived it as a beneficiary of the low interest rate environment. Perceived also as bond sensitive, the health care and utilities sectors also outperformed. Linked to the more cautious outlook for the global economy, the energy and materials sectors were weak over the period, while financials also underperformed as a result of the decline in bond yields and the outlook for interest rates.
Portfolio Review
What Contributed to Returns:• Stock selection in materials, and stock selection and an overweight in industrials • Pest control and hygiene business Rentokil performed well after reporting strong first-half results• French-listed exchange operator Euronext received clearance for its acquisition of Oslo Bors, and it delivered a strong set of
results for the first quarter
What Detracted from Returns:• Stock selection and an underweight in health care, and an overweight and stock selection in energy and real estate • Not owning Nestlé within consumer goods was the largest detractor from relative performance, as it benefited from the reduced
expectations for higher interest rates, and the decline in bond yields • Concerns about regulatory intervention in the Berlin rental market weighed on the share price of Deutsche Wohnen
Outlook Investors have become nervous since the start of the year, while market participants have grown increasingly pessimistic on the outlook for economic growth and geopolitical developments in Europe and abroad. This led to crowding in certain areas of the European market, in particular growth stocks, while flows into defensive and bond securities sectors relative to cyclicals also became stretched, reflecting the underlying cautious sentiment. As we have previously argued, the macro trade around bond-sensitive stocks has become overextended, and the backup in bond yields and sharp rotation that resulted in equity markets in September was evidence of this.

LA
ZA
RD
GL
OB
AL
AC
TIV
E F
UN
DS
PL
CInvestment Managers’ Report (continued)
18Lazard Global Active Funds plc Financial period ended 30 September 2019
We believe that asymmetry in the market continues to persist and that valuations remain attractive in a number of unloved sectors. Extremes in market positioning and investor sentiment means that even an incremental improvement in sentiment could be powerful enough to spark a further rotation of capital out of heavily crowded sectors in favour of those that have been neglected. Catalysts for another move could include an improvement in economic data, increased fiscal spending, or signs of an agreement between China and the United States, and between the United Kingdom and the EU.
In this increasingly complex environment, we believe that our active, bottom-up stock selection approach focused on company fundamentals is best suited to uncovering investment opportunities at attractive valuations.
All data contained herein is sourced by Lazard Asset Management unless otherwise noted, as at 30 September 2019.
1 Source: Lazard Asset Management Limited, NAV to NAV Price, Net Income Reinvested in Euro terms, ‘B’ distribution share class net of fees, to 30 September 2019. Index returns shown on a total return basis.
Fund Manager: Aaron Barnfather, Paul Selvey-Clinton and team.
Figures refer to past performance which is not a reliable indicator of future results.
Lazard Asset Management Limited
Lazard Pan European Equity Fund (continued)
Outlook (continued)

LA
ZA
RD
GL
OB
AL
AC
TIV
E F
UN
DS
PL
C
Investment Managers’ Report (continued)
19Lazard Global Active Funds plc Financial period ended 30 September 2019
Lazard Pan-European Small Cap Fund
Investment ReviewOver the six-month period ended 30 September 2019, the Lazard Pan-European Small Cap Fund (“the “Fund”) returned 1.20% in Euro terms, against the MSCI Europe Small Cap Index, which returned 3.00% 1.
Market ReviewEuropean equities closed at their session high, supported by a strong rebound at the start of 2019, growing expectations that central bank policies would remain accommodative, hopes of a resolution to the US-China trade dispute, and the European Union’s decision to extend the United Kingdom’s departure date until 31 October.
The US Federal Reserve cut interest rates in August, its first reduction since 2008, as growth concerns became more pronounced, and the yield curve between the two-year and 10-year US Treasuries inverted. The European Central Bank responded to the possibility of a recession in Germany, and accompanying lower regional growth and inflation prospects, by reviving its fiscal stimulus programme in September, with a further reduction for already negative key interest rates, and the resumption of its bond buying exercise. The oil price staged a strong rally in mid-September following a terrorist attack on an oil refinery in Saudi Arabia, but subsequently retreated once it was established that significant supply could come back on-stream within weeks.
Information technology was the best performing sector over the period. Perceived as defensive, utilities and communication services also outperformed. Linked to the more cautious outlook for the global economy, the energy and financials sectors declined the most.
Portfolio Review
What Contributed to Returns:• Stock selection in the health care and financials sectors• Belgian company, Barco, contributed to performance in the period as it reported upside to earnings guidance• El.En, an Italian provider of laser systems and related services for the medical and industrial industries, showed its attractive
positioning and innovation by reporting stronger earnings, and further upside to full year numbers
What Detracted from Returns:• Stock selection in the information technology and consumer discretionary sectors, and stock selection and an underweight in
real estate• Burford detracted from performance during the period. The company was subject of a research report that questioned Burford’s
accounting practices • UK-listed Smart Metering Systems reported lower than expected earnings due to the delay of installations and the decision to
retain skilled workforce
Outlook Market participants have grown increasingly pessimistic on the outlook for economic growth and geopolitical developments in Europe and abroad. This led to crowding in certain areas of the European market, in particular growth stocks, while flows into defensive sectors relative to cyclicals also became stretched, reflecting the underlying cautious sentiment. As we have previously argued, the macro trade around bond-sensitive stocks has become overextended, and the backup in bond yields and sharp rotation that resulted in equity markets in September was evidence of this.

LA
ZA
RD
GL
OB
AL
AC
TIV
E F
UN
DS
PL
CInvestment Managers’ Report (continued)
20Lazard Global Active Funds plc Financial period ended 30 September 2019
We believe that asymmetry in the market continues to persist and that valuations remain attractive in a number of under-owned sectors. Extremes in market positioning and investor sentiment means that even an incremental improvement in sentiment could be powerful enough to spark a further rotation of capital out of heavily crowded sectors in favour of those that have been neglected. Catalysts for another move could include an improvement in economic data, increased fiscal spending, or signs of an agreement between China and the United States, and between the United Kingdom and the European Union.
In this increasingly complex environment, we believe that our active, bottom-up stock selection approach focused on company fundamentals is best suited to uncovering investment opportunities at attractive valuations.
All data contained herein is sourced by Lazard Asset Management Limited unless otherwise noted, as at 30 September 2019.
1 Source: Lazard Asset Management Limited, NAV to NAV Price, Net Income Reinvested in Euro, ‘B’ accumulation share class Net of fees, to 30 September 2019. Index returns shown on a total return basis.
Fund Manager: Ed Rosenfeld and team.
Figures refer to past performance, which is not a reliable indicator of future results.
Lazard Asset Management LLC
Lazard Pan-European Small Cap Fund (continued)
Outlook (continued)
LA
ZA
RD
GL
OB
AL
AC
TIV
E F
UN
DS
PL
C
Investment Managers’ Report (continued)
21Lazard Global Active Funds plc Financial period ended 30 September 2019
Lazard UK Omega Equity Fund
Investment ReviewOver the six-month period ended 30 September 2019, the Lazard UK Omega Equity Fund (the “Fund”) returned 2.02% in Pound Sterling terms, against the FTSE All-Share Index, which returned 4.57% 1 .
Market ReviewUnited Kingdom (UK) equities rose over the period, supported by hopes of a resolution to the US-China trade dispute, growing expectations that central bank policies would remain accommodative, and the possibility of a Brexit deal before the end of October. Domestic economic data initially proved resilient, supported by consumer confidence, stockpiling in response to business uncertainty, and low unemployment.
The yield curve between two-year and 10-year US Treasuries inverted, and in the UK, 30-year bond yields slipped into negative territory for the first time. In response to the deteriorating economic outlook, the US Federal Reserve cut interest rates in August, its first reduction since 2008. The oil price staged a strong rally in mid-September following a terrorist attack on an oil refinery in Saudi Arabia, but quickly fell back as supply was restored.
The value of sterling weakened against both the US Dollar and Euro over the period, providing a translation windfall to UK corporates generating revenues and earnings overseas. Perceived as defensive, health care was the strongest performing sector during the period; industrials and telecommunications also outperformed. Reflecting their sensitivity to progress in the trade talks, returns in the technology and basic materials sectors were weak.
Portfolio Review
What Contributed to Returns:• Stock selection in telecommunications and consumer goods• Pest control and hygiene business, Rentokil, performed well after reporting strong first-half results • Medical equipment manufacturer, Smith & Nephew, performed well after reporting strong first half results, and it increased the
interim dividend
What Detracted from Returns:• Stock selection in the industrials and financials sectors• A “short attack” on litigation finance business, Burford Capital, resulted in a sharp decline in the share price• Not owning AstraZeneca detracted from relative returns, as it reported good results from one of its pipeline drugs
Outlook The prospects of a no-deal Brexit on 31 October continue to weigh on sentiment towards UK equities, although there is a range of supportive macro data, such as an economy at full employment, low current inflation and strong wage growth underpinning current returns.
Notwithstanding the outcome in October, we believe the market contains a number of opportunities that we look forward to engaging with, and where the financial productivity and valuations look very attractive at present. We believe that a bottom-up investment approach remains the best way of exploiting these opportunities within a focused portfolio approach.
All data contained herein is sourced by Lazard Asset Management Limited unless otherwise noted, as at 30 September 2019.
1 Source: Lazard Asset Management Limited, NAV to NAV Price, Net Income Reinvested in Pound Sterling, ‘C’ accumulation share class Net of fees, to 30 September 2019. Index returns shown on a total return basis.
Fund Manager: Alan Custis and team.
Figures refer to past performance which is not a reliable indicator of future results.
Lazard Asset Management Limited
LA
ZA
RD
GL
OB
AL
AC
TIV
E F
UN
DS
PL
CInvestment Managers’ Report (continued)
22Lazard Global Active Funds plc Financial period ended 30 September 2019
Lazard US Equity Concentrated Fund
Investment ReviewOver the six-month period ended 30 September 2019, the Lazard US Equity Concentrated Fund (the “Fund”) returned 8.85% in US Dollar terms, against the S&P 500 Index, which returned 5.76% 1.
Market ReviewThe United States continued to play a significant role in driving markets higher. The US equity market benefitted from good employment and economic growth figures. The decision by the US Federal Reserve (the "Fed") to lower interest rates twice during the six-month period amid mixed global economic data provided an added boost. In Europe, fears of a recession in the Eurozone and ongoing uncertainty about the fate of Brexit in the United Kingdom weighed on European equity markets during the third quarter. Meanwhile in Asia, the Hong Kong equity market suffered a significant decline in the six-month period as a result of ongoing civil unrest. The sharp rise in the price of gold was another notable feature during the period.
The protracted trade war between the United States and China weighed on emerging markets and export-dependent countries. Trade tensions between the United States on the one hand and Europe, Japan, and India on the other, as well as a limited trade war between Japan and Korea, further undermined stock market confidence.
Central bank activity played a significant role in calming markets in the face of growing anxiety about a global economic slowdown, trade wars, and Brexit. In addition to the two 25 basis points (bps) cuts by the Fed, the European Central Bank further reduced negative rates from -40 to -50 bps, while the Bank of England indicated that it is ready to reduce rates to offset the impact of a possible Brexit.
Portfolio Review
What Contributed to Returns:• A position in medical device maker, Medtronic, contributed to performance, as the shares rose after the company reported
quarterly results above expectations• Construction aggregate maker, Vulcan Materials, helped returns after reporting solid quarterly results, driven by attractive pricing
and volume growth• Construction materials maker, Armstrong, also helped returns, as shares rose after the company reported results broadly above
expectations, driven by strong pricing
What Detracted from Returns:• Networking equipment maker, Cisco, detracted from performance after reporting results for the final quarter of the year• Shares in animal health company, Elanco, fell after the company announced plans to acquire Bayer’s animal health unit• Toolmaker, Kennametal, also hurt returns after the company reported third-quarter results below expectations, hurt by softer sales
across its businesses. We exited our position in July

LA
ZA
RD
GL
OB
AL
AC
TIV
E F
UN
DS
PL
C
Investment Managers’ Report (continued)
23Lazard Global Active Funds plc Financial period ended 30 September 2019
Outlook While the uncertainty of trade wars and other political issues are numerous, the global economic outlook is more balanced. Unemployment is low, inflation is largely non-existent, and central banks are highly accommodative toward providing economic stimulus. Nevertheless, equity valuations are high, especially in companies demonstrating even the slightest modicum of growth. Looking forward, the geopolitical environment looks highly uncertain. A lack of any meaningful progress on trade or impeachment/hard Brexit would increase volatility and potentially trigger another market correction akin to the fourth quarter of 2018. While the odds of a global recession seem to be remote, corporate earnings are expected to see their third straight quarterly decline, though at a modest rate. We expect that any decline will be driven by a political rather than financial or economic shortcoming.
All data contained herein is sourced by Lazard Asset Management Limited unless otherwise noted, as at 30 September 2019.
1 Source: Lazard Asset Management Limited, NAV to NAV Price, Net Income Reinvested in US Dollars, ‘EA’ accumulation share class Net of fees, to 30 September 2019. Index returns shown on a total return basis.
Fund Manager: Christopher Blake, Martin Flood and team.
Figures refer to past performance, which is not a reliable indicator of future results.
Lazard Asset Management LLC
Lazard US Equity Concentrated Fund (continued)

LA
ZA
RD
GL
OB
AL
AC
TIV
E F
UN
DS
PL
CInvestment Managers’ Report (continued)
24Lazard Global Active Funds plc Financial period ended 30 September 2019
Lazard Japanese Strategic Equity Fund
Investment ReviewOver the six-month period ended 30 September 2019, the Lazard Japanese Strategic Equity Fund (the “Fund”) returned 3.84% in Japanese Yen terms, against the Tokyo Stock Price Index (“TOPIX”) Total Return Index, which returned 0.96% 1.
Market ReviewJapanese equities delivered a muted total performance over the period, with the TOPIX rising by 1% against the backdrop of broader markets volatility. Following a recovery in equity performance during the March quarter, Japanese stocks performed weakly as the on-going US/China trade friction negatively affected sentiment, as did continuing earnings estimate cuts. However, sentiment improved markedly in September, with the TOPIX rebounding nearly 6%, thanks to central bank action by the US Federal Reserve and the European Central Bank.
Some pro-cyclical sectors such as steel and paper continued to perform poorly over the review period, but other pro-cyclical sectors such as marine transportation and electrical appliances started to experience a recovery. Higher quality pro-cyclical names fared well as investors started to discount a 2021 recovery and a stronger secular outlook for these winners.
Portfolio Review
What Contributed to Returns:• Sony, where management continued to execute well, delivering better than expected earnings. In addition, expectations of
continued governance improvements increased• Tokyo Electron, which is a global winner in the semiconductor equipment industry. Although near-term semiconductor
fundamentals are weak, Tokyo Electron has benefited from a strong secular outlook, and expectations of a recovery in 2021 and beyond
• Disco is a global leader in the semiconductor equipment industry. Although industry indicators are currently soft, Disco has benefited from a strong secular outlook and expectations of a recovery in 2021 and beyond
What Detracted from Returns:• Mitsubishi Corporation, where weaker global economic outlook has hurt the outlook for its commodity related businesses • Makita, as weaker global demand as well as rising costs led to significant earnings downgrades. Management continues to
disappoint in terms of allocating capital • Izumi experienced disappointing sales growth, while higher costs associated with new stores weighed heavily on earnings. This
slower earnings outlook has resulted in significant valuation multiple compression
Outlook There is further evidence of a revival in value investing in Japan, including a modest recovery in oversold cyclical and technology stocks. Investors appear to be repositioning their portfolios in response to the modest adjustment in the US yield curve, a possible indication that the US economy is slowing.
That this recalibration is occurring most noticeably in financial stocks should come as no surprise, but we believe that it has caught out a number of active managers ill-prepared to deal effectively with significant, unpredictable sector movements. As we have previously discussed, it is difficult to identify when a market rotation from fixed income to financials stocks might occur, we think it is important to retain adequate flexibility in the portfolio.
All data contained herein is sourced by Lazard Asset Management Limited unless otherwise noted, as at 30 September 2019.
1 Source: Lazard Asset Management Limited, NAV to NAV Price, Net Income Reinvested in Japanese Yen, ‘A’ accumulation share class Net of fees, to 30 September 2019. Index returns shown on a total return basis.
Fund Manager: Tim Griffen and team.
Figures refer to past performance which is not a reliable indicator of future results.
Lazard Japan Asset Management K.K.
LA
ZA
RD
GL
OB
AL
AC
TIV
E F
UN
DS
PL
C
Investment Managers’ Report (continued)
25Lazard Global Active Funds plc Financial period ended 30 September 2019
Lazard Emerging World Fund
Investment ReviewOver the six-month period ended 30 September 2019, the Lazard Emerging World Fund (the “Fund”) returned -1.28% in US Dollar terms, against the MSCI Emerging Markets Index, which returned -3.66% 1.
Market ReviewDuring the period, equity markets in the developing world retreated as mounting global economic challenges undercut investors’ appetites for riskier assets, but central bank activity to increase global liquidity mitigated some of the market anxiety. In the United States, the Federal Reserve (the "Fed") cut interest rates by 25 basis points (bps) twice. Across the Atlantic, the European Central Bank reduced negative rates from minus 40 to minus 50 bps. Among major emerging economies, central banks in Brazil, India, and Turkey cut interest rates appreciably during the same period.
The protracted trade war between the United States and China continued to be a drag on emerging markets, while trade tensions between the United States on the one hand and Europe, Japan, and India on the other, as well as a limited trade war between Japan and South Korea, further dampened risk sentiment.
The Europe, the Middle East, and Africa region (EMEA) outperformed the broader market benchmark. In emerging Europe, the Russian equity market surged, thanks to a recovery in the price of oil and investor confidence that the United States would not impose any additional sanctions.
Latin America also performed relatively well, as Brazil’s equity market benefitted from a significant interest rate cut by the country’s central bank and encouraging news about pension-reform legislation. Emerging Asia underperformed the index on concerns that China’s was slowing.
Portfolio Review
What Contributed to Returns:• Underweight exposures to South Korea and South Africa boosted relative performance, as did overweight exposure to emerging
Europe• The top contributors were investments focused on frontier markets, emerging Europe, and global emerging markets (GEM)
investment companies• JPMorgan Russian Securities rose more than 27%, compared to the 15% gain recorded by the Russian equity market, helped by
discount compression of 780 basis points
What Detracted from Returns:• The high level of investments focused on China, as discounts on investments in the region expanded• By country, investments in China performed the weakest while underweighting Taiwan, which performed strongly, hurt relative returns• Performance in China was led lower by Prosus, a recently listed company with ownership stakes in key Asian technology
companies, and Fidelity China Special Situations
Outlook While macroeconomic and political issues will continue to influence the asset class, we believe that emerging markets economic growth will endure despite the recent decline in global growth expectations. Given the trouble spots as well as areas of great potential in the current markets, skilled stock selection and a long term investment horizon remains essential.
All data contained herein is sourced by Lazard Asset Management Limited, unless otherwise noted, as at 30 September 2019.
1 Source: Lazard Asset Management Limited, NAV to NAV Price, Net Income Reinvested in US Dollar terms, ‘A’ accumulation share class Net of fees, to 30 September 2019. Index returns shown on a total return basis.
Fund Manager: Kun Deng and team.
Figures refer to past performance which is not a reliable indicator of future results.
Lazard Asset Management LLC

LA
ZA
RD
GL
OB
AL
AC
TIV
E F
UN
DS
PL
CInvestment Managers’ Report (continued)
26Lazard Global Active Funds plc Financial period ended 30 September 2019
Lazard Emerging Markets Equity Fund
Investment ReviewOver the six-month period ended 30 September 2019, the Lazard Emerging Markets Equity Fund (the “Fund”) returned -1.47% in US Dollar terms, against the MSCI Emerging Markets Index, which returned 3.66% 1.
Market ReviewEmerging markets declined over the period, as concerns over slowing global economic growth and trade tensions and tariff actions dominated the environment. Asian stocks were affected by trade issues; Latin American shares also declined, while emerging European markets actually rose.
Greek and Russian shares performed strongly over the six months. Turkish equities also rebounded as inflation and trade indicators improved, and the currency demonstrated signs of stability. European Union tensions over Brexit and a weaker German economy hurt returns in Poland and the Czech Republic. In South Africa, the market remained unimpressed at the government’s lack of urgency to establish a pro-growth economy.
In Asia, equities in China were range-bound on trade tensions with the United States and tariff increases. Indian stocks were aided by Prime Minister Narendra Modi’s re-election and a corporate tax cut, but this was more than offset by signs of a slowing economy. South Korean equities were also affected by concerns over economic growth, but improving expectations for semiconductor prices helped share prices there and especially in Taiwan.
Most markets in Latin America finished lower. Weaker copper prices helped to pressure Chilean share prices. Brazilian equities rose modestly as pension reform legislation moved forward. Mexican equity prices finished the period virtually unchanged. An August primary election in Argentina resulted in a collapse in local share prices.
Portfolio Review
What Contributed to Returns:• Stock selection in the communication services, financials and industrials sectors and South Korea added value. A higher-than-
benchmark exposure to Russia also helped• Shares of Gazprom, a Russian gas company, surged after the company announced a sharp rise in the dividend payout• Sberbank, a Russian bank, reported strong May profits with supportive net interest margin trends
What Detracted from Returns:• Stock selection in the consumer staples sector detracted from performance• Shares of YPF, an Argentine energy company, dipped sharply along with the whole market, after the country’s surprising primary
election result• The share price of Banco do Brasil, a Brazilian bank, corrected on rumours of a potential stake-sale by a closed-end fund
Outlook Recent gains in emerging markets equities have left many investors wondering what will drive returns going forward. Investors continue to face a number of uncertainties, but we believe the potential negative effects from these uncertainties are mostly priced into markets. The positive effects that could come from their resolution, on the other hand, are mostly not.
Emerging markets equity valuations continue to be attractive compared to developed markets equities, and that should attract investors seeking higher relative growth prospects. We also note that equity declines in 2018 significantly lowered emerging markets valuations. Notwithstanding year-to-date gains, emerging markets equities can offer discounted exposure to potentially greater growth opportunities, as well as relatively attractive free cash flow and dividend yields.

LA
ZA
RD
GL
OB
AL
AC
TIV
E F
UN
DS
PL
C
Investment Managers’ Report (continued)
27Lazard Global Active Funds plc Financial period ended 30 September 2019
Finally, we believe the long-term emerging markets "story” remains valid. We continue to believe that, regardless of higher volatility and relatively short-term changes in investor confidence, the overall trends in emerging markets—higher growth potential, stabilizing institutions, a rising middle class of consumers—are positive. In fact, the gap between emerging and US economic growth is expected to widen again after shrinking for two years. This is likely as stimulus efforts drive growth in China, which has become an engine of the global economy. More important for equities, we believe emerging markets are poised to deliver stronger earnings than in the United States.
All data contained herein is sourced by Lazard Asset Management Limited unless otherwise noted, as at 30 September 2019.
1 Source: Lazard Asset Management Limited, NAV to NAV Price, Net Income Reinvested in US Dollars, ‘A’ accumulation share class Net of fees, to 30 September 2019. Index returns shown on a total return basis.
Fund Manager: James Donald and team.
Figures refer to past performance, which is not a reliable indicator of future results.
Lazard Asset Management LLC
Lazard Emerging Markets Equity Fund (continued)
Outlook (continued)
LA
ZA
RD
GL
OB
AL
AC
TIV
E F
UN
DS
PL
CInvestment Managers’ Report (continued)
28Lazard Global Active Funds plc Financial period ended 30 September 2019
Lazard Emerging Markets Core Equity Fund
Investment ReviewOver the six-month period ended 30 September 2019, the Lazard Emerging Markets Core Equity Fund (the “Fund”) returned -2.48% in US Dollar terms, against the MSCI Emerging Markets Index, which returned -3.66% 1.
Market ReviewEmerging markets declined over the period, as concerns over slowing global economic growth and trade tensions and tariff actions dominated the environment. Asian stocks were affected by trade issues; Latin American shares also declined, while emerging European markets actually rose.
Greek and Russian shares performed strongly over the six months. Turkish equities also rebounded as inflation and trade indicators improved, and the currency demonstrated signs of stability. European Union tensions over Brexit and a weaker German economy hurt returns in Poland and the Czech Republic. In South Africa, the market remained unimpressed at the government’s lack of urgency to establish a pro-growth economy.
In Asia, equities in China were range-bound on trade tensions with the United States and tariff increases. Indian stocks were aided by Prime Minister Narendra Modi’s re-election and a corporate tax cut, but this was more than offset by signs of a slowing economy. South Korean equities were also affected by concerns over economic growth, but improving expectations for semiconductor prices helped share prices there and especially in Taiwan.
Most markets in Latin America finished lower. Weaker copper prices put pressure on Chilean share prices. Brazilian equities rose modestly as pension reform legislation moved forward. Mexican equity prices finished the period virtually unchanged. An August primary election in Argentina resulted in a collapse in local share prices.
Portfolio Review
What Contributed to Returns:• Security selection in the industrials, financials, information technology, and communication services sectors, as well as in China
and South Korea helped performance. An overweight to Russian securities added to returns• Taiwan Semiconductor Manufacturing Company, a leading semiconductor foundry business in Taiwan, ended higher on
expectations of stronger 2020 earnings growth, driven by 5G demand, as well as a rebound in high performance computing demand
• New Oriental Education & Technology Group, the largest provider of private educational services in China, closed higher as its online subsidiary Koolearn reported stronger revenue growth in its 2019 results
What Detracted from Returns:• Stock selection in Russia, as well as in the energy sector, detracted from returns, as did an overweight in the materials sector• Braskem, a Brazilian petrochemical company, closed lower as LyondellBasell Industries broke-off formal discussions to acquire
the company• Ternium, a steel manufacturer with operations across Latin America, declined as rising input costs weighed on the stock’s
performance
Outlook Recent gains in emerging markets equities have left many investors wondering what will drive returns going forward. Investors continue to face a number of uncertainties, but we believe the potential negative effects from these uncertainties are mostly priced into markets. The positive effects that could come from their resolution, on the other hand, are mostly not.
LA
ZA
RD
GL
OB
AL
AC
TIV
E F
UN
DS
PL
C
Investment Managers’ Report (continued)
29Lazard Global Active Funds plc Financial period ended 30 September 2019
Emerging markets equity valuations continue to be attractive compared to developed markets equities, and that should attract investors seeking higher relative growth prospects. We also note that equity declines in 2018 significantly lowered emerging markets valuations. Notwithstanding year-to-date gains, emerging markets equities can offer discounted exposure to potentially greater growth opportunities, as well as relatively attractive free cash flow and dividend yields.
Finally, we believe the long-term emerging markets "story” remains valid. We continue to believe that, regardless of higher volatility and relatively short-term changes in investor confidence, the overall trends in emerging markets—higher growth potential, stabilizing institutions, a rising middle class of consumers—are positive. In fact, the gap between emerging and US economic growth is expected to widen again after shrinking for two years. This is likely as stimulus efforts drive growth in China, which has become an engine of the global economy. More important for equities, we believe emerging markets are poised to deliver stronger earnings than in the United States.
All data contained herein is sourced by Lazard Asset Management Limited unless otherwise noted, as at 30 September 2019.
1 Source: Lazard Asset Management Limited, NAV to NAV Price, Net Income Reinvested in US Dollars, ‘A’ accumulation share class Net of fees, to 30 September 2019. Index returns shown on a total return basis.
Fund Manager: Stephen Russell and team.
Figures refer to past performance, which is not a reliable indicator of future results.
Lazard Asset Management LLC
Lazard Emerging Markets Core Equity Fund (continued)
Outlook (continued)

LA
ZA
RD
GL
OB
AL
AC
TIV
E F
UN
DS
PL
CInvestment Managers’ Report (continued)
30Lazard Global Active Funds plc Financial period ended 30 September 2019
Lazard Emerging Markets Equity Advantage Fund
Investment ReviewOver the six-month period ended 30 September 2019, the Lazard Emerging Markets Equity Advantage Fund (the “Fund”) returned -2.66% in US Dollar terms, against the MSCI Emerging Markets Index, which returned -3.66% 1.
Market ReviewEmerging markets remained volatile over the period. Trade wars dominated investor sentiment, as markets vacillated over the apparent Chinese and United States willingness to negotiate on trade. Both countries enacted a new set of tariffs, as rhetoric reached a crescendo in August with the US allegation of currency manipulation and blacklisting of Huawei, the China telecommunications giant. The Japan – South Korea trade war also weighed on Asian markets, with an apparent thaw in September benefiting the South Korean market.
The period was also punctuated by several headline grabbing events including Argentina’s debt default and currency plunge, which sent its stock market significantly lower and which resulted in the imposition of currency controls. A surprise attack in September on Saudi Arabia’s Abqaiq and Khurais oil refineries, which accounted for approximately 5% of the world’s oil supply, drove oil prices 15% higher before they retreated at month end. Market leaders during the period included Turkey and Russia. Both these markets saw a sharp drop in interest rates, largely driven by accommodative policies instituted by their central banks. Taiwan also posted a strong return, as its tech laden stock-market proved resistant to the slowing global economy. The country’s 2020 will be closely watched as it will likely define ongoing relations with China. In addition to Argentina, Chile and Peru both lagged as their commodity dominated exchanges fell, reflecting the weakening global economy.
Portfolio Review
What Contributed to Returns:• An overweight in the information technology sector and an underweight in consumer discretionary were the largest contributors
from an allocation standpoint• Stock selection was strong in financials and healthcare• Stock selection in China, and stock selection and an overweight in Taiwan provided much of the excess return
What Detracted from Returns:• An underweight in utilities and communication services detracted• Stock selection lagged in communication services, consumer staples, energy and utilities• Stock selection in India also detracted, as did an overweight in Argentina, and an underweight and stock selection in Brazil
Outlook A slowing global economy and broadening trade wars have had an adverse impact on emerging markets for much of the past year, which have lagged developed markets for much of the period. Coupled with a strengthening US Dollar and concerns over sovereign debt levels, investors have been slow to commit capital to the emerging markets. Given the valuation disparity between emerging and developed markets, and dovish posturing from the central banks and pro-growth policies in several countries including India, Thailand and Brazil, we believe that this could potentially erase some of the recent underperformance and reverse investor sentiment toward the emerging markets.
We will continue to focus our systematic approach on a fundamentally based, bottom-up stock selection process.
All data contained herein is sourced by Lazard Asset Management Limited, unless otherwise noted, as at 30 September 2019.
1 Source: Lazard Asset Management Limited, NAV to NAV Price, Net Income Reinvested in US Dollars, ‘EA’ accumulation share class Net of fees, to 30 September 2019. Index returns shown on a total return basis.
Fund Manager: Paul Moghtader and team.
Figures refer to past performance, which is not a reliable indicator of future results.
Lazard Asset Management LLC

LA
ZA
RD
GL
OB
AL
AC
TIV
E F
UN
DS
PL
C
Investment Managers’ Report (continued)
31Lazard Global Active Funds plc Financial period ended 30 September 2019
Lazard Developing Markets Equity Fund
Investment ReviewOver the six-month period ended 30 September 2019, the Lazard Developing Markets Equity Fund (the “Fund”) returned -2.00% in US Dollar terms, against the MSCI Emerging Markets Index, which returned -3.66% 1.
Market ReviewEmerging markets declined over the period, as concerns over slowing global economic growth and trade tensions and tariff actions dominated the environment. Asian stocks were affected by trade issues; Latin American shares also declined, while emerging European markets actually rose.
Greek and Russian shares performed strongly over the six months. Turkish equities also rebounded as inflation and trade indicators improved, and the currency demonstrated signs of stability. European Union tensions over Brexit and a weaker German economy hurt returns in Poland and the Czech Republic. In South Africa, the market remained unimpressed at the government’s lack of urgency to establish a pro-growth economy.
In Asia, equities in China were range-bound on trade tensions with the United States and tariff increases. Indian stocks were aided by Prime Minister Narendra Modi’s re-election and a corporate tax cut, but this was more than offset by signs of a slowing economy. South Korean equities were also affected by concerns over economic growth, but improving expectations for semiconductor prices helped share prices there and especially in Taiwan.
Most markets in Latin America finished lower. Weaker copper prices helped to pressure Chilean share prices. Brazilian equities rose modestly as pension reform legislation moved forward. Mexican equity prices finished the period virtually unchanged. An August primary election in Argentina resulted in a collapse in local share prices.
Portfolio Review
What Contributed to Returns:• Stock selection in the consumer discretionary, consumer staples, financials, healthcare and information technology sectors as well
as in Brazil, Colombia, China, India and South Korea helped performance. Lower than index exposure in the materials sector as well as to Saudi Arabia, and higher than index exposure to Russia added value
• Notre Dame Intermedica, a Brazilian vertically integrated healthcare provider, outperformed on strong new net member growth, and accelerating synergies from a recent acquisition
• New Oriental Education and Technology Group, an English language learning service provider in China, outperformed after management’s strong margin guidance
What Detracted from Returns:• Stock selection in the communication services, materials and utilities sectors as well as in Russia detracted value. Lower than
index exposure within the consumer staples sector as well as to Taiwan, and higher than index exposure within the communication services and healthcare sectors as well as to Peru hurt performance
• KAZ Minerals, a Kazakh copper miner, dropped as a result of weaker copper prices• Focused Photonics, a Chinese environmental and process control test systems company, underperformed after announcing second
quarter results that showed growth at the lower end of their guided range
Outlook Recent gains in emerging markets equities have left many investors wondering what will drive returns going forward. Investors continue to face a number of uncertainties, but we believe the potential negative effects from these uncertainties are mostly priced into markets. The positive effects that could come from their resolution, on the other hand, are mostly not.

LA
ZA
RD
GL
OB
AL
AC
TIV
E F
UN
DS
PL
CInvestment Managers’ Report (continued)
32Lazard Global Active Funds plc Financial period ended 30 September 2019
Emerging markets equity valuations continue to be attractive compared to developed markets equities, and that should attract investors seeking higher relative growth prospects. We also note that equity declines in 2018 significantly lowered emerging markets valuations. Notwithstanding year-to-date gains, emerging markets equities can offer discounted exposure to potentially greater growth opportunities, as well as relatively attractive free cash flow and dividend yields.
Finally, we believe the long-term emerging markets "story” remains valid. We continue to believe that, regardless of higher volatility and relatively short-term changes in investor confidence, the overall trends in emerging markets—higher growth potential, stabilizing institutions, a rising middle class of consumers—are positive. In fact, the gap between emerging and US economic growth is expected to widen again after shrinking for two years. This is likely as stimulus efforts drive growth in China, which has become an engine of the global economy. More important for equities, we believe emerging markets are poised to deliver stronger earnings than in the United States.
All data contained herein is sourced by Lazard Asset Management Limited unless otherwise noted, as at 30 September 2019.
1 Source: Lazard Asset Management Limited, NAV to NAV Price, Net Income Reinvested in US Dollars, ‘A’ accumulation share class Net of fees, to 30 September 2019. Index returns shown on a total return basis.
Fund Manager: James Donald and team.
Figures refer to past performance, which is not a reliable indicator of future results.
Lazard Asset Management LLC
Lazard Developing Markets Equity Fund (continued)
Outlook (continued)
LA
ZA
RD
GL
OB
AL
AC
TIV
E F
UN
DS
PL
C
Investment Managers’ Report (continued)
33Lazard Global Active Funds plc Financial period ended 30 September 2019
Lazard MENA Fund
Investment ReviewOver the six-month period ended 30 September 2019, the Lazard MENA Fund (the “Fund”) returned -2.36% in US Dollar terms, against the S&P Pan Arab Composite LargeMidCap Net Total Return Index, which returned -3.17% 1.
Market ReviewThe benchmark index closed the period on a weak note, surrendering many of the gains built up earlier in the year by Saudi Arabia’s inclusion into the MSCI and FTSE Emerging Market indices, which had benefitted that market and Kuwait, financials and large cap stocks. Bahrain was the best performing regional market over the half-year, helped by the announcement of a merger between Ahli United Bank and Kuwait Finance House. Saudi Arabia accounts for half of the benchmark weighting, but following the MSCI and FTSE moves, investors exited the market to seek out better value elsewhere in the region. Other regional markets that declined over the period included the United Arab Emirates (UAE), Lebanon and Jordan. Egypt delivered a strong performance, helped by significant positive macro-economic headwinds, and falling inflation and interest rates, and in spite of major protests in the latter part of September.
Portfolio Review
What Contributed to Returns:• Stock selection in the real estate, industrials, and consumer staples sectors, an overweight in the consumer discretionary, energy
and health care sectors and no holding in information technology sector all helped performance• Stock selection in the UAE, an underweight in Saudi Arabia, and an overweight in Oman had a positive effect on performance• Intentionally not holding Saudi Basic Industries due to its expensive valuation helped the portfolio’s relative performance
What Detracted from Returns:• Stock selection and an underweight in communication services and financials, and no holdings in utilities detracted• Stock selection and an underweight in Kuwait, and no holdings in Qatar and Bahrain also weighed on performance• No significant improvement in motor insurance for Malath meant that investor interest dissipated, resulting in its relative
underperformance
Outlook With the majority of passive flows finding their way to Saudi index names with large caps and financials taking the lion’s share, market participants are expected to focus on fundamentals and valuations. Accordingly, any move into cheaper and less markets would not be surprising, nor would an adjustment from major index names and large caps to smaller non-index names, as a result of a significant valuation gap.
If these moves materialise, that would be beneficial to the portfolio, which has focused on attractively valued names, while ignoring speculative index flows prepositioning.
We also continue to see significant valuation upside in the underlying names in the portfolio, most of which trade at a significant discount to what we consider to be their intrinsic values.
All data contained herein is sourced by Lazard Asset Management Limited unless otherwise noted as at 30 September 2019.
1 Source: Lazard Asset Management Limited, NAV to NAV Price, Net Income Reinvested in US Dollars, ‘EA’ accumulation share class Net of fees, to 30 September 2019. Index returns shown on a total return basis.
Fund Manager: Fadi Al Said and team.
Figures refer to past performance, which is not a reliable indicator of future results.
Lazard Gulf Limited

LA
ZA
RD
GL
OB
AL
AC
TIV
E F
UN
DS
PL
CInvestment Managers’ Report (continued)
34Lazard Global Active Funds plc Financial period ended 30 September 2019
Lazard Global Fixed Income Fund
Investment ReviewOver the six-month period ended 30 September 2019, the Lazard Global Fixed Income Fund (the “Fund”) returned 3.65% in US Dollar terms, against the Barclays Global Aggregate Bond Total Return Index, which returned 4.03% 1.
Market ReviewGlobal fixed income markets consolidated in April after a volatile first quarter, but escalating global trade tensions and concerns over growth prospects drove a strong bond market rally during May and June, which continued in the third quarter.
The US Federal Reserve (the "Fed") delivered highly anticipated rate cuts in July and September, but comments by, and dissension amongst, Fed officials appeared to temper some of the dovish enthusiasm for the path of future potential rate cuts. The 10-year Treasury yield traded in a range of more than 100 basis points (bps) during the two-quarter period, closing near the lower end of the range at 1.66%. These low levels were last seen during the middle of 2016. Furthermore, the long bond (30-year Treasury) breached the 2.00% level for the first time ever, but it closed at 2.11%. There was a high quality bond rally in Australia, New Zealand, Canada, the United Kingdom, and core Europe, but government bonds in Japan were noticeably stable, perhaps due to rich valuations and light activity outside of domestic Japanese investors and Bank of Japan. German rates made headlines as the entire yield curve traded at negative yields for the first time ever.
Credit spreads continued to tighten across many sectors in spite of some risk aversion (driven by the August turmoil in Argentina) reflected in lower quality/riskier areas of the high yield and emerging market sectors. In addition, the energy sector underperformed other corporate credits and experienced considerable weakness during the third quarter. Corporate earnings were generally positive, underpinning the resilient credit sentiment, especially combined with favourable flows from retail and institutional investors.
Currency markets were active during the period, as US Dollar strength prevailed. The Japanese Yen maintained its safe haven status with a stable performance versus the US Dollar during the period, but the Euro and Pound Sterling lost ground, given the weaker economic data and political uncertainty in both areas. A variety of other currencies also weakened over the period, including the Chinese Yuan (down by over 6%) and Argentinian Peso, which fell by over 25% during the period and by almost 35% on a year-to date basis.
Portfolio Review
What Contributed to Returns:• Country Allocation: Overweight market value and contribution to duration in countries and regions such as Australia, Chile,
Czech Republic, Hungary, Poland, Norway, Singapore, and United States• Currency Effect: Underweighting the Chinese Yuan, South Korean Won and a tactical overweight in the Japanese Yen• Security selection in Australia, Canada, Norway and the United States
What Detracted from Returns:• Country allocation: Underweight market value and contribution to duration in Japan and Europe (local Italy in particular)• Currency effect: Underperformance of the portfolio’s Euro proxies (underweighting the Euro with a corresponding overweight
in the Norwegian Krone and Czech Koruna)• Modest currency exposure to the Australian Dollar, New Zealand Dollar and Pound Sterling
Outlook In July, the International Monetary Fund (IMF) cut its outlook for 2019 global growth to 3.2%, the fourth downgrade since last October. Recent data suggests that the downturn in manufacturing and trade activity is broad-based, and business confidence is deflating, especially for export-driven nations. Given the strong consensus views and positioning on dovish monetary policy around the world, any changes in growth differentials could be a key factor in currency markets. Weak global export conditions will likely continue to put pressure on currencies for countries such as China, so we are currently underweight exposure to that market. We favor currency positioning aimed at reducing hedge costs in the portfolio specifically we are maintaining an underweight position in the Euro and are using the Czech Koruna and Norwegian Krone as proxy exposure, given the favorable cost savings compared to the Euro.

LA
ZA
RD
GL
OB
AL
AC
TIV
E F
UN
DS
PL
C
Investment Managers’ Report (continued)
35Lazard Global Active Funds plc Financial period ended 30 September 2019
For interest rates, we expect more volatility within recent ranges, and we would consider adding duration exposure in some countries on a backup in yields. Elsewhere we will continue to look for additional opportunities in select countries to take profits on longer maturity bonds and re-invest in attractive shorter maturity or floating rate notes. Given the uncertainty in upcoming trade/tariff developments, we are mindful of maintaining appropriate allocations to US rates (and the Japanese Yen/Swiss Franc as flight-to-quality proxies). We believe our ability to separate bond and currency investment decisions is crucial to generating returns in the portfolio, and an active, tactical approach is key to fixed income investing.
All data contained herein is sourced by Lazard Asset Management unless otherwise noted, as at 30 September 2019.
1 Source: Lazard Asset Management Limited, NAV to NAV Price, Net Income Reinvested in US Dollars, ‘A’ accumulation share class Net of fees, to 30 September 2019. Index returns shown on a total return basis.
Fund Manager: Yvette Klevan and team.
Figures refer to past performance which is not a reliable indicator of future results.
Lazard Asset Management LLC
Lazard Global Fixed Income Fund (continued)
Outlook (continued)
LA
ZA
RD
GL
OB
AL
AC
TIV
E F
UN
DS
PL
CInvestment Managers’ Report (continued)
36Lazard Global Active Funds plc Financial period ended 30 September 2019
Lazard Sterling High Quality Bond Fund
Investment ReviewOver the six-month period ended 30 September 2019, the Lazard Sterling High Quality Bond Fund (the “Fund”) returned 7.44% in Pound Sterling terms, against the Markit iBoxx Sterling Overall Index, which returned 7.30% 1.
Market ReviewOver the six-month period under review, corporate bonds denominated in Sterling underperformed UK government bonds by six basis points. 10-year UK government yields peaked at 1.7% in October and then declined below 1% towards the end of the reporting period, driven by slowing economic growth and Brexit uncertainty. Statements by the new Italian government perceived as hostile towards the European Union resulted in a risk-off move, which partly spilled over to sterling assets.
Having traded sideways throughout the summer, credit spreads took a hit when markets were troubled by growing fears of recession towards the end of 2018. With inflation running above the Bank of England’s 2% target, the Monetary Policy Committee voted to raise UK base rate to 0.7% at its August meeting. It stayed on hold for the rest of the review period, given the uncertainties of a hard Brexit and slowing inflation. UK government bonds remained well supported towards the end of the reporting period.
Portfolio Review
What Contributed to Returns:• Security selection in financials contributed to the Fund’s relative and absolute performance• An overweight in the telecommunications contributed to the Fund’s relative and absolute performance• An overweight and security selection in transportation contributed to the Fund’s relative and absolute performance
What Detracted from Returns:• An underweight in UK government bonds detracted from the relative performance• An underweight and security selection in utilities hurt the relative and absolute performance• A slight underweight in healthcare detracted from relative and absolute performance
Outlook The Fund closed on 14 October 2019.
All data contained herein is sourced by Lazard Asset Management Limited unless otherwise noted, as at 30 September 2019.
1 Source: Morningstar Direct, NAV to NAV Price, Gross Income Reinvested in Pound Sterling, ‘A’ distribution share class Net of fees, to 30 September 2019. Index returns shown on a total return basis.
Fund Manager: Benjamin Boehme, Ulrich Teutsch and team.
Figures refer to past performance which is not a reliable indicator of future results.
Lazard Asset Management (Deutschland) GmbH

LA
ZA
RD
GL
OB
AL
AC
TIV
E F
UN
DS
PL
C
37Lazard Global Active Funds plc Financial period ended 30 September 2019
Financial Statements (Unaudited)
Statement of Comprehensive Income
Lazard Global Listed Infrastructure Equity Fund
Lazard Global Strategic Equity Fund
Lazard Global Equity Select Fund
30/09/2019 30/09/2018 30/09/2019 30/09/2018 30/09/2019 30/09/2018
Notes GBP GBP USD USD USD USD
Investment income
Bond income – – – – – –
Dividend income 36,714,501 32,481,015 86,467 135,922 162,462 134,071
Bank interest 0 32,509 3,267 907 393 2,249 556
Other income 4 3,212 – – – – –
0
Net realised gain/(loss) on investments and foreign currency 0 41,866,930 18,725,097 171,443 951,381 (143,634) 183,236Net movement in unrealised gain/(loss) on investments and foreign currency 0 56,281,137 53,265,430 169,488 (542,478) 776,265 380,891
0
Total investment income 0 134,898,289 104,474,809 428,305 545,218 797,342 698,754
0
Expenses 0
Management fees 3 5,909,673 5,894,139 16,958 50,217 51,122 50,137
Administration, transfer agency & depositary fees 3 856,484 853,876 14,059 13,683 18,837 19,061
Legal fees 0 67,159 106,844 472 754 2,427 3,299
Audit fees 0 4,550 4,137 4,860 5,240 4,860 5,237
Directors’ fees 3 20,941 20,692 146 210 206 154
Tax advice and professional fees 0 15,190 22,264 6,917 7,605 4,482 3,945
Other expenses 0 76,291 58,643 5,032 2,715 4,068 2,409
0
Total expenses 0 6,950,288 6,960,595 48,444 80,424 86,002 84,242
0
Reimbursement from Manager 3 – – (9,449) (4,179) (2,651) (4,593)
0
Net investment income 0 127,948,001 97,514,214 389,310 468,973 713,991 619,105
0
Finance costs 0
Distributions 13 (8,581,540) (9,971,390) – (4,956) (5) –
Bank interest 0 (2,389) (9,903) – (1) – –
Total finance costs 0 (8,583,929) (9,981,293) – (4,957) (5) –
0
Profit for the financial period before tax 0 119,364,072 87,532,921 389,310 464,016 713,986 619,105
0
Foreign capital gains tax on appreciated securities – – – – – 229
Withholding tax 0 (5,188,946) (3,997,279) (15,206) (22,834) (25,504) (17,649)
0
Profit for the financial period after tax 0 114,175,126 83,535,642 374,104 441,182 688,482 601,685
Adjustment for write-off of organisational costs 0 – – – – – –
0Net movement in net assets attributable to holders of redeemable participating shares from operations 0 114,175,126 83,535,642 374,104 441,182 688,482 601,685
Gains and losses arose solely from continuing operations.
There were no gains or losses other than those dealt with in the Statement of Comprehensive Income.
The EUR, GBP and JPY Funds are translated in the total column at the average exchange rate for the financial period as disclosed in Note 7.
The accompanying notes are an integral part of the financial statements.

LA
ZA
RD
GL
OB
AL
AC
TIV
E F
UN
DS
PL
C
38Lazard Global Active Funds plc Financial period ended 30 September 2019
Financial Statements (Unaudited) (continued)
Statement of Comprehensive Income (continued)
Lazard Global Equity Income
Fund*Lazard Global
Managed Volatility Fund Lazard Thematic Global FundLazard Global
Equity Franchise Fund
9/30/2018 30/09/2019 30/09/2018 30/09/2019 30/09/2018 30/09/2019 30/09/2018
Notes USD USD USD USD USD USD USD
Investment income
Bond income – – – – – – –
Dividend income 246,199 3,426,618 2,545,139 607,749 647,393 5,613,477 3,702,532
Bank interest 0 669 14,411 4,906 10,747 15,783 47,583 13,723
Other income 4 – 20,396 – 6,682 – – –
0Net realised (loss)/gain on investments and foreign currency 0 (156,515) 4,151,724 4,162,497 1,679,254 5,833,866 15,999,950 9,636,738
Net movement in unrealised (loss)/gain on investments and foreign currency 0 (47,161) 1,666 1,440,672 1,858,470 (2,262,544) (1,308,630) 2,056,033
0
Total investment income 0 43,192 7,614,815 8,153,214 4,162,902 4,234,498 20,352,380 15,409,026
0
Expenses 0
Management fees 3 27,720 745,128 606,227 300,841 324,742 931,358 617,337Administration, transfer agency & depositary fees 3 13,082 148,353 89,935 40,280 35,047 158,661 98,285
Legal fees 0 435 11,925 20,043 3,189 4,090 15,210 12,505
Audit fees 0 5,240 4,940 5,276 4,888 5,164 4,934 5,261
Directors’ fees 3 119 3,103 2,760 913 1,157 4,053 2,078
Tax advice and professional fees 0 8,256 9,892 15,200 9,416 14,280 11,702 18,075
Other expenses 0 6,668 18,075 9,408 10,226 7,224 34,581 6,967
0
Total expenses 0 61,520 941,416 748,849 369,753 391,704 1,160,499 760,508
0
Reimbursement from Manager 3 (13,530) – – – – – –
0
Net investment (expenses)/income 0 (4,798) 6,673,399 7,404,365 3,793,149 3,842,794 19,191,881 14,648,518
0
Finance costs 0
Distributions 13 (110,500) (131,806) (128,620) – – (438,314) (220,608)
Bank interest 0 – (35) (2,815) – (6) (111) (39)
Total finance costs 0 (110,500) (131,841) (131,435) – (6) (438,425) (220,647)
0(Loss)/profit for the financial period before tax 0 (115,298) 6,541,558 7,272,930 3,793,149 3,842,788 18,753,456 14,427,871
0Foreign capital gains tax on appreciated securities 501 – – – – – –
Withholding tax 0 (25,077) (594,982) (375,364) (88,339) (101,769) (771,388) (491,314)
0(Loss)/profit for the financial period after tax 0 (139,874) 5,946,576 6,897,566 3,704,810 3,741,019 17,982,068 13,936,557
Adjustment for write-off of organisational costs 0 (715) – – – – (76) (6,982)
0Net movement in net assets attributable to holders of redeemable participating shares from operations
0 (140,589) 5,946,576 6,897,566 3,704,810 3,741,019 17,981,992 13,929,575
Gains and losses arose solely from continuing operations, except for Lazard Global Equity Income Fund which was discontinued operations.
There were no gains or losses other than those dealt with in the Statement of Comprehensive Income.
The EUR, GBP and JPY Funds are translated in the total column at the average exchange rate for the financial period as disclosed in Note 7.
The accompanying notes are an integral part of the financial statements.
* Fund fully redeemed on 19 February 2019.

LA
ZA
RD
GL
OB
AL
AC
TIV
E F
UN
DS
PL
C
39Lazard Global Active Funds plc Financial period ended 30 September 2019
Financial Statements (Unaudited) (continued)
Statement of Comprehensive Income (continued)
Lazard European Equity FundLazard Pan
European Equity Fund*Lazard Pan-European
Small Cap Fund
30/09/2019 30/09/2018 30/09/2019 30/09/2018 30/09/2019 30/09/2018
Notes EUR EUR EUR EUR EUR EUR
Investment income
Bond income – – – – – –
Dividend income 841,433 814,384 59,756 57,064 1,318,378 1,894,368
Bank interest 0 – – – 1 79 1
Other income 4 371,868 – 50,618 – – –
0
Net realised (loss)/gain on investments and foreign currency 0 (132,522) 607,835 (46,464) 48,438 175,027 4,838,907Net movement in unrealised gain/(loss) on investments and foreign currency 0 1,747,788 87,760 132,876 20,354 (15,984) (1,734,451)
0
Total investment income 0 2,828,567 1,509,979 196,786 125,857 1,477,500 4,998,825
0
Expenses 0
Management fees 3 272,241 304,795 12,925 18,956 326,148 548,994
Administration, transfer agency & depositary fees 3 31,179 28,121 12,525 11,236 47,889 60,596
Legal fees 0 4,059 5,190 2,012 2,798 4,806 9,199
Audit fees 0 4,365 4,316 4,331 4,307 4,391 4,328
Directors’ fees 3 593 593 44 45 1,082 1,457
Tax advice and professional fees 0 10,580 11,021 9,549 7,654 7,582 13,133
Other expenses 0 13,391 8,459 8,467 3,734 14,257 13,049
0
Total expenses 0 336,408 362,495 49,853 48,730 406,155 650,756
0
Reimbursement from Manager 3 – – (22,959) (16,566) (27,000) (2,144)
0
Net investment income 0 2,492,159 1,147,484 169,892 93,693 1,098,345 4,350,213
0
Finance costs 0
Distributions 13 (99) (293) (887) (1,210) – –
Bank interest 0 (4,056) (2,333) (50) (23) (6,827) (21,147)
Total finance costs 0 (4,155) (2,626) (937) (1,233) (6,827) (21,147)
0
Profit for the financial period before tax 0 2,488,004 1,144,858 168,955 92,460 1,091,518 4,329,066
0
Foreign capital gains tax on appreciated securities – – – – – –
Withholding tax 0 (59,938) (51,417) (3,574) (3,045) (121,531) (139,888)
0
Profit for the financial period after tax 0 2,428,066 1,093,441 165,381 89,415 969,987 4,189,178
Adjustment for write-off of organisational costs 0 – – – – (4,176) (4,816)
0Net movement in net assets attributable to holders of redeemable participating shares from operations 0 2,428,066 1,093,441 165,381 89,415 965,811 4,184,362
Gains and losses arose solely from continuing operations.
There were no gains or losses other than those dealt with in the Statement of Comprehensive Income.
The EUR, GBP and JPY Funds are translated in the total column at the average exchange rate for the financial period as disclosed in Note 7.
The accompanying notes are an integral part of the financial statements.
* Fund fully redeemed on 25 November 2019.

LA
ZA
RD
GL
OB
AL
AC
TIV
E F
UN
DS
PL
C
40Lazard Global Active Funds plc Financial period ended 30 September 2019
Financial Statements (Unaudited) (continued)
Statement of Comprehensive Income (continued)
Lazard UK Omega Equity Fund*Lazard US Equity
Concentrated FundLazard Japanese
Strategic Equity Fund
30/09/2019 30/09/2018 30/09/2019 30/09/2018 30/09/2019 30/09/2018
Notes GBP GBP USD USD JPY JPY
Investment income
Bond income – – – – – –
Dividend income 75,463 76,977 2,402,799 5,543,194 33,988,194 35,007,110
Bank interest 0 37 9 78,641 85,381 398 1
Other income 4 – – – – – –
0
Net realised (loss)/gain on investments and foreign currency 0 (36,667) 86,864 1,587,010 14,101,104 (26,511,114) 57,124,174Net movement in unrealised gain on investments and foreign currency 0 33,550 26,494 23,770,438 28,233,852 105,650,924 (19,603,112)
0
Total investment income 0 72,383 190,344 27,838,888 47,963,531 113,128,402 72,528,173
0
Expenses 0
Management fees 3 14,291 22,721 1,484,165 1,972,586 10,682,203 13,028,282
Administration, transfer agency & depositary fees 3 7,218 5,997 193,142 278,644 1,873,566 2,044,798
Legal fees 0 1,797 2,924 21,804 63,635 329,269 415,344
Audit fees 0 3,868 3,823 5,108 5,354 526,019 564,084
Directors’ fees 3 47 46 6,719 8,515 42,377 37,149
Tax advice and professional fees 0 5,732 5,635 15,275 26,921 655,667 581,347
Other expenses 0 7,288 2,473 33,138 21,989 598,414 317,383
0
Total expenses 0 40,241 43,619 1,759,351 2,377,644 14,707,515 16,988,387
0
Reimbursement from Manager 3 (17,079) (12,024) – – – –
0
Net investment income 0 49,221 158,749 26,079,537 45,585,887 98,420,887 55,539,786
0
Finance costs 0
Distributions 13 (16,616) (10,219) (1,350) (2,029) (31,264) (27,659)
Bank interest 0 – – – – (27,674) (69,457)
Total finance costs 0 (16,616) (10,219) (1,350) (2,029) (58,938) (97,116)
0
Profit for the financial period before tax 0 32,605 148,530 26,078,187 45,583,858 98,361,949 55,442,670
0
Foreign capital gains tax on appreciated securities – – – – – –
Withholding tax 0 – – (607,333) (1,400,524) (5,098,223) (5,251,423)
0
Profit for the financial period after tax 0 32,605 148,530 25,470,854 44,183,334 93,263,726 50,191,247
Adjustment for write-off of organisational costs 0 – – (56) (5,483) – –
0Net movement in net assets attributable to holders of redeemable participating shares from operations 0 32,605 148,530 25,470,798 44,177,851 93,263,726 50,191,247
Gains and losses arose solely from continuing operations.
There were no gains or losses other than those dealt with in the Statement of Comprehensive Income.
The EUR, GBP and JPY Funds are translated in the total column at the average exchange rate for the financial period as disclosed in Note 7.
The accompanying notes are an integral part of the financial statements.
* Fund fully redeemed on 25 November 2019.
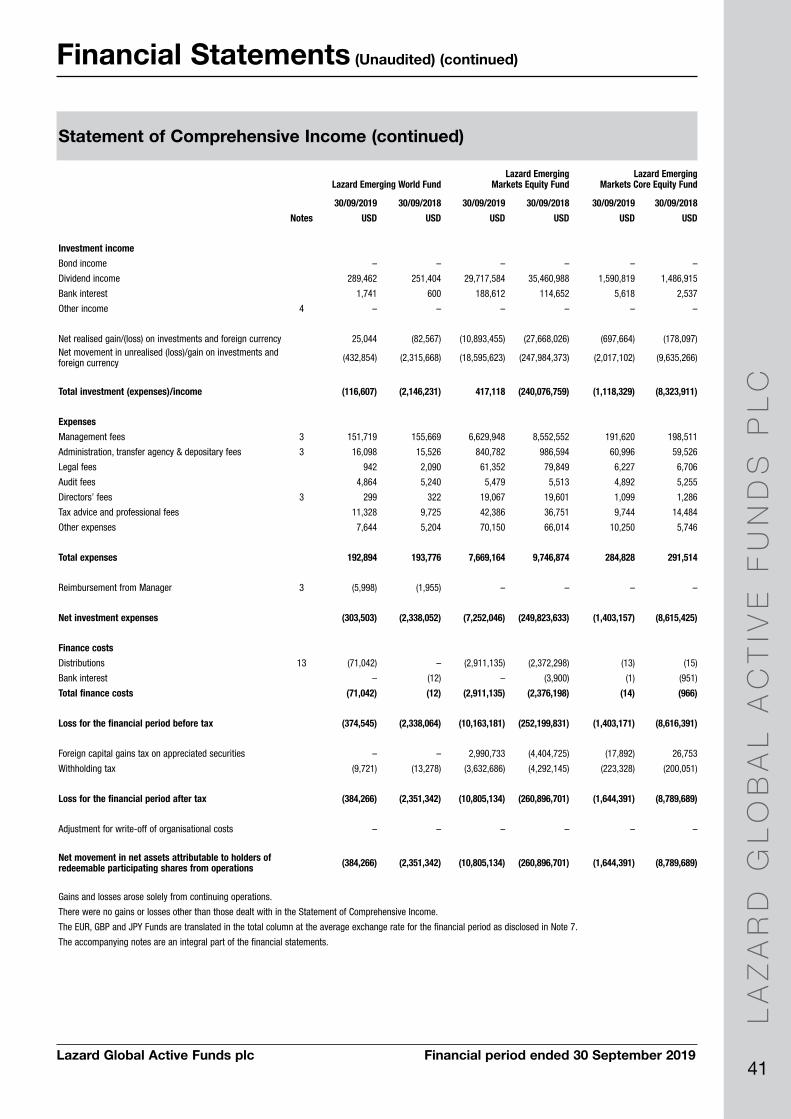
LA
ZA
RD
GL
OB
AL
AC
TIV
E F
UN
DS
PL
C
41Lazard Global Active Funds plc Financial period ended 30 September 2019
Financial Statements (Unaudited) (continued)
Statement of Comprehensive Income (continued)
Lazard Emerging World FundLazard Emerging
Markets Equity FundLazard Emerging
Markets Core Equity Fund
30/09/2019 30/09/2018 30/09/2019 30/09/2018 30/09/2019 30/09/2018
Notes USD USD USD USD USD USD
Investment income
Bond income – – – – – –
Dividend income 289,462 251,404 29,717,584 35,460,988 1,590,819 1,486,915
Bank interest 0 1,741 600 188,612 114,652 5,618 2,537
Other income 4 – – – – – –
0
Net realised gain/(loss) on investments and foreign currency 0 25,044 (82,567) (10,893,455) (27,668,026) (697,664) (178,097)Net movement in unrealised (loss)/gain on investments and foreign currency 0 (432,854) (2,315,668) (18,595,623) (247,984,373) (2,017,102) (9,635,266)
0
Total investment (expenses)/income 0 (116,607) (2,146,231) 417,118 (240,076,759) (1,118,329) (8,323,911)
0
Expenses 0
Management fees 3 151,719 155,669 6,629,948 8,552,552 191,620 198,511
Administration, transfer agency & depositary fees 3 16,098 15,526 840,782 986,594 60,996 59,526
Legal fees 0 942 2,090 61,352 79,849 6,227 6,706
Audit fees 0 4,864 5,240 5,479 5,513 4,892 5,255
Directors’ fees 3 299 322 19,067 19,601 1,099 1,286
Tax advice and professional fees 0 11,328 9,725 42,386 36,751 9,744 14,484
Other expenses 0 7,644 5,204 70,150 66,014 10,250 5,746
0
Total expenses 0 192,894 193,776 7,669,164 9,746,874 284,828 291,514
0
Reimbursement from Manager 3 (5,998) (1,955) – – – –
0
Net investment expenses 0 (303,503) (2,338,052) (7,252,046) (249,823,633) (1,403,157) (8,615,425)
0
Finance costs 0
Distributions 13 (71,042) – (2,911,135) (2,372,298) (13) (15)
Bank interest 0 – (12) – (3,900) (1) (951)
Total finance costs 0 (71,042) (12) (2,911,135) (2,376,198) (14) (966)
0
Loss for the financial period before tax 0 (374,545) (2,338,064) (10,163,181) (252,199,831) (1,403,171) (8,616,391)
0
Foreign capital gains tax on appreciated securities – – 2,990,733 (4,404,725) (17,892) 26,753
Withholding tax 0 (9,721) (13,278) (3,632,686) (4,292,145) (223,328) (200,051)
0
Loss for the financial period after tax 0 (384,266) (2,351,342) (10,805,134) (260,896,701) (1,644,391) (8,789,689)
Adjustment for write-off of organisational costs 0 – – – – – –
0Net movement in net assets attributable to holders of redeemable participating shares from operations 0 (384,266) (2,351,342) (10,805,134) (260,896,701) (1,644,391) (8,789,689)
Gains and losses arose solely from continuing operations.
There were no gains or losses other than those dealt with in the Statement of Comprehensive Income.
The EUR, GBP and JPY Funds are translated in the total column at the average exchange rate for the financial period as disclosed in Note 7.
The accompanying notes are an integral part of the financial statements.
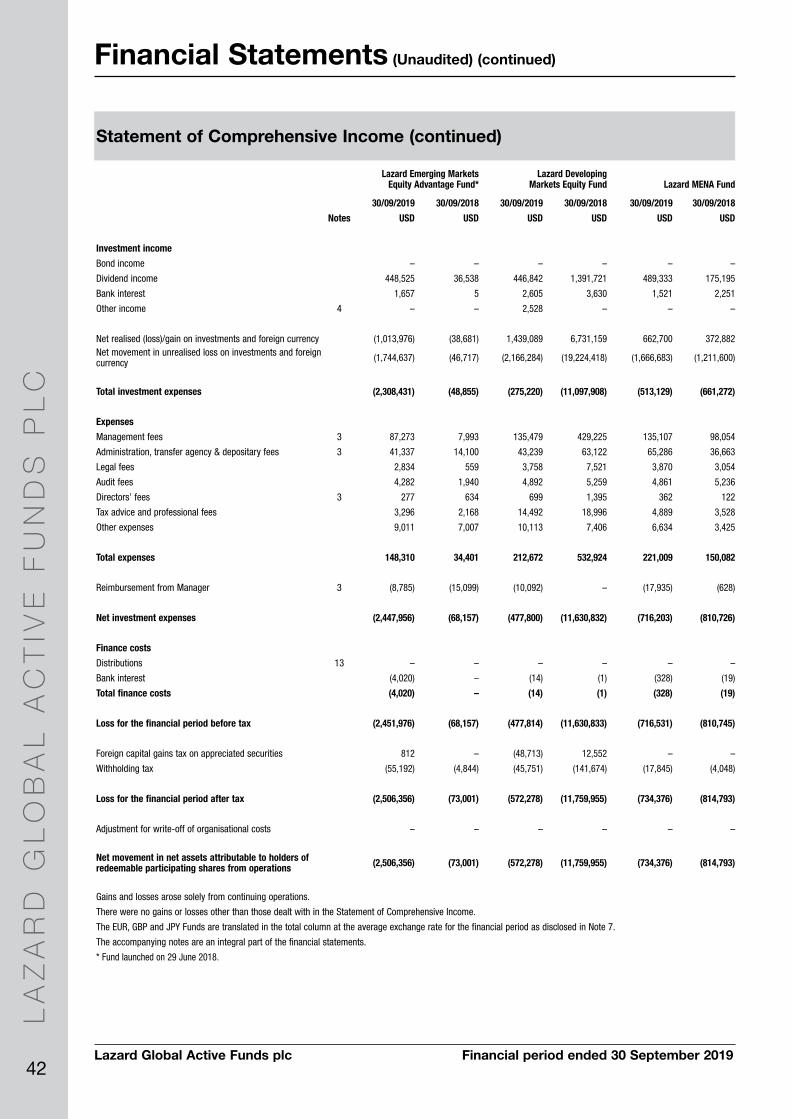
LA
ZA
RD
GL
OB
AL
AC
TIV
E F
UN
DS
PL
C
42Lazard Global Active Funds plc Financial period ended 30 September 2019
Financial Statements (Unaudited) (continued)
Statement of Comprehensive Income (continued)
Lazard Emerging Markets Equity Advantage Fund*
Lazard Developing Markets Equity Fund Lazard MENA Fund
30/09/2019 30/09/2018 30/09/2019 30/09/2018 30/09/2019 30/09/2018
Notes USD USD USD USD USD USD
Investment income
Bond income – – – – – –
Dividend income 448,525 36,538 446,842 1,391,721 489,333 175,195
Bank interest 0 1,657 5 2,605 3,630 1,521 2,251
Other income 4 – – 2,528 – – –
0
Net realised (loss)/gain on investments and foreign currency 0 (1,013,976) (38,681) 1,439,089 6,731,159 662,700 372,882Net movement in unrealised loss on investments and foreign currency 0 (1,744,637) (46,717) (2,166,284) (19,224,418) (1,666,683) (1,211,600)
0
Total investment expenses 0 (2,308,431) (48,855) (275,220) (11,097,908) (513,129) (661,272)
0
Expenses 0
Management fees 3 87,273 7,993 135,479 429,225 135,107 98,054
Administration, transfer agency & depositary fees 3 41,337 14,100 43,239 63,122 65,286 36,663
Legal fees 0 2,834 559 3,758 7,521 3,870 3,054
Audit fees 0 4,282 1,940 4,892 5,259 4,861 5,236
Directors’ fees 3 277 634 699 1,395 362 122
Tax advice and professional fees 0 3,296 2,168 14,492 18,996 4,889 3,528
Other expenses 0 9,011 7,007 10,113 7,406 6,634 3,425
0
Total expenses 0 148,310 34,401 212,672 532,924 221,009 150,082
0
Reimbursement from Manager 3 (8,785) (15,099) (10,092) – (17,935) (628)
0
Net investment expenses 0 (2,447,956) (68,157) (477,800) (11,630,832) (716,203) (810,726)
0
Finance costs 0
Distributions 13 – – – – – –
Bank interest 0 (4,020) – (14) (1) (328) (19)
Total finance costs 0 (4,020) – (14) (1) (328) (19)
0
Loss for the financial period before tax 0 (2,451,976) (68,157) (477,814) (11,630,833) (716,531) (810,745)
0
Foreign capital gains tax on appreciated securities 812 – (48,713) 12,552 – –
Withholding tax 0 (55,192) (4,844) (45,751) (141,674) (17,845) (4,048)
0
Loss for the financial period after tax 0 (2,506,356) (73,001) (572,278) (11,759,955) (734,376) (814,793)
Adjustment for write-off of organisational costs 0 – – – – – –
0Net movement in net assets attributable to holders of redeemable participating shares from operations 0 (2,506,356) (73,001) (572,278) (11,759,955) (734,376) (814,793)
Gains and losses arose solely from continuing operations.
There were no gains or losses other than those dealt with in the Statement of Comprehensive Income.
The EUR, GBP and JPY Funds are translated in the total column at the average exchange rate for the financial period as disclosed in Note 7.
The accompanying notes are an integral part of the financial statements.
* Fund launched on 29 June 2018.
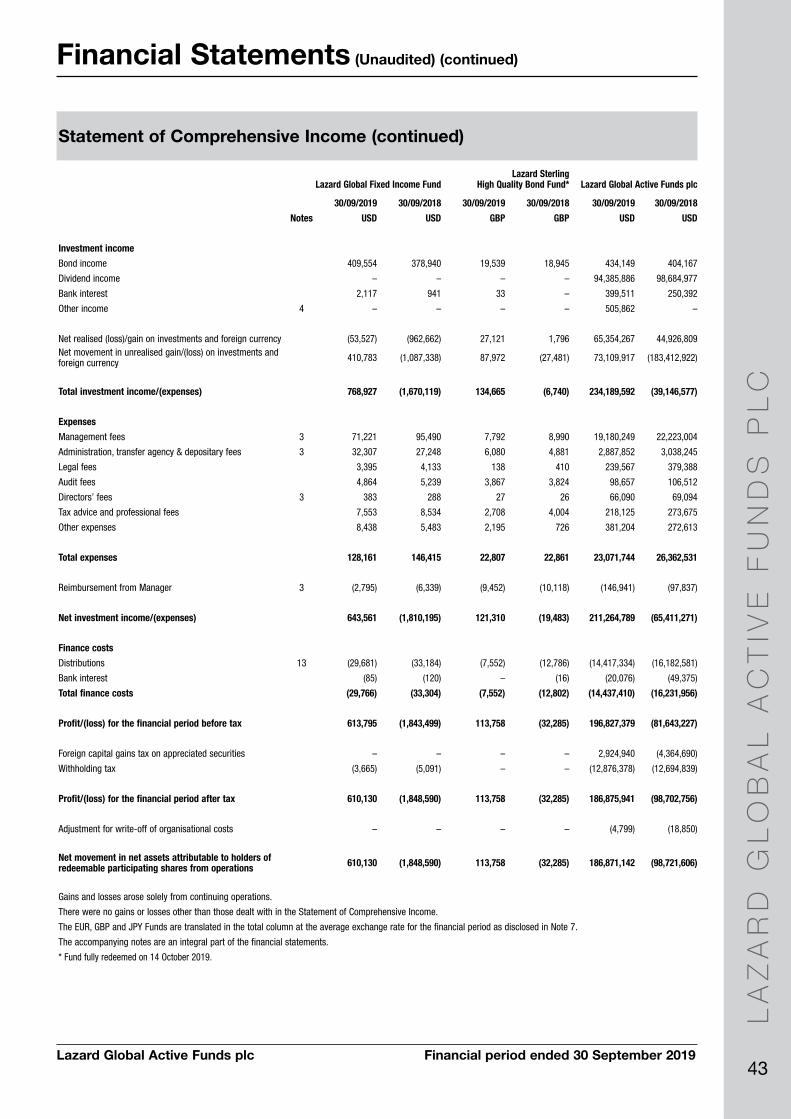
LA
ZA
RD
GL
OB
AL
AC
TIV
E F
UN
DS
PL
C
43Lazard Global Active Funds plc Financial period ended 30 September 2019
Financial Statements (Unaudited) (continued)
Statement of Comprehensive Income (continued)
Lazard Global Fixed Income FundLazard Sterling
High Quality Bond Fund* Lazard Global Active Funds plc
30/09/2019 30/09/2018 30/09/2019 30/09/2018 30/09/2019 30/09/2018
Notes USD USD GBP GBP USD USD
Investment income
Bond income 409,554 378,940 19,539 18,945 434,149 404,167
Dividend income – – – – 94,385,886 98,684,977
Bank interest 0 2,117 941 33 – 399,511 250,392
Other income 4 – – – – 505,862 –
0
Net realised (loss)/gain on investments and foreign currency 0 (53,527) (962,662) 27,121 1,796 65,354,267 44,926,809Net movement in unrealised gain/(loss) on investments and foreign currency 0 410,783 (1,087,338) 87,972 (27,481) 73,109,917 (183,412,922)
0
Total investment income/(expenses) 0 768,927 (1,670,119) 134,665 (6,740) 234,189,592 (39,146,577)
0
Expenses 0
Management fees 3 71,221 95,490 7,792 8,990 19,180,249 22,223,004
Administration, transfer agency & depositary fees 3 32,307 27,248 6,080 4,881 2,887,852 3,038,245
Legal fees 0 3,395 4,133 138 410 239,567 379,388
Audit fees 0 4,864 5,239 3,867 3,824 98,657 106,512
Directors’ fees 3 383 288 27 26 66,090 69,094
Tax advice and professional fees 0 7,553 8,534 2,708 4,004 218,125 273,675
Other expenses 0 8,438 5,483 2,195 726 381,204 272,613
0
Total expenses 0 128,161 146,415 22,807 22,861 23,071,744 26,362,531
0
Reimbursement from Manager 3 (2,795) (6,339) (9,452) (10,118) (146,941) (97,837)
0
Net investment income/(expenses) 0 643,561 (1,810,195) 121,310 (19,483) 211,264,789 (65,411,271)
0
Finance costs 0
Distributions 13 (29,681) (33,184) (7,552) (12,786) (14,417,334) (16,182,581)
Bank interest 0 (85) (120) – (16) (20,076) (49,375)
Total finance costs 0 (29,766) (33,304) (7,552) (12,802) (14,437,410) (16,231,956)
0
Profit/(loss) for the financial period before tax 0 613,795 (1,843,499) 113,758 (32,285) 196,827,379 (81,643,227)
0
Foreign capital gains tax on appreciated securities – – – – 2,924,940 (4,364,690)
Withholding tax 0 (3,665) (5,091) – – (12,876,378) (12,694,839)
0
Profit/(loss) for the financial period after tax 0 610,130 (1,848,590) 113,758 (32,285) 186,875,941 (98,702,756)
Adjustment for write-off of organisational costs 0 – – – – (4,799) (18,850)
0Net movement in net assets attributable to holders of redeemable participating shares from operations 0 610,130 (1,848,590) 113,758 (32,285) 186,871,142 (98,721,606)
Gains and losses arose solely from continuing operations.
There were no gains or losses other than those dealt with in the Statement of Comprehensive Income.
The EUR, GBP and JPY Funds are translated in the total column at the average exchange rate for the financial period as disclosed in Note 7.
The accompanying notes are an integral part of the financial statements.
* Fund fully redeemed on 14 October 2019.

LA
ZA
RD
GL
OB
AL
AC
TIV
E F
UN
DS
PL
C
44Lazard Global Active Funds plc Financial period ended 30 September 2019
Financial Statements (Unaudited) (continued)
Statement of Financial Position
Lazard Global Listed Infrastructure Equity Fund
Lazard Global Strategic Equity Fund
Lazard Global Equity Select Fund
30/09/2019 31/03/2019 30/09/2019 31/03/2019 30/09/2019 31/03/2019
Notes GBP GBP USD USD USD USD
Assets
Financial assets at fair value through profit or loss 0 1,381,688,761 1,256,702,840 8,654,031 7,247,992 15,175,587 12,911,164
Cash at bank 8 12,993,977 93,598,682 300,143 94,740 329,935 419,808
Subscriptions receivable 0 1,597,796 959,732 – – 500,000 –
Investments sold receivable 0 33,469,810 3,526,347 – – – –
Investments income receivable 0 733,169 2,473,808 11,742 21,331 25,226 31,230
Other assets 0 8,998 502 5,101 105 425 3,933
Total assets 0 1,430,492,511 1,357,261,911 8,971,017 7,364,168 16,031,173 13,366,135
0
Liabilities 0
Financial liabilities at fair value through profit or loss 8,854,364 5,457,443 – – – –
Redemptions payable 0 2,028,032 1,765,807 2,018 – – –
Investments purchased payable 0 – 38,724,725 – 5,719 330,114 –
Distribution payable 0 369 953 – – – –
Accrued foreign capital gains tax on appreciated securities – – – – – –
Expenses payable 0 2,714,369 3,159,979 38,908 53,026 55,452 59,629
Total liabilities 0 13,597,134 49,108,907 40,926 58,745 385,566 59,629
0Net assets attributable to redeemable participating shareholders 0 1,416,895,377 1,308,153,004 8,930,091 7,305,423 15,645,607 13,306,506
0
Adjustment for write-off of organisational costs 0 – – – – – –
0Net assets attributable to redeemable participating shareholders 0 1,416,895,377 1,308,153,004 8,930,091 7,305,423 15,645,607 13,306,506
The EUR, GBP and JPY Funds are translated in the total column at the financial period end exchange rate as disclosed in Note 7.
The accompanying notes are an integral part of the financial statements.
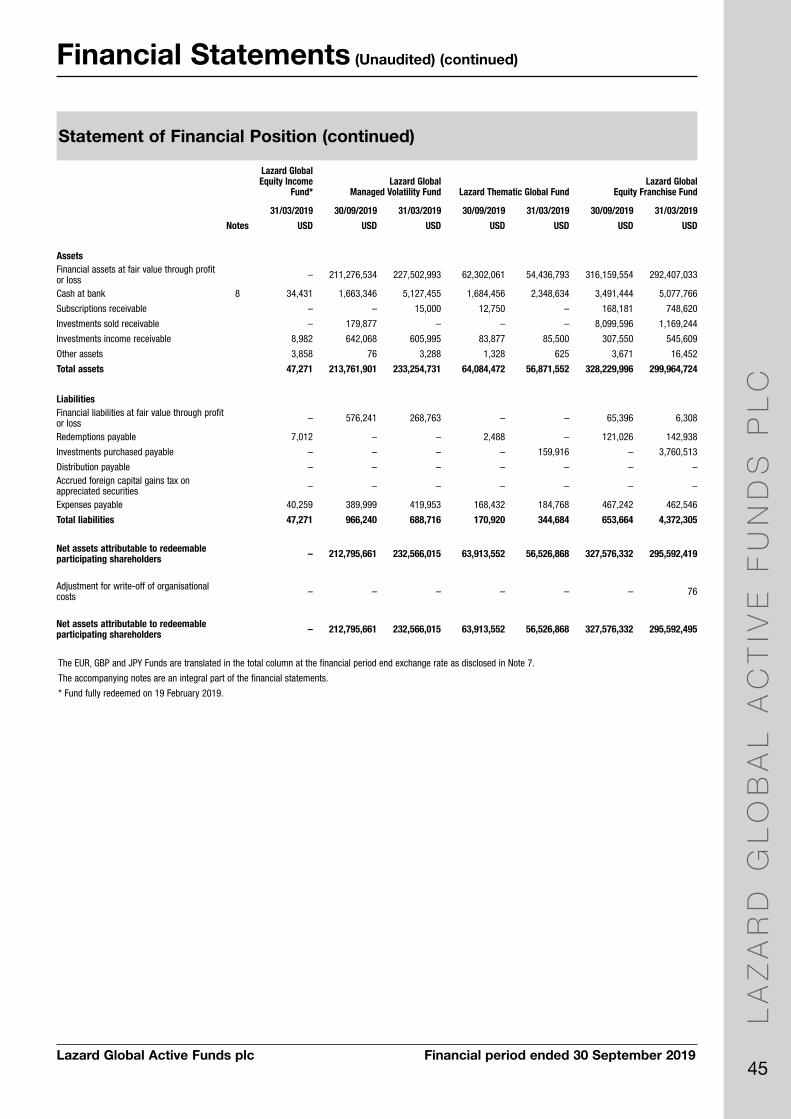
LA
ZA
RD
GL
OB
AL
AC
TIV
E F
UN
DS
PL
C
45Lazard Global Active Funds plc Financial period ended 30 September 2019
Financial Statements (Unaudited) (continued)
Statement of Financial Position (continued)
Lazard Global Equity Income
Fund*Lazard Global
Managed Volatility Fund Lazard Thematic Global FundLazard Global
Equity Franchise Fund
31/03/2019 30/09/2019 31/03/2019 30/09/2019 31/03/2019 30/09/2019 31/03/2019
Notes USD USD USD USD USD USD USD
AssetsFinancial assets at fair value through profit or loss 0 – 211,276,534 227,502,993 62,302,061 54,436,793 316,159,554 292,407,033
Cash at bank 8 34,431 1,663,346 5,127,455 1,684,456 2,348,634 3,491,444 5,077,766
Subscriptions receivable 0 – – 15,000 12,750 – 168,181 748,620
Investments sold receivable 0 – 179,877 – – – 8,099,596 1,169,244
Investments income receivable 0 8,982 642,068 605,995 83,877 85,500 307,550 545,609
Other assets 0 3,858 76 3,288 1,328 625 3,671 16,452
Total assets 0 47,271 213,761,901 233,254,731 64,084,472 56,871,552 328,229,996 299,964,724
0
Liabilities 0Financial liabilities at fair value through profit or loss – 576,241 268,763 – – 65,396 6,308
Redemptions payable 0 7,012 – – 2,488 – 121,026 142,938
Investments purchased payable 0 – – – – 159,916 – 3,760,513
Distribution payable 0 – – – – – – –Accrued foreign capital gains tax on appreciated securities – – – – – – –
Expenses payable 0 40,259 389,999 419,953 168,432 184,768 467,242 462,546
Total liabilities 0 47,271 966,240 688,716 170,920 344,684 653,664 4,372,305
0Net assets attributable to redeemable participating shareholders 0 – 212,795,661 232,566,015 63,913,552 56,526,868 327,576,332 295,592,419
0Adjustment for write-off of organisational costs 0 – – – – – – 76
0Net assets attributable to redeemable participating shareholders 0 – 212,795,661 232,566,015 63,913,552 56,526,868 327,576,332 295,592,495
The EUR, GBP and JPY Funds are translated in the total column at the financial period end exchange rate as disclosed in Note 7.
The accompanying notes are an integral part of the financial statements.
* Fund fully redeemed on 19 February 2019.
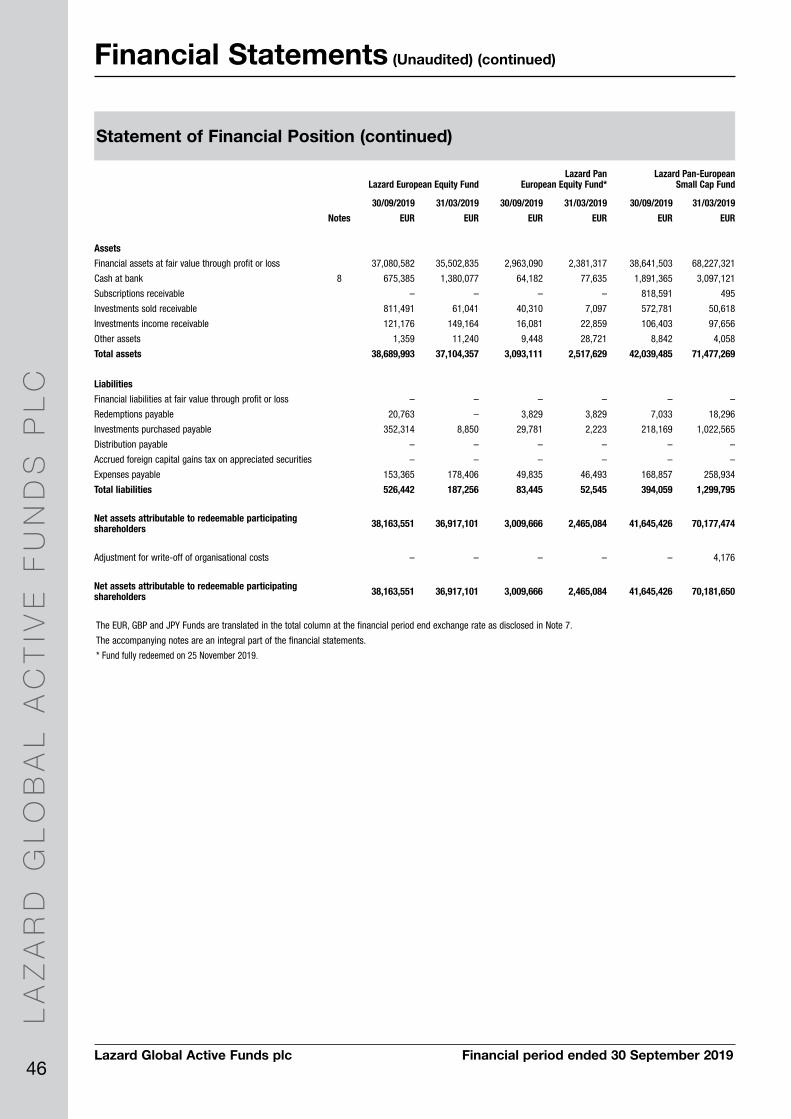
LA
ZA
RD
GL
OB
AL
AC
TIV
E F
UN
DS
PL
C
46Lazard Global Active Funds plc Financial period ended 30 September 2019
Financial Statements (Unaudited) (continued)
Statement of Financial Position (continued)
Lazard European Equity FundLazard Pan
European Equity Fund*Lazard Pan-European
Small Cap Fund
30/09/2019 31/03/2019 30/09/2019 31/03/2019 30/09/2019 31/03/2019
Notes EUR EUR EUR EUR EUR EUR
Assets
Financial assets at fair value through profit or loss 0 37,080,582 35,502,835 2,963,090 2,381,317 38,641,503 68,227,321
Cash at bank 8 675,385 1,380,077 64,182 77,635 1,891,365 3,097,121
Subscriptions receivable 0 – – – – 818,591 495
Investments sold receivable 0 811,491 61,041 40,310 7,097 572,781 50,618
Investments income receivable 0 121,176 149,164 16,081 22,859 106,403 97,656
Other assets 0 1,359 11,240 9,448 28,721 8,842 4,058
Total assets 0 38,689,993 37,104,357 3,093,111 2,517,629 42,039,485 71,477,269
0
Liabilities 0
Financial liabilities at fair value through profit or loss – – – – – –
Redemptions payable 0 20,763 – 3,829 3,829 7,033 18,296
Investments purchased payable 0 352,314 8,850 29,781 2,223 218,169 1,022,565
Distribution payable 0 – – – – – –
Accrued foreign capital gains tax on appreciated securities – – – – – –
Expenses payable 0 153,365 178,406 49,835 46,493 168,857 258,934
Total liabilities 0 526,442 187,256 83,445 52,545 394,059 1,299,795
0Net assets attributable to redeemable participating shareholders 0 38,163,551 36,917,101 3,009,666 2,465,084 41,645,426 70,177,474
0
Adjustment for write-off of organisational costs 0 – – – – – 4,176
0Net assets attributable to redeemable participating shareholders 0 38,163,551 36,917,101 3,009,666 2,465,084 41,645,426 70,181,650
The EUR, GBP and JPY Funds are translated in the total column at the financial period end exchange rate as disclosed in Note 7.
The accompanying notes are an integral part of the financial statements.
* Fund fully redeemed on 25 November 2019.
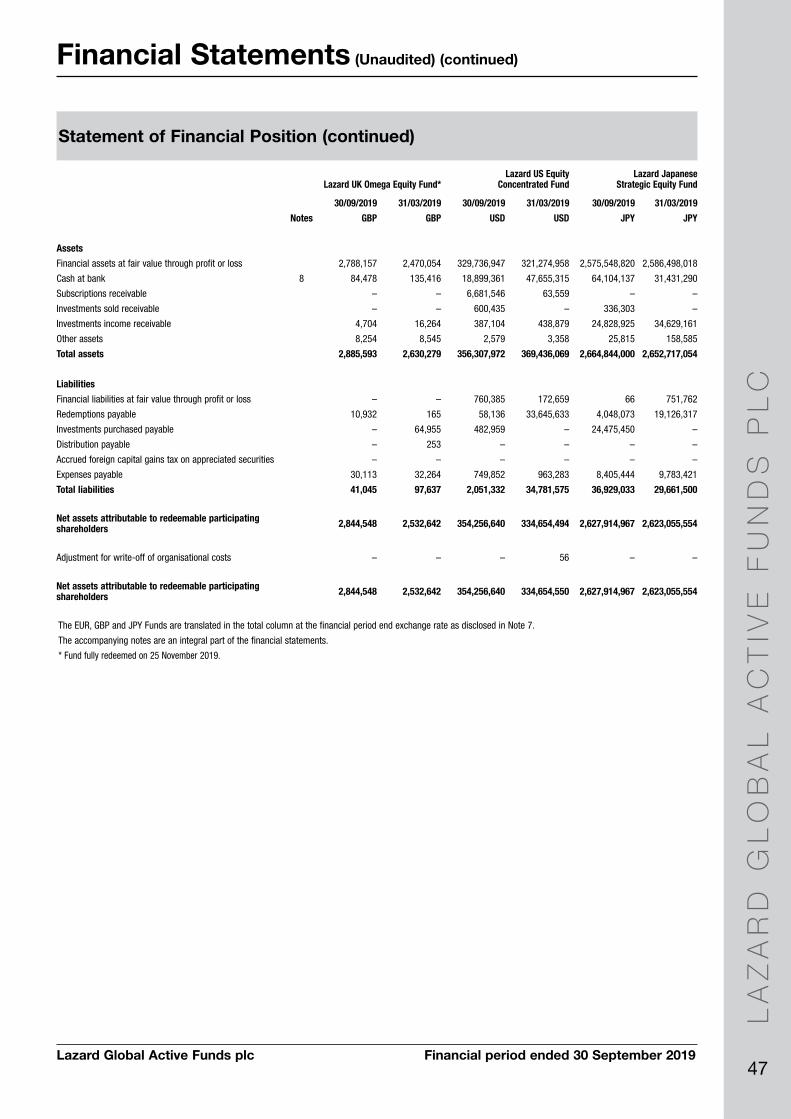
LA
ZA
RD
GL
OB
AL
AC
TIV
E F
UN
DS
PL
C
47Lazard Global Active Funds plc Financial period ended 30 September 2019
Financial Statements (Unaudited) (continued)
Statement of Financial Position (continued)
Lazard UK Omega Equity Fund*Lazard US Equity
Concentrated FundLazard Japanese
Strategic Equity Fund
30/09/2019 31/03/2019 30/09/2019 31/03/2019 30/09/2019 31/03/2019
Notes GBP GBP USD USD JPY JPY
Assets
Financial assets at fair value through profit or loss 0 2,788,157 2,470,054 329,736,947 321,274,958 2,575,548,820 2,586,498,018
Cash at bank 8 84,478 135,416 18,899,361 47,655,315 64,104,137 31,431,290
Subscriptions receivable 0 – – 6,681,546 63,559 – –
Investments sold receivable 0 – – 600,435 – 336,303 –
Investments income receivable 0 4,704 16,264 387,104 438,879 24,828,925 34,629,161
Other assets 0 8,254 8,545 2,579 3,358 25,815 158,585
Total assets 0 2,885,593 2,630,279 356,307,972 369,436,069 2,664,844,000 2,652,717,054
0
Liabilities 0
Financial liabilities at fair value through profit or loss – – 760,385 172,659 66 751,762
Redemptions payable 0 10,932 165 58,136 33,645,633 4,048,073 19,126,317
Investments purchased payable 0 – 64,955 482,959 – 24,475,450 –
Distribution payable 0 – 253 – – – –
Accrued foreign capital gains tax on appreciated securities – – – – – –
Expenses payable 0 30,113 32,264 749,852 963,283 8,405,444 9,783,421
Total liabilities 0 41,045 97,637 2,051,332 34,781,575 36,929,033 29,661,500
0Net assets attributable to redeemable participating shareholders 0 2,844,548 2,532,642 354,256,640 334,654,494 2,627,914,967 2,623,055,554
0
Adjustment for write-off of organisational costs 0 – – – 56 – –
0Net assets attributable to redeemable participating shareholders 0 2,844,548 2,532,642 354,256,640 334,654,550 2,627,914,967 2,623,055,554
The EUR, GBP and JPY Funds are translated in the total column at the financial period end exchange rate as disclosed in Note 7.
The accompanying notes are an integral part of the financial statements.
* Fund fully redeemed on 25 November 2019.
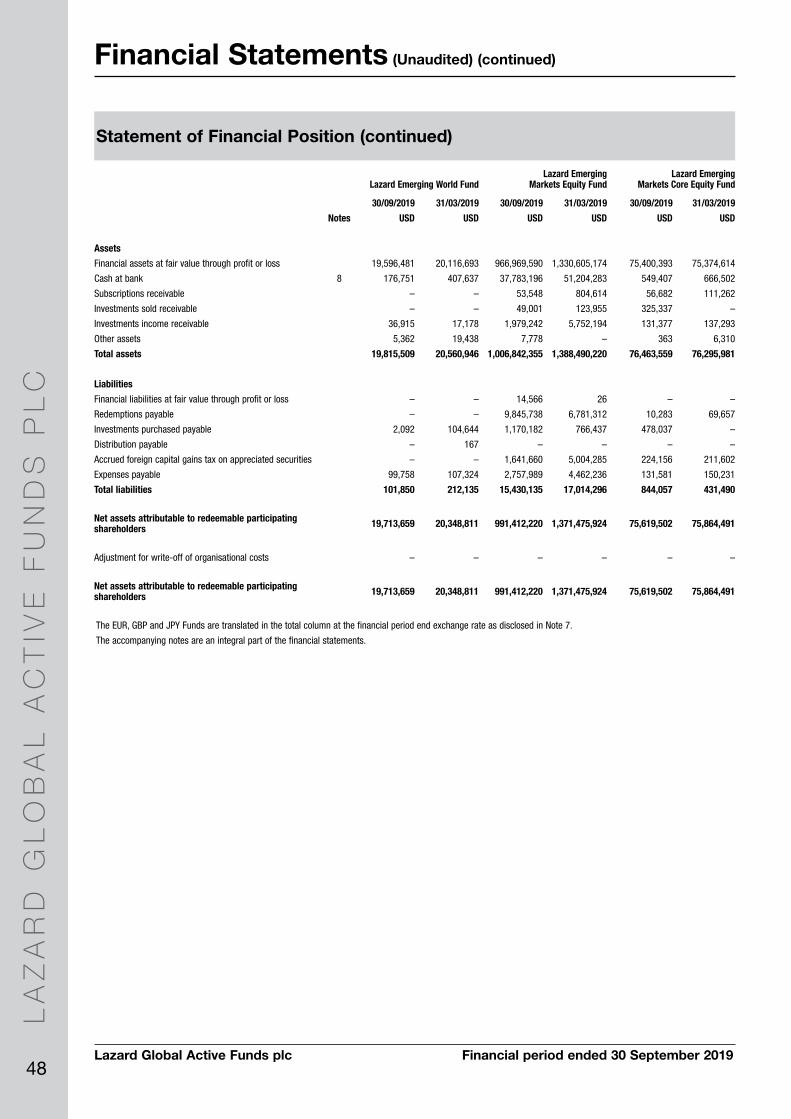
LA
ZA
RD
GL
OB
AL
AC
TIV
E F
UN
DS
PL
C
48Lazard Global Active Funds plc Financial period ended 30 September 2019
Financial Statements (Unaudited) (continued)
Statement of Financial Position (continued)
Lazard Emerging World FundLazard Emerging
Markets Equity FundLazard Emerging
Markets Core Equity Fund
30/09/2019 31/03/2019 30/09/2019 31/03/2019 30/09/2019 31/03/2019
Notes USD USD USD USD USD USD
Assets
Financial assets at fair value through profit or loss 0 19,596,481 20,116,693 966,969,590 1,330,605,174 75,400,393 75,374,614
Cash at bank 8 176,751 407,637 37,783,196 51,204,283 549,407 666,502
Subscriptions receivable 0 – – 53,548 804,614 56,682 111,262
Investments sold receivable 0 – – 49,001 123,955 325,337 –
Investments income receivable 0 36,915 17,178 1,979,242 5,752,194 131,377 137,293
Other assets 0 5,362 19,438 7,778 – 363 6,310
Total assets 0 19,815,509 20,560,946 1,006,842,355 1,388,490,220 76,463,559 76,295,981
0
Liabilities 0
Financial liabilities at fair value through profit or loss – – 14,566 26 – –
Redemptions payable 0 – – 9,845,738 6,781,312 10,283 69,657
Investments purchased payable 0 2,092 104,644 1,170,182 766,437 478,037 –
Distribution payable 0 – 167 – – – –
Accrued foreign capital gains tax on appreciated securities – – 1,641,660 5,004,285 224,156 211,602
Expenses payable 0 99,758 107,324 2,757,989 4,462,236 131,581 150,231
Total liabilities 0 101,850 212,135 15,430,135 17,014,296 844,057 431,490
0Net assets attributable to redeemable participating shareholders 0 19,713,659 20,348,811 991,412,220 1,371,475,924 75,619,502 75,864,491
0
Adjustment for write-off of organisational costs 0 – – – – – –
0Net assets attributable to redeemable participating shareholders 0 19,713,659 20,348,811 991,412,220 1,371,475,924 75,619,502 75,864,491
The EUR, GBP and JPY Funds are translated in the total column at the financial period end exchange rate as disclosed in Note 7.
The accompanying notes are an integral part of the financial statements.

LA
ZA
RD
GL
OB
AL
AC
TIV
E F
UN
DS
PL
C
49Lazard Global Active Funds plc Financial period ended 30 September 2019
Financial Statements (Unaudited) (continued)
Statement of Financial Position (continued)
Lazard Emerging Markets Equity Advantage Fund*
Lazard Developing Markets Equity Fund Lazard MENA Fund
30/09/2019 31/03/2019 30/09/2019 31/03/2019 30/09/2019 31/03/2019
Notes USD USD USD USD USD USD
Assets
Financial assets at fair value through profit or loss 0 84,130,569 3,746,322 23,722,575 30,785,345 25,672,707 26,397,214
Cash at bank 8 2,708,172 19,360 361,163 196,997 707,442 546,504
Subscriptions receivable 0 216,697 – – – 59 185
Investments sold receivable 0 140,079 96 5,978 494,396 125,281 127,246
Investments income receivable 0 159,014 8,652 60,964 83,324 – 187,107
Other assets 0 213 7,071 5,669 3,894 16,051 13,181
Total assets 0 87,354,744 3,781,501 24,156,349 31,563,956 26,521,540 27,271,437
0
Liabilities 0
Financial liabilities at fair value through profit or loss 28,975 3,671 – – 5,872 –
Redemptions payable 0 29,431 – 2,307 – 3,959 861
Investments purchased payable 0 338,042 – – 137,248 – 427,228
Distribution payable 0 – – – – – –
Accrued foreign capital gains tax on appreciated securities – 1,191 80,977 87,416 – –
Expenses payable 0 127,023 35,533 120,759 137,246 97,041 124,206
Total liabilities 0 523,471 40,395 204,043 361,910 106,872 552,295
0Net assets attributable to redeemable participating shareholders 0 86,831,273 3,741,106 23,952,306 31,202,046 26,414,668 26,719,142
0
Adjustment for write-off of organisational costs 0 – – – – – –
0Net assets attributable to redeemable participating shareholders 0 86,831,273 3,741,106 23,952,306 31,202,046 26,414,668 26,719,142
The EUR, GBP and JPY Funds are translated in the total column at the financial period end exchange rate as disclosed in Note 7.
The accompanying notes are an integral part of the financial statements.
* Fund launched on 29 June 2018.

LA
ZA
RD
GL
OB
AL
AC
TIV
E F
UN
DS
PL
C
50Lazard Global Active Funds plc Financial period ended 30 September 2019
Financial Statements (Unaudited) (continued)
Statement of Financial Position (continued)
Lazard Global Fixed Income FundLazard Sterling
High Quality Bond Fund* Lazard Global Active Funds plc
30/09/2019 31/03/2019 30/09/2019 31/03/2019 30/09/2019 31/03/2019
Notes USD USD GBP GBP USD USD
Assets
Financial assets at fair value through profit or loss 0 30,255,741 20,517,480 1,695,167 1,691,267 3,986,845,811 4,208,806,591
Cash at bank 8 423,561 77,164 123,453 95,513 88,808,458 241,539,567
Subscriptions receivable 0 – 25 – – 10,550,849 2,994,399
Investments sold receivable 0 – 27,364 – – 52,326,612 6,670,651
Investments income receivable 0 265,098 206,240 20,933 16,117 5,520,628 12,010,871
Other assets 0 1,679 5,200 4,136 4,103 98,312 154,707
Total assets 0 30,946,079 20,833,473 1,843,689 1,807,000 4,144,150,670 4,472,176,786
0
Liabilities 0
Financial liabilities at fair value through profit or loss 557,275 201,810 – – 12,919,943 7,771,350
Redemptions payable 0 1,184 – 26,318 24,004 12,693,551 43,177,483
Investments purchased payable 0 – – – – 3,682,297 57,067,202
Distribution payable 0 – – – 166 455 1,955
Accrued foreign capital gains tax on appreciated securities – – – – 1,946,793 5,304,494
Expenses payable 0 85,798 90,161 17,438 18,931 9,176,736 12,106,376
Total liabilities 0 644,257 291,971 43,756 43,101 40,419,775 125,428,860
0Net assets attributable to redeemable participating shareholders 0 30,301,822 20,541,502 1,799,933 1,763,899 4,103,730,895 4,346,747,926
0
Adjustment for write-off of organisational costs 0 – – – – – 4,821
0Net assets attributable to redeemable participating shareholders 0 30,301,822 20,541,502 1,799,933 1,763,899 4,103,730,895 4,346,752,747
The EUR, GBP and JPY Funds are translated in the total column at the financial period end exchange rate as disclosed in Note 7.
The accompanying notes are an integral part of the financial statements.
* Fund fully redeemed on 14 October 2019.
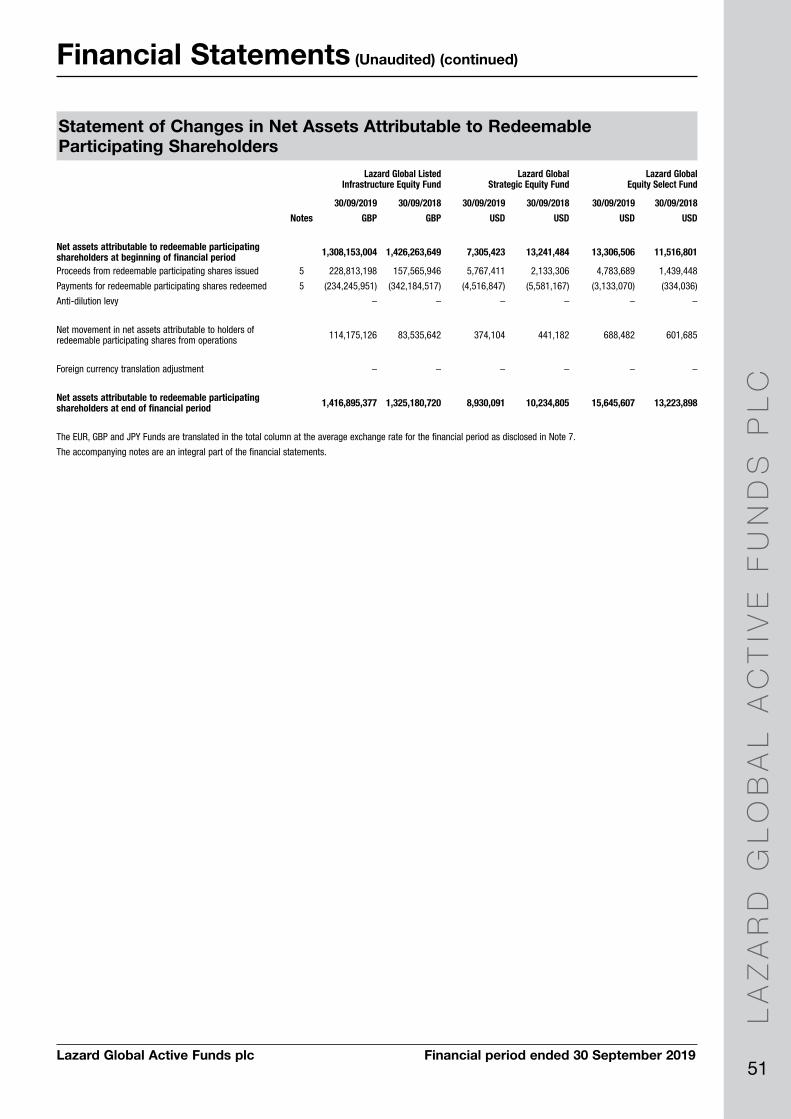
LA
ZA
RD
GL
OB
AL
AC
TIV
E F
UN
DS
PL
C
51Lazard Global Active Funds plc Financial period ended 30 September 2019
Financial Statements (Unaudited) (continued)
Statement of Changes in Net Assets Attributable to Redeemable Participating Shareholders
Lazard Global Listed Infrastructure Equity Fund
Lazard Global Strategic Equity Fund
Lazard Global Equity Select Fund
30/09/2019 30/09/2018 30/09/2019 30/09/2018 30/09/2019 30/09/2018
Notes GBP GBP USD USD USD USD
Net assets attributable to redeemable participating shareholders at beginning of financial period 1,308,153,004 1,426,263,649 7,305,423 13,241,484 13,306,506 11,516,801
Proceeds from redeemable participating shares issued 5 228,813,198 157,565,946 5,767,411 2,133,306 4,783,689 1,439,448
Payments for redeemable participating shares redeemed 5 (234,245,951) (342,184,517) (4,516,847) (5,581,167) (3,133,070) (334,036)
Anti-dilution levy – – – – – –
Net movement in net assets attributable to holders of redeemable participating shares from operations 114,175,126 83,535,642 374,104 441,182 688,482 601,685
Foreign currency translation adjustment – – – – – –
Net assets attributable to redeemable participating shareholders at end of financial period 1,416,895,377 1,325,180,720 8,930,091 10,234,805 15,645,607 13,223,898
The EUR, GBP and JPY Funds are translated in the total column at the average exchange rate for the financial period as disclosed in Note 7.
The accompanying notes are an integral part of the financial statements.
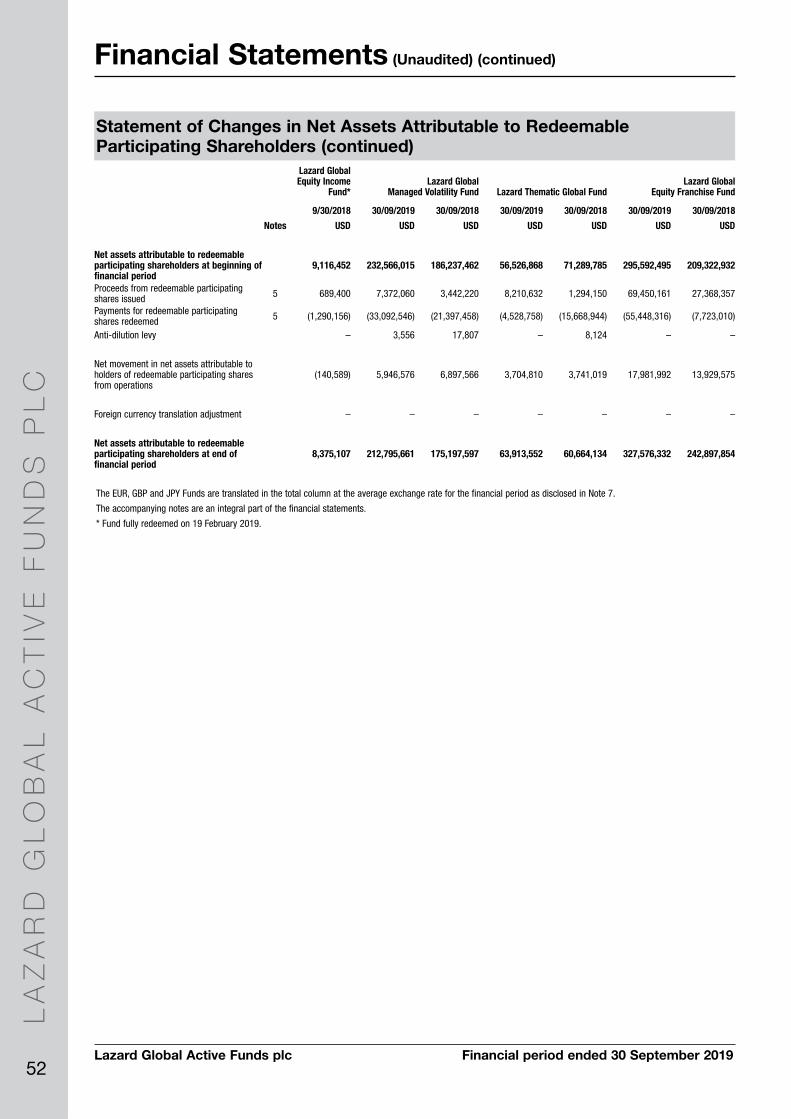
LA
ZA
RD
GL
OB
AL
AC
TIV
E F
UN
DS
PL
C
52Lazard Global Active Funds plc Financial period ended 30 September 2019
Financial Statements (Unaudited) (continued)
Statement of Changes in Net Assets Attributable to Redeemable Participating Shareholders (continued)
Lazard Global Equity Income
Fund*Lazard Global
Managed Volatility Fund Lazard Thematic Global FundLazard Global
Equity Franchise Fund
9/30/2018 30/09/2019 30/09/2018 30/09/2019 30/09/2018 30/09/2019 30/09/2018
Notes USD USD USD USD USD USD USD
Net assets attributable to redeemable participating shareholders at beginning of financial period
9,116,452 232,566,015 186,237,462 56,526,868 71,289,785 295,592,495 209,322,932
Proceeds from redeemable participating shares issued 5 689,400 7,372,060 3,442,220 8,210,632 1,294,150 69,450,161 27,368,357
Payments for redeemable participating shares redeemed 5 (1,290,156) (33,092,546) (21,397,458) (4,528,758) (15,668,944) (55,448,316) (7,723,010)
Anti-dilution levy – 3,556 17,807 – 8,124 – –
Net movement in net assets attributable to holders of redeemable participating shares from operations
(140,589) 5,946,576 6,897,566 3,704,810 3,741,019 17,981,992 13,929,575
Foreign currency translation adjustment – – – – – – –
Net assets attributable to redeemable participating shareholders at end of financial period
8,375,107 212,795,661 175,197,597 63,913,552 60,664,134 327,576,332 242,897,854
The EUR, GBP and JPY Funds are translated in the total column at the average exchange rate for the financial period as disclosed in Note 7.
The accompanying notes are an integral part of the financial statements.
* Fund fully redeemed on 19 February 2019.

LA
ZA
RD
GL
OB
AL
AC
TIV
E F
UN
DS
PL
C
53Lazard Global Active Funds plc Financial period ended 30 September 2019
Financial Statements (Unaudited) (continued)
Statement of Changes in Net Assets Attributable to Redeemable Participating Shareholders (continued)
Lazard European Equity FundLazard Pan
European Equity Fund*Lazard Pan-European
Small Cap Fund
30/09/2019 30/09/2018 30/09/2019 30/09/2018 30/09/2019 30/09/2018
Notes EUR EUR EUR EUR EUR EUR
Net assets attributable to redeemable participating shareholders at beginning of financial period 36,917,101 40,936,192 2,465,084 2,683,892 70,181,650 112,944,417
Proceeds from redeemable participating shares issued 5 1,879,319 831,740 1,274,280 814,105 3,802,882 721,304
Payments for redeemable participating shares redeemed 5 (3,060,935) (2,309,778) (895,079) (668,488) (33,311,926) (46,449,929)
Anti-dilution levy – – – – 7,009 120,698
Net movement in net assets attributable to holders of redeemable participating shares from operations 2,428,066 1,093,441 165,381 89,415 965,811 4,184,362
Foreign currency translation adjustment – – – – – –
Net assets attributable to redeemable participating shareholders at end of financial period 38,163,551 40,551,595 3,009,666 2,918,924 41,645,426 71,520,852
The EUR, GBP and JPY Funds are translated in the total column at the average exchange rate for the financial period as disclosed in Note 7.
The accompanying notes are an integral part of the financial statements.
* Fund fully redeemed on 25 November 2019.
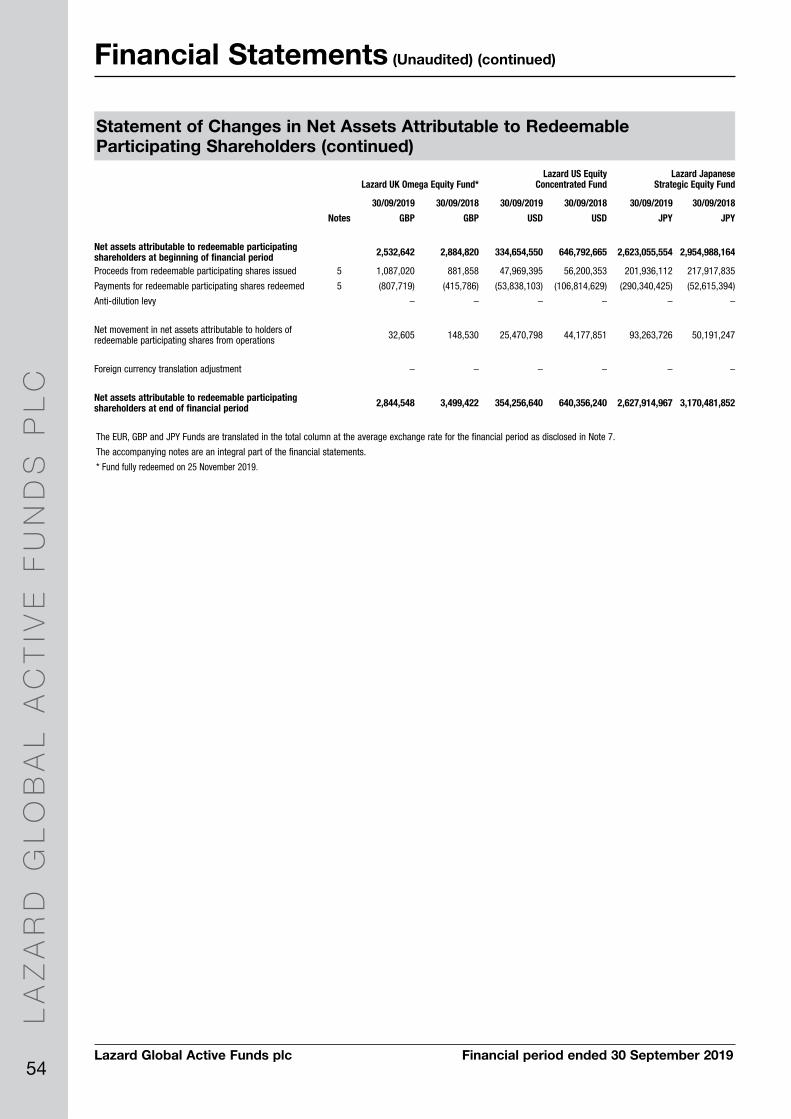
LA
ZA
RD
GL
OB
AL
AC
TIV
E F
UN
DS
PL
C
54Lazard Global Active Funds plc Financial period ended 30 September 2019
Financial Statements (Unaudited) (continued)
Statement of Changes in Net Assets Attributable to Redeemable Participating Shareholders (continued)
Lazard UK Omega Equity Fund*Lazard US Equity
Concentrated FundLazard Japanese
Strategic Equity Fund
30/09/2019 30/09/2018 30/09/2019 30/09/2018 30/09/2019 30/09/2018
Notes GBP GBP USD USD JPY JPY
Net assets attributable to redeemable participating shareholders at beginning of financial period 2,532,642 2,884,820 334,654,550 646,792,665 2,623,055,554 2,954,988,164
Proceeds from redeemable participating shares issued 5 1,087,020 881,858 47,969,395 56,200,353 201,936,112 217,917,835
Payments for redeemable participating shares redeemed 5 (807,719) (415,786) (53,838,103) (106,814,629) (290,340,425) (52,615,394)
Anti-dilution levy – – – – – –
Net movement in net assets attributable to holders of redeemable participating shares from operations 32,605 148,530 25,470,798 44,177,851 93,263,726 50,191,247
Foreign currency translation adjustment – – – – – –
Net assets attributable to redeemable participating shareholders at end of financial period 2,844,548 3,499,422 354,256,640 640,356,240 2,627,914,967 3,170,481,852
The EUR, GBP and JPY Funds are translated in the total column at the average exchange rate for the financial period as disclosed in Note 7.
The accompanying notes are an integral part of the financial statements.
* Fund fully redeemed on 25 November 2019.
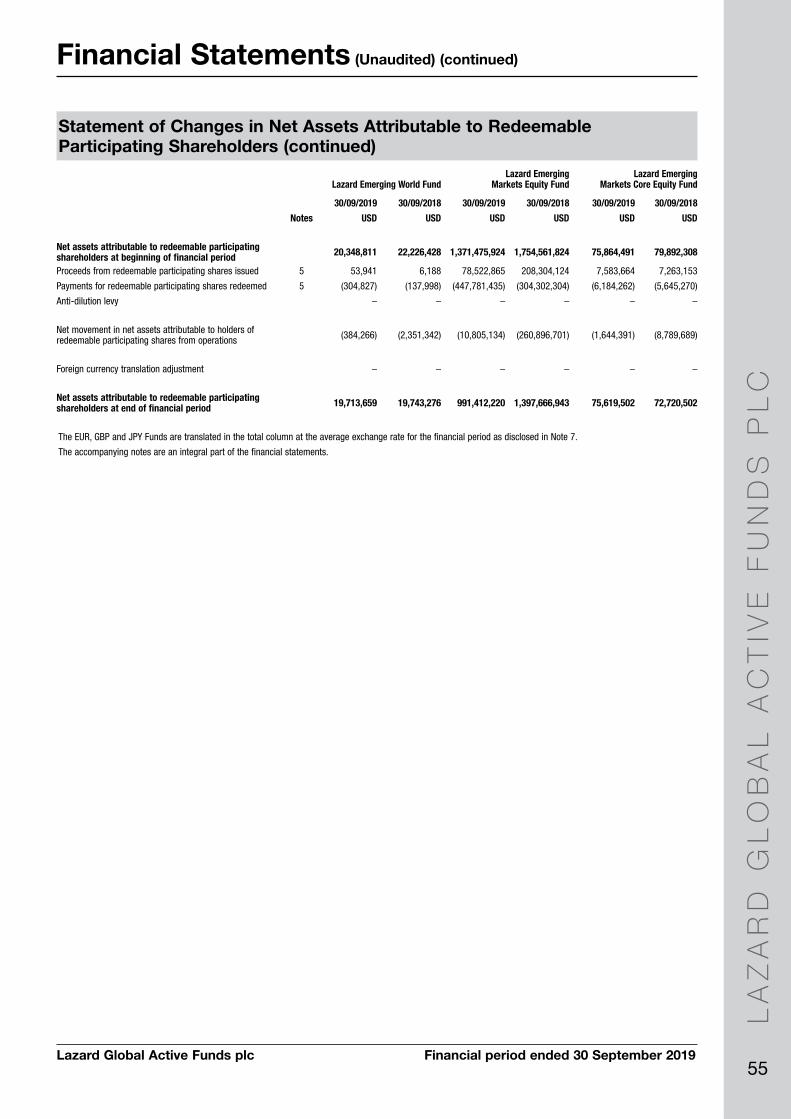
LA
ZA
RD
GL
OB
AL
AC
TIV
E F
UN
DS
PL
C
55Lazard Global Active Funds plc Financial period ended 30 September 2019
Financial Statements (Unaudited) (continued)
Statement of Changes in Net Assets Attributable to Redeemable Participating Shareholders (continued)
Lazard Emerging World FundLazard Emerging
Markets Equity FundLazard Emerging
Markets Core Equity Fund
30/09/2019 30/09/2018 30/09/2019 30/09/2018 30/09/2019 30/09/2018
Notes USD USD USD USD USD USD
Net assets attributable to redeemable participating shareholders at beginning of financial period 20,348,811 22,226,428 1,371,475,924 1,754,561,824 75,864,491 79,892,308
Proceeds from redeemable participating shares issued 5 53,941 6,188 78,522,865 208,304,124 7,583,664 7,263,153
Payments for redeemable participating shares redeemed 5 (304,827) (137,998) (447,781,435) (304,302,304) (6,184,262) (5,645,270)
Anti-dilution levy – – – – – –
Net movement in net assets attributable to holders of redeemable participating shares from operations (384,266) (2,351,342) (10,805,134) (260,896,701) (1,644,391) (8,789,689)
Foreign currency translation adjustment – – – – – –
Net assets attributable to redeemable participating shareholders at end of financial period 19,713,659 19,743,276 991,412,220 1,397,666,943 75,619,502 72,720,502
The EUR, GBP and JPY Funds are translated in the total column at the average exchange rate for the financial period as disclosed in Note 7.
The accompanying notes are an integral part of the financial statements.

LA
ZA
RD
GL
OB
AL
AC
TIV
E F
UN
DS
PL
C
56Lazard Global Active Funds plc Financial period ended 30 September 2019
Financial Statements (Unaudited) (continued)
Statement of Changes in Net Assets Attributable to Redeemable Participating Shareholders (continued)
Lazard Emerging Markets Equity Advantage Fund*
Lazard Developing Markets Equity Fund Lazard MENA Fund
30/09/2019 30/09/2018 30/09/2019 30/09/2018 30/09/2019 30/09/2018
Notes USD USD USD USD USD USD
Net assets attributable to redeemable participating shareholders at beginning of financial period 3,741,106 – 31,202,046 110,124,552 26,719,142 7,046,612
Proceeds from redeemable participating shares issued 5 90,092,935 4,054,650 1,839,075 1,680,206 1,698,961 24,340,585
Payments for redeemable participating shares redeemed 5 (4,496,412) – (8,520,047) (34,541,115) (1,269,059) (5,239,531)
Anti-dilution levy – – 3,510 72,045 – –
Net movement in net assets attributable to holders of redeemable participating shares from operations (2,506,356) (73,001) (572,278) (11,759,955) (734,376) (814,793)
Foreign currency translation adjustment – – – – – –
Net assets attributable to redeemable participating shareholders at end of financial period 86,831,273 3,981,649 23,952,306 65,575,733 26,414,668 25,332,873
The EUR, GBP and JPY Funds are translated in the total column at the average exchange rate for the financial period as disclosed in Note 7.
The accompanying notes are an integral part of the financial statements.
* Fund launched on 29 June 2018.

LA
ZA
RD
GL
OB
AL
AC
TIV
E F
UN
DS
PL
C
57Lazard Global Active Funds plc Financial period ended 30 September 2019
Financial Statements (Unaudited) (continued)
Statement of Changes in Net Assets Attributable to Redeemable Participating Shareholders (continued)
Lazard Global Fixed Income FundLazard Sterling
High Quality Bond Fund* Lazard Global Active Funds plc
30/09/2019 30/09/2018 30/09/2019 30/09/2018 30/09/2019 30/09/2018
Notes USD USD GBP GBP USD USD
Net assets attributable to redeemable participating shareholders at beginning of financial period 20,541,502 19,734,119 1,763,899 1,962,694 4,346,752,747 5,369,007,058
Proceeds from redeemable participating shares issued 5 16,837,621 6,204,712 31,681 12,977 639,247,699 560,188,372
Payments for redeemable participating shares redeemed 5 (7,687,431) (380,234) (109,405) (201,417) (971,144,187) (1,024,200,054)
Anti-dilution levy – – – – 14,900 240,090
Net movement in net assets attributable to holders of redeemable participating shares from operations 610,130 (1,848,590) 113,758 (32,285) 186,871,142 (98,721,606)
Foreign currency translation adjustment – – – – (98,011,406) (150,417,481)
Net assets attributable to redeemable participating shareholders at end of financial period 30,301,822 23,710,007 1,799,933 1,741,969 4,103,730,895 4,656,096,379
The EUR, GBP and JPY Funds are translated in the total column at the average exchange rate for the financial period as disclosed in Note 7.
The accompanying notes are an integral part of the financial statements.
* Fund fully redeemed on 14 October 2019.
LA
ZA
RD
GL
OB
AL
AC
TIV
E F
UN
DS
PL
C
58Lazard Global Active Funds plc Financial period ended 30 September 2019
Notes to the Financial Statements (Unaudited)
1. GeneralLazard Global Active Funds plc (the “Company”) was incorporated on 10 April 1996 as an open-ended investment company with variable capital structured as an umbrella fund and with segregated liability between its sub funds (individually referred to as the “Fund” and collectively the “Funds”) organised under the laws of Ireland. The Company qualifies and is authorised in Ireland by the Central Bank of Ireland (the “Central Bank”) as an Undertaking for Collective Investment in Transferable Securities (“UCITS”) pursuant to the European Communities (Undertakings for Collective Investment in Transferable Securities) Regulations, 2011 (as amended) (the “UCITS Regulations”) and the Central Bank (Supervision and Enforcement) Act 2013 (Section 48(1)) (Undertakings for Collective Investment in Transferable Securities) Regulations 2019, as amended (the “Central Bank UCITS Regulations”). The Company is structured as an umbrella fund in that the share capital of the Company may be divided into different classes of shares with one or more classes representing a separate Fund of the Company.
The Company currently has twenty Funds in existence. As at 30 September 2019, Lazard Global Listed Infrastructure Equity Fund, Lazard Global Strategic Equity Fund, Lazard Global Equity Select Fund, Lazard Global Managed Volatility Fund, Lazard Thematic Global Fund, Lazard Global Equity Franchise Fund, Lazard European Equity Fund, Lazard Pan European Equity Fund, Lazard Pan-European Small Cap Fund, Lazard UK Omega Equity Fund, Lazard US Equity Concentrated Fund, Lazard Japanese Strategic Equity Fund, Lazard Emerging World Fund, Lazard Emerging Markets Equity Fund, Lazard Emerging Markets Core Equity Fund, Lazard Emerging Markets Equity Advantage Fund, Lazard Developing Markets Equity Fund, Lazard MENA Fund, Lazard Global Fixed Income Fund and Lazard Sterling High Quality Bond Fund were funded. The investment objectives of each Fund within the Company are set out in the Prospectus and relevant Supplements for the Funds.
Lazard Global Equity Income Fund closed on 19 February 2019. Lazard Pan European Equity Fund, Lazard UK Omega Equity Fund and Lazard Sterling High Quality Bond Fund were closed subsequent to the financial period end. See Note 15 for information on the termination dates of these Funds.
2. Significant Accounting PoliciesThe significant accounting policies and estimation techniques adopted by the Company in the preparation of the financial statements are set out below. All references to net assets throughout the financial statements refer to net assets attributable to redeemable participating shareholders unless otherwise stated.
Statement of ComplianceThe condensed financial statements for the financial period ended 30 September 2019 have been prepared in accordance with Financial Reporting Standard (“FRS”) 104: “Interim Financial Reporting”, the UCITS Regulations and the Central Bank UCITS Regulations. The condensed financial statements should be read in conjunction with the audited financial statements for the financial year ended 31 March 2019, which have been prepared in accordance with FRS 102: “The Financial Reporting Standard applicable in the United Kingdom and the Republic of Ireland’’ (“FRS 102”) and Irish statute comprising the Companies Act 2014, the UCITS Regulations and the Central Bank UCITS Regulations.
The same accounting policies, presentation and methods of computation have been followed in these interim report and unaudited financial statements as were applied in the preparation of the Company’s annual report and audited financial statements for the financial year ended 31 March 2019.
These interim financial statements are unaudited. We note that the statutory auditor’s report in the Company’s annual report and audited financial statements for the financial year ended 31 March 2019 was unqualified.
Basis of PreparationThe financial statements are prepared under the historical cost convention as modified by the revaluation of financial assets and financial liabilities held at fair value through profit or loss. The financial statements have been prepared on a going concern basis and in accordance with accounting standards generally accepted in Ireland, the UCITS Regulations and the Central Bank UCITS Regulations. Accounting standards generally accepted in Ireland in preparing financial statements giving a true and fair view are those accounting standards issued by the Financial Reporting Council (Generally Accepted Accounting Practice in Ireland). Lazard Global Equity Income Fund was closed during the financial period end while Lazard Pan European Equity Fund, Lazard UK Omega Equity Fund and Lazard Sterling High Quality Bond Fund were closed subsequent to financial period end. As a result, the financial statements of these Funds have been prepared on a non-going concern basis.
The Company has availed of the exemption available to open-ended investment funds under FRS 102, Section 7 “Statement of Cash Flows” not to prepare a cash flow statement on the basis that substantially all of the Company’s investments are highly liquid and carried at fair value, and the Company provides a statement of changes in net assets attributable to redeemable participating shareholders.
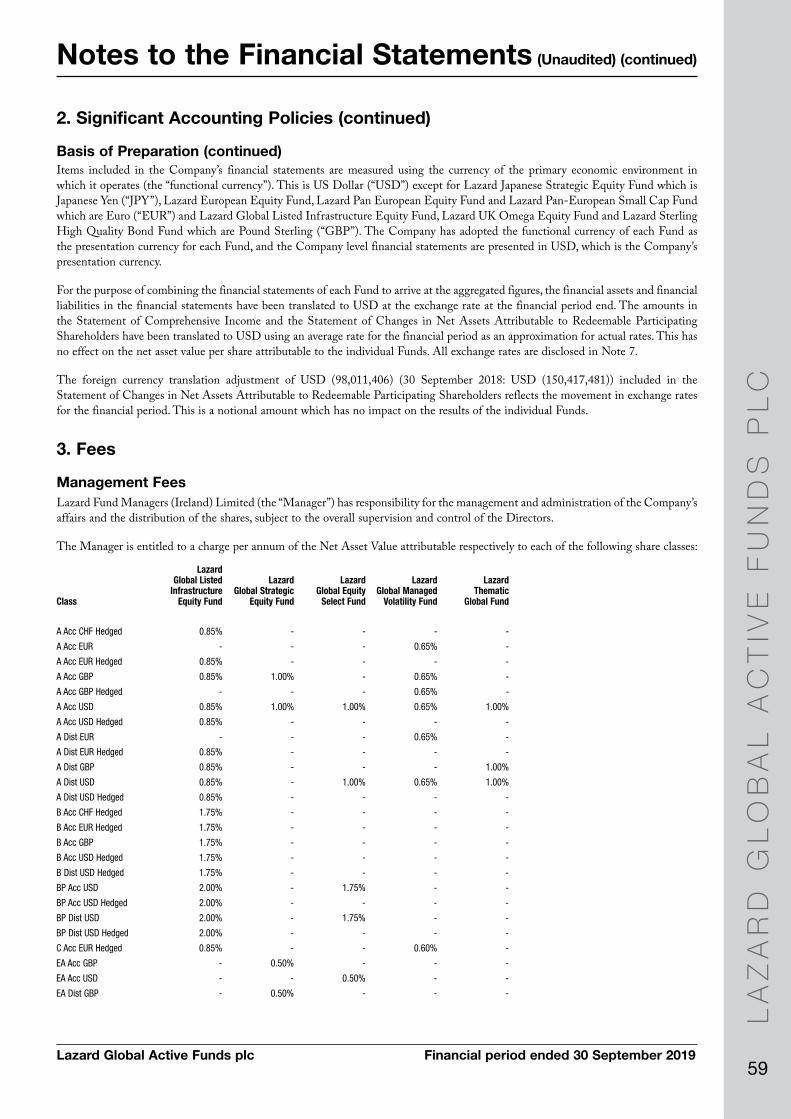
LA
ZA
RD
GL
OB
AL
AC
TIV
E F
UN
DS
PL
C
59Lazard Global Active Funds plc Financial period ended 30 September 2019
Notes to the Financial Statements (Unaudited) (continued)
Items included in the Company’s financial statements are measured using the currency of the primary economic environment in which it operates (the “functional currency”). This is US Dollar (“USD”) except for Lazard Japanese Strategic Equity Fund which is Japanese Yen (“JPY”), Lazard European Equity Fund, Lazard Pan European Equity Fund and Lazard Pan-European Small Cap Fund which are Euro (“EUR”) and Lazard Global Listed Infrastructure Equity Fund, Lazard UK Omega Equity Fund and Lazard Sterling High Quality Bond Fund which are Pound Sterling (“GBP”). The Company has adopted the functional currency of each Fund as the presentation currency for each Fund, and the Company level financial statements are presented in USD, which is the Company’s presentation currency.
For the purpose of combining the financial statements of each Fund to arrive at the aggregated figures, the financial assets and financial liabilities in the financial statements have been translated to USD at the exchange rate at the financial period end. The amounts in the Statement of Comprehensive Income and the Statement of Changes in Net Assets Attributable to Redeemable Participating Shareholders have been translated to USD using an average rate for the financial period as an approximation for actual rates. This has no effect on the net asset value per share attributable to the individual Funds. All exchange rates are disclosed in Note 7.
The foreign currency translation adjustment of USD (98,011,406) (30 September 2018: USD (150,417,481)) included in the Statement of Changes in Net Assets Attributable to Redeemable Participating Shareholders reflects the movement in exchange rates for the financial period. This is a notional amount which has no impact on the results of the individual Funds.
3. Fees
Management FeesLazard Fund Managers (Ireland) Limited (the “Manager”) has responsibility for the management and administration of the Company’s affairs and the distribution of the shares, subject to the overall supervision and control of the Directors.
The Manager is entitled to a charge per annum of the Net Asset Value attributable respectively to each of the following share classes:
Class
Lazard Global Listed
Infrastructure Equity Fund
Lazard Global Strategic
Equity Fund
Lazard Global Equity
Select Fund
Lazard Global Managed
Volatility Fund
Lazard Thematic
Global Fund
A Acc CHF Hedged 0.85% - - - -
A Acc EUR - - - 0.65% -
A Acc EUR Hedged 0.85% - - - -
A Acc GBP 0.85% 1.00% - 0.65% -
A Acc GBP Hedged - - - 0.65% -
A Acc USD 0.85% 1.00% 1.00% 0.65% 1.00%
A Acc USD Hedged 0.85% - - - -
A Dist EUR - - - 0.65% -
A Dist EUR Hedged 0.85% - - - -
A Dist GBP 0.85% - - - 1.00%
A Dist USD 0.85% - 1.00% 0.65% 1.00%
A Dist USD Hedged 0.85% - - - -
B Acc CHF Hedged 1.75% - - - -
B Acc EUR Hedged 1.75% - - - -
B Acc GBP 1.75% - - - -
B Acc USD Hedged 1.75% - - - -
B Dist USD Hedged 1.75% - - - -
BP Acc USD 2.00% - 1.75% - -
BP Acc USD Hedged 2.00% - - - -
BP Dist USD 2.00% - 1.75% - -
BP Dist USD Hedged 2.00% - - - -
C Acc EUR Hedged 0.85% - - 0.60% -
EA Acc GBP - 0.50% - - -
EA Acc USD - - 0.50% - -
EA Dist GBP - 0.50% - - -
2. Significant Accounting Policies (continued)
Basis of Preparation (continued)
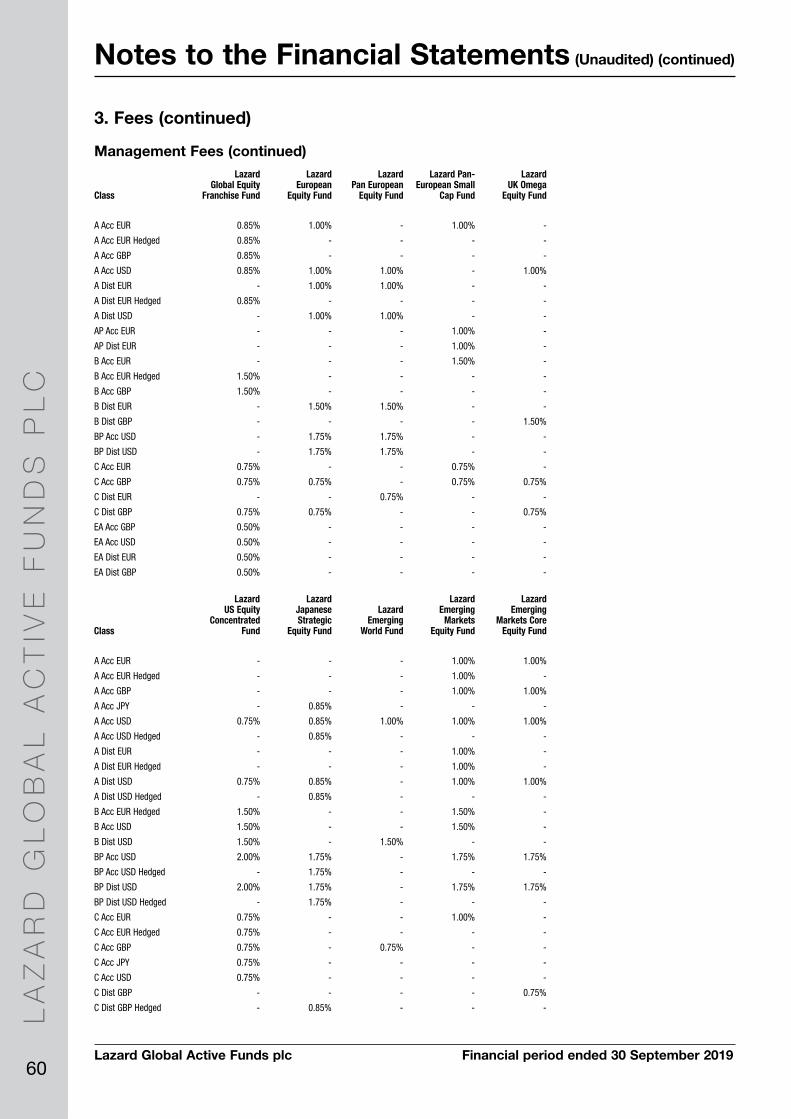
LA
ZA
RD
GL
OB
AL
AC
TIV
E F
UN
DS
PL
C
60Lazard Global Active Funds plc Financial period ended 30 September 2019
Notes to the Financial Statements (Unaudited) (continued)
Class
Lazard Global Equity
Franchise Fund
Lazard European
Equity Fund
Lazard Pan European
Equity Fund
Lazard Pan-European Small
Cap Fund
Lazard UK Omega
Equity Fund
A Acc EUR 0.85% 1.00% - 1.00% -
A Acc EUR Hedged 0.85% - - - -
A Acc GBP 0.85% - - - -
A Acc USD 0.85% 1.00% 1.00% - 1.00%
A Dist EUR - 1.00% 1.00% - -
A Dist EUR Hedged 0.85% - - - -
A Dist USD - 1.00% 1.00% - -
AP Acc EUR - - - 1.00% -
AP Dist EUR - - - 1.00% -
B Acc EUR - - - 1.50% -
B Acc EUR Hedged 1.50% - - - -
B Acc GBP 1.50% - - - -
B Dist EUR - 1.50% 1.50% - -
B Dist GBP - - - - 1.50%
BP Acc USD - 1.75% 1.75% - -
BP Dist USD - 1.75% 1.75% - -
C Acc EUR 0.75% - - 0.75% -
C Acc GBP 0.75% 0.75% - 0.75% 0.75%
C Dist EUR - - 0.75% - -
C Dist GBP 0.75% 0.75% - - 0.75%
EA Acc GBP 0.50% - - - -
EA Acc USD 0.50% - - - -
EA Dist EUR 0.50% - - - -
EA Dist GBP 0.50% - - - -
Class
Lazard US Equity
Concentrated Fund
Lazard Japanese Strategic
Equity Fund
Lazard Emerging
World Fund
Lazard Emerging
Markets Equity Fund
Lazard Emerging
Markets Core Equity Fund
A Acc EUR - - - 1.00% 1.00%
A Acc EUR Hedged - - - 1.00% -
A Acc GBP - - - 1.00% 1.00%
A Acc JPY - 0.85% - - -
A Acc USD 0.75% 0.85% 1.00% 1.00% 1.00%
A Acc USD Hedged - 0.85% - - -
A Dist EUR - - - 1.00% -
A Dist EUR Hedged - - - 1.00% -
A Dist USD 0.75% 0.85% - 1.00% 1.00%
A Dist USD Hedged - 0.85% - - -
B Acc EUR Hedged 1.50% - - 1.50% -
B Acc USD 1.50% - - 1.50% -
B Dist USD 1.50% - 1.50% - -
BP Acc USD 2.00% 1.75% - 1.75% 1.75%
BP Acc USD Hedged - 1.75% - - -
BP Dist USD 2.00% 1.75% - 1.75% 1.75%
BP Dist USD Hedged - 1.75% - - -
C Acc EUR 0.75% - - 1.00% -
C Acc EUR Hedged 0.75% - - - -
C Acc GBP 0.75% - 0.75% - -
C Acc JPY 0.75% - - - -
C Acc USD 0.75% - - - -
C Dist GBP - - - - 0.75%
C Dist GBP Hedged - 0.85% - - -
3. Fees (continued)
Management Fees (continued)
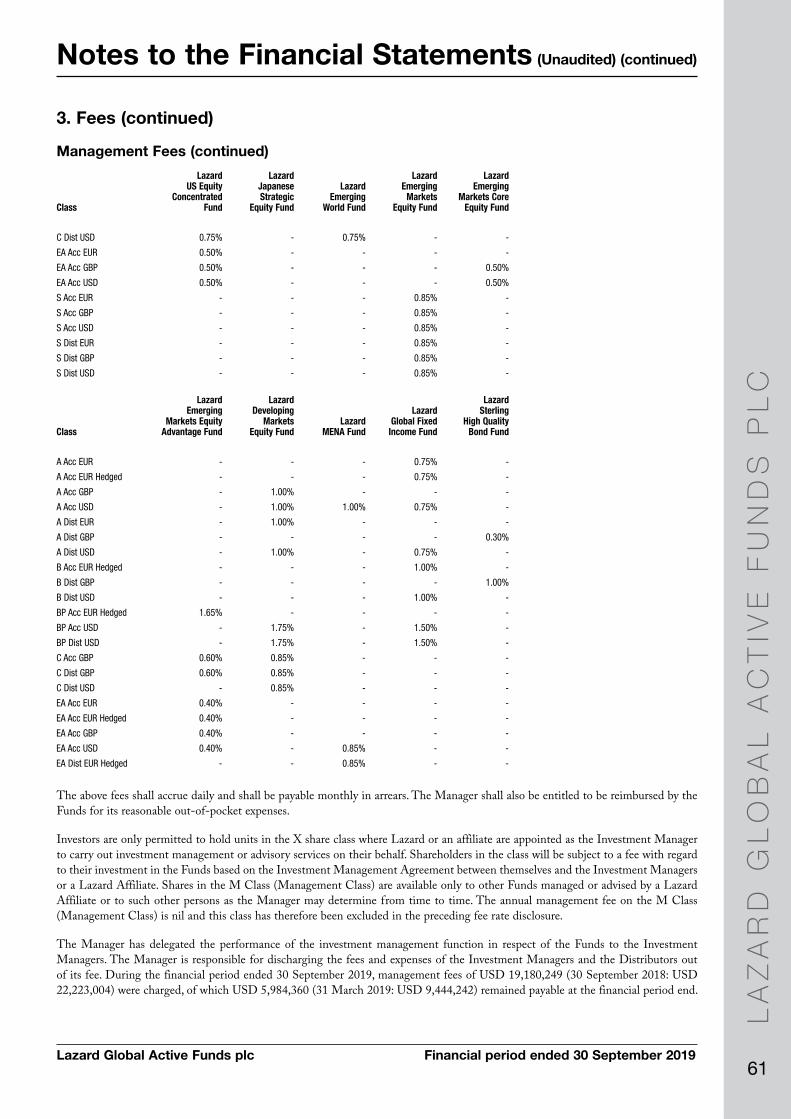
LA
ZA
RD
GL
OB
AL
AC
TIV
E F
UN
DS
PL
C
61Lazard Global Active Funds plc Financial period ended 30 September 2019
Notes to the Financial Statements (Unaudited) (continued)
C Dist USD 0.75% - 0.75% - -
EA Acc EUR 0.50% - - - -
EA Acc GBP 0.50% - - - 0.50%
EA Acc USD 0.50% - - - 0.50%
S Acc EUR - - - 0.85% -
S Acc GBP - - - 0.85% -
S Acc USD - - - 0.85% -
S Dist EUR - - - 0.85% -
S Dist GBP - - - 0.85% -
S Dist USD - - - 0.85% -
Class
Lazard Emerging
Markets Equity Advantage Fund
Lazard Developing
Markets Equity Fund
Lazard MENA Fund
Lazard Global Fixed
Income Fund
Lazard Sterling
High Quality Bond Fund
A Acc EUR - - - 0.75% -
A Acc EUR Hedged - - - 0.75% -
A Acc GBP - 1.00% - - -
A Acc USD - 1.00% 1.00% 0.75% -
A Dist EUR - 1.00% - - -
A Dist GBP - - - - 0.30%
A Dist USD - 1.00% - 0.75% -
B Acc EUR Hedged - - - 1.00% -
B Dist GBP - - - - 1.00%
B Dist USD - - - 1.00% -
BP Acc EUR Hedged 1.65% - - - -
BP Acc USD - 1.75% - 1.50% -
BP Dist USD - 1.75% - 1.50% -
C Acc GBP 0.60% 0.85% - - -
C Dist GBP 0.60% 0.85% - - -
C Dist USD - 0.85% - - -
EA Acc EUR 0.40% - - - -
EA Acc EUR Hedged 0.40% - - - -
EA Acc GBP 0.40% - - - -
EA Acc USD 0.40% - 0.85% - -
EA Dist EUR Hedged - - 0.85% - -
The above fees shall accrue daily and shall be payable monthly in arrears. The Manager shall also be entitled to be reimbursed by the Funds for its reasonable out-of-pocket expenses.
Investors are only permitted to hold units in the X share class where Lazard or an affiliate are appointed as the Investment Manager to carry out investment management or advisory services on their behalf. Shareholders in the class will be subject to a fee with regard to their investment in the Funds based on the Investment Management Agreement between themselves and the Investment Managers or a Lazard Affiliate. Shares in the M Class (Management Class) are available only to other Funds managed or advised by a Lazard Affiliate or to such other persons as the Manager may determine from time to time. The annual management fee on the M Class (Management Class) is nil and this class has therefore been excluded in the preceding fee rate disclosure.
The Manager has delegated the performance of the investment management function in respect of the Funds to the Investment Managers. The Manager is responsible for discharging the fees and expenses of the Investment Managers and the Distributors out of its fee. During the financial period ended 30 September 2019, management fees of USD 19,180,249 (30 September 2018: USD 22,223,004) were charged, of which USD 5,984,360 (31 March 2019: USD 9,444,242) remained payable at the financial period end.
3. Fees (continued)
Management Fees (continued)
Class
Lazard US Equity
Concentrated Fund
Lazard Japanese Strategic
Equity Fund
Lazard Emerging
World Fund
Lazard Emerging
Markets Equity Fund
Lazard Emerging
Markets Core Equity Fund

LA
ZA
RD
GL
OB
AL
AC
TIV
E F
UN
DS
PL
C
62Lazard Global Active Funds plc Financial period ended 30 September 2019
Notes to the Financial Statements (Unaudited) (continued)
Each class of shares of each Fund shall bear its attributable portion of the other expenses of the Company (as set out in detail under the heading “Other Expenses” in the section of the Prospectus entitled “Fees and Expenses”), subject to an overall cap on expenses of 0.30% per annum of the Net Asset Value of the Funds. In the case of Lazard Global Managed Volatility Fund and Lazard Emerging Markets Equity Advantage Fund, the cap is 0.23% and in the case of Lazard Global Equity Franchise Fund and Lazard Pan-European Small Cap Fund, the cap is 0.20%. During the financial periods ended 30 September 2019 and 30 September 2018, the above cap on expenses was in use on Lazard Global Strategic Equity Fund, Lazard Global Equity Select Fund, Lazard Pan European Equity Fund, Lazard Pan-European Small Cap Fund, Lazard UK Omega Equity Fund, Lazard Emerging World Fund, Lazard Emerging Markets Equity Advantage Fund, Lazard MENA Fund, Lazard Global Fixed Income Fund and Lazard Sterling High Quality Bond Fund. The Manager will be responsible for any such expenses in excess of this limit with the exception of the expenses of acquiring and disposing of investments (including brokerage expenses, custodial and sub-custodial transaction charges, stamp duties and other relevant taxes). For Lazard Global Equity Franchise Fund, Lazard Pan European Equity Fund, Lazard Pan-European Small Cap Fund, Lazard US Equity Concentrated Fund and Lazard Emerging Markets Core Equity Fund, custodial and sub-custodial transactions charges are included in the cap. For the avoidance of doubt, the Manager will not be responsible for the costs of hedging the currency exposure for the benefit of any particular share class of the Funds, which costs shall be attributable exclusively to the relevant share class.
The fees reimbursed by the Manager during the financial period ended 30 September 2019 amounted to USD 146,941 (30 September 2018: USD 97,837), of which USD 61,414 (31 March 2019: USD 148,847) remained receivable at the financial period end.
Administration, Transfer Agency and Depositary FeesBNY Mellon Fund Services (Ireland) Designated Activity Company (the “Administrator”) is entitled to an annual fee payable by the Funds of up to 0.07% of the Funds’ Net Asset Value. Such fees shall accrue daily and shall be payable monthly in arrears. The Administrator shall also be entitled to recover from the Funds its reasonable out-of-pocket expenses.
Shareholder and transfer agency services will be charged at USD 20 per investor holding at Fund level per annum (exclusive of transaction charges, which shall be at normal commercial rates).
The Depositary is entitled to be paid by the Funds an annual fee for the performance of its trustee functions of up to 0.0225% of the Funds’ Net Asset Value. Such fees shall accrue daily and shall be payable monthly in arrears. The Depositary is also entitled to charge the Funds transaction fees, which shall be at normal commercial rates, and to be reimbursed by the Funds for the fees and transactions charges of any sub-custodian (which shall also be at normal commercial rates), together with its reasonable out-of-pocket expenses.
The administration, transfer agency and depositary fees charged during the financial period ended 30 September 2019 (including out-of-pocket expenses) amounted to USD 2,887,852 (30 September 2018: USD 3,038,245), of which USD 1,998,045 (31 March 2019: USD 1,567,079) remained payable at the financial period end.
Directors’ FeesDirectors’ fees charged during the financial period ended 30 September 2019 were USD 66,090 (30 September 2018: USD 69,094), of which USD 30,135 (31 March 2019: USD 29,917) remained payable at the financial period end.
4. TaxationUnder current law and practice, the Company qualifies as an investment undertaking as defined in Section 739B of the Taxes Consolidation Act, 1997, as amended. On that basis, the Company will not be liable to taxation in respect of its income and gains, other than on the occurrence of a chargeable event. Generally, a chargeable event arises on any distribution, redemption, repurchase, cancellation, transfer of shares or on the ending of a ‘relevant period’, a ‘relevant period’ being an eight year period beginning with the acquisition of the shares by the shareholders and each subsequent period of eight years beginning immediately after the preceding relevant period.
3. Fees (continued)
Reimbursement from Manager

LA
ZA
RD
GL
OB
AL
AC
TIV
E F
UN
DS
PL
C
63Lazard Global Active Funds plc Financial period ended 30 September 2019
Notes to the Financial Statements (Unaudited) (continued)
A chargeable event does not include:
a) any transactions in relation to shares held in a recognised clearing system as designated by order of the Revenue Commissioners of Ireland; or
b) an exchange of shares representing a Fund for another Fund; orc) an exchange of shares arising on a qualifying amalgamation or reconstruction of a Fund with another Fund; ord) certain exchanges of shares between spouses and former spouses.
A chargeable event will not occur in respect of shareholders who are neither resident nor ordinarily resident in Ireland and who have provided the Company with a relevant declaration to that effect.
In the absence of an appropriate declaration, the Company will be liable to Irish Tax on the occurrence of a chargeable event. There were no chargeable events during the financial period under review.
Capital gains, dividends and interest received may be subject to withholding taxes imposed by the country of origin and such taxes may not be recoverable by a Fund or its shareholders.
Withholding Tax RefundsDuring the financial period ended 30 September 2019, a number of Funds received withholding tax refunds which were not previously recognised due to uncertainty around their recoverability. Upon receipt of these refunds, these amounts were included in the Net Asset Value of the Funds and were recorded in the Statement of Comprehensive Income as “Other Income”. These refunds had a positive impact on the performance of the Funds which received them during the financial period ended 30 September 2019.
During the financial period ended 30 September 2018, none of the Funds received withholding tax refunds.
5. Capital and ReservesThe Company has a variable share capital.
Management SharesOn incorporation, the authorised share capital of the Company was GBP 40,000 divided in 40,000 subscriber shares of par value of GBP 1 each (“Equity shares”), all but one of which were subsequently redeemed.
There is currently 1 subscriber share in issue and that is held by the Manager.
The subscriber share does not form part of the net asset value of the Company.
Redeemable Participating SharesThe Company has an authorised share capital of 500,000,000,000 shares of no par value which are available for issue as fully paid Participating Shares in each of the Company’s Funds (“Redeemable Participating Shares”). They may be redeemed by the Company at the request of the shareholder. Redeemable Participating Shares are available for subscription and redemption on each dealing day as outlined in the Funds’ Supplements to the Prospectus. The value of shares issued and redeemed during the financial period is set out in the Statement of Changes in Net Assets Attributable to Redeemable Participating Shareholders.
Redeemable Participating Shares carry the right to a proportionate share in the assets of the Funds and to any distributions in net assets that may be declared. The holder of the share is entitled to one vote each on a poll. Under Section 22 “Liabilities and Equity” of FRS 102, the Redeemable Participating Shares are redeemable at the shareholder’s option and are classified as financial liabilities.
All Redeemable Participating Shares issued by the Company provide the investors with the right to require redemption for cash at the value proportionate to the investors share in each Fund’s net assets at the redemption date. In accordance with Section 22 of FRS 102, such instruments give rise to a financial liability for the present value of the redemption amount that would be payable at the Statement of Financial Position date if the shareholders exercised their rights to put the shares back to the Company.
4. Taxation (continued)
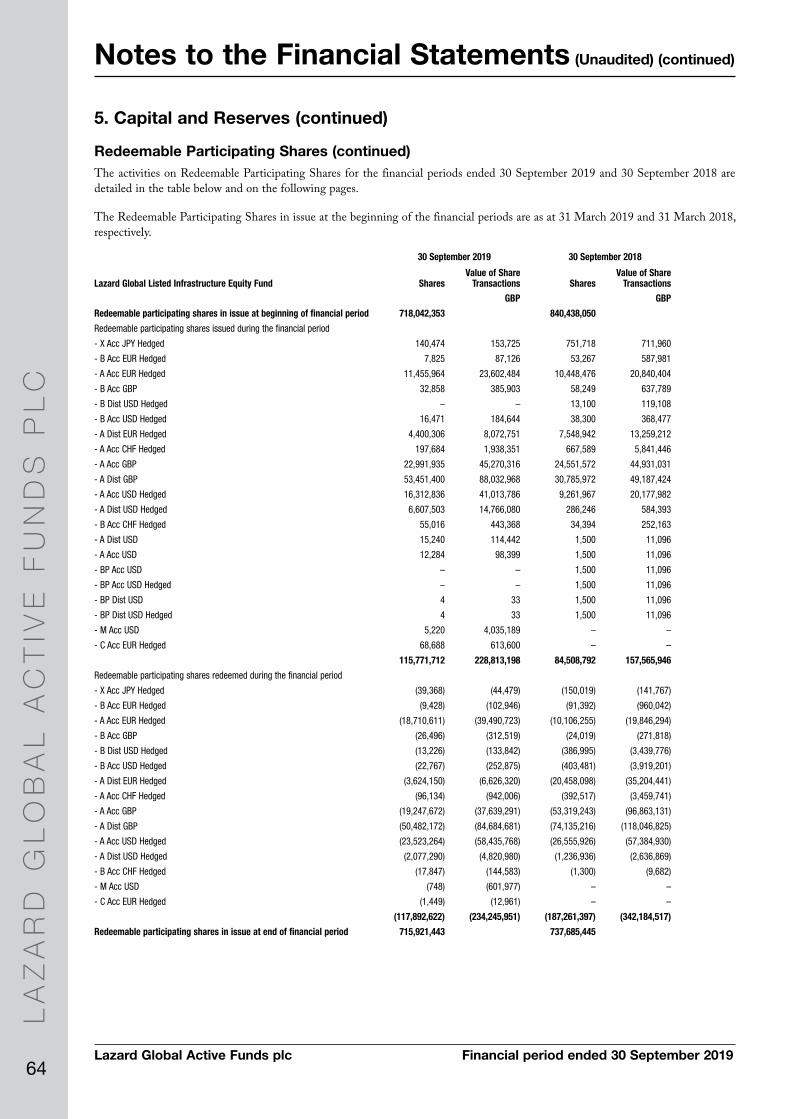
LA
ZA
RD
GL
OB
AL
AC
TIV
E F
UN
DS
PL
C
64Lazard Global Active Funds plc Financial period ended 30 September 2019
Notes to the Financial Statements (Unaudited) (continued)
The activities on Redeemable Participating Shares for the financial periods ended 30 September 2019 and 30 September 2018 are detailed in the table below and on the following pages.
The Redeemable Participating Shares in issue at the beginning of the financial periods are as at 31 March 2019 and 31 March 2018, respectively.
30 September 2019 30 September 2018
Lazard Global Listed Infrastructure Equity Fund SharesValue of Share
Transactions SharesValue of Share
Transactions
GBP GBP
Redeemable participating shares in issue at beginning of financial period 718,042,353 840,438,050
Redeemable participating shares issued during the financial period
- X Acc JPY Hedged 140,474 153,725 751,718 711,960
- B Acc EUR Hedged 7,825 87,126 53,267 587,981
- A Acc EUR Hedged 11,455,964 23,602,484 10,448,476 20,840,404
- B Acc GBP 32,858 385,903 58,249 637,789
- B Dist USD Hedged – – 13,100 119,108
- B Acc USD Hedged 16,471 184,644 38,300 368,477
- A Dist EUR Hedged 4,400,306 8,072,751 7,548,942 13,259,212
- A Acc CHF Hedged 197,684 1,938,351 667,589 5,841,446
- A Acc GBP 22,991,935 45,270,316 24,551,572 44,931,031
- A Dist GBP 53,451,400 88,032,968 30,785,972 49,187,424
- A Acc USD Hedged 16,312,836 41,013,786 9,261,967 20,177,982
- A Dist USD Hedged 6,607,503 14,766,080 286,246 584,393
- B Acc CHF Hedged 55,016 443,368 34,394 252,163
- A Dist USD 15,240 114,442 1,500 11,096
- A Acc USD 12,284 98,399 1,500 11,096
- BP Acc USD – – 1,500 11,096
- BP Acc USD Hedged – – 1,500 11,096
- BP Dist USD 4 33 1,500 11,096
- BP Dist USD Hedged 4 33 1,500 11,096
- M Acc USD 5,220 4,035,189 – –
- C Acc EUR Hedged 68,688 613,600 – –
115,771,712 228,813,198 84,508,792 157,565,946
Redeemable participating shares redeemed during the financial period
- X Acc JPY Hedged (39,368) (44,479) (150,019) (141,767)
- B Acc EUR Hedged (9,428) (102,946) (91,392) (960,042)
- A Acc EUR Hedged (18,710,611) (39,490,723) (10,106,255) (19,846,294)
- B Acc GBP (26,496) (312,519) (24,019) (271,818)
- B Dist USD Hedged (13,226) (133,842) (386,995) (3,439,776)
- B Acc USD Hedged (22,767) (252,875) (403,481) (3,919,201)
- A Dist EUR Hedged (3,624,150) (6,626,320) (20,458,098) (35,204,441)
- A Acc CHF Hedged (96,134) (942,006) (392,517) (3,459,741)
- A Acc GBP (19,247,672) (37,639,291) (53,319,243) (96,863,131)
- A Dist GBP (50,482,172) (84,684,681) (74,135,216) (118,046,825)
- A Acc USD Hedged (23,523,264) (58,435,768) (26,555,926) (57,384,930)
- A Dist USD Hedged (2,077,290) (4,820,980) (1,236,936) (2,636,869)
- B Acc CHF Hedged (17,847) (144,583) (1,300) (9,682)
- M Acc USD (748) (601,977) – –
- C Acc EUR Hedged (1,449) (12,961) – –
(117,892,622) (234,245,951) (187,261,397) (342,184,517)
Redeemable participating shares in issue at end of financial period 715,921,443 737,685,445
5. Capital and Reserves (continued)
Redeemable Participating Shares (continued)
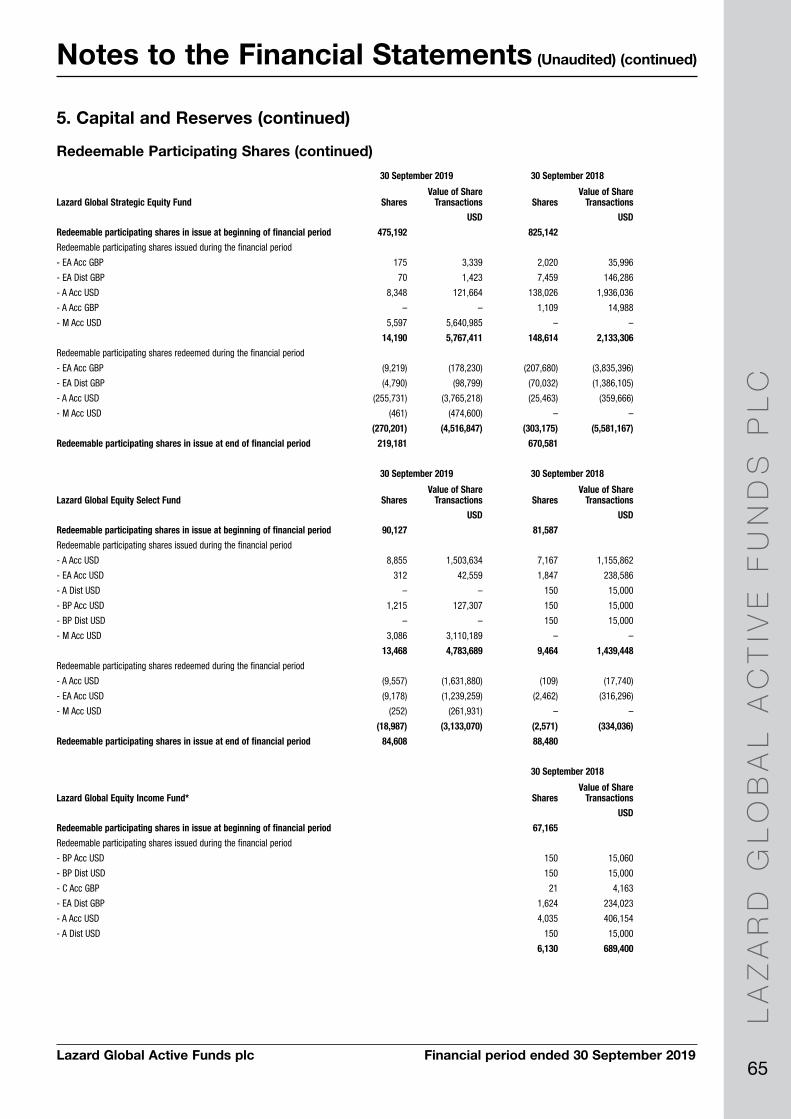
LA
ZA
RD
GL
OB
AL
AC
TIV
E F
UN
DS
PL
C
65Lazard Global Active Funds plc Financial period ended 30 September 2019
Notes to the Financial Statements (Unaudited) (continued)
30 September 2019 30 September 2018
Lazard Global Strategic Equity Fund SharesValue of Share
Transactions SharesValue of Share
Transactions
USD USD
Redeemable participating shares in issue at beginning of financial period 475,192 825,142
Redeemable participating shares issued during the financial period
- EA Acc GBP 175 3,339 2,020 35,996
- EA Dist GBP 70 1,423 7,459 146,286
- A Acc USD 8,348 121,664 138,026 1,936,036
- A Acc GBP – – 1,109 14,988
- M Acc USD 5,597 5,640,985 – –
14,190 5,767,411 148,614 2,133,306
Redeemable participating shares redeemed during the financial period
- EA Acc GBP (9,219) (178,230) (207,680) (3,835,396)
- EA Dist GBP (4,790) (98,799) (70,032) (1,386,105)
- A Acc USD (255,731) (3,765,218) (25,463) (359,666)
- M Acc USD (461) (474,600) – –
(270,201) (4,516,847) (303,175) (5,581,167)
Redeemable participating shares in issue at end of financial period 219,181 670,581
30 September 2019 30 September 2018
Lazard Global Equity Select Fund SharesValue of Share
Transactions SharesValue of Share
Transactions
USD USD
Redeemable participating shares in issue at beginning of financial period 90,127 81,587
Redeemable participating shares issued during the financial period
- A Acc USD 8,855 1,503,634 7,167 1,155,862
- EA Acc USD 312 42,559 1,847 238,586
- A Dist USD – – 150 15,000
- BP Acc USD 1,215 127,307 150 15,000
- BP Dist USD – – 150 15,000
- M Acc USD 3,086 3,110,189 – –
13,468 4,783,689 9,464 1,439,448
Redeemable participating shares redeemed during the financial period
- A Acc USD (9,557) (1,631,880) (109) (17,740)
- EA Acc USD (9,178) (1,239,259) (2,462) (316,296)
- M Acc USD (252) (261,931) – –
(18,987) (3,133,070) (2,571) (334,036)
Redeemable participating shares in issue at end of financial period 84,608 88,480
30 September 2018
Lazard Global Equity Income Fund* SharesValue of Share
Transactions
USD
Redeemable participating shares in issue at beginning of financial period 67,165
Redeemable participating shares issued during the financial period
- BP Acc USD 150 15,060
- BP Dist USD 150 15,000
- C Acc GBP 21 4,163
- EA Dist GBP 1,624 234,023
- A Acc USD 4,035 406,154
- A Dist USD 150 15,000
6,130 689,400
5. Capital and Reserves (continued)
Redeemable Participating Shares (continued)

LA
ZA
RD
GL
OB
AL
AC
TIV
E F
UN
DS
PL
C
66Lazard Global Active Funds plc Financial period ended 30 September 2019
Notes to the Financial Statements (Unaudited) (continued)
Redeemable participating shares redeemed during the financial period
- EA Dist EUR (280) (32,863)
- BP Acc USD (1) (60)
- EA Acc GBP (2,459) (417,108)
- EA Dist GBP (4,936) (714,242)
- A Acc USD (1,184) (116,506)
- EA Dist USD (109) (9,377)
(8,969) (1,290,156)
Redeemable participating shares in issue at end of financial period 64,326
* Fund fully redeemed on 19 February 2019.
30 September 2019 30 September 2018
Lazard Global Managed Volatility Fund SharesValue of Share
Transactions SharesValue of Share
Transactions
USD USD
Redeemable participating shares in issue at beginning of financial period 1,416,612 1,063,877
Redeemable participating shares issued during the financial period
- A Acc EUR 4,750 683,425 – –
- A Acc GBP Hedged – – 130 23,524
- A Acc USD 1,266 259,240 8,284 1,599,746
- A Dist USD 4,418 547,589 14,514 1,746,166
- A Acc GBP 120 17,333 530 72,784
- C Acc EUR Hedged 18,000 2,123,709 – –
- M Acc USD 3,742 3,740,764 – –
32,296 7,372,060 23,458 3,442,220
Redeemable participating shares redeemed during the financial period
- A Acc EUR (13,754) (1,969,693) – –
- A Acc GBP Hedged – – (104,267) (16,031,833)
- A Acc USD (32,724) (6,773,704) (27,107) (5,235,625)
- A Dist USD (136,044) (16,807,980) (1,078) (130,000)
- C Acc EUR Hedged (62,000) (7,410,682) – –
- M Acc USD (126) (130,487) – –
(244,648) (33,092,546) (132,452) (21,397,458)
Redeemable participating shares in issue at end of financial period 1,204,260 954,883
30 September 2019 30 September 2018
Lazard Thematic Global Fund SharesValue of Share
Transactions SharesValue of Share
Transactions
USD USD
Redeemable participating shares in issue at beginning of financial period 244,119 324,552
Redeemable participating shares issued during the financial period
- A Dist GBP 383 93,272 174 39,139
- A Acc USD 12,000 2,926,099 5,249 1,191,269
- A Dist USD 4,445 1,084,027 283 63,742
- M Acc USD 4,025 4,107,234 – –
20,853 8,210,632 5,706 1,294,150
Redeemable participating shares redeemed during the financial period
- A Dist GBP (10,776) (2,586,331) (17,038) (3,839,705)
- A Acc USD (7,689) (1,900,232) (885) (204,153)
- A Dist USD (37) (9,259) (51,508) (11,625,086)
- M Acc USD (31) (32,936) – –
(18,533) (4,528,758) (69,431) (15,668,944)
Redeemable participating shares in issue at end of financial period 246,439 260,827
5. Capital and Reserves (continued)
Redeemable Participating Shares (continued)
30 September 2018
Lazard Global Equity Income Fund* (continued) SharesValue of Share
Transactions
USD

LA
ZA
RD
GL
OB
AL
AC
TIV
E F
UN
DS
PL
C
67Lazard Global Active Funds plc Financial period ended 30 September 2019
Notes to the Financial Statements (Unaudited) (continued)
30 September 2019 30 September 2018
Lazard Global Equity Franchise Fund SharesValue of Share
Transactions SharesValue of Share
Transactions
USD USD
Redeemable participating shares in issue at beginning of financial period 2,095,458 1,506,596
Redeemable participating shares issued during the financial period
- A Acc GBP 8,166 1,795,514 22,524 4,917,287
- A Acc USD 119,732 17,370,815 890 128,167
- EA Acc GBP 23,144 3,740,801 16,956 2,646,018
- EA Acc USD 132,548 19,424,344 18,981 2,607,799
- EA Dist GBP 78,544 11,107,685 49,673 7,034,420
- B Acc GBP 1,093 158,420 11,642 1,692,123
- C Acc GBP 26,164 3,873,253 54,129 7,924,293
- C Dist GBP 7,971 1,142,666 2,586 380,239
- EA Dist EUR 1,031 128,176 309 38,011
- A Acc EUR Hedged 25,241 2,963,928 – –
- C Acc EUR 49,222 5,518,082 – –
- A Acc EUR 500 55,953 – –
- M Acc USD 2,142 2,170,524 – –
475,498 69,450,161 177,690 27,368,357
Redeemable participating shares redeemed during the financial period
- A Acc GBP (8,392) (1,830,063) (7,650) (1,657,964)
- A Acc USD (224,807) (32,868,836) – –
- EA Acc GBP (15,146) (2,447,274) (4,455) (704,359)
- EA Acc USD (35,426) (5,169,627) (12,508) (1,722,605)
- EA Dist GBP (27,040) (3,829,385) (16,703) (2,394,080)
- B Acc GBP (6,396) (921,029) (1,663) (241,781)
- C Acc GBP (30,074) (4,398,722) (6,858) (1,002,125)
- C Dist GBP (2,224) (316,202) (1) (96)
- EA Dist EUR (9,310) (1,194,051) – –
- A Acc EUR Hedged (19,759) (2,313,996) – –
- B Acc EUR Hedged (342) (37,324) – –
- C Acc EUR (386) (46,397) – –
- M Acc USD (73) (75,410) – –
(379,375) (55,448,316) (49,838) (7,723,010)
Redeemable participating shares in issue at end of financial period 2,191,581 1,634,448
30 September 2019 30 September 2018
Lazard European Equity Fund SharesValue of Share
Transactions SharesValue of Share
Transactions
EUR EUR
Redeemable participating shares in issue at beginning of financial period 14,048,006 15,084,019
Redeemable participating shares issued during the financial period
- A Acc EUR 93,270 259,893 9,922 28,501
- B Dist EUR 2,676 7,727 3,049 9,211
- C Acc GBP 1,383 4,535 4,201 13,426
- C Dist GBP 366 1,135 1,855 5,630
- A Acc USD 87,302 108,841 574,539 704,174
- A Dist EUR – – 32,635 33,000
- A Dist USD – – 15,000 12,599
- BP Acc USD 50 40 15,000 12,599
- BP Dist USD 108 89 15,000 12,600
- M Acc USD 1,657 1,497,059 – –
186,812 1,879,319 671,201 831,740
5. Capital and Reserves (continued)
Redeemable Participating Shares (continued)

LA
ZA
RD
GL
OB
AL
AC
TIV
E F
UN
DS
PL
C
68Lazard Global Active Funds plc Financial period ended 30 September 2019
Notes to the Financial Statements (Unaudited) (continued)
Redeemable participating shares redeemed during the financial period
- B Dist EUR (580,485) (1,676,357) (661,424) (1,941,975)
- C Acc GBP (4,648) (15,072) (4,608) (15,042)
- C Dist GBP – – (45,000) (138,422)
- A Acc USD (870,670) (1,101,697) (146,862) (184,579)
- A Dist EUR (101,024) (102,863) (29,662) (29,760)
- BP Acc USD (50) (40) – –
- BP Dist USD (108) (87) – –
- M Acc USD (182) (164,819) – –
(1,557,167) (3,060,935) (887,556) (2,309,778)
Redeemable participating shares in issue at end of financial period 12,677,651 14,867,664
30 September 2019 30 September 2018
Lazard Pan European Equity Fund* SharesValue of Share
Transactions SharesValue of Share
Transactions
EUR EUR
Redeemable participating shares in issue at beginning of financial period 2,125,695 2,266,056
Redeemable participating shares issued during the financial period
- B Dist EUR 148,742 236,621 2,622 4,128
- A Acc USD 15,000 13,475 822,072 769,901
- C Dist EUR 896 862 1,256 1,210
- A Dist USD 31 25 15,000 12,956
- BP Acc USD – – 15,000 12,955
- BP Dist USD – – 15,000 12,955
- M Acc USD 1,131 1,023,297 – –
165,800 1,274,280 870,950 814,105
Redeemable participating shares redeemed during the financial period
- B Dist EUR (10,734) (16,369) (53,558) (88,103)
- A Acc USD (915,199) (861,741) (612,546) (580,385)
- M Acc USD (18) (16,969) – –
(925,951) (895,079) (666,104) (668,488)
Redeemable participating shares in issue at end of financial period 1,365,544 2,470,902
* Fund fully redeemed on 25 November 2019.
30 September 2019 30 September 2018
Lazard Pan-European Small Cap Fund SharesValue of Share
Transactions SharesValue of Share
Transactions
EUR EUR
Redeemable participating shares in issue at beginning of financial period 627,467 941,548
Redeemable participating shares issued during the financial period
- AP Dist EUR 271 31,129 270 34,377
- AP Acc EUR 318 36,200 860 104,279
- B Acc EUR 4,064 460,867 4,726 582,648
- A Acc EUR 31,737 3,274,686 – –
36,390 3,802,882 5,856 721,304
Redeemable participating shares redeemed during the financial period
- AP Dist EUR (70,400) (8,075,573) – –
- AP Acc EUR (214,399) (23,851,673) (135,348) (16,433,923)
- B Acc EUR (12,241) (1,384,680) (44,205) (5,434,950)
- C Acc GBP – – (184,174) (24,581,056)
(297,040) (33,311,926) (363,727) (46,449,929)
Redeemable participating shares in issue at end of financial period 366,817 583,677
5. Capital and Reserves (continued)
Redeemable Participating Shares (continued)
30 September 2019 30 September 2018
Lazard European Equity Fund (continued) SharesValue of Share
Transactions SharesValue of Share
Transactions
EUR EUR
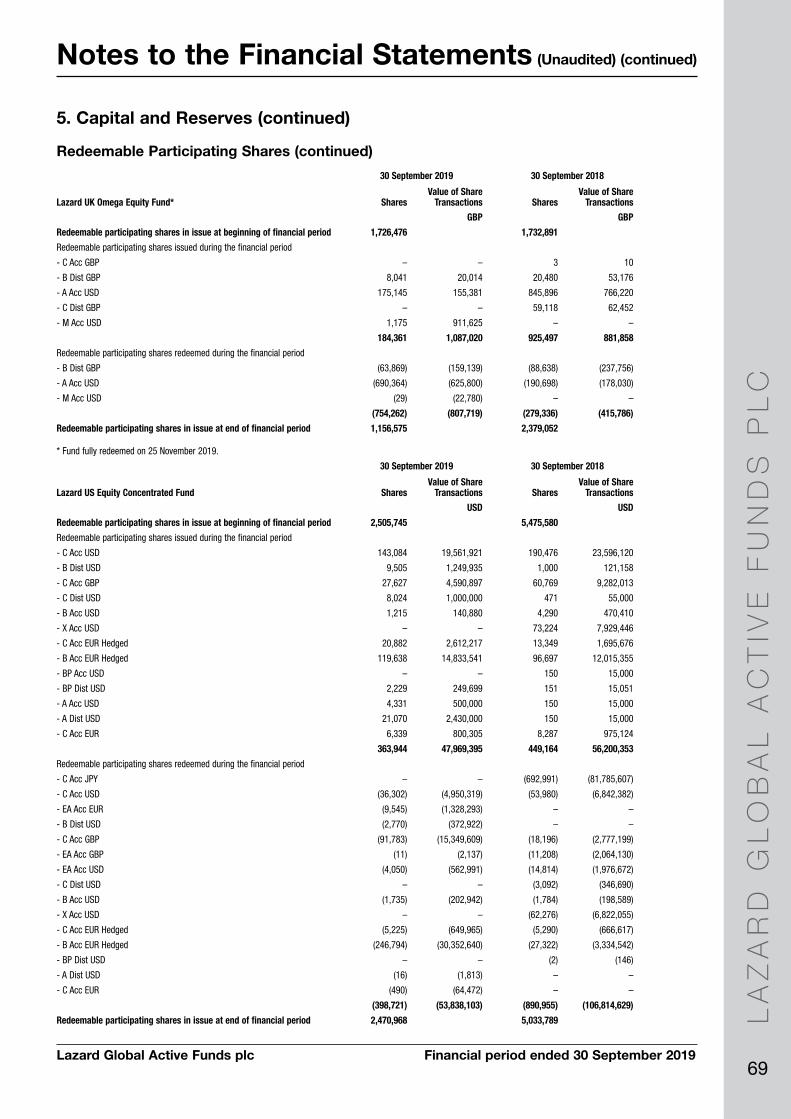
LA
ZA
RD
GL
OB
AL
AC
TIV
E F
UN
DS
PL
C
69Lazard Global Active Funds plc Financial period ended 30 September 2019
Notes to the Financial Statements (Unaudited) (continued)
30 September 2019 30 September 2018
Lazard UK Omega Equity Fund* SharesValue of Share
Transactions SharesValue of Share
Transactions
GBP GBP
Redeemable participating shares in issue at beginning of financial period 1,726,476 1,732,891
Redeemable participating shares issued during the financial period
- C Acc GBP – – 3 10
- B Dist GBP 8,041 20,014 20,480 53,176
- A Acc USD 175,145 155,381 845,896 766,220
- C Dist GBP – – 59,118 62,452
- M Acc USD 1,175 911,625 – –
184,361 1,087,020 925,497 881,858
Redeemable participating shares redeemed during the financial period
- B Dist GBP (63,869) (159,139) (88,638) (237,756)
- A Acc USD (690,364) (625,800) (190,698) (178,030)
- M Acc USD (29) (22,780) – –
(754,262) (807,719) (279,336) (415,786)
Redeemable participating shares in issue at end of financial period 1,156,575 2,379,052
* Fund fully redeemed on 25 November 2019.
30 September 2019 30 September 2018
Lazard US Equity Concentrated Fund SharesValue of Share
Transactions SharesValue of Share
Transactions
USD USD
Redeemable participating shares in issue at beginning of financial period 2,505,745 5,475,580
Redeemable participating shares issued during the financial period
- C Acc USD 143,084 19,561,921 190,476 23,596,120
- B Dist USD 9,505 1,249,935 1,000 121,158
- C Acc GBP 27,627 4,590,897 60,769 9,282,013
- C Dist USD 8,024 1,000,000 471 55,000
- B Acc USD 1,215 140,880 4,290 470,410
- X Acc USD – – 73,224 7,929,446
- C Acc EUR Hedged 20,882 2,612,217 13,349 1,695,676
- B Acc EUR Hedged 119,638 14,833,541 96,697 12,015,355
- BP Acc USD – – 150 15,000
- BP Dist USD 2,229 249,699 151 15,051
- A Acc USD 4,331 500,000 150 15,000
- A Dist USD 21,070 2,430,000 150 15,000
- C Acc EUR 6,339 800,305 8,287 975,124
363,944 47,969,395 449,164 56,200,353
Redeemable participating shares redeemed during the financial period
- C Acc JPY – – (692,991) (81,785,607)
- C Acc USD (36,302) (4,950,319) (53,980) (6,842,382)
- EA Acc EUR (9,545) (1,328,293) – –
- B Dist USD (2,770) (372,922) – –
- C Acc GBP (91,783) (15,349,609) (18,196) (2,777,199)
- EA Acc GBP (11) (2,137) (11,208) (2,064,130)
- EA Acc USD (4,050) (562,991) (14,814) (1,976,672)
- C Dist USD – – (3,092) (346,690)
- B Acc USD (1,735) (202,942) (1,784) (198,589)
- X Acc USD – – (62,276) (6,822,055)
- C Acc EUR Hedged (5,225) (649,965) (5,290) (666,617)
- B Acc EUR Hedged (246,794) (30,352,640) (27,322) (3,334,542)
- BP Dist USD – – (2) (146)
- A Dist USD (16) (1,813) – –
- C Acc EUR (490) (64,472) – –
(398,721) (53,838,103) (890,955) (106,814,629)
Redeemable participating shares in issue at end of financial period 2,470,968 5,033,789
5. Capital and Reserves (continued)
Redeemable Participating Shares (continued)

LA
ZA
RD
GL
OB
AL
AC
TIV
E F
UN
DS
PL
C
70Lazard Global Active Funds plc Financial period ended 30 September 2019
Notes to the Financial Statements (Unaudited) (continued)
30 September 2019 30 September 2018
Lazard Japanese Strategic Equity Fund SharesValue of Share
Transactions SharesValue of Share
Transactions
JPY JPY
Redeemable participating shares in issue at beginning of financial period 19,473,606 18,976,645
Redeemable participating shares issued during the financial period
- A Acc JPY 30,742 3,786,385 425,627 62,390,667
- A Acc USD Hedged 1,145 13,574,037 11,321 144,009,714
- A Acc USD – – 150 1,645,351
- A Dist USD 1 11,136 150 1,645,350
- BP Acc USD – – 150 1,645,350
- BP Dist USD 1 9,136 150 1,645,350
- A Dist USD Hedged 1 10,992 150 1,645,351
- BP Acc USD Hedged – – 150 1,645,351
- BP Dist USD Hedged – – 150 1,645,351
- M Acc USD 1,654 184,544,426 – –
33,544 201,936,112 437,998 217,917,835
Redeemable participating shares redeemed during the financial period
- A Acc JPY (980,938) (119,324,570) – –
- C Dist GBP Hedged (8) (137,071) (154) (3,555,667)
- A Acc USD Hedged (12,571) (149,690,069) (3,930) (49,059,727)
- M Acc USD (199) (21,188,715) – –
(993,716) (290,340,425) (4,084) (52,615,394)
Redeemable participating shares in issue at end of financial period 18,513,434 19,410,559
30 September 2019 30 September 2018
Lazard Emerging World Fund SharesValue of Share
Transactions SharesValue of Share
Transactions
USD USD
Redeemable participating shares in issue at beginning of financial period 841,921 851,156
Redeemable participating shares issued during the financial period
- A Acc USD 641 20,000 – –
- B Dist USD 984 28,406 204 6,188
- C Dist USD 5,715 5,535 – –
7,340 53,941 204 6,188
Redeemable participating shares redeemed during the financial period
- A Acc USD (8,654) (263,719) – –
- B Dist USD (1,425) (41,108) (4,747) (137,998)
(10,079) (304,827) (4,747) (137,998)
Redeemable participating shares in issue at end of financial period 839,182 846,613
30 September 2019 30 September 2018
Lazard Emerging Markets Equity Fund SharesValue of Share
Transactions SharesValue of Share
Transactions
USD USD
Redeemable participating shares in issue at beginning of financial period 826,784,749 869,622,508
Redeemable participating shares issued during the financial period
- A Dist EUR 45,614 5,716,409 51,038 6,383,145
- A Acc USD 2,952,503 2,852,241 63,370,356 67,170,521
- A Acc GBP 1,493 227,049 9,985 1,647,993
- S Acc GBP 95,745 162,723 1,066,083 1,820,358
- S Dist GBP 1,315,317 2,074,973 4,361,377 7,468,139
- A Dist USD 105,370 11,768,435 84,609 10,212,843
- S Acc USD 11,410,763 11,828,506 3,631,288 4,203,306
- S Dist USD 1,548,140 1,544,438 6,484,384 6,814,333
- B Acc USD 37,797,342 34,522,107 62,209,691 59,793,897
- A Acc EUR 2,782,015 3,120,077 35,973,884 42,198,938
5. Capital and Reserves (continued)
Redeemable Participating Shares (continued)
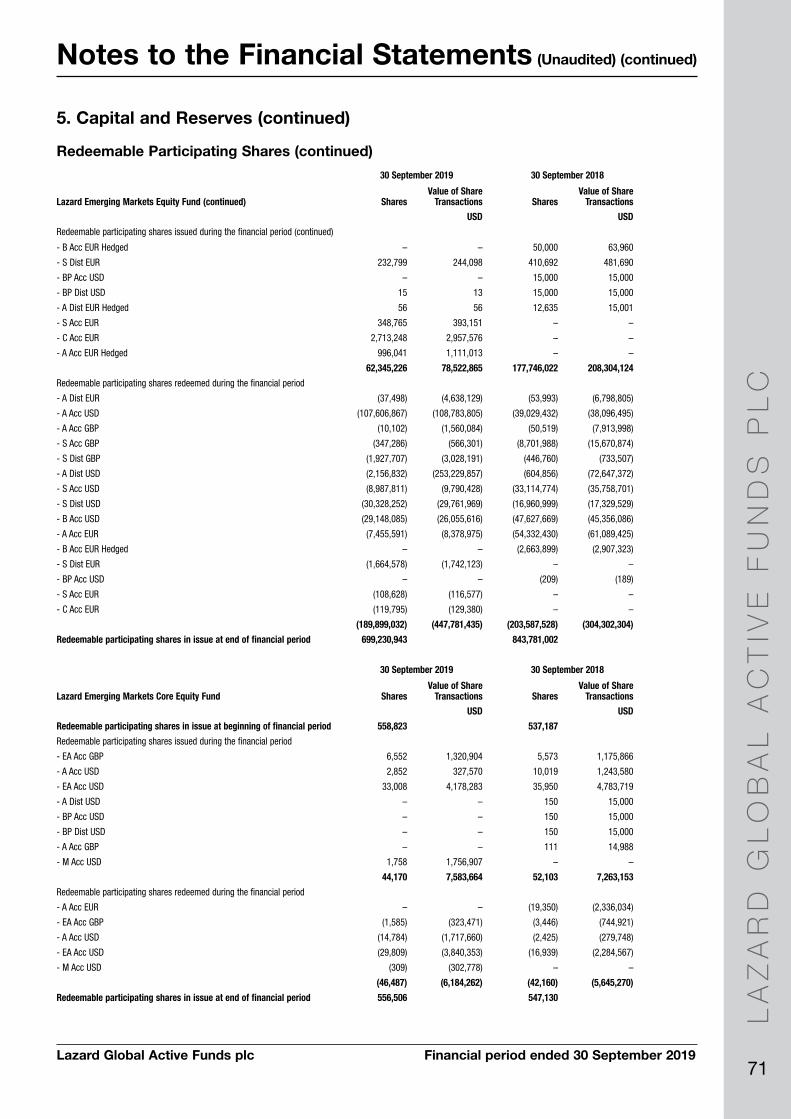
LA
ZA
RD
GL
OB
AL
AC
TIV
E F
UN
DS
PL
C
71Lazard Global Active Funds plc Financial period ended 30 September 2019
Notes to the Financial Statements (Unaudited) (continued)
- B Acc EUR Hedged – – 50,000 63,960
- S Dist EUR 232,799 244,098 410,692 481,690
- BP Acc USD – – 15,000 15,000
- BP Dist USD 15 13 15,000 15,000
- A Dist EUR Hedged 56 56 12,635 15,001
- S Acc EUR 348,765 393,151 – –
- C Acc EUR 2,713,248 2,957,576 – –
- A Acc EUR Hedged 996,041 1,111,013 – –
62,345,226 78,522,865 177,746,022 208,304,124
Redeemable participating shares redeemed during the financial period
- A Dist EUR (37,498) (4,638,129) (53,993) (6,798,805)
- A Acc USD (107,606,867) (108,783,805) (39,029,432) (38,096,495)
- A Acc GBP (10,102) (1,560,084) (50,519) (7,913,998)
- S Acc GBP (347,286) (566,301) (8,701,988) (15,670,874)
- S Dist GBP (1,927,707) (3,028,191) (446,760) (733,507)
- A Dist USD (2,156,832) (253,229,857) (604,856) (72,647,372)
- S Acc USD (8,987,811) (9,790,428) (33,114,774) (35,758,701)
- S Dist USD (30,328,252) (29,761,969) (16,960,999) (17,329,529)
- B Acc USD (29,148,085) (26,055,616) (47,627,669) (45,356,086)
- A Acc EUR (7,455,591) (8,378,975) (54,332,430) (61,089,425)
- B Acc EUR Hedged – – (2,663,899) (2,907,323)
- S Dist EUR (1,664,578) (1,742,123) – –
- BP Acc USD – – (209) (189)
- S Acc EUR (108,628) (116,577) – –
- C Acc EUR (119,795) (129,380) – –
(189,899,032) (447,781,435) (203,587,528) (304,302,304)
Redeemable participating shares in issue at end of financial period 699,230,943 843,781,002
30 September 2019 30 September 2018
Lazard Emerging Markets Core Equity Fund SharesValue of Share
Transactions SharesValue of Share
Transactions
USD USD
Redeemable participating shares in issue at beginning of financial period 558,823 537,187
Redeemable participating shares issued during the financial period
- EA Acc GBP 6,552 1,320,904 5,573 1,175,866
- A Acc USD 2,852 327,570 10,019 1,243,580
- EA Acc USD 33,008 4,178,283 35,950 4,783,719
- A Dist USD – – 150 15,000
- BP Acc USD – – 150 15,000
- BP Dist USD – – 150 15,000
- A Acc GBP – – 111 14,988
- M Acc USD 1,758 1,756,907 – –
44,170 7,583,664 52,103 7,263,153
Redeemable participating shares redeemed during the financial period
- A Acc EUR – – (19,350) (2,336,034)
- EA Acc GBP (1,585) (323,471) (3,446) (744,921)
- A Acc USD (14,784) (1,717,660) (2,425) (279,748)
- EA Acc USD (29,809) (3,840,353) (16,939) (2,284,567)
- M Acc USD (309) (302,778) – –
(46,487) (6,184,262) (42,160) (5,645,270)
Redeemable participating shares in issue at end of financial period 556,506 547,130
5. Capital and Reserves (continued)
Redeemable Participating Shares (continued)
30 September 2019 30 September 2018
Lazard Emerging Markets Equity Fund (continued) SharesValue of Share
Transactions SharesValue of Share
Transactions
USD USD
Redeemable participating shares issued during the financial period (continued)
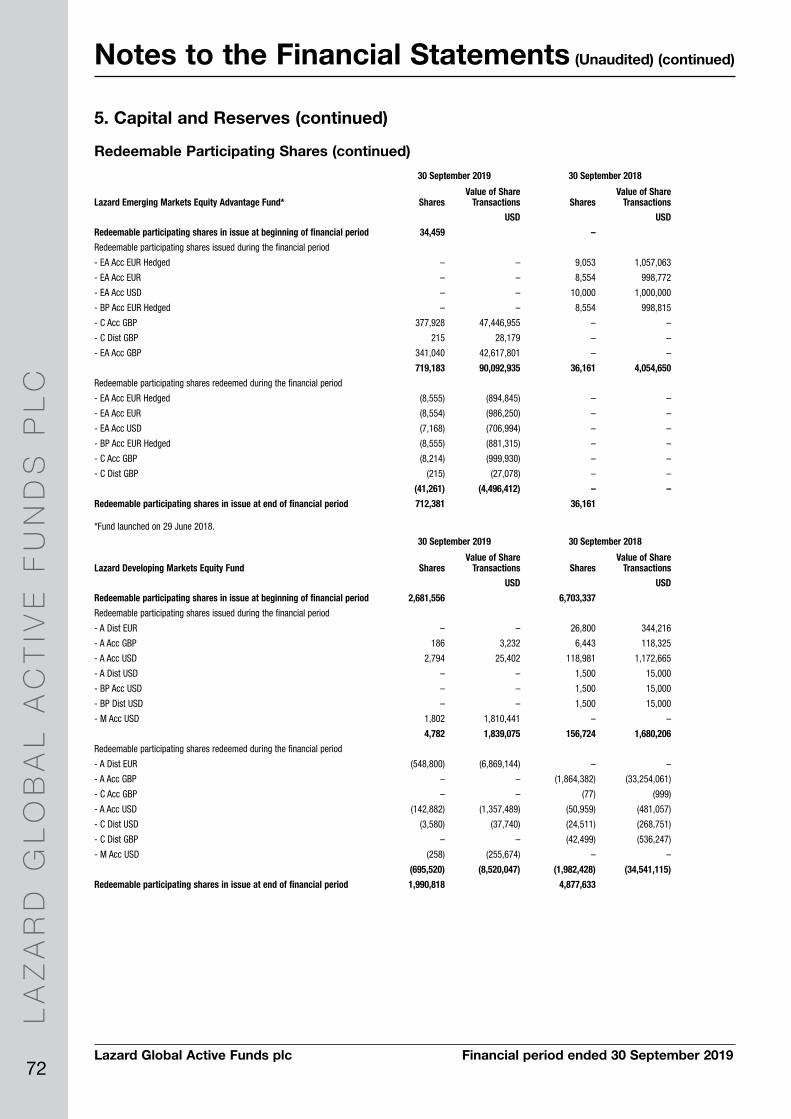
LA
ZA
RD
GL
OB
AL
AC
TIV
E F
UN
DS
PL
C
72Lazard Global Active Funds plc Financial period ended 30 September 2019
Notes to the Financial Statements (Unaudited) (continued)
30 September 2019 30 September 2018
Lazard Emerging Markets Equity Advantage Fund* SharesValue of Share
Transactions SharesValue of Share
Transactions
USD USD
Redeemable participating shares in issue at beginning of financial period 34,459 –
Redeemable participating shares issued during the financial period
- EA Acc EUR Hedged – – 9,053 1,057,063
- EA Acc EUR – – 8,554 998,772
- EA Acc USD – – 10,000 1,000,000
- BP Acc EUR Hedged – – 8,554 998,815
- C Acc GBP 377,928 47,446,955 – –
- C Dist GBP 215 28,179 – –
- EA Acc GBP 341,040 42,617,801 – –
719,183 90,092,935 36,161 4,054,650
Redeemable participating shares redeemed during the financial period
- EA Acc EUR Hedged (8,555) (894,845) – –
- EA Acc EUR (8,554) (986,250) – –
- EA Acc USD (7,168) (706,994) – –
- BP Acc EUR Hedged (8,555) (881,315) – –
- C Acc GBP (8,214) (999,930) – –
- C Dist GBP (215) (27,078) – –
(41,261) (4,496,412) – –
Redeemable participating shares in issue at end of financial period 712,381 36,161
*Fund launched on 29 June 2018.
30 September 2019 30 September 2018
Lazard Developing Markets Equity Fund SharesValue of Share
Transactions SharesValue of Share
Transactions
USD USD
Redeemable participating shares in issue at beginning of financial period 2,681,556 6,703,337
Redeemable participating shares issued during the financial period
- A Dist EUR – – 26,800 344,216
- A Acc GBP 186 3,232 6,443 118,325
- A Acc USD 2,794 25,402 118,981 1,172,665
- A Dist USD – – 1,500 15,000
- BP Acc USD – – 1,500 15,000
- BP Dist USD – – 1,500 15,000
- M Acc USD 1,802 1,810,441 – –
4,782 1,839,075 156,724 1,680,206
Redeemable participating shares redeemed during the financial period
- A Dist EUR (548,800) (6,869,144) – –
- A Acc GBP – – (1,864,382) (33,254,061)
- C Acc GBP – – (77) (999)
- A Acc USD (142,882) (1,357,489) (50,959) (481,057)
- C Dist USD (3,580) (37,740) (24,511) (268,751)
- C Dist GBP – – (42,499) (536,247)
- M Acc USD (258) (255,674) – –
(695,520) (8,520,047) (1,982,428) (34,541,115)
Redeemable participating shares in issue at end of financial period 1,990,818 4,877,633
5. Capital and Reserves (continued)
Redeemable Participating Shares (continued)

LA
ZA
RD
GL
OB
AL
AC
TIV
E F
UN
DS
PL
C
73Lazard Global Active Funds plc Financial period ended 30 September 2019
Notes to the Financial Statements (Unaudited) (continued)
30 September 2019 30 September 2018
Lazard MENA Fund SharesValue of Share
Transactions SharesValue of Share
Transactions
USD USD
Redeemable participating shares in issue at beginning of financial period 167,047 40,670
Redeemable participating shares issued during the financial period
- A Acc USD 443 78,019 138,817 24,329,979
- EA Acc USD – – 100 10,606
- EA Dist EUR Hedged 14,403 1,620,942 – –
14,846 1,698,961 138,917 24,340,585
Redeemable participating shares redeemed during the financial period
- A Acc USD (519) (88,917) (29,997) (5,239,531)
- EA Dist EUR Hedged (10,936) (1,180,142) – –
(11,455) (1,269,059) (29,997) (5,239,531)
Redeemable participating shares in issue at end of financial period 170,438 149,590
30 September 2019 30 September 2018
Lazard Global Fixed Income Fund SharesValue of Share
Transactions SharesValue of Share
Transactions
USD USD
Redeemable participating shares in issue at beginning of financial period 177,840 160,636
Redeemable participating shares issued during the financial period
- A Acc EUR Hedged 16,841 1,695,452 – –
- A Acc USD 884 121,664 44,232 6,159,074
- B Dist USD 5 636 5 638
- A Dist USD 1 148 116 15,000
- BP Acc USD – – 115 15,000
- BP Dist USD 1 92 115 15,000
- B Acc EUR Hedged 399 44,828 – –
- M Acc USD 12,865 12,871,882 – –
- A Acc EUR 18,820 2,102,919 – –
49,816 16,837,621 44,583 6,204,712
Redeemable participating shares redeemed during the financial period
- A Acc USD (51,048) (7,028,338) (2,575) (349,455)
- B Dist USD – – (259) (30,779)
- M Acc USD (635) (659,093) – –
(51,683) (7,687,431) (2,834) (380,234)
Redeemable participating shares in issue at end of financial period 175,973 202,385
30 September 2019 30 September 2018
Lazard Sterling High Quality Bond Fund* SharesValue of Share
Transactions SharesValue of Share
Transactions
GBP GBP
Redeemable participating shares in issue at beginning of financial period 13,145 15,103
Redeemable participating shares issued during the financial period
- A Dist GBP 148 20,049 18 2,317
- B Dist GBP 85 11,632 83 10,660
233 31,681 101 12,977
Redeemable participating shares redeemed during the financial period
- A Dist GBP (13) (1,902) (1) (186)
- B Dist GBP (784) (107,503) (1,559) (201,231)
(797) (109,405) (1,560) (201,417)
Redeemable participating shares in issue at end of financial period 12,581 13,644
* Fund fully redeemed on 14 October 2019.
See Note 14 for information on the launch and termination dates during the financial period of the above share classes.
5. Capital and Reserves (continued)
Redeemable Participating Shares (continued)
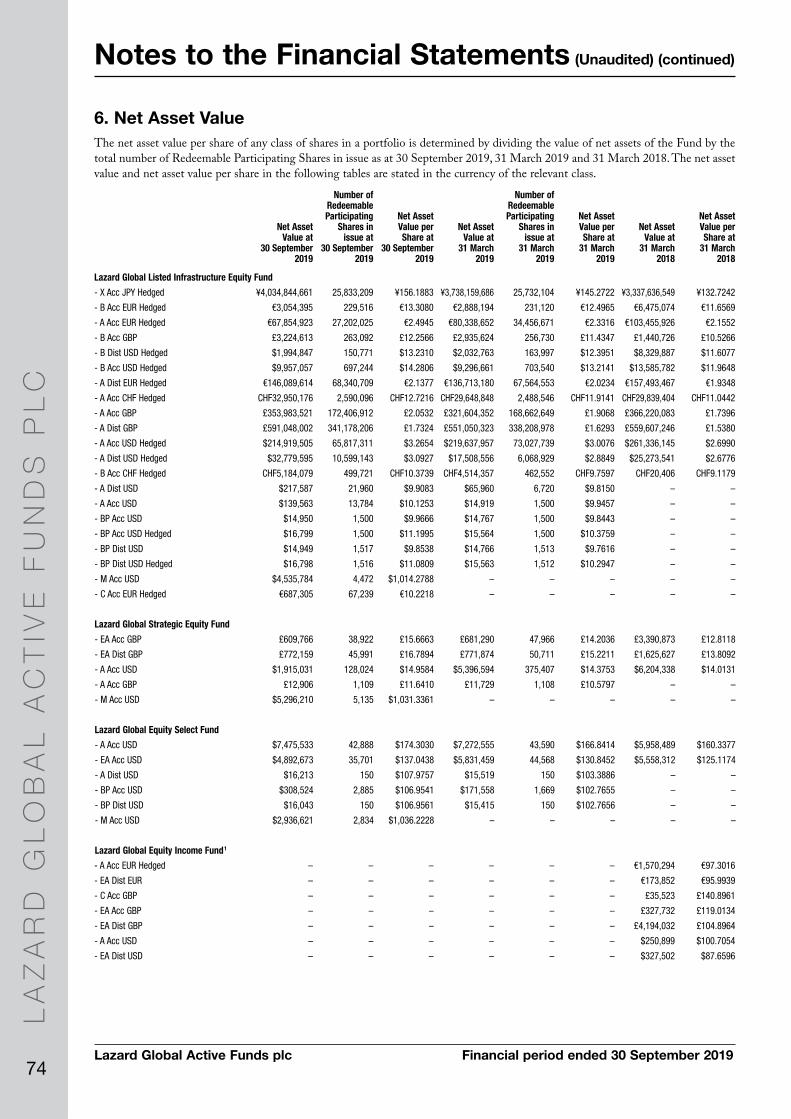
LA
ZA
RD
GL
OB
AL
AC
TIV
E F
UN
DS
PL
C
74Lazard Global Active Funds plc Financial period ended 30 September 2019
Notes to the Financial Statements (Unaudited) (continued)
6. Net Asset ValueThe net asset value per share of any class of shares in a portfolio is determined by dividing the value of net assets of the Fund by the total number of Redeemable Participating Shares in issue as at 30 September 2019, 31 March 2019 and 31 March 2018. The net asset value and net asset value per share in the following tables are stated in the currency of the relevant class.
Net Asset Value at
30 September 2019
Number of Redeemable Participating
Shares in issue at
30 September 2019
Net Asset Value per Share at
30 September 2019
Net Asset Value at
31 March 2019
Number of Redeemable Participating
Shares in issue at
31 March 2019
Net Asset Value per Share at
31 March 2019
Net Asset Value at
31 March 2018
Net Asset Value per Share at
31 March 2018
Lazard Global Listed Infrastructure Equity Fund
- X Acc JPY Hedged ¥4,034,844,661 25,833,209 ¥156.1883 ¥3,738,159,686 25,732,104 ¥145.2722 ¥3,337,636,549 ¥132.7242
- B Acc EUR Hedged €3,054,395 229,516 €13.3080 €2,888,194 231,120 €12.4965 €6,475,074 €11.6569
- A Acc EUR Hedged €67,854,923 27,202,025 €2.4945 €80,338,652 34,456,671 €2.3316 €103,455,926 €2.1552
- B Acc GBP £3,224,613 263,092 £12.2566 £2,935,624 256,730 £11.4347 £1,440,726 £10.5266
- B Dist USD Hedged $1,994,847 150,771 $13.2310 $2,032,763 163,997 $12.3951 $8,329,887 $11.6077
- B Acc USD Hedged $9,957,057 697,244 $14.2806 $9,296,661 703,540 $13.2141 $13,585,782 $11.9648
- A Dist EUR Hedged €146,089,614 68,340,709 €2.1377 €136,713,180 67,564,553 €2.0234 €157,493,467 €1.9348
- A Acc CHF Hedged CHF32,950,176 2,590,096 CHF12.7216 CHF29,648,848 2,488,546 CHF11.9141 CHF29,839,404 CHF11.0442
- A Acc GBP £353,983,521 172,406,912 £2.0532 £321,604,352 168,662,649 £1.9068 £366,220,083 £1.7396
- A Dist GBP £591,048,002 341,178,206 £1.7324 £551,050,323 338,208,978 £1.6293 £559,607,246 £1.5380
- A Acc USD Hedged $214,919,505 65,817,311 $3.2654 $219,637,957 73,027,739 $3.0076 $261,336,145 $2.6990
- A Dist USD Hedged $32,779,595 10,599,143 $3.0927 $17,508,556 6,068,929 $2.8849 $25,273,541 $2.6776
- B Acc CHF Hedged CHF5,184,079 499,721 CHF10.3739 CHF4,514,357 462,552 CHF9.7597 CHF20,406 CHF9.1179
- A Dist USD $217,587 21,960 $9.9083 $65,960 6,720 $9.8150 – –
- A Acc USD $139,563 13,784 $10.1253 $14,919 1,500 $9.9457 – –
- BP Acc USD $14,950 1,500 $9.9666 $14,767 1,500 $9.8443 – –
- BP Acc USD Hedged $16,799 1,500 $11.1995 $15,564 1,500 $10.3759 – –
- BP Dist USD $14,949 1,517 $9.8538 $14,766 1,513 $9.7616 – –
- BP Dist USD Hedged $16,798 1,516 $11.0809 $15,563 1,512 $10.2947 – –
- M Acc USD $4,535,784 4,472 $1,014.2788 – – – – –
- C Acc EUR Hedged €687,305 67,239 €10.2218 – – – – –
Lazard Global Strategic Equity Fund
- EA Acc GBP £609,766 38,922 £15.6663 £681,290 47,966 £14.2036 £3,390,873 £12.8118
- EA Dist GBP £772,159 45,991 £16.7894 £771,874 50,711 £15.2211 £1,625,627 £13.8092
- A Acc USD $1,915,031 128,024 $14.9584 $5,396,594 375,407 $14.3753 $6,204,338 $14.0131
- A Acc GBP £12,906 1,109 £11.6410 £11,729 1,108 £10.5797 – –
- M Acc USD $5,296,210 5,135 $1,031.3361 – – – – –
Lazard Global Equity Select Fund
- A Acc USD $7,475,533 42,888 $174.3030 $7,272,555 43,590 $166.8414 $5,958,489 $160.3377
- EA Acc USD $4,892,673 35,701 $137.0438 $5,831,459 44,568 $130.8452 $5,558,312 $125.1174
- A Dist USD $16,213 150 $107.9757 $15,519 150 $103.3886 – –
- BP Acc USD $308,524 2,885 $106.9541 $171,558 1,669 $102.7655 – –
- BP Dist USD $16,043 150 $106.9561 $15,415 150 $102.7656 – –
- M Acc USD $2,936,621 2,834 $1,036.2228 – – – – –
Lazard Global Equity Income Fund 1
- A Acc EUR Hedged – – – – – – €1,570,294 €97.3016
- EA Dist EUR – – – – – – €173,852 €95.9939
- C Acc GBP – – – – – – £35,523 £140.8961
- EA Acc GBP – – – – – – £327,732 £119.0134
- EA Dist GBP – – – – – – £4,194,032 £104.8964
- A Acc USD – – – – – – $250,899 $100.7054
- EA Dist USD – – – – – – $327,502 $87.6596

LA
ZA
RD
GL
OB
AL
AC
TIV
E F
UN
DS
PL
C
75Lazard Global Active Funds plc Financial period ended 30 September 2019
Notes to the Financial Statements (Unaudited) (continued)
Lazard Global Managed Volatility Fund
- A Acc EUR €26,942,845 197,346 €136.5257 €26,431,027 206,351 €128.0877 €1,954,158 €111.2245
- A Dist EUR €12,721,119 97,960 €129.8603 €11,986,642 97,960 €122.3626 €10,532,671 €107.5201
- A Acc GBP Hedged – – – – – – £12,115,809 £116.3447
- A Acc USD $135,697,212 649,961 $208.7777 $137,460,957 681,418 $201.7279 $140,778,148 $191.7508
- A Dist USD – – – $16,287,345 131,626 $123.7397 $13,105,969 $119.1034
- A Acc GBP £77,310 650 £118.9226 £57,654 530 £108.6825 – –
- C Acc EUR Hedged €27,542,388 254,727 €108.1251 €31,710,700 298,727 €106.1528 – –
- M Acc USD $3,735,265 3,616 $1,032.9157 – – – – –
Lazard Thematic Global Fund
- A Dist GBP £11,025,907 55,361 £199.1627 £11,652,217 65,754 £177.2084 £12,882,749 £156.2113
- A Acc USD $3,551,732 13,972 $254.1958 $2,310,321 9,662 $239.1290 $2,386,794 $226.3748
- A Dist USD $42,576,550 173,111 $245.9502 $39,033,126 168,703 $231.3721 $50,831,072 $219.5364
- M Acc USD $4,198,044 3,995 $1,050.9413 – – – – –
Lazard Global Equity Franchise Fund
- A Acc GBP £7,564,244 41,369 £182.8500 £6,777,649 41,594 £162.9466 £6,857,998 £148.6522
- A Acc USD $22,476,849 150,366 $149.4806 $35,976,026 255,442 $140.8384 $365,764 $138.2526
- EA Acc GBP £28,461,459 213,082 £133.5705 £24,366,845 205,084 £118.8138 £15,499,825 £107.9833
- EA Acc USD $158,913,662 1,089,993 $145.7932 $136,143,256 992,871 $137.1208 $130,077,041 $134.1329
- EA Dist GBP £42,324,240 360,856 £117.2885 £32,582,197 309,351 £105.3245 £22,368,486 £97.6853
- B Acc GBP £3,726,534 30,724 £121.2891 £3,906,802 36,027 £108.4402 £2,364,790 £99.5649
- C Acc GBP £23,911,681 194,224 £123.1141 £21,725,697 198,134 £109.6517 £8,875,986 £99.9346
- C Dist GBP £2,438,573 20,415 £119.4502 £1,575,404 14,668 £107.4013 £10,008 £100.0810
- EA Dist EUR €559,494 4,659 €120.0904 €1,432,760 12,938 €110.7444 €289,022 €101.0699
- A Acc EUR Hedged €3,540,007 32,978 €107.3441 €2,825,076 27,496 €102.7448 – –
- B Acc EUR Hedged €1,044 10 €99.7898 €33,808 353 €95.8326 – –
- A Dist EUR Hedged €150,405 1,500 €100.2701 €144,352 1,500 €96.2349 – –
- C Acc EUR €5,258,166 48,836 €107.6705 – – – – –
- A Acc EUR €53,826 500 €107.6521 – – – – –
- M Acc USD $2,146,105 2,069 $1,037.2425 – – – – –
Lazard European Equity Fund
- A Acc EUR €1,521,233 521,981 €2.9143 €1,168,845 428,712 €2.7264 €1,152,870 €2.7529
- B Dist EUR €34,103,453 11,402,073 €2.9910 €33,606,171 11,979,882 €2.8052 €37,814,214 €2.8727
- C Acc GBP £18,594 6,312 £2.9458 £25,520 9,577 £2.6646 £27,025 £2.7482
- C Dist GBP £418,353 152,439 £2.7444 £377,796 152,073 £2.4843 £289,916 £2.5921
- A Acc USD $370,485 262,483 $1.4115 $1,421,336 1,045,850 $1.3590 $1,595,649 $1.5043
- A Dist EUR €292,329 285,722 €1.0231 €370,169 386,746 €0.9571 €312,567 €0.9777
- A Dist USD $13,918 15,105 $0.9214 $13,412 15,105 $0.8879 – –
- BP Acc USD $13,773 15,000 $0.9182 $13,323 15,000 $0.8882 – –
- BP Dist USD $13,773 15,061 $0.9145 $13,323 15,061 $0.8846 – –
- M Acc USD $1,498,761 1,475 $1,016.0972 – – – – –
Lazard Pan European Equity Fund
- A Dist EUR – – – – – – €201 €1.1820
- B Dist EUR €1,636,635 1,021,380 €1.6024 €1,333,832 883,371 €1.5099 €1,456,601 €1.5449
- A Acc USD $15,321 15,000 $1.0214 $927,367 915,199 $1.0133 $1,175,162 $1.1249
- C Dist EUR €286,291 283,021 €1.0116 €268,752 282,125 €0.9526 €271,581 €0.9754
- A Dist USD $14,199 15,030 $0.9447 $13,746 15,000 $0.9164 – –
- BP Acc USD $14,064 15,000 $0.9376 $13,667 15,000 $0.9111 – –
- BP Dist USD $14,064 15,000 $0.9376 $13,667 15,000 $0.9111 – –
- M Acc USD $1,127,109 1,113 $1,012.9034 – – – – –
6. Net Asset Value (continued)
Net Asset Value at
30 September 2019
Number of Redeemable Participating
Shares in issue at
30 September 2019
Net Asset Value per Share at
30 September 2019
Net Asset Value at
31 March 2019
Number of Redeemable Participating
Shares in issue at
31 March 2019
Net Asset Value per Share at
31 March 2019
Net Asset Value at
31 March 2018
Net Asset Value per Share at
31 March 2018

LA
ZA
RD
GL
OB
AL
AC
TIV
E F
UN
DS
PL
C
76Lazard Global Active Funds plc Financial period ended 30 September 2019
Notes to the Financial Statements (Unaudited) (continued)
Lazard Pan-European Small Cap Fund
- C Acc EUR €10,196 100 €101.9618 €10,038 100 €100.3782 – –
- AP Dist EUR €22,659,841 195,892 €115.6753 €30,331,538 266,021 €114.0192 €32,303,629 €121.6866
- AP Acc EUR €104,990 944 €111.1853 €23,565,364 215,025 €109.5937 €42,289,316 €115.8353
- B Acc EUR €15,548,967 138,145 €112.5557 €16,274,710 146,321 €111.2259 €14,984,600 €118.1501
- C Acc GBP – – – – – – £20,486,474 £111.2342
- A Acc EUR €3,321,432 31,736 €104.6560 – – – – –
Lazard UK Omega Equity Fund
- C Acc GBP £3,476 1,244 £2.7961 £3,408 1,243 £2.7407 £3,564 £2.7711
- B Dist GBP £1,432,336 578,465 £2.4761 £1,559,279 634,293 £2.4583 £2,062,189 £2.5474
- A Acc USD $417,963 382,259 $1.0934 $1,018,329 897,479 $1.1347 $1,098,181 $1.2392
- C Dist GBP £189,833 193,461 £0.9812 £188,459 193,461 £0.9741 £36,219 £1.0097
- M Acc USD $1,084,092 1,146 $946.0580 – – – – –
Lazard US Equity Concentrated Fund
- C Acc JPY – – – – – – ¥8,313,298,060 ¥11,996.2550
- C Acc USD $179,473,545 1,275,058 $140.7571 $151,262,127 1,168,277 $129.4745 $186,112,929 $120.1355
- EA Acc EUR €11,262,267 81,124 €138.8276 €11,228,382 90,669 €123.8393 €14,614,986 €104.6746
- B Dist USD $5,357,270 39,502 $135.6209 $4,103,235 32,767 $125.2250 $3,955,945 $117.0671
- C Acc GBP £47,264,633 337,945 £139.8591 £48,929,412 402,100 £121.6847 £37,533,502 £104.8947
- EA Acc GBP £9,438,884 56,735 £166.3681 £8,202,080 56,746 £144.5404 £9,187,233 £124.2779
- EA Acc USD $16,970,227 111,456 $152.2590 $16,156,691 115,506 $139.8771 $17,229,415 $129.4637
- C Dist USD $1,893,458 14,686 $128.9306 $791,388 6,662 $118.7923 $970,022 $110.6851
- B Acc USD $2,840,454 23,104 $122.9429 $2,681,705 23,624 $113.5188 $2,400,022 $106.1236
- X Acc USD – – – $13 – $115.3211 $190,748,651 $106.0468
- C Acc EUR Hedged €10,377,999 89,642 €115.7718 €7,995,570 73,985 €108.0703 €6,569,418 €103.5529
- B Acc EUR Hedged €45,689,138 404,632 €112.9153 €56,282,555 531,788 €105.8365 €61,479,427 €102.1912
- BP Acc USD $17,140 150 $114.2656 $15,866 150 $105.7750 – –
- BP Dist USD $271,844 2,379 $114.2564 $15,865 150 $105.7669 $98 $97.1980
- A Acc USD $521,001 4,481 $116.2773 $16,044 150 $106.9575 – –
- A Dist USD $2,456,928 21,205 $115.8649 $16,044 150 $106.7624 – –
- C Acc EUR €1,079,593 8,869 €121.7245 €328,664 3,021 €108.7982 – –
Lazard Japanese Strategic Equity Fund
- A Acc JPY ¥2,408,040,588 18,506,925 ¥130.1157 ¥2,438,095,895 19,457,121 ¥125.3061 ¥2,787,318,721 ¥146.9834
- C Dist GBP Hedged £3,309 24 £137.7452 £4,192 32 £132.2250 £49,117 £155.3915
- A Acc USD Hedged $428,101 3,975 $107.6924 $1,578,087 15,401 $102.4648 $1,507,680 $117.4573
- A Acc USD $13,180 150 $87.8646 $12,393 150 $82.6215 – –
- A Dist USD $13,180 152 $86.7720 $12,393 151 $82.2473 – –
- BP Acc USD $13,015 150 $86.7685 $12,295 150 $81.9638 – –
- BP Dist USD $13,015 151 $86.3755 $12,295 150 $81.8710 – –
- A Dist USD Hedged $13,435 152 $88.5011 $12,774 151 $84.7923 – –
- BP Acc USD Hedged $13,268 150 $88.4512 $12,673 150 $84.4855 – –
- BP Dist USD Hedged $13,268 151 $88.0858 $12,673 150 $84.3961 – –
- M Acc USD $1,509,921 1,454 $1,038.0271 – – – – –
Lazard Emerging World Fund
- C Acc GBP £796 32 £24.3085 £761 33 £23.2622 £755 £23.0514
- A Acc USD $288,847 9,307 $31.0351 $544,520 17,320 $31.4387 $636,189 $33.6119
- B Dist USD $19,286,852 682,231 $28.2703 $19,669,147 682,671 $28.8120 $21,446,114 $31.0282
- C Dist USD $136,980 147,612 $0.9280 $134,151 141,897 $0.9454 $143,066 $1.0145
6. Net Asset Value (continued)
Net Asset Value at
30 September 2019
Number of Redeemable Participating
Shares in issue at
30 September 2019
Net Asset Value per Share at
30 September 2019
Net Asset Value at
31 March 2019
Number of Redeemable Participating
Shares in issue at
31 March 2019
Net Asset Value per Share at
31 March 2019
Net Asset Value at
31 March 2018
Net Asset Value per Share at
31 March 2018
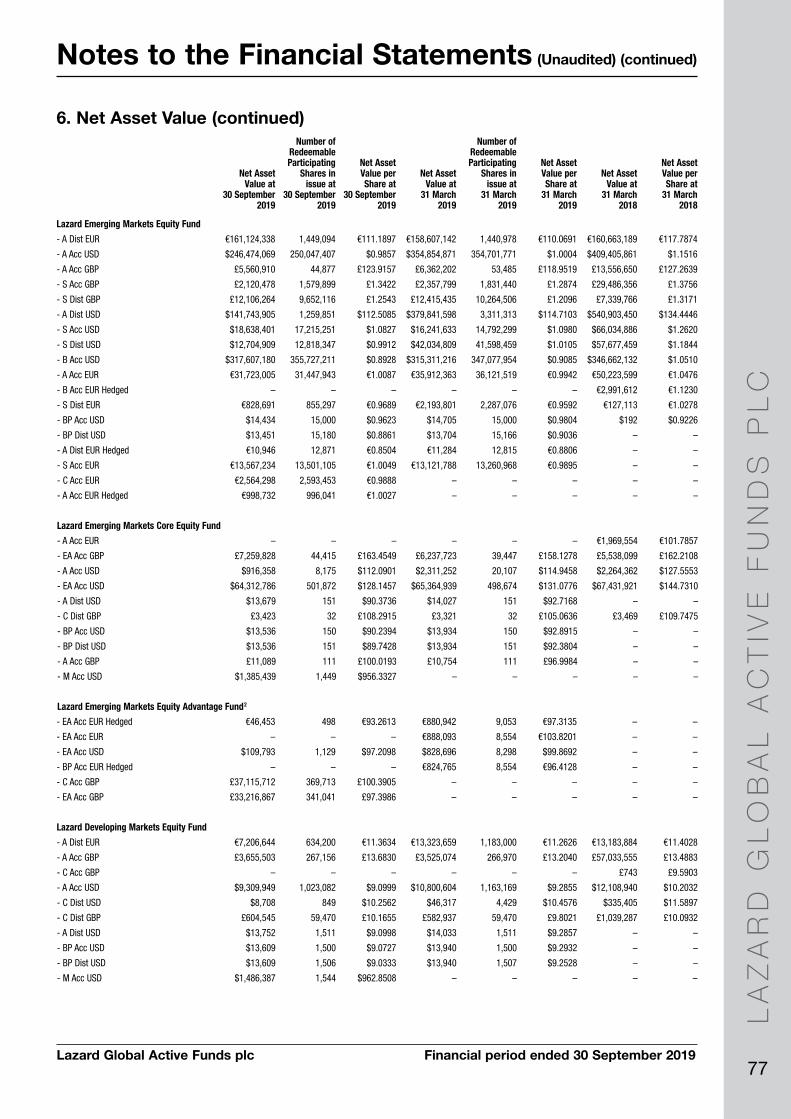
LA
ZA
RD
GL
OB
AL
AC
TIV
E F
UN
DS
PL
C
77Lazard Global Active Funds plc Financial period ended 30 September 2019
Notes to the Financial Statements (Unaudited) (continued)
Lazard Emerging Markets Equity Fund
- A Dist EUR €161,124,338 1,449,094 €111.1897 €158,607,142 1,440,978 €110.0691 €160,663,189 €117.7874
- A Acc USD $246,474,069 250,047,407 $0.9857 $354,854,871 354,701,771 $1.0004 $409,405,861 $1.1516
- A Acc GBP £5,560,910 44,877 £123.9157 £6,362,202 53,485 £118.9519 £13,556,650 £127.2639
- S Acc GBP £2,120,478 1,579,899 £1.3422 £2,357,799 1,831,440 £1.2874 £29,486,356 £1.3756
- S Dist GBP £12,106,264 9,652,116 £1.2543 £12,415,435 10,264,506 £1.2096 £7,339,766 £1.3171
- A Dist USD $141,743,905 1,259,851 $112.5085 $379,841,598 3,311,313 $114.7103 $540,903,450 $134.4446
- S Acc USD $18,638,401 17,215,251 $1.0827 $16,241,633 14,792,299 $1.0980 $66,034,886 $1.2620
- S Dist USD $12,704,909 12,818,347 $0.9912 $42,034,809 41,598,459 $1.0105 $57,677,459 $1.1844
- B Acc USD $317,607,180 355,727,211 $0.8928 $315,311,216 347,077,954 $0.9085 $346,662,132 $1.0510
- A Acc EUR €31,723,005 31,447,943 €1.0087 €35,912,363 36,121,519 €0.9942 €50,223,599 €1.0476
- B Acc EUR Hedged – – – – – – €2,991,612 €1.1230
- S Dist EUR €828,691 855,297 €0.9689 €2,193,801 2,287,076 €0.9592 €127,113 €1.0278
- BP Acc USD $14,434 15,000 $0.9623 $14,705 15,000 $0.9804 $192 $0.9226
- BP Dist USD $13,451 15,180 $0.8861 $13,704 15,166 $0.9036 – –
- A Dist EUR Hedged €10,946 12,871 €0.8504 €11,284 12,815 €0.8806 – –
- S Acc EUR €13,567,234 13,501,105 €1.0049 €13,121,788 13,260,968 €0.9895 – –
- C Acc EUR €2,564,298 2,593,453 €0.9888 – – – – –
- A Acc EUR Hedged €998,732 996,041 €1.0027 – – – – –
Lazard Emerging Markets Core Equity Fund
- A Acc EUR – – – – – – €1,969,554 €101.7857
- EA Acc GBP £7,259,828 44,415 £163.4549 £6,237,723 39,447 £158.1278 £5,538,099 £162.2108
- A Acc USD $916,358 8,175 $112.0901 $2,311,252 20,107 $114.9458 $2,264,362 $127.5553
- EA Acc USD $64,312,786 501,872 $128.1457 $65,364,939 498,674 $131.0776 $67,431,921 $144.7310
- A Dist USD $13,679 151 $90.3736 $14,027 151 $92.7168 – –
- C Dist GBP £3,423 32 £108.2915 £3,321 32 £105.0636 £3,469 £109.7475
- BP Acc USD $13,536 150 $90.2394 $13,934 150 $92.8915 – –
- BP Dist USD $13,536 151 $89.7428 $13,934 151 $92.3804 – –
- A Acc GBP £11,089 111 £100.0193 £10,754 111 £96.9984 – –
- M Acc USD $1,385,439 1,449 $956.3327 – – – – –
Lazard Emerging Markets Equity Advantage Fund 2
- EA Acc EUR Hedged €46,453 498 €93.2613 €880,942 9,053 €97.3135 – –
- EA Acc EUR – – – €888,093 8,554 €103.8201 – –
- EA Acc USD $109,793 1,129 $97.2098 $828,696 8,298 $99.8692 – –
- BP Acc EUR Hedged – – – €824,765 8,554 €96.4128 – –
- C Acc GBP £37,115,712 369,713 £100.3905 – – – – –
- EA Acc GBP £33,216,867 341,041 £97.3986 – – – – –
Lazard Developing Markets Equity Fund
- A Dist EUR €7,206,644 634,200 €11.3634 €13,323,659 1,183,000 €11.2626 €13,183,884 €11.4028
- A Acc GBP £3,655,503 267,156 £13.6830 £3,525,074 266,970 £13.2040 £57,033,555 £13.4883
- C Acc GBP – – – – – – £743 £9.5903
- A Acc USD $9,309,949 1,023,082 $9.0999 $10,800,604 1,163,169 $9.2855 $12,108,940 $10.2032
- C Dist USD $8,708 849 $10.2562 $46,317 4,429 $10.4576 $335,405 $11.5897
- C Dist GBP £604,545 59,470 £10.1655 £582,937 59,470 £9.8021 £1,039,287 £10.0932
- A Dist USD $13,752 1,511 $9.0998 $14,033 1,511 $9.2857 – –
- BP Acc USD $13,609 1,500 $9.0727 $13,940 1,500 $9.2932 – –
- BP Dist USD $13,609 1,506 $9.0333 $13,940 1,507 $9.2528 – –
- M Acc USD $1,486,387 1,544 $962.8508 – – – – –
6. Net Asset Value (continued)
Net Asset Value at
30 September 2019
Number of Redeemable Participating
Shares in issue at
30 September 2019
Net Asset Value per Share at
30 September 2019
Net Asset Value at
31 March 2019
Number of Redeemable Participating
Shares in issue at
31 March 2019
Net Asset Value per Share at
31 March 2019
Net Asset Value at
31 March 2018
Net Asset Value per Share at
31 March 2018
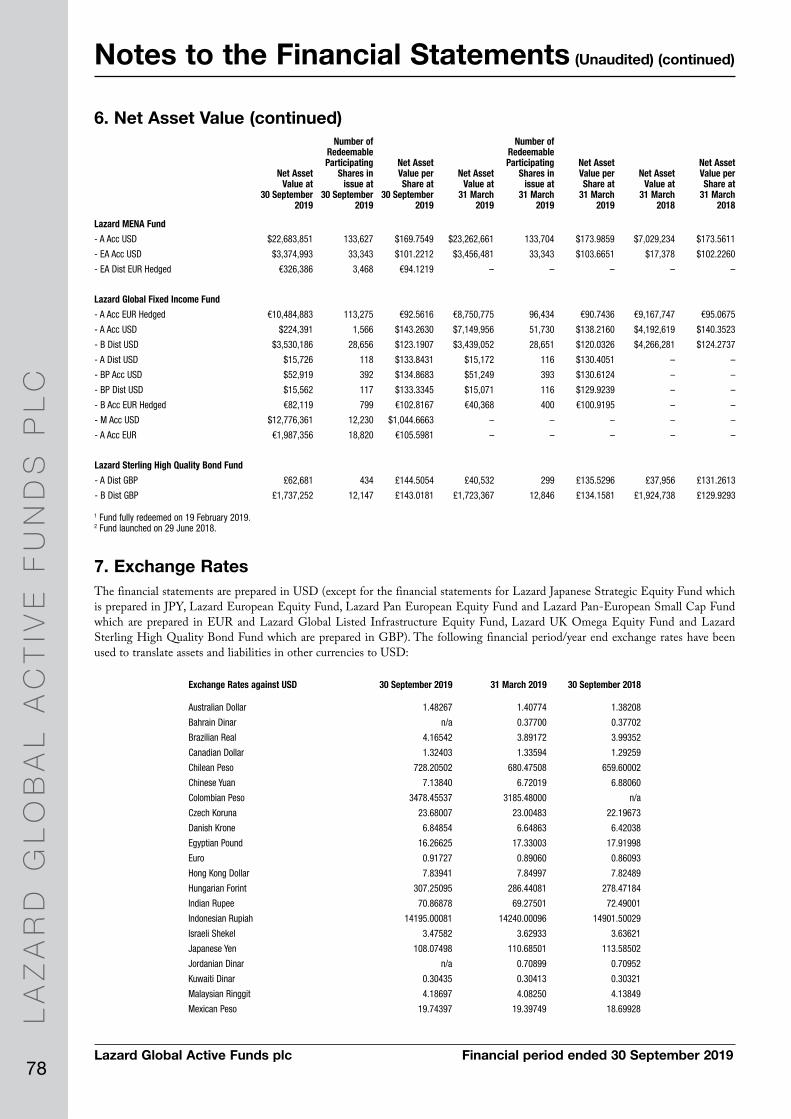
LA
ZA
RD
GL
OB
AL
AC
TIV
E F
UN
DS
PL
C
78Lazard Global Active Funds plc Financial period ended 30 September 2019
Notes to the Financial Statements (Unaudited) (continued)
Lazard MENA Fund
- A Acc USD $22,683,851 133,627 $169.7549 $23,262,661 133,704 $173.9859 $7,029,234 $173.5611
- EA Acc USD $3,374,993 33,343 $101.2212 $3,456,481 33,343 $103.6651 $17,378 $102.2260
- EA Dist EUR Hedged €326,386 3,468 €94.1219 – – – – –
Lazard Global Fixed Income Fund
- A Acc EUR Hedged €10,484,883 113,275 €92.5616 €8,750,775 96,434 €90.7436 €9,167,747 €95.0675
- A Acc USD $224,391 1,566 $143.2630 $7,149,956 51,730 $138.2160 $4,192,619 $140.3523
- B Dist USD $3,530,186 28,656 $123.1907 $3,439,052 28,651 $120.0326 $4,266,281 $124.2737
- A Dist USD $15,726 118 $133.8431 $15,172 116 $130.4051 – –
- BP Acc USD $52,919 392 $134.8683 $51,249 393 $130.6124 – –
- BP Dist USD $15,562 117 $133.3345 $15,071 116 $129.9239 – –
- B Acc EUR Hedged €82,119 799 €102.8167 €40,368 400 €100.9195 – –
- M Acc USD $12,776,361 12,230 $1,044.6663 – – – – –
- A Acc EUR €1,987,356 18,820 €105.5981 – – – – –
Lazard Sterling High Quality Bond Fund
- A Dist GBP £62,681 434 £144.5054 £40,532 299 £135.5296 £37,956 £131.2613
- B Dist GBP £1,737,252 12,147 £143.0181 £1,723,367 12,846 £134.1581 £1,924,738 £129.9293
1 Fund fully redeemed on 19 February 2019.2 Fund launched on 29 June 2018.
7. Exchange RatesThe financial statements are prepared in USD (except for the financial statements for Lazard Japanese Strategic Equity Fund which is prepared in JPY, Lazard European Equity Fund, Lazard Pan European Equity Fund and Lazard Pan-European Small Cap Fund which are prepared in EUR and Lazard Global Listed Infrastructure Equity Fund, Lazard UK Omega Equity Fund and Lazard Sterling High Quality Bond Fund which are prepared in GBP). The following financial period/year end exchange rates have been used to translate assets and liabilities in other currencies to USD:
Exchange Rates against USD 30 September 2019 31 March 2019 30 September 2018
Australian Dollar 1.48267 1.40774 1.38208
Bahrain Dinar n/a 0.37700 0.37702
Brazilian Real 4.16542 3.89172 3.99352
Canadian Dollar 1.32403 1.33594 1.29259
Chilean Peso 728.20502 680.47508 659.60002
Chinese Yuan 7.13840 6.72019 6.88060
Colombian Peso 3478.45537 3185.48000 n/a
Czech Koruna 23.68007 23.00483 22.19673
Danish Krone 6.84854 6.64863 6.42038
Egyptian Pound 16.26625 17.33003 17.91998
Euro 0.91727 0.89060 0.86093
Hong Kong Dollar 7.83941 7.84997 7.82489
Hungarian Forint 307.25095 286.44081 278.47184
Indian Rupee 70.86878 69.27501 72.49001
Indonesian Rupiah 14195.00081 14240.00096 14901.50029
Israeli Shekel 3.47582 3.62933 3.63621
Japanese Yen 108.07498 110.68501 113.58502
Jordanian Dinar n/a 0.70899 0.70952
Kuwaiti Dinar 0.30435 0.30413 0.30321
Malaysian Ringgit 4.18697 4.08250 4.13849
Mexican Peso 19.74397 19.39749 18.69928
6. Net Asset Value (continued)
Net Asset Value at
30 September 2019
Number of Redeemable Participating
Shares in issue at
30 September 2019
Net Asset Value per Share at
30 September 2019
Net Asset Value at
31 March 2019
Number of Redeemable Participating
Shares in issue at
31 March 2019
Net Asset Value per Share at
31 March 2019
Net Asset Value at
31 March 2018
Net Asset Value per Share at
31 March 2018

LA
ZA
RD
GL
OB
AL
AC
TIV
E F
UN
DS
PL
C
79Lazard Global Active Funds plc Financial period ended 30 September 2019
Notes to the Financial Statements (Unaudited) (continued)
New Zealand Dollar 1.59474 1.46629 1.50842
Norwegian Krone 9.08598 8.61157 8.14328
Omani Rial 0.38505 0.38498 0.38488
Pakistan Rupee 156.32500 140.75001 124.18002
Peruvian Sol 3.38412 n/a n/a
Philippine Peso 51.82999 52.51000 54.03002
Polish Zloty 4.00913 3.83381 3.68617
Pound Sterling 0.81149 0.76743 0.76684
Qatari Riyal n/a 3.64077 3.64150
Romanian Leu 4.35040 4.25659 4.00970
Russian Ruble 64.88250 65.69752 65.49507
Saudi Arabian Riyal 3.75120 3.75035 n/a
Singapore Dollar 1.38290 1.35451 1.36636
South African Rand 15.16250 14.42124 14.15126
South Korean Won 1196.15004 1135.10003 1109.25003
Swedish Krona 9.83214 9.27528 8.89326
Swiss Franc 0.99716 0.99589 0.97680
Taiwan Dollar 31.02447 30.82050 30.53299
Thai Baht 30.58500 31.73497 32.34002
Turkish Lira 5.64651 5.64959 6.00728
UAE Dirham 3.67317 3.67311 3.67302
The following financial period/year end exchange rates have been used to translate assets and liabilities in other currencies to EUR:
Exchange Rates against EUR 30 September 2019 31 March 2019 30 September 2018
Danish Krone 7.46623 7.46532 7.45747
Norwegian Krone 9.90547 9.66937 9.45867
Pound Sterling 0.88468 0.86170 0.89071
Swedish Krona 10.71894 10.41461 10.32979
Swiss Franc 1.08710 1.11822 1.13459
Turkish Lira n/a 6.34356 6.97764
US Dollar 1.09019 1.12283 1.16153
The following financial period/year end exchange rates have been used to translate assets and liabilities in other currencies to GBP:
Exchange Rates against GBP 30 September 2019 31 March 2019 30 September 2018
Australian Dollar 1.82710 1.83435 1.80230
Canadian Dollar 1.63160 1.74080 1.68560
Euro 1.13035 1.16050 1.12270
Hong Kong Dollar 9.66050 10.22890 n/a
Japanese Yen 133.18080 144.22810 148.12055
Swiss Franc 1.22880 1.29770 1.27380
US Dollar 1.23230 1.30305 1.30405
The following financial period/year end exchange rates have been used to translate assets and liabilities in other currencies to JPY:
Exchange Rates against JPY 30 September 2019 31 March 2019 30 September 2018
Euro n/a 0.00805 0.00758
Pound Sterling 0.00751 0.00693 0.00675
US Dollar 0.00925 0.00903 0.00880
7. Exchange Rates (continued)
Exchange Rates against USD 30 September 2019 31 March 2019 30 September 2018

LA
ZA
RD
GL
OB
AL
AC
TIV
E F
UN
DS
PL
C
80Lazard Global Active Funds plc Financial period ended 30 September 2019
Notes to the Financial Statements (Unaudited) (continued)
The following average exchange rates have been used to translate Statement of Comprehensive Income and Statement of Changes in Net Assets Attributable to Redeemable Participating Shareholders balances in other currencies to USD:
Average Exchange Rates against USD 30 September 2019 30 September 2018
Euro 0.89469 0.84930
Japanese Yen 108.63311 110.23000
Pound Sterling 0.79443 0.75099
8. Cash at BankCash at bank as at 30 September 2019 and 31 March 2019 comprise of current deposits. The Depositary may utilise one or more sub-custodians for holding cash of the Funds. As at 30 September 2019 and 31 March 2019, cash held by the Funds is deposited with the network of the Depositary’s global sub-custodian, The Bank of New York Mellon SA/NV (the “Global Sub-Custodian”).
Cash account arrangements have been put in place in respect of the Company and the Funds as a consequence of the introduction of the new requirements relating to the subscription and redemption collection accounts pursuant to the Central Bank of Ireland (Supervision and Enforcement) Act 2013 (Section 48 (i)) Investor Money Regulations 2015 for Fund Service Providers (“Investor Money Regulations”), which took effect from 1 July 2016.
These cash accounts, held with the Global Sub-Custodian for collection of subscriptions and payment of redemptions and dividends for the Company, are deemed assets of the Company. The balances on these cash accounts are reflected on the Statement of Financial Position of the relevant Funds as at 30 September 2019 and 31 March 2019.
9. Risk Management Policies and ProceduresThe Funds’ investment activities expose them to the various types of risk which are associated with the financial instruments and markets in which they invest. The following information is not intended to be a comprehensive summary of all risks and investors should refer to the Prospectus and Supplements for a more detailed discussion of the risks inherent in investing in the Funds.
The Board of Directors (the “Directors”) review reporting from Lazard Asset Management Limited, Lazard Asset Management LLC, Lazard Japan Asset Management K.K., Lazard Asset Management Pacific Co., Lazard Asset Management (Deutschland) GmbH and Lazard Gulf Limited (the “Investment Managers”) on a quarterly basis and more frequently as required in relation to the Funds’ performance and risk profile.
The Investment Managers are also responsible for ensuring that the Funds are managed within the terms of each Fund’s investment guidelines and limits set out in the Prospectus and Supplements as well as each Investment Manager’s own internal investment guidelines and limits. The Directors delegate to the Manager who in turn delegates to the Investment Managers the responsibility for the monitoring and oversight of risk for the Funds.
There is a Risk Management Team responsible for overseeing the risk management process of the Investment Managers. Risk Management is delegated to the respective risk team in either the country of operation of the relevant Investment Manager or where not available, Lazard Asset Management LLC. The Head of Risk reports into the Oversight Committee. The Oversight Committee is the central management body for the Investment Managers’ investment platform. It reviews and monitors all Funds to ensure they remain consistent with their stated goals and objectives in terms of product characteristics, performance and risk meaning that the Funds are managed in line with client expectations and their legal and constitutional regulations. There have been no material updates in the risk management process since 31 March 2019.
The following paragraphs outline procedures undertaken to manage the market, credit and liquidity risks of the Funds. These are consistent with the risks that existed as at 31 March 2019.
Market RiskMarket risk arises mainly from uncertainty about future values of financial instruments held specifically from price, currency and interest rate movements. It represents the potential loss the Funds might suffer through holding market positions in the face of market movements.
7. Exchange Rates (continued)
LA
ZA
RD
GL
OB
AL
AC
TIV
E F
UN
DS
PL
C
81Lazard Global Active Funds plc Financial period ended 30 September 2019
Notes to the Financial Statements (Unaudited) (continued)
(i) Market Price RiskMarket price risk is the risk that the fair value or future cash flows of a financial instrument will fluctuate because of changes in market prices (other than those arising from interest rate risk or currency risk), whether those changes are caused by factors specific to the individual financial instrument or its issuer, or factors affecting similar financial instruments traded in the market. The Funds are exposed to market price risk arising from its investments in securities. By diversifying the portfolio, the risk that a price change of a particular investment will have a material impact on the Company is controlled. The Investment Managers manage the Funds’ market risk on a daily basis in accordance with the Fund’s investment objective, policies and core philosophy. The core philosophy of total performance measurement entails the active management of return, risk and cost. Relative-to-benchmark risk is controlled through the construction of diversified portfolios where exposures to certain market features (such as capitalisation or industry) are limited. All of the securities (excluding derivatives) were designated at fair value through profit or loss at the financial period end.
The Company does not currently use financial derivative instruments for efficient portfolio management purposes. However, a number of the Funds use forward foreign currency exchange contracts for portfolio and share class hedging and investment purposes. Details of forward foreign currency exchange contracts held as at 30 September 2019 are included in the Portfolios of Investments. The Company uses the commitment approach to measure global exposure for the Funds which hold forward foreign currency exchange contracts.
(ii) Foreign Currency RiskThe Funds may invest in securities denominated in currencies other than its functional currency (or, indeed, the currency of the investor). Furthermore, the Funds may invest in forward foreign currency exchange contracts for the purpose of implementing investment views and/or share class hedging purposes. Consequently, the Funds are exposed to risks that the exchange rate of its reporting currency relative to other currencies may change in a manner that has an adverse effect on the value of the portion of the Fund’s assets that are denominated in currencies other than its own currency. Currencies may also move in such a way as to cause losses on forward foreign currency exchange contracts.
For portfolios in which currency risk is hedged out, the currency risk is managed by regular rebalancing of the forward foreign currency exchange contracts to maintain zero (or close to zero) currency exposure. For those portfolios for which currency exposure is a critical source of return, exposures are managed relative to the appropriate benchmark. For other portfolios, there is no explicit currency management policy.
Four of the Funds (Lazard UK Omega Equity Fund, Lazard US Equity Concentrated Fund, Lazard Japanese Strategic Equity Fund and Lazard Sterling High Quality Bond Fund) invest only in securities denominated in the base currency of the portfolio, so bear no significant currency risk.
(iii) Interest Rate RiskInterest rate risk is the risk that the fair value or future cash flows of a financial instrument will fluctuate because of changes in prevailing interest rates. The Funds are exposed to interest rate risk through their investments in securities with fixed and floating rates of interest held within bond Funds. The Investment Managers manage the Funds’ interest rate risk on a daily basis in accordance with the Funds’ investment objective, policies and core philosophy.
Credit Risk Credit risk is the risk that the counterparty or issuer to a financial instrument will fail to discharge an obligation or commitment that it has entered into with each Fund. The Company is exposed to credit risk via the Funds that invest in fixed income securities.
All transactions involving transferable securities are settled upon delivery using approved brokers. The risk of default is considered minimal, as delivery of securities sold is only made once the broker has received payment. Payment is made on a purchase once the securities have been received by the broker. The trade will fail if either party fails to meet their obligations.
Substantially all of the cash and securities held in the Funds are held via the Depositary, except for the financial derivative instruments which are held with the counterparties as disclosed in the Portfolio of Investments. The Bank of New York Mellon SA/NV acts as the Global Sub-Custodian for the Funds via the Depositary.
While cash held by the Global Sub-Custodian and the Depositary is identifiable as belonging to the Funds, the Funds will be exposed to the credit risk of the financial institution where cash is deposited. In the event of insolvency of the financial institution, the Funds will be treated as a general creditor of the financial institution in relation to cash holdings of the Funds.
9. Risk Management Policies and Procedures (continued)
Market Risk (continued)

LA
ZA
RD
GL
OB
AL
AC
TIV
E F
UN
DS
PL
C
82Lazard Global Active Funds plc Financial period ended 30 September 2019
Notes to the Financial Statements (Unaudited) (continued)
In circumstances such as the insolvency of a sub-custodian or registrar, or retro-active application of legislation, the Funds may not, in all cases, be able to establish title to investments made and may suffer losses as a result. The Funds may find it impossible to enforce its rights against third parties. In addition, as the Funds may invest in markets where custodial and/or settlement systems are not fully developed, there is a transaction and custody risk involved in dealing in such markets. In certain circumstances, a Fund may not be able to recover some of its assets. Such circumstances may include any acts or omissions or the liquidation, bankruptcy or insolvency of a sub-custodian, retroactive application of legislation and fraud or improper registration of title. The costs borne by a Fund in investing and holding investments in such markets will generally be higher than in organised securities markets.
The Funds’ securities are always separately identified on the accounting records of the Global Sub-Custodian, therefore the rights, with respect to those securities, are preserved. Thus in the event of insolvency or bankruptcy of the Depositary, the Funds’ securities are segregated and protected and this further reduces counterparty risk.
Bankruptcy or insolvency by the Depositary may cause the Funds’ rights with respect to the cash and the securities held by the Depositary to be delayed or limited. The Funds monitor their risk by monitoring the credit quality and financial position of the Depositary that the Funds use. The Standard & Poor’s credit ratings of the parent company of the Depositary and the Global Sub-Custodian as at 30 September 2019 and 31 March 2019 is AA- for long term deposits and A-1+ for short term deposits.
Counterparty/Issuer RiskThe Funds are exposed to a credit risk to parties with whom they trade and will bear the risk of settlement default. Counterparty/issuer risk is monitored and managed by a formal counterparty or issuer exposure management program within the Investment Managers.
The Investment Managers’ approved list of counterparties is generally limited to the most highly rated and recognised dealers in their sectors. The Investment Managers perform ongoing monitoring of this list. Counterparty/issuer risk is monitored on an ongoing basis in the following manner:
• Approved broker selection - the trading system only permits trading with approved brokers. New brokers are added, subject to a formal review process that includes a review of the broker’s creditworthiness, financial strength, ability to enter into legally enforceable arrangements and standing in the financial community.
• Broker monitoring - performed through a variety of ongoing activities, including the assessment of certain regulatory filings and financial statements.
• Measurement and monitoring of counterparty or issuer trade exposure - a daily review of outstanding positions is performed.
A Fund is exposed to a credit risk on the over-the-counter (“OTC”) counterparties with whom it trades, that these counterparties may not perform their obligations and that settlement of transactions may not occur. All OTC counterparties must meet the following criteria as set out in the Central Bank UCITS Regulations namely:
(i) A credit institution in accordance with the Central Bank UCITS Regulations, or(ii) Have a minimum credit rating of A2 or equivalent, or in the opinion of the Investment Managers, an implied credit minimum
rating of A2 or equivalent.
Exposures to individual counterparties are limited to 10% of Net Asset Value in the case of (i) above and 5% of Net Asset Value in the case of (ii) above.
All counterparties to the forward foreign currency exchange contracts are disclosed in the relevant Portfolio of Investments.
A number of the Funds can be/are also exposed to credit risk via their investment in Participatory Notes (“P-Notes”). P-Notes are financial instruments that may be used by the Funds to obtain exposure to an equity investment in a local market where direct ownership is not allowed. Investment in P-Notes may involve an OTC transaction with a third party. Investing in P-Notes may expose the Funds not only to movements in the value of the underlying equity but also to the risk of counterparty default, which may in the event of counterparty default result in the loss of the full market value of the equity. This exposure to counterparties is managed to the Central Bank UCITS Regulations exposure limits as detailed above. P-Notes generally are issued by banks or broker-dealers and are promissory notes that are designed to replicate the performance of a particular underlying equity security or market. The return on a P-Note that is linked to a particular underlying security generally is increased to the extent of any dividends paid in connection with the underlying security. However, the holder of a P-Note typically does not receive voting rights as it would if it directly owned the underlying security. Lazard MENA Fund is the only Fund that currently uses P-Notes to obtain exposure to certain local markets.
9. Risk Management Policies and Procedures (continued)
Credit Risk (continued)
LA
ZA
RD
GL
OB
AL
AC
TIV
E F
UN
DS
PL
C
83Lazard Global Active Funds plc Financial period ended 30 September 2019
Notes to the Financial Statements (Unaudited) (continued)
Liquidity RiskThe Funds’ assets comprise mainly of realisable securities which can be readily sold. The main liability of the Funds is the redemption of any shares that investors wish to sell. Shareholders have the right to require the Funds to redeem their shares in the Funds on any business day subject to restrictions set out in the Prospectus. If total requests for redemption and/or switching on any dealing day for any Fund exceed 10% of the Net Asset Value of that Fund, each redemption or switching request in respect of shares in such Fund may, at the discretion of the Directors, be reduced pro rata so that the total number of shares of such Fund for redemption or switching on that dealing day shall not exceed 10% of the Net Asset Value of that Fund. Any redemption or switching request so reduced shall be carried forward to the next dealing day and effected in accordance with the Constitution on the following dealing day(s). The Funds have the ability to borrow in the short term to ensure settlement. No such borrowings have arisen during the current or prior financial period.
The Funds’ financial liabilities due for payment within three months relate, in the most part, to investments purchased payable, redemptions payable, distribution payable and payment of expenses and bank overdraft interest. Details of these amounts where relevant, can be found in the Statement of Financial Position. There are no other financial liabilities that fall due within three months except for the forward foreign currency exchange contracts which are outlined in the Portfolios of Investments as at 30 September 2019.
Concentration RiskThe Funds may be exposed to concentration risk when a shareholder holds a significant portion of the issued share capital of the Fund.
Fair Value MeasurementThe Company has classified fair value measurements using a fair value hierarchy that reflects the significance of the inputs used in making the measurements. The fair value hierarchy has the following levels:
Level 1 inputs are unadjusted quoted prices in active markets for identical assets or liabilities that the reporting entity has the ability to access at the valuation date. An active market for the asset or liability is a market in which transactions for the asset or liability occur with sufficient frequency and volume to provide pricing information on an ongoing basis.
Level 2 inputs are inputs other than quoted prices in active markets included within level 1 that are observable for the asset or liability, either directly or indirectly. Fair value is determined through the use of models or other valuation methodologies. Level 2 inputs include the following:
a) Quoted prices for similar assets or liabilities in active markets.b) Quoted prices for identical or similar assets or liabilities in markets that are not active, that is, markets in which there are few
transactions for the asset or liability, the prices are not current, or price quotations vary substantially either over time or among market makers, or in which little information is released publicly.
c) Inputs other than quoted prices that are observable for the asset or liability (e.g. interest rate and yield curves observable at commonly quoted intervals, volatilities, prepayment speeds, loss severities, credit risks and default rates).
d) Inputs that are derived principally from or corroborated by observable market data by correlation or other means.
Level 3 inputs are unobservable inputs for the asset or liability. Unobservable inputs reflect the Company’s own assumptions about how market participants would be expected to value the asset or liability. Unobservable inputs are developed based on the best information available in the circumstances, other than market data obtained from sources independent of the Company and might include the Company’s own data.
An investment is always categorised as level 1, 2 or 3 in its entirety. In certain cases, the fair value measurement for an investment may use a number of different inputs that fall into different levels of the fair value hierarchy. In such cases, an investment’s level within the fair value hierarchy is based on the lowest level of input that is significant to the fair value measurement. The assessment of the significance of a particular input to the fair value measurement requires judgment and is specific to the investment.
9. Risk Management Policies and Procedures (continued)
LA
ZA
RD
GL
OB
AL
AC
TIV
E F
UN
DS
PL
C
84Lazard Global Active Funds plc Financial period ended 30 September 2019
Notes to the Financial Statements (Unaudited) (continued)
All financial instruments for each Fund are level 1, apart from the financial instruments listed below which are level 2 as at 30 September 2019 and 31 March 2019:
30 September 2019 % of NAV 31 March 2019 % of NAV
Lazard Global Listed Infrastructure Equity Fund Level 2 Level 2
Financial assets at fair value through profit or loss GBP GBP
Forward Foreign Currency Exchange Contracts 503,735 0.04 4,011,992 0.31
Total 503,735 0.04 4,011,992 0.31
Financial liabilities at fair value through profit or loss GBP GBP
Forward Foreign Currency Exchange Contracts (8,854,364) (0.63) (5,457,443) (0.42)
Total (8,854,364) (0.63) (5,457,443) (0.42)
30 September 2019 % of NAV 31 March 2019 % of NAV
Lazard Global Managed Volatility Fund Level 2 Level 2
Financial assets at fair value through profit or loss USD USD
Forward Foreign Currency Exchange Contracts 88,816 0.04 – –
Total 88,816 0.04 – –
Financial liabilities at fair value through profit or loss USD USD
Forward Foreign Currency Exchange Contracts (576,241) (0.27) (268,763) (0.12)
Total (576,241) (0.27) (268,763) (0.12)
30 September 2019 % of NAV 31 March 2019 % of NAV
Lazard Global Equity Franchise Fund Level 2 Level 2
Financial assets at fair value through profit or loss USD USD
Forward Foreign Currency Exchange Contracts 897 0.00 728 0.00
Total 897 0.00 728 0.00
Financial liabilities at fair value through profit or loss USD USD
Forward Foreign Currency Exchange Contracts (65,396) (0.02) (6,308) (0.00)
Total (65,396) (0.02) (6,308) (0.00)
30 September 2019 % of NAV 31 March 2019 % of NAV
Lazard UK Omega Equity Fund Level 2 Level 2
Financial assets at fair value through profit or loss GBP GBP
Common Stock – – 71,003 2.80
Total – – 71,003 2.80
30 September 2019 % of NAV 31 March 2019 % of NAV
Lazard US Equity Concentrated Fund Level 2 Level 2
Financial assets at fair value through profit or loss USD USD
Forward Foreign Currency Exchange Contracts 20,483 0.01 161,757 0.05
Total 20,483 0.01 161,757 0.05
Financial liabilities at fair value through profit or loss USD USD
Forward Foreign Currency Exchange Contracts (760,385) (0.22) (172,659) (0.05)
Total (760,385) (0.22) (172,659) (0.05)
9. Risk Management Policies and Procedures (continued)
Fair Value Measurement (continued)

LA
ZA
RD
GL
OB
AL
AC
TIV
E F
UN
DS
PL
C
85Lazard Global Active Funds plc Financial period ended 30 September 2019
Notes to the Financial Statements (Unaudited) (continued)
30 September 2019 % of NAV 31 March 2019 % of NAV
Lazard Japanese Strategic Equity Fund Level 2 Level 2
Financial assets at fair value through profit or loss JPY JPY
Forward Foreign Currency Exchange Contracts 488,230 0.02 96,148 0.01
Total 488,230 0.02 96,148 0.01
Financial liabilities at fair value through profit or loss JPY JPY
Forward Foreign Currency Exchange Contracts (66) (0.00) (751,762) (0.03)
Total (66) (0.00) (751,762) (0.03)
30 September 2019 % of NAV 31 March 2019 % of NAV
Lazard Emerging Markets Equity Fund Level 2 Level 2
Financial assets at fair value through profit or loss USD USD
Forward Foreign Currency Exchange Contracts 298 0.00 2 0.00
Total 298 0.00 2 0.00
Financial liabilities at fair value through profit or loss USD USD
Forward Foreign Currency Exchange Contracts (14,566) (0.00) (26) (0.00)
Total (14,566) (0.00) (26) (0.00)
30 September 2019 % of NAV 31 March 2019 % of NAV
Lazard Emerging Markets Equity Advantage Fund* Level 2 Level 2
Financial assets at fair value through profit or loss USD USD
Forward Foreign Currency Exchange Contracts 25,099 0.03 170 0.01
Total 25,099 0.03 170 0.01
Financial liabilities at fair value through profit or loss USD USD
Forward Foreign Currency Exchange Contracts (28,975) (0.03) (3,671) (0.10)
Total (28,975) (0.03) (3,671) (0.10)
*Fund launched on 29 June 2018.30 September 2019 % of NAV 31 March 2019 % of NAV
Lazard MENA Fund Level 2 Level 2
Financial assets at fair value through profit or loss USD USD
Common Stock – – 1,978,875 7.41
P-Notes 1,869,958 7.08 1,551,239 5.81
Forward Foreign Currency Exchange Contracts 221 0.00 – –
Total 1,870,179 7.08 3,530,114 13.22
Financial liabilities at fair value through profit or loss USD USD
Forward Foreign Currency Exchange Contracts (5,872) (0.02) – –
Total (5,872) (0.02) – –
9. Risk Management Policies and Procedures (continued)
Fair Value Measurement (continued)

LA
ZA
RD
GL
OB
AL
AC
TIV
E F
UN
DS
PL
C
86Lazard Global Active Funds plc Financial period ended 30 September 2019
Notes to the Financial Statements (Unaudited) (continued)
30 September 2019 % of NAV 31 March 2019 % of NAV
Lazard Global Fixed Income Fund Level 2 Level 2
Financial assets at fair value through profit or loss USD USD
Bonds 29,975,496 98.92 20,454,218 99.58
Forward Foreign Currency Exchange Contracts 280,245 0.93 63,262 0.31
Total 30,255,741 99.85 20,517,480 99.89
Financial liabilities at fair value through profit or loss USD USD
Forward Foreign Currency Exchange Contracts (557,275) (1.84) (201,810) (0.98)
Total (557,275) (1.84) (201,810) (0.98)
30 September 2019 % of NAV 31 March 2019 % of NAV
Lazard Sterling High Quality Bond Fund Level 2 Level 2
Financial assets at fair value through profit or loss GBP GBP
Bonds 1,695,167 94.18 1,691,267 95.88
Total 1,695,167 94.18 1,691,267 95.88
Investments, whose values are based on quoted market prices in active markets, and therefore classified within level 1, include active listed equities and investment funds. The Funds do not adjust the quoted price for these instruments. Financial instruments that do not have quoted market prices but are valued based on market prices, dealer quotations or alternative pricing sources supported by observable inputs are classified within level 2; these include common stock, bonds, P-Notes and forward foreign currency exchange contracts.
There are level 3 securities held but fair valued at zero on Lazard Emerging World Fund and Lazard MENA Fund as at 30 September 2019.
There were level 3 securities held but fair valued at zero on Lazard Emerging World Fund and Lazard MENA Fund as at 31 March 2019.
Transfers are deemed to occur at the end of the financial period.
10. Soft Commission ArrangementsThe Investment Managers for the Company, in accordance with common market practice for investment managers, entered into dealing arrangements with brokers whereby part of the dealing commissions paid to them are used to discharge the cost of investment related services supplied to them by the broker or by third parties. These services may be either market research or be related to the execution of trades on behalf of clients.
The Investment Managers place business with these counterparties including transactions relating to the Funds’ investments. The Investment Managers will endeavour at all times to obtain best execution on all transactions for all clients including the Funds, and are satisfied that these arrangements are of benefit to the Funds.
11. Related Party TransactionsAll material related party transactions with the Manager and Directors are included in Note 3 to the financial statements.
Andreas Hübner and Jeremy Taylor are, and Michael Allen up until 25 June 2019 was, full time executives of the Lazard Group as well as Directors of the Company. Michael Allen, Andreas Hübner and Jeremy Taylor are not entitled to any Directors’ fees from the Company.
All Directors of the Company are also Directors of the Manager.
Daniel Morrissey is a Director of the Company and is also a partner of William Fry (the Company’s legal advisers). The partners of William Fry own Wilton Secretarial Limited (the “Secretary”) and accordingly, Daniel Morrissey had a beneficial interest under the Companies Act 2014 in legal and secretarial fees paid to William Fry and the Secretary amounting to USD 68,984 (30 September 2018: USD 146,681) for the financial period ended 30 September 2019.
In the opinion of the Directors, the Investment Managers are related parties under FRS 102, Section 33 “Related Party Transaction”. Please refer to Note 3 to the financial statements for details of arrangements between the Funds and the Investment Managers.
9. Risk Management Policies and Procedures (continued)
Fair Value Measurement (continued)
LA
ZA
RD
GL
OB
AL
AC
TIV
E F
UN
DS
PL
C
87Lazard Global Active Funds plc Financial period ended 30 September 2019
Notes to the Financial Statements (Unaudited) (continued)
There is currently 1 subscriber share in issue and that is held by the Manager.
The following table details the related party investors by Fund as at 30 September 2019 and 31 March 2019:
Fund Investor Name Currency 30 September 2019 % of NAV 31 March 2019 % of NAV
Lazard Global Listed Infrastructure Equity Fund Lazard & Co Services Limited GBP 558,595 0.04% 350,183 0.03%
Lazard Asset Management Limited GBP 426,469 0.03% 111,118 0.01%
Lazard Group LLC GBP 2,892,387 0.20% 710,819 0.05%
Lazard Asset Management LLC GBP 76,174 0.01% 69,446 0.01%
Lazard Global Strategic Equity Fund Lazard & Co Services Limited USD 1,143,408 12.80% 789,567 10.81%
Lazard Asset Management Limited USD 3,307,477 37.04% 2,310,695 31.63%
Lazard Group LLC USD 1,050,721 11.77% 668,585 9.15%
Lazard Asset Management LLC USD 15,868 0.18% 15,284 0.21%
Lazard Global Equity Select Fund Lazard & Co Services Limited USD 299,044 1.91% 224,446 1.69%
Lazard Asset Management Limited USD 1,230,686 7.87% 585,139 4.40%
Lazard Group LLC USD 1,397,099 8.93% 784,852 5.90%
Lazard Asset Management LLC USD 2,457,266 15.71% 2,358,332 17.72%
Lazard Global Managed Volatility Fund Lazard & Co Services Limited USD 688,411 0.32% 589,908 0.25%
Lazard Asset Management Limited USD 894,520 0.42% 510,701 0.22%
Lazard Group LLC USD 2,364,091 1.11% 1,081,193 0.46%
Lazard Asset Management LLC USD 16,210 0.01% 15,701 0.01%
Lazard Thematic Global Fund Lazard & Co Services Limited USD 1,258,958 1.97% 899,696 1.59%
Lazard Asset Management Limited USD 64,938 0.10% 30,931 0.05%
Lazard Group LLC USD 2,860,935 4.48% 905,695 1.60%
Lazard Global Equity Franchise Fund Lazard & Co Services Limited USD 69,124 0.02% 42,379 0.01%
Lazard Asset Management Limited USD 1,652,024 0.50% 830,316 0.28%
Lazard Group LLC USD 1,520,521 0.46% 439,968 0.15%
Lazard European Equity Fund Lazard & Co Services Limited EUR 431,036 1.13% 363,328 0.98%
Lazard Asset Management Limited EUR 406,174 1.06% 261,243 0.71%
Lazard Group LLC EUR 728,982 1.91% 502,511 1.36%
Lazard Asset Management LLC EUR 38,034 0.10% 35,676 0.10%
Lazard Pan European Equity Fund Lazard & Co Services Limited EUR 206,081 6.85% 200,552 8.14%
Lazard Asset Management Limited EUR 450,166 14.96% 332,159 13.47%
Lazard Group LLC EUR 377,615 12.55% 293,209 11.89%
Lazard Asset Management LLC EUR 52,879 1.76% 36,585 1.48%
Lazard UK Omega Equity Fund Lazard & Co Services Limited GBP 126,281 4.44% 60,231 2.38%
Lazard Asset Management Limited GBP 997,385 35.06% 663,001 26.18%
Lazard Group LLC GBP 92,535 3.25% 56,897 2.25%
Lazard US Equity Concentrated Fund Lazard Asset Management LLC USD 69,162 0.02% 63,819 0.02%
Lazard Japanese Strategic Equity Fund Lazard & Co Services Limited JPY 16,765,572 0.64% 11,999,432 0.46%
Lazard Asset Management Limited JPY 67,305,790 2.56% 53,386,496 2.04%
Lazard Group LLC JPY 103,065,409 3.92% 85,972,404 3.28%
Lazard Asset Management LLC JPY 10,071,527 0.38% 9,684,469 0.37%
Lazard Emerging Markets Equity Fund Lazard Asset Management LLC USD 39,818 0.00% 41,081 0.00%
Lazard Emerging Markets Core Equity Fund Lazard & Co Services Limited USD 173,748 0.23% 139,174 0.18%
Lazard Asset Management Limited USD 333,581 0.44% 215,766 0.28%
Lazard Group LLC USD 1,065,782 1.41% 718,146 0.95%
Lazard Asset Management LLC USD 54,150 0.07% 55,908 0.07%
Lazard Emerging Markets Equity Advantage Fund* Lazard Asset Management LLC USD n/a n/a 3,573,883 95.53%
Lazard Developing Markets Equity Fund Lazard & Co Services Limited USD 239,775 1.00% 113,187 0.36%
Lazard Asset Management Limited USD 731,479 3.05% 315,752 1.01%
Lazard Group LLC USD 511,619 2.14% 582,793 1.87%
Lazard Asset Management LLC USD 40,878 0.17% 41,912 0.13%
Lazard Global Fixed Income Fund Lazard & Co Services Limited USD 3,686,864 12.17% 2,092,112 10.18%
Lazard Asset Management Limited USD 2,479,654 8.18% 1,047,738 5.10%
Lazard Group LLC USD 6,842,378 22.58% 4,005,320 19.50%
Lazard Asset Management LLC USD 46,897 0.15% 45,313 0.22%
Lazard Sterling High Quality Bond Fund Mauritius Control Account Co Lazard GBP 6,986 0.39% 6,525 0.37%
*Fund launched on 29 June 2018.
11. Related Party Transactions (continued)

LA
ZA
RD
GL
OB
AL
AC
TIV
E F
UN
DS
PL
C
88Lazard Global Active Funds plc Financial period ended 30 September 2019
Notes to the Financial Statements (Unaudited) (continued)
12. Connected Persons TransactionsIn accordance with the requirements of the Central Bank UCITS Regulations 43(1), any transaction carried out with the Company by its management company or depositary, and the delegates or sub-delegates of such management company or depositary (excluding any non-group company sub-custodians appointed by a depositary), and any associated or group company of such management company, depositary, delegate or sub-delegate (“Connected Persons”) must be carried out as if negotiated at arm’s length. Such transactions must be in the best interests of the shareholders. In addition to those transactions, there are also transactions carried out by Connected Persons on behalf of the Company to which the Directors have no direct access and in respect of which the Directors must rely upon assurances from the Company’s delegates that the Connected Persons carrying out those transactions do carry them out on a similar basis.
Shareholders should have regard to the governance structure of the Company as more particularly described in the Corporate Governance Statement section of the Directors’ Report of the audited financial statements for the financial year ended 31 March 2019 and the roles and responsibilities of the Company’s respective delegates subject to the overall supervision of the Directors. Further, shareholders should refer to the Prospectus which identifies many of the Connected Person transactions and the general nature of the contractual arrangements with the principal Connected Persons but it is not exhaustive of all Connected Persons transactions. Shareholders should also refer to the provisions of the Prospectus dealing with conflicts of interest.
Therefore, having regard to confirmations from the Company’s management and its relevant delegates, the Directors of the Company are satisfied that:
(i) there are arrangements (as evidenced by written procedures documented by the Manager) in place to ensure that the obligations described above are applied to all transactions with Connected Persons; and
(ii) transactions with Connected Persons entered into during the financial period complied with these obligations, as attested by the Manager through regular updates to the Directors.
Details of fees paid to related parties and certain Connected Persons are set out in Notes 3 and 11. However, shareholders should understand that not all “Connected Persons” are related parties as such latter expression is defined by Section 33 of FRS 102.
13. DistributionsDuring the financial period ended 30 September 2019 and 30 September 2018, distributions were paid on the following share classes:
30 September 2019 30 September 2018
ClassCurrency of Share Class Date
Amount (Class
Currency)Distribution
per Share Date
Amount (Class
Currency)Distribution
per Share
Lazard Global Listed Infrastructure Equity Fund
B Dist USD Hedged USD 01-Apr-19 25,241 0.1539 03-Apr-18 117,276 0.1634
A Dist EUR Hedged EUR 01-Apr-19 1,733,187 0.0257 03-Apr-18 2,162,746 0.0265
A Dist GBP GBP 01-Apr-19 6,917,395 0.0205 03-Apr-18 7,745,152 0.0213
A Dist USD Hedged USD 01-Apr-19 216,878 0.0357 03-Apr-18 354,831 0.0376
A Dist USD USD 01-Apr-19 564 0.0839 - - -
BP Dist USD USD 01-Apr-19 44 0.0289 - - -
BP Dist USD Hedged USD 01-Apr-19 43 0.0287 - - -
Lazard Global Strategic Equity Fund
EA Dist GBP GBP - - - 03-Apr-18 3,528 0.0300
Lazard Global Equity Select Fund
A Dist USD USD 01-Apr-19 5 0.0364 - - -
Lazard Global Managed Volatility Fund
A Dist EUR EUR 01-Apr-19 53,126 0.5423 03-Apr-18 52,046 0.5313
A Dist USD USD 01-Apr-19 72,196 0.5485 03-Apr-18 64,737 0.5883
Lazard Global Equity Franchise Fund
EA Dist GBP GBP 01-Apr-19 305,811 0.9886 03-Apr-18 155,266 0.6721
C Dist GBP GBP 01-Apr-19 14,923 1.0091 03-Apr-18 69 0.6895
A Dist EUR Hedged EUR 01-Apr-19 392 0.2613 - - -
EA Dist EUR EUR 01-Apr-19 14,500 1.0403 03-Apr-18 1,988 0.6951
Lazard European Equity Fund
C Dist GBP GBP 01-Apr-19 84 0.0006 03-Apr-18 257 0.0023
Lazard Pan European Equity Fund
C Dist EUR EUR 01-Apr-19 862 0.0031 03-Apr-18 1,210 0.0043
A Dist USD EUR 01-Apr-19 28 0.0019 - - -

LA
ZA
RD
GL
OB
AL
AC
TIV
E F
UN
DS
PL
C
89Lazard Global Active Funds plc Financial period ended 30 September 2019
Notes to the Financial Statements (Unaudited) (continued)
Lazard UK Omega Equity Fund
B Dist GBP GBP 01-Apr-19 14,198 0.0224 03-Apr-18 9,906 0.0122
C Dist GBP GBP 01-Apr-19 2,417 0.0125 03-Apr-18 314 0.0087
Lazard US Equity Concentrated Fund
C Dist USD USD 01-Apr-19 1,322 0.1985 03-Apr-18 2,029 0.2315
A Dist USD USD 01-Apr-19 28 0.1864 - - -
Lazard Japanese Strategic Equity Fund
C Dist GBP Hedged GBP - - - 03-Apr-18 185 0.5847
A Dist USD USD 01-Apr-19 100 0.6646 - - -
BP Dist USD USD 01-Apr-19 43 0.2831 - - -
A Dist USD Hedged USD 01-Apr-19 99 0.6562 - - -
BP Dist USD Hedged USD 01-Apr-19 40 0.2641 - - -
Lazard Emerging World Fund
B Dist USD USD 01-Apr-19 70,100 0.1027 - - -
C Dist USD USD 01-Apr-19 943 0.0066 - - -
Lazard Emerging Markets Equity Fund
A Dist EUR EUR 01-Apr-19 734,627 0.5098 03-Apr-18 467,712 0.3429
S Dist GBP GBP 01-Apr-19 66,643 0.0065 03-Apr-18 26,968 0.0048
A Dist USD USD 01-Apr-19 1,760,583 0.5317 03-Apr-18 1,547,574 0.3864
S Dist USD USD 01-Apr-19 225,334 0.0054 03-Apr-18 211,804 0.0044
S Dist EUR EUR 01-Apr-19 11,806 0.0052 03-Apr-18 777 0.0038
BP Dist USD USD 01-Apr-19 13 0.0009 - - -
A Dist EUR Hedged EUR 01-Apr-19 50 0.0039 - - -
Lazard Emerging Markets Core Equity Fund
A Dist USD USD 01-Apr-19 6 0.0408 - - -
C Dist GBP GBP 01-Apr-19 5 0.1668 03-Apr-18 11 0.3361
Lazard Global Fixed Income Fund
B Dist USD USD 01-Apr-19 29,441 1.0276 03-Apr-18 33,184 0.9666
A Dist USD USD 01-Apr-19 148 1.2749 - - -
BP Dist USD USD 01-Apr-19 92 0.7968 - - -
Lazard Sterling High Quality Bond Fund
A Dist GBP GBP 01-Apr-19 306 1.0231 03-Apr-18 375 1.2985
B Dist GBP GBP 01-Apr-19 7,246 0.5640 03-Apr-18 12,410 0.8378
14. Significant Events During the Financial PeriodDuring the financial period ended 30 September 2019, the following share classes were launched:
Fund Name Share Class Launch Date
Lazard Global Listed Infrastructure Equity Fund M Acc USD 04-Apr-19
C Acc EUR Hedged 25-Jul-19
Lazard Global Strategic Equity Fund M Acc USD 04-Apr-19
Lazard Global Equity Select Fund M Acc USD 04-Apr-19
Lazard Global Managed Volatility Fund M Acc USD 04-Apr-19
Lazard Thematic Global Fund M Acc USD 04-Apr-19
Lazard Global Equity Franchise Fund C Acc EUR 01-Apr-19
A Acc EUR 02-Apr-19
M Acc USD 04-Apr-19
Lazard European Equity Fund M Acc USD 04-Apr-19
Lazard Pan European Equity Fund M Acc USD 04-Apr-19
A Acc USD 1 22-May-19
Lazard Pan-European Small Cap Fund A Acc EUR 22-Aug-19
Lazard UK Omega Equity Fund M Acc USD 04-Apr-19
Lazard Japanese Strategic Equity Fund M Acc USD 04-Apr-19
Lazard Emerging Markets Equity Fund C Acc EUR 25-Apr-19
A Acc EUR Hedged 22-May-19
13. Distributions (continued)30 September 2019 30 September 2018
ClassCurrency of Share Class Date
Amount (Class
Currency)Distribution
per Share Date
Amount (Class
Currency)Distribution
per Share

LA
ZA
RD
GL
OB
AL
AC
TIV
E F
UN
DS
PL
C
90Lazard Global Active Funds plc Financial period ended 30 September 2019
Notes to the Financial Statements (Unaudited) (continued)
Lazard Emerging Markets Core Equity Fund M Acc USD 04-Apr-19
Lazard Emerging Markets Equity Advantage Fund C Acc GBP 11-Apr-19
C Dist GBP 11-Apr-19
EA Acc GBP 22-Jul-19
Lazard Developing Markets Equity Fund M Acc USD 04-Apr-19
Lazard MENA Fund EA Dist EUR Hedged 09-Apr-19
Lazard Global Fixed Income Fund M Acc USD 04-Apr-19
A Acc EUR 28-May-19
1 A ACC USD on Lazard Pan European Equity Fund closed on 25 April 2019 and re-opened on 22 May 2019.
During the financial period ended 30 September 2019, the following share classes were fully redeemed:
Fund Name Share Class Termination Date
Lazard US Equity Concentrated Fund X Acc USD 09-Apr-19
Lazard Global Managed Volatility Fund A Dist USD 02-Sep-19
Lazard Emerging Markets Equity Advantage Fund BP Acc EUR Hedged 18-Sep-19
EA Acc EUR 18-Sep-19
C Dist GBP 18-Sep-19
Effective 25 June 2019, Michael Allen resigned from the Board of Directors of the Company and as a member of the Audit Committee. On the same date, Jeremy Taylor was appointed as a member of the Audit Committee.
15. Significant Events Since the Financial Period EndPost financial period end dividend distributions were declared on 1 October 2019 as follows:
ClassCurrency of Share Class Date
Amount (Class Currency)
Distribution per Share
Lazard Global Listed Infrastructure Equity Fund
B Dist USD Hedged USD 01-Oct-19 40,310 0.2674
A Dist EUR Hedged EUR 01-Oct-19 3,051,932 0.0447
A Dist GBP GBP 01-Oct-19 12,493,325 0.0366
A Dist USD Hedged USD 01-Oct-19 660,560 0.0623
A Dist USD USD 01-Oct-19 4,594 0.2092
BP Dist USD USD 01-Oct-19 312 0.2056
BP Dist USD Hedged USD 01-Oct-19 334 0.2204
Lazard Global Strategic Equity Fund
EA Dist GBP GBP 01-Oct-19 2,195 0.0477
Lazard Global Equity Select Fund
A Dist USD USD 01-Oct-19 31 0.2071
Lazard Global Managed Volatility Fund
A Dist EUR EUR 01-Oct-19 103,424 1.0558
Lazard Thematic Global Fund
A Dist GBP GBP 01-Oct-19 25,805 0.4661
A Dist USD USD 01-Oct-19 99,635 0.5756
Lazard Global Equity Franchise Fund
EA Dist GBP GBP 01-Oct-19 619,743 1.7174
C Dist GBP GBP 01-Oct-19 35,763 1.7505
A Dist EUR Hedged EUR 01-Oct-19 2,238 1.4918
EA Dist EUR EUR 01-Oct-19 8,197 1.7594
Lazard European Equity Fund
C Dist GBP GBP 01-Oct-19 9,986 0.0655
B Dist EUR EUR 01-Oct-19 690,134 0.0605
A Dist EUR EUR 01-Oct-19 6,624 0.0232
A Dist USD USD 01-Oct-19 316 0.0209
BP Dist USD USD 01-Oct-19 262 0.0174
14. Significant Events During the Financial Period (continued)
Fund Name Share Class Launch Date

LA
ZA
RD
GL
OB
AL
AC
TIV
E F
UN
DS
PL
C
91Lazard Global Active Funds plc Financial period ended 30 September 2019
Notes to the Financial Statements (Unaudited) (continued)
Lazard Pan European Equity Fund
C Dist EUR EUR 01-Oct-19 7,379 0.0261
A Dist USD USD 01-Oct-19 349 0.0232
B Dist EUR EUR 01-Oct-19 36,497 0.0357
BP Dist USD USD 01-Oct-19 297 0.0198
Lazard Pan-European Small Cap Fund
AP Dist EUR EUR 01-Oct-19 292,441 1.4929
Lazard UK Omega Equity Fund
B Dist GBP GBP 01-Oct-19 21,800 0.0377
C Dist GBP GBP 01-Oct-19 3,598 0.0186
Lazard US Equity Concentrated Fund
C Dist USD USD 01-Oct-19 1,861 0.1267
A Dist USD USD 01-Oct-19 2,407 0.1135
Lazard Japanese Strategic Equity Fund
C Dist GBP Hedged GBP 01-Oct-19 14 0.6027
A Dist USD USD 01-Oct-19 70 0.4601
BP Dist USD USD 01-Oct-19 12 0.0781
A Dist USD Hedged USD 01-Oct-19 67 0.4413
BP Dist USD Hedged USD 01-Oct-19 8 0.0520
Lazard Emerging World Fund
B Dist USD USD 01-Oct-19 90,087 0.1320
C Dist USD USD 01-Oct-19 1,166 0.0079
Lazard Emerging Markets Equity Fund
A Dist EUR EUR 01-Oct-19 2,707,398 1.8683
S Dist GBP GBP 01-Oct-19 212,688 0.0220
A Dist USD USD 01-Oct-19 2,381,728 1.8905
S Dist USD USD 01-Oct-19 223,186 0.0174
S Dist EUR EUR 01-Oct-19 14,549 0.0170
BP Dist USD USD 01-Oct-19 174 0.0115
A Dist EUR Hedged EUR 01-Oct-19 188 0.0146
Lazard Emerging Markets Core Equity Fund
A Dist USD USD 01-Oct-19 166 1.0961
C Dist GBP GBP 01-Oct-19 46 1.4440
BP Dist USD USD 01-Oct-19 112 0.7440
Lazard Developing Markets Equity Fund
A Dist EUR EUR 01-Oct-19 48,194 0.0760
A Dist USD USD 01-Oct-19 91 0.0605
BP Dist USD USD 01-Oct-19 39 0.0258
C Dist GBP GBP 01-Oct-19 4,503 0.0757
C Dist USD USD 01-Oct-19 65 0.0761
Lazard MENA Fund
EA Dist EUR Hedged EUR 01-Oct-19 3,291 0.9535
Lazard Global Fixed Income Fund
B Dist USD USD 01-Oct-19 24,996 0.8723
A Dist USD USD 01-Oct-19 131 1.1161
BP Dist USD USD 01-Oct-19 72 0.6138
Lazard Sterling High Quality Bond Fund
A Dist GBP GBP 01-Oct-19 411 0.9588
B Dist GBP GBP 01-Oct-19 5,629 0.4634
Lazard Sterling High Quality Bond Fund fully redeemed on 14 October 2019.
Lazard Pan European Equity Fund and Lazard UK Omega Equity Fund fully redeemed on 25 November 2019.
Lazard Global Thematic Focus Fund was approved by the Central Bank on 20 November 2019.
16. Approval of the Financial StatementsThe financial statements were approved by the Directors on 25 November 2019.
15. Significant Events Since the Financial Period End (continued)
ClassCurrency of Share Class Date
Amount (Class Currency)
Distribution per Share

LA
ZA
RD
GL
OB
AL
AC
TIV
E F
UN
DS
PL
C
92Lazard Global Active Funds plc Financial period ended 30 September 2019
Portfolios of Investments (Unaudited)
Analysis of Total Assets % of Total AssetsTransferable securities admitted to an official stock exchange listing or traded on a regulated market 96.55
Financial derivative instruments 0.04
Other assets 3.41
Total Assets 100.00
Lazard Global Listed Infrastructure Equity FundPortfolio of Investments as at 30 September 2019
Shares Fair Value GBP
% of NAV
Common Stock - 97.48% (31 March 2019: 95.76%)
Maturity Date
Amount Bought
Amount Sold
Unrealised Gain/(Loss)
GBP
% of NAV
Open forward foreign currency exchange contracts - (0.59)% (31 March 2019: (0.11)%)
Australia - 4.91% (31 March 2019: 9.57%)
6,925,130 Atlas Arteria Ltd 29,586,322 2.09
27,743,462 Spark Infrastructure Group 32,809,168 2.32
888,449 Transurban Group 7,151,601 0.50
69,547,091 4.91
Canada - 1.05% (31 March 2019: 0.99%)
500,400 Atco Ltd/Canada 14,868,468 1.05
France - 8.10% (31 March 2019: 7.96%)
3,190,850 Eutelsat Communications SA 48,225,033 3.40
760,555 Vinci SA 66,539,887 4.70
114,764,920 8.10
Germany - 3.36% (31 March 2019: 3.25%)
692,620 Fraport AG Frankfurt Airport Services Worldwide 47,682,877 3.36
Hong Kong - 4.11% (31 March 2019: 1.94%)
10,671,000 Power Assets Holdings Ltd 58,189,647 4.11
Italy - 28.44% (31 March 2019: 27.91%)
643,262 ASTM SpA 16,706,087 1.18
5,600,366 Atlantia SpA 110,065,729 7.77
7,597,714 Hera SpA 25,333,004 1.79
8,038,356 Italgas SpA 42,149,381 2.97
21,421,946 Snam SpA 87,911,565 6.20
967,728 Societa Iniziative Autostradali e Servizi SpA 13,713,762 0.97
20,552,410 Terna Rete Elettrica Nazionale SpA 107,135,740 7.56
403,015,268 28.44
Luxembourg - 4.79% (31 March 2019: 4.29%)
4,581,235 SES SA Receipt - Class A 67,816,042 4.79
Portugal - 1.38% (31 March 2019: 1.44%)
8,625,138 REN - Redes Energeticas Nacionais SGPS SA 19,533,635 1.38
Spain - 4.53% (31 March 2019: 2.92%)
2,739,868 Ferrovial SA 64,256,213 4.53
United Kingdom - 21.14% (31 March 2019: 20.73%)
12,802,653 National Grid Plc 112,899,248 7.97
6,248,613 Pennon Group Plc 51,668,637 3.64
3,034,214 Severn Trent Plc 65,715,957 4.64
8,388,239 United Utilities Group Plc 69,246,104 4.89
299,529,946 21.14
United States - 15.67% (31 March 2019: 14.76%)
768,799 CSX Corp 43,215,700 3.05
326,204 Kansas City Southern 35,209,279 2.49
765,573 Norfolk Southern Corp 111,614,741 7.88
243,000 Union Pacific Corp 31,941,199 2.25
221,980,919 15.67
Total Common Stock - (Cost GBP 1,221,969,779) 1,381,185,026 97.48
Total Investments - (Cost GBP 1,221,969,779) 1,381,185,026 97.48
15/10/19 CHF 591,783 GBP 477,328 4,604 0.00
15/10/19 CHF 38,630,771 GBP 31,862,289 (402,456) (0.02)
15/10/19 EUR 30,095 GBP 26,525 114 0.00
15/10/19 EUR 222,899,188 GBP 200,297,248 (2,989,754) (0.21)
15/10/19 GBP 337,301 CHF 412,496 1,377 0.00
15/10/19 GBP 500,916 CHF 616,425 (1,085) (0.00)
15/10/19 GBP 46,754 CHF 57,173 193 0.00
15/10/19 GBP 73,943 CHF 90,982 (151) (0.00)
15/10/19 GBP 5,073,940 EUR 5,697,469 30,615 0.00
15/10/19 GBP 1,565 EUR 1,777 (6) (0.00)
15/10/19 GBP 71,947 EUR 80,783 438 0.00
15/10/19 GBP 300,625 JPY 39,944,392 567 0.00
15/10/19 GBP 526,042 JPY 70,633,917 (4,553) (0.00)
15/10/19 GBP 43,638 USD 53,757 44 0.00
15/10/19 GBP 20,936,421 USD 25,912,857 (77,691) (0.00)
15/10/19 GBP 41,501 USD 51,483 (250) (0.00)
15/10/19 JPY 88,070,699 GBP 657,612 3,966 0.00
15/10/19 JPY 4,047,522,859 GBP 30,863,700 (459,084) (0.03)
15/10/19 USD 11,643,762 GBP 9,412,800 29,744 0.00
15/10/19 USD 263,161,193 GBP 214,005,256 (593,875) (0.05)
15/10/19 USD 548,273 GBP 443,120 1,505 0.00
15/10/19 USD 9,656,329 GBP 7,852,621 (21,791) (0.00)
27/12/19 AUD 65,706,096 GBP 36,026,178 (99,853) (0.00)
27/12/19 CAD 1,115,141 GBP 671,518 10,430 0.00
27/12/19 GBP 105,945,172 AUD 194,713,797 (519,091) (0.04)
27/12/19 GBP 15,017,939 CAD 24,939,195 (233,250) (0.02)
27/12/19 GBP 692,053,087 EUR 779,183,448 420,138 0.04
27/12/19 GBP 59,310,251 HKD 582,026,106 (755,171) (0.06)
27/12/19 GBP 226,234,863 USD 283,180,486 (2,696,303) (0.20)
Unrealised gain on forward foreign currency exchange contracts 503,735 0.04
Unrealised loss on forward foreign currency exchange contracts (8,854,364) (0.63)
Net unrealised loss on forward foreign currency exchange contracts (8,350,629) (0.59)
Financial assets and financial liabilities at fair value 1,372,834,397 96.89
Other Net Assets 44,060,980 3.11
Net Assets 1,416,895,377 100.00
The counterparties for the open forward foreign currency exchange contracts are:
- BNP Paribas Securities Corp
- Citigroup Global Markets Inc
- HSBC Bank USA
- JPMorgan Chase Bank N.A.
- RBC Capital Markets LLC
- State Street Global Markets Corp.
- The Bank of New York Mellon

LA
ZA
RD
GL
OB
AL
AC
TIV
E F
UN
DS
PL
C
93Lazard Global Active Funds plc Financial period ended 30 September 2019
Portfolios of Investments (Unaudited) (continued)
Lazard Global Strategic Equity FundPortfolio of Investments as at 30 September 2019
Australia - 0.85% (31 March 2019: 1.06%)
1,451 Rio Tinto Plc 75,537 0.85
Canada - 6.55% (31 March 2019: 3.14%)
9,265 CAE Inc 235,539 2.64
3,927 Suncor Energy Inc 123,947 1.39
1,274 TMX Group Ltd 110,019 1.23
2,386 Toromont Industries Ltd 115,333 1.29
584,838 6.55
China - 2.58% (31 March 2019: 3.67%)
692 Alibaba Group Holding Ltd ADR 115,723 1.30
2,700 Tencent Holdings Ltd 114,562 1.28
230,285 2.58
Denmark - 1.34% (31 March 2019: 1.28%)
587 Genmab A/S 119,339 1.34
France - 5.96% (31 March 2019: 5.28%)
8,829 Engie SA 144,279 1.62
970 Safran SA 152,946 1.71
469 Ubisoft Entertainment SA 33,928 0.38
7,322 Vivendi SA 201,124 2.25
532,277 5.96
Germany - 4.11% (31 March 2019: 0.95%)
763 Beiersdorf AG 90,046 1.01
5,046 Infineon Technologies AG 90,727 1.01
2,046 Scout24 AG '144A' 116,715 1.31
2,600 TeamViewer AG 69,984 0.78
367,472 4.11
Hong Kong - 1.55% (31 March 2019: 3.22%)
14,786 AIA Group Ltd 138,709 1.55
Ireland - 0.55% (31 March 2019: 0.68%)
4,272 Ryanair Holdings Plc 49,244 0.55
Israel - 1.48% (31 March 2019: 1.50%)
18,520 Bank Leumi Le-Israel BM 131,840 1.48
Japan - 4.57% (31 March 2019: 4.64%)
2,800 Digital Garage Inc 89,850 1.01
6,200 Nexon Co Ltd 75,281 0.84
1,700 Suzuki Motor Corp 72,245 0.81
1,500 TechnoPro Holdings Inc 88,974 1.00
1,800 Toei Animation Co Ltd 81,738 0.91
408,088 4.57
Netherlands - 1.48% (31 March 2019: 0.00%)
1,097 Koninklijke DSM NV 131,989 1.48
New Zealand - 0.98% (31 March 2019: 1.18%)
3,498 Mainfreight Ltd 87,420 0.98
South Africa - 0.70% (31 March 2019: 2.10%)
12,733 Sanlam Ltd 62,723 0.70
South Korea - 1.07% (31 March 2019: 0.40%)
1,391 SK Hynix Inc 95,655 1.07
Switzerland - 4.79% (31 March 2019: 4.88%)
1,120 Alcon Inc 65,424 0.73
1,727 Novartis AG 150,064 1.68
169 Partners Group Holding AG 129,755 1.45
310 Swatch Group AG/The 82,511 0.93
427,754 4.79
Taiwan - 0.96% (31 March 2019: 0.00%)
15,000 Merida Industry Co Ltd 85,964 0.96
United Kingdom - 6.00% (31 March 2019: 8.29%)
2,675 Coca-Cola European Partners Plc 149,280 1.67
12,423 Informa Plc 130,405 1.46
4,500 Prudential Plc 81,907 0.92
7,324 RELX Plc 174,263 1.95
535,855 6.00
United States - 51.39% (31 March 2019: 53.76%)
924 Accenture Plc - Class A 177,731 1.99
357 Alphabet Inc - Class A 435,947 4.88
1,210 Aon Plc 234,220 2.62
5,305 Bank of America Corp 154,747 1.73
1,664 Baxter International Inc 145,550 1.63
4,444 Coca-Cola Co/The 241,931 2.71
3,110 CoreLogic Inc/United States 143,900 1.61
1,154 Danaher Corp 166,672 1.87
528 Deere & Co 89,063 1.00
930 Dollar General Corp 147,814 1.65
5,551 Elanco Animal Health Inc 147,601 1.65
1,477 Electronic Arts Inc 144,480 1.62
768 EOG Resources Inc 57,001 0.64
784 Fidelity National Information Services Inc 104,084 1.17
3,297 Intercontinental Exchange Inc 304,214 3.41
319 IPG Photonics Corp 43,257 0.48
1,689 IQVIA Holdings Inc 252,303 2.82
1,686 Medtronic Plc 183,133 2.05
2,332 Microsoft Corp 324,218 3.63
671 Palo Alto Networks Inc 136,770 1.53
1,332 PTC Inc 90,816 1.02
841 Raytheon Co 164,996 1.85
915 S&P Global Inc 224,157 2.51
505 Union Pacific Corp 81,800 0.92
1,370 Visa Inc - Class A 235,654 2.64
1,260 Zoetis Inc 156,983 1.76
4,589,042 51.39
Total Common Stock - (Cost USD 7,515,977) 8,654,031 96.91
Total Investments - (Cost USD 7,515,977) 8,654,031 96.91
Other Net Assets 276,060 3.09
Net Assets 8,930,091 100.00
ADR - American Depositary Receipt
Shares Fair Value USD
% of NAV
Common Stock - 96.91% (31 March 2019: 99.21%)
Shares Fair Value USD
% of NAV
Common Stock - 96.91% (31 March 2019: 99.21%) (continued)

LA
ZA
RD
GL
OB
AL
AC
TIV
E F
UN
DS
PL
C
94
Portfolios of Investments (Unaudited) (continued)
Lazard Global Active Funds plc Financial period ended 30 September 2019
Analysis of Total Assets % of Total AssetsTransferable securities admitted to an official stock exchange listing or traded on a regulated market 96.47
Other assets 3.53
Total Assets 100.00
Lazard Global Strategic Equity Fund (continued)Portfolio of Investments as at 30 September 2019

LA
ZA
RD
GL
OB
AL
AC
TIV
E F
UN
DS
PL
C
95Lazard Global Active Funds plc Financial period ended 30 September 2019
Portfolios of Investments (Unaudited) (continued)
Lazard Global Equity Select FundPortfolio of Investments as at 30 September 2019
Shares Fair Value USD
% of NAV
Common Stock - 97.00% (31 March 2019: 97.03%)
Shares Fair Value USD
% of NAV
Common Stock - 97.00% (31 March 2019: 97.03%) (continued)
Belgium - 1.65% (31 March 2019: 1.49%)
2,702 Anheuser-Busch InBev SA/NV 257,288 1.65
Canada - 5.47% (31 March 2019: 4.08%)
6,385 CAE Inc 162,322 1.03
2,991 Canadian National Railway Co 268,732 1.72
5,235 Dollarama Inc 187,531 1.20
4,777 National Bank of Canada 237,835 1.52
856,420 5.47
China - 2.32% (31 March 2019: 2.19%)
651 Alibaba Group Holding Ltd ADR 108,866 0.70
5,986 Tencent Holdings Ltd 253,989 1.62
362,855 2.32
Finland - 0.82% (31 March 2019: 1.92%)
3,239 Sampo Oyj - Class A 128,886 0.82
France - 1.00% (31 March 2019: 1.27%)
2,154 Ubisoft Entertainment SA 155,820 1.00
Germany - 1.15% (31 March 2019: 1.10%)
1,847 Symrise AG - Class A 179,547 1.15
Hong Kong - 2.92% (31 March 2019: 3.23%)
27,790 AIA Group Ltd 260,701 1.66
9,100 Hang Seng Bank Ltd 196,834 1.26
457,535 2.92
Israel - 1.25% (31 March 2019: 1.15%)
27,377 Bank Leumi Le-Israel BM 194,892 1.25
Japan - 5.36% (31 March 2019: 6.65%)
5,373 Daiwa House Industry Co Ltd 175,148 1.12
6,100 Kansai Paint Co Ltd 142,642 0.91
2,232 Kao Corp 165,609 1.06
3,252 TechnoPro Holdings Inc 192,895 1.23
3,600 Yamaha Corp 162,938 1.04
839,232 5.36
Netherlands - 2.60% (31 March 2019: 2.49%)
5,566 Wolters Kluwer NV 406,613 2.60
Singapore - 1.37% (31 March 2019: 1.54%)
27,280 Oversea-Chinese Banking Corp Ltd 214,873 1.37
South Africa - 1.45% (31 March 2019: 1.50%)
15,353 Distell Group Holdings Ltd 137,720 0.88
17,994 Sanlam Ltd 88,639 0.57
226,359 1.45
Sweden - 3.05% (31 March 2019: 3.14%)
5,883 Assa Abloy AB 131,214 0.84
17,895 Epiroc AB 194,514 1.24
3,136 Hexagon AB 151,716 0.97
477,444 3.05
Switzerland - 4.14% (31 March 2019: 2.69%)
8,728 ABB Ltd 171,582 1.09
1,654 Alcon Inc 96,618 0.62
Switzerland - 4.14% (31 March 2019: 2.69%) (continued)
2,497 Novartis AG 216,971 1.39
212 Partners Group Holding AG 162,769 1.04
647,940 4.14
Taiwan - 1.14% (31 March 2019: 0.96%)
3,833 Taiwan Semiconductor Manufacturing Co Ltd ADR 178,158 1.14
United Kingdom - 11.69% (31 March 2019: 12.09%)
4,117 Bunzl Plc 107,878 0.69
4,175 Coca-Cola European Partners Plc 231,504 1.48
8,361 Compass Group Plc 215,607 1.38
8,581 Diageo Plc 351,921 2.25
10,950 Prudential Plc 199,307 1.27
12,631 RELX Plc 300,534 1.92
5,574 Unilever Plc 335,905 2.15
4,909 Weir Group Plc/The 86,341 0.55
1,828,997 11.69
United States - 49.62% (31 March 2019: 48.05%)
1,684 Accenture Plc - Class A 323,917 2.07
367 Alphabet Inc - Class A 448,158 2.86
2,074 Aon Plc 401,464 2.57
5,775 Boston Scientific Corp 234,985 1.50
4,121 Cisco Systems Inc 203,619 1.30
7,406 Coca-Cola Co/The 403,183 2.58
3,100 CoreLogic Inc/United States 143,437 0.92
1,285 Dollar General Corp 204,238 1.31
3,630 E*TRADE Financial Corp 158,595 1.01
1,785 Honeywell International Inc 302,022 1.93
3,518 Intercontinental Exchange Inc 324,606 2.07
2,651 IQVIA Holdings Inc 396,006 2.53
2,545 Johnson & Johnson 329,272 2.10
1,490 Kimberly-Clark Corp 211,654 1.35
1,330 Lowe's Cos Inc 146,247 0.94
1,335 McDonald's Corp 286,638 1.83
3,612 Microsoft Corp 502,176 3.21
1,797 Motorola Solutions Inc 306,227 1.96
2,205 Procter & Gamble Co/The 274,258 1.75
2,425 PTC Inc 165,336 1.06
1,488 Rockwell Automation Inc 245,222 1.57
1,121 S&P Global Inc 274,623 1.76
1,890 Texas Instruments Inc 244,264 1.56
1,557 Thermo Fisher Scientific Inc 453,507 2.90
2,068 Visa Inc - Class A 355,717 2.27
3,398 Zoetis Inc 423,357 2.71
7,762,728 49.62
Total Common Stock - (Cost USD 12,103,082) 15,175,587 97.00
Total Investments - (Cost USD 12,103,082) 15,175,587 97.00
Other Net Assets 470,020 3.00
Net Assets 15,645,607 100.00
ADR - American Depositary Receipt

LA
ZA
RD
GL
OB
AL
AC
TIV
E F
UN
DS
PL
C
96
Portfolios of Investments (Unaudited) (continued)
Lazard Global Active Funds plc Financial period ended 30 September 2019
Lazard Global Equity Select Fund (continued)Portfolio of Investments as at 30 September 2019
Analysis of Total Assets % of Total AssetsTransferable securities admitted to an official stock exchange listing or traded on a regulated market 94.66
Other assets 5.34
Total Assets 100.00

LA
ZA
RD
GL
OB
AL
AC
TIV
E F
UN
DS
PL
C
97Lazard Global Active Funds plc Financial period ended 30 September 2019
Portfolios of Investments (Unaudited) (continued)
Lazard Global Managed Volatility FundPortfolio of Investments as at 30 September 2019
Shares Fair Value USD
% of NAV
Common Stock - 99.24% (31 March 2019: 97.82%)
Shares Fair Value USD
% of NAV
Common Stock - 99.24% (31 March 2019: 97.82%) (continued)
Australia - 5.96% (31 March 2019: 5.59%)
127,764 AGL Energy Ltd 1,649,938 0.78
21,229 BHP Group Ltd 525,193 0.25
3,642 Cochlear Ltd 512,113 0.24
11,565 CSL Ltd 1,826,156 0.86
190,401 Evolution Mining Ltd 577,602 0.27
39,658 JB Hi-Fi Ltd 910,413 0.43
304,864 Qantas Airways Ltd 1,295,431 0.61
154,015 Regis Resources Ltd 505,050 0.24
16,032 Rio Tinto Ltd 1,007,566 0.47
16,991 Rio Tinto Plc 884,521 0.42
141,345 Sandfire Resources NL 628,503 0.29
229,198 Saracen Mineral Holdings Ltd 528,752 0.25
247,505 Shopping Centres Australasia Property Group (Units) (REIT) 435,873 0.20
55,024 Woolworths Group Ltd 1,385,286 0.65
12,672,397 5.96
Belgium - 1.23% (31 March 2019: 1.11%)
17,445 Colruyt SA 956,108 0.45
35,327 Proximus SADP 1,049,819 0.49
8,482 UCB SA 616,050 0.29
2,621,977 1.23
Canada - 7.15% (31 March 2019: 7.98%)
25,473 Air Canada - Class B 831,318 0.39
49,996 Alimentation Couche-Tard Inc - Class B 1,533,077 0.72
17,516 Canadian Utilities Ltd 516,605 0.24
27,364 CGI Inc 2,165,099 1.02
8,274 Colliers International Group Inc 621,787 0.29
468 Constellation Software Inc/Canada 467,690 0.22
1,446 Fairfax Financial Holdings Ltd 637,799 0.30
15,521 Granite Real Estate Investment Trust (Units) (REIT) 752,002 0.35
64,947 H&R Real Estate Investment Trust (Units) (REIT) 1,134,586 0.53
16,653 Kirkland Lake Gold Ltd 746,476 0.35
66,683 Northland Power Inc 1,280,246 0.60
55,241 Rogers Communications Inc 2,692,316 1.27
40,459 Teck Resources Ltd 656,375 0.31
7,902 Toronto-Dominion Bank/The 461,040 0.22
73,591 Tourmaline Oil Corp 728,669 0.34
15,225,085 7.15
Denmark - 1.00% (31 March 2019: 0.63%)
6,613 Coloplast A/S 797,389 0.37
14,857 H Lundbeck A/S 493,052 0.23
9,580 SimCorp A/S 841,934 0.40
2,132,375 1.00
France - 1.47% (31 March 2019: 1.66%)
63,304 Electricite de France SA 708,602 0.33
913 Hermes International 631,634 0.30
341 Ipsen SA 32,374 0.02
52,806 Orange SA 829,048 0.39
17,600 TOTAL SA 916,459 0.43
3,118,117 1.47
Germany - 1.73% (31 March 2019: 1.07%)
5,162 Allianz SE 1,204,025 0.57
7,657 Muenchener Rueckversicherungs-Gesellschaft AG in Muenchen 1,981,481 0.93
3,924 Rheinmetall AG 496,816 0.23
3,682,322 1.73
Hong Kong - 1.33% (31 March 2019: 0.64%)
53,500 CK Hutchison Holdings Ltd 470,237 0.22
10,000 Jardine Matheson Holdings Ltd 536,366 0.25
196,000 Swire Pacific Ltd 1,826,135 0.86
2,832,738 1.33
Israel - 1.25% (31 March 2019: 1.13%)
75,869 Bank Leumi Le-Israel BM 540,097 0.25
482,579 Israel Discount Bank Ltd 2,123,101 1.00
2,663,198 1.25
Italy - 2.56% (31 March 2019: 3.48%)
425,328 Enel SpA 3,178,711 1.49
120,984 Hera SpA 497,105 0.23
67,888 Italgas SpA 438,665 0.21
117,211 Poste Italiane SpA '144A' 1,334,467 0.63
5,448,948 2.56
Japan - 7.33% (31 March 2019: 6.66%)
14,700 ANA Holdings Inc 494,583 0.23
49,000 Dai-ichi Life Holdings Inc 744,959 0.35
9,000 Daito Trust Construction Co Ltd 1,154,414 0.54
49,000 Daiwa House Industry Co Ltd 1,597,288 0.75
7,900 East Japan Railway Co 756,087 0.36
51,400 Fuji Media Holdings Inc 665,096 0.31
12,200 FUJIFILM Holdings Corp 537,905 0.25
128,200 Hachijuni Bank Ltd/The 524,936 0.25
21,600 Japan Airlines Co Ltd 642,298 0.30
108,700 Japan Post Holdings Co Ltd 1,004,310 0.47
135 Japan Prime Realty Investment Corp (REIT) 641,125 0.30
24,500 McDonald's Holdings Co Japan Ltd 1,185,950 0.56
21,600 Mitsubishi Heavy Industries Ltd 850,044 0.40
12,000 Nissan Chemical Corp 501,904 0.24
115,600 NTT DOCOMO Inc 2,953,169 1.39
34,800 Seven & i Holdings Co Ltd 1,336,061 0.63
15,590,129 7.33
Netherlands - 0.70% (31 March 2019: 0.99%)
35,535 Koninklijke Ahold Delhaize NV 889,122 0.42
20,221 Royal Dutch Shell Plc 592,367 0.28
1,481,489 0.70
Norway - 1.68% (31 March 2019: 2.96%)
21,823 Equinor ASA 414,486 0.20
76,090 Leroy Seafood Group ASA 462,760 0.22
56,748 Orkla ASA 517,340 0.24
18,395 Salmar ASA 808,665 0.38
68,287 Telenor ASA 1,371,939 0.64
3,575,190 1.68
Puerto Rico - 0.18% (31 March 2019: 0.00%)
12,585 EVERTEC Inc 392,904 0.18

LA
ZA
RD
GL
OB
AL
AC
TIV
E F
UN
DS
PL
C
98
Portfolios of Investments (Unaudited) (continued)
Lazard Global Active Funds plc Financial period ended 30 September 2019
Lazard Global Managed Volatility Fund (continued)Portfolio of Investments as at 30 September 2019
Shares Fair Value USD
% of NAV
Common Stock - 99.24% (31 March 2019: 97.82%) (continued)
Shares Fair Value USD
% of NAV
Common Stock - 99.24% (31 March 2019: 97.82%) (continued)
Singapore - 0.56% (31 March 2019: 1.13%)
37,500 Jardine Cycle & Carriage Ltd 815,863 0.38
135,300 Singapore Technologies Engineering Ltd 375,803 0.18
1,191,666 0.56
South Africa - 0.49% (31 March 2019: 0.52%)
45,422 Anglo American Plc 1,048,748 0.49
Spain - 0.72% (31 March 2019: 0.34%)
4,155 Corp Financiera Alba SA 202,474 0.09
128,222 Iberdrola SA 1,332,809 0.63
1,535,283 0.72
Sweden - 0.20% (31 March 2019: 0.31%)
20,487 Axfood AB 435,811 0.20
Switzerland - 4.18% (31 March 2019: 2.60%)
4,627 Helvetia Holding AG 639,209 0.30
25,465 Novartis AG 2,212,725 1.04
557 Partners Group Holding AG 427,653 0.20
12,770 Roche Holding AG 3,727,378 1.75
10,914 Swatch Group AG/The 549,804 0.26
1,569 Swisscom AG 774,548 0.37
1,464 Zurich Insurance Group AG 560,707 0.26
8,892,024 4.18
United Kingdom - 3.15% (31 March 2019: 5.28%)
33,451 Admiral Group Plc 873,272 0.41
136,566 Auto Trader Group Plc '144A' 858,132 0.40
45,221 Britvic Plc 548,034 0.26
51,592 Compass Group Plc 1,330,417 0.63
82,944 Howden Joinery Group Plc 572,685 0.27
63,683 International Consolidated Airlines Group SA 372,758 0.17
1,266,389 Lloyds Banking Group Plc 846,413 0.40
35,002 RELX Plc 832,302 0.39
60,294 SSP Group Plc 460,594 0.22
6,694,607 3.15
United States - 56.37% (31 March 2019: 53.07%)
6,435 3M Co 1,057,914 0.50
11,586 AbbVie Inc 877,292 0.41
40,219 Aflac Inc 2,104,258 0.99
5,585 Akamai Technologies Inc 510,357 0.24
18,764 Altria Group Inc 767,448 0.36
9,699 American Express Co 1,147,198 0.54
9,403 American States Water Co 844,954 0.40
2,974 American Tower Corp (REIT) 657,641 0.31
6,495 AmerisourceBergen Corp - Class A 534,733 0.25
5,197 Amgen Inc 1,005,672 0.47
17,256 Aon Plc 3,340,244 1.57
1,107 AutoZone Inc 1,200,674 0.56
36,477 AXA Equitable Holdings Inc 808,330 0.38
30,433 Bristol-Myers Squibb Co 1,543,257 0.73
20,003 BRP Inc 778,801 0.37
4,423 Burlington Stores Inc 883,804 0.42
551 Cable One Inc 691,340 0.33
14,334 Cadence Design Systems Inc 947,191 0.45
United States - 56.37% (31 March 2019: 53.07%) (continued)
7,386 Cboe Global Markets Inc 848,725 0.40
7,126 CDW Corp/DE 878,208 0.41
10,989 Church & Dwight Co Inc 826,812 0.39
4,477 Cigna Corp 679,564 0.32
44,801 Coca-Cola Co/The 2,438,967 1.15
29,063 Colgate-Palmolive Co 2,136,421 1.00
15,808 Comcast Corp 712,625 0.34
8,670 Comerica Inc 572,133 0.27
19,399 Darden Restaurants Inc 2,293,350 1.08
20,924 Edison International 1,578,088 0.74
23,037 Eli Lilly & Co 2,576,228 1.21
21,205 Encompass Health Corp 1,341,852 0.63
20,416 Estee Lauder Cos Inc/The - Class A 4,061,763 1.91
11,382 F5 Networks Inc 1,598,261 0.75
2,364 FactSet Research Systems Inc 574,381 0.27
20,076 H&R Block Inc 474,195 0.22
4,270 HCA Healthcare Inc 514,193 0.24
5,749 HEICO Corp - Class A 559,435 0.26
26,440 Hershey Co/The 4,097,936 1.93
7,265 Honeywell International Inc 1,229,238 0.58
16,846 Intel Corp 868,074 0.41
9,011 Intercontinental Exchange Inc 831,445 0.39
5,029 Intuit Inc 1,337,412 0.63
3,139 IQVIA Holdings Inc 468,904 0.22
24,508 Johnson & Johnson 3,170,845 1.49
11,075 Kimberly-Clark Corp 1,573,204 0.74
4,739 Lockheed Martin Corp 1,848,494 0.87
8,474 LPL Financial Holdings Inc 694,021 0.33
3,710 Lululemon Athletica Inc 714,286 0.34
9,631 McGrath RentCorp 670,221 0.32
7,177 Mellanox Technologies Ltd 786,527 0.37
32,041 Merck & Co Inc 2,697,211 1.27
14,927 MetLife Inc 703,957 0.33
24,352 Morgan Stanley 1,039,100 0.49
3,974 Morningstar Inc 580,760 0.27
7,778 Nasdaq Inc 772,744 0.36
31,331 National Retail Properties Inc (REIT) 1,767,068 0.83
28,111 NIKE Inc 2,640,185 1.24
17,262 Nordstrom Inc 581,212 0.27
3,545 Northrop Grumman Corp 1,328,631 0.63
20,134 Occidental Petroleum Corp 895,359 0.42
13,070 Omnicom Group Inc 1,023,381 0.48
22,510 PepsiCo Inc 3,086,121 1.45
7,663 Philip Morris International Inc 581,852 0.27
21,432 Pinnacle West Capital Corp 2,080,404 0.98
41,119 Premier Inc - Class A 1,189,162 0.56
30,498 Procter & Gamble Co/The 3,793,341 1.78
10,011 Progressive Corp/The 773,350 0.36
12,065 Public Service Enterprise Group Inc 748,995 0.35
2,605 Raytheon Co 511,075 0.24
32,304 Republic Services Inc - Class A 2,795,911 1.31
7,172 Ross Stores Inc 787,844 0.37
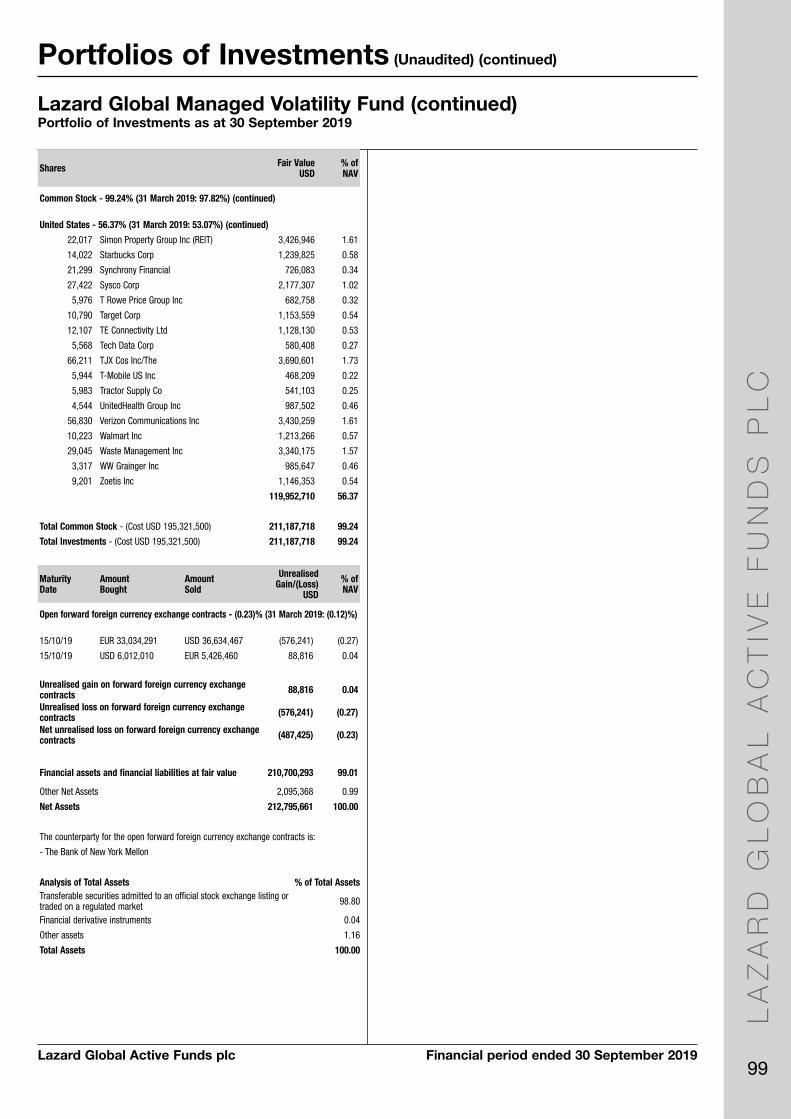
LA
ZA
RD
GL
OB
AL
AC
TIV
E F
UN
DS
PL
C
99Lazard Global Active Funds plc Financial period ended 30 September 2019
Portfolios of Investments (Unaudited) (continued)
United States - 56.37% (31 March 2019: 53.07%) (continued)
22,017 Simon Property Group Inc (REIT) 3,426,946 1.61
14,022 Starbucks Corp 1,239,825 0.58
21,299 Synchrony Financial 726,083 0.34
27,422 Sysco Corp 2,177,307 1.02
5,976 T Rowe Price Group Inc 682,758 0.32
10,790 Target Corp 1,153,559 0.54
12,107 TE Connectivity Ltd 1,128,130 0.53
5,568 Tech Data Corp 580,408 0.27
66,211 TJX Cos Inc/The 3,690,601 1.73
5,944 T-Mobile US Inc 468,209 0.22
5,983 Tractor Supply Co 541,103 0.25
4,544 UnitedHealth Group Inc 987,502 0.46
56,830 Verizon Communications Inc 3,430,259 1.61
10,223 Walmart Inc 1,213,266 0.57
29,045 Waste Management Inc 3,340,175 1.57
3,317 WW Grainger Inc 985,647 0.46
9,201 Zoetis Inc 1,146,353 0.54
119,952,710 56.37
Total Common Stock - (Cost USD 195,321,500) 211,187,718 99.24
Total Investments - (Cost USD 195,321,500) 211,187,718 99.24
Shares Fair Value USD
% of NAV
Common Stock - 99.24% (31 March 2019: 97.82%) (continued)
Lazard Global Managed Volatility Fund (continued)Portfolio of Investments as at 30 September 2019
Maturity Date
Amount Bought
Amount Sold
Unrealised Gain/(Loss)
USD
% of NAV
Open forward foreign currency exchange contracts - (0.23)% (31 March 2019: (0.12)%)
15/10/19 EUR 33,034,291 USD 36,634,467 (576,241) (0.27)
15/10/19 USD 6,012,010 EUR 5,426,460 88,816 0.04
Unrealised gain on forward foreign currency exchange contracts 88,816 0.04
Unrealised loss on forward foreign currency exchange contracts (576,241) (0.27)
Net unrealised loss on forward foreign currency exchange contracts (487,425) (0.23)
Financial assets and financial liabilities at fair value 210,700,293 99.01
Other Net Assets 2,095,368 0.99
Net Assets 212,795,661 100.00
The counterparty for the open forward foreign currency exchange contracts is:
- The Bank of New York Mellon
Analysis of Total Assets % of Total AssetsTransferable securities admitted to an official stock exchange listing or traded on a regulated market 98.80
Financial derivative instruments 0.04
Other assets 1.16
Total Assets 100.00

LA
ZA
RD
GL
OB
AL
AC
TIV
E F
UN
DS
PL
C
100
Portfolios of Investments (Unaudited) (continued)
Lazard Global Active Funds plc Financial period ended 30 September 2019
Lazard Thematic Global FundPortfolio of Investments as at 30 September 2019
Canada - 4.05% (31 March 2019: 4.68%)
11,089 Agnico Eagle Mines Ltd (Units) 594,481 0.93
38,304 Barrick Gold Corp 663,808 1.04
14,801 Kirkland Lake Gold Ltd 663,460 1.04
13,397 Nutrien Ltd 668,243 1.04
2,589,992 4.05
China - 2.86% (31 March 2019: 3.68%)
2,881 Alibaba Group Holding Ltd ADR 481,790 0.75
65,000 Ping An Insurance Group Co of China Ltd 'H' 752,062 1.18
14,000 Tencent Holdings Ltd 594,026 0.93
1,827,878 2.86
France - 3.77% (31 March 2019: 4.40%)
6,314 EssilorLuxottica SA 911,043 1.42
1,157 L'Oreal SA 324,273 0.51
5,152 Safran SA 812,350 1.27
5,019 Ubisoft Entertainment SA 363,073 0.57
2,410,739 3.77
Germany - 3.35% (31 March 2019: 3.05%)
6,856 Beiersdorf AG 809,115 1.27
5,839 SAP SE 686,612 1.07
16,462 Siemens Healthineers AG '144A' 647,781 1.01
2,143,508 3.35
Hong Kong - 1.35% (31 March 2019: 2.76%)
92,000 AIA Group Ltd 863,063 1.35
India - 2.77% (31 March 2019: 3.20%)
13,586 HDFC Bank Ltd ADR 775,081 1.21
59,958 ICICI Bank Ltd ADR 730,289 1.14
11,684 MakeMyTrip Ltd 265,110 0.42
1,770,480 2.77
Indonesia - 0.66% (31 March 2019: 0.50%)
1,448,100 Bank Rakyat Indonesia Persero Tbk PT 420,538 0.66
Japan - 8.35% (31 March 2019: 6.69%)
2,200 FANUC Corp 417,533 0.65
39,400 Kansai Paint Co Ltd 921,329 1.44
9,600 Kao Corp 712,296 1.11
1,200 Keyence Corp 747,991 1.17
34,700 Nexon Co Ltd 421,333 0.66
12,900 Seven & i Holdings Co Ltd 495,264 0.78
14,400 Sony Corp 846,543 1.33
11,500 Sysmex Corp 773,341 1.21
5,335,630 8.35
Netherlands - 3.55% (31 March 2019: 3.15%)
3,140 ASML Holding NV 779,528 1.22
24,198 Royal Dutch Shell Plc 707,527 1.11
10,693 Wolters Kluwer NV 781,156 1.22
2,268,211 3.55
Norway - 1.04% (31 March 2019: 0.51%)
35,043 Equinor ASA 665,575 1.04
Peru - 0.87% (31 March 2019: 0.00%)
2,660 Credicorp Ltd 554,450 0.87
Singapore - 1.01% (31 March 2019: 1.08%)
35,800 DBS Group Holdings Ltd 644,892 1.01
Spain - 0.78% (31 March 2019: 0.00%)
16,132 Industria de Diseno Textil SA 499,820 0.78
Sweden - 2.26% (31 March 2019: 2.29%)
33,751 Assa Abloy AB 752,778 1.18
14,334 Hexagon AB 693,462 1.08
1,446,240 2.26
Switzerland - 1.39% (31 March 2019: 1.26%)
8,167 Nestle SA 886,699 1.39
United Kingdom - 8.80% (31 March 2019: 8.92%)
108,306 BP Plc 686,307 1.07
13,741 Compass Group Plc 354,343 0.55
19,454 Diageo Plc 797,841 1.25
3,699 Linde Plc 717,509 1.12
40,971 Prudential Plc 745,737 1.17
27,538 RELX Plc 654,818 1.03
154,348 Rentokil Initial Plc 889,572 1.39
12,929 Unilever Plc 779,139 1.22
5,625,266 8.80
United States - 50.62% (31 March 2019: 50.13%)
4,104 Accenture Plc - Class A 789,404 1.24
9,451 Activision Blizzard Inc 500,147 0.78
2,325 Adobe Inc 642,281 1.00
436 Alphabet Inc 531,484 0.83
433 Alphabet Inc - Class A 528,754 0.83
3,328 ANSYS Inc 736,686 1.15
3,901 Aon Plc 755,117 1.18
3,975 Apple Inc 890,281 1.39
4,384 Autodesk Inc 647,517 1.01
15,668 Bank of America Corp 457,036 0.72
12,991 BB&T Corp 693,330 1.08
18,860 Boston Scientific Corp 767,413 1.20
5,657 Chevron Corp 670,920 1.05
15,928 Coca-Cola Co/The 867,120 1.36
6,881 Colgate-Palmolive Co 505,822 0.79
6,613 Danaher Corp 955,116 1.49
4,771 Deere & Co 804,772 1.26
3,341 DuPont de Nemours Inc 238,247 0.37
8,792 Eaton Corp Plc 731,055 1.14
3,418 Ecolab Inc 676,901 1.06
8,081 EOG Resources Inc 599,772 0.94
5,028 Fidelity National Information Services Inc 667,517 1.04
4,837 Honeywell International Inc 818,420 1.28
8,813 Intercontinental Exchange Inc 813,175 1.27
5,113 IQVIA Holdings Inc 763,780 1.20
5,360 Johnson & Johnson 693,477 1.09
18,566 Johnson Controls International plc 814,862 1.28
4,186 Laboratory Corp of America Holdings 703,248 1.10
4,018 M&T Bank Corp 634,723 0.99
Shares Fair Value USD
% of NAV
Common Stock - 97.48% (31 March 2019: 96.30%)
Shares Fair Value USD
% of NAV
Common Stock - 97.48% (31 March 2019: 96.30%) (continued)
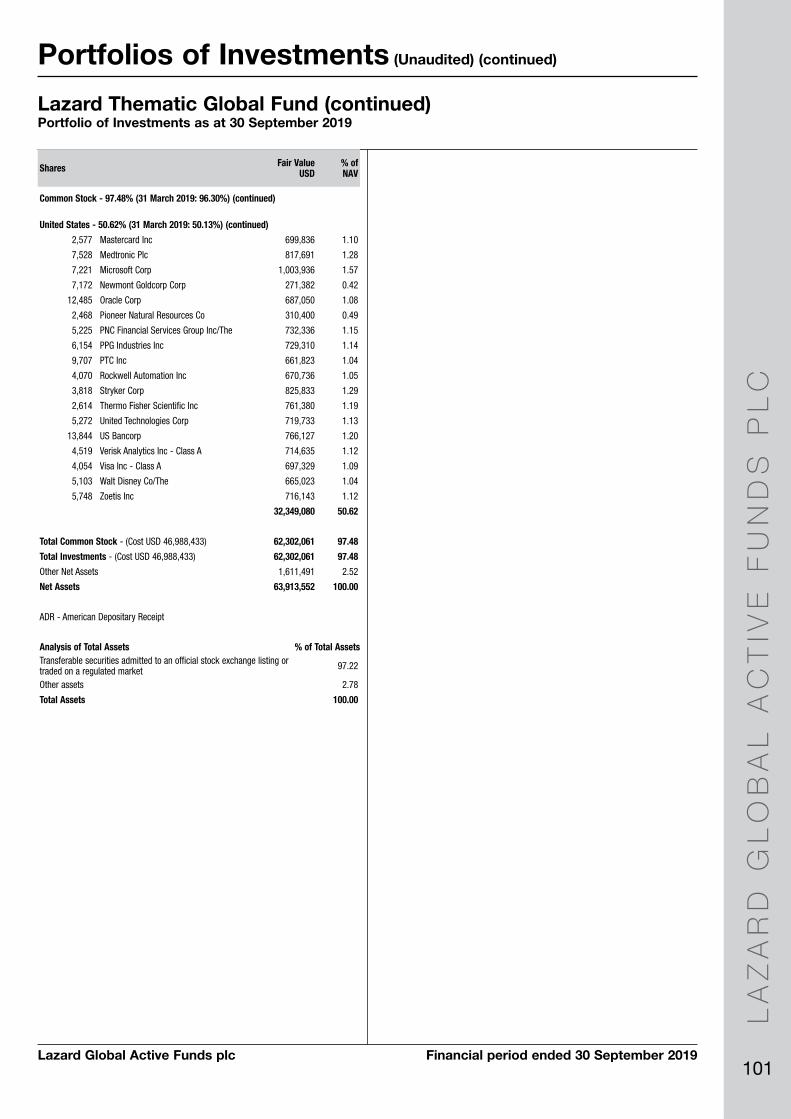
LA
ZA
RD
GL
OB
AL
AC
TIV
E F
UN
DS
PL
C
101Lazard Global Active Funds plc Financial period ended 30 September 2019
Portfolios of Investments (Unaudited) (continued)
United States - 50.62% (31 March 2019: 50.13%) (continued)
2,577 Mastercard Inc 699,836 1.10
7,528 Medtronic Plc 817,691 1.28
7,221 Microsoft Corp 1,003,936 1.57
7,172 Newmont Goldcorp Corp 271,382 0.42
12,485 Oracle Corp 687,050 1.08
2,468 Pioneer Natural Resources Co 310,400 0.49
5,225 PNC Financial Services Group Inc/The 732,336 1.15
6,154 PPG Industries Inc 729,310 1.14
9,707 PTC Inc 661,823 1.04
4,070 Rockwell Automation Inc 670,736 1.05
3,818 Stryker Corp 825,833 1.29
2,614 Thermo Fisher Scientific Inc 761,380 1.19
5,272 United Technologies Corp 719,733 1.13
13,844 US Bancorp 766,127 1.20
4,519 Verisk Analytics Inc - Class A 714,635 1.12
4,054 Visa Inc - Class A 697,329 1.09
5,103 Walt Disney Co/The 665,023 1.04
5,748 Zoetis Inc 716,143 1.12
32,349,080 50.62
Total Common Stock - (Cost USD 46,988,433) 62,302,061 97.48
Total Investments - (Cost USD 46,988,433) 62,302,061 97.48
Other Net Assets 1,611,491 2.52
Net Assets 63,913,552 100.00
ADR - American Depositary Receipt
Shares Fair Value USD
% of NAV
Common Stock - 97.48% (31 March 2019: 96.30%) (continued)
Lazard Thematic Global Fund (continued)Portfolio of Investments as at 30 September 2019
Analysis of Total Assets % of Total AssetsTransferable securities admitted to an official stock exchange listing or traded on a regulated market 97.22
Other assets 2.78
Total Assets 100.00
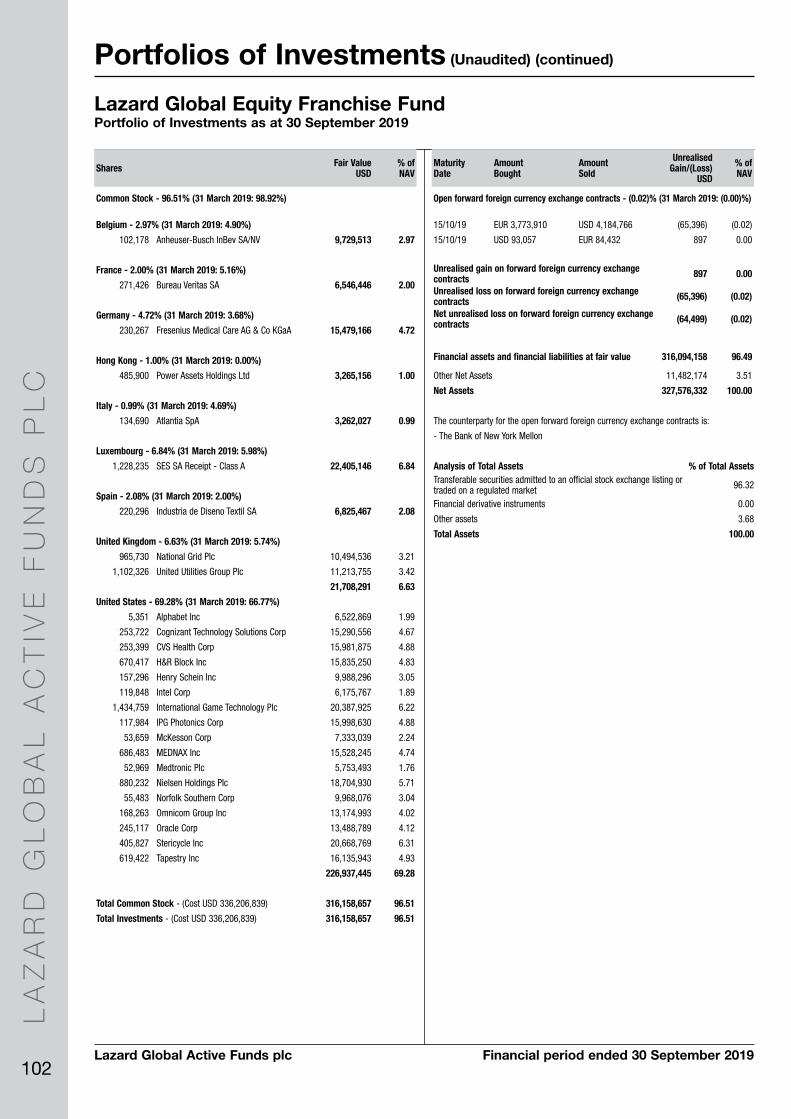
LA
ZA
RD
GL
OB
AL
AC
TIV
E F
UN
DS
PL
C
102
Portfolios of Investments (Unaudited) (continued)
Lazard Global Active Funds plc Financial period ended 30 September 2019
Lazard Global Equity Franchise FundPortfolio of Investments as at 30 September 2019
Shares Fair Value USD
% of NAV
Common Stock - 96.51% (31 March 2019: 98.92%)
Maturity Date
Amount Bought
Amount Sold
Unrealised Gain/(Loss)
USD
% of NAV
Open forward foreign currency exchange contracts - (0.02)% (31 March 2019: (0.00)%)
15/10/19 EUR 3,773,910 USD 4,184,766 (65,396) (0.02)
15/10/19 USD 93,057 EUR 84,432 897 0.00
Unrealised gain on forward foreign currency exchange contracts 897 0.00
Unrealised loss on forward foreign currency exchange contracts (65,396) (0.02)
Net unrealised loss on forward foreign currency exchange contracts (64,499) (0.02)
Financial assets and financial liabilities at fair value 316,094,158 96.49
Other Net Assets 11,482,174 3.51
Net Assets 327,576,332 100.00
The counterparty for the open forward foreign currency exchange contracts is:
- The Bank of New York Mellon
Belgium - 2.97% (31 March 2019: 4.90%)
102,178 Anheuser-Busch InBev SA/NV 9,729,513 2.97
France - 2.00% (31 March 2019: 5.16%)
271,426 Bureau Veritas SA 6,546,446 2.00
Germany - 4.72% (31 March 2019: 3.68%)
230,267 Fresenius Medical Care AG & Co KGaA 15,479,166 4.72
Hong Kong - 1.00% (31 March 2019: 0.00%)
485,900 Power Assets Holdings Ltd 3,265,156 1.00
Italy - 0.99% (31 March 2019: 4.69%)
134,690 Atlantia SpA 3,262,027 0.99
Luxembourg - 6.84% (31 March 2019: 5.98%)
1,228,235 SES SA Receipt - Class A 22,405,146 6.84
Spain - 2.08% (31 March 2019: 2.00%)
220,296 Industria de Diseno Textil SA 6,825,467 2.08
United Kingdom - 6.63% (31 March 2019: 5.74%)
965,730 National Grid Plc 10,494,536 3.21
1,102,326 United Utilities Group Plc 11,213,755 3.42
21,708,291 6.63
United States - 69.28% (31 March 2019: 66.77%)
5,351 Alphabet Inc 6,522,869 1.99
253,722 Cognizant Technology Solutions Corp 15,290,556 4.67
253,399 CVS Health Corp 15,981,875 4.88
670,417 H&R Block Inc 15,835,250 4.83
157,296 Henry Schein Inc 9,988,296 3.05
119,848 Intel Corp 6,175,767 1.89
1,434,759 International Game Technology Plc 20,387,925 6.22
117,984 IPG Photonics Corp 15,998,630 4.88
53,659 McKesson Corp 7,333,039 2.24
686,483 MEDNAX Inc 15,528,245 4.74
52,969 Medtronic Plc 5,753,493 1.76
880,232 Nielsen Holdings Plc 18,704,930 5.71
55,483 Norfolk Southern Corp 9,968,076 3.04
168,263 Omnicom Group Inc 13,174,993 4.02
245,117 Oracle Corp 13,488,789 4.12
405,827 Stericycle Inc 20,668,769 6.31
619,422 Tapestry Inc 16,135,943 4.93
226,937,445 69.28
Total Common Stock - (Cost USD 336,206,839) 316,158,657 96.51
Total Investments - (Cost USD 336,206,839) 316,158,657 96.51
Analysis of Total Assets % of Total AssetsTransferable securities admitted to an official stock exchange listing or traded on a regulated market 96.32
Financial derivative instruments 0.00
Other assets 3.68
Total Assets 100.00

LA
ZA
RD
GL
OB
AL
AC
TIV
E F
UN
DS
PL
C
103Lazard Global Active Funds plc Financial period ended 30 September 2019
Portfolios of Investments (Unaudited) (continued)
Lazard European Equity FundPortfolio of Investments as at 30 September 2019
Shares Fair Value EUR
% of NAV
Common Stock - 95.07% (31 March 2019: 93.63%)
Shares Fair Value EUR
% of NAV
Common Stock - 95.07% (31 March 2019: 93.63%) (continued)
Austria - 2.46% (31 March 2019: 1.08%)
13,195 BAWAG Group AG '144A' 476,162 1.25
9,397 OMV AG 461,882 1.21
938,044 2.46
Belgium - 1.23% (31 March 2019: 2.20%)
5,367 Anheuser-Busch InBev SA/NV 468,772 1.23
China - 1.41% (31 March 2019: 0.00%)
7,977 Prosus NV 537,251 1.41
Denmark - 2.77% (31 March 2019: 3.51%)
4,421 Carlsberg A/S 600,128 1.57
2,454 Genmab A/S 457,631 1.20
1,057,759 2.77
Finland - 2.48% (31 March 2019: 1.85%)
79,764 Nordea Bank Abp 520,037 1.36
11,675 Sampo Oyj - Class A 426,136 1.12
946,173 2.48
France - 30.64% (31 March 2019: 28.47%)
9,400 Air Liquide SA 1,228,809 3.22
4,908 Amundi SA '144A' 314,334 0.82
10,157 Atos SE 657,706 1.72
28,883 AXA SA 677,336 1.78
19,762 Cie de Saint-Gobain 712,208 1.87
67,856 Engie SA 1,017,130 2.67
9,348 Faurecia SE 407,750 1.07
1,964 LVMH Moet Hennessy Louis Vuitton SE 717,289 1.88
51,176 Orange SA 736,986 1.93
8,189 Safran SA 1,184,389 3.10
15,516 Sanofi 1,320,038 3.46
25,682 Societe Generale SA 646,443 1.69
20,393 SPIE SA 374,835 0.98
7,915 Vinci SA 782,736 2.05
36,324 Vivendi SA 915,218 2.40
11,693,207 30.64
Germany - 14.35% (31 March 2019: 12.51%)
6,207 Beiersdorf AG 671,920 1.76
6,750 Delivery Hero SE '144A' 275,103 0.72
14,062 Deutsche Wohnen SE 471,120 1.23
2,563 Knorr-Bremse AG 221,035 0.58
10,824 SAP SE 1,167,500 3.06
18,097 Scout24 AG '144A' 946,944 2.48
9,847 Symrise AG - Class A 878,033 2.30
11,600 TeamViewer AG 286,404 0.75
12,028 Vonovia SE 559,799 1.47
5,477,858 14.35
Ireland - 2.35% (31 March 2019: 3.80%)
12,766 CRH Plc 402,009 1.05
46,781 Ryanair Holdings Plc 494,642 1.30
896,651 2.35
Italy - 3.11% (31 March 2019: 1.63%)
23,521 Cerved Group SpA 188,269 0.49
39,056 FinecoBank Banca Fineco SpA 379,836 0.99
57,275 UniCredit SpA 620,804 1.63
1,188,909 3.11
Luxembourg - 0.63% (31 March 2019: 0.43%)
18,503 ArcelorMittal 239,293 0.63
Netherlands - 7.71% (31 March 2019: 9.70%)
4,090 ASML Holding NV 931,369 2.44
5,067 Euronext NV '144A' 380,015 1.00
8,190 Koninklijke DSM NV 903,878 2.37
11,367 Royal Dutch Shell Plc 304,864 0.80
6,284 Wolters Kluwer NV 421,086 1.10
2,941,212 7.71
Norway - 3.54% (31 March 2019: 2.38%)
45,301 Equinor ASA 789,224 2.07
26,455 Mowi ASA 560,567 1.47
1,349,791 3.54
Portugal - 2.05% (31 March 2019: 1.76%)
56,626 Galp Energia SGPS SA 781,454 2.05
Sweden - 3.28% (31 March 2019: 6.16%)
37,264 Epiroc AB 371,541 0.97
11,050 Hexagon AB 490,359 1.28
14,843 Saab AB 391,655 1.03
1,253,555 3.28
Switzerland - 11.82% (31 March 2019: 11.24%)
41,738 ABB Ltd 752,637 1.97
13,114 Alcon Inc 702,670 1.84
7,035 Cie Financiere Richemont SA 474,663 1.25
8,925 Julius Baer Group Ltd 363,482 0.95
23,809 Novartis AG 1,897,673 4.97
2,769 VAT Group AG '144A' 321,011 0.84
4,512,136 11.82
United Kingdom - 4.26% (31 March 2019: 4.84%)
30,551 RELX Plc 666,773 1.75
36,385 Subsea 7 SA 343,985 0.90
11,151 Unilever NV 614,746 1.61
1,625,504 4.26
United States - 0.98% (31 March 2019: 1.60%)
12,464 QIAGEN NV 374,396 0.98
Total Common Stock - (Cost EUR 33,410,810) 36,281,965 95.07
Preferred Stock - 2.09% (31 March 2019: 2.54%)
Germany - 2.09% (31 March 2019: 2.54%)
13,380 Porsche Automobil Holding SE - Preference 798,617 2.09
Total Preferred Stock - (Cost EUR 968,194) 798,617 2.09
Total Investments - (Cost EUR 34,379,004) 37,080,582 97.16
Other Net Assets 1,082,969 2.84
Net Assets 38,163,551 100.00
Analysis of Total Assets % of Total AssetsTransferable securities admitted to an official stock exchange listing or traded on a regulated market 95.84
Other assets 4.16
Total Assets 100.00

LA
ZA
RD
GL
OB
AL
AC
TIV
E F
UN
DS
PL
C
104
Portfolios of Investments (Unaudited) (continued)
Lazard Global Active Funds plc Financial period ended 30 September 2019
Shares Fair Value EUR
% of NAV
Common Stock - 96.68% (31 March 2019: 94.52%)
Shares Fair Value EUR
% of NAV
Common Stock - 96.68% (31 March 2019: 94.52%) (continued)
Lazard Pan European Equity FundPortfolio of Investments as at 30 September 2019
Australia - 1.37% (31 March 2019: 2.18%)
864 Rio Tinto Plc 41,257 1.37
Austria - 2.16% (31 March 2019: 0.92%)
901 BAWAG Group AG '144A' 32,514 1.08
659 OMV AG 32,391 1.08
64,905 2.16
Belgium - 0.97% (31 March 2019: 1.77%)
333 Anheuser-Busch InBev SA/NV 29,085 0.97
China - 1.32% (31 March 2019: 0.00%)
588 Prosus NV 39,602 1.32
Denmark - 2.28% (31 March 2019: 2.24%)
310 Carlsberg A/S 42,081 1.40
143 Genmab A/S 26,667 0.88
68,748 2.28
Finland - 2.16% (31 March 2019: 1.56%)
5,169 Nordea Bank Abp 33,700 1.12
860 Sampo Oyj - Class A 31,390 1.04
65,090 2.16
France - 25.75% (31 March 2019: 24.15%)
619 Air Liquide SA 80,918 2.69
287 Amundi SA '144A' 18,381 0.61
703 Atos SE 45,522 1.51
1,848 AXA SA 43,338 1.44
1,284 Cie de Saint-Gobain 46,274 1.54
4,610 Engie SA 69,102 2.30
648 Faurecia SE 28,265 0.94
138 LVMH Moet Hennessy Louis Vuitton SE 50,400 1.67
3,450 Orange SA 49,683 1.65
482 Safran SA 69,712 2.32
999 Sanofi 84,991 2.82
1,747 Societe Generale SA 43,974 1.46
1,429 SPIE SA 26,266 0.87
544 Vinci SA 53,798 1.79
2,560 Vivendi SA 64,502 2.14
775,126 25.75
Germany - 12.11% (31 March 2019: 9.79%)
431 Beiersdorf AG 46,657 1.55
485 Delivery Hero SE '144A' 19,767 0.66
995 Deutsche Wohnen SE 33,336 1.11
723 SAP SE 77,984 2.59
1,358 Scout24 AG '144A' 71,059 2.36
623 Symrise AG - Class A 55,551 1.84
800 TeamViewer AG 19,752 0.66
867 Vonovia SE 40,351 1.34
364,457 12.11
Ireland - 2.30% (31 March 2019: 2.97%)
1,190 CRH Plc 37,474 1.25
2,988 Ryanair Holdings Plc 31,594 1.05
69,068 2.30
Italy - 2.20% (31 March 2019: 0.96%)
2,730 FinecoBank Banca Fineco SpA 26,551 0.88
3,669 UniCredit SpA 39,768 1.32
66,319 2.20
Luxembourg - 0.53% (31 March 2019: 0.42%)
1,225 ArcelorMittal 15,842 0.53
Netherlands - 9.42% (31 March 2019: 10.54%)
281 ASML Holding NV 63,989 2.13
349 Euronext NV '144A' 26,174 0.87
560 Koninklijke DSM NV 61,804 2.05
3,727 Royal Dutch Shell Plc 99,959 3.32
471 Wolters Kluwer NV 31,561 1.05
283,487 9.42
Norway - 1.37% (31 March 2019: 0.17%)
1,948 Mowi ASA 41,277 1.37
Portugal - 1.55% (31 March 2019: 1.38%)
3,381 Galp Energia SGPS SA 46,659 1.55
Sweden - 2.65% (31 March 2019: 5.20%)
2,148 Epiroc AB 21,417 0.71
819 Hexagon AB 36,344 1.21
839 Saab AB 22,138 0.73
79,899 2.65
Switzerland - 9.81% (31 March 2019: 9.82%)
2,614 ABB Ltd 47,137 1.57
900 Alcon Inc 48,224 1.60
396 Cie Financiere Richemont SA 26,719 0.89
689 Julius Baer Group Ltd 28,060 0.93
1,502 Novartis AG 119,715 3.98
218 VAT Group AG '144A' 25,273 0.84
295,128 9.81
United Arab Emirates - 0.35% (31 March 2019: 0.00%)
1,741 Network International Holdings Plc '144A' 10,526 0.35
United Kingdom - 17.61% (31 March 2019: 18.47%)
5,516 Ascential Plc '144A' 23,660 0.79
1,031 Associated British Foods Plc 26,835 0.89
14,997 BP Plc 87,170 2.90
1,520 British American Tobacco Plc 51,663 1.72
39,154 Lloyds Banking Group Plc 24,004 0.80
16,026 Melrose Industries Plc 36,498 1.21
10,619 Premier Oil Plc 9,317 0.31
2,526 Prudential Plc 42,174 1.40
3,012 RELX Plc 65,737 2.18
372 Renishaw Plc 15,401 0.51
9,568 Rentokil Initial Plc 50,582 1.68
2,727 RSA Insurance Group Plc 16,464 0.55
1,800 Subsea 7 SA 17,017 0.56
1,151 Unilever NV 63,454 2.11
529,976 17.61
United States - 0.77% (31 March 2019: 1.53%)
773 QIAGEN NV 23,219 0.77
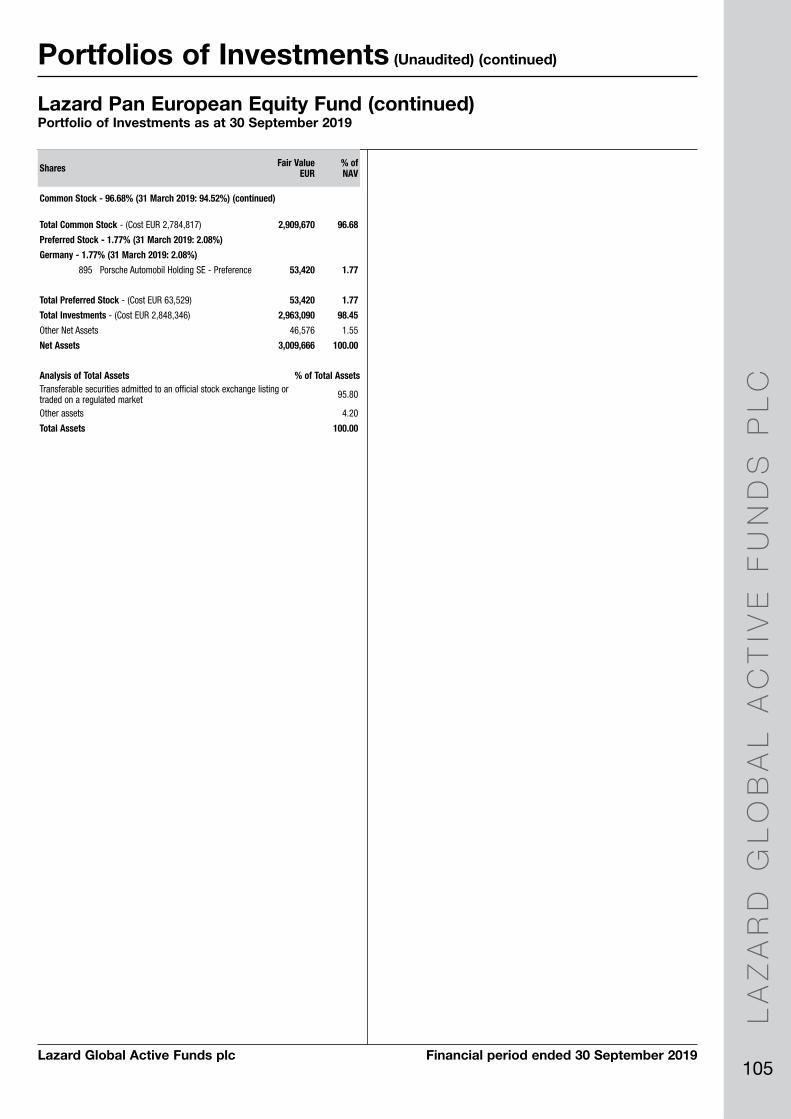
LA
ZA
RD
GL
OB
AL
AC
TIV
E F
UN
DS
PL
C
105Lazard Global Active Funds plc Financial period ended 30 September 2019
Portfolios of Investments (Unaudited) (continued)
Total Common Stock - (Cost EUR 2,784,817) 2,909,670 96.68
Preferred Stock - 1.77% (31 March 2019: 2.08%)
Germany - 1.77% (31 March 2019: 2.08%)
895 Porsche Automobil Holding SE - Preference 53,420 1.77
Total Preferred Stock - (Cost EUR 63,529) 53,420 1.77
Total Investments - (Cost EUR 2,848,346) 2,963,090 98.45
Other Net Assets 46,576 1.55
Net Assets 3,009,666 100.00
Shares Fair Value EUR
% of NAV
Common Stock - 96.68% (31 March 2019: 94.52%) (continued)
Lazard Pan European Equity Fund (continued)Portfolio of Investments as at 30 September 2019
Analysis of Total Assets % of Total AssetsTransferable securities admitted to an official stock exchange listing or traded on a regulated market 95.80
Other assets 4.20
Total Assets 100.00
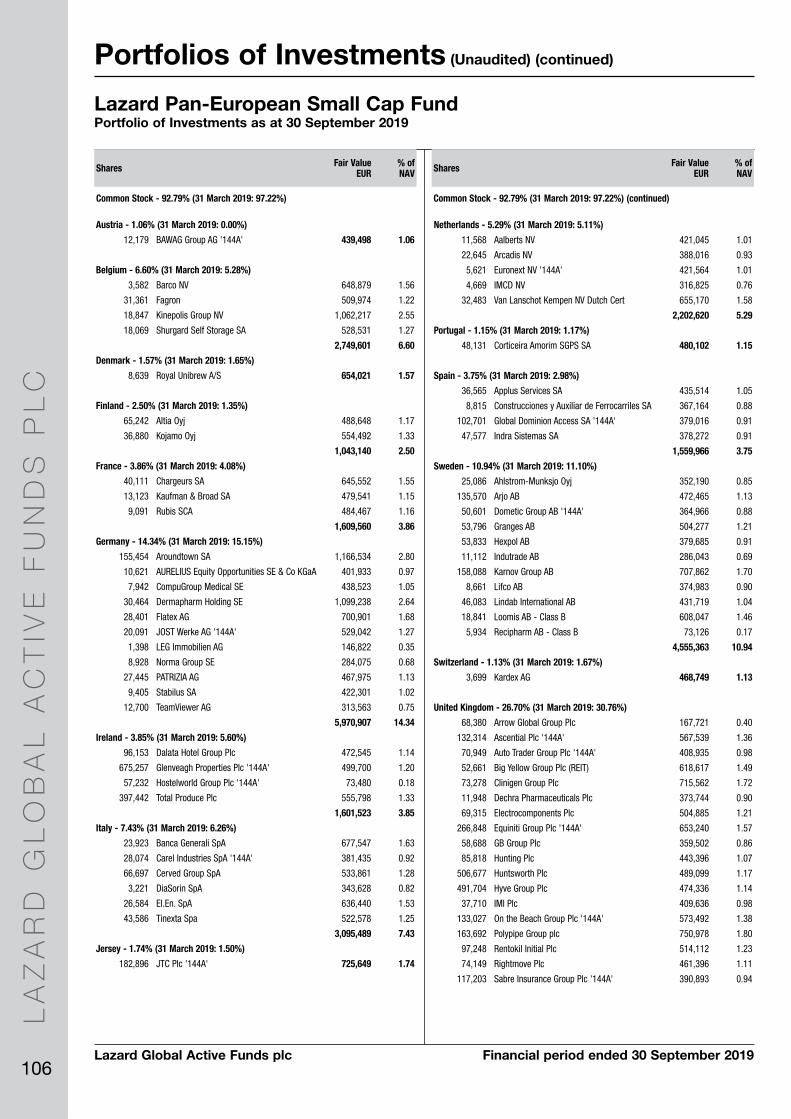
LA
ZA
RD
GL
OB
AL
AC
TIV
E F
UN
DS
PL
C
106
Portfolios of Investments (Unaudited) (continued)
Lazard Global Active Funds plc Financial period ended 30 September 2019
Lazard Pan-European Small Cap FundPortfolio of Investments as at 30 September 2019
Shares Fair Value EUR
% of NAV
Common Stock - 92.79% (31 March 2019: 97.22%)
Shares Fair Value EUR
% of NAV
Common Stock - 92.79% (31 March 2019: 97.22%) (continued)
Austria - 1.06% (31 March 2019: 0.00%)
12,179 BAWAG Group AG '144A' 439,498 1.06
Belgium - 6.60% (31 March 2019: 5.28%)
3,582 Barco NV 648,879 1.56
31,361 Fagron 509,974 1.22
18,847 Kinepolis Group NV 1,062,217 2.55
18,069 Shurgard Self Storage SA 528,531 1.27
2,749,601 6.60
Denmark - 1.57% (31 March 2019: 1.65%)
8,639 Royal Unibrew A/S 654,021 1.57
Finland - 2.50% (31 March 2019: 1.35%)
65,242 Altia Oyj 488,648 1.17
36,880 Kojamo Oyj 554,492 1.33
1,043,140 2.50
France - 3.86% (31 March 2019: 4.08%)
40,111 Chargeurs SA 645,552 1.55
13,123 Kaufman & Broad SA 479,541 1.15
9,091 Rubis SCA 484,467 1.16
1,609,560 3.86
Germany - 14.34% (31 March 2019: 15.15%)
155,454 Aroundtown SA 1,166,534 2.80
10,621 AURELIUS Equity Opportunities SE & Co KGaA 401,933 0.97
7,942 CompuGroup Medical SE 438,523 1.05
30,464 Dermapharm Holding SE 1,099,238 2.64
28,401 Flatex AG 700,901 1.68
20,091 JOST Werke AG '144A' 529,042 1.27
1,398 LEG Immobilien AG 146,822 0.35
8,928 Norma Group SE 284,075 0.68
27,445 PATRIZIA AG 467,975 1.13
9,405 Stabilus SA 422,301 1.02
12,700 TeamViewer AG 313,563 0.75
5,970,907 14.34
Ireland - 3.85% (31 March 2019: 5.60%)
96,153 Dalata Hotel Group Plc 472,545 1.14
675,257 Glenveagh Properties Plc '144A' 499,700 1.20
57,232 Hostelworld Group Plc '144A' 73,480 0.18
397,442 Total Produce Plc 555,798 1.33
1,601,523 3.85
Italy - 7.43% (31 March 2019: 6.26%)
23,923 Banca Generali SpA 677,547 1.63
28,074 Carel Industries SpA '144A' 381,435 0.92
66,697 Cerved Group SpA 533,861 1.28
3,221 DiaSorin SpA 343,628 0.82
26,584 El.En. SpA 636,440 1.53
43,586 Tinexta Spa 522,578 1.25
3,095,489 7.43
Jersey - 1.74% (31 March 2019: 1.50%)
182,896 JTC Plc '144A' 725,649 1.74
Netherlands - 5.29% (31 March 2019: 5.11%)
11,568 Aalberts NV 421,045 1.01
22,645 Arcadis NV 388,016 0.93
5,621 Euronext NV '144A' 421,564 1.01
4,669 IMCD NV 316,825 0.76
32,483 Van Lanschot Kempen NV Dutch Cert 655,170 1.58
2,202,620 5.29
Portugal - 1.15% (31 March 2019: 1.17%)
48,131 Corticeira Amorim SGPS SA 480,102 1.15
Spain - 3.75% (31 March 2019: 2.98%)
36,565 Applus Services SA 435,514 1.05
8,815 Construcciones y Auxiliar de Ferrocarriles SA 367,164 0.88
102,701 Global Dominion Access SA '144A' 379,016 0.91
47,577 Indra Sistemas SA 378,272 0.91
1,559,966 3.75
Sweden - 10.94% (31 March 2019: 11.10%)
25,086 Ahlstrom-Munksjo Oyj 352,190 0.85
135,570 Arjo AB 472,465 1.13
50,601 Dometic Group AB '144A' 364,966 0.88
53,796 Granges AB 504,277 1.21
53,833 Hexpol AB 379,685 0.91
11,112 Indutrade AB 286,043 0.69
158,088 Karnov Group AB 707,862 1.70
8,661 Lifco AB 374,983 0.90
46,083 Lindab International AB 431,719 1.04
18,841 Loomis AB - Class B 608,047 1.46
5,934 Recipharm AB - Class B 73,126 0.17
4,555,363 10.94
Switzerland - 1.13% (31 March 2019: 1.67%)
3,699 Kardex AG 468,749 1.13
United Kingdom - 26.70% (31 March 2019: 30.76%)
68,380 Arrow Global Group Plc 167,721 0.40
132,314 Ascential Plc '144A' 567,539 1.36
70,949 Auto Trader Group Plc '144A' 408,935 0.98
52,661 Big Yellow Group Plc (REIT) 618,617 1.49
73,278 Clinigen Group Plc 715,562 1.72
11,948 Dechra Pharmaceuticals Plc 373,744 0.90
69,315 Electrocomponents Plc 504,885 1.21
266,848 Equiniti Group Plc '144A' 653,240 1.57
58,688 GB Group Plc 359,502 0.86
85,818 Hunting Plc 443,396 1.07
506,677 Huntsworth Plc 489,099 1.17
491,704 Hyve Group Plc 474,336 1.14
37,710 IMI Plc 409,636 0.98
133,027 On the Beach Group Plc '144A' 573,492 1.38
163,692 Polypipe Group plc 750,978 1.80
97,248 Rentokil Initial Plc 514,112 1.23
74,149 Rightmove Plc 461,396 1.11
117,203 Sabre Insurance Group Plc '144A' 390,893 0.94

LA
ZA
RD
GL
OB
AL
AC
TIV
E F
UN
DS
PL
C
107Lazard Global Active Funds plc Financial period ended 30 September 2019
Portfolios of Investments (Unaudited) (continued)
Shares Fair Value EUR
% of NAV
Common Stock - 92.79% (31 March 2019: 97.22%) (continued)
Lazard Pan-European Small Cap Fund (continued)Portfolio of Investments as at 30 September 2019
Analysis of Total Assets % of Total AssetsTransferable securities admitted to an official stock exchange listing or traded on a regulated market 91.92
Other assets 8.08
Total Assets 100.00
United Kingdom - 26.70% (31 March 2019: 30.76%) (continued)
97,725 Smart Metering Systems Plc 444,022 1.07
38,094 Subsea 7 SA 360,142 0.87
82,103 Synthomer Plc 301,291 0.72
393,729 Volution Group Plc 747,087 1.79
24,256 Weir Group Plc/The 391,324 0.94
11,120,949 26.70
United States - 0.88% (31 March 2019: 2.55%)
39,126 Burford Capital Ltd 364,366 0.88
Total Common Stock - (Cost EUR 38,101,050) 38,641,503 92.79
Total Investments - (Cost EUR 38,101,050) 38,641,503 92.79
Other Net Assets 3,003,923 7.21
Net Assets 41,645,426 100.00

LA
ZA
RD
GL
OB
AL
AC
TIV
E F
UN
DS
PL
C
108
Portfolios of Investments (Unaudited) (continued)
Lazard Global Active Funds plc Financial period ended 30 September 2019
Lazard UK Omega Equity FundPortfolio of Investments as at 30 September 2019
Shares Fair Value GBP
% of NAV
Common Stock - 98.02% (31 March 2019: 97.53%)
Shares Fair Value GBP
% of NAV
Common Stock - 98.02% (31 March 2019: 97.53%) (continued)
Advertising - 4.99% (31 March 2019: 0.00%)
14,238 Ascential Plc '144A' 54,029 1.90
8,636 WPP Plc 87,925 3.09
141,954 4.99
Airlines - 2.25% (31 March 2019: 2.69%)
5,550 easyJet Plc 63,814 2.25
Banks - 9.17% (31 March 2019: 3.91%)
261,592 Lloyds Banking Group Plc 141,881 4.99
57,260 Royal Bank of Scotland Group Plc 118,987 4.18
260,868 9.17
Beverages - 9.15% (31 March 2019: 5.22%)
2,961 Coca-Cola HBC AG 78,672 2.77
5,455 Diageo Plc 181,546 6.38
260,218 9.15
Chemicals - 4.73% (31 March 2019: 4.78%)
1,246 Croda International Plc 60,587 2.13
22,751 Synthomer Plc 73,861 2.60
134,448 4.73
Commercial Services - 2.27% (31 March 2019: 4.16%)
13,805 Rentokil Initial Plc 64,565 2.27
Cosmetics/Personal Care - 4.00% (31 March 2019: 4.70%)
2,324 Unilever Plc 113,650 4.00
Distribution/Wholesale - 2.18% (31 March 2019: 0.00%)
1,044 Ferguson Plc 62,035 2.18
Diversified Financial Services - 4.43% (31 March 2019: 4.65%)
748 London Stock Exchange Group Plc 54,634 1.92
70,300 Trian Investors 1 Ltd 71,355 2.51
125,989 4.43
Food - 6.96% (31 March 2019: 3.93%)
2,377 Associated British Foods Plc 54,733 1.92
26,089 J Sainsbury Plc 57,342 2.02
35,613 Tesco Plc 85,891 3.02
197,966 6.96
Home Builders - 2.42% (31 March 2019: 2.03%)
42,660 Taylor Wimpey Plc 68,894 2.42
Insurance - 5.34% (31 March 2019: 8.29%)
10,288 Prudential Plc 151,958 5.34
Leisure Time - 2.10% (31 March 2019: 0.00%)
6,314 TUI AG 59,762 2.10
Machinery-Diversified - 2.16% (31 March 2019: 2.08%)
4,311 Weir Group Plc/The 61,530 2.16
Media - 2.00% (31 March 2019: 4.61%)
45,243 ITV Plc 56,837 2.00
Mining - 6.11% (31 March 2019: 8.62%)
5,281 Anglo American Plc 98,947 3.48
1,772 Rio Tinto Plc 74,858 2.63
173,805 6.11
Miscellaneous Manufacturing - 2.14% (31 March 2019: 4.32%)
6,337 IMI Plc 60,899 2.14
Oil & Gas - 13.70% (31 March 2019: 17.10%)
40,489 BP Plc 208,203 7.32
7,603 Royal Dutch Shell Plc 181,655 6.38
389,858 13.70
Pharmaceuticals - 4.41% (31 March 2019: 5.69%)
7,214 GlaxoSmithKline Plc 125,591 4.41
Private Equity - 2.59% (31 March 2019: 2.27%)
6,308 3i Group Plc 73,564 2.59
Telecommunications - 4.92% (31 March 2019: 4.11%)
86,407 Vodafone Group Plc 139,952 4.92
Total Common Stock - (Cost GBP 2,727,672) 2,788,157 98.02
Total Investments - (Cost GBP 2,727,672) 2,788,157 98.02
Other Net Assets 56,391 1.98
Net Assets 2,844,548 100.00
Analysis of Total Assets % of Total AssetsTransferable securities admitted to an official stock exchange listing or traded on a regulated market 96.62
Other assets 3.38
Total Assets 100.00
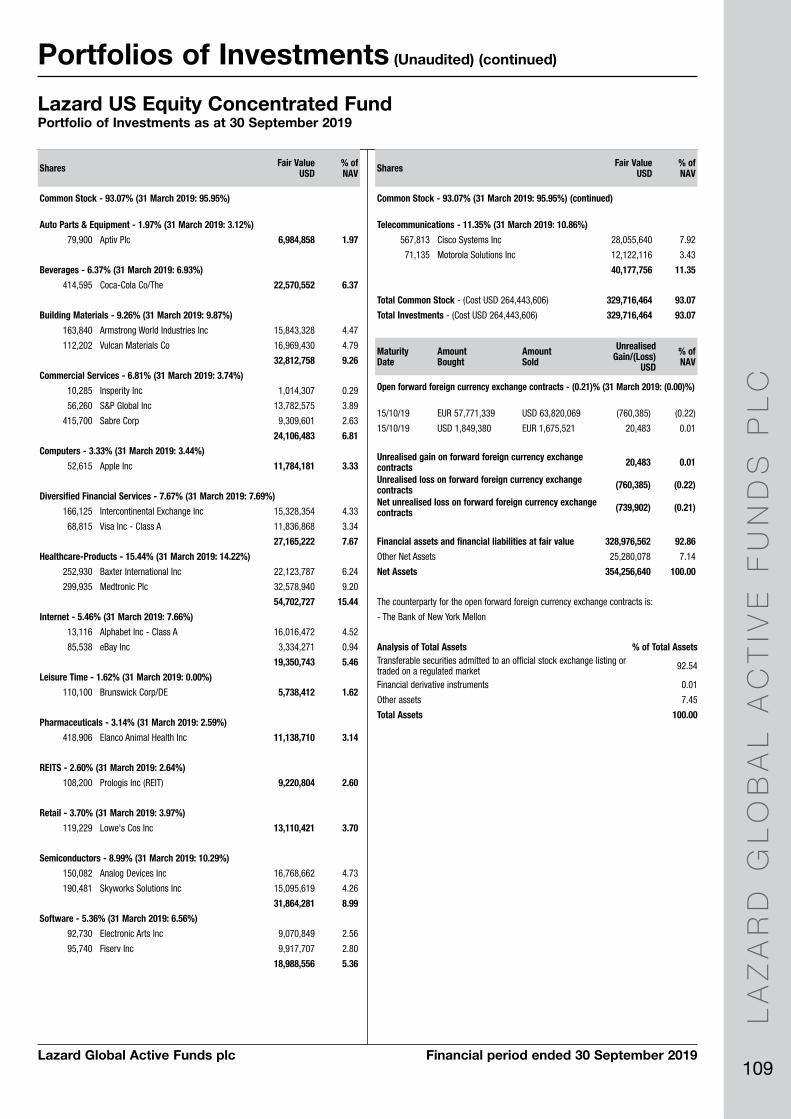
LA
ZA
RD
GL
OB
AL
AC
TIV
E F
UN
DS
PL
C
109Lazard Global Active Funds plc Financial period ended 30 September 2019
Portfolios of Investments (Unaudited) (continued)
Telecommunications - 11.35% (31 March 2019: 10.86%)
567,813 Cisco Systems Inc 28,055,640 7.92
71,135 Motorola Solutions Inc 12,122,116 3.43
40,177,756 11.35
Total Common Stock - (Cost USD 264,443,606) 329,716,464 93.07
Total Investments - (Cost USD 264,443,606) 329,716,464 93.07
Lazard US Equity Concentrated FundPortfolio of Investments as at 30 September 2019
Shares Fair Value USD
% of NAV
Common Stock - 93.07% (31 March 2019: 95.95%)
Shares Fair Value USD
% of NAV
Common Stock - 93.07% (31 March 2019: 95.95%) (continued)
Auto Parts & Equipment - 1.97% (31 March 2019: 3.12%)
79,900 Aptiv Plc 6,984,858 1.97
Beverages - 6.37% (31 March 2019: 6.93%)
414,595 Coca-Cola Co/The 22,570,552 6.37
Building Materials - 9.26% (31 March 2019: 9.87%)
163,840 Armstrong World Industries Inc 15,843,328 4.47
112,202 Vulcan Materials Co 16,969,430 4.79
32,812,758 9.26
Commercial Services - 6.81% (31 March 2019: 3.74%)
10,285 Insperity Inc 1,014,307 0.29
56,260 S&P Global Inc 13,782,575 3.89
415,700 Sabre Corp 9,309,601 2.63
24,106,483 6.81
Computers - 3.33% (31 March 2019: 3.44%)
52,615 Apple Inc 11,784,181 3.33
Diversified Financial Services - 7.67% (31 March 2019: 7.69%)
166,125 Intercontinental Exchange Inc 15,328,354 4.33
68,815 Visa Inc - Class A 11,836,868 3.34
27,165,222 7.67
Healthcare-Products - 15.44% (31 March 2019: 14.22%)
252,930 Baxter International Inc 22,123,787 6.24
299,935 Medtronic Plc 32,578,940 9.20
54,702,727 15.44
Internet - 5.46% (31 March 2019: 7.66%)
13,116 Alphabet Inc - Class A 16,016,472 4.52
85,538 eBay Inc 3,334,271 0.94
19,350,743 5.46
Leisure Time - 1.62% (31 March 2019: 0.00%)
110,100 Brunswick Corp/DE 5,738,412 1.62
Pharmaceuticals - 3.14% (31 March 2019: 2.59%)
418,906 Elanco Animal Health Inc 11,138,710 3.14
REITS - 2.60% (31 March 2019: 2.64%)
108,200 Prologis Inc (REIT) 9,220,804 2.60
Retail - 3.70% (31 March 2019: 3.97%)
119,229 Lowe's Cos Inc 13,110,421 3.70
Semiconductors - 8.99% (31 March 2019: 10.29%)
150,082 Analog Devices Inc 16,768,662 4.73
190,481 Skyworks Solutions Inc 15,095,619 4.26
31,864,281 8.99
Software - 5.36% (31 March 2019: 6.56%)
92,730 Electronic Arts Inc 9,070,849 2.56
95,740 Fiserv Inc 9,917,707 2.80
18,988,556 5.36
Maturity Date
Amount Bought
Amount Sold
Unrealised Gain/(Loss)
USD
% of NAV
Open forward foreign currency exchange contracts - (0.21)% (31 March 2019: (0.00)%)
15/10/19 EUR 57,771,339 USD 63,820,069 (760,385) (0.22)
15/10/19 USD 1,849,380 EUR 1,675,521 20,483 0.01
Unrealised gain on forward foreign currency exchange contracts 20,483 0.01
Unrealised loss on forward foreign currency exchange contracts (760,385) (0.22)
Net unrealised loss on forward foreign currency exchange contracts (739,902) (0.21)
Financial assets and financial liabilities at fair value 328,976,562 92.86
Other Net Assets 25,280,078 7.14
Net Assets 354,256,640 100.00
The counterparty for the open forward foreign currency exchange contracts is:
- The Bank of New York Mellon
Analysis of Total Assets % of Total AssetsTransferable securities admitted to an official stock exchange listing or traded on a regulated market 92.54
Financial derivative instruments 0.01
Other assets 7.45
Total Assets 100.00

LA
ZA
RD
GL
OB
AL
AC
TIV
E F
UN
DS
PL
C
110
Portfolios of Investments (Unaudited) (continued)
Lazard Global Active Funds plc Financial period ended 30 September 2019
Real Estate - 7.61% (31 March 2019: 7.65%)
85,500 Hulic Co Ltd 94,477,500 3.59
153,200 Tokyu Fudosan Holdings Corp 105,554,800 4.02
200,032,300 7.61
Retail - 1.66% (31 March 2019: 2.10%)
10,300 Izumi Co Ltd 43,569,000 1.66
Semiconductors - 3.76% (31 March 2019: 3.90%)
4,800 Tokyo Electron Ltd 98,712,000 3.76
Toys/Games/Hobbies - 3.65% (31 March 2019: 3.25%)
2,400 Nintendo Co Ltd 96,048,000 3.65
Transportation - 3.22% (31 March 2019: 3.43%)
44,900 Seibu Holdings Inc 84,546,700 3.22
Total Common Stock - (Cost JPY 2,548,860,248) 2,575,060,590 97.99
Total Investments - (Cost JPY 2,548,860,248) 2,575,060,590 97.99
Shares Fair Value JPY
% of NAV
Common Stock - 97.99% (31 March 2019: 98.60%)
Shares Fair Value JPY
% of NAV
Common Stock - 97.99% (31 March 2019: 98.60%) (continued)
Maturity Date
Amount Bought
Amount Sold
Unrealised Gain/(Loss)
JPY
% of NAV
Open forward foreign currency exchange contracts - 0.02% (31 March 2019: (0.02)%)
15/10/19 GBP 3,230 JPY 427,730 2,227 0.00
15/10/19 GBP 122 JPY 16,296 (66) (0.00)
15/10/19 USD 473,776 JPY 50,660,821 486,003 0.02
Unrealised gain on forward foreign currency exchange contracts 488,230 0.02
Unrealised loss on forward foreign currency exchange contracts (66) (0.00)
Net unrealised loss on forward foreign currency exchange contracts 488,164 0.02
Financial assets and financial liabilities at fair value 2,575,548,754 98.01
Other Net Assets 52,366,213 1.99
Net Assets 2,627,914,967 100.00
The counterparty for the open forward foreign currency exchange contracts is:
- The Bank of New York Mellon
Lazard Japanese Strategic Equity FundPortfolio of Investments as at 30 September 2019
Auto Parts & Equipment - 0.65% (31 March 2019: 0.78%)
5,000 Aisin Seiki Co Ltd 16,975,000 0.65
Banks - 12.84% (31 March 2019: 13.57%)
227,400 Mitsubishi UFJ Financial Group Inc 124,706,160 4.75
442,400 Mizuho Financial Group Inc 73,261,440 2.79
58,900 Shizuoka Bank Ltd/The 47,414,500 1.80
23,600 Sumitomo Mitsui Trust Holdings Inc 91,945,600 3.50
337,327,700 12.84
Chemicals - 6.86% (31 March 2019: 5.28%)
26,700 Kansai Paint Co Ltd 67,043,700 2.55
13,400 Nitto Denko Corp 69,733,600 2.65
20,000 Ube Industries Ltd 43,580,000 1.66
180,357,300 6.86
Distribution/Wholesale - 4.01% (31 March 2019: 4.82%)
39,800 Mitsubishi Corp 105,509,800 4.01
Diversified Financial Services - 5.82% (31 March 2019: 5.75%)
97,100 Nomura Holdings Inc 44,462,090 1.69
67,300 ORIX Corp 108,420,300 4.13
152,882,390 5.82
Electric - 0.93% (31 March 2019: 0.00%)
20,200 Kansai Electric Power Co Inc/The 24,411,700 0.93
Electronics - 4.53% (31 March 2019: 4.49%)
8,200 Nidec Corp 119,064,000 4.53
Hand/Machine Tools - 6.69% (31 March 2019: 6.60%)
4,200 Disco Corp 85,932,000 3.27
26,400 Makita Corp 89,760,000 3.42
175,692,000 6.69
Home Builders - 3.31% (31 March 2019: 2.24%)
24,800 Daiwa House Industry Co Ltd 86,948,800 3.31
Home Furnishings - 5.53% (31 March 2019: 4.18%)
22,900 Sony Corp 145,346,300 5.53
Insurance - 3.48% (31 March 2019: 3.40%)
56,100 Dai-ichi Life Holdings Inc 91,386,900 3.48
Machinery-Construction & Mining - 9.75% (31 March 2019: 9.73%)
32,000 Hitachi Ltd 128,736,000 4.90
51,500 Komatsu Ltd 127,462,500 4.85
256,198,500 9.75
Machinery-Diversified - 6.29% (31 March 2019: 6.10%)
51,300 Amada Holdings Co Ltd 59,713,200 2.27
5,200 FANUC Corp 105,768,000 4.02
165,481,200 6.29
Pharmaceuticals - 2.51% (31 March 2019: 3.19%)
17,900 Takeda Pharmaceutical Co Ltd 66,051,000 2.51
Private Equity - 4.89% (31 March 2019: 4.93%)
31,500 Jafco Co Ltd 128,520,000 4.89
Analysis of Total Assets % of Total AssetsTransferable securities admitted to an official stock exchange listing or traded on a regulated market 96.63
Financial derivative instruments 0.02
Other assets 3.35
Total Assets 100.00

LA
ZA
RD
GL
OB
AL
AC
TIV
E F
UN
DS
PL
C
111Lazard Global Active Funds plc Financial period ended 30 September 2019
Portfolios of Investments (Unaudited) (continued)
Lazard Emerging World FundPortfolio of Investments as at 30 September 2019
Shares Fair Value USD
% of NAV
Common Stock - 22.81% (31 March 2019: 18.54%)
Shares Fair Value USD
% of NAV
Common Stock - 22.81% (31 March 2019: 18.54%) (continued)
Bermuda - 0.36% (31 March 2019: 0.23%)
6,500 Ocean Wilsons Holdings Ltd 71,689 0.36
Brazil - 1.10% (31 March 2019: 0.84%)
9,000 Cosan Ltd 134,100 0.68
57,800 GP Investments Ltd BDR - Class B 82,147 0.42
216,247 1.10
China - 7.52% (31 March 2019: 1.85%)
54,000 China Everbright Ltd 63,165 0.32
185,588 China Merchants China Direct Investments Ltd 225,611 1.14
311,500 CITIC Securities Co Ltd 'H' 583,312 2.96
8,319 Prosus NV 610,819 3.10
1,482,907 7.52
Hong Kong - 2.15% (31 March 2019: 1.99%)
1,109,600 First Pacific Co Ltd 424,624 2.15
Romania - 2.91% (31 March 2019: 1.88%)
42,477 Fondul Proprietatea SA GDR 573,440 2.91
South Africa - 5.49% (31 March 2019: 8.11%)
7,144 Naspers Ltd 1,081,341 5.49
South Korea - 2.24% (31 March 2019: 2.58%)
2,590 SK Holdings Co Ltd 441,717 2.24
Sweden - 1.04% (31 March 2019: 1.06%)
17,673 Eastnine AB 205,271 1.04
United States - 0.00% (31 March 2019: 0.00%)
6,922 Escrow Latin American Discovery Fund Inc/The+ – 0.00
Total Common Stock - (Cost USD 4,685,138) 4,497,236 22.81
Investment in Exchange Traded Investment Funds - 71.58% (31 March 2019: 79.06%)*
Hong Kong - 0.27% (31 March 2019: 0.28%)
45,079 HSBC China Dragon Fund 53,478 0.27
United Kingdom - 57.09% (31 March 2019: 56.10%)
59,230 Aberdeen Emerging Markets Investment Co Ltd 423,337 2.15
106,574 Aberdeen Frontier Markets Investment Co Ltd 60,412 0.31
26,548 Aberdeen New Dawn Investment Trust Plc 80,479 0.41
88,329 Aberdeen New India Investment Trust Plc 537,708 2.73
39,298 Aberdeen New Thai Investment Trust Plc 296,615 1.50
91,753 Africa Opportunity Fund Ltd 51,840 0.26
6,186 Baring Emerging Europe Plc 64,491 0.33
87,175 BlackRock Latin American Investment Trust Plc 495,233 2.51
44,566 BlackRock World Mining Trust Plc 196,609 1.00
52,349 Dragon Capital - Vietnam Enterprise Investments Ltd 325,129 1.65
102,546 Edinburgh Dragon Trust Plc 510,524 2.59
469,208 Fidelity China Special Situations Plc 1,254,705 6.36
71,077 Genesis Emerging Markets Fund Ltd 669,174 3.39
77,225 Gulf Investment Fund Plc 95,759 0.49
203,576 India Capital Growth Fund Ltd 191,662 0.97
United Kingdom - 57.09% (31 March 2019: 56.10%) (continued)
106,278 INVESCO Asia Trust Plc 364,741 1.85
67,103 JPMorgan Asian Investment Trust Plc/Fund 298,515 1.51
9,253 JPMorgan Chinese Investment Trust Plc/Fund 35,291 0.18
115,678 JPMorgan Emerging Markets Investment Trust plc 1,408,394 7.14
24,238 JPMorgan Indian Investment Trust Plc/Fund 222,222 1.13
86,720 JPMorgan Russian Securities plc 738,437 3.75
97,158 Macau Property Opportunities Fund Ltd 156,245 0.79
70,703 Schroder AsiaPacific Fund Plc 379,004 1.92
123,750 Templeton Emerging Markets Investment Trust Plc 1,201,677 6.10
180,369 Utilico Emerging Markets Trust Plc/The Fund 531,222 2.70
157,756 VinaCapital Vietnam Opportunity Fund Ltd 663,885 3.37
11,253,310 57.09
United States - 14.22% (31 March 2019: 22.68%)
31,081 Aberdeen Emerging Markets Equity Income Fund Inc 216,324 1.10
16,667 ASA Gold and Precious Metals Ltd 200,337 1.02
9,835 Central and Eastern Europe Fund Inc 255,710 1.30
8,462 China Fund Inc/The 164,247 0.83
9,714 First Trust Aberdeen Emerging Opportunity Fund 128,516 0.65
13,907 India Fund Inc/The 285,511 1.45
8,230 Korea Fund Inc/The 225,749 1.14
1,683 Mexico Equity & Income Fund Inc/Fund 17,702 0.09
8,500 Mexico Fund Inc/The 110,925 0.56
13,050 Morgan Stanley China A Share Fund Inc 267,003 1.35
3,200 Morgan Stanley India Investment Fund Inc 60,640 0.31
12,559 Taiwan Fund Inc/The 231,965 1.18
35,678 Templeton Dragon Fund Inc 638,993 3.24
2,803,622 14.22
Total Investment in Exchange Traded Investment Funds - (Cost USD 11,575,426) 14,110,410 71.58
Preferred Stock - 5.02% (31 March 2019: 1.26%)
Brazil - 1.30% (31 March 2019: 1.26%)
10,100 Bradespar SA - Preference 76,524 0.39
56,700 Itausa - Investimentos Itau SA - Preference 179,407 0.91
255,931 1.30
South Korea - 3.72% (31 March 2019: 0.00%)
22,194 Samsung Electronics Co Ltd - Preference 732,904 3.72
Total Preferred Stock - (Cost USD 957,098) 988,835 5.02
Total Investments - (Cost USD 17,217,662) 19,596,481 99.41
Other Net Assets 117,178 0.59
Net Assets 19,713,659 100.00
+ - Security is valued at zero
GDR - Global Depositary Receipt
BDR - Brazil Depositary Receipt
* Classified based on country of primary exchange listing

LA
ZA
RD
GL
OB
AL
AC
TIV
E F
UN
DS
PL
C
112
Portfolios of Investments (Unaudited) (continued)
Lazard Global Active Funds plc Financial period ended 30 September 2019
Analysis of Total Assets % of Total AssetsTransferable securities admitted to an official stock exchange listing or traded on a regulated market 27.69
Investment funds 71.21
Other assets 1.10
Total Assets 100.00
Lazard Emerging World Fund (continued)Portfolio of Investments as at 30 September 2019

LA
ZA
RD
GL
OB
AL
AC
TIV
E F
UN
DS
PL
C
113Lazard Global Active Funds plc Financial period ended 30 September 2019
Portfolios of Investments (Unaudited) (continued)
Shares Fair Value USD
% of NAV
Common Stock - 97.53% (31 March 2019: 97.02%)
Shares Fair Value USD
% of NAV
Common Stock - 97.53% (31 March 2019: 97.02%) (continued)
Lazard Emerging Markets Equity FundPortfolio of Investments as at 30 September 2019
Brazil - 8.91% (31 March 2019: 8.10%)
1,501,120 Ambev SA ADR 6,935,174 0.70
2,741,276 Banco do Brasil SA 29,937,095 3.02
2,066,100 BB Seguridade Participacoes SA 17,375,305 1.75
4,242,772 CCR SA 17,570,323 1.77
4,101,987 Cielo SA 7,878,168 0.79
960,900 IRB Brasil Resseguros S/A 8,687,593 0.88
88,383,658 8.91
China - 19.54% (31 March 2019: 19.80%)
1,520,657 AAC Technologies Holdings Inc 8,131,182 0.82
2,577,247 Anhui Conch Cement Co Ltd 'H' 15,369,124 1.55
91,600 Baidu Inc ADR 9,412,816 0.95
66,839,821 China Construction Bank Corp 'H' 50,816,846 5.13
2,136,500 China Merchants Bank Co Ltd 'H' 10,233,574 1.03
385,430 China Mobile Ltd ADR 15,956,802 1.61
3,624,651 China Shenhua Energy Co Ltd 'H' 7,253,970 0.73
6,359,000 CNOOC Ltd 9,767,793 0.99
984,800 ENN Energy Holdings Ltd 10,222,329 1.03
1,385,500 Hengan International Group Co Ltd 9,045,424 0.91
114,825 NetEase Inc ADR 30,564,119 3.08
11,670,844 Weichai Power Co Ltd 'H' 16,917,736 1.71
193,691,715 19.54
Egypt - 1.24% (31 March 2019: 1.07%)
2,667,647 Commercial International Bank Egypt SAE GDR 12,279,329 1.24
Hong Kong - 1.33% (31 March 2019: 1.10%)
1,070,900 ASM Pacific Technology Ltd 13,152,858 1.33
Hungary - 2.00% (31 March 2019: 2.06%)
474,973 OTP Bank Nyrt 19,786,353 2.00
India - 11.03% (31 March 2019: 10.02%)
1,230,948 Axis Bank Ltd 11,899,096 1.20
212,688 Bajaj Auto Ltd 8,830,352 0.89
1,399,897 Bharat Petroleum Corp Ltd 9,289,893 0.94
952,240 Bharti Infratel Ltd 3,458,675 0.35
2,262,634 Coal India Ltd 6,386,716 0.64
816,772 HCL Technologies Ltd 12,461,118 1.26
321,138 Hero MotoCorp Ltd 12,260,912 1.24
993,600 Infosys Ltd ADR 11,297,232 1.14
4,330,199 Oil & Natural Gas Corp Ltd 8,074,771 0.81
621,003 Tata Consultancy Services Ltd 18,390,823 1.85
821,919 UPL Ltd 7,005,986 0.71
109,355,574 11.03
Indonesia - 5.09% (31 March 2019: 5.79%)
25,189,700 Astra International Tbk PT 11,741,269 1.18
37,559,864 Bank Mandiri Persero Tbk PT 18,465,541 1.86
3,110,600 Semen Indonesia Persero Tbk PT 2,532,166 0.26
588,174 Telekomunikasi Indonesia Persero Tbk PT ADR 17,709,919 1.79
50,448,895 5.09
Luxembourg - 0.83% (31 March 2019: 0.69%)
427,121 Ternium SA ADR 8,196,452 0.83
Malaysia - 0.42% (31 March 2019: 0.78%)
917,493 British American Tobacco Malaysia Bhd 4,150,667 0.42
Mexico - 3.74% (31 March 2019: 3.28%)
1,427,756 America Movil SAB de CV ADR 21,216,454 2.14
2,746,655 Grupo Mexico SAB de CV 6,418,700 0.65
4,696,800 Kimberly-Clark de Mexico SAB de CV 9,427,392 0.95
37,062,546 3.74
Pakistan - 0.69% (31 March 2019: 1.03%)
2,495,400 Habib Bank Ltd 1,885,785 0.19
361,240 Oil & Gas Development Co Ltd 283,722 0.03
5,352,125 Pakistan Petroleum Ltd 4,665,041 0.47
6,834,548 0.69
Philippines - 0.74% (31 March 2019: 0.67%)
335,970 PLDT Inc ADR 7,391,340 0.74
Portugal - 0.22% (31 March 2019: 0.00%)
147,241 Galp Energia SGPS SA 2,215,235 0.22
Russia - 9.33% (31 March 2019: 9.79%)
11,927,377 Alrosa PJSC 13,692,724 1.38
1,671,831 Gazprom PJSC ADR 11,517,978 1.16
187,133 LUKOIL PJSC ADR 15,452,743 1.56
692,183 Magnit PJSC GDR 9,040,621 0.91
1,653,388 Mobile TeleSystems PJSC ADR 13,392,443 1.35
8,398,775 Sberbank of Russia PJSC 29,470,453 2.97
92,566,962 9.33
South Africa - 6.40% (31 March 2019: 7.79%)
639,601 Bidvest Group Ltd/The 8,059,031 0.81
5,012,046 Life Healthcare Group Holdings Ltd 7,500,227 0.76
600,345 Motus Holdings Ltd 2,727,223 0.28
531,212 Nedbank Group Ltd 7,961,700 0.80
3,649,906 PPC Ltd 965,794 0.10
1,686,712 Sanlam Ltd 8,308,831 0.84
1,045,030 Shoprite Holdings Ltd (Units) 8,467,539 0.85
808,594 Standard Bank Group Ltd 9,329,470 0.94
1,279,604 Vodacom Group Ltd 10,100,728 1.02
63,420,543 6.40
South Korea - 15.13% (31 March 2019: 14.33%)
807,339 Hanwha Life Insurance Co Ltd 1,607,054 0.16
71,588 Hyundai Mobis Co Ltd 15,121,276 1.52
426,408 KB Financial Group Inc 15,253,348 1.54
110,657 KT&G Corp 9,768,642 0.99
1,132,400 Samsung Electronics Co Ltd 46,201,840 4.66
544,092 Shinhan Financial Group Co Ltd 18,963,933 1.91
463,706 SK Hynix Inc 31,887,766 3.22
157,773 Woongjin Coway Co Ltd 11,167,970 1.13
149,971,829 15.13
Taiwan - 5.24% (31 March 2019: 5.53%)
1,412,000 Catcher Technology Co Ltd 10,726,868 1.08
4,824,540 Hon Hai Precision Industry Co Ltd 11,461,893 1.16
3,369,890 Taiwan Semiconductor Manufacturing Co Ltd 29,741,221 3.00
51,929,982 5.24
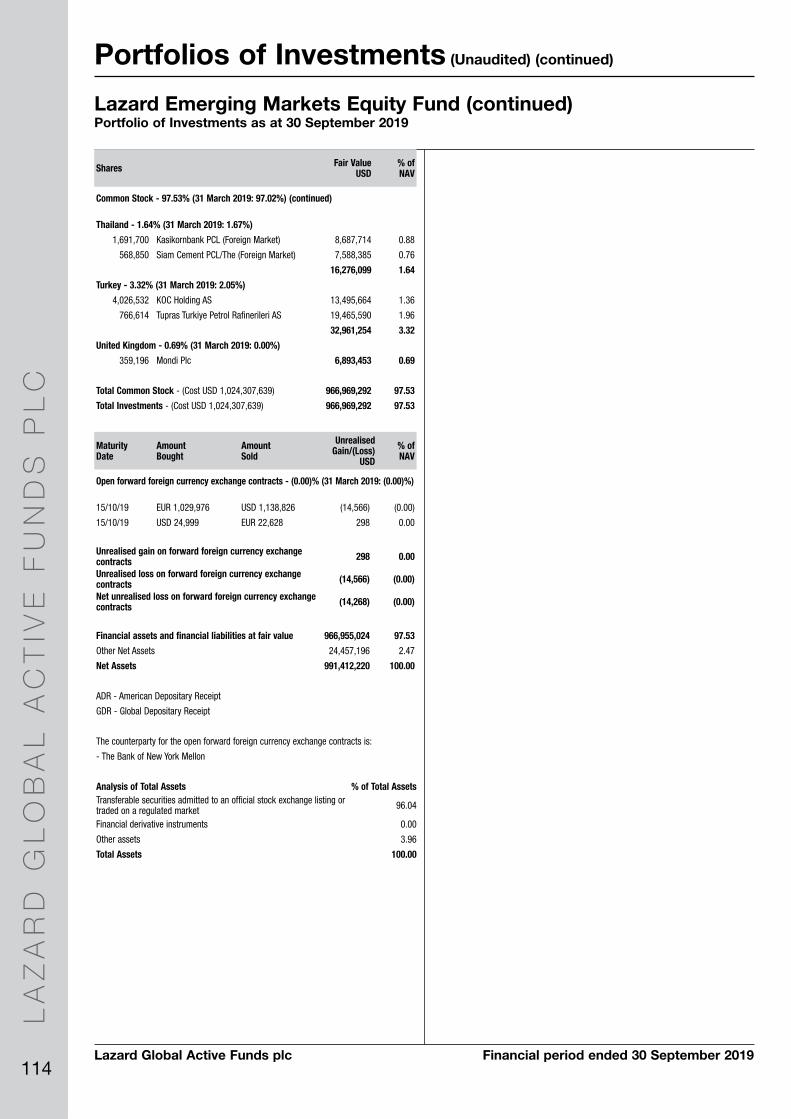
LA
ZA
RD
GL
OB
AL
AC
TIV
E F
UN
DS
PL
C
114
Portfolios of Investments (Unaudited) (continued)
Lazard Global Active Funds plc Financial period ended 30 September 2019
Thailand - 1.64% (31 March 2019: 1.67%)
1,691,700 Kasikornbank PCL (Foreign Market) 8,687,714 0.88
568,850 Siam Cement PCL/The (Foreign Market) 7,588,385 0.76
16,276,099 1.64
Turkey - 3.32% (31 March 2019: 2.05%)
4,026,532 KOC Holding AS 13,495,664 1.36
766,614 Tupras Turkiye Petrol Rafinerileri AS 19,465,590 1.96
32,961,254 3.32
United Kingdom - 0.69% (31 March 2019: 0.00%)
359,196 Mondi Plc 6,893,453 0.69
Total Common Stock - (Cost USD 1,024,307,639) 966,969,292 97.53
Total Investments - (Cost USD 1,024,307,639) 966,969,292 97.53
Lazard Emerging Markets Equity Fund (continued)Portfolio of Investments as at 30 September 2019
Shares Fair Value USD
% of NAV
Common Stock - 97.53% (31 March 2019: 97.02%) (continued)
Maturity Date
Amount Bought
Amount Sold
Unrealised Gain/(Loss)
USD
% of NAV
Open forward foreign currency exchange contracts - (0.00)% (31 March 2019: (0.00)%)
15/10/19 EUR 1,029,976 USD 1,138,826 (14,566) (0.00)
15/10/19 USD 24,999 EUR 22,628 298 0.00
Unrealised gain on forward foreign currency exchange contracts 298 0.00
Unrealised loss on forward foreign currency exchange contracts (14,566) (0.00)
Net unrealised loss on forward foreign currency exchange contracts (14,268) (0.00)
Financial assets and financial liabilities at fair value 966,955,024 97.53
Other Net Assets 24,457,196 2.47
Net Assets 991,412,220 100.00
ADR - American Depositary Receipt
GDR - Global Depositary Receipt
The counterparty for the open forward foreign currency exchange contracts is:
- The Bank of New York Mellon
Analysis of Total Assets % of Total AssetsTransferable securities admitted to an official stock exchange listing or traded on a regulated market 96.04
Financial derivative instruments 0.00
Other assets 3.96
Total Assets 100.00

LA
ZA
RD
GL
OB
AL
AC
TIV
E F
UN
DS
PL
C
115Lazard Global Active Funds plc Financial period ended 30 September 2019
Portfolios of Investments (Unaudited) (continued)
Lazard Emerging Markets Core Equity FundPortfolio of Investments as at 30 September 2019
Shares Fair Value USD
% of NAV
Common Stock - 98.90% (31 March 2019: 98.01%)
Shares Fair Value USD
% of NAV
Common Stock - 98.90% (31 March 2019: 98.01%) (continued)
Brazil - 9.76% (31 March 2019: 7.28%)
21,884 Azul SA ADR 783,885 1.04
61,300 Banco BTG Pactual SA (Units) 861,645 1.14
155,100 Banco do Brasil SA 1,693,826 2.24
153,100 CCR SA 634,023 0.84
98,100 IRB Brasil Resseguros S/A 886,932 1.17
68,869 Itau Unibanco Holding SA ADR 579,188 0.77
172,900 Rumo SA 1,016,956 1.34
70,000 Telefonica Brasil SA ADR 921,900 1.22
7,378,355 9.76
Canada - 1.01% (31 March 2019: 1.03%)
50,000 Parex Resources Inc 766,600 1.01
China - 29.37% (31 March 2019: 27.15%)
20,770 Alibaba Group Holding Ltd ADR 3,473,367 4.59
6,477 Baidu Inc ADR 665,577 0.88
277,500 Budweiser Brewing Co APAC Ltd '144A' 998,226 1.32
1,352,000 China National Building Material Co Ltd 'H' 1,221,212 1.61
276,000 China Overseas Land & Investment Ltd 872,934 1.15
4,290,772 Industrial & Commercial Bank of China Ltd 'H' 2,864,476 3.79
3,471 NetEase Inc ADR 923,911 1.22
12,943 New Oriental Education & Technology Group Inc ADR 1,433,567 1.90
772,610 PICC Property & Casualty Co Ltd 'H' 906,839 1.20
203,000 Ping An Insurance Group Co of China Ltd 'H' 2,348,748 3.11
4,386 Prosus NV 322,040 0.43
79,228 Shenzhou International Group Holdings Ltd 1,042,110 1.38
112,800 Sinopharm Group Co Ltd 'H' 354,517 0.47
104,700 Tencent Holdings Ltd 4,442,469 5.87
33,500 Wuxi Biologics Cayman Inc '144A' 342,267 0.45
22,212,260 29.37
Colombia - 1.17% (31 March 2019: 1.19%)
17,900 Bancolombia SA ADR 885,155 1.17
Hong Kong - 1.15% (31 March 2019: 1.39%)
124,000 Techtronic Industries Co Ltd 870,036 1.15
Hungary - 0.84% (31 March 2019: 1.01%)
67,589 MOL Hungarian Oil & Gas Plc 635,628 0.84
India - 10.14% (31 March 2019: 10.72%)
47,500 HDFC Bank Ltd ADR 2,709,875 3.59
352,988 Hindalco Industries Ltd 954,724 1.26
198,290 Hindustan Zinc Ltd 598,591 0.79
91,260 Infosys Ltd ADR 1,037,626 1.37
8,598 Maruti Suzuki India Ltd 815,423 1.08
248,545 Motherson Sumi Systems Ltd 368,673 0.49
138,280 UPL Ltd 1,178,690 1.56
7,663,602 10.14
Indonesia - 2.24% (31 March 2019: 2.20%)
1,964,300 Bank Mandiri Persero Tbk PT 965,708 1.28
24,110 Telekomunikasi Indonesia Persero Tbk PT ADR 725,952 0.96
1,691,660 2.24
Luxembourg - 1.44% (31 March 2019: 1.99%)
17,100 Tenaris SA ADR 362,178 0.48
37,870 Ternium SA ADR 726,725 0.96
1,088,903 1.44
Mexico - 3.26% (31 March 2019: 3.01%)
123,590 Arca Continental SAB de CV 667,715 0.88
61,397 Gruma SAB de CV 627,964 0.83
5,200 Grupo Aeroportuario del Pacifico SAB de CV ADR 501,904 0.67
124,281 Grupo Financiero Banorte SAB de CV 667,672 0.88
2,465,255 3.26
Peru - 1.08% (31 March 2019: 1.20%)
3,899 Credicorp Ltd 812,708 1.08
Philippines - 2.45% (31 March 2019: 1.77%)
597,600 Ayala Land Inc 570,459 0.75
421,850 BDO Unibank Inc 1,162,815 1.54
7,514 GT Capital Holdings Inc 121,978 0.16
1,855,252 2.45
Poland - 0.63% (31 March 2019: 0.00%)
7,801 CD Projekt SA 474,372 0.63
Portugal - 0.94% (31 March 2019: 0.99%)
47,221 Galp Energia SGPS SA 710,438 0.94
Russia - 5.85% (31 March 2019: 7.35%)
31,098 LUKOIL PJSC ADR 2,567,956 3.40
130,829 Sberbank of Russia PJSC ADR 1,853,865 2.45
4,421,821 5.85
South Africa - 3.30% (31 March 2019: 3.94%)
48,349 Barloworld Ltd 368,683 0.49
51,846 Bidvest Group Ltd/The 653,264 0.86
196,574 FirstRand Ltd 807,791 1.07
4,386 Naspers Ltd 665,581 0.88
2,495,319 3.30
South Korea - 10.93% (31 March 2019: 10.84%)
12,307 DB Insurance Co Ltd 530,198 0.70
8,526 Fila Korea Ltd 412,869 0.55
2,091 NCSoft Corp 909,351 1.20
99,667 Samsung Electronics Co Ltd 4,066,407 5.38
18,388 SK Hynix Inc 1,264,491 1.67
6,519 S-Oil Corp 544,124 0.72
7,622 Woongjin Coway Co Ltd 539,524 0.71
8,266,964 10.93
Taiwan - 9.07% (31 March 2019: 9.50%)
297,000 Far EasTone Telecommunications Co Ltd 698,219 0.92
373,000 Formosa Plastics Corp 1,144,540 1.51
6,000 Largan Precision Co Ltd 865,643 1.15
89,356 Taiwan Semiconductor Manufacturing Co Ltd ADR 4,153,267 5.49
6,861,669 9.07
Thailand - 1.22% (31 March 2019: 1.39%)
78,000 Bangkok Bank PCL (Foreign Market) 449,488 0.59
92,600 Kasikornbank PCL (Foreign Market) 475,547 0.63
925,035 1.22
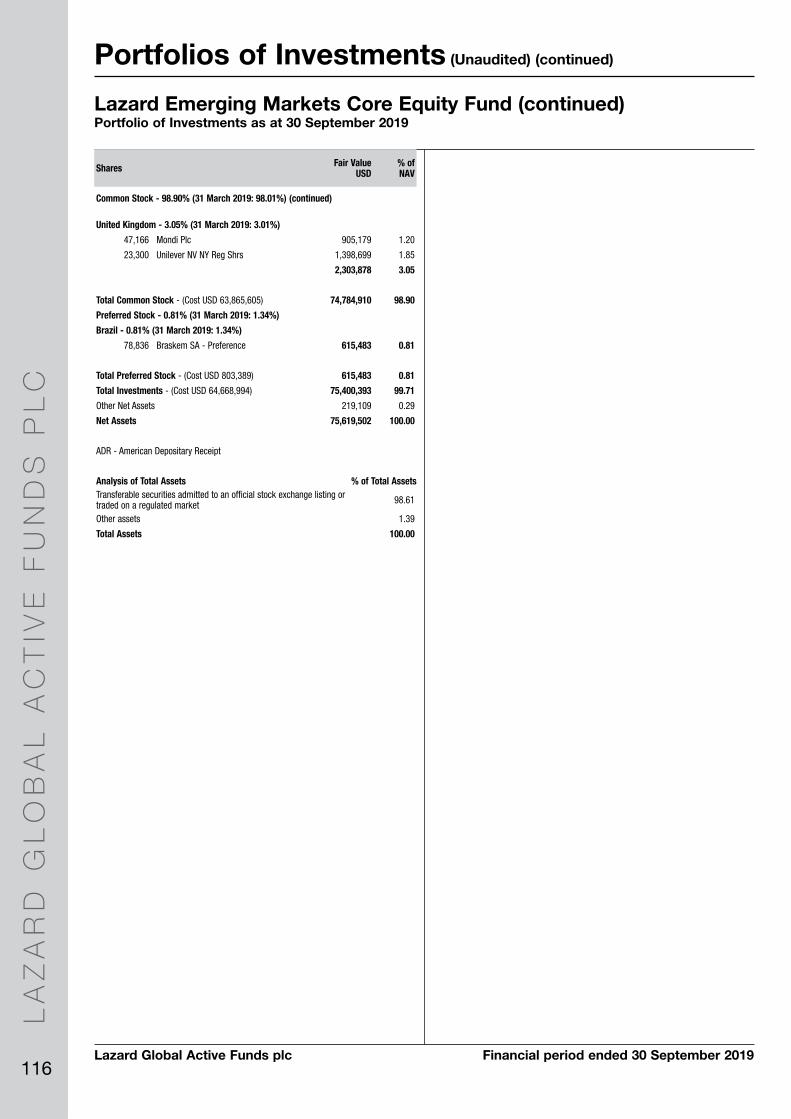
LA
ZA
RD
GL
OB
AL
AC
TIV
E F
UN
DS
PL
C
116
Portfolios of Investments (Unaudited) (continued)
Lazard Global Active Funds plc Financial period ended 30 September 2019
Lazard Emerging Markets Core Equity Fund (continued)Portfolio of Investments as at 30 September 2019
United Kingdom - 3.05% (31 March 2019: 3.01%)
47,166 Mondi Plc 905,179 1.20
23,300 Unilever NV NY Reg Shrs 1,398,699 1.85
2,303,878 3.05
Total Common Stock - (Cost USD 63,865,605) 74,784,910 98.90
Preferred Stock - 0.81% (31 March 2019: 1.34%)
Brazil - 0.81% (31 March 2019: 1.34%)
78,836 Braskem SA - Preference 615,483 0.81
Total Preferred Stock - (Cost USD 803,389) 615,483 0.81
Total Investments - (Cost USD 64,668,994) 75,400,393 99.71
Other Net Assets 219,109 0.29
Net Assets 75,619,502 100.00
ADR - American Depositary Receipt
Shares Fair Value USD
% of NAV
Common Stock - 98.90% (31 March 2019: 98.01%) (continued)
Analysis of Total Assets % of Total AssetsTransferable securities admitted to an official stock exchange listing or traded on a regulated market 98.61
Other assets 1.39
Total Assets 100.00

LA
ZA
RD
GL
OB
AL
AC
TIV
E F
UN
DS
PL
C
117Lazard Global Active Funds plc Financial period ended 30 September 2019
Portfolios of Investments (Unaudited) (continued)
Lazard Emerging Markets Equity Advantage FundPortfolio of Investments as at 30 September 2019
Shares Fair Value USD
% of NAV
Common Stock - 96.20% (31 March 2019: 99.06%)
Shares Fair Value USD
% of NAV
Common Stock - 96.20% (31 March 2019: 99.06%) (continued)
Argentina - 0.15% (31 March 2019: 0.00%)
1,450 Globant SA 132,791 0.15
Brazil - 4.82% (31 March 2019: 4.54%)
49,309 Banco Bradesco SA ADR 401,375 0.46
27,500 Banco do Brasil SA 300,324 0.35
40,200 Banco Santander Brasil SA (Units) 437,474 0.50
22,400 BB Seguridade Participacoes SA 188,378 0.22
86,600 CCR SA 358,631 0.41
112,500 IRB Brasil Resseguros S/A 1,017,124 1.17
15,960 Lojas Renner SA 193,378 0.22
103,500 Minerva SA/Brazil 243,256 0.28
75,100 Vale SA 860,903 0.99
21,600 YDUQS Part 187,095 0.22
4,187,938 4.82
Chile - 0.41% (31 March 2019: 0.61%)
16,207 Cia Cervecerias Unidas SA ADR 359,633 0.41
China - 31.82% (31 March 2019: 34.56%)
184,000 Air China Ltd 'H' 162,917 0.19
23,707 Alibaba Group Holding Ltd ADR 3,964,522 4.57
83,000 Anhui Conch Cement Co Ltd 'H' 494,961 0.57
10,800 Anhui Gujing Distillery Co Ltd 'A' 174,280 0.20
42,000 ANTA Sports Products Ltd 347,746 0.40
2,825 Autohome Inc ADR 234,842 0.27
2,400 Baidu Inc ADR 246,624 0.28
104,200 Bank of Nanjing Co Ltd 'A' 125,700 0.14
62,500 Beijing Enterprises Holdings Ltd 288,107 0.33
150,000 China Aoyuan Group Ltd 170,241 0.20
841,000 China CITIC Bank Corp Ltd 'H' 449,587 0.52
1,575,000 China Construction Bank Corp 'H' 1,197,438 1.38
67,000 China Evergrande Group 143,506 0.17
348,000 China Lesso Group Holdings Ltd 330,800 0.38
33,000 China Mengniu Dairy Co Ltd 123,140 0.14
162,500 China Merchants Bank Co Ltd 'H' 778,355 0.90
38,000 China Mobile Ltd 315,303 0.36
234,000 China Resources Cement Holdings Ltd 234,944 0.27
50,000 China Resources Gas Group Ltd 246,693 0.28
84,000 China Resources Land Ltd 350,135 0.40
308,000 China SCE Group Holdings Ltd 142,431 0.16
1,650,000 China Telecom Corp Ltd 'H' 753,831 0.87
716,000 China Unicom Hong Kong Ltd 756,837 0.87
39,200 China Vanke Co Ltd 'H' 137,211 0.16
182,000 CITIC Ltd 229,048 0.26
710,000 CNOOC Ltd 1,090,601 1.26
283,000 Country Garden Holdings Co Ltd 356,405 0.41
108,000 Country Garden Services Holdings Co Ltd 313,011 0.36
348,000 CSPC Pharmaceutical Group Ltd 703,489 0.81
15,800 ENN Energy Holdings Ltd 164,006 0.19
12,600 Foshan Haitian Flavouring & Food Co Ltd 'A' 194,341 0.22
74,200 Fujian Sunner Development Co Ltd 'A' 257,258 0.30
47,550 Hualan Biological Engineering Inc 'A' 229,039 0.26
54,820 Huaxin Cement Co Ltd 'A' 145,464 0.17
China - 31.82% (31 March 2019: 34.56%) (continued)
32,500 Hubei Jumpcan Pharmaceutical Co Ltd 'A' 129,379 0.15
908,000 Industrial & Commercial Bank of China Ltd 'H' 606,172 0.70
6,812 JD.com Inc ADR 192,167 0.22
15,020 Jiangsu Hengrui Medicine Co Ltd 'A' 170,284 0.20
236,000 Kunlun Energy Co Ltd 203,418 0.23
13,000 LexinFintech Holdings Ltd ADR 130,390 0.15
136,500 Li Ning Co Ltd 392,456 0.45
54,000 Longfor Group Holdings Ltd '144A' 202,455 0.23
44,700 Luxshare Precision Industry Co Ltd 'A' 169,210 0.20
14,700 Luzhou Laojiao Co Ltd 'A' 176,036 0.20
3,475 Momo Inc ADR 107,656 0.12
908 NetEase Inc ADR 241,691 0.28
4,590 New Oriental Education & Technology Group Inc ADR 508,388 0.59
922,000 PetroChina Co Ltd 'H' 475,676 0.55
210,000 PICC Property & Casualty Co Ltd 'H' 246,484 0.28
91,700 Ping An Bank Co Ltd 'A' 201,168 0.23
149,500 Ping An Insurance Group Co of China Ltd 'H' 1,729,743 1.99
93,300 Sany Heavy Industry Co Ltd 'A' 187,434 0.22
10,300 Sunny Optical Technology Group Co Ltd 153,608 0.18
70,800 Tangshan Jidong Cement Co Ltd 'A' 152,832 0.18
83,700 Tencent Holdings Ltd 3,551,430 4.09
21,667 Tencent Music Entertainment Group ADR 276,688 0.32
21,459 Vipshop Holdings Ltd ADR 191,414 0.22
214,200 Weichai Power Co Ltd 'A' 338,791 0.39
43,500 Wens Foodstuffs Group Co Ltd 'A' 227,166 0.26
946,000 West China Cement Ltd 154,666 0.18
8,614 Yum China Holdings Inc 391,334 0.45
1,825 YY Inc ADR 102,620 0.12
191,700 Zhengzhou Coal Mining Machinery Group Co Ltd 'A' 166,699 0.19
27,630,268 31.82
Colombia - 0.36% (31 March 2019: 0.18%)
18,109 Ecopetrol SA ADR 308,396 0.36
Greece - 0.39% (31 March 2019: 0.21%)
16,129 Hellenic Telecommunications Organization SA 222,354 0.26
5,910 JUMBO SA 112,313 0.13
334,667 0.39
Hong Kong - 0.35% (31 March 2019: 0.64%)
238,000 Sino Biopharmaceutical Ltd 304,276 0.35
Hungary - 0.68% (31 March 2019: 1.37%)
82,735 Magyar Telekom Telecommunications Plc 118,478 0.14
50,078 MOL Hungarian Oil & Gas Plc 470,949 0.54
589,427 0.68
India - 7.17% (31 March 2019: 7.35%)
7,675 Axis Bank Ltd GDR 374,293 0.43
4,233 Dr Reddy's Laboratories Ltd ADR 160,388 0.19
46,851 GAIL India Ltd GDR 520,266 0.60
21,404 HDFC Bank Ltd ADR 1,221,098 1.41
46,641 ICICI Bank Ltd ADR 568,088 0.65
121,949 Infosys Ltd ADR 1,386,560 1.60

LA
ZA
RD
GL
OB
AL
AC
TIV
E F
UN
DS
PL
C
118
Portfolios of Investments (Unaudited) (continued)
Lazard Global Active Funds plc Financial period ended 30 September 2019
Lazard Emerging Markets Equity Advantage Fund (continued)Portfolio of Investments as at 30 September 2019
India - 7.17% (31 March 2019: 7.35%) (continued)
16,325 Reliance Industries Ltd GDR '144A' 608,874 0.70
8,633 State Bank of India GDR 331,672 0.38
115,769 Wipro Ltd ADR 422,557 0.49
10,699 WNS Holdings Ltd ADR 628,566 0.72
6,222,362 7.17
Indonesia - 2.95% (31 March 2019: 2.65%)
239,900 Bank Central Asia Tbk PT 513,136 0.59
955,300 Bank Mandiri Persero Tbk PT 469,654 0.54
2,185,000 Bank Rakyat Indonesia Persero Tbk PT 634,539 0.73
19,303 Telekomunikasi Indonesia Persero Tbk PT ADR 581,213 0.67
110,900 Unilever Indonesia Tbk PT 363,872 0.42
2,562,414 2.95
Malaysia - 1.64% (31 March 2019: 1.98%)
409,300 Bermaz Auto Bhd 223,104 0.26
160,800 Genting Malaysia Bhd 116,638 0.13
97,700 MISC Bhd 181,818 0.21
7,100 Nestle Malaysia Bhd 247,081 0.28
119,100 Petronas Chemicals Group Bhd 214,693 0.25
327,500 RHB Bank Bhd 441,216 0.51
1,424,550 1.64
Mexico - 2.58% (31 March 2019: 2.98%)
241,700 Alfa SAB de CV 212,149 0.24
47,576 America Movil SAB de CV ADR 706,979 0.81
63,300 Grupo Aeroportuario del Centro Norte SAB de CV - Class B 375,363 0.43
78,700 Qualitas Controladora SAB de CV 282,570 0.33
224,200 Wal-Mart de Mexico SAB de CV 664,062 0.77
2,241,123 2.58
Peru - 0.15% (31 March 2019: 0.26%)
642 Credicorp Ltd 133,818 0.15
Philippines - 1.72% (31 March 2019: 1.42%)
181,500 Cebu Air Inc 315,254 0.36
983,400 DMCI Holdings Inc 157,831 0.18
126,250 International Container Terminal Services Inc 293,875 0.34
153,090 JG Summit Holdings Inc 214,032 0.25
1,236,700 Megaworld Corp 104,333 0.12
21,640 SM Investments Corp 404,963 0.47
1,490,288 1.72
Poland - 1.53% (31 March 2019: 1.05%)
2,667 CD Projekt SA 162,178 0.19
6,417 Dino Polska SA '144A' 251,587 0.29
68,968 Enea SA 147,991 0.17
37,476 PGE Polska Grupa Energetyczna SA 74,727 0.09
19,925 PLAY Communications SA '144A' 136,681 0.16
47,690 Powszechna Kasa Oszczednosci Bank Polski SA 468,191 0.54
212,804 Tauron Polska Energia SA 82,226 0.09
1,323,581 1.53
Russia - 5.07% (31 March 2019: 4.10%)
75,000 Gazprom PJSC ADR 516,708 0.59
11,067 LUKOIL PJSC ADR 913,871 1.05
19,629 MMC Norilsk Nickel PJSC ADR 502,384 0.58
Russia - 5.07% (31 March 2019: 4.10%) (continued)
758 Novatek PJSC GDR 153,408 0.18
14,272 Novolipetsk Steel PJSC GDR 310,122 0.36
220,008 RusHydro PJSC ADR 178,346 0.20
57,426 Sberbank of Russia PJSC ADR 813,734 0.94
20,675 Severstal PJSC GDR 296,710 0.34
8,305 Tatneft PJSC ADR 527,138 0.61
147,881 VTB Bank PJSC GDR 191,494 0.22
4,403,915 5.07
South Africa - 3.12% (31 March 2019: 4.22%)
11,359 Anglo American Platinum Ltd 684,244 0.79
1,704 Capitec Bank Holdings Ltd 144,739 0.17
10,838 Exxaro Resources Ltd 93,380 0.11
73,010 FirstRand Ltd 300,023 0.34
63,789 Harmony Gold Mining Co Ltd ADR 181,161 0.21
50,637 MTN Group Ltd 321,728 0.37
6,495 Naspers Ltd 985,625 1.13
2,710,900 3.12
South Korea - 13.47% (31 March 2019: 14.75%)
3,200 AfreecaTV Co Ltd 172,228 0.20
4,617 Daelim Industrial Co Ltd 402,370 0.46
2,967 Douzone Bizon Co Ltd 161,462 0.19
10,353 Hana Financial Group Inc 305,576 0.35
5,272 Hanwha Aerospace Co Ltd 186,033 0.21
1,533 Hyundai Mobis Co Ltd 323,810 0.37
37,267 Industrial Bank of Korea 411,344 0.47
10,376 KB Financial Group Inc 371,167 0.43
20,600 Kia Motors Corp 787,602 0.91
22,492 Koentec Co Ltd 200,342 0.23
9,342 KT&G Corp 824,698 0.95
592 LG Chem Ltd 147,673 0.17
2,842 LG Electronics Inc 159,544 0.18
425 LG Household & Health Care Ltd 465,174 0.54
39,367 LG Uplus Corp 450,067 0.52
775 NCSoft Corp 337,038 0.39
892 POSCO 168,948 0.20
2,150 Samsung Electro-Mechanics Co Ltd 185,930 0.21
4,256 Samsung Electronics Co Ltd GDR 4,332,170 4.99
1,683 Samsung SDS Co Ltd 268,867 0.31
10,792 SK Hynix Inc 742,136 0.86
4,736 Soulbrain Co Ltd 289,085 0.33
11,693,264 13.47
Taiwan - 12.63% (31 March 2019: 12.41%)
70,000 Advantech Co Ltd 620,343 0.71
308,000 Asia Cement Corp 433,097 0.50
68,260 Chailease Holding Co Ltd 276,974 0.32
104,000 Chicony Electronics Co Ltd 308,061 0.36
67,000 Delta Electronics Inc 288,132 0.33
514,918 Eva Airways Corp 228,255 0.26
82,300 Feng TAY Enterprise Co Ltd 594,389 0.69
25,000 International Games System Co Ltd 315,281 0.36
29,100 Makalot Industrial Co Ltd 154,958 0.18
80,000 Nanya Technology Corp 208,945 0.24
Shares Fair Value USD
% of NAV
Common Stock - 96.20% (31 March 2019: 99.06%) (continued)
Shares Fair Value USD
% of NAV
Common Stock - 96.20% (31 March 2019: 99.06%) (continued)

LA
ZA
RD
GL
OB
AL
AC
TIV
E F
UN
DS
PL
C
119Lazard Global Active Funds plc Financial period ended 30 September 2019
Portfolios of Investments (Unaudited) (continued)
Lazard Emerging Markets Equity Advantage Fund (continued)Portfolio of Investments as at 30 September 2019
Taiwan - 12.63% (31 March 2019: 12.41%) (continued)
42,000 President Chain Store Corp 395,573 0.46
58,000 Rexon Industrial Corp Ltd 167,599 0.19
108,732 Taiwan Semiconductor Manufacturing Co Ltd ADR 5,053,863 5.82
175,000 Taiwan Styrene Monomer 123,606 0.14
100,000 Uni-President Enterprises Corp 242,579 0.28
1,997,000 Yuanta Financial Holding Co Ltd 1,192,702 1.37
102,000 Zhen Ding Technology Holding Ltd 365,757 0.42
10,970,114 12.63
Thailand - 4.04% (31 March 2019: 1.93%)
39,200 Advanced Info Service PCL (Foreign Market) 281,968 0.33
68,300 Central Pattana PCL NVDR 152,167 0.18
360,800 Com7 PCL NVDR 288,065 0.33
120,000 CP ALL PCL (Foreign Market) 318,784 0.37
557,500 Home Product Center PCL (Foreign Market) 311,697 0.36
238,300 Krungthai Card PCL NVDR 332,206 0.38
217,500 PTG Energy PCL NVDR 134,166 0.15
114,200 PTT Exploration & Production PCL (Foreign Market) 451,797 0.52
164,200 Ratch Group PCL NVDR 383,962 0.44
197,500 Supalai PCL (Foreign Market) 116,233 0.13
232,500 Thanachart Capital PCL NVDR 432,872 0.50
90,800 Tisco Financial Group PCL NVDR 304,822 0.35
3,508,739 4.04
Turkey - 0.95% (31 March 2019: 1.05%)
23,696 BIM Birlesik Magazalar AS 206,401 0.24
82,035 Haci Omer Sabanci Holding AS 139,185 0.16
188,128 Turk Telekomunikasyon AS 193,666 0.22
161,461 Turkiye Garanti Bankasi AS ADR 280,942 0.33
820,194 0.95
United States - 0.20% (31 March 2019: 0.00%)
22,500 JBS SA 177,119 0.20
Total Common Stock - (Cost USD 85,145,955) 83,529,777 96.20
Preferred Stock - 0.66% (31 March 2019: 1.07%)
Brazil - 0.66% (31 March 2019: 1.07%)
87,042 Petroleo Brasileiro SA - Preference 575,693 0.66
Total Preferred Stock - (Cost USD 613,072) 575,693 0.66
Total Investments - (Cost USD 85,759,027) 84,105,470 96.86
Shares Fair Value USD
% of NAV
Common Stock - 96.20% (31 March 2019: 99.06%) (continued)
Maturity Date
Amount Bought
Amount Sold
Unrealised Gain/(Loss)
USD
% of NAV
Open forward foreign currency exchange contracts - (0.00)%
15/10/19 EUR 1,660,479 USD 1,841,453 (28,975) (0.03)
15/10/19 USD 1,786,844 EUR 1,614,001 25,099 0.03
Unrealised gain on forward foreign currency exchange contracts 25,099 0.03
Unrealised loss on forward foreign currency exchange contracts (28,975) (0.03)
Net unrealised loss on forward foreign currency exchange contracts (3,876) (0.00)
Financial assets and financial liabilities at fair value 84,101,594 96.86
Other Net Assets 2,729,679 3.14
Net Assets 86,831,273 100.00
ADR - American Depositary Receipt
GDR - Global Depositary Receipt
NVDR - Nonvoting Depositary Receipt
The counterparty for the open forward foreign currency exchange contracts is:
- The Bank of New York Mellon
Analysis of Total Assets % of Total AssetsTransferable securities admitted to an official stock exchange listing or traded on a regulated market 96.28
Financial derivative instruments 0.03
Other assets 3.69
Total Assets 100.00
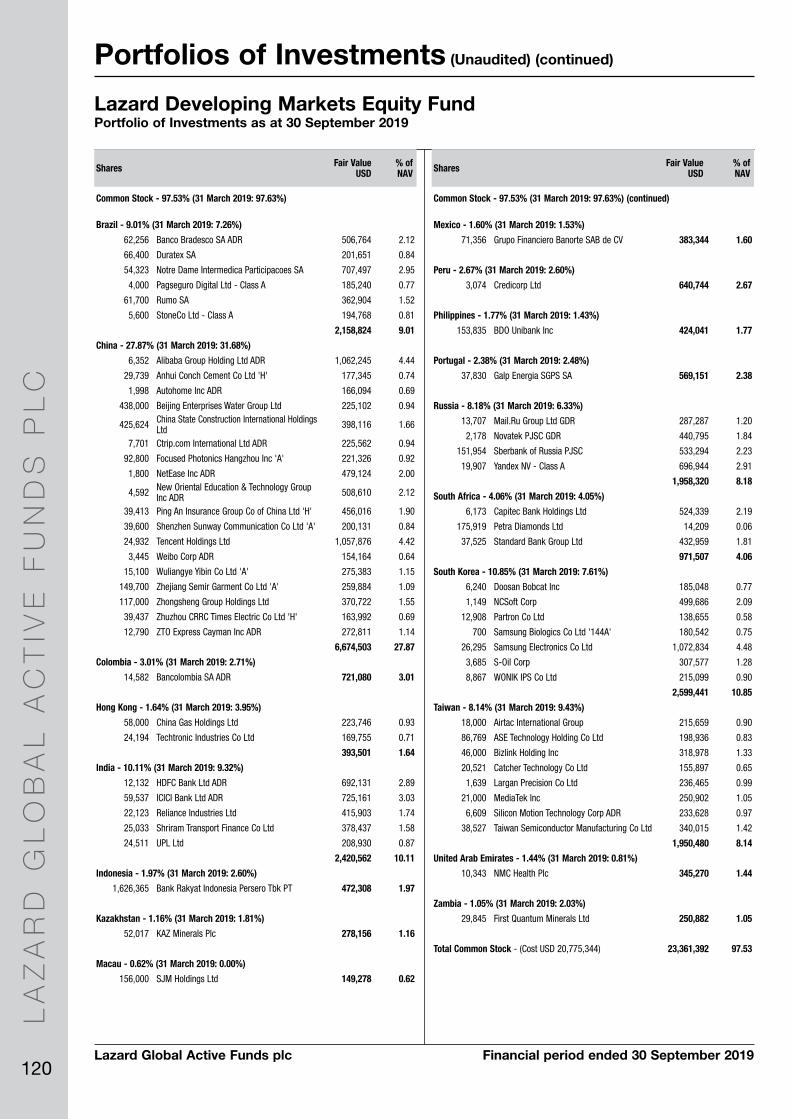
LA
ZA
RD
GL
OB
AL
AC
TIV
E F
UN
DS
PL
C
120
Portfolios of Investments (Unaudited) (continued)
Lazard Global Active Funds plc Financial period ended 30 September 2019
Lazard Developing Markets Equity FundPortfolio of Investments as at 30 September 2019
Brazil - 9.01% (31 March 2019: 7.26%)
62,256 Banco Bradesco SA ADR 506,764 2.12
66,400 Duratex SA 201,651 0.84
54,323 Notre Dame Intermedica Participacoes SA 707,497 2.95
4,000 Pagseguro Digital Ltd - Class A 185,240 0.77
61,700 Rumo SA 362,904 1.52
5,600 StoneCo Ltd - Class A 194,768 0.81
2,158,824 9.01
China - 27.87% (31 March 2019: 31.68%)
6,352 Alibaba Group Holding Ltd ADR 1,062,245 4.44
29,739 Anhui Conch Cement Co Ltd 'H' 177,345 0.74
1,998 Autohome Inc ADR 166,094 0.69
438,000 Beijing Enterprises Water Group Ltd 225,102 0.94
425,624 China State Construction International Holdings Ltd 398,116 1.66
7,701 Ctrip.com International Ltd ADR 225,562 0.94
92,800 Focused Photonics Hangzhou Inc 'A' 221,326 0.92
1,800 NetEase Inc ADR 479,124 2.00
4,592 New Oriental Education & Technology Group Inc ADR 508,610 2.12
39,413 Ping An Insurance Group Co of China Ltd 'H' 456,016 1.90
39,600 Shenzhen Sunway Communication Co Ltd 'A' 200,131 0.84
24,932 Tencent Holdings Ltd 1,057,876 4.42
3,445 Weibo Corp ADR 154,164 0.64
15,100 Wuliangye Yibin Co Ltd 'A' 275,383 1.15
149,700 Zhejiang Semir Garment Co Ltd 'A' 259,884 1.09
117,000 Zhongsheng Group Holdings Ltd 370,722 1.55
39,437 Zhuzhou CRRC Times Electric Co Ltd 'H' 163,992 0.69
12,790 ZTO Express Cayman Inc ADR 272,811 1.14
6,674,503 27.87
Colombia - 3.01% (31 March 2019: 2.71%)
14,582 Bancolombia SA ADR 721,080 3.01
Hong Kong - 1.64% (31 March 2019: 3.95%)
58,000 China Gas Holdings Ltd 223,746 0.93
24,194 Techtronic Industries Co Ltd 169,755 0.71
393,501 1.64
India - 10.11% (31 March 2019: 9.32%)
12,132 HDFC Bank Ltd ADR 692,131 2.89
59,537 ICICI Bank Ltd ADR 725,161 3.03
22,123 Reliance Industries Ltd 415,903 1.74
25,033 Shriram Transport Finance Co Ltd 378,437 1.58
24,511 UPL Ltd 208,930 0.87
2,420,562 10.11
Indonesia - 1.97% (31 March 2019: 2.60%)
1,626,365 Bank Rakyat Indonesia Persero Tbk PT 472,308 1.97
Kazakhstan - 1.16% (31 March 2019: 1.81%)
52,017 KAZ Minerals Plc 278,156 1.16
Macau - 0.62% (31 March 2019: 0.00%)
156,000 SJM Holdings Ltd 149,278 0.62
Mexico - 1.60% (31 March 2019: 1.53%)
71,356 Grupo Financiero Banorte SAB de CV 383,344 1.60
Peru - 2.67% (31 March 2019: 2.60%)
3,074 Credicorp Ltd 640,744 2.67
Philippines - 1.77% (31 March 2019: 1.43%)
153,835 BDO Unibank Inc 424,041 1.77
Portugal - 2.38% (31 March 2019: 2.48%)
37,830 Galp Energia SGPS SA 569,151 2.38
Russia - 8.18% (31 March 2019: 6.33%)
13,707 Mail.Ru Group Ltd GDR 287,287 1.20
2,178 Novatek PJSC GDR 440,795 1.84
151,954 Sberbank of Russia PJSC 533,294 2.23
19,907 Yandex NV - Class A 696,944 2.91
1,958,320 8.18
South Africa - 4.06% (31 March 2019: 4.05%)
6,173 Capitec Bank Holdings Ltd 524,339 2.19
175,919 Petra Diamonds Ltd 14,209 0.06
37,525 Standard Bank Group Ltd 432,959 1.81
971,507 4.06
South Korea - 10.85% (31 March 2019: 7.61%)
6,240 Doosan Bobcat Inc 185,048 0.77
1,149 NCSoft Corp 499,686 2.09
12,908 Partron Co Ltd 138,655 0.58
700 Samsung Biologics Co Ltd '144A' 180,542 0.75
26,295 Samsung Electronics Co Ltd 1,072,834 4.48
3,685 S-Oil Corp 307,577 1.28
8,867 WONIK IPS Co Ltd 215,099 0.90
2,599,441 10.85
Taiwan - 8.14% (31 March 2019: 9.43%)
18,000 Airtac International Group 215,659 0.90
86,769 ASE Technology Holding Co Ltd 198,936 0.83
46,000 Bizlink Holding Inc 318,978 1.33
20,521 Catcher Technology Co Ltd 155,897 0.65
1,639 Largan Precision Co Ltd 236,465 0.99
21,000 MediaTek Inc 250,902 1.05
6,609 Silicon Motion Technology Corp ADR 233,628 0.97
38,527 Taiwan Semiconductor Manufacturing Co Ltd 340,015 1.42
1,950,480 8.14
United Arab Emirates - 1.44% (31 March 2019: 0.81%)
10,343 NMC Health Plc 345,270 1.44
Zambia - 1.05% (31 March 2019: 2.03%)
29,845 First Quantum Minerals Ltd 250,882 1.05
Total Common Stock - (Cost USD 20,775,344) 23,361,392 97.53
Shares Fair Value USD
% of NAV
Common Stock - 97.53% (31 March 2019: 97.63%)
Shares Fair Value USD
% of NAV
Common Stock - 97.53% (31 March 2019: 97.63%) (continued)

LA
ZA
RD
GL
OB
AL
AC
TIV
E F
UN
DS
PL
C
121Lazard Global Active Funds plc Financial period ended 30 September 2019
Portfolios of Investments (Unaudited) (continued)
Lazard Developing Markets Equity Fund (continued)Portfolio of Investments as at 30 September 2019
Brazil - 1.51% (31 March 2019: 1.03%)
54,609 Petroleo Brasileiro SA - Preference 361,183 1.51
Total Preferred Stock - (Cost USD 315,152) 361,183 1.51
Total Investments - (Cost USD 21,090,496) 23,722,575 99.04
Other Net Assets 229,731 0.96
Net Assets 23,952,306 100.00
ADR - American Depositary Receipt
GDR - Global Depositary Receipt
Shares Fair Value USD
% of NAV
Preferred Stock - 1.51% (31 March 2019: 1.03%)
Analysis of Total Assets % of Total AssetsTransferable securities admitted to an official stock exchange listing or traded on a regulated market 98.20
Other assets 1.80
Total Assets 100.00
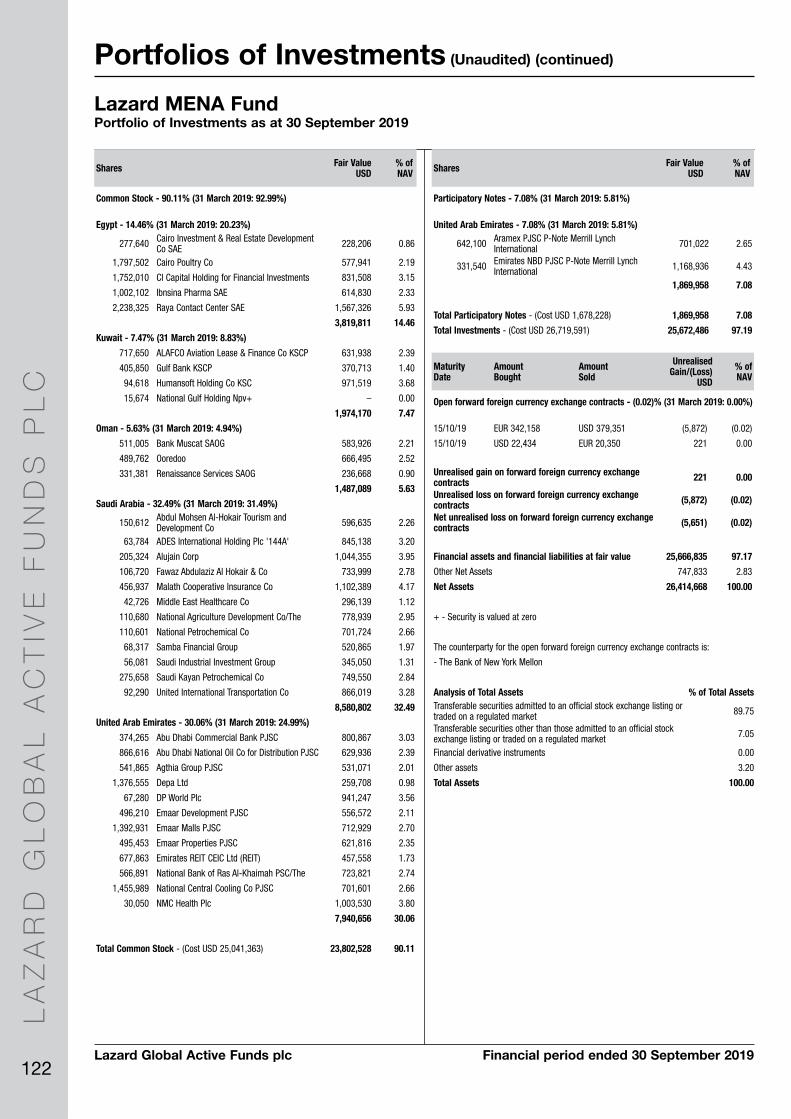
LA
ZA
RD
GL
OB
AL
AC
TIV
E F
UN
DS
PL
C
122
Portfolios of Investments (Unaudited) (continued)
Lazard Global Active Funds plc Financial period ended 30 September 2019
United Arab Emirates - 7.08% (31 March 2019: 5.81%)
642,100 Aramex PJSC P-Note Merrill Lynch International 701,022 2.65
331,540 Emirates NBD PJSC P-Note Merrill Lynch International 1,168,936 4.43
1,869,958 7.08
Total Participatory Notes - (Cost USD 1,678,228) 1,869,958 7.08
Total Investments - (Cost USD 26,719,591) 25,672,486 97.19
Lazard MENA FundPortfolio of Investments as at 30 September 2019
Egypt - 14.46% (31 March 2019: 20.23%)
277,640 Cairo Investment & Real Estate Development Co SAE 228,206 0.86
1,797,502 Cairo Poultry Co 577,941 2.19
1,752,010 CI Capital Holding for Financial Investments 831,508 3.15
1,002,102 Ibnsina Pharma SAE 614,830 2.33
2,238,325 Raya Contact Center SAE 1,567,326 5.93
3,819,811 14.46
Kuwait - 7.47% (31 March 2019: 8.83%)
717,650 ALAFCO Aviation Lease & Finance Co KSCP 631,938 2.39
405,850 Gulf Bank KSCP 370,713 1.40
94,618 Humansoft Holding Co KSC 971,519 3.68
15,674 National Gulf Holding Npv+ – 0.00
1,974,170 7.47
Oman - 5.63% (31 March 2019: 4.94%)
511,005 Bank Muscat SAOG 583,926 2.21
489,762 Ooredoo 666,495 2.52
331,381 Renaissance Services SAOG 236,668 0.90
1,487,089 5.63
Saudi Arabia - 32.49% (31 March 2019: 31.49%)
150,612 Abdul Mohsen Al-Hokair Tourism and Development Co 596,635 2.26
63,784 ADES International Holding Plc '144A' 845,138 3.20
205,324 Alujain Corp 1,044,355 3.95
106,720 Fawaz Abdulaziz Al Hokair & Co 733,999 2.78
456,937 Malath Cooperative Insurance Co 1,102,389 4.17
42,726 Middle East Healthcare Co 296,139 1.12
110,680 National Agriculture Development Co/The 778,939 2.95
110,601 National Petrochemical Co 701,724 2.66
68,317 Samba Financial Group 520,865 1.97
56,081 Saudi Industrial Investment Group 345,050 1.31
275,658 Saudi Kayan Petrochemical Co 749,550 2.84
92,290 United International Transportation Co 866,019 3.28
8,580,802 32.49
United Arab Emirates - 30.06% (31 March 2019: 24.99%)
374,265 Abu Dhabi Commercial Bank PJSC 800,867 3.03
866,616 Abu Dhabi National Oil Co for Distribution PJSC 629,936 2.39
541,865 Agthia Group PJSC 531,071 2.01
1,376,555 Depa Ltd 259,708 0.98
67,280 DP World Plc 941,247 3.56
496,210 Emaar Development PJSC 556,572 2.11
1,392,931 Emaar Malls PJSC 712,929 2.70
495,453 Emaar Properties PJSC 621,816 2.35
677,863 Emirates REIT CEIC Ltd (REIT) 457,558 1.73
566,891 National Bank of Ras Al-Khaimah PSC/The 723,821 2.74
1,455,989 National Central Cooling Co PJSC 701,601 2.66
30,050 NMC Health Plc 1,003,530 3.80
7,940,656 30.06
Total Common Stock - (Cost USD 25,041,363) 23,802,528 90.11
Shares Fair Value USD
% of NAV
Common Stock - 90.11% (31 March 2019: 92.99%)
Shares Fair Value USD
% of NAV
Participatory Notes - 7.08% (31 March 2019: 5.81%)
Maturity Date
Amount Bought
Amount Sold
Unrealised Gain/(Loss)
USD
% of NAV
Open forward foreign currency exchange contracts - (0.02)% (31 March 2019: 0.00%)
15/10/19 EUR 342,158 USD 379,351 (5,872) (0.02)
15/10/19 USD 22,434 EUR 20,350 221 0.00
Unrealised gain on forward foreign currency exchange contracts 221 0.00
Unrealised loss on forward foreign currency exchange contracts (5,872) (0.02)
Net unrealised loss on forward foreign currency exchange contracts (5,651) (0.02)
Financial assets and financial liabilities at fair value 25,666,835 97.17
Other Net Assets 747,833 2.83
Net Assets 26,414,668 100.00
+ - Security is valued at zero
The counterparty for the open forward foreign currency exchange contracts is:
- The Bank of New York Mellon
Analysis of Total Assets % of Total AssetsTransferable securities admitted to an official stock exchange listing or traded on a regulated market 89.75
Transferable securities other than those admitted to an official stock exchange listing or traded on a regulated market 7.05
Financial derivative instruments 0.00
Other assets 3.20
Total Assets 100.00

LA
ZA
RD
GL
OB
AL
AC
TIV
E F
UN
DS
PL
C
123Lazard Global Active Funds plc Financial period ended 30 September 2019
Portfolios of Investments (Unaudited) (continued)
Australia - 2.01% (31 March 2019: 3.85%)
406,000 Queensland Treasury Corp '144A' 3.000 22/03/24 297,002 0.98
200,000 Telstra Corp Ltd 'MTN' 2.900 19/04/21 137,943 0.46
240,000 Telstra Corp Ltd 'MTN' 4.000 16/09/22 173,478 0.57
608,423 2.01
Bahamas - 1.84% (31 March 2019: 2.47%)
492,000 Bahamas Government International Bond 'REGS' 6.950 20/11/29 556,575 1.84
Bermuda - 2.00% (31 March 2019: 2.83%)
550,000 Bermuda Government International Bond 'REGS' 4.854 06/02/24 606,423 2.00
Canada - 4.24% (31 March 2019: 3.85%)
425,000 Canadian Imperial Bank of Commerce 2.900 14/09/21 325,875 1.08
205,000 City of Vancouver 2.900 20/11/25 162,662 0.54
600,000 Export Development Canada 1.800 01/09/22 455,039 1.50
250,000 Province of Quebec Canada 1.650 03/03/22 188,455 0.62
195,000 Rogers Communications Inc 3.250 01/05/29 151,879 0.50
1,283,910 4.24
Chile - 3.04% (31 March 2019: 3.13%)
390,000,000 Bonos de la Tesoreria de la Republica en pesos 4.500 01/03/26 600,869 1.98
185,000,000 Bonos de la Tesoreria de la Republica en pesos 5.000 01/03/35 319,782 1.06
920,651 3.04
Colombia - 0.88% (31 March 2019: 0.93%)
731,000,000 Colombia Government International Bond 9.850 28/06/27 267,891 0.88
Croatia - 0.73% (31 March 2019: 1.06%)
200,000 Croatia Government International Bond 'REGS' 5.500 04/04/23 221,932 0.73
Czech Republic - 2.96% (31 March 2019: 2.28%)
20,770,000 Czech Republic Government Bond FRN 2.150 19/11/27 896,318 2.96
France - 3.30% (31 March 2019: 2.29%)
470,000 French Republic Government Bond OAT '144A' 1.750 25/06/39 664,263 2.19
330,000 Schneider Electric SE 'REGS' 2.950 27/09/22 337,375 1.11
1,001,638 3.30
Germany - 3.13% (31 March 2019: 2.28%)
185,000 BMW Finance NV 'EMTN' 0.875 16/08/22 226,530 0.75
125,000 Fresenius Medical Care US Finance II Inc 'REGS' 4.125 15/10/20 126,571 0.42
875,000 Kreditanstalt fuer Wiederaufbau 'MTN' 2.750 16/04/20 595,251 1.96
948,352 3.13
Hungary - 3.85% (31 March 2019: 3.41%)
81,280,000 Hungary Government Bond 2.500 24/10/24 283,866 0.94
81,910,000 Hungary Government Bond 2.750 22/12/26 291,014 0.96
87,290,000 Hungary Government Bond 3.000 27/10/27 315,591 1.04
260,000 Hungary Government International Bond 6.375 29/03/21 275,985 0.91
1,166,456 3.85
Ireland - 2.04% (31 March 2019: 2.03%)
250,000 Ireland Government Bond 1.350 18/03/31 311,727 1.03
230,000 Ireland Government Bond 1.700 15/05/37 305,056 1.01
616,783 2.04
Italy - 1.07% (31 March 2019: 1.00%)
280,000 Republic of Italy Government International Bond 6.875 27/09/23 324,968 1.07
Japan - 1.32% (31 March 2019: 1.90%)
200,000 Japan International Cooperation Agency 1.875 13/11/19 199,969 0.66
200,000 Japan International Cooperation Agency 2.125 20/10/26 201,201 0.66
401,170 1.32
Mexico - 1.71% (31 March 2019: 2.25%)
62,542,000 Mexico Cetes (Zero Coupon) Zero Coupon 23/04/20 304,348 1.01
143,000 Mexico Government International Bond 'GMTN' 6.750 06/02/24 212,383 0.70
516,731 1.71
Morocco - 1.55% (31 March 2019: 1.24%)
450,000 Morocco Government International Bond 'REGS' 4.250 11/12/22 470,755 1.55
Multi-National - 9.64% (31 March 2019: 10.66%)
230,000 Asian Development Bank 'GMTN' 1.000 15/12/22 286,672 0.95
348,000 Asian Development Bank 'GMTN' 2.125 19/03/25 356,775 1.18
160,000 European Bank for Reconstruction & Development 1.625 27/09/24 159,846 0.53
260,000 European Investment Bank '144A' 1.125 16/09/21 194,224 0.64
185,000 European Investment Bank 'REGS' 1.125 16/09/21 138,290 0.46
9,750,000 International Bank for Reconstruction & Development 5.750 28/10/19 137,468 0.45
605,000 International Bank for Reconstruction & Development 2.500 03/08/23 469,998 1.55
240,000International Bank for Reconstruction & Development 'GMTN'
3.500 22/01/21 155,046 0.51
160,000International Bank for Reconstruction & Development 'MTN'
2.900 26/11/25 118,073 0.39
340,000 International Finance Corp 'GMTN' 2.125 07/04/26 350,017 1.15
415,000 International Finance Corp 'MTN' 3.625 20/05/20 264,254 0.87
410,000 International Finance Corp 'MTN' 2.700 15/03/23 291,002 0.96
2,921,665 9.64
Netherlands - 1.71% (31 March 2019: 1.76%)
445,000 BNG Bank NV 'EMTN' 5.000 16/09/20 288,574 0.95
220,000 Nederlandse Waterschapsbank NV 'REGS' 3.125 05/12/22 229,886 0.76
518,460 1.71
New Zealand - 1.52% (31 March 2019: 1.94%)
200,000 Fonterra Co-operative Group Ltd 'MTN' 5.500 26/02/24 156,428 0.52
450,000 New Zealand Local Government Funding Agency Bond 6.000 15/05/21 304,275 1.00
460,703 1.52
Norway - 3.60% (31 March 2019: 4.96%)
5,000,000 City of Oslo Norway 2.350 04/09/24 560,809 1.85
3,000,000 City of Oslo Norway 'EMTN' 'FRN' 2.080 06/05/26 331,269 1.09
200,000 Kommunalbanken AS 'REGS' 1.375 26/10/20 198,914 0.66
1,090,992 3.60
Principal Amount
Coupon Rate %
Maturity Date
Fair Value USD
% of NAV
Bonds - 98.92% (31 March 2019: 99.58%)
Principal Amount
Coupon Rate %
Maturity Date
Fair Value USD
% of NAV
Bonds - 98.92% (31 March 2019: 99.58%) (continued)
Lazard Global Fixed Income FundPortfolio of Investments as at 30 September 2019
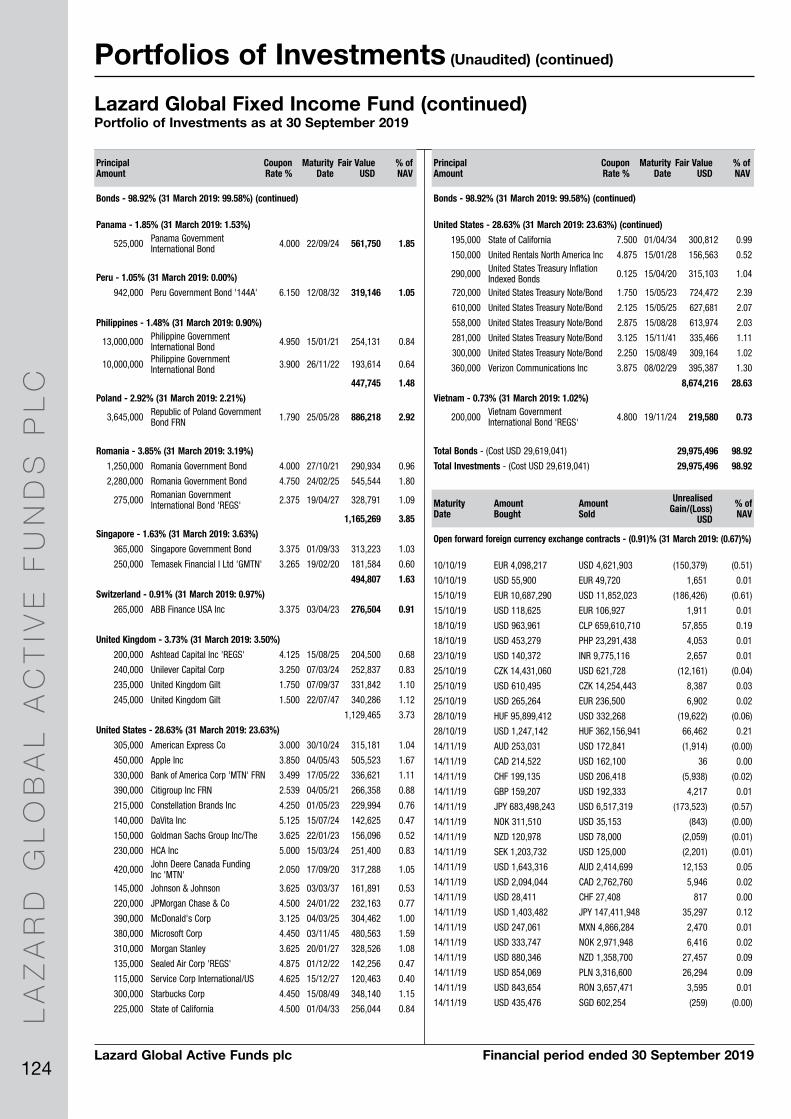
LA
ZA
RD
GL
OB
AL
AC
TIV
E F
UN
DS
PL
C
124
Portfolios of Investments (Unaudited) (continued)
Lazard Global Active Funds plc Financial period ended 30 September 2019
Panama - 1.85% (31 March 2019: 1.53%)
525,000 Panama Government International Bond 4.000 22/09/24 561,750 1.85
Peru - 1.05% (31 March 2019: 0.00%)
942,000 Peru Government Bond '144A' 6.150 12/08/32 319,146 1.05
Philippines - 1.48% (31 March 2019: 0.90%)
13,000,000 Philippine Government International Bond 4.950 15/01/21 254,131 0.84
10,000,000 Philippine Government International Bond 3.900 26/11/22 193,614 0.64
447,745 1.48
Poland - 2.92% (31 March 2019: 2.21%)
3,645,000 Republic of Poland Government Bond FRN 1.790 25/05/28 886,218 2.92
Romania - 3.85% (31 March 2019: 3.19%)
1,250,000 Romania Government Bond 4.000 27/10/21 290,934 0.96
2,280,000 Romania Government Bond 4.750 24/02/25 545,544 1.80
275,000 Romanian Government International Bond 'REGS' 2.375 19/04/27 328,791 1.09
1,165,269 3.85
Singapore - 1.63% (31 March 2019: 3.63%)
365,000 Singapore Government Bond 3.375 01/09/33 313,223 1.03
250,000 Temasek Financial I Ltd 'GMTN' 3.265 19/02/20 181,584 0.60
494,807 1.63
Switzerland - 0.91% (31 March 2019: 0.97%)
265,000 ABB Finance USA Inc 3.375 03/04/23 276,504 0.91
United Kingdom - 3.73% (31 March 2019: 3.50%)
200,000 Ashtead Capital Inc 'REGS' 4.125 15/08/25 204,500 0.68
240,000 Unilever Capital Corp 3.250 07/03/24 252,837 0.83
235,000 United Kingdom Gilt 1.750 07/09/37 331,842 1.10
245,000 United Kingdom Gilt 1.500 22/07/47 340,286 1.12
1,129,465 3.73
United States - 28.63% (31 March 2019: 23.63%)
305,000 American Express Co 3.000 30/10/24 315,181 1.04
450,000 Apple Inc 3.850 04/05/43 505,523 1.67
330,000 Bank of America Corp 'MTN' FRN 3.499 17/05/22 336,621 1.11
390,000 Citigroup Inc FRN 2.539 04/05/21 266,358 0.88
215,000 Constellation Brands Inc 4.250 01/05/23 229,994 0.76
140,000 DaVita Inc 5.125 15/07/24 142,625 0.47
150,000 Goldman Sachs Group Inc/The 3.625 22/01/23 156,096 0.52
230,000 HCA Inc 5.000 15/03/24 251,400 0.83
420,000 John Deere Canada Funding Inc 'MTN' 2.050 17/09/20 317,288 1.05
145,000 Johnson & Johnson 3.625 03/03/37 161,891 0.53
220,000 JPMorgan Chase & Co 4.500 24/01/22 232,163 0.77
390,000 McDonald's Corp 3.125 04/03/25 304,462 1.00
380,000 Microsoft Corp 4.450 03/11/45 480,563 1.59
310,000 Morgan Stanley 3.625 20/01/27 328,526 1.08
135,000 Sealed Air Corp 'REGS' 4.875 01/12/22 142,256 0.47
115,000 Service Corp International/US 4.625 15/12/27 120,463 0.40
300,000 Starbucks Corp 4.450 15/08/49 348,140 1.15
225,000 State of California 4.500 01/04/33 256,044 0.84
Lazard Global Fixed Income Fund (continued)Portfolio of Investments as at 30 September 2019
Maturity Date
Amount Bought
Amount Sold
Unrealised Gain/(Loss)
USD
% of NAV
Open forward foreign currency exchange contracts - (0.91)% (31 March 2019: (0.67)%)
10/10/19 EUR 4,098,217 USD 4,621,903 (150,379) (0.51)
10/10/19 USD 55,900 EUR 49,720 1,651 0.01
15/10/19 EUR 10,687,290 USD 11,852,023 (186,426) (0.61)
15/10/19 USD 118,625 EUR 106,927 1,911 0.01
18/10/19 USD 963,961 CLP 659,610,710 57,855 0.19
18/10/19 USD 453,279 PHP 23,291,438 4,053 0.01
23/10/19 USD 140,372 INR 9,775,116 2,657 0.01
25/10/19 CZK 14,431,060 USD 621,728 (12,161) (0.04)
25/10/19 USD 610,495 CZK 14,254,443 8,387 0.03
25/10/19 USD 265,264 EUR 236,500 6,902 0.02
28/10/19 HUF 95,899,412 USD 332,268 (19,622) (0.06)
28/10/19 USD 1,247,142 HUF 362,156,941 66,462 0.21
14/11/19 AUD 253,031 USD 172,841 (1,914) (0.00)
14/11/19 CAD 214,522 USD 162,100 36 0.00
14/11/19 CHF 199,135 USD 206,418 (5,938) (0.02)
14/11/19 GBP 159,207 USD 192,333 4,217 0.01
14/11/19 JPY 683,498,243 USD 6,517,319 (173,523) (0.57)
14/11/19 NOK 311,510 USD 35,153 (843) (0.00)
14/11/19 NZD 120,978 USD 78,000 (2,059) (0.01)
14/11/19 SEK 1,203,732 USD 125,000 (2,201) (0.01)
14/11/19 USD 1,643,316 AUD 2,414,699 12,153 0.05
14/11/19 USD 2,094,044 CAD 2,762,760 5,946 0.02
14/11/19 USD 28,411 CHF 27,408 817 0.00
14/11/19 USD 1,403,482 JPY 147,411,948 35,297 0.12
14/11/19 USD 247,061 MXN 4,866,284 2,470 0.01
14/11/19 USD 333,747 NOK 2,971,948 6,416 0.02
14/11/19 USD 880,346 NZD 1,358,700 27,457 0.09
14/11/19 USD 854,069 PLN 3,316,600 26,294 0.09
14/11/19 USD 843,654 RON 3,657,471 3,595 0.01
14/11/19 USD 435,476 SGD 602,254 (259) (0.00)
Principal Amount
Coupon Rate %
Maturity Date
Fair Value USD
% of NAV
Bonds - 98.92% (31 March 2019: 99.58%) (continued)
Principal Amount
Coupon Rate %
Maturity Date
Fair Value USD
% of NAV
Bonds - 98.92% (31 March 2019: 99.58%) (continued)
United States - 28.63% (31 March 2019: 23.63%) (continued)
195,000 State of California 7.500 01/04/34 300,812 0.99
150,000 United Rentals North America Inc 4.875 15/01/28 156,563 0.52
290,000 United States Treasury Inflation Indexed Bonds 0.125 15/04/20 315,103 1.04
720,000 United States Treasury Note/Bond 1.750 15/05/23 724,472 2.39
610,000 United States Treasury Note/Bond 2.125 15/05/25 627,681 2.07
558,000 United States Treasury Note/Bond 2.875 15/08/28 613,974 2.03
281,000 United States Treasury Note/Bond 3.125 15/11/41 335,466 1.11
300,000 United States Treasury Note/Bond 2.250 15/08/49 309,164 1.02
360,000 Verizon Communications Inc 3.875 08/02/29 395,387 1.30
8,674,216 28.63
Vietnam - 0.73% (31 March 2019: 1.02%)
200,000 Vietnam Government International Bond 'REGS' 4.800 19/11/24 219,580 0.73
Total Bonds - (Cost USD 29,619,041) 29,975,496 98.92
Total Investments - (Cost USD 29,619,041) 29,975,496 98.92

LA
ZA
RD
GL
OB
AL
AC
TIV
E F
UN
DS
PL
C
125Lazard Global Active Funds plc Financial period ended 30 September 2019
Portfolios of Investments (Unaudited) (continued)
Lazard Global Fixed Income Fund (continued)Portfolio of Investments as at 30 September 2019
06/02/20 USD 280,170 COP 961,361,458 5,669 0.02
10/02/20 KRW 429,336,000 USD 360,000 (431) (0.00)
12/02/20 IDR 1,277,723,500 USD 88,454 (8) (0.00)
19/02/20 USD 246,348 PEN 843,864 (1,511) (0.01)
Unrealised gain on forward foreign currency exchange contracts 280,245 0.93
Unrealised loss on forward foreign currency exchange contracts (557,275) (1.84)
Net unrealised loss on forward foreign currency exchange contracts (277,030) (0.91)
Financial assets and financial liabilities at fair value 29,698,466 98.01
Other Net Assets 603,356 1.99
Net Assets 30,301,822 100.00
The counterparties for the open forward foreign currency exchange contracts are:
- Citigroup Global Markets Inc
- HSBC Bank USA
- JPMorgan Chase Bank N.A.
- The Bank of New York Mellon
Maturity Date
Amount Bought
Amount Sold
Unrealised Gain/(Loss)
USD
% of NAV
Open forward foreign currency exchange contracts - (0.91)% (31 March 2019: (0.67)%) (continued)
Analysis of Total Assets % of Total AssetsTransferable securities admitted to an official stock exchange listing or traded on a regulated market 96.86
Financial derivative instruments 0.91
Other assets 2.23
Total Assets 100.00

LA
ZA
RD
GL
OB
AL
AC
TIV
E F
UN
DS
PL
C
126
Portfolios of Investments (Unaudited) (continued)
Lazard Global Active Funds plc Financial period ended 30 September 2019
Lazard Sterling High Quality Bond FundPortfolio of Investments as at 30 September 2019
Principal Amount
Coupon Rate %
Maturity Date
Fair Value GBP
% of NAV
Bonds - 94.18% (31 March 2019: 95.88%)
France - 7.88% (31 March 2019: 7.46%)
50,000 Cie de Saint-Gobain 'EMTN' 5.625 15/11/24 60,701 3.37
50,000 Orange SA 'EMTN' 5.375 22/11/50 81,137 4.51
141,838 7.88
Germany - 11.78% (31 March 2019: 11.49%)
50,000 Deutsche Bahn Finance GMBH 'EMTN' 1.875 13/02/26 52,575 2.92
50,000Deutsche Telekom International Finance BV 'EMTN'
2.250 13/04/29 51,878 2.88
100,000 Volkswagen International Finance NV 3.375 16/11/26 107,623 5.98
212,076 11.78
Italy - 3.05% (31 March 2019: 3.12%)
50,000 Autostrade per l'Italia SpA 'EMTN' 6.250 09/06/22 54,886 3.05
United Kingdom - 62.12% (31 March 2019: 55.57%)
20,000 Aviva Plc FRN 6.125 14/11/36 23,915 1.33
100,000 CYBG Plc 'GMTN' FRN 4.000 03/09/27 99,965 5.55
100,000 Gatwick Funding Ltd 'EMTN' 3.250 26/02/48 112,432 6.25
100,000 HSBC Holdings Plc FRN 2.256 13/11/26 102,096 5.67
75,000 United Kingdom Gilt 4.750 07/12/30 109,763 6.10
50,000 United Kingdom Gilt 4.250 07/03/36 76,680 4.26
70,000 United Kingdom Gilt 1.750 07/09/37 80,213 4.46
160,000 United Kingdom Gilt 3.250 22/01/44 238,880 13.27
150,000 United Kingdom Gilt 1.500 22/07/47 169,065 9.39
100,000 Vodafone Group Plc 'EMTN' 3.375 08/08/49 105,090 5.84
1,118,099 62.12
United States - 9.35% (31 March 2019: 6.76%)
50,000 Comcast Corp 5.500 23/11/29 68,480 3.81
100,000 General Motors Financial Co Inc 'EMTN' 2.350 03/09/25 99,788 5.54
168,268 9.35
Total Bonds - (Cost GBP 1,577,662) 1,695,167 94.18
Total Investments - (Cost GBP 1,577,662) 1,695,167 94.18
Other Net Assets 104,766 5.82
Net Assets 1,799,933 100.00
Analysis of Total Assets % of Total AssetsTransferable securities admitted to an official stock exchange listing or traded on a regulated market 91.94
Other assets 8.06
Total Assets 100.00
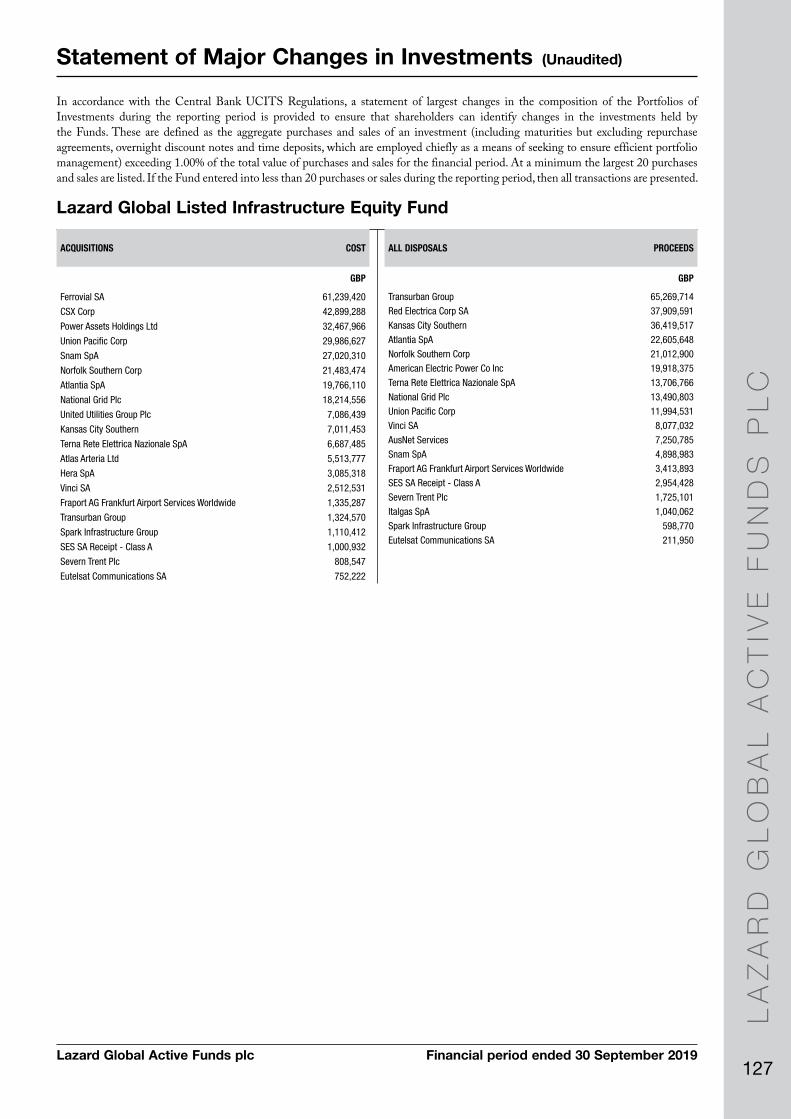
Lazard Global Active Funds plc Financial period ended 30 September 2019
LA
ZA
RD
GL
OB
AL
AC
TIV
E F
UN
DS
PL
C
127
Statement of Major Changes in Investments (Unaudited)
Lazard Global Listed Infrastructure Equity Fund
In accordance with the Central Bank UCITS Regulations, a statement of largest changes in the composition of the Portfolios of Investments during the reporting period is provided to ensure that shareholders can identify changes in the investments held by the Funds. These are defined as the aggregate purchases and sales of an investment (including maturities but excluding repurchase agreements, overnight discount notes and time deposits, which are employed chiefly as a means of seeking to ensure efficient portfolio management) exceeding 1.00% of the total value of purchases and sales for the financial period. At a minimum the largest 20 purchases and sales are listed. If the Fund entered into less than 20 purchases or sales during the reporting period, then all transactions are presented.
ACQUISITIONS COST
GBP
Ferrovial SA 61,239,420
CSX Corp 42,899,288
Power Assets Holdings Ltd 32,467,966
Union Pacific Corp 29,986,627
Snam SpA 27,020,310
Norfolk Southern Corp 21,483,474
Atlantia SpA 19,766,110
National Grid Plc 18,214,556
United Utilities Group Plc 7,086,439
Kansas City Southern 7,011,453
Terna Rete Elettrica Nazionale SpA 6,687,485
Atlas Arteria Ltd 5,513,777
Hera SpA 3,085,318
Vinci SA 2,512,531
Fraport AG Frankfurt Airport Services Worldwide 1,335,287
Transurban Group 1,324,570
Spark Infrastructure Group 1,110,412
SES SA Receipt - Class A 1,000,932
Severn Trent Plc 808,547
Eutelsat Communications SA 752,222
ALL DISPOSALS PROCEEDS
GBP
Transurban Group 65,269,714
Red Electrica Corp SA 37,909,591
Kansas City Southern 36,419,517
Atlantia SpA 22,605,648
Norfolk Southern Corp 21,012,900
American Electric Power Co Inc 19,918,375
Terna Rete Elettrica Nazionale SpA 13,706,766
National Grid Plc 13,490,803
Union Pacific Corp 11,994,531
Vinci SA 8,077,032
AusNet Services 7,250,785
Snam SpA 4,898,983
Fraport AG Frankfurt Airport Services Worldwide 3,413,893
SES SA Receipt - Class A 2,954,428
Severn Trent Plc 1,725,101
Italgas SpA 1,040,062
Spark Infrastructure Group 598,770
Eutelsat Communications SA 211,950
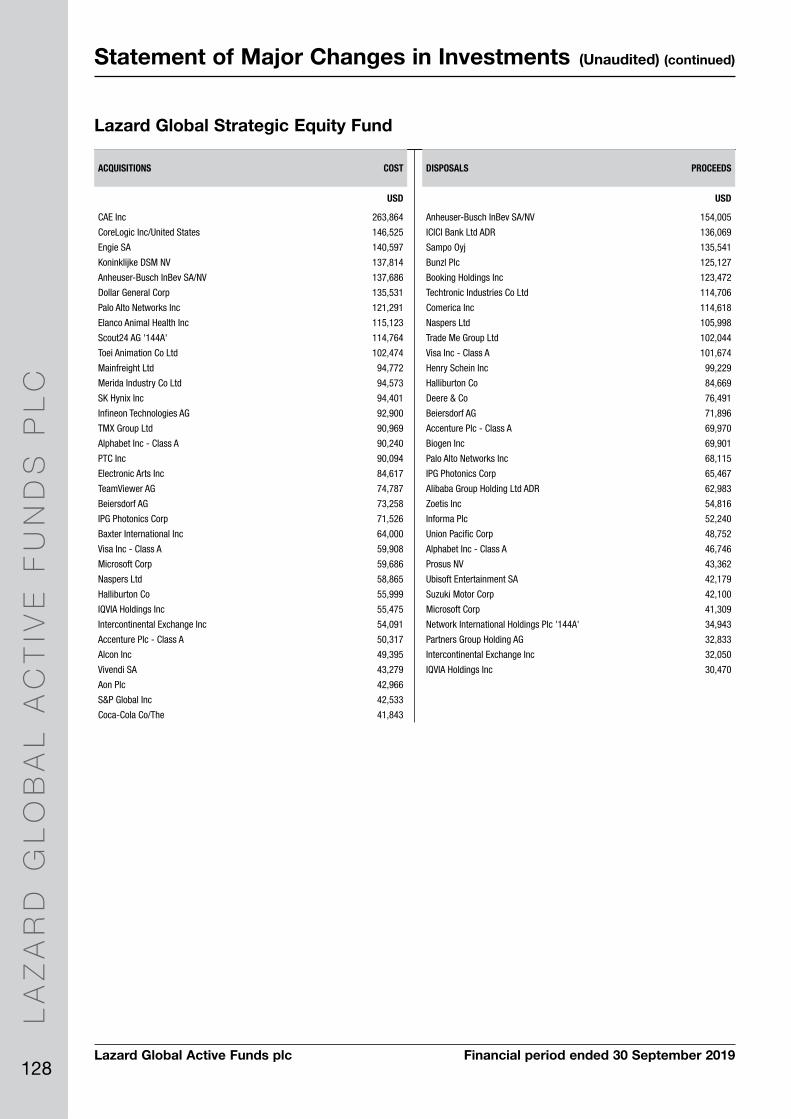
Lazard Global Active Funds plc Financial period ended 30 September 2019
LA
ZA
RD
GL
OB
AL
AC
TIV
E F
UN
DS
PL
C
128
Statement of Major Changes in Investments (Unaudited) (continued)
Lazard Global Strategic Equity Fund
ACQUISITIONS COST
USD
CAE Inc 263,864
CoreLogic Inc/United States 146,525
Engie SA 140,597
Koninklijke DSM NV 137,814
Anheuser-Busch InBev SA/NV 137,686
Dollar General Corp 135,531
Palo Alto Networks Inc 121,291
Elanco Animal Health Inc 115,123
Scout24 AG '144A' 114,764
Toei Animation Co Ltd 102,474
Mainfreight Ltd 94,772
Merida Industry Co Ltd 94,573
SK Hynix Inc 94,401
Infineon Technologies AG 92,900
TMX Group Ltd 90,969
Alphabet Inc - Class A 90,240
PTC Inc 90,094
Electronic Arts Inc 84,617
TeamViewer AG 74,787
Beiersdorf AG 73,258
IPG Photonics Corp 71,526
Baxter International Inc 64,000
Visa Inc - Class A 59,908
Microsoft Corp 59,686
Naspers Ltd 58,865
Halliburton Co 55,999
IQVIA Holdings Inc 55,475
Intercontinental Exchange Inc 54,091
Accenture Plc - Class A 50,317
Alcon Inc 49,395
Vivendi SA 43,279
Aon Plc 42,966
S&P Global Inc 42,533
Coca-Cola Co/The 41,843
DISPOSALS PROCEEDS
USD
Anheuser-Busch InBev SA/NV 154,005
ICICI Bank Ltd ADR 136,069
Sampo Oyj 135,541
Bunzl Plc 125,127
Booking Holdings Inc 123,472
Techtronic Industries Co Ltd 114,706
Comerica Inc 114,618
Naspers Ltd 105,998
Trade Me Group Ltd 102,044
Visa Inc - Class A 101,674
Henry Schein Inc 99,229
Halliburton Co 84,669
Deere & Co 76,491
Beiersdorf AG 71,896
Accenture Plc - Class A 69,970
Biogen Inc 69,901
Palo Alto Networks Inc 68,115
IPG Photonics Corp 65,467
Alibaba Group Holding Ltd ADR 62,983
Zoetis Inc 54,816
Informa Plc 52,240
Union Pacific Corp 48,752
Alphabet Inc - Class A 46,746
Prosus NV 43,362
Ubisoft Entertainment SA 42,179
Suzuki Motor Corp 42,100
Microsoft Corp 41,309
Network International Holdings Plc '144A' 34,943
Partners Group Holding AG 32,833
Intercontinental Exchange Inc 32,050
IQVIA Holdings Inc 30,470
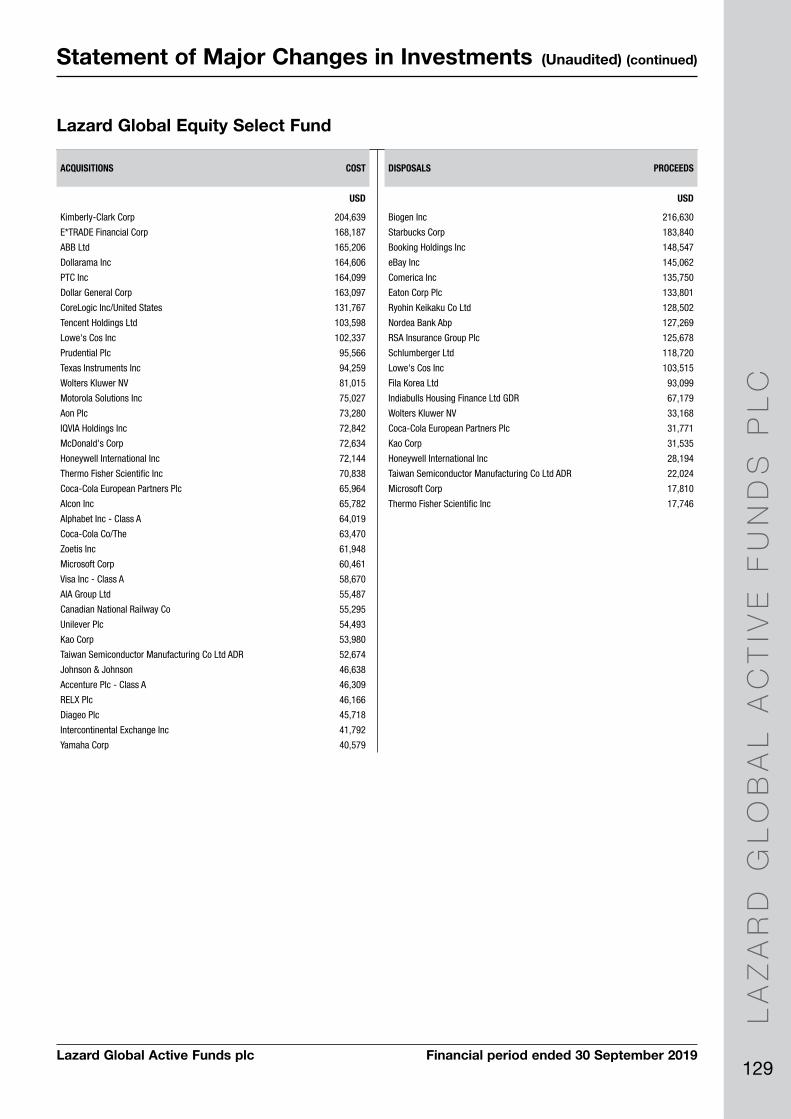
Lazard Global Active Funds plc Financial period ended 30 September 2019
LA
ZA
RD
GL
OB
AL
AC
TIV
E F
UN
DS
PL
C
129
Statement of Major Changes in Investments (Unaudited) (continued)
Lazard Global Equity Select Fund
ACQUISITIONS COST
USD
Kimberly-Clark Corp 204,639
E*TRADE Financial Corp 168,187
ABB Ltd 165,206
Dollarama Inc 164,606
PTC Inc 164,099
Dollar General Corp 163,097
CoreLogic Inc/United States 131,767
Tencent Holdings Ltd 103,598
Lowe's Cos Inc 102,337
Prudential Plc 95,566
Texas Instruments Inc 94,259
Wolters Kluwer NV 81,015
Motorola Solutions Inc 75,027
Aon Plc 73,280
IQVIA Holdings Inc 72,842
McDonald's Corp 72,634
Honeywell International Inc 72,144
Thermo Fisher Scientific Inc 70,838
Coca-Cola European Partners Plc 65,964
Alcon Inc 65,782
Alphabet Inc - Class A 64,019
Coca-Cola Co/The 63,470
Zoetis Inc 61,948
Microsoft Corp 60,461
Visa Inc - Class A 58,670
AIA Group Ltd 55,487
Canadian National Railway Co 55,295
Unilever Plc 54,493
Kao Corp 53,980
Taiwan Semiconductor Manufacturing Co Ltd ADR 52,674
Johnson & Johnson 46,638
Accenture Plc - Class A 46,309
RELX Plc 46,166
Diageo Plc 45,718
Intercontinental Exchange Inc 41,792
Yamaha Corp 40,579
DISPOSALS PROCEEDS
USD
Biogen Inc 216,630
Starbucks Corp 183,840
Booking Holdings Inc 148,547
eBay Inc 145,062
Comerica Inc 135,750
Eaton Corp Plc 133,801
Ryohin Keikaku Co Ltd 128,502
Nordea Bank Abp 127,269
RSA Insurance Group Plc 125,678
Schlumberger Ltd 118,720
Lowe's Cos Inc 103,515
Fila Korea Ltd 93,099
Indiabulls Housing Finance Ltd GDR 67,179
Wolters Kluwer NV 33,168
Coca-Cola European Partners Plc 31,771
Kao Corp 31,535
Honeywell International Inc 28,194
Taiwan Semiconductor Manufacturing Co Ltd ADR 22,024
Microsoft Corp 17,810
Thermo Fisher Scientific Inc 17,746

Lazard Global Active Funds plc Financial period ended 30 September 2019
LA
ZA
RD
GL
OB
AL
AC
TIV
E F
UN
DS
PL
C
130
Statement of Major Changes in Investments (Unaudited) (continued)
Lazard Global Managed Volatility Fund
ACQUISITIONS COST
USD
Hershey Co/The 3,484,474
Coca-Cola Co/The 2,431,900
Colgate-Palmolive Co 2,047,586
Edison International 1,934,799
Muenchener Rueckversicherungs-Gesellschaft AG in Muenchen 1,925,507
American Tower Corp (REIT) 1,904,361
Lockheed Martin Corp 1,788,747
Pinnacle West Capital Corp 1,751,911
Sysco Corp 1,744,704
National Retail Properties Inc (REIT) 1,723,443
Alimentation Couche-Tard Inc - Class B 1,551,950
Novartis AG 1,527,672
Colruyt SA 1,495,489
Premier Inc - Class A 1,468,671
Swire Pacific Ltd 1,449,957
Fidelity National Information Services Inc 1,404,720
Northrop Grumman Corp 1,348,702
Northland Power Inc 1,258,754
NTT DOCOMO Inc 1,243,159
T Rowe Price Group Inc 1,243,043
DISPOSALS PROCEEDS
USD
Royal Bank of Canada 3,236,084
Terna Rete Elettrica Nazionale SpA 3,071,534
Sysco Corp 2,987,488
Starbucks Corp 2,877,821
American Electric Power Co Inc 2,752,405
Toronto-Dominion Bank/The 2,740,065
Fiserv Inc 2,274,097
Broadridge Financial Solutions Inc 2,260,911
Telenor ASA 2,234,652
National Grid Plc 2,095,225
Paychex Inc 1,980,120
National Bank of Canada 1,934,415
Atmos Energy Corp 1,928,825
Exelon Corp 1,806,296
Kimberly-Clark Corp 1,764,964
UnitedHealth Group Inc 1,751,528
Ross Stores Inc 1,553,006
PepsiCo Inc 1,525,819
Imperial Brands Plc 1,493,857
Fidelity National Information Services Inc 1,491,377
Pinnacle West Capital Corp 1,488,113
Avnet Inc 1,478,948
Intercontinental Exchange Inc 1,430,793
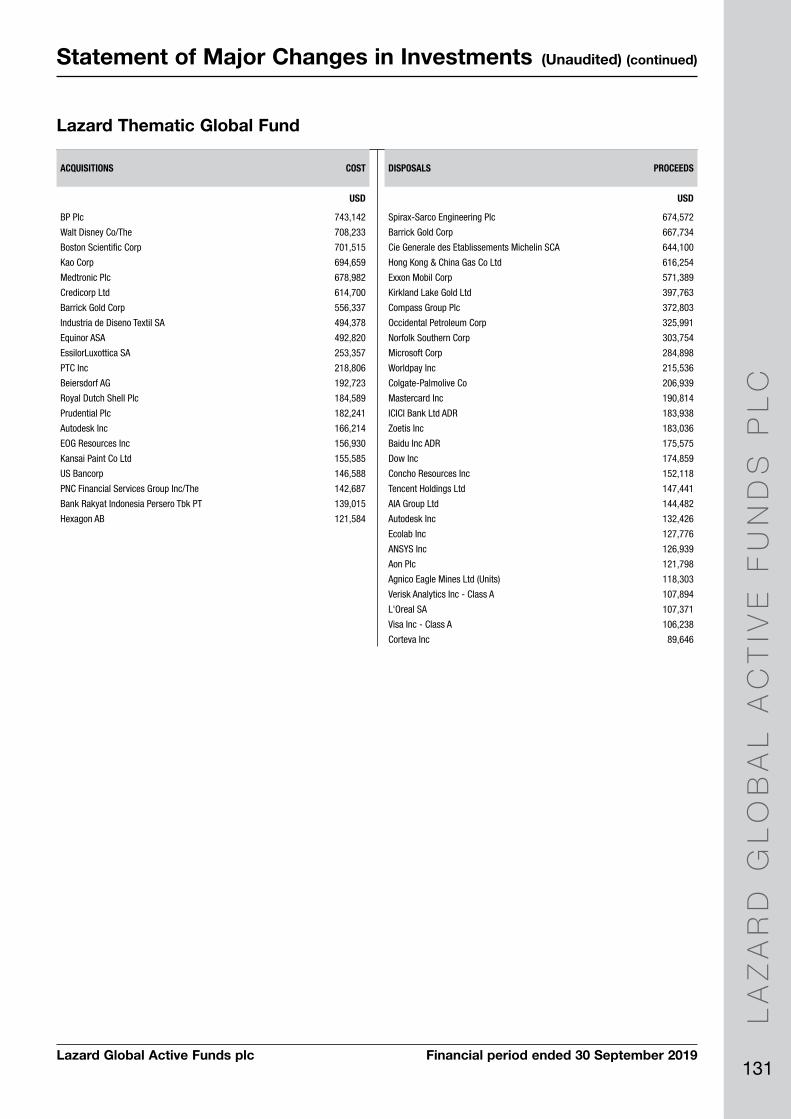
Lazard Global Active Funds plc Financial period ended 30 September 2019
LA
ZA
RD
GL
OB
AL
AC
TIV
E F
UN
DS
PL
C
131
Statement of Major Changes in Investments (Unaudited) (continued)
Lazard Thematic Global Fund
ACQUISITIONS COST
USD
BP Plc 743,142
Walt Disney Co/The 708,233
Boston Scientific Corp 701,515
Kao Corp 694,659
Medtronic Plc 678,982
Credicorp Ltd 614,700
Barrick Gold Corp 556,337
Industria de Diseno Textil SA 494,378
Equinor ASA 492,820
EssilorLuxottica SA 253,357
PTC Inc 218,806
Beiersdorf AG 192,723
Royal Dutch Shell Plc 184,589
Prudential Plc 182,241
Autodesk Inc 166,214
EOG Resources Inc 156,930
Kansai Paint Co Ltd 155,585
US Bancorp 146,588
PNC Financial Services Group Inc/The 142,687
Bank Rakyat Indonesia Persero Tbk PT 139,015
Hexagon AB 121,584
DISPOSALS PROCEEDS
USD
Spirax-Sarco Engineering Plc 674,572
Barrick Gold Corp 667,734
Cie Generale des Etablissements Michelin SCA 644,100
Hong Kong & China Gas Co Ltd 616,254
Exxon Mobil Corp 571,389
Kirkland Lake Gold Ltd 397,763
Compass Group Plc 372,803
Occidental Petroleum Corp 325,991
Norfolk Southern Corp 303,754
Microsoft Corp 284,898
Worldpay Inc 215,536
Colgate-Palmolive Co 206,939
Mastercard Inc 190,814
ICICI Bank Ltd ADR 183,938
Zoetis Inc 183,036
Baidu Inc ADR 175,575
Dow Inc 174,859
Concho Resources Inc 152,118
Tencent Holdings Ltd 147,441
AIA Group Ltd 144,482
Autodesk Inc 132,426
Ecolab Inc 127,776
ANSYS Inc 126,939
Aon Plc 121,798
Agnico Eagle Mines Ltd (Units) 118,303
Verisk Analytics Inc - Class A 107,894
L'Oreal SA 107,371
Visa Inc - Class A 106,238
Corteva Inc 89,646

Lazard Global Active Funds plc Financial period ended 30 September 2019
LA
ZA
RD
GL
OB
AL
AC
TIV
E F
UN
DS
PL
C
132
Statement of Major Changes in Investments (Unaudited) (continued)
Lazard Global Equity Franchise Fund
ACQUISITIONS COST
USD
Cognizant Technology Solutions Corp 16,922,807
Tapestry Inc 13,789,122
Oracle Corp 10,077,367
Henry Schein Inc 9,669,180
Norfolk Southern Corp 9,555,775
IPG Photonics Corp 7,917,597
Intel Corp 7,713,787
Fresenius Medical Care AG & Co KGaA 6,817,399
Ferrovial SA 6,525,023
Terna Rete Elettrica Nazionale SpA 6,496,643
H&R Block Inc 5,144,515
MEDNAX Inc 4,378,918
Atlantia SpA 4,352,657
McKesson Corp 3,990,912
Medtronic Plc 3,956,272
Nielsen Holdings Plc 3,954,122
Alphabet Inc 3,796,891
Stericycle Inc 3,527,968
Power Assets Holdings Ltd 3,277,739
United Utilities Group Plc 3,175,290
CVS Health Corp 3,173,300
Kraft Heinz Co/The 3,035,718
International Game Technology Plc 2,741,931
Omnicom Group Inc 2,731,643
SES SA Receipt - Class A 2,542,889
National Grid Plc 2,080,215
EssilorLuxottica SA 1,726,528
DISPOSALS PROCEEDS
USD
McKesson Corp 17,457,976
Atlantia SpA 15,389,542
EssilorLuxottica SA 13,580,549
QUALCOMM Inc 13,535,416
Oracle Corp 12,463,015
Anheuser-Busch InBev SA/NV 8,672,556
Medtronic Plc 7,647,302
Terna Rete Elettrica Nazionale SpA 7,052,598
Ferrovial SA 6,798,895
Norfolk Southern Corp 6,740,592
Microsoft Corp 6,334,202
CVS Health Corp 5,238,310
H&R Block Inc 3,264,007
Kraft Heinz Co/The 3,124,569
Visa Inc 3,088,412
IPG Photonics Corp 3,034,024
Intel Corp 2,674,380
Omnicom Group Inc 2,387,822
International Game Technology Plc 2,118,004
Stericycle Inc 1,914,608

Lazard Global Active Funds plc Financial period ended 30 September 2019
LA
ZA
RD
GL
OB
AL
AC
TIV
E F
UN
DS
PL
C
133
Statement of Major Changes in Investments (Unaudited) (continued)
Lazard European Equity Fund
ACQUISITIONS COST
EUR
Siemens AG 1,000,518
Engie SA 907,803
ABB Ltd 859,009
LVMH Moet Hennessy Louis Vuitton SE 723,641
Vonovia SE 603,779
Prosus NV 594,636
Mowi ASA 535,474
OMV AG 413,969
Scout24 AG '144A' 395,772
FinecoBank Banca Fineco SpA 386,345
Atos SE 351,199
Alcon Inc 349,344
Beiersdorf AG 323,113
VAT Group AG '144A' 321,777
Unilever NV 318,394
Carlsberg A/S 315,940
TeamViewer AG 304,500
Delivery Hero SE '144A' 273,738
UniCredit SpA 260,724
Societe Generale SA 250,894
SPIE SA 245,679
Orange SA 243,631
Air Liquide SA 240,500
Sanofi 222,922
Nordea Bank Abp 218,411
Deutsche Wohnen SE 211,659
Symrise AG - Class A 206,375
Equinor ASA 168,598
Galp Energia SGPS SA 161,920
Royal Dutch Shell Plc 142,391
Novartis AG 142,348
ArcelorMittal 141,971
DISPOSALS PROCEEDS
EUR
Siemens AG 849,233
Novartis AG 784,312
Vonovia SE 782,395
Assa Abloy AB 757,047
Carlsberg A/S 744,969
Kerry Group Plc 682,858
Anheuser-Busch InBev SA/NV 604,019
Cie Generale des Etablissements Michelin SCA 545,133
ABN AMRO Bank NV Dutch Cert '144A' 515,038
AXA SA 492,557
Amundi SA '144A' 485,071
SAP SE 421,231
Capgemini SE 382,097
Euronext NV '144A' 364,930
Faurecia SE 364,082
Royal Dutch Shell Plc 359,770
Unilever NV 332,701
Credit Suisse Group AG 329,749
Julius Baer Group Ltd 296,343
Ubisoft Entertainment SA 283,079
CNH Industrial NV 273,546
Porsche Automobil Holding SE - Preference 255,988
Hexagon AB 225,303
Orange SA 223,716
Deutsche Wohnen SE 204,385
Vivendi SA 189,183
Knorr-Bremse AG 183,308
SPIE SA 175,344
Bankia SA 154,322
ABB Ltd 152,915
QIAGEN NV 149,559
Worldline SA/France '144A' 149,486
Safran SA 147,461
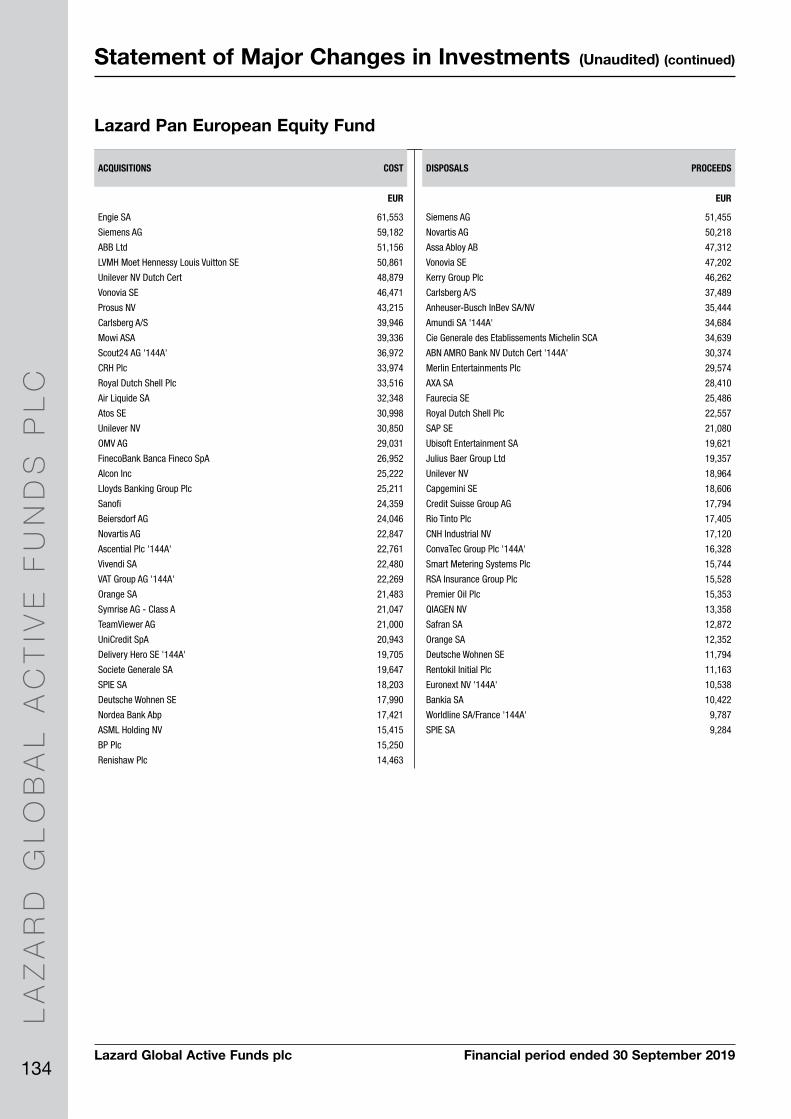
Lazard Global Active Funds plc Financial period ended 30 September 2019
LA
ZA
RD
GL
OB
AL
AC
TIV
E F
UN
DS
PL
C
134
Statement of Major Changes in Investments (Unaudited) (continued)
Lazard Pan European Equity Fund
ACQUISITIONS COST
EUR
Engie SA 61,553
Siemens AG 59,182
ABB Ltd 51,156
LVMH Moet Hennessy Louis Vuitton SE 50,861
Unilever NV Dutch Cert 48,879
Vonovia SE 46,471
Prosus NV 43,215
Carlsberg A/S 39,946
Mowi ASA 39,336
Scout24 AG '144A' 36,972
CRH Plc 33,974
Royal Dutch Shell Plc 33,516
Air Liquide SA 32,348
Atos SE 30,998
Unilever NV 30,850
OMV AG 29,031
FinecoBank Banca Fineco SpA 26,952
Alcon Inc 25,222
Lloyds Banking Group Plc 25,211
Sanofi 24,359
Beiersdorf AG 24,046
Novartis AG 22,847
Ascential Plc '144A' 22,761
Vivendi SA 22,480
VAT Group AG '144A' 22,269
Orange SA 21,483
Symrise AG - Class A 21,047
TeamViewer AG 21,000
UniCredit SpA 20,943
Delivery Hero SE '144A' 19,705
Societe Generale SA 19,647
SPIE SA 18,203
Deutsche Wohnen SE 17,990
Nordea Bank Abp 17,421
ASML Holding NV 15,415
BP Plc 15,250
Renishaw Plc 14,463
DISPOSALS PROCEEDS
EUR
Siemens AG 51,455
Novartis AG 50,218
Assa Abloy AB 47,312
Vonovia SE 47,202
Kerry Group Plc 46,262
Carlsberg A/S 37,489
Anheuser-Busch InBev SA/NV 35,444
Amundi SA '144A' 34,684
Cie Generale des Etablissements Michelin SCA 34,639
ABN AMRO Bank NV Dutch Cert '144A' 30,374
Merlin Entertainments Plc 29,574
AXA SA 28,410
Faurecia SE 25,486
Royal Dutch Shell Plc 22,557
SAP SE 21,080
Ubisoft Entertainment SA 19,621
Julius Baer Group Ltd 19,357
Unilever NV 18,964
Capgemini SE 18,606
Credit Suisse Group AG 17,794
Rio Tinto Plc 17,405
CNH Industrial NV 17,120
ConvaTec Group Plc '144A' 16,328
Smart Metering Systems Plc 15,744
RSA Insurance Group Plc 15,528
Premier Oil Plc 15,353
QIAGEN NV 13,358
Safran SA 12,872
Orange SA 12,352
Deutsche Wohnen SE 11,794
Rentokil Initial Plc 11,163
Euronext NV '144A' 10,538
Bankia SA 10,422
Worldline SA/France '144A' 9,787
SPIE SA 9,284

Lazard Global Active Funds plc Financial period ended 30 September 2019
LA
ZA
RD
GL
OB
AL
AC
TIV
E F
UN
DS
PL
C
135
Statement of Major Changes in Investments (Unaudited) (continued)
Lazard Pan-European Small Cap Fund
ACQUISITIONS COST
EUR
Karnov Group AB 1,185,874
Tinexta Spa 803,549
Arjo AB 745,767
Fagron 710,018
BAWAG Group AG '144A' 681,944
Lindab International AB 603,996
Kojamo Oyj 594,124
Applus Services SA 587,770
IMI Plc 558,294
Dream Global Real Estate Investment Trust (Units) (REIT) 541,791
Arcadis NV 509,347
Synthomer Plc 396,776
TeamViewer AG 333,375
Network International Holdings Plc '144A' 221,147
LEG Immobilien AG 145,457
Weir Group Plc/The 138,259
CompuGroup Medical SE 133,884
Subsea 7 SA 117,274
Total Produce Plc 106,045
Altia Oyj 102,484
DISPOSALS PROCEEDS
EUR
BCA Marketplace Plc 1,142,391
Lifco AB 1,064,377
Barco NV 922,384
Corestate Capital Holding SA 919,043
Dalata Hotel Group Plc 821,570
Indutrade AB 813,829
Aalberts NV 805,686
Dometic Group AB '144A' 802,768
Kinepolis Group NV 792,218
CompuGroup Medical SE 743,251
Kardex AG 736,904
Loomis AB - Class B 709,758
Aroundtown SA 706,998
Savills Plc 691,760
Electrocomponents Plc 682,430
Alimak Group AB '144A' 680,752
JOST Werke AG '144A' 680,361
Arrow Global Group Plc 662,379
Sbanken ASA '144A' 652,227
Royal Unibrew A/S 648,482
Dream Global Real Estate Investment Trust (Units) (REIT) 625,851
Dechra Pharmaceuticals Plc 624,445
Hexpol AB 599,863
Dermapharm Holding SE 597,931
Carel Industries SpA '144A' 587,821
Polypipe Group plc 572,678
AURELIUS Equity Opportunities SE & Co KGaA 563,202
Altia Oyj 553,538
JTC Plc '144A' 539,515
Euronext NV '144A' 533,781
Banca Generali SpA 532,946
Karnov Group AB 530,290
Kaufman & Broad SA 524,454
Scapa Group Plc 509,356
Core Laboratories NV 508,060
Volution Group Plc 499,077
El.En. SpA 495,400
Clinigen Group Plc 484,692
Flatex AG 475,274
Smart Metering Systems Plc 472,427
Rightmove Plc 466,851
Rentokil Initial Plc 463,928
IMCD NV 455,913
Senior Plc 449,173
Auto Trader Group Plc '144A' 433,758
Van Lanschot Kempen NV Dutch Cert 432,391
Chargeurs SA 431,374
Cerved Group SpA 419,056
Ahlstrom-Munksjo Oyj 413,217
On the Beach Group Plc '144A' 412,820
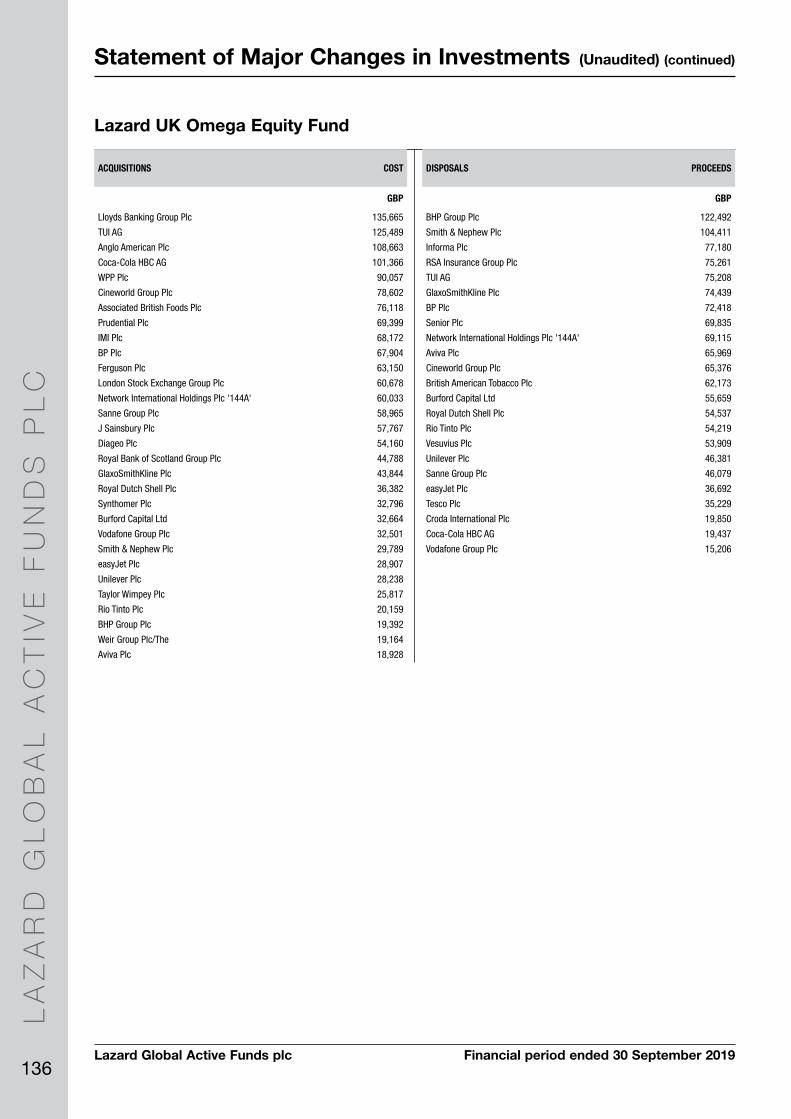
Lazard Global Active Funds plc Financial period ended 30 September 2019
LA
ZA
RD
GL
OB
AL
AC
TIV
E F
UN
DS
PL
C
136
Statement of Major Changes in Investments (Unaudited) (continued)
Lazard UK Omega Equity Fund
ACQUISITIONS COST
GBP
Lloyds Banking Group Plc 135,665
TUI AG 125,489
Anglo American Plc 108,663
Coca-Cola HBC AG 101,366
WPP Plc 90,057
Cineworld Group Plc 78,602
Associated British Foods Plc 76,118
Prudential Plc 69,399
IMI Plc 68,172
BP Plc 67,904
Ferguson Plc 63,150
London Stock Exchange Group Plc 60,678
Network International Holdings Plc '144A' 60,033
Sanne Group Plc 58,965
J Sainsbury Plc 57,767
Diageo Plc 54,160
Royal Bank of Scotland Group Plc 44,788
GlaxoSmithKline Plc 43,844
Royal Dutch Shell Plc 36,382
Synthomer Plc 32,796
Burford Capital Ltd 32,664
Vodafone Group Plc 32,501
Smith & Nephew Plc 29,789
easyJet Plc 28,907
Unilever Plc 28,238
Taylor Wimpey Plc 25,817
Rio Tinto Plc 20,159
BHP Group Plc 19,392
Weir Group Plc/The 19,164
Aviva Plc 18,928
DISPOSALS PROCEEDS
GBP
BHP Group Plc 122,492
Smith & Nephew Plc 104,411
Informa Plc 77,180
RSA Insurance Group Plc 75,261
TUI AG 75,208
GlaxoSmithKline Plc 74,439
BP Plc 72,418
Senior Plc 69,835
Network International Holdings Plc '144A' 69,115
Aviva Plc 65,969
Cineworld Group Plc 65,376
British American Tobacco Plc 62,173
Burford Capital Ltd 55,659
Royal Dutch Shell Plc 54,537
Rio Tinto Plc 54,219
Vesuvius Plc 53,909
Unilever Plc 46,381
Sanne Group Plc 46,079
easyJet Plc 36,692
Tesco Plc 35,229
Croda International Plc 19,850
Coca-Cola HBC AG 19,437
Vodafone Group Plc 15,206

Lazard Global Active Funds plc Financial period ended 30 September 2019
LA
ZA
RD
GL
OB
AL
AC
TIV
E F
UN
DS
PL
C
137
Statement of Major Changes in Investments (Unaudited) (continued)
Lazard US Equity Concentrated Fund
ALL ACQUISITIONS COST
USD
Sabre Corp 9,791,870
Elanco Animal Health Inc 8,471,633
Brunswick Corp/DE 5,368,213
Cisco Systems Inc 4,989,070
Baxter International Inc 4,187,372
Medtronic Plc 3,691,310
Skyworks Solutions Inc 2,184,947
Lowe's Cos Inc 1,978,896
Coca-Cola Co/The 1,290,822
Insperity Inc 1,008,921
Alphabet Inc - Class A 822,049
Armstrong World Industries Inc 589,161
Prologis Inc (REIT) 366,629
Visa Inc - Class A 350,060
Aptiv Plc 349,066
Apple Inc 329,516
Vulcan Materials Co 226,361
eBay Inc 164,759
DISPOSALS PROCEEDS
USD
eBay Inc 7,387,081
Kennametal Inc 7,099,703
Medtronic Plc 7,089,167
Analog Devices Inc 5,344,527
Armstrong World Industries Inc 4,931,406
Aptiv Plc 4,904,806
Molson Coors Brewing Co 3,689,966
Fiserv Inc 3,481,318
Elanco Animal Health Inc 3,304,705
Vulcan Materials Co 3,281,574
Lowe's Cos Inc 2,230,287
Visa Inc - Class A 2,082,049
Apple Inc 1,842,977
Prologis Inc (REIT) 1,490,665
Baxter International Inc 1,185,255
Coca-Cola Co/The 1,164,432
Intercontinental Exchange Inc 832,151
Alphabet Inc - Class A 807,381
S&P Global Inc 783,722
Cisco Systems Inc 769,754
Motorola Solutions Inc 686,222
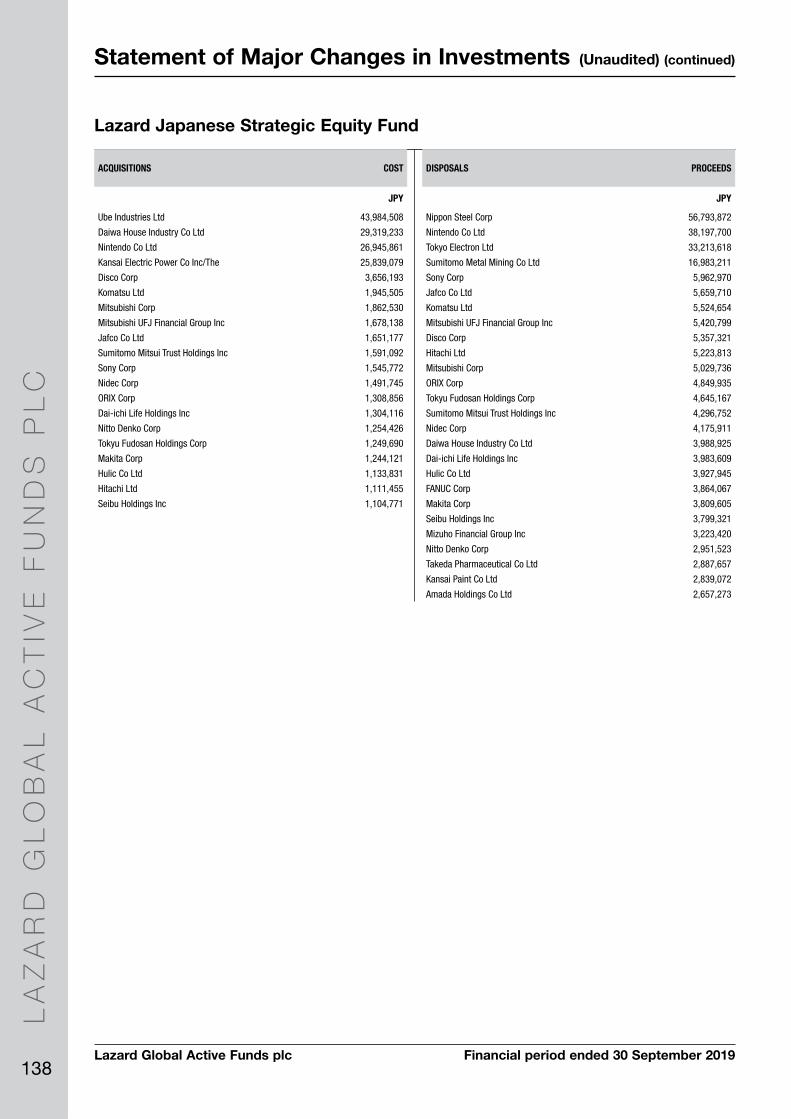
Lazard Global Active Funds plc Financial period ended 30 September 2019
LA
ZA
RD
GL
OB
AL
AC
TIV
E F
UN
DS
PL
C
138
Statement of Major Changes in Investments (Unaudited) (continued)
Lazard Japanese Strategic Equity Fund
ACQUISITIONS COST
JPY
Ube Industries Ltd 43,984,508
Daiwa House Industry Co Ltd 29,319,233
Nintendo Co Ltd 26,945,861
Kansai Electric Power Co Inc/The 25,839,079
Disco Corp 3,656,193
Komatsu Ltd 1,945,505
Mitsubishi Corp 1,862,530
Mitsubishi UFJ Financial Group Inc 1,678,138
Jafco Co Ltd 1,651,177
Sumitomo Mitsui Trust Holdings Inc 1,591,092
Sony Corp 1,545,772
Nidec Corp 1,491,745
ORIX Corp 1,308,856
Dai-ichi Life Holdings Inc 1,304,116
Nitto Denko Corp 1,254,426
Tokyu Fudosan Holdings Corp 1,249,690
Makita Corp 1,244,121
Hulic Co Ltd 1,133,831
Hitachi Ltd 1,111,455
Seibu Holdings Inc 1,104,771
DISPOSALS PROCEEDS
JPY
Nippon Steel Corp 56,793,872
Nintendo Co Ltd 38,197,700
Tokyo Electron Ltd 33,213,618
Sumitomo Metal Mining Co Ltd 16,983,211
Sony Corp 5,962,970
Jafco Co Ltd 5,659,710
Komatsu Ltd 5,524,654
Mitsubishi UFJ Financial Group Inc 5,420,799
Disco Corp 5,357,321
Hitachi Ltd 5,223,813
Mitsubishi Corp 5,029,736
ORIX Corp 4,849,935
Tokyu Fudosan Holdings Corp 4,645,167
Sumitomo Mitsui Trust Holdings Inc 4,296,752
Nidec Corp 4,175,911
Daiwa House Industry Co Ltd 3,988,925
Dai-ichi Life Holdings Inc 3,983,609
Hulic Co Ltd 3,927,945
FANUC Corp 3,864,067
Makita Corp 3,809,605
Seibu Holdings Inc 3,799,321
Mizuho Financial Group Inc 3,223,420
Nitto Denko Corp 2,951,523
Takeda Pharmaceutical Co Ltd 2,887,657
Kansai Paint Co Ltd 2,839,072
Amada Holdings Co Ltd 2,657,273
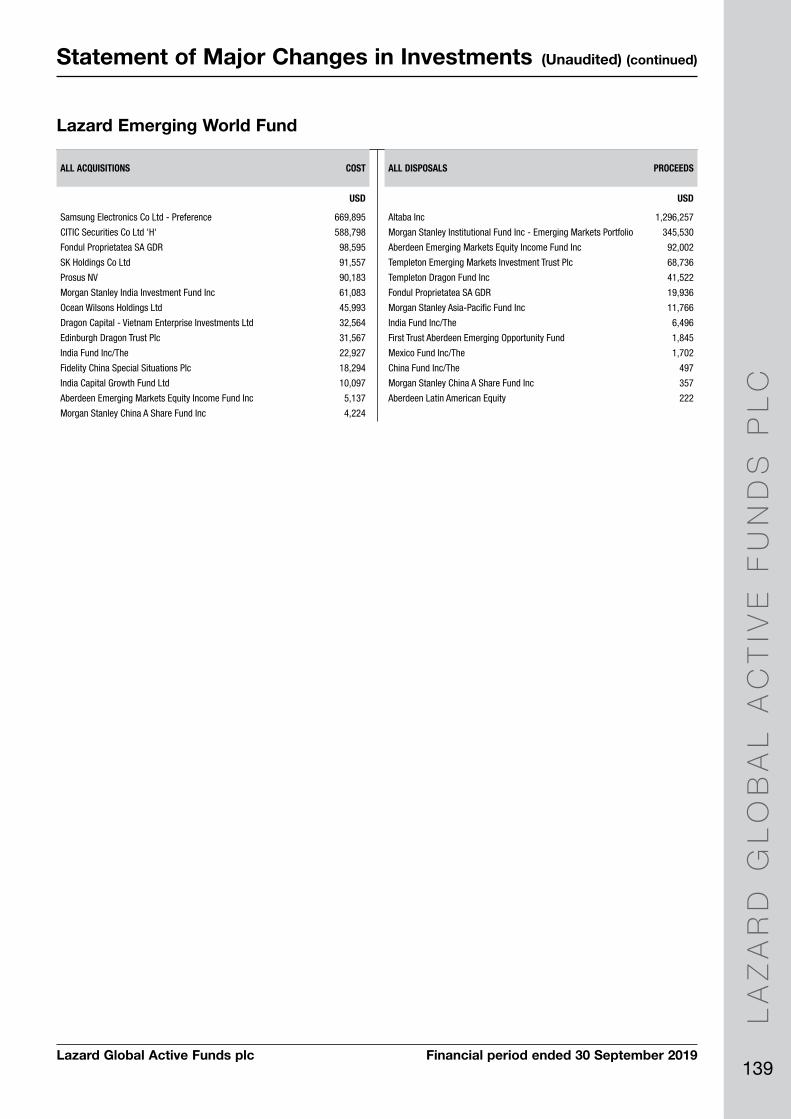
Lazard Global Active Funds plc Financial period ended 30 September 2019
LA
ZA
RD
GL
OB
AL
AC
TIV
E F
UN
DS
PL
C
139
Statement of Major Changes in Investments (Unaudited) (continued)
Lazard Emerging World Fund
ALL ACQUISITIONS COST
USD
Samsung Electronics Co Ltd - Preference 669,895
CITIC Securities Co Ltd 'H' 588,798
Fondul Proprietatea SA GDR 98,595
SK Holdings Co Ltd 91,557
Prosus NV 90,183
Morgan Stanley India Investment Fund Inc 61,083
Ocean Wilsons Holdings Ltd 45,993
Dragon Capital - Vietnam Enterprise Investments Ltd 32,564
Edinburgh Dragon Trust Plc 31,567
India Fund Inc/The 22,927
Fidelity China Special Situations Plc 18,294
India Capital Growth Fund Ltd 10,097
Aberdeen Emerging Markets Equity Income Fund Inc 5,137
Morgan Stanley China A Share Fund Inc 4,224
ALL DISPOSALS PROCEEDS
USD
Altaba Inc 1,296,257
Morgan Stanley Institutional Fund Inc - Emerging Markets Portfolio 345,530
Aberdeen Emerging Markets Equity Income Fund Inc 92,002
Templeton Emerging Markets Investment Trust Plc 68,736
Templeton Dragon Fund Inc 41,522
Fondul Proprietatea SA GDR 19,936
Morgan Stanley Asia-Pacific Fund Inc 11,766
India Fund Inc/The 6,496
First Trust Aberdeen Emerging Opportunity Fund 1,845
Mexico Fund Inc/The 1,702
China Fund Inc/The 497
Morgan Stanley China A Share Fund Inc 357
Aberdeen Latin American Equity 222
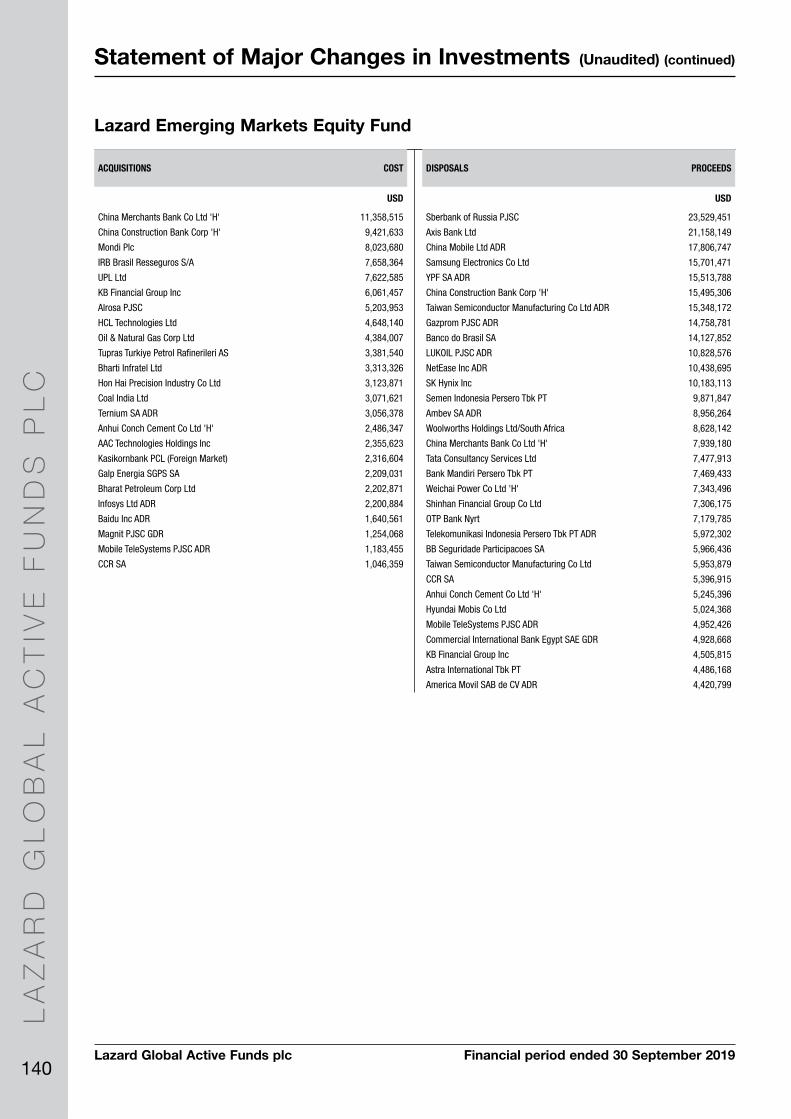
Lazard Global Active Funds plc Financial period ended 30 September 2019
LA
ZA
RD
GL
OB
AL
AC
TIV
E F
UN
DS
PL
C
140
Statement of Major Changes in Investments (Unaudited) (continued)
Lazard Emerging Markets Equity Fund
ACQUISITIONS COST
USD
China Merchants Bank Co Ltd 'H' 11,358,515
China Construction Bank Corp 'H' 9,421,633
Mondi Plc 8,023,680
IRB Brasil Resseguros S/A 7,658,364
UPL Ltd 7,622,585
KB Financial Group Inc 6,061,457
Alrosa PJSC 5,203,953
HCL Technologies Ltd 4,648,140
Oil & Natural Gas Corp Ltd 4,384,007
Tupras Turkiye Petrol Rafinerileri AS 3,381,540
Bharti Infratel Ltd 3,313,326
Hon Hai Precision Industry Co Ltd 3,123,871
Coal India Ltd 3,071,621
Ternium SA ADR 3,056,378
Anhui Conch Cement Co Ltd 'H' 2,486,347
AAC Technologies Holdings Inc 2,355,623
Kasikornbank PCL (Foreign Market) 2,316,604
Galp Energia SGPS SA 2,209,031
Bharat Petroleum Corp Ltd 2,202,871
Infosys Ltd ADR 2,200,884
Baidu Inc ADR 1,640,561
Magnit PJSC GDR 1,254,068
Mobile TeleSystems PJSC ADR 1,183,455
CCR SA 1,046,359
DISPOSALS PROCEEDS
USD
Sberbank of Russia PJSC 23,529,451
Axis Bank Ltd 21,158,149
China Mobile Ltd ADR 17,806,747
Samsung Electronics Co Ltd 15,701,471
YPF SA ADR 15,513,788
China Construction Bank Corp 'H' 15,495,306
Taiwan Semiconductor Manufacturing Co Ltd ADR 15,348,172
Gazprom PJSC ADR 14,758,781
Banco do Brasil SA 14,127,852
LUKOIL PJSC ADR 10,828,576
NetEase Inc ADR 10,438,695
SK Hynix Inc 10,183,113
Semen Indonesia Persero Tbk PT 9,871,847
Ambev SA ADR 8,956,264
Woolworths Holdings Ltd/South Africa 8,628,142
China Merchants Bank Co Ltd 'H' 7,939,180
Tata Consultancy Services Ltd 7,477,913
Bank Mandiri Persero Tbk PT 7,469,433
Weichai Power Co Ltd 'H' 7,343,496
Shinhan Financial Group Co Ltd 7,306,175
OTP Bank Nyrt 7,179,785
Telekomunikasi Indonesia Persero Tbk PT ADR 5,972,302
BB Seguridade Participacoes SA 5,966,436
Taiwan Semiconductor Manufacturing Co Ltd 5,953,879
CCR SA 5,396,915
Anhui Conch Cement Co Ltd 'H' 5,245,396
Hyundai Mobis Co Ltd 5,024,368
Mobile TeleSystems PJSC ADR 4,952,426
Commercial International Bank Egypt SAE GDR 4,928,668
KB Financial Group Inc 4,505,815
Astra International Tbk PT 4,486,168
America Movil SAB de CV ADR 4,420,799
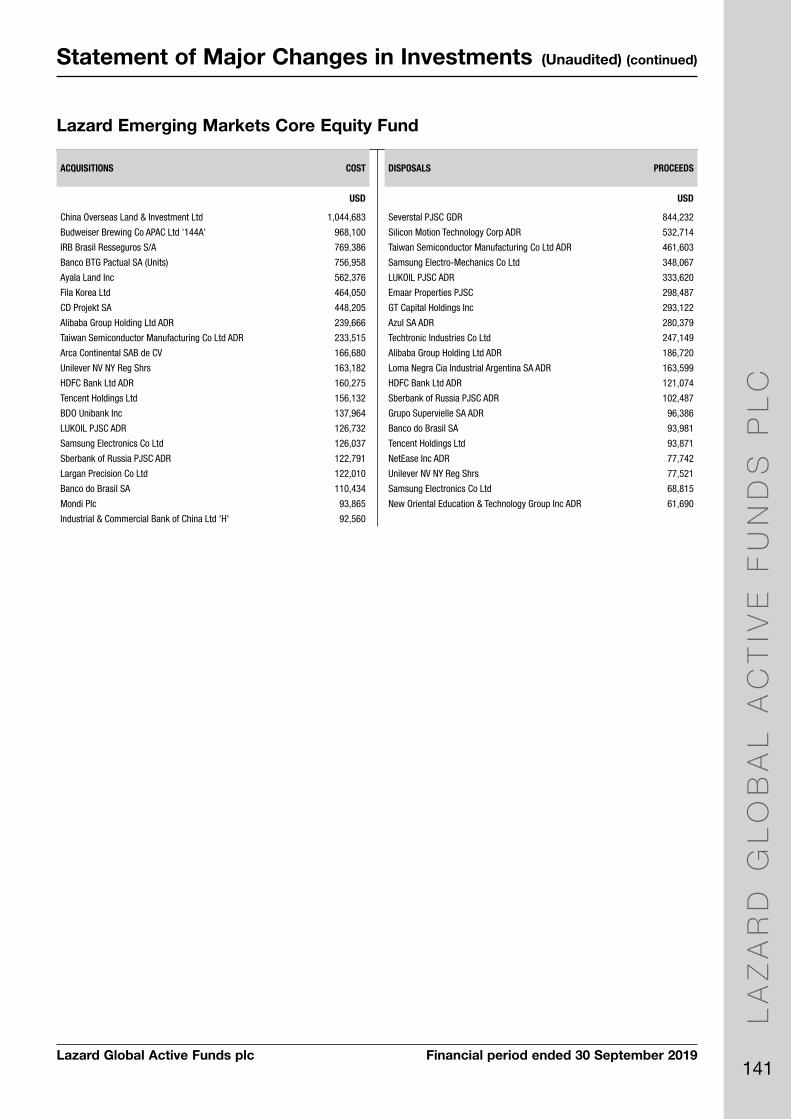
Lazard Global Active Funds plc Financial period ended 30 September 2019
LA
ZA
RD
GL
OB
AL
AC
TIV
E F
UN
DS
PL
C
141
Statement of Major Changes in Investments (Unaudited) (continued)
Lazard Emerging Markets Core Equity Fund
ACQUISITIONS COST
USD
China Overseas Land & Investment Ltd 1,044,683
Budweiser Brewing Co APAC Ltd '144A' 968,100
IRB Brasil Resseguros S/A 769,386
Banco BTG Pactual SA (Units) 756,958
Ayala Land Inc 562,376
Fila Korea Ltd 464,050
CD Projekt SA 448,205
Alibaba Group Holding Ltd ADR 239,666
Taiwan Semiconductor Manufacturing Co Ltd ADR 233,515
Arca Continental SAB de CV 166,680
Unilever NV NY Reg Shrs 163,182
HDFC Bank Ltd ADR 160,275
Tencent Holdings Ltd 156,132
BDO Unibank Inc 137,964
LUKOIL PJSC ADR 126,732
Samsung Electronics Co Ltd 126,037
Sberbank of Russia PJSC ADR 122,791
Largan Precision Co Ltd 122,010
Banco do Brasil SA 110,434
Mondi Plc 93,865
Industrial & Commercial Bank of China Ltd 'H' 92,560
DISPOSALS PROCEEDS
USD
Severstal PJSC GDR 844,232
Silicon Motion Technology Corp ADR 532,714
Taiwan Semiconductor Manufacturing Co Ltd ADR 461,603
Samsung Electro-Mechanics Co Ltd 348,067
LUKOIL PJSC ADR 333,620
Emaar Properties PJSC 298,487
GT Capital Holdings Inc 293,122
Azul SA ADR 280,379
Techtronic Industries Co Ltd 247,149
Alibaba Group Holding Ltd ADR 186,720
Loma Negra Cia Industrial Argentina SA ADR 163,599
HDFC Bank Ltd ADR 121,074
Sberbank of Russia PJSC ADR 102,487
Grupo Supervielle SA ADR 96,386
Banco do Brasil SA 93,981
Tencent Holdings Ltd 93,871
NetEase Inc ADR 77,742
Unilever NV NY Reg Shrs 77,521
Samsung Electronics Co Ltd 68,815
New Oriental Education & Technology Group Inc ADR 61,690
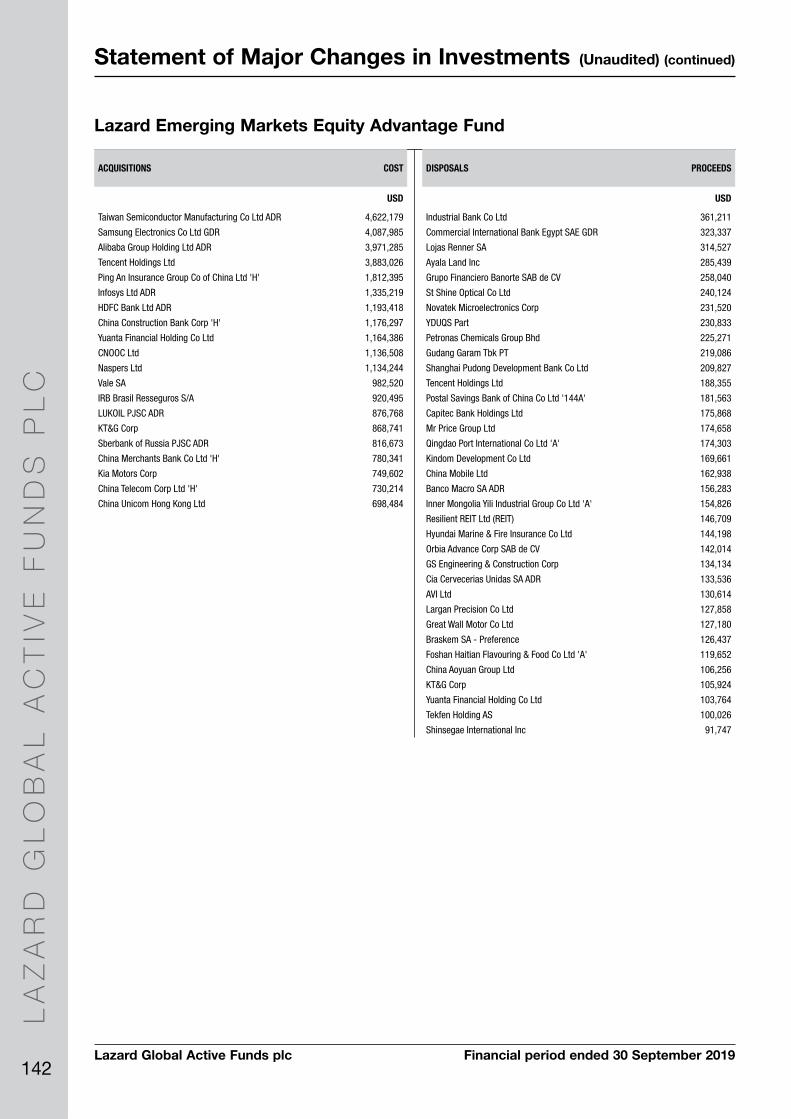
Lazard Global Active Funds plc Financial period ended 30 September 2019
LA
ZA
RD
GL
OB
AL
AC
TIV
E F
UN
DS
PL
C
142
Statement of Major Changes in Investments (Unaudited) (continued)
Lazard Emerging Markets Equity Advantage Fund
ACQUISITIONS COST
USD
Taiwan Semiconductor Manufacturing Co Ltd ADR 4,622,179
Samsung Electronics Co Ltd GDR 4,087,985
Alibaba Group Holding Ltd ADR 3,971,285
Tencent Holdings Ltd 3,883,026
Ping An Insurance Group Co of China Ltd 'H' 1,812,395
Infosys Ltd ADR 1,335,219
HDFC Bank Ltd ADR 1,193,418
China Construction Bank Corp 'H' 1,176,297
Yuanta Financial Holding Co Ltd 1,164,386
CNOOC Ltd 1,136,508
Naspers Ltd 1,134,244
Vale SA 982,520
IRB Brasil Resseguros S/A 920,495
LUKOIL PJSC ADR 876,768
KT&G Corp 868,741
Sberbank of Russia PJSC ADR 816,673
China Merchants Bank Co Ltd 'H' 780,341
Kia Motors Corp 749,602
China Telecom Corp Ltd 'H' 730,214
China Unicom Hong Kong Ltd 698,484
DISPOSALS PROCEEDS
USD
Industrial Bank Co Ltd 361,211
Commercial International Bank Egypt SAE GDR 323,337
Lojas Renner SA 314,527
Ayala Land Inc 285,439
Grupo Financiero Banorte SAB de CV 258,040
St Shine Optical Co Ltd 240,124
Novatek Microelectronics Corp 231,520
YDUQS Part 230,833
Petronas Chemicals Group Bhd 225,271
Gudang Garam Tbk PT 219,086
Shanghai Pudong Development Bank Co Ltd 209,827
Tencent Holdings Ltd 188,355
Postal Savings Bank of China Co Ltd '144A' 181,563
Capitec Bank Holdings Ltd 175,868
Mr Price Group Ltd 174,658
Qingdao Port International Co Ltd 'A' 174,303
Kindom Development Co Ltd 169,661
China Mobile Ltd 162,938
Banco Macro SA ADR 156,283
Inner Mongolia Yili Industrial Group Co Ltd 'A' 154,826
Resilient REIT Ltd (REIT) 146,709
Hyundai Marine & Fire Insurance Co Ltd 144,198
Orbia Advance Corp SAB de CV 142,014
GS Engineering & Construction Corp 134,134
Cia Cervecerias Unidas SA ADR 133,536
AVI Ltd 130,614
Largan Precision Co Ltd 127,858
Great Wall Motor Co Ltd 127,180
Braskem SA - Preference 126,437
Foshan Haitian Flavouring & Food Co Ltd 'A' 119,652
China Aoyuan Group Ltd 106,256
KT&G Corp 105,924
Yuanta Financial Holding Co Ltd 103,764
Tekfen Holding AS 100,026
Shinsegae International Inc 91,747
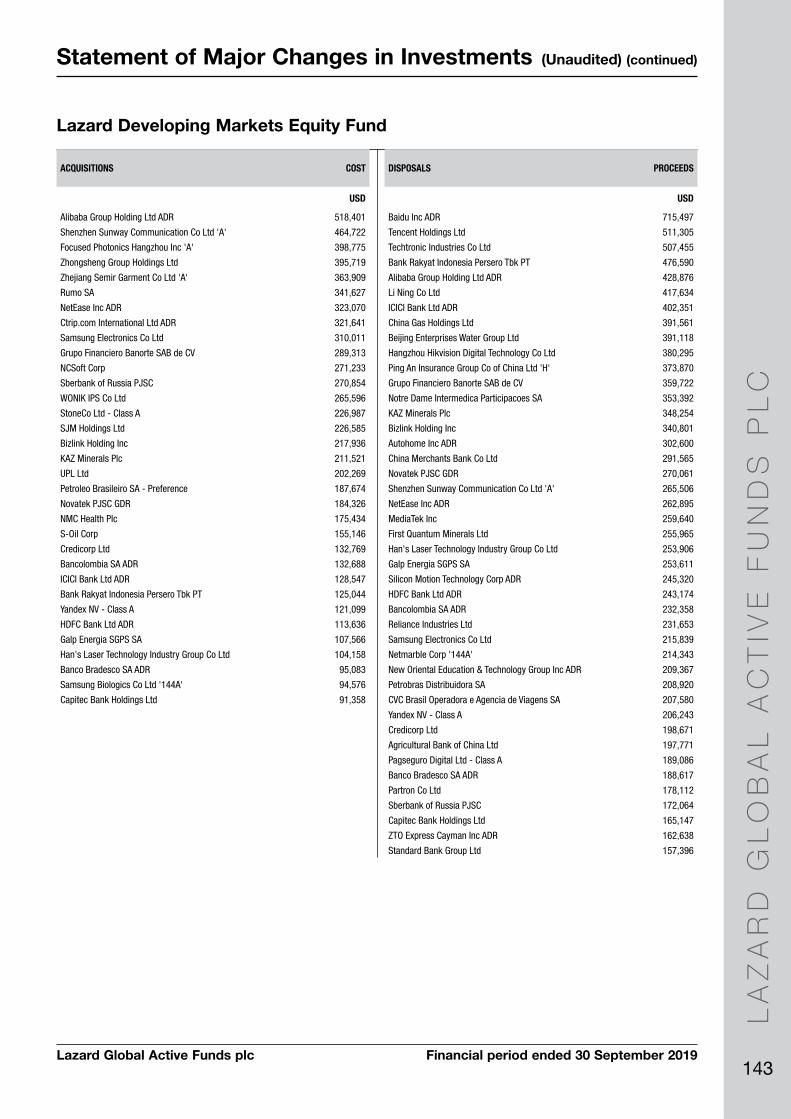
Lazard Global Active Funds plc Financial period ended 30 September 2019
LA
ZA
RD
GL
OB
AL
AC
TIV
E F
UN
DS
PL
C
143
Statement of Major Changes in Investments (Unaudited) (continued)
Lazard Developing Markets Equity Fund
ACQUISITIONS COST
USD
Alibaba Group Holding Ltd ADR 518,401
Shenzhen Sunway Communication Co Ltd 'A' 464,722
Focused Photonics Hangzhou Inc 'A' 398,775
Zhongsheng Group Holdings Ltd 395,719
Zhejiang Semir Garment Co Ltd 'A' 363,909
Rumo SA 341,627
NetEase Inc ADR 323,070
Ctrip.com International Ltd ADR 321,641
Samsung Electronics Co Ltd 310,011
Grupo Financiero Banorte SAB de CV 289,313
NCSoft Corp 271,233
Sberbank of Russia PJSC 270,854
WONIK IPS Co Ltd 265,596
StoneCo Ltd - Class A 226,987
SJM Holdings Ltd 226,585
Bizlink Holding Inc 217,936
KAZ Minerals Plc 211,521
UPL Ltd 202,269
Petroleo Brasileiro SA - Preference 187,674
Novatek PJSC GDR 184,326
NMC Health Plc 175,434
S-Oil Corp 155,146
Credicorp Ltd 132,769
Bancolombia SA ADR 132,688
ICICI Bank Ltd ADR 128,547
Bank Rakyat Indonesia Persero Tbk PT 125,044
Yandex NV - Class A 121,099
HDFC Bank Ltd ADR 113,636
Galp Energia SGPS SA 107,566
Han's Laser Technology Industry Group Co Ltd 104,158
Banco Bradesco SA ADR 95,083
Samsung Biologics Co Ltd '144A' 94,576
Capitec Bank Holdings Ltd 91,358
DISPOSALS PROCEEDS
USD
Baidu Inc ADR 715,497
Tencent Holdings Ltd 511,305
Techtronic Industries Co Ltd 507,455
Bank Rakyat Indonesia Persero Tbk PT 476,590
Alibaba Group Holding Ltd ADR 428,876
Li Ning Co Ltd 417,634
ICICI Bank Ltd ADR 402,351
China Gas Holdings Ltd 391,561
Beijing Enterprises Water Group Ltd 391,118
Hangzhou Hikvision Digital Technology Co Ltd 380,295
Ping An Insurance Group Co of China Ltd 'H' 373,870
Grupo Financiero Banorte SAB de CV 359,722
Notre Dame Intermedica Participacoes SA 353,392
KAZ Minerals Plc 348,254
Bizlink Holding Inc 340,801
Autohome Inc ADR 302,600
China Merchants Bank Co Ltd 291,565
Novatek PJSC GDR 270,061
Shenzhen Sunway Communication Co Ltd 'A' 265,506
NetEase Inc ADR 262,895
MediaTek Inc 259,640
First Quantum Minerals Ltd 255,965
Han's Laser Technology Industry Group Co Ltd 253,906
Galp Energia SGPS SA 253,611
Silicon Motion Technology Corp ADR 245,320
HDFC Bank Ltd ADR 243,174
Bancolombia SA ADR 232,358
Reliance Industries Ltd 231,653
Samsung Electronics Co Ltd 215,839
Netmarble Corp '144A' 214,343
New Oriental Education & Technology Group Inc ADR 209,367
Petrobras Distribuidora SA 208,920
CVC Brasil Operadora e Agencia de Viagens SA 207,580
Yandex NV - Class A 206,243
Credicorp Ltd 198,671
Agricultural Bank of China Ltd 197,771
Pagseguro Digital Ltd - Class A 189,086
Banco Bradesco SA ADR 188,617
Partron Co Ltd 178,112
Sberbank of Russia PJSC 172,064
Capitec Bank Holdings Ltd 165,147
ZTO Express Cayman Inc ADR 162,638
Standard Bank Group Ltd 157,396

Lazard Global Active Funds plc Financial period ended 30 September 2019
LA
ZA
RD
GL
OB
AL
AC
TIV
E F
UN
DS
PL
C
144
Statement of Major Changes in Investments (Unaudited) (continued)
Lazard MENA Fund
ALL ACQUISITIONS COST
USD
NMC Health Plc 911,852
National Agriculture Development Co/The 707,320
Fawaz Abdulaziz Al Hokair & Co 646,604
National Central Cooling Co PJSC 596,112 Fawry Banking and Payment Technology Services P-Note HSBC Bank Plc 245,096
Emirates NBD PJSC P-Note Merrill Lynch International 223,466
Ooredoo 158,336
CI Capital Holding for Financial Investments 146,217
ALL DISPOSALS PROCEEDS
USD
Co for Cooperative Insurance/The 814,910
Cairo Investment & Real Estate Development Co SAE 659,758
OCI NV 595,751
Abu Dhabi National Oil Co for Distribution PJSC 368,611
United International Transportation Co 350,641 Fawry Banking and Payment Technology Services P-Note HSBC Bank Plc 308,765
Gulf Bank KSCP 288,033

Lazard Global Active Funds plc Financial period ended 30 September 2019
LA
ZA
RD
GL
OB
AL
AC
TIV
E F
UN
DS
PL
C
145
Statement of Major Changes in Investments (Unaudited) (continued)
Lazard Global Fixed Income Fund
ACQUISITIONS COST
USD
Czech Republic Government Bond FRN, 2.150% due 19/11/2027 927,743
Republic of Poland Government Bond FRN, 1.790% due 25/05/2028 921,101
United States Treasury Note/Bond, 1.750% due 15/05/2023 881,709
United States Treasury Note/Bond, 2.125% due 15/05/2025 675,040
Kreditanstalt fuer Wiederaufbau 'MTN', 2.750% due 16/04/2020 615,637
United States Treasury Note/Bond, 2.875% due 15/08/2028 538,917 French Republic Government Bond OAT '144A', 1.750% due 25/06/2039 367,726
Spain Government Bond '144A', 1.400% due 30/04/2028 362,169 United States Treasury Inflation Indexed Bonds, 0.137% due 15/04/2020 310,996
American Express Co, 3.000% due 30/10/2024 309,572
Ireland Government Bond, 1.350% due 18/03/2031 306,968
Mexico Cetes (Zero Coupon), due 23/04/2020 306,920
Starbucks Corp, 4.450% due 15/08/2049 305,103
Hungary Government Bond, 2.500% due 24/10/2024 303,794
Hungary Government Bond, 2.750% due 22/12/2026 302,802
United States Treasury Note/Bond, 2.250% due 15/08/2049 302,332
Hungary Government Bond, 3.000% due 21/08/2030 302,191
Peru Government Bond '144A', 6.150% due 12/08/2032 300,058
Singapore Government Bond, 3.375% due 01/09/2033 298,413
Romania Government Bond, 4.000% due 27/10/2021 297,872
McDonald's Corp, 3.125% due 04/03/2025 297,780
Microsoft Corp, 4.450% due 03/11/2045 254,960
Apple Inc, 3.850% due 04/05/2043 250,545
Philippine Government International Bond, 4.950% due 15/01/2021 248,563
Panama Government International Bond, 4.000% due 22/09/2024 235,643
City of Oslo Norway, 2.350% due 04/09/2024 231,684
Czech Republic Government Bond, 2.500% due 25/08/2028 214,743 Morocco Government International Bond 'REGS', 4.250% due 11/12/2022 206,000
Verizon Communications Inc, 3.875% due 08/02/2029 198,095
United States Treasury Note/Bond, 3.125% due 15/11/2041 190,530
Ireland Government Bond, 1.700% due 15/05/2037 188,802 Bonos de la Tesoreria de la Republica en pesos, 0.000% due 01/03/2026 185,447
United Kingdom Gilt, 1.750% due 07/09/2037 179,604
BNG Bank NV 'EMTN', 5.000% due 16/09/2020 174,755
United Kingdom Gilt, 1.500% due 22/07/2047 168,919
DISPOSALS PROCEEDS
USD
Czech Republic Government Bond, 2.500% due 25/08/2028 710,621
Singapore Government Bond, 3.000% due 01/09/2024 647,759
Spain Government Bond '144A', 1.400% due 30/04/2028 623,328
Republic of Poland Government Bond, 2.500% due 25/07/2026 600,639
United States Treasury Note/Bond, 2.875% due 15/08/2028 583,278
United States Treasury Note/Bond, 3.125% due 15/11/2041 526,412
Ireland Government Bond, 1.700% due 15/05/2037 351,386
NIKE Inc, 2.375% due 01/11/2026 333,235
Hungary Government Bond, 3.000% due 21/08/2030 326,850
Mexican Bonos, 6.500% due 09/06/2022 318,460
Hungary Government Bond, 3.000% due 26/06/2024 309,867
Western Australian Treasury Corp, 6.000% due 16/10/2023 294,792
African Development Bank, 2.375% due 23/09/2021 282,579
City of Oslo Norway, 2.450% due 24/05/2023 234,300
Iberdrola International BV 'EMTN', 1.125% due 21/04/2026 232,542
United Rentals North America Inc, 4.625% due 15/07/2023 215,775
Starbucks Corp, 3.100% due 01/03/2023 198,508
Johnson & Johnson, 3.625% due 03/03/2037 179,614
United States Treasury Note/Bond, 1.750% due 15/05/2023 175,048
Ball Corp, 4.000% due 15/11/2023 166,000
Carlsberg Breweries A/S 'EMTN', 2.500% due 28/05/2024 135,565 Fresenius Medical Care US Finance II Inc 'REGS', 4.125% due 15/10/2020 116,248
Commonwealth of Pennsylvania, 5.850% due 15/07/2030 103,569
HCA Inc, 6.500% due 15/02/2020 80,239

Lazard Global Active Funds plc Financial period ended 30 September 2019
LA
ZA
RD
GL
OB
AL
AC
TIV
E F
UN
DS
PL
C
146
Statement of Major Changes in Investments (Unaudited) (continued)
Lazard Sterling High Quality Bond Fund
ALL ACQUISITIONS COST
GBP
United Kingdom Gilt, 3.250% due 22/01/2044 234,640
United Kingdom Gilt, 1.250% due 22/07/2027 123,958
United Kingdom Treasury Bill (Zero Coupon), due 02/12/2019 99,826
General Motors Financial Co Inc 'EMTN', 2.350% due 03/09/2025 99,823
CYBG Plc 'GMTN' FRN, 4.000% due 03/09/2027 99,589
United Utilities Water Finance Plc 'EMTN', 2.000% due 03/07/2033 98,546
Aviva Plc FRN, 6.125% due 14/11/2036 23,523
ALL DISPOSALS PROCEEDS
GBP
United Kingdom Gilt, 1.250% due 22/07/2027 159,310
United Utilities Water Finance Plc 'EMTN', 2.000% due 03/07/2033 105,583
APT Pipelines Ltd, 3.125% due 18/07/2031 104,947
InterContinental Hotels Group Plc 'EMTN', 2.125% due 24/08/2026 101,607
Glencore Finance Europe Ltd 'EMTN', 3.125% due 26/03/2026 101,056
United Kingdom Treasury Bill (Zero Coupon), due 16/09/2019 99,963
United Kingdom Treasury Bill (Zero Coupon), due 02/12/2019 99,857
GE Capital UK Funding Unlimited Co 'EMTN', 5.875% due 04/11/2020 52,674
United Kingdom Gilt, 4.750% due 07/12/2030 35,275
United Kingdom Gilt, 1.625% due 22/10/2028 26,828