Lawson Williams · Lawson Williams Consulting Group Ltd is a Recruitment Solutions ... Accounting...
37
Lawson Williams Specialist Recruitment The New Zealand Staff Turnover Survey - Full report in partnership with...
Transcript of Lawson Williams · Lawson Williams Consulting Group Ltd is a Recruitment Solutions ... Accounting...

Lawson WilliamsSpecialist Recruitment
The New Zealand Staff Turnover Sur vey
- Full report
in partnership with...

I t ’ s about f l e x -ibili ty and open-n e s s , deliv-ering s trat-e gi e s a n d p r o -cesses t h a t f i t w i t h y o u r inter-nal r e -cruit-m e n t a n d HR r e -sourc-e s . Deliv-e r in g t h e r i g h t
people or HR projects on time and within budget.
Companys are seeking to improve recruitment outcomes and achieve a reduction in the total cost of recruitment.
Improved recruitment outcomes result from effective recruitment, onboarding, retention and the development of staff.
Introduction..
The measurement of staff turnover provides organisations a benchmark of the success of their recruitment, onboarding, retention and development activities.
The improvement of staff turnover is a competitive opportunity employers have, in an increasing talent and skills short market.
The New Zealand Staff Turnover Survey provides New Zealand companies their staff turnover benchmark.
The NZ Staff Turnover Survey report.
Sur vey participants receive a report including:
Industr y comparison - your organistion’s per formance on staff turnover versus other employers in your industr y sector. Also included is private sector vs. public sector comparisons.
90 Day trial period status - an update on who is using it and how often.
Voluntar y versus involuntar y departures - a benchmark indicator of your Staff Retention per formance & Organisational Culture.
Departures in the first year of employment - a benchmark indicator of the success of your Recruitment & Induction programmes.
Turnover by Region - compare across New Zealand.
Costs of Turnover - method for costing of staff turnover.
Trends Analysis and Commentar y - key comparisons with the previous five years and suggestions for the future.
Recommendations - managing turnover and applying turnover metrics.
This is a FREE sur vey and report - unlike remuneration sur veys, there is no cost to participate and receive the report findings.

Lawson Williams Consulting Group Ltd is a Recruitment Solutions business.
We have worked with a wide range of New Zealand businesses for over 20 years, improving recruitment outcomes and reducing the total cost of recruitment.
The business operates with 3 recruitment brands...
High performing peopleLawsonExecutive
Specialising in 6 core verticals..Manufacturing and OperationsSupply Chain and ProcurementTechnical, Quality and Health and SafetyEngineeringLean and Continuous ImprovementSales and Marketing
Specialising in 6 core verticals..Human ResourcesAccountingCustomer ServicesOffice Support ITSales and marketing
Leadership positions for New Zealand organisations
Each brand operates with 3 divisions...
End to end recruitment...
As recruitment specialists our role is to know who is right. It’s about experience, capability, potential and fit
Today’s recruitment specialist must know both the market and the people in it. With over 20 years recruiting in New Zealand, including the
completion of thousands of successful assignments we have become an authority within our areas of recruitment specialisation.
Recruitment Consulting...
Our Recruitment consulting team work with clients who are looking for a fit for purpose recruitment solution, not always requiring our end to
end specialist recruitment services. We work with Managers, Human Resources and Internal Recruitment to develop, implement or
supplement unique recruitment services.
HR Services....
Our clients often have human resources management needs that require reliable access to senior level HR experience, but not on a full-time
basis. Whether it’s a one-off project or on-going support and advice throughout the year, HR Services can develop and provide the
HR service or support to meet your requirements.
About the authors.

For further information visitwww.lawsonwilliams.co.nz
www.oxygenrecruitment.co.nz
To participate in this survey contact us at ...
Auckland Office
Level 17, 126 Vincent StreetAuckland
Phone: 09 522 3920
Waikato Office
298 Barton StreetHamilton
Phone: 07 854 3716
Web
www.lawsonwilliams.co.nzwww.oxygenrecruitment.co.nz

New Zealands only National Staff Turnover survey
www.lawsonwilliams.co.nzwww.hrinz.org.nz
THE 2016 NEW ZEALAND
SURVEY

COPYRIGHTCopyright, Lawson Williams Consulting Group Limited, 2017 No part of this publication may be reproduced, transmitted, or stored in an information retrieval system by any means, except for the specific and sole use by the subscribing organisation solely and only within the subscribing organisation, without the prior written permission of Lawson Williams Consulting Group Ltd. The material in this publication may not be issued to others.
Contents
22List of Contributing Organisations 3
5Executive Summary 24
26
31
32
Voluntary vs. Involuntary Turnover by Industry
Voluntary vs. Involuntary Turnover
Statistical Notes
Industry Categorys
15
18
20
Turnover by Industry
Turnover by Staff Size
Turnover by Organisational Revenue/Baseline
Lawson Williams Consulting Group Ltd - 2017
The 90 day trial period 11
Turnover by Region

1.Contributing OrganisationsThe following re the list of organisations who have contributed data for this report
1.Contributing Organisations The following are the list of organisations who have contributed data for this report
Lawson Williams Consulting Group Ltd - 2017Page 3
Adamas Business ConsultingADInstrumentsAECOMAir New ZealandAlpine EnergyAPLArgenta ManufacturingAshon Ventures New ZealandAuCom ElectronicsBaldwins Intellectual PropertyBallance Agri NutrientsBarkers Fruit ProcessorsBayer New ZealandBDO AucklandBearcat TyresBremca WaikatoCalder StewartCanary EnterprisesCarlton Taylor IndustriesChemcolour IndustriesChorusChristchurch City CouncilChristchurch Netball CentreCity CareComprehensive CareConneticsContact EnergyCo-op Money New ZealandCouplands BakeriesCPB ContractorsCubic Defence New ZealandCulpan MedicalDairyNZDamar IndustriesDHLDowner New ZealandEagle TechnolgyEbert ConstructionElectrixEnvironment SouthlandEnviroWaste New ZealandEPA
Experience WellingtonFamily PlanningFar North REAPFirst AssistanceFisher & Paykel AppliancesFisher & Paykel HealthcareFMAFoodstuffs North IslandForte CareersGCL New Energy HoldingsGenesis EnergyGHDGodfrey HIrstGough GroupGreen Valley DairiesGreenpeaceGrow Human ResourcesGuritHamilton City CouncilHancock Forest ManagementHarrison Grierson ConsultantsHawke’s Bay Regional CouncilHayes InternationalHorizons Regional CouncilHospice North ShoreHydraulink Fluid ConnectorsIHCIInland RevenueInstant FinanceInvitaJacobsJenkins Freshpac SystemsJetconnectJLLKaizen Institute New ZealandKarori Medical CentreKaycee ProjectsKiwi DiscoveryKiwibankKPMG
Lawson WilliamsMaersk LineMainPower New ZealandMarlborough District CouncilMary Potter HospiceMASH TrustMassey UniversityMcAlpine HussmannMCI & AssociatesMcLaren AssociatesMedical Council of New Zea-landMental Health Support Ser-vicesMeridianEnergyMet ServiceMinistry of HealthMitsui & CoMore4AppsMr Apple New ZealandMWHMyFarmNational Mini StorageNautech ElectronicsNaylor Love ConstructionNelmacNelson City CouncilNelson ForestsNet GroupNew Plymouth District Coun-cilNew Zealand King SalmonNew Zealand PharmaceuticalsNew Zealand PoliceNew Zealand Red CrossNew Zealand SteelNiagara Sawmilling CompanyNIBNind Electrical Services

Ud exeraessisi. MetueraNulla commy nim alit
min
iat.
Illa
con
utet
nul
put
metuera
Red Border Magazine • Issue 285
4
Lawson Williams Consulting Group Ltd - 2017Page 4
Northland Regional CouncilNZ Sign CoNZCU BaywideOffice of the Privacy Commis-sionerOnline DistributionOpus International Consul-tantsOrion New ZealandOSPRI New ZealandOtago Southland Employers AssnPall NZPan Pac Forest ProductsPenguin Random House Pernod Ricard WinemakersPerry Metal ProtectionPlanProPlunketPolson HiggsPremier Beehive Presbyterian Support East CoastPresbyterian Support South-landPrimary ITOPurata FarmingQueenstown Lakes District CouncilRentokil InitialRepcoReserve Bank of New ZealandRexel NZ trading as Ideal Elec-trical Suppliers
Rheem New ZealandSealed AirSika New ZealandSKF New ZealandSkillset New ZealandSkyCitySouthern Cross Health Soci-etySovereignSpectrum CareSpotless Springer NatureSPSSt JohnStaples Rodway HBSummerset Group HoldingsSushi Bar HayamaTasman Bay Food GroupTasman District CouncilTaylor PrestonTegel FoodsTenon ManufacturingThe Co-operative BankThe Cornell Education GroupThe Griffin’s Food CompanyThe Langham, AucklandThe Rees ManagementThe Skills OrganisationThe Tatua Co-operative Dairy CompanyTransmission GullyTranspower New Zealand
Trustees ExecutorsTurk’s Poultry FarmUCOLUnison NetworksVectorVectorVerkerksVilla Maria EstateVista Entertainment GroupVizExplorerVocus GroupVodafone New ZealandVTNZWakefield MetalsWaratah New ZealandWarren and Mahoney Archi-tectsWebb GroupWestern Bay of Plenty District CouncilWillis Towers WatsonWintecWWF New ZealandYellow Pages GroupYMCA

Ud exeraessisi. MetueraNulla commy nim alit
min
iat.
Illa
con
utet
nul
put
metuera
Red Border Magazine • Issue 285
5
Factors such as an aging workforce, skill-shortages, attitudinal shifts to the
desirable speed of changing jobs, reduced loyalty, rapid organisational change producing redundancy & reduced job security have all driven gradual increases in turnover during most of the past twenty years.
These increases came to an abrupt halt after the onset of the Global Financial Crisis in 2007 and subsequent recession of 2008 & 2009. Turnover decreased by well over a quarter (28.3%) since its peak of 23.0% in 2007. Furthermore the 2008 figure of 22.4% masked a significant jump in involuntary turnover, with 4.5% of the total (about one-fifth of departures) being involuntary and with that increase almost certainly being due to a sharp increase in redundancies in the second half of the 2008 calendar year. 2009 saw a dramatic drop in voluntary turnover from 17.5% in 2008 to 12.8%. More than one departure in five was involuntary, again suggesting a high rate of redundancies that year.
Since 2009 with the end of the recession and the move to a more stable but very low growth economy, the labour market has stabilised and shown some very gradual improvement. This was reflected in voluntary turnover increasing from 12.8% to 13.4% and involuntary turnover
reducing from 4.6% to 4.0% for the year ending 31 May 2011. In turn, the very gradual improvement continued with voluntary turnover increasing slightly from 13.4% to 13.7% in 2012 and involuntary turnover reduced from 4.0% to 3.8%.
In 2013 we noted a reversal in both voluntary and involuntary turnover. Voluntary decreased slightly to 13.3% from 13.7% which was indicative of the continuing uncertainty in the employment market in most sectors through to late 2013. Involuntary increased slightly from 3.8% to 4.1% which again may indicate that some companies were still in restructure or reduction mode in 2013. The average turnover rate in 2014 remained relatively stable with a small decrease from 17.2% in 2013 to 16.3% in 2014.
This slight decrease reflected that even though the economy was showing positive signs of growth this was not reflected in employment activity across all sectors and an increase in voluntary turnover. We noted that throughout 2014 and particularly in the 4th quarter a record number of people entered the workforce and the participation rate reached an all time high, yet wage inflation was mild. This left the economy in a strong position of economic growth with little inflation which led to the speculation
2.Executive Summary.The New Zealand National Average Turnover
The National average turnover for 2016 was 18.8%. This is the highest rate since 2008
showing a 2.2% increase on 2015.
Lawson Williams Consulting Group Ltd - 2017Page 5

Ud exeraessisi. MetueraNulla commy nim alit
min
iat.
Illa
con
utet
nul
put
metuera
Red Border Magazine • Issue 285
6 that low wage inflation i.e. a lag in salary increase behind economic growth might impact on peoples desire to voluntarily seek new employment in 2014.
In 2015 we saw a significant increase of 11.4% in the national average turnover to the highest level of 18.4% since 2008. This has increased a further 2.2% in 2016 to 18.8%.
Involuntary turnover has shown a decrease in 2016 to 3.6% from 3.9% in 2015. This has returned to the trend where movements in Involuntary turnover following volun-tary turnover. In the past two years we had seen a change to this trend where these figures had moved in the same direction as each other. We had suggested that since 2014 these figures were indicating an economy of significant variability.
At that time for example growth and confidence in Auckland and Canterbury and in sectors such as manufacturing and construction was not reflected across a broader range of regions and sectors. It appeared that some organisations were still in a mode of restructuring and increasing their levels of Involuntary turnover. This resulted in a national increase at the same time as a national increase in Voluntary turnover.
As we present these 2016 survey results in early 2017, amidst more consistent and positive market conditions it appears that the transition and subsequent strength of New Zealand economy across a broader number of sectors has returned the strong correlation between Voluntary and Involuntary staff turnover.
Lawson Williams Consulting Group Ltd - 2017Page 6
Perc
ent
National Average Staff Turnover
Year
20.423 22.4
16.5 16.4 17.7 17.2 16.318.4 18.8
0
5
10
15
20
25
30
2006
2007
2008
2009
2010
/2011
2012
2013
2014
2015
2016

Ud exeraessisi. MetueraNulla commy nim alit
Red Border Magazine • Issue 285
7
min
iat.
Illa
con
utet
nul
put
Comparisons by Industry Sector
Consistent with past research, 2016turnover rates varied considerably
across industry sectors. The average turnover in 2016 ranged from 11.7% in the Accounting Sector to 41.7% in Fast-food and hospitality.
In this survey we note some significant changes in percentage of staff turnover in specific industry sectors, between 2015 and 2016.
Fastfood and Hospitality 21% decreaseRetail 20% decreaseTransport and Logistics 27% increaseHealthcare 23% increaseCrown Entity 36% increaseFMCG 21% increaseAgriculture 23% increase
These changes in industry accentuate the need for organisations to evaluate the turnover/staff retention performance across their own industry sector, rather than using the national av-erage turnover rate of 18.8% as a bench-mark. We have therefore provided industry-by-industry turnover figures throughout this report.
Insurance 25% increaseNon profit 19% decreaseBanking and Finance 26% decreasePharma/Med products 27% decreaseEnergy/Electricity 19% increaseAccounting firms 18% decrease
Suggestions for
Using the Data
Lawson Williams Consulting Group Ltd - 2017Page 7
Ud exeraessisi. MetueraNulla commy nim alit
Red Border Magazine • Issue 285
8
min
iat.
Illa
con
utet
nul
put
Suggestions for
Using the Data
Voluntary vs. Involuntary
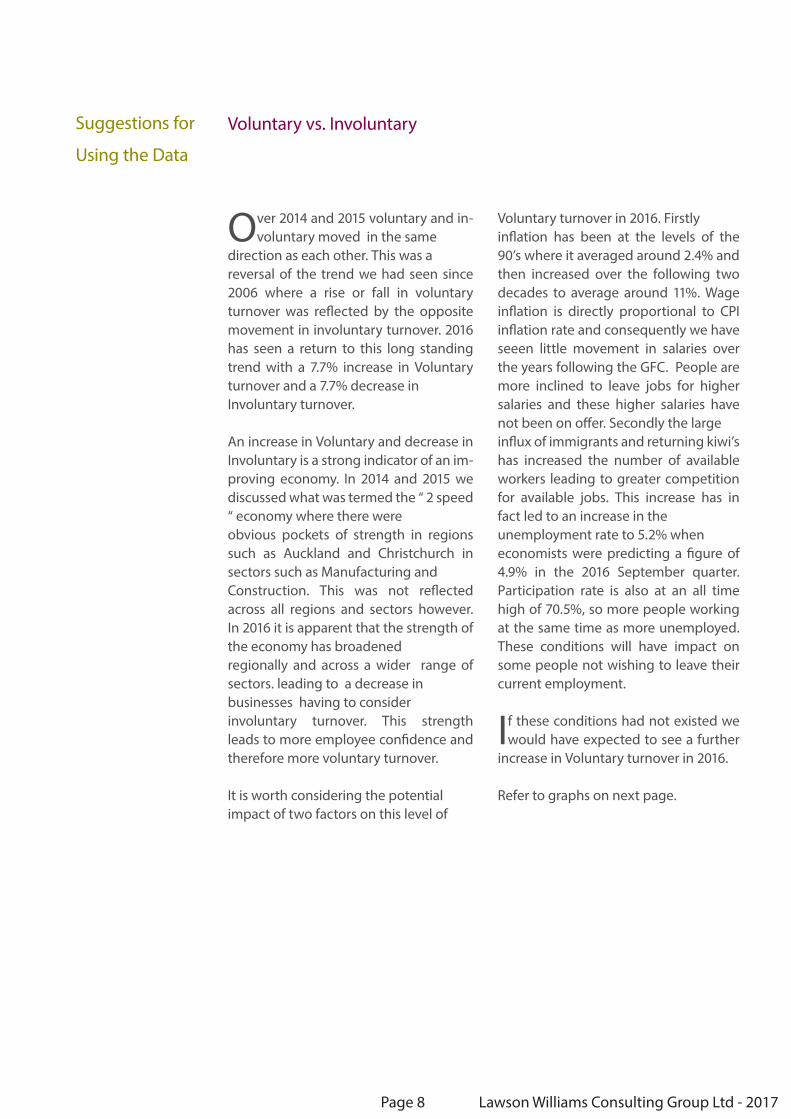
Over 2014 and 2015 voluntary and in-voluntary moved in the same
direction as each other. This was a reversal of the trend we had seen since 2006 where a rise or fall in voluntary turnover was reflected by the opposite movement in involuntary turnover. 2016 has seen a return to this long standing trend with a 7.7% increase in Voluntary turnover and a 7.7% decrease in Involuntary turnover.
An increase in Voluntary and decrease in Involuntary is a strong indicator of an im-proving economy. In 2014 and 2015 we discussed what was termed the “ 2 speed “ economy where there were obvious pockets of strength in regions such as Auckland and Christchurch in sectors such as Manufacturing and Construction. This was not reflected across all regions and sectors however. In 2016 it is apparent that the strength of the economy has broadened regionally and across a wider range of sectors. leading to a decrease in businesses having to consider involuntary turnover. This strength leads to more employee confidence and therefore more voluntary turnover.
It is worth considering the potential impact of two factors on this level of
Voluntary turnover in 2016. Firstly inflation has been at the levels of the 90’s where it averaged around 2.4% and then increased over the following two decades to average around 11%. Wage inflation is directly proportional to CPI inflation rate and consequently we have seeen little movement in salaries over the years following the GFC. People are more inclined to leave jobs for higher salaries and these higher salaries have not been on offer. Secondly the large influx of immigrants and returning kiwi’s has increased the number of available workers leading to greater competition for available jobs. This increase has in fact led to an increase in the unemployment rate to 5.2% when economists were predicting a figure of 4.9% in the 2016 September quarter. Participation rate is also at an all time high of 70.5%, so more people working at the same time as more unemployed. These conditions will have impact on some people not wishing to leave their current employment.
If these conditions had not existed we would have expected to see a further
increase in Voluntary turnover in 2016.
Refer to graphs on next page.
Lawson Williams Consulting Group Ltd - 2015Lawson Williams Consulting Group Ltd - 2017Page 8
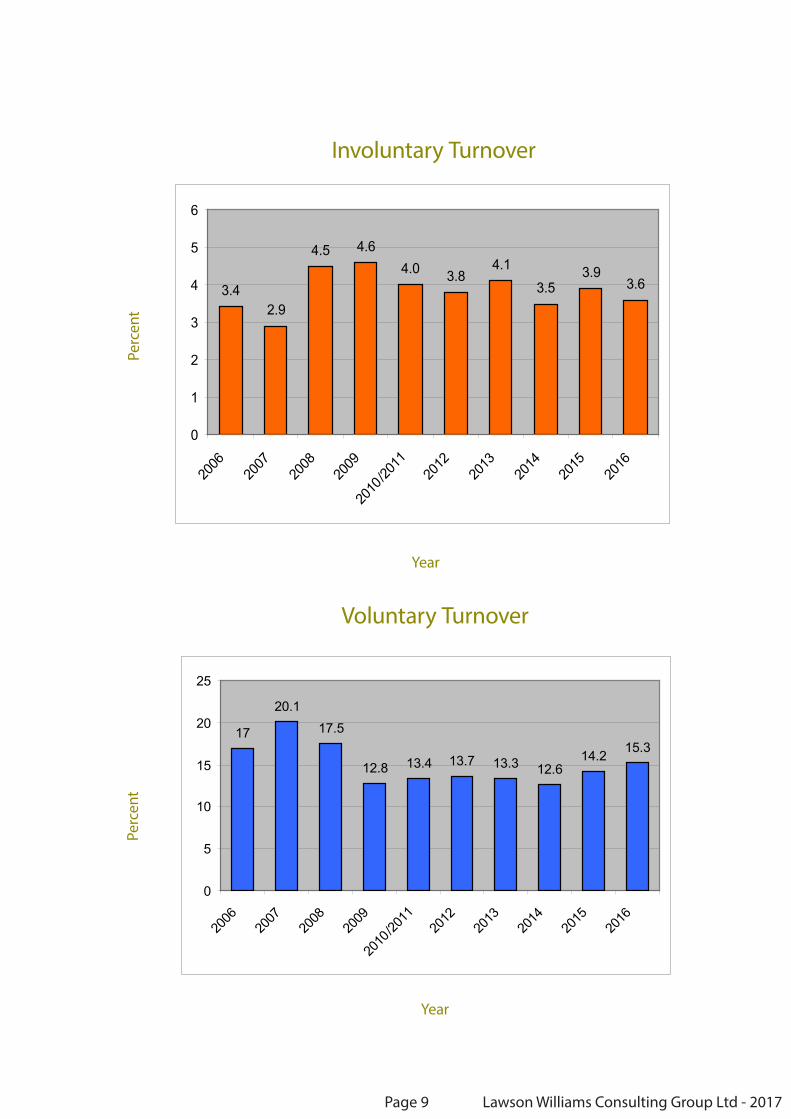
Involuntary Turnover
Year
Perc
ent
Year
Perc
ent
Voluntary Turnover
Lawson Williams Consulting Group Ltd - 2017Page 9
17
20.117.5
12.8 13.4 13.7 13.3 12.614.2 15.3
0
5
10
15
20
25
2006
2007
2008
2009
2010
/2011
2012
2013
2014
2015
2016
3.42.9
4.5 4.64.0 3.8
4.13.5
3.93.6
0
1
2
3
4
5
6
2006
2007
2008
2009
2010
/2011
2012
2013
2014
2015
2016

Ud exeraessisi. MetueraNulla commy nim alit
Red Border Magazine • Issue 285
1
min
iat.
Illa
con
utet
nul
put
Turnover in the first twelve months employment
This is a key benchmark of recruitment & induction success.
Consistently across the years of this survey has been the trend that turnover in the first 12 months employment is similar to or higher than beyond 12 months employment.
In the past we have said anecdotally that for most roles, finding the right work experience & qualifications is not the issue but assessing behaviour, motivation, cultural fit and implementing a successful induction are where the risks lie.
We understand many organisations in New Zealand have been focused over the last few years on improving the quality of their recruitment and induction practices.
In 2013 we suggested that the result was a reflection of all the good work being done in recruitment, induction and retention. 2014 showed a 12.8% increase in 1st year turnover and 2015 showed only a 1% increase to 19.6%. In 2016 we are reporting a 21% increase in first year turnover. The trend appears to be following the increase in overall turnover percentages but the % increase is surprising.
The point to take away from this data is that your retention strategies should start on day one. Employee engagement, flexible schedules, providing a positive work environment, and setting fair compensation should be implemented and evaluated on a year long basis.
Suggestions for
Using the Data
Turnover in the first twelve months of employment
Perc
ent
Year
Lawson Williams Consulting Group Ltd - 2015Lawson Williams Consulting Group Ltd - 2017Page 10
23.426.1
22 21.1 20.717.2
19.4 19.6
24.8
0
5
10
15
20
25
30
35
2007
2008
2009
2010
/2011
2012
2013
2014
2015
2016

3.The 90 day trial period.Background
The ability for companies to include a 90 day trial period as a clause in their Individual Employment Agreement (IEA) was introduced March 1st 2009 for companies with 19 or fewer staff. This was extended to all New Zealand businesses 1st April 2011.
Current status of trial periods - 2016
67.5% of respondents stated they had a trial period clause in their Individual employment agreements (IEA) for new staff, a slight increase from 65.5% in 2015; 32.5% said they did not.
Of the organisations that had a trial clause for new staff, 70.9% stated they did not dismiss anybody during this initial period. In 2015 this figure was 53.8%, showing a lower reliance on the trial clause to address an unsatisfactory hiring decision. This is a 24% decrease.
Of the organisations that have a trial period in their IEA, a fifth (20.7%) reportedly terminated between one and three new employees; with less than a tenth (8.4%) dismissing four or more staff.
Lawson Williams Consulting Group Ltd - 2017Page 11
70.9%
8.4%2.5%
7.4%
10.8%
None 1 2 3 4+

78.8% of organisations with a trial period clause reported that none of their new staff resigned during this period. this is an increase of 9.5% from 69.3% in 2015. Those that did have resignations, 94% had three or less with only 5.9% reporting 4+ resignations.
Lawson Williams Consulting Group Ltd - 2017Page 12
78.8%
5.9%2.0%2.0%
11.3%
None 1 2 3 4+
Employment of staff due to the existence of the 90 day trial
A core tenet of the 90 day trial period introduction was that its existence would encourage organisations to employ more staff, to take a risk knowing they could exit the employment relationship with relative ease within 90 days.
Of the 67.5% of organisations that have a 90 day trial period in their employment agreements only 9.1% believe its existence has encouraged them to employ more staff with 90.9% believing the 90 day trial period has not influenced them to employ more staff.

Uptake of 90 day trial period by company size.
When considering the size of a company and the uptake of the 90 day trial option there are some differences.
The turnover survey collects data across 5 company size categories (refer to the graph below)
For companies below 700 staff it is significantly more likely that they have chosen to incorporate the 90 day trial in their employment agreements.
For organisations with over 700 staff only 39% have incorporated the trial period into their employment agreements.
Lawson Williams Consulting Group Ltd - 2017Page 13
0.0
20.0
40.0
60.0
80.0
100.0
<30 31-64 65-99 100-700 >700
Company size by number of staff
Perc
en
tag
e
% of companies with 90 day trial "% of companies without 90 day trial"
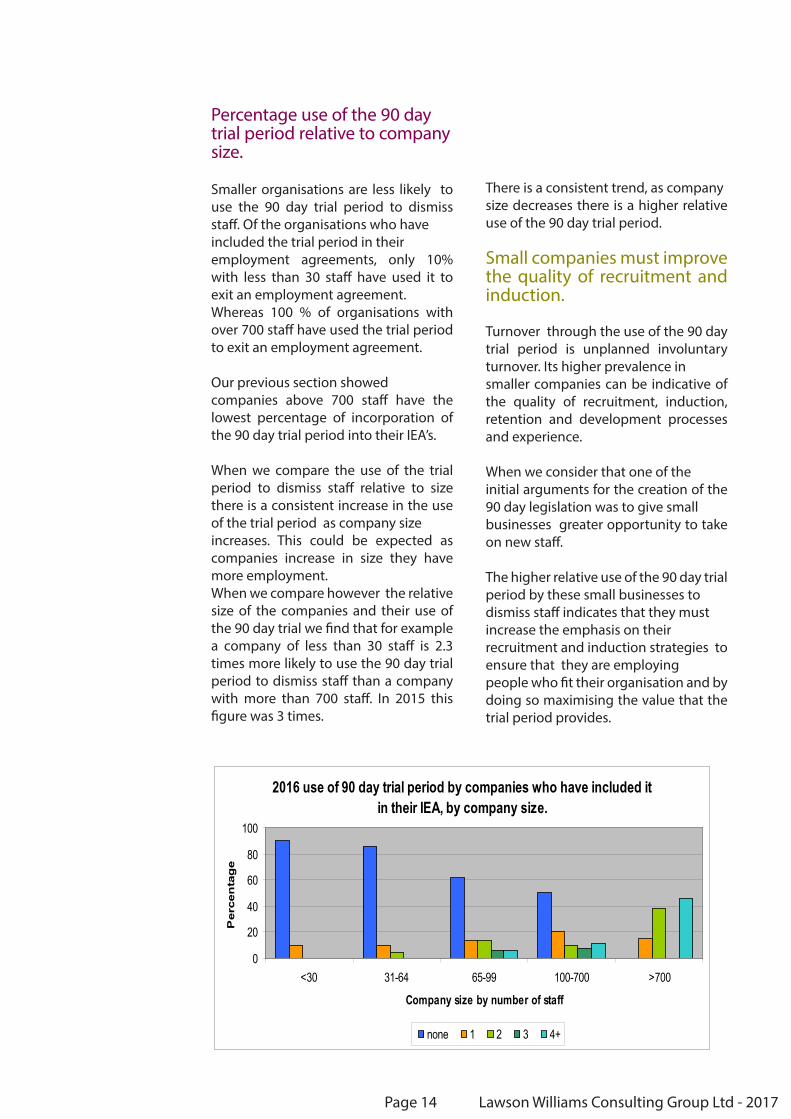
Percentage use of the 90 day trial period relative to company size.
Smaller organisations are less likely to use the 90 day trial period to dismiss staff. Of the organisations who have included the trial period in their employment agreements, only 10% with less than 30 staff have used it to exit an employment agreement. Whereas 100 % of organisations with over 700 staff have used the trial period to exit an employment agreement.
Our previous section showed companies above 700 staff have the lowest percentage of incorporation of the 90 day trial period into their IEA’s.
When we compare the use of the trial period to dismiss staff relative to size there is a consistent increase in the use of the trial period as company size increases. This could be expected as companies increase in size they have more employment. When we compare however the relative size of the companies and their use of the 90 day trial we find that for example a company of less than 30 staff is 2.3 times more likely to use the 90 day trial period to dismiss staff than a company with more than 700 staff. In 2015 this figure was 3 times.
There is a consistent trend, as companysize decreases there is a higher relative use of the 90 day trial period.
Small companies must improve the quality of recruitment and induction.
Turnover through the use of the 90 day trial period is unplanned involuntary turnover. Its higher prevalence in smaller companies can be indicative of the quality of recruitment, induction, retention and development processes and experience.
When we consider that one of the initial arguments for the creation of the 90 day legislation was to give small businesses greater opportunity to take on new staff.
The higher relative use of the 90 day trial period by these small businesses to dismiss staff indicates that they must increase the emphasis on their recruitment and induction strategies to ensure that they are employing people who fit their organisation and by doing so maximising the value that the trial period provides.
Lawson Williams Consulting Group Ltd - 2017Page 14
2016 use of 90 day trial period by companies who have included it in their IEA, by company size.
0
20
40
60
80
100
<30 31-64 65-99 100-700 >700
Company size by number of staff
Per
cen
tag
e
none 1 2 3 4+

3.Turnover by industry.The following graphs display turnover data for different industries . The graph labels throughout the report are abbreviated (e.g., ‘Agriculture’ is short for the agriculture, horticulture, forestry & fishing industry sector). A definition for each industry categorisation is available on page 32.
As expected, turnover in 2016 varied considerably between different industries, from 11.7% (Accounting Firms) to 41.7% (Fastfood, hospi-tality). Previously in 2015, turnover across different industries ranged from 11.0% (Energy/Electricity) to Fastfood, hospitality (52.7%).
Looking at the average turnover rates between 2007 and 2015, industries that typically represent low turnover rates are Energy/Electricity (13.0%), Engineering/Tech products (14.8%), Accounting firms (14.9%).
2016 was a year of significant fluctuation in turnover rates. Crown organisations showed the highest increase since 2015 of 36%, with Healthcare, FMCG, Agriculture and Insurance all showing an increase above 20%. Conversely Other manufacturing showed the largest de-crease of 28% with Pharma/medical products and Banking and Fi-nance close behind. The usually high sectors of Fastfood/Hospitality and Retail also showed a decrease in turnover of over 20% in 2016.
Lawson Williams Consulting Group Ltd - 2017Page 15

Law
son
Will
iam
s Co
nsul
ting
Gro
up L
td -
2017
Page
16

Page
17
Law
son
Will
iam
s Co
nsul
ting
Gro
up L
td -
2017

4. Turnover by staff size.The following graph compares turnover (private vs public) according to five different groups of organisational size: (1) less than 30 staff, (2) 31-64 staff, (3) 65-99 staff, (4) 101-700 staff, and (5) more than 700 staff.
Amongst public sector employers, turnover decreased slightly for or-ganisations with greater than 700 staff (from 14.1% in 2015 to 12.4% in 2016). A small increase occurred for organisations with 100-700 staff (16.9% in 2015 to 17.4%); as well as organisations with 31-64 staff (19.8% in 2015 to 22.1%). Employers with 65-99 staff saw a large increase in turnover from last year (from 14.5% to 21.3%).
Large organisations (700+ staff) within the Public sector have con-sistently shown lower rates of turnover.
Turnover in smaller private sector companies has shown a large in-crease from 2015 to 2016. Turnover within organisations with less than 30 staff have doubled from 11.4% in 2014 to 20.4%: for organ-isations with 31-60 staff, 14.4% to 20.5%. In contrast private organ-isations with 65-99 staff showed the largest change with a decrease form 26% in 1025 to 15.7% in 2016.
Larger private organisations above 100 staff remained stable at just under 20% turnover.
Lawson Williams Consulting Group Ltd - 2017Page 18

Law
son
Will
iam
s Co
nsul
ting
Gro
up L
td -
2017
Page
19

5. Turnover by organisational revenue/baseline budget.This graph compares turnover either by organisational revenue (for the Private Sector, blue bars) or baseline budget (for the Public Sector, grey bars).
The data collected from the Public Sector were grouped as follows: (1) baseline budget of less than $50 million, (2) baseline budget of $50 million to $250 million, and (3) baseline budget of over $250 million.
The data gathered from the Private Sector were grouped according to: (1) revenue of less than $50 million, (2) revenue of $50 million to $250 million, and (3) revenue of over $250 million.
Turnover amongst large public sector organisations jumped from 11.4% in 2014 to 17.1% in 2015 and in 2016 have fallen to 12.7. This equates to an decrease of 25% turnover, returning to the trend of consistently low (less than 13%) staff departures since 2010.
Public sector employers with a baseline budget of $50 million to $250 million increased from 11.9% in 2014 to 12.7% in 2015 and again increased significantly to 15.6% in 2016.
Public sector employers with a baseline budget of less than $50 million show steady turnover. In 2015 the figure was 19.1%, an in-crease from 17.8% in 2014. In 2016 the figure is 19.7%.
Turnover amongst larger private sector organisations shifted slight-ly between 2014 and 2015, from 16.1% to 17.1% and again to 18.7% in 2016 for organisations with a revenue of over $250 million; and 17.4% to 17.5% and holding at this level in 2016 for organisations with a revenue between $50 million and $250 million.
Private sector employers with less than $50 million in 2015 had the highest rates of staff departures (20.9%), an increase from 15.8% in 2014. In 2016 this level had held at 21.0%.
Lawson Williams Consulting Group Ltd - 2017Page 20

Law
son
Will
iam
s Co
nsul
ting
Gro
up L
td -
2017
Page
21

6. Turnover by region.Participants were asked to provide the geographic location of where 50% or more of their staff are located. The following graph charts turnover data in Auckland, Waikato, Wellington, Rest of North Island, Christchurch, Rest of South Island, as well as an ‘Across New Zealand’ category for organisations with staff fully spread throughout the country.
Organisations with the majority of staff based in Waikato consistent-ly show the lowest rates of turnover, ranging from 13.2-14.7% in the past five years.
Auckland and Wellington show the highest rates of turnover, indi-cating an active job market in these regions.
At 17.4%, turnover in Christchurch in 2016 is the highest it has been in the previous five years.
Lawson Williams Consulting Group Ltd - 2017Page 22

Law
son
Will
iam
s Co
nsul
ting
Gro
up L
td -
2017
Page
23

7. Voluntary vs Involuntary turnover.The next graph represents the rates of voluntary and involuntary turnover across the sampled organisations.
Involuntary turnover tends to be higher amongst private sector or-ganisations, peaking at 5.8% in 2009 then remaining around 3.6-4.3%.
Involuntary turnover within public sector organisations is at its lowest since 2009.
Involuntary turnover represented 18.7% of all departures, and the rest (81.3%) recorded as voluntary departures.
Lawson Williams Consulting Group Ltd - 2017Page 24

Law
son
Will
iam
s Co
nsul
ting
Gro
up L
td -
2017
Page
25
8. Voluntary and Involuntary turnover by industry.The following graphs depict voluntary and involuntary turnover according to industry.
As expected, rates of involuntary turnover varied greatly across industries – from 0.8% (Accounting firms) to 8.9% (Transport/Logis-tics).
Voluntary turnover also varied between industries: from 9.0% (En-ergy/electricity) to 38.3% (Fastfood, hospitality).
Fastfood, hospitality organisations have traditionally had higher rates of involuntary departures, 5.8% and 8% in 2014 and 2013 ret-rospectively. At 2.1%, Fastfood, hospitality organisations had one of the lowest involuntary turnover in 2015 and this has now increased to 3.5% in 2016.
Accounting firms typically have less than 1% involuntary turnover.
Involuntary turnover doubled in Engineering Consulting organisa-tions, up from 4.5% in 2014 to 9.2% in 2015. This has decreased to 3.8% in 2016. Property/construction organisations also saw a major increase in involuntary turnover during this time, from 4.2% to 7.0%. This has also seen a decrease to 5.6% in 2016. Transport/Lo-gistics, Agriculture and retail have all significantly increased invol-untary turnover levels in 2016.
High levels of involuntary turnover suggest relatively high levels of restructures, redundancies and dismissals in a given industry sector.
Lawson Williams Consulting Group Ltd - 2017Page 26

Law
son
Will
iam
s Co
nsul
ting
Gro
up L
td -
2017
Page
27

Page
28
Law
son
Will
iam
s Co
nsul
ting
Gro
up L
td -
2017

Page
29
Law
son
Will
iam
s Co
nsul
ting
Gro
up L
td -
2017

Page
30
Law
son
Will
iam
s Co
nsul
ting
Gro
up L
td -
2017

9. Statistical notes.The main population for the survey is midsize and large organisations in New Zealand, iden-tified according to public-record, as understood to have 65 staff or more. 1450 employers across all industries and regions of New Zealand were contacted in this category of which 203 participated, meaning a response rate of 14%, a high participation rate for a survey of a population of this size and sufficient to make the data very robust overall.
In addition, for the last three survey years, organisations with less than 65 staff have partici-pated. Seventy-nine organisations of this size provided data. This represents a very small per-centage of the total number of small employers in NZ. Employers with greater than 65 staff should not be concerned about data from small employers biasing results in the industry category information as staff size is only weakly and inconsistently correlated with rates of turnover – how many staff you have is a largely irrelevant predictor of turnover.
1450 slightly understates the actual number of employers with more than 65 staff due to the removal of individual franchisees under common parent company brands (e.g. individual quick-service restaurants and supermarkets will often have more than 65 staff). These fran-chise and similar organisations are contacted via their Head Office. In the Public sector, public schools have been removed and are not contacted and thus not part of the population.
Contact points within organisations is by way of job title, this being Human Resources and senior management personnel.
The survey method is via email and web-based questionnaire.
A specific limitation to the accuracy of the data in this particular survey is the availability of HRIS technology within all participant organisations that enables all participants to answer all questions without using estimates (i.e. where data was not known, the survey question-naire asked participants to provide an estimate).
Generally accepted limits that apply to data accuracy in numerical surveys apply also to this survey.
Please note, where participating organisations did not provide data for a given question, it is not included in this report.
Page 31 Lawson Williams Consulting Group Ltd - 2017

10. Industry categories.
Industry Categories
Building Products FMCG (food, beverage, OTC pharmacy, stationery) Engineering Consulting Accounting firm Law firmOther professional services General & Other Services (airlines, postal, call centres, cleaning contracting) Retail Fastfood, Hospitality & Tourism (quick service restaurants, hotels, travel & tourism venues) Banking & FinanceInsuranceInformation & Communications Technology (Computer systems, software providers, telcos, ISPs, office equipment, etc) Engineering & other technology products Other manufacturing and industrial productsMedia & Advertising (TV, radio, publishing, advertising agencies etc) Property & Construction Services Transport & Logistics Services (services in air freight, sea freight, third party logistics, supply chain, couriers, rail, ports etc.) Energy & Electricity (water, electricity, gas, coal etc.) Agriculture, horticulture, forestry, fishing Research & Development (Public & Private) Healthcare provider (Public & Private) Education and training provider (Public & Private) Non-profit Charity or Community OrganisationPrint, packaging and paper Crown Entity Local Government (Local Authority or Regional Authority) Government Department/Ministry
Lawson Williams Consulting Group Ltd - 2017Page 32