Lawrence D. Howell, CEO - EFG International3a2b0a9b-8bbe-4cc6-a... · UBS Swiss Alpine Summit 2007...
25
UBS Swiss Alpine Summit 2007 Gstaad, 18 January 2007 Lawrence D. Howell, CEO
Transcript of Lawrence D. Howell, CEO - EFG International3a2b0a9b-8bbe-4cc6-a... · UBS Swiss Alpine Summit 2007...

UBS Swiss Alpine Summit 2007
Gstaad, 18 January 2007Lawrence D. Howell, CEO

Disclaimer
This presentation has been prepared by EFG International solely for use by you for general information only and does not contain and is not to be taken as containing any securities advice, recommendation, offer or invitation to subscribe for or purchase any securities regarding EFG International.
This presentation contains specific forward-looking statements, e.g. statements which include terms like "believe", "assume", "expect" or similar expressions. Such forward-looking statements are subject to known and unknown risks, uncertainties and other factors which may result in a substantial divergence between the actual results, the financial situation, and/or the development or performance of the company and those explicitly or implicitly presumed in these statements. These factors include (1) general market, macro-economic, governmental and regulatory trends, (2) movements in securities markets, exchange rates and interest rates, (3) competitive pressures, (4) our ability to continue to recruit CROs, (5) our ability to implement our acquisition strategy, (6) our ability to manage our economic growth and (7) other risks and uncertainties inherent in our business. EFG International is not under any obligation to (and expressly disclaims any such obligation to) update or alter its forward-looking statements whether as a result of new information, future events or otherwise.

Table of Contents
I. Industry Overview 1
II. Overview EFG International 2
III. Financials 10
IV. Strategic Goals 16

I. Industry Overview

Large Volumes of AUM
The “Pure” Private Banking Industry
8.7 m people globally hold more than US$ 1 min financial assets
Wealthiest individuals have been steadily increasing their personal net wealth and
- have become more sophisticated
- demand more products
- have a a greater global perspective
High Net Worth Individuals (HNWI) financial wealth expected to grow at an annual rate of 6.0% and to reach US$ 44.6 trillion by 2010
Private Banking Industry is very fragmented
Source: Merrill Lynch / Cap Gemini (World Wealth Report 2006)
Predictable Revenue Stream Higher Growth Industry
1
Attractive industry offering large volumes, predictable revenues and low risk
19.121.6
25.5 26.2 26.728.5
30.7
27.0
16.6
1996 1997 1998 1999 2000 2001 2002 2003 2004 2005
33.3
(data in US$ trillion)
Growth of HNWI Financial Wealth
CAGR 1996 – 2005: + 8%

II. Overview EFG International

EFG International – Overview
2
A global private banking organisation
- 13 booking centres
- present in 43 locations in 29 countries
Part of EFG Group, Switzerland’s 3rd largest banking group
- Total Shareholders’ Equity of EFG Group: > CHF 7 billion
- As of Dec 31, 2005, EFG Group – Switzerland’s 3rd banking group by Tier-1 Capital (1)
One of Switzerland’s best capitalised banking organisations
- Total Shareholders’ Equity of EFG International: CHF 2.1 billion
- As of Dec 31, 2005 EFG International – Switzerland’s 9th banking group by Tier-1 Capital (1)
Ratings of EFG International
- Moody’s: 'A2 with stable outlook'
- Fitch Ratings: 'A with positive outlook'
Publicly listed on SWX Swiss Exchange
- Market Cap of ~ CHF 6.5 billion
- Shareholders: EFG Group (~ 48.7%); Management and Employees (~23.2%); Public (~28.1%)
(1) Source: The Banker: Top 1000 World Banks, July 2006

Key Performance Indicators
3
(1) Including Harris Allday and Banque Monégasque de Gestion(2) Including shares of EFG International which do not form part of the 28% free float of EFG International at the SWX Swiss Exchange (CHF 4.2 bn)
100%104%105%105%
82%
CROs AUM TotalRevenues
GrossProfit
Net Profit
Historic Performance
CROs AUM
Acceleration in Performance
2000 – 2004 CAGR
78% (1) (2)
2H 2004 – 3Q 2006 CAGR
62% (1)
CROs AUM
34%43%

Key Performance Indicators
4
Note: Operating Profit = Operating income less operating expenses (excluding depreciation and amortisation)
100%104%105%105%
82%
CROs AUM TotalRevenues
GrossProfit
Net Profit
Historic Performance
Revenues OperatingProfit
NetProfit
Acceleration in Performance
Revenues OperatingProfit
NetProfit
2000 – 2004 CAGR (Swiss GAAP)
2H 2004 – 1H 2006 CAGR (IFRS)
42%57% 65%
76%
158% 158%

The Business Model
The EFG International Business Model
A Strategy Focused Exclusively on Providing Private Banking and Asset Management Services through an Open Architecture Approach
Diversified Global Management Team with Extensive Private Banking ExpertiseCombined with Management’s Significant Equity Exposure
Global Footprint with Fully Integrated IT and Operating Platforms
Low Risk Profile (Focus on Low Risk Private Banking Business)
CRO-Centred Model
5

The CRO Model: The Key Growth Driver
6
Entrepreneurial CRO Model
CRO is his/her own business manager
Compensation Model
Uncapped contractual bonus
Salary at market rates
plus
Bonus of 15% to 20% of net contribution
CRO experienced business manager
- No client segmentation criteria
- Global mandate
- Can book at any booking centre of choice withP&L recognition
- Open architecture / no push of “in-house” products
- Offers third-party products in best long-terminterest of client
- No allocation of overhead costs, only directlycontrollable costs

(1) Agreements to set up businesses accounted for as acquisitions of intangible assets(2) Announced on January 8, 2007
7
11 Years of Organic and External Growth
Organic Growth
Acquisitions
Royal Bankof Scotland
Zurich
Geneva Private
Banking Business of Parent Bank
Founding ofEFG Bank
Miami Broker-Dealer Buenos Aires
Singapore
Hong Kong
Guernsey
IBP Fondkom--mission(Sweden)
Taipei
Structured Notes
Business(Scandinavia,
Europe)(1)
BanqueEdouardConstant
BanSabadell Finance(Geneva)
1996 1997 1998 1999 2000 2001 2002 2003 20041995
Luxembourg
EFGInvestment
Bank, Sweden
BancoAtlantico
Gibraltar Ltd
DLFA Dresdner
LatAm Financial Advisors
BancoSabadell
Bahamas(1)
EFG Private Bank Limited
(London)
EFG Eurofinancièred’Investisse-ments SAM
(Monaco)
2005
New York
Chiltern Wealth Management
(London)
Bank von Ernst (Liechtenstein)
2006
Capital Management
Advisors
LuxembourgBank
BahamasBank
Dubai
BanqueMonégasquede Gestion(Monaco)
Harris Allday(UK)
QuesadaKapital-
förvaltning(Sweden)
PRS Group (2)
Cayman
Athens
Bangkok
Manila

Booking CentreRep/Admin Office
Today’s Global Presence
Caracas
Lima
Buenos Aires
Hong Kong Taipei
Singapore
Helsinki
Luxembourg
MonacoGibraltar
Bahamas Dubai
LondonStockholm
Miami
New York
Göteborg
MalmöKristianstadBirmingham
JerseyGuernseySwitzerland: Zurich, Geneva, Valais
Luleå
8
Liechtenstein
Bermuda
Jakarta
Mexico City
BogotaQuito
Bahrain
Athens
ManilaCayman
Bangkok
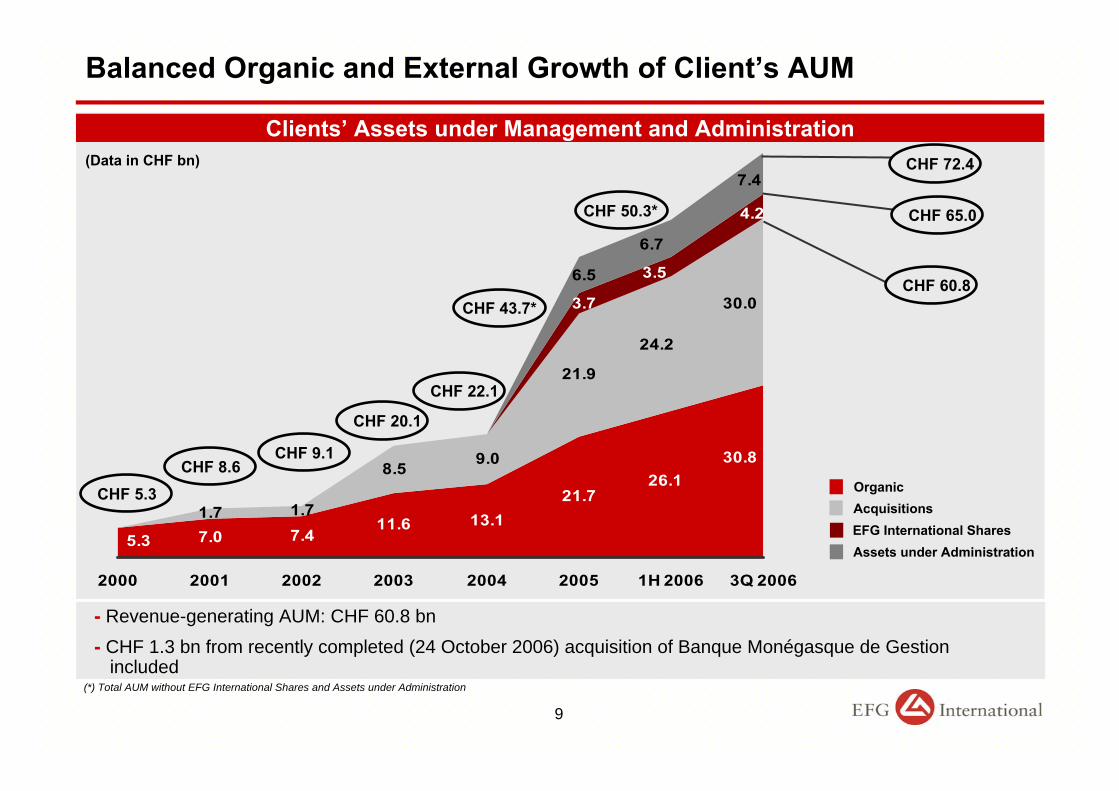
Balanced Organic and External Growth of Client’s AUM
Clients’ Assets under Management and Administration
9
7.411.6 13.1
21.71.7 1.7
8.5
21.9
30.826.1
7.05.3
30.0
24.2
9.0
4.2
3.7
3.5
7.4
6.7
6.5
2000 2001 2002 2003 2004 2005 1H 2006 3Q 2006
(Data in CHF bn)
CHF 5.3CHF 8.6
CHF 9.1
CHF 20.1
CHF 22.1
OrganicAcquisitions
Assets under AdministrationEFG International Shares
- Revenue-generating AUM: CHF 60.8 bn - CHF 1.3 bn from recently completed (24 October 2006) acquisition of Banque Monégasque de Gestion
included
CHF 50.3*
CHF 72.4
CHF 43.7*
CHF 65.0
CHF 60.8
(*) Total AUM without EFG International Shares and Assets under Administration

III. Financials

Continued strong growth in number of CROs
368
323268
5080 90
130160
180
0
50
100
150
200
250
300
350
400
2000 2001 2002 2003 2004 1H 2005 2005 1H 2006 3Q 2006
Number of CROs
10
Including the recently completed acquisition of Banque Monégasque de Gestion (6) the total number of Client Relationship Officers stood at 374 as of September 30, 2006
CRO growth in 1Q06: 29 CROs
CRO growth in 2Q06: 26 CROs
CRO growth in 3Q06: 18 CROs
as per period endincluding announced acquisitions
226
356374

63.7
53.8
47.3
25.622.120.1
9.18.65.3
2000 2001 2002 2003 2004 1H 2005 2005 1H 2006 3Q 2006
Continued strong growth in AUMClients’ Assets under Management and Administration
11
Total AUM growth in 1H06: CHF 4.5 bn; CHF 5.3 bn net new assets & client loans and negative impact relating to market action of CHF 0.9 bn (not including CHF 7.9 bn from acquisitions of CMA, BMG and Harris Allday)
Total AUM growth in 3Q06: CHF 5.4 bn (CHF 2.5 bn net new assets & client loans and CHF 2.9 bn relating to market action; not including CHF 4.5 bn from acquisition of Harris Allday)
(Data in CHF bn)
AUM as per period endAUM including announced acquisitionsAUM & AUA including announced acquisitions
Note: AUM data includes shares of EFG International which do not form part of the current 28% free float of EFG Internationalat the SWX Swiss Exchange (CHF 4.2 bn)
36.3
42.7
53.8
59.6
66.365.072.4

AUM Breakdown at 1st Half 2006 – reflects conservative AUMs
53'833
June 30, 2006
12
Deposits
Bonds
Loans
Structured Notes
Equities
Third Party Funds
EFG Funds (1)
EFG InternationalShares
16%
12%
11%
6%
15%
10%2%7%
Fiduciary Deposits
Other
8%
13%
(1) Includes CMA funds
(Data in CHF million)

1H06 vs. 1H05 and 2H05 – Consistent Growth
13
1H 2006
CHF 30.4 m
CHF 70.8 m
CHF 81.1 m
CHF 197.8 m CHF 140.6 m
57.0 %
CHF 100.7 m
CHF 114.6 m
CHF 288.6 mOperating Income
Profit before Tax
Net Profit attr. to ordinary
shareholders
Net Profit
2H 2005 1H 2005
CHF 57.0 m
CHF 50.1 m
Cost-Income Ratio 57.0 % 57.1 %
CHF 53.2 mCHF 88.4 m

Consolidated Income Statement (unaudited)
14
Note: All figures on a consolidated basis.(1) Operating expenses including amortisation and depreciation of CHF 9.5 m in 1H06, CHF 3.3 m in 1H05 and CHF 4.2 m in 2H05
(2) Operating expenses before amortisation and depreciation amounted to CHF 164.5 m in 1H06, CHF 80.3 m in 1H05 and CHF 112.5 m in 2H05
101%
103%
101%
-
108%
105%
95%
33%
97%
109%
101%
Δ vs. 1H05
35%(13,948)(10,305)(6,873)Income tax expense
----Impairment losses on loans and advances
49%(173,924)(116,684)(83,653)Operating expenses (1) (2)
40%175,261125,22383,748Net banking fee & commission income
49%77,86052,18038,740Net interest income
-267%779(467)587Other operating income / (expense)
66%34,66820,84417,554Net trading income
74%35,44720,37718,141Net other income
46%288,568197,780140,629Operating income
41%114,64481,09656,976Profit before tax
50,103
1H05
42%100,69670,791Net profit for the period
Δ vs. 2H051H062H05(In CHF million)

Balance Sheet development in line with AUM growth
15
n.m.1,5171,709BIS Tier 1 Capital
+20%4,0913,410Risk Weighted Assets
n.m.1,6661,888BIS Total Capital
+3%2,1432,082Total shareholders‘ equity
n.m.37.1%50.1%BIS Tier 1 Ratio
+18%9,0857,711Due to customers
n.m.40.7%55.4%BIS Total capital ratio
+72%603351Intangible assets
+16%5,2824,544Loans and advances to customersΔ (in %)As of June 30, 2006as of Dec. 31, 2005(In CHF million)

IV. Strategic Goals

Strategic Goals in the Light of 3Q 2006 Data
16
(1) Including announced acquisitions as of the time of the IPO (2) Including acquisitions announced since IPO, not including Quesada Kapitalförvaltning (CHF 0.8 bn) and PRS Group (CHF 3.0 bn)(3) Excluding shares of EFG International which do not form part of the current 28% free float of EFG International at the SWX Swiss Exchange (CHF 4.2 bn)
Previously Announced
Medium-Term Targets
CROs
CHF 10.1 bn AUM (2)
since IPO
Above CHF 40.0 m
CHF 59.5 bn (3) /CHF 60.8 bn (3)
368 / 374
Additional AUM growth through acquisitions
CHF 60-65 bn (3)
CHF 30 mper year
~ 500
AUM Growth per CRO
Assets under Management
Acquisitions
3Q 2006Status
2007Strategic Goals
2008Strategic Goals
500 - 525
CHF 30 mper year
CHF 30 mper year
650 - 675
CHF 87-93 bn (3) CHF 115-125 bn (3)
CHF 10-15 bnper year (incl.in AUM below)
CHF 10-15 bnper year (incl.
in AUM below)
1H 2005Status
180 / 226 (1)
CHF 25.6 bn /CHF 36.3 bn (1)
Above CHF 35.0 m
CHF 10.7 bn AUM (1)

Review of Recent Acquisitions
17
Quesada Kapitalförvaltning – Stockholm-based wealth management company (announced December 22, 2006)
- Adding 2 CROs and CHF 800 million AUM to our presence in the Nordic markets
- Quesada will be run as separate division of EFG Investment Bank AB under brand name Quesada
- Acquisition price will be paid through combination of upfront payment and earn-out payments based on future performance of business
- Closing of transaction is expected during the first quarter of 2007
PRS Group – Cayman / Miami-based UHNWI specialized investment services company (announced January 8, 2007)
- Adding 5 CROs and CHF 3.0 billion AUM
- Offers a broad range of family office type of private banking services and discretionary asset management
- PRS established long-standing client relationships over the last 25 years
- Transaction structured in line with EFGI’s criteria, including an earn-out element
- Realizing revenue synergies by capturing banking services currently outsourced to third-party banks
- Closing of transaction is expected by early February 2007

Outlook on M&A Activity
18
Evaluation of acquisition opportunities in onshore Europe, the Americas, the Middle East, Indian
Subcontinent and Switzerland
Since the IPO CHF 10.1 billion of AUM acquired + CHF 3.8 billion from announced acquisitions
totalling CHF 13.9 billion. Total AUM acquired in 2006 totalling CHF 11.7 billion (incl. PRS Group)
Expected acquisition volume of CHF 10-15 billion for both 2007 and 2008
Excess Tier 1 Capital capacity for incremental goodwill stands at approx. CHF 0.8 – 0.9 billion
Acquisitions meeting EFG International’s pricing criteria exist, but overall prices are higher
As of January 15, 2007:
- > CHF 10 billion in Assets under Management with advanced negotiations ongoing
- > CHF 30 billion Assets under Management opportunities being evaluated with ongoing
discussions and meetings