Lawrence Berkeley National Laboratory · PDF fileTable 3.9: Overall Convection Microwave Use...
43
Lawrence Berkeley National Laboratory Lawrence Berkeley National Laboratory Title Surveys of Microwave Ovens in U.S. Homes Permalink https://escholarship.org/uc/item/3s29h7wd Author Williams, Alison Publication Date 2014-04-21 eScholarship.org Powered by the California Digital Library University of California
Transcript of Lawrence Berkeley National Laboratory · PDF fileTable 3.9: Overall Convection Microwave Use...
Lawrence Berkeley National LaboratoryLawrence Berkeley National Laboratory
TitleSurveys of Microwave Ovens in U.S. Homes
Permalinkhttps://escholarship.org/uc/item/3s29h7wd
AuthorWilliams, Alison
Publication Date2014-04-21
eScholarship.org Powered by the California Digital LibraryUniversity of California
LBNL-5947E Surveys of Microwave Ovens in U.S. Homes Alison Williams, Hung-Chia (Dominique) Yang, Bereket Beraki, Louis-Benoit Desroches, Scott J. Young, Chun Chun Ni, Henry Willem, Jeffery B. Greenblatt, and Camilla Dunham Whitehead Lawrence Berkeley National Laboratory, Berkeley, California, USA Sally M. Donovan Consultant, Melbourne, Australia Environmental Energy Technologies Division December 2012 This work was supported by the Assistant Secretary for Energy Efficiency and Renewable Energy, Office of Building Technology, State, and Community Programs, of the U.S. Department of Energy under Contract No. DE-AC02-05CH11231.
DISCLAIMER
This document was prepared as an account of work sponsored by the United States Government. While this document is believed to contain correct information, neither the United States Government nor any agency thereof, nor the Regents of the University of California, nor any of their employees, makes any warranty, express or implied, or assumes any legal responsibility for the accuracy, completeness, or usefulness of any information, apparatus, product, or process disclosed, or represents that its use would not infringe privately owned rights. Reference herein to any specific commercial product, process, or service by its trade name, trademark, manufacturer, or otherwise, does not necessarily constitute or imply its endorsement, recommendation, or favoring by the United States Government or any agency thereof, or the Regents of the University of California. The views and opinions of authors expressed herein do not necessarily state or reflect those of the United States Government or any agency thereof or the Regents of the University of California.
i
Surveys of Microwave Ovens in U.S. Homes
Alison Williams, Hung-Chia (Dominique) Yang, Berket Beraki, Louis-Benoit Desroches, Scott J. Young, Chun Chun Ni, Henry Willem, Jeffery B. Greenblatt, and Camilla Dunham Whitehead
Lawrence Berkeley National Laboratory, Berkeley, California, USA
Sally M. Donovan Consultant, Melbourne, Australia
December 4, 2012
Table of Contents 1 Introduction ........................................................................................................................................... 1
1.1 Existing data ................................................................................................................................ 2 1.1.1 Residential Energy Consumption Survey (RECS) ................................................. 2 1.1.2 American Housing Survey (AHS) .................................................................................. 2 1.1.3 AHAM ......................................................................................................................................... 3 1.1.4 Appliance Magazine ............................................................................................................ 3
2 Methods.................................................................................................................................................... 3 2.1 Survey Design .............................................................................................................................. 3 2.2 Online Survey Description .................................................................................................... 4 2.3 Logistics ......................................................................................................................................... 4 2.4 Data clean-up ............................................................................................................................... 5 2.5 Survey weightings ..................................................................................................................... 6
2.5.1 CMWO weighting .................................................................................................................. 7 2.5.2 Demographic Weighting Results................................................................................ 13 2.5.3 Analytical Methodology.................................................................................................. 14
3 Final results ......................................................................................................................................... 17 3.1 Microwave ownership ......................................................................................................... 17
3.1.1 General Microwave ........................................................................................................... 17 3.1.2 Convection Microwave ................................................................................................... 17
3.2 Microwave Type...................................................................................................................... 18 3.3 Microwave Use ........................................................................................................................ 20
3.3.1 MWO Survey ........................................................................................................................ 20 3.3.2 CMWO Survey ..................................................................................................................... 23
4 Conclusions ......................................................................................................................................... 27 5 Acknowledgments............................................................................................................................ 28 6 References ........................................................................................................................................... 28 Appendix A: Microwave Oven -- General Population Survey ................................................ 30 Appendix B: Convection Microwave Oven -- General Population Survey ....................... 35
ii
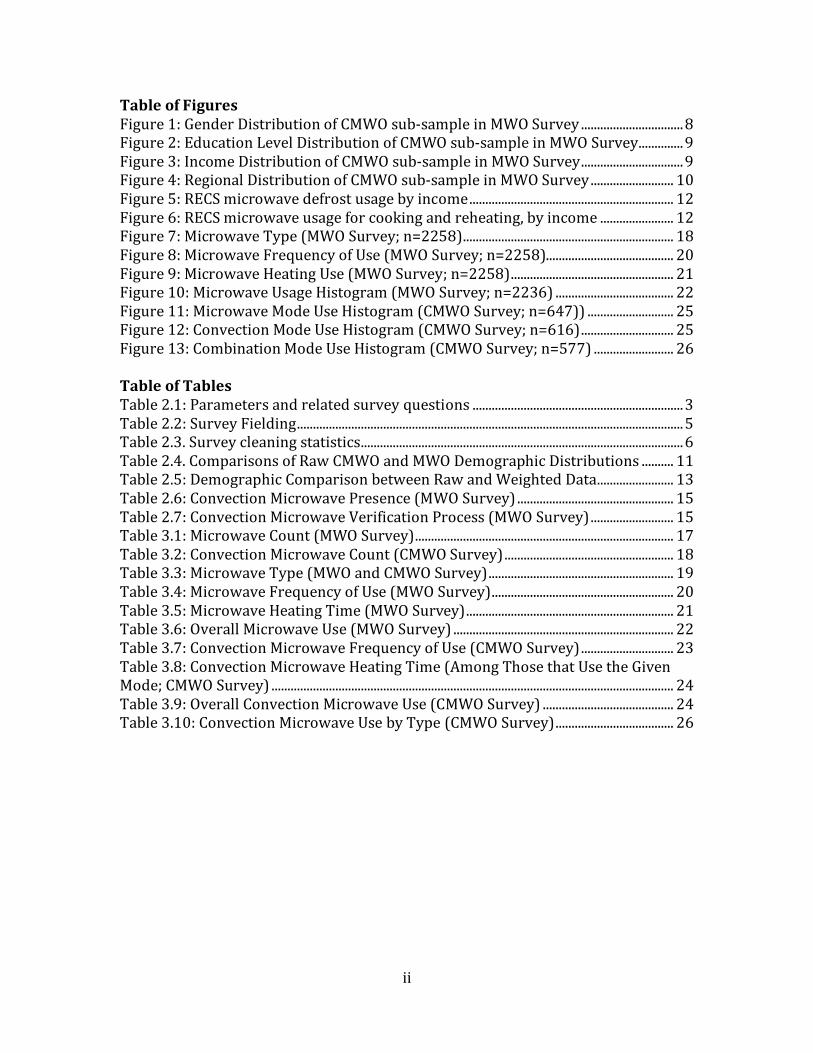
Table of Figures Figure 1: Gender Distribution of CMWO sub-sample in MWO Survey ................................ 8Figure 2: Education Level Distribution of CMWO sub-sample in MWO Survey .............. 9Figure 3: Income Distribution of CMWO sub-sample in MWO Survey ................................ 9Figure 4: Regional Distribution of CMWO sub-sample in MWO Survey .......................... 10Figure 5: RECS microwave defrost usage by income ................................................................ 12Figure 6: RECS microwave usage for cooking and reheating, by income ....................... 12Figure 7: Microwave Type (MWO Survey; n=2258) .................................................................. 18Figure 8: Microwave Frequency of Use (MWO Survey; n=2258) ........................................ 20Figure 9: Microwave Heating Use (MWO Survey; n=2258) ................................................... 21Figure 10: Microwave Usage Histogram (MWO Survey; n=2236) ..................................... 22Figure 11: Microwave Mode Use Histogram (CMWO Survey; n=647)) ........................... 25Figure 12: Convection Mode Use Histogram (CMWO Survey; n=616) ............................. 25Figure 13: Combination Mode Use Histogram (CMWO Survey; n=577) ......................... 26 Table of Tables Table 2.1: Parameters and related survey questions .................................................................. 3Table 2.2: Survey Fielding ......................................................................................................................... 5Table 2.3. Survey cleaning statistics ..................................................................................................... 6Table 2.4. Comparisons of Raw CMWO and MWO Demographic Distributions .......... 11Table 2.5: Demographic Comparison between Raw and Weighted Data ........................ 13Table 2.6: Convection Microwave Presence (MWO Survey) ................................................. 15Table 2.7: Convection Microwave Verification Process (MWO Survey) .......................... 15Table 3.1: Microwave Count (MWO Survey) ................................................................................. 17Table 3.2: Convection Microwave Count (CMWO Survey) ..................................................... 18Table 3.3: Microwave Type (MWO and CMWO Survey) .......................................................... 19Table 3.4: Microwave Frequency of Use (MWO Survey) ......................................................... 20Table 3.5: Microwave Heating Time (MWO Survey) ................................................................. 21Table 3.6: Overall Microwave Use (MWO Survey) ..................................................................... 22Table 3.7: Convection Microwave Frequency of Use (CMWO Survey) ............................. 23Table 3.8: Convection Microwave Heating Time (Among Those that Use the Given Mode; CMWO Survey) .............................................................................................................................. 24Table 3.9: Overall Convection Microwave Use (CMWO Survey) ......................................... 24Table 3.10: Convection Microwave Use by Type (CMWO Survey) ..................................... 26
1
1 Introduction The U.S. Department of Energy (DOE) is conducting test procedure and energy conservation standard rulemakings for microwave ovens.1
A “microwave oven” is a cooking appliance that is capable of cooking or heating food using microwave energy. These units can be self-contained counter-top units; units placed over a conventional range with a fume hood attached (also known as over-the-range microwave ovens); or built-in units that are installed surrounded by kitchen cabinetry. They can also include “convection microwave ovens,” which are cooking appliances capable of cooking or heating food using both microwave energy and convection heat transfer in a single compartment. Such appliances have the capability of heating food using microwave energy or convection heat transfer or both microwave and convection in a single cooking cycle. These units generally offer a “convection,” “bake,” or “combo” cooking mode on the user interface.
DOE divides products under analysis into classes by the type of energy used, capacity, or other performance-related features that affect consumer utility and efficiency. Installation types are grouped as (1) countertop and (2) built-in and over-the-range. For the DOE test procedure and standard rulemaking, two types of microwave ovens are of interest, specifically:
• Microwave-only ovens and countertop convection microwave ovens • Built-in and over-the-range convection microwave ovens
DOE must decide whether the test procedure for convection microwave ovens should test only microwave mode or also convection mode. Therefore, DOE is interested in how often convection-capable microwaves are used in convection mode. While some consumer data exist on microwave ovens generally, there are no data that allow a differentiation between types of microwave ovens, their form of installation, or consumer use of the convection mode. In order to supplement the microwave data currently available, LBNL undertook data collection of its own using online surveys. We sought details of microwave oven ownership and use, such as:
• Distinguishing characteristics of households with convection microwave ovens
• Frequency and duration of cooking events for each microwave oven product class to estimate how much energy is consumed by each class.
1 See the Department of Energy website for Cooking Products including microwave ovens: http://www1.eere.energy.gov/buildings/appliance_standards/residential/cooking_products.html
2
The following sub-sections summarize the existing data as well as the specific data LBNL obtained with surveys.
1.1 Existing data While much of the specific data DOE requires for its rulemaking does not exist, several sources have published information on microwave ownership and use. These sources include the Residential Energy Consumption Survey (RECS), American Housing Survey (AHS), the Association of Home Appliance Manufacturers (AHAM), and Appliance Magazine.
1.1.1 Residential Energy Consumption Survey (RECS) RECS is published every few years by the Energy Information Administration within the DOE. It asks hundreds of questions about home characteristics, appliances, and demographics, and is designed to be a representative sample of U.S. households. The most recent survey (RECS 2009) was deployed in 2010 and contained more than 12,000 samples taken from 16 States (McNary and Berry, 2012). In 1978, when RECS began inquiring about microwaves, just 8% of households used one. Just 30 years later in the 2009 RECS sample, 96% of households used microwave ovens. Initially RECS asked only about the presence of a microwave oven. RECS now collects data on whether a respondent uses a microwave, for how many meals and snacks, and whether the respondent uses it to defrost food. RECS contains no information specific to convection microwave ovens.
1.1.2 American Housing Survey (AHS) AHS is a national housing survey sponsored by the Department of Housing and Urban Development, conducted by the U.S. Census Bureau and published every two years since 1973. The Survey provides a current and continuous series of data of selected housing (including general housing data, housing quality and equipment, etc.) and demographic characteristics. The most recent survey (AHS 2011) was deployed in 2011 and contained more than 70,000 samples taken from four census regions. AHS collects data on whether a selected housing unit has a working cook stove or range/oven. Microwave ovens data are collected only if a housing unit does not have a complete kitchen facility.2
AHS redesigned its questionnaire regarding kitchen equipment (including microwave ovens) several times during the past. The questionnaire has asked directly about microwave presence since 1997. Therefore, data of microwave presence prior to 1997 cannot be compared to more recent data. According to AHS 2011, about 97% of the housing units in the U.S. have a microwave oven.
Similar to RECS, AHS contains no information about product classes of microwave ovens. 2 A completed kitchen facility means it has all of the following; (1) kitchen sink; (2) burners, cook stove, or microwave oven; and (3) refrigerator.
3
1.1.3 AHAM AHAM collected information on microwave shipments from 1972-2009 (AHAM 2009). AHAM has also published numbers on the saturation of microwaves in use in American homes for various years.
1.1.4 Appliance Magazine Appliance Magazine provides shipments of microwave ovens, broken down into convection, countertop, and over-the-range (as well as microwave ovens in ranges until 1996) from 1991 to 2007 (Appliance Magazine 2008). Appliance Magazine has also published information on the life expectancy of microwaves as well as saturation (Appliance Magazine 2009). Over-the-range units are not differentiated be cooking feature type and no information about consumer frequency or time usage amounts of different microwave oven types is provided.
2 Methods To determine saturations and energy use for specific product classes, we found insufficient information in existing sources and, therefore, explored collecting the information from surveys that would be administered over the Internet.
2.1 Survey Design We developed two main surveys for deployment, with one focused on microwave ovens in general (MWO) and the other focused on convection microwave ovens (CMWO). These surveys were open to only the subset of U.S. adult residents who owned MWOs or CMWOs, as appropriate for each survey. The survey included questions related to microwaves that would help obtain information necessary for DOE’s rulemakings. This included the following information shown in Table 2.1. Table 2.1: Parameters and related survey questions Parameter Query
Product Class saturation
Number of total microwaves in the home Number of convection microwaves in the home Type of microwave (built-in, over-the-range, countertop) Brand and model
Frequency of Use Frequency of use (by mode for convection microwave ovens)
Duration of Use Event Heating time (by mode for convection microwave ovens)
Connection to other surveys Demographics of the respondent and home We used the RECS 2009 survey to provide the format and wording of most of the demographic questions used in our surveys. The demographic questions included
4
were: zipcode, gender, ethnicity, race, education, occupants by age, annual household income, type of home, and owned vs. rented. For the CMWO survey, we also included a “cheater” question, which is a non-topical question that attempts to identify frivolous respondents. This question specifically asked respondents to choose the correct number of minutes in an hour. No cheater question was employed for the MWO survey because it was deemed unnecessary. The full survey can be found in Appendix A.
2.2 Online Survey Description Many survey methods exist including online surveys. As internet availability and use has grown, the appeal of online surveys has increased. Online surveys offer the possibility to collect data less expensively, over a wider geographic area, and in a shorter time, than traditional in-person, telephone, or mail-in surveys. Currently, one commonly used platform to administer online surveys is Amazon Mechanical Turk (AMT), which is available through Amazon.com. AMT requires respondents to answer online questions and include information that cannot be determined by computers alone, such as model numbers on household appliances. (Greenblatt, et al. 2012) We deployed the surveys discussed in this report using Amazon Mechanical Turk (AMT). When compared with the general U.S. demographics, AMT workers are younger, more typically female, and have lower incomes and smaller families (Ipeirotis, 2010). In order to help correct for these biases, we over-sampled certain demographic subgroups by launching targeted subgroup surveys in addition to the general population (“gen pop”) surveys of MWO or CMWO owners. These sub-samples were deployed based on experience with other LBNL AMT surveys (Greenblatt et al., 2012) that found the following demographic groups were generally under-represented in raw general population AMT data by about a factor of three compared with RECS:
1) Black/African American households 2) Households with persons age 60 and older 3) Respondents with no college education
After compiling the gen pop and demographic subgroup data for each survey (i.e., MWO and CMWO), we used a weighting method to further correct the AMT samples to be representative of the U.S. population. However, we recognize that biases may still exist. For full details of the weighting method and potential biases, please see the LBNL report. (Greenblatt, JB, et al., 2012)
2.3 Logistics Each targeted product survey consisted of one gen pop survey and three demographic sub-group surveys. We aimed for at least 2,500 final responses for each targeted product survey. We set quantity goals of 2,000 completions each for
5
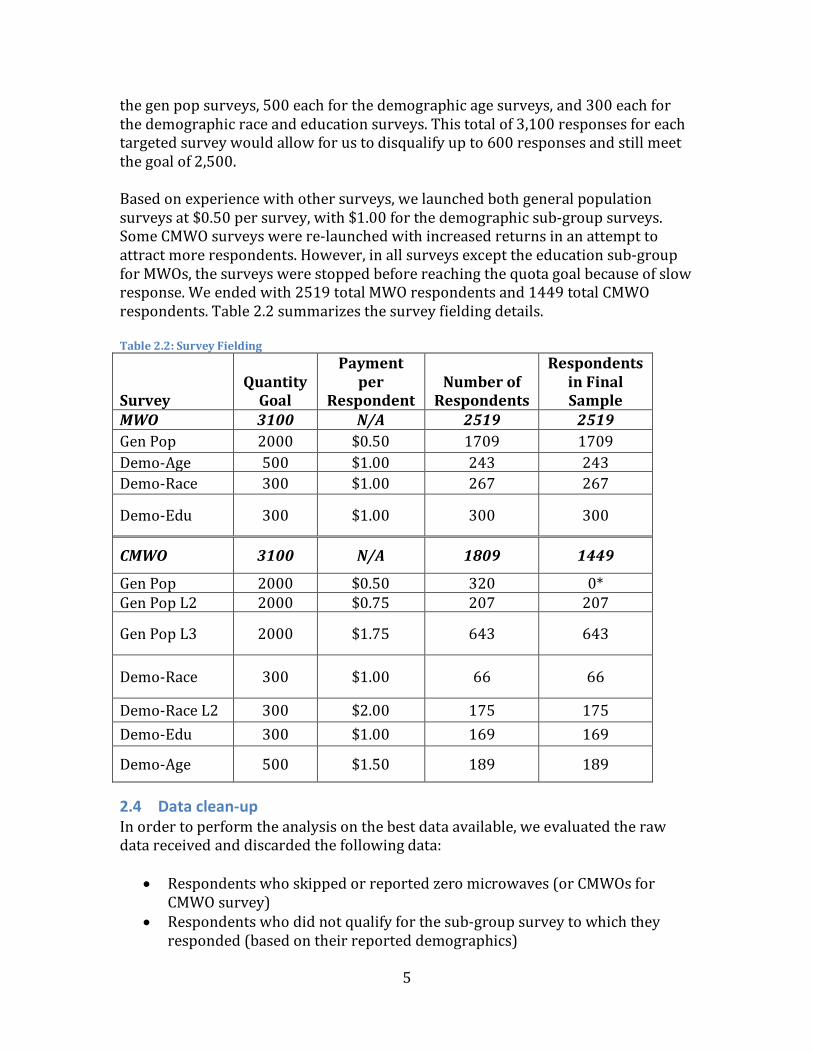
the gen pop surveys, 500 each for the demographic age surveys, and 300 each for the demographic race and education surveys. This total of 3,100 responses for each targeted survey would allow for us to disqualify up to 600 responses and still meet the goal of 2,500. Based on experience with other surveys, we launched both general population surveys at $0.50 per survey, with $1.00 for the demographic sub-group surveys. Some CMWO surveys were re-launched with increased returns in an attempt to attract more respondents. However, in all surveys except the education sub-group for MWOs, the surveys were stopped before reaching the quota goal because of slow response. We ended with 2519 total MWO respondents and 1449 total CMWO respondents. Table 2.2 summarizes the survey fielding details. Table 2.2: Survey Fielding
Survey Quantity
Goal
Payment per
Respondent Number of
Respondents
Respondents in Final Sample
MWO 3100 N/A 2519 2519 Gen Pop 2000 $0.50 1709 1709 Demo-Age 500 $1.00 243 243 Demo-Race 300 $1.00 267 267
Demo-Edu 300 $1.00 300 300
CMWO 3100 N/A 1809 1449
Gen Pop 2000 $0.50 320 0* Gen Pop L2 2000 $0.75 207 207
Gen Pop L3 2000 $1.75 643 643
Demo-Race 300 $1.00 66 66
Demo-Race L2 300 $2.00 175 175 Demo-Edu 300 $1.00 169 169
Demo-Age 500 $1.50 189 189
2.4 Data clean-up In order to perform the analysis on the best data available, we evaluated the raw data received and discarded the following data:
• Respondents who skipped or reported zero microwaves (or CMWOs for CMWO survey)
• Respondents who did not qualify for the sub-group survey to which they responded (based on their reported demographics)
6
• Duplicate respondents (i.e. took the same survey twice – including subgroup surveys)
• Respondents with excessive skipped questions (3 or more that were not part of a skip pattern)
• Questionable respondents o Respondents who could potentially be “cheaters”3
o Respondents in the demographic age survey who list four or more persons above age 60 in the home
• Respondents in the CMWO survey for whom we could not verify through on-line searching that the brand and model they provided is actually a CMWO.
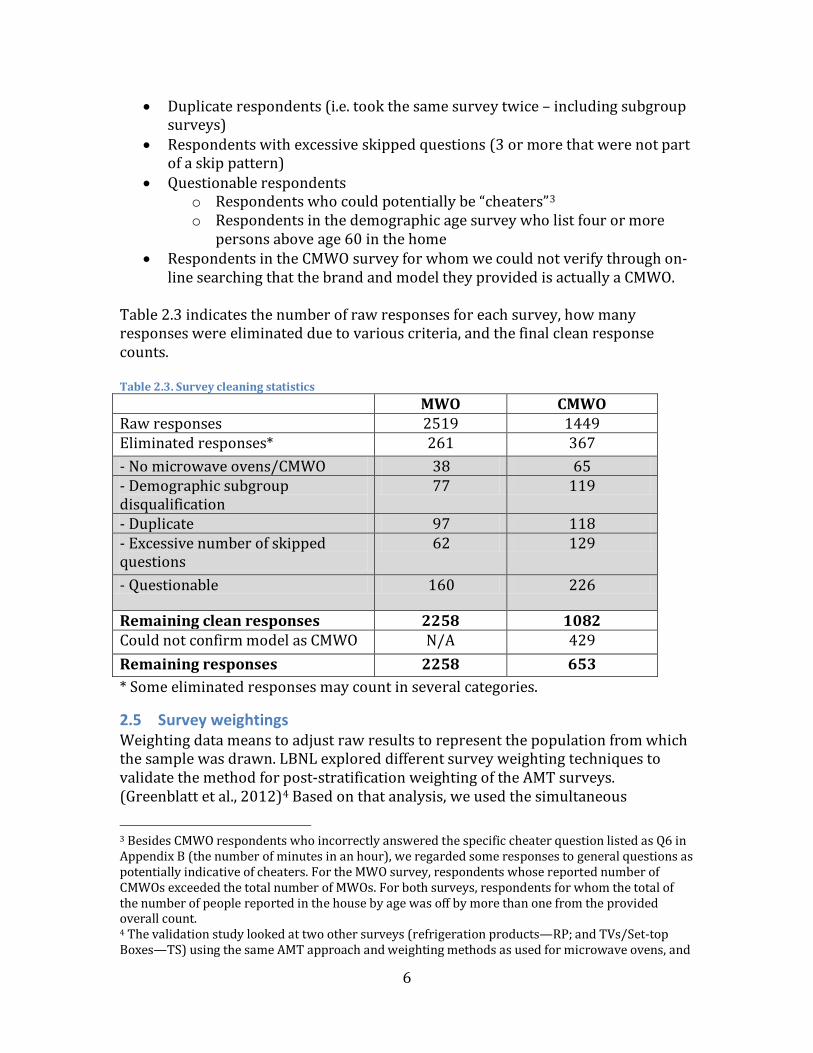
Table 2.3 indicates the number of raw responses for each survey, how many responses were eliminated due to various criteria, and the final clean response counts. Table 2.3. Survey cleaning statistics MWO CMWO Raw responses 2519 1449 Eliminated responses* 261 367 - No microwave ovens/CMWO 38 65 - Demographic subgroup disqualification
77 119
- Duplicate 97 118 - Excessive number of skipped questions
62 129
- Questionable 160 226
Remaining clean responses 2258 1082 Could not confirm model as CMWO N/A 429 Remaining responses 2258 653 * Some eliminated responses may count in several categories.
2.5 Survey weightings Weighting data means to adjust raw results to represent the population from which the sample was drawn. LBNL explored different survey weighting techniques to validate the method for post-stratification weighting of the AMT surveys. (Greenblatt et al., 2012)4
3 Besides CMWO respondents who incorrectly answered the specific cheater question listed as Q6 in Appendix B (the number of minutes in an hour), we regarded some responses to general questions as potentially indicative of cheaters. For the MWO survey, respondents whose reported number of CMWOs exceeded the total number of MWOs. For both surveys, respondents for whom the total of the number of people reported in the house by age was off by more than one from the provided overall count.
Based on that analysis, we used the simultaneous
4 The validation study looked at two other surveys (refrigeration products—RP; and TVs/Set-top Boxes—TS) using the same AMT approach and weighting methods as used for microwave ovens, and
7
weighting method, which simultaneously weights the AMT surveys based on a few important demographics of a reference sample of RECS 2009 microwave owners. This process corrects for the known demographic biases in the AMT population. The AMT and reference surveys are subdivided into many demographic subcategories and the relative weights of the AMT respondents in each subcategory are adjusted to match the equivalent subcategory in the reference sample. Because the reference and AMT surveys have a limited number of total respondents, there is a practical limit to the total number of subcategories. Given the size of RECS 2009, and the demographic biases of AMT, the subcategories that result in the best overall correction include the following demographics: region, total number of people per household, race, total number of 20-29 year olds per household, and education level of head of household. See Greenblatt et al. (2012) for more details on the general weighting methodology.
2.5.1 CMWO weighting We performed the final weighting of the CMWO survey directly to the reference sample of RECS 2009 microwave owners using simultaneous weighting method as noted above. However, this was not the originally intended approach, as ideally the CMWO survey should be weighted against a population of CMWO owners (as opposed to general MWO owners); however, the small size of the CMWO subsample made this unfeasible. (See Section 2.5.1.1) We also compared the raw demographic distributions and usage patterns of MWOs and CMWOs, and our analysis indicates that our final weighting approach may result in an undersampling of high income respondents and a possible bias in microwave usage. (See Section 2.5.1.2)
2.5.1.1 Originally Intended Approach For CMWOs, which have low household penetration, we developed a two-tiered process where first we obtained the incidence of CMWOs among U.S. households using a short survey of all microwave owners, and then we deployed a targeted survey only for owners of CMWOs. The first survey (the “parent”) is designed to obtain the demographic distribution of CMWO owners, which after weighting to match RECS microwave owners, produces a demographic distribution against which, theoretically, the second survey (the “child”) can then be weighted. In other words, the MWO survey was supposed to be weighted to RECS microwave owners, and the CMWO survey was supposed to be weighted to the subsample of CMWO owners in the weighted MWO data. However, although 595 respondents in the MWO survey said they had a convection microwave oven, we were only able to verify 106 respondents. This is a very small sub-sample to use to weight the “child” survey.
performed statistical tests on several survey questions for which answers were known (RECS and IMS Research/NCTA). The authors found that the “simultaneous” weighting approach generally improved the match for these answers better than the other method (“sequential”), and both made improvements over the unweighted data.

8
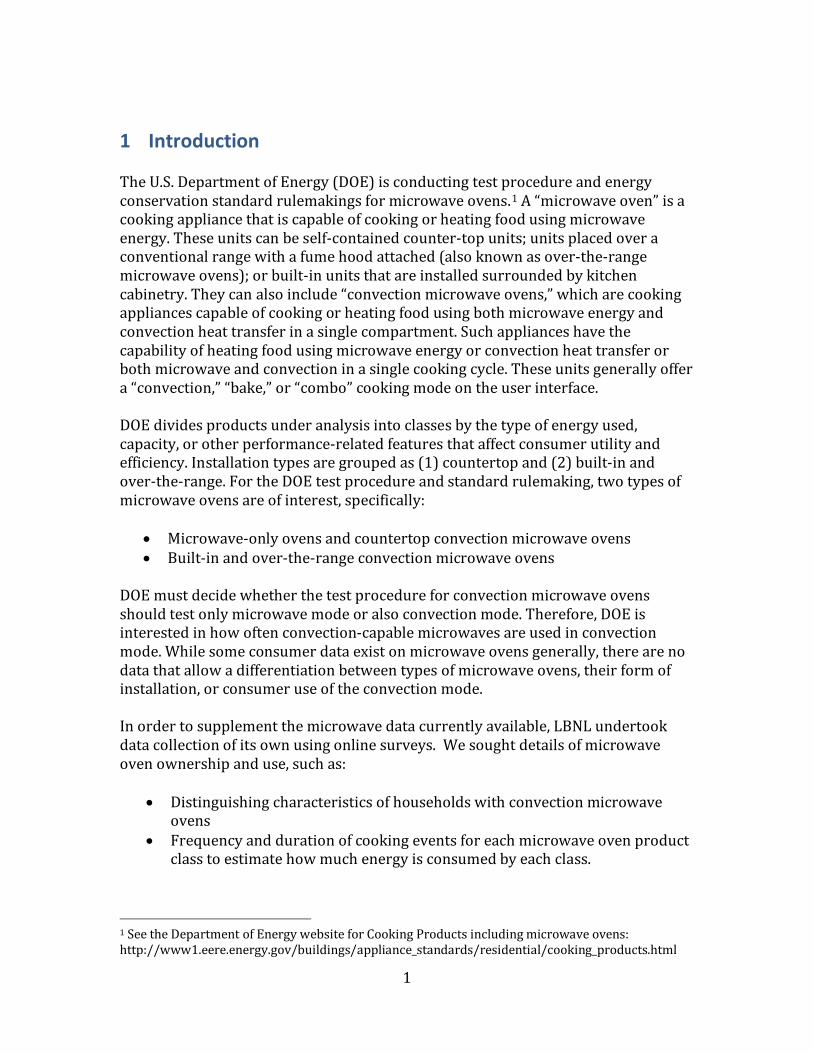
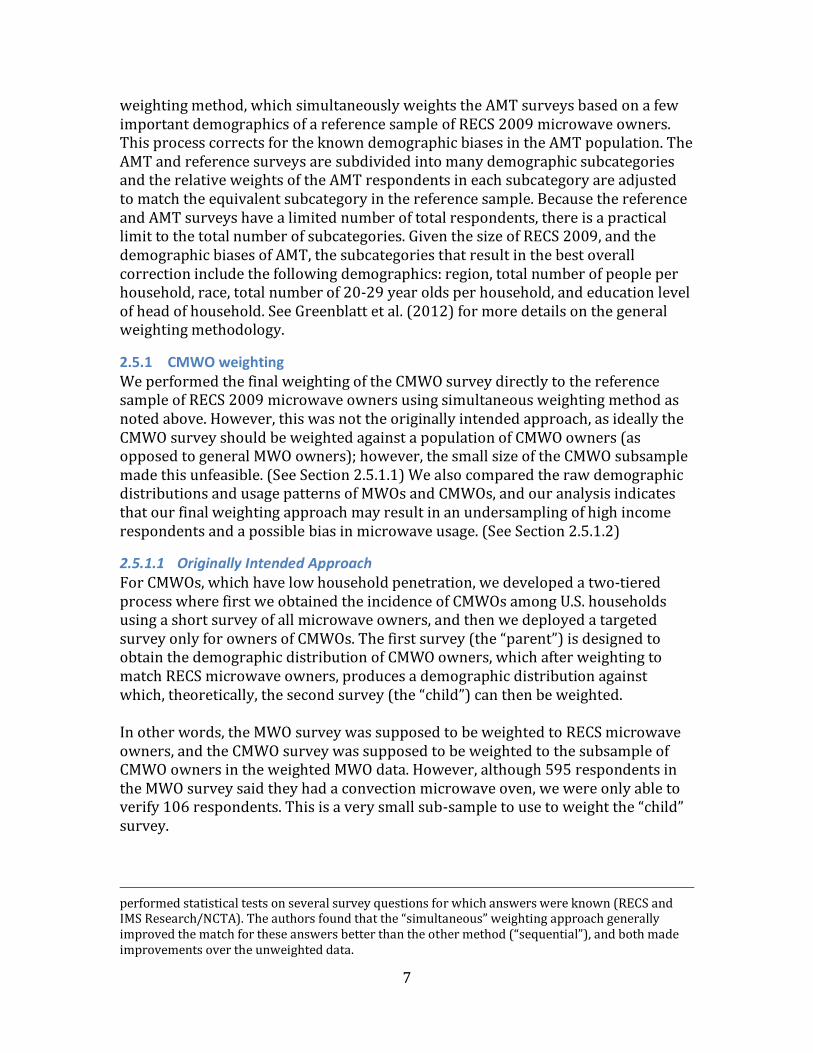
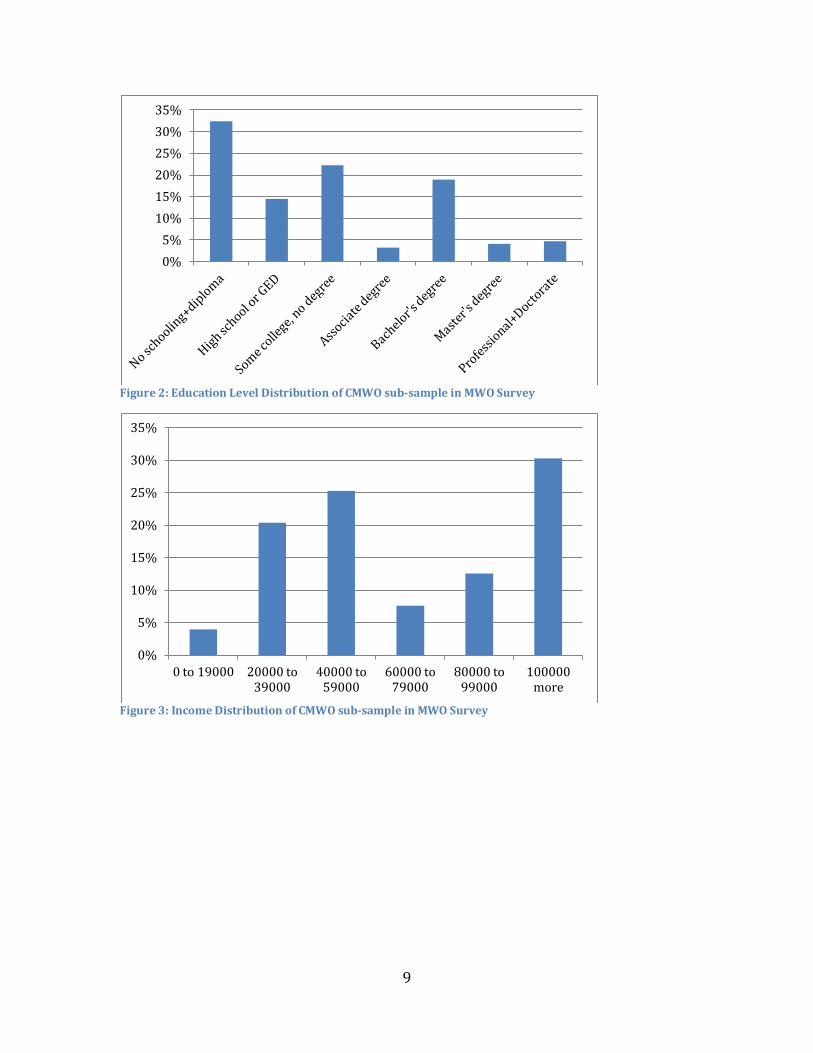
We made two attempts to do this weighting using the sequential (or iterative) weighting method, as described in the LBNL report (Greenblatt, et al. 2012). The simultaneous weighting method does not work well with small reference samples, as the number of subcategories is extremely limited. First, we attempted to weight the child directly to the parent. We also attempted to weight the child directly to RECS and then weight it to the parent, hoping it would take fewer iterations to converge. In both these methods, the attempt to weight to the parent using the sequential method failed before convergence. The likely reason for this is that the sub-sample used is a tiny sub-sample of the entire MWO survey, and the demographics are likely skewed and not representative of CMWO-owning households. For example, we identified a skewed gender distribution, a majority of respondents with less than college education, an income distribution that does not seem to correlate with the education distribution, and a non-representational regional distribution. (See Figures 1 to 4) Given the difficulties in trying to weight the child to the parent using the sequential weighting method as our originally intended approach, we were forced to weight the CMWO survey directly to the microwave owner subsample in RECS 2009 using the simultaneous weighting method, as we did with the MWO survey, because the RECS 2009 microwave owner subsample is sufficiently large.
Figure 1: Gender Distribution of CMWO sub-sample in MWO Survey
0%
10%
20%
30%
40%
50%
60%
70%
80%
Female Male
9
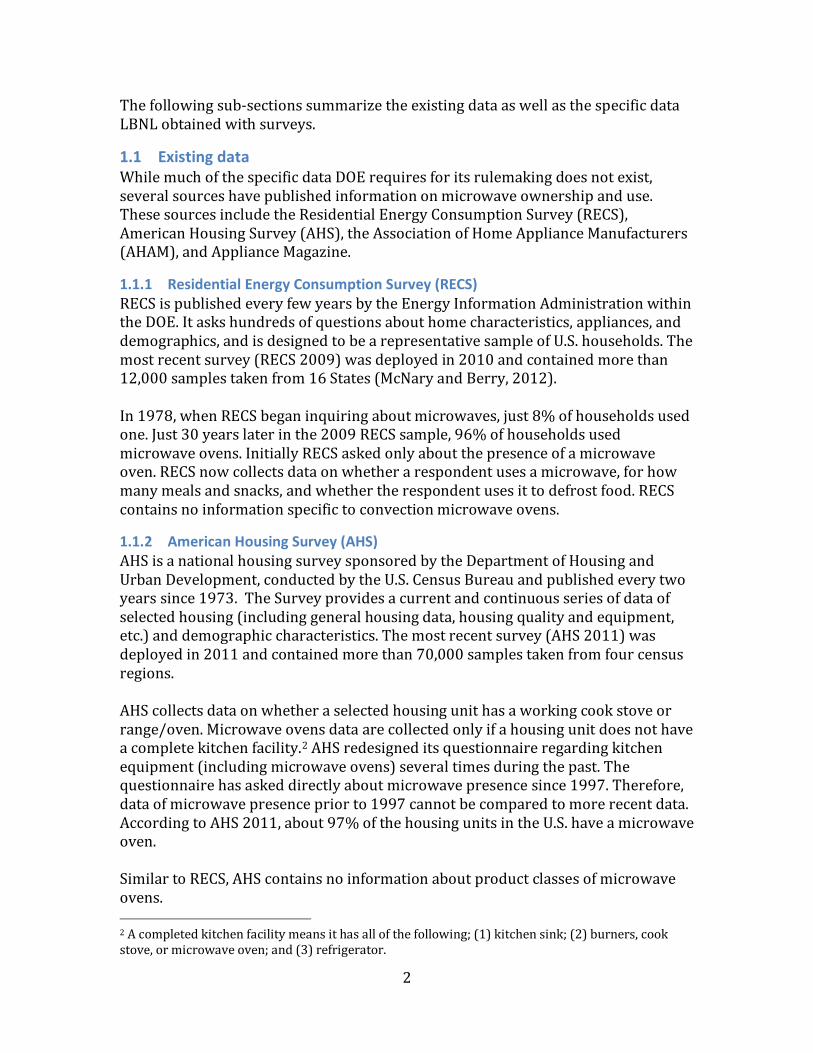
Figure 2: Education Level Distribution of CMWO sub-sample in MWO Survey
Figure 3: Income Distribution of CMWO sub-sample in MWO Survey
0% 5%
10% 15% 20% 25% 30% 35%
0%
5%
10%
15%
20%
25%
30%
35%
0 to 19000 20000 to 39000
40000 to 59000
60000 to 79000
80000 to 99000
100000 more
10
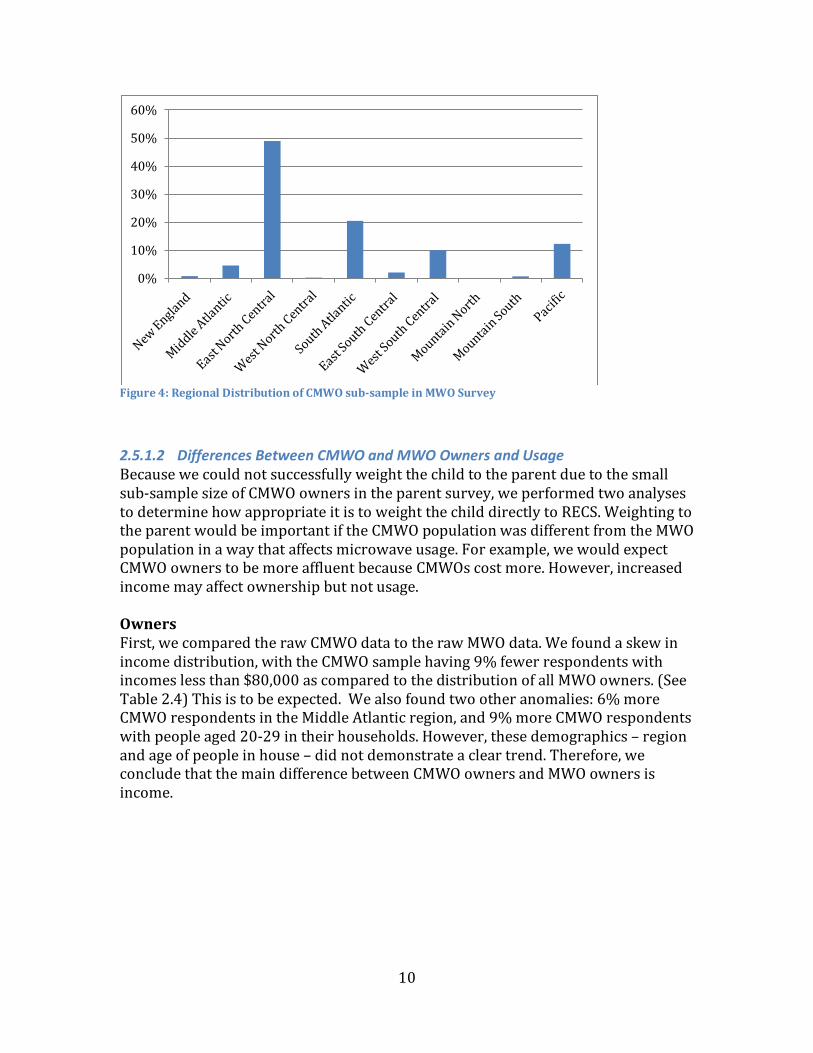
Figure 4: Regional Distribution of CMWO sub-sample in MWO Survey
2.5.1.2 Differences Between CMWO and MWO Owners and Usage Because we could not successfully weight the child to the parent due to the small sub-sample size of CMWO owners in the parent survey, we performed two analyses to determine how appropriate it is to weight the child directly to RECS. Weighting to the parent would be important if the CMWO population was different from the MWO population in a way that affects microwave usage. For example, we would expect CMWO owners to be more affluent because CMWOs cost more. However, increased income may affect ownership but not usage. Owners First, we compared the raw CMWO data to the raw MWO data. We found a skew in income distribution, with the CMWO sample having 9% fewer respondents with incomes less than $80,000 as compared to the distribution of all MWO owners. (See Table 2.4) This is to be expected. We also found two other anomalies: 6% more CMWO respondents in the Middle Atlantic region, and 9% more CMWO respondents with people aged 20-29 in their households. However, these demographics – region and age of people in house – did not demonstrate a clear trend. Therefore, we conclude that the main difference between CMWO owners and MWO owners is income.
0%
10%
20%
30%
40%
50%
60%
11
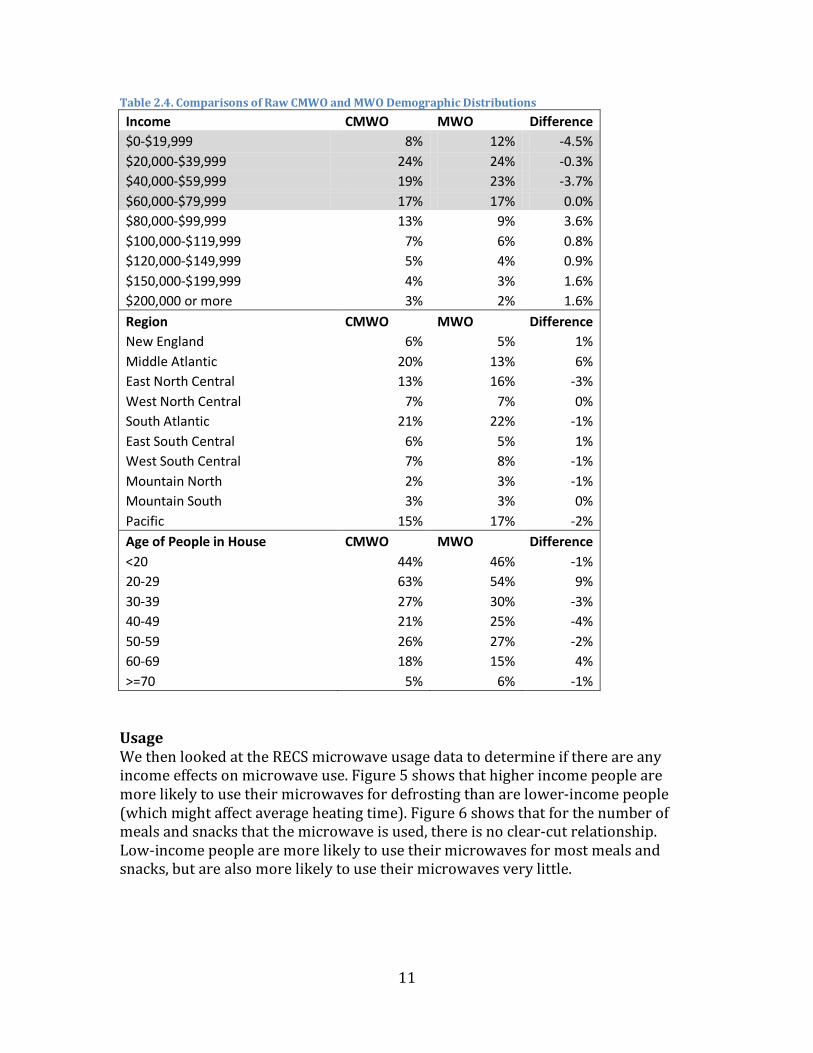
Table 2.4. Comparisons of Raw CMWO and MWO Demographic Distributions Income CMWO MWO Difference $0-$19,999 8% 12% -4.5% $20,000-$39,999 24% 24% -0.3% $40,000-$59,999 19% 23% -3.7% $60,000-$79,999 17% 17% 0.0% $80,000-$99,999 13% 9% 3.6% $100,000-$119,999 7% 6% 0.8% $120,000-$149,999 5% 4% 0.9% $150,000-$199,999 4% 3% 1.6% $200,000 or more 3% 2% 1.6% Region CMWO MWO Difference New England 6% 5% 1% Middle Atlantic 20% 13% 6% East North Central 13% 16% -3% West North Central 7% 7% 0% South Atlantic 21% 22% -1% East South Central 6% 5% 1% West South Central 7% 8% -1% Mountain North 2% 3% -1% Mountain South 3% 3% 0% Pacific 15% 17% -2% Age of People in House CMWO MWO Difference <20 44% 46% -1% 20-29 63% 54% 9% 30-39 27% 30% -3% 40-49 21% 25% -4% 50-59 26% 27% -2% 60-69 18% 15% 4% >=70 5% 6% -1%
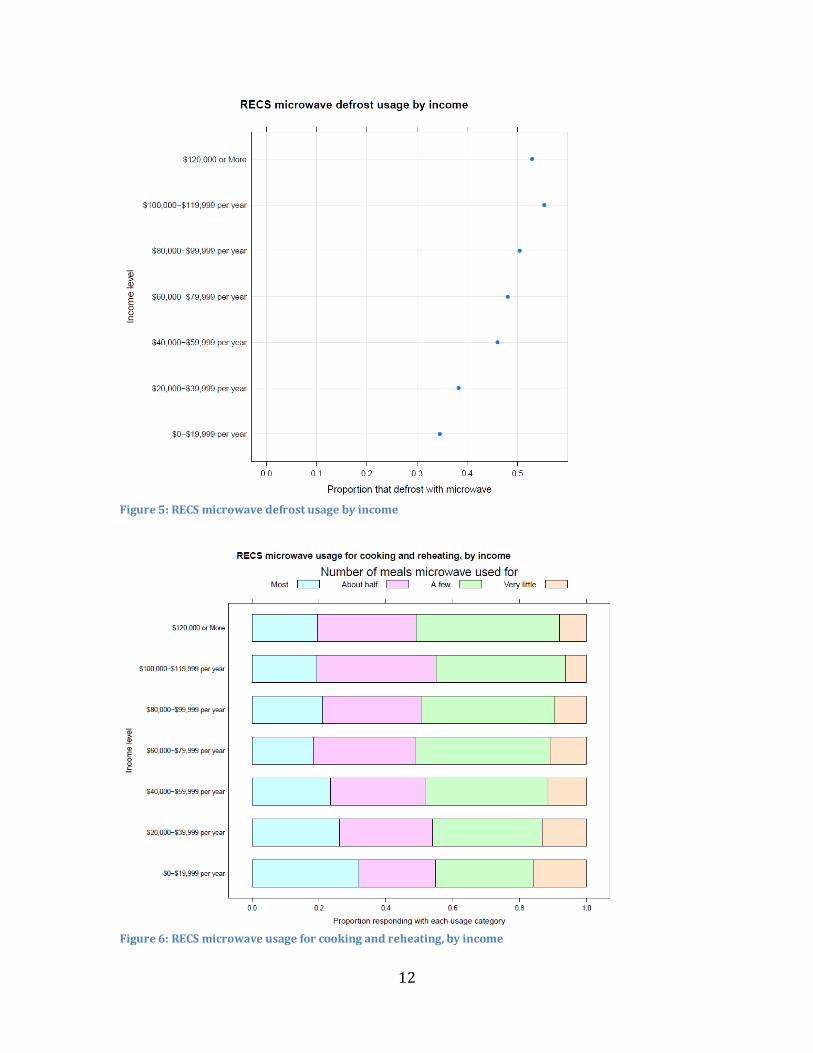
Usage We then looked at the RECS microwave usage data to determine if there are any income effects on microwave use. Figure 5 shows that higher income people are more likely to use their microwaves for defrosting than are lower-income people (which might affect average heating time). Figure 6 shows that for the number of meals and snacks that the microwave is used, there is no clear-cut relationship. Low-income people are more likely to use their microwaves for most meals and snacks, but are also more likely to use their microwaves very little.
12
Figure 5: RECS microwave defrost usage by income
Figure 6: RECS microwave usage for cooking and reheating, by income
13
This usage analysis implies that there may be some income effect on average heating time and potentially frequency of use, although the relationship is not clear. Because we were unable to make adjustments to the CMWO weighting to capture this affect (i.e., we could not weight directly to the parent but instead only to RECS MWO owners), we recognize that our approach may result in an undersampling of high income respondents in the CMWO survey and a possible bias in microwave usage.
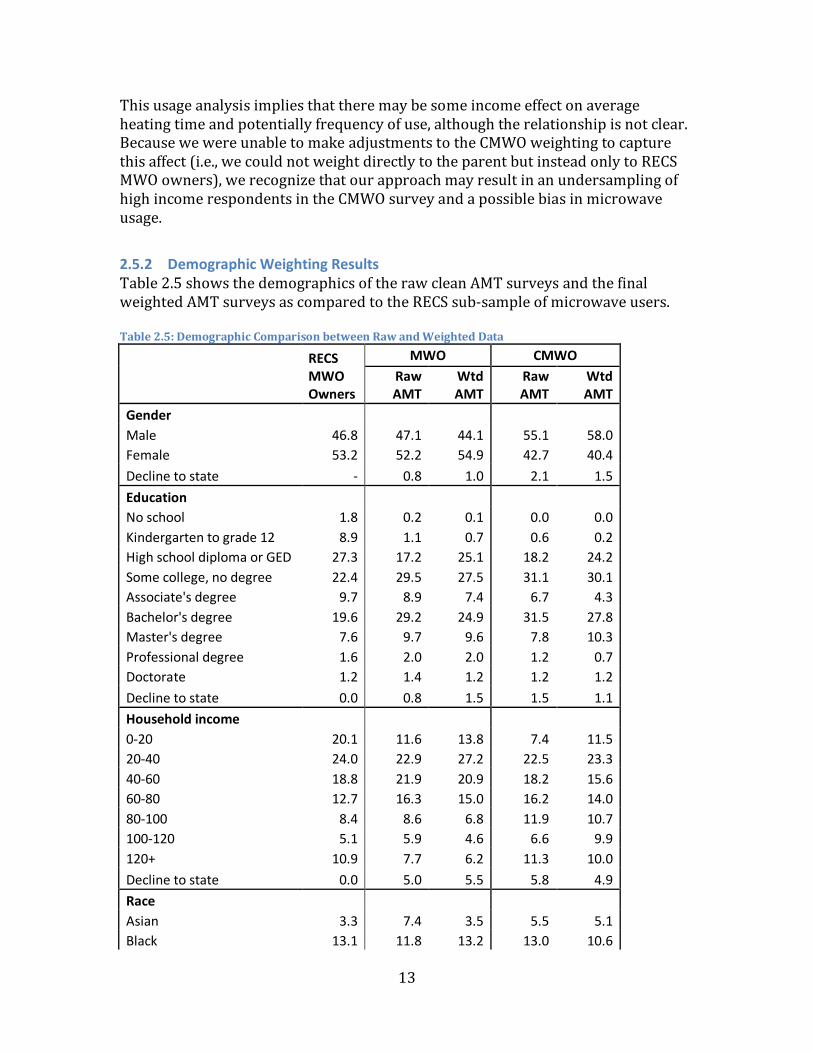
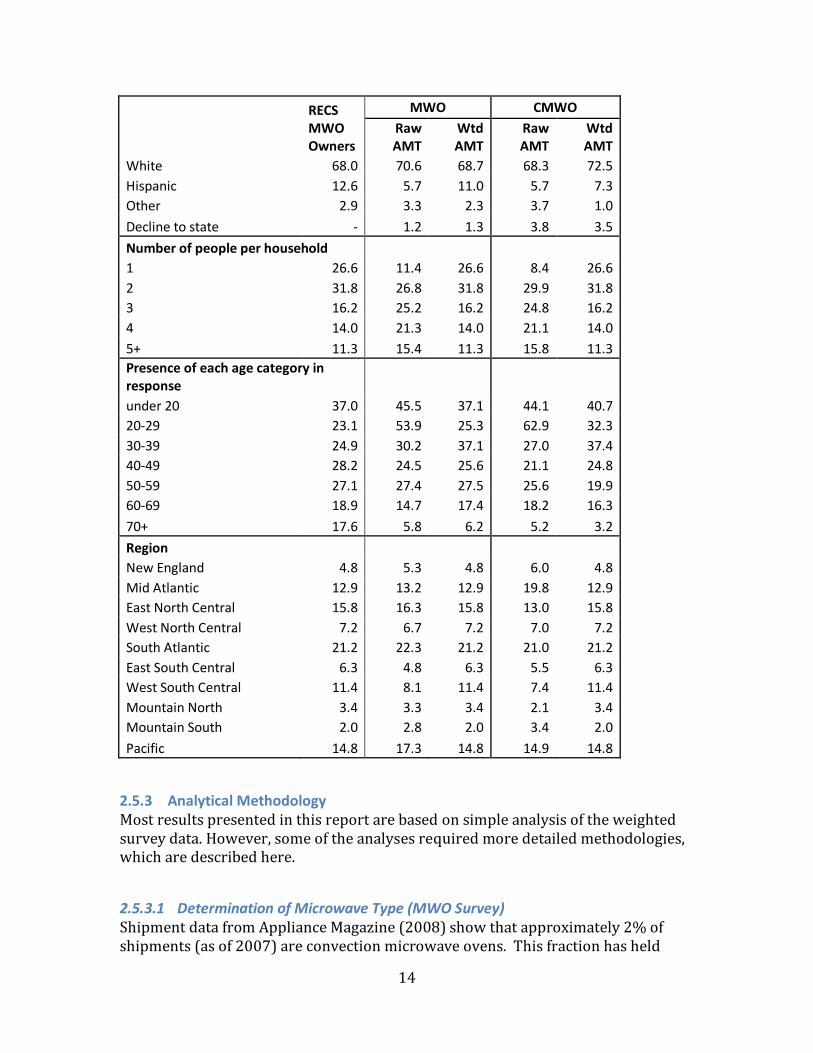
2.5.2 Demographic Weighting Results Table 2.5 shows the demographics of the raw clean AMT surveys and the final weighted AMT surveys as compared to the RECS sub-sample of microwave users. Table 2.5: Demographic Comparison between Raw and Weighted Data
RECS MWO Owners
MWO CMWO Raw AMT
Wtd AMT
Raw AMT
Wtd AMT
Gender Male 46.8 47.1 44.1 55.1 58.0 Female 53.2 52.2 54.9 42.7 40.4 Decline to state - 0.8 1.0 2.1 1.5 Education
No school 1.8 0.2 0.1 0.0 0.0 Kindergarten to grade 12 8.9 1.1 0.7 0.6 0.2 High school diploma or GED 27.3 17.2 25.1 18.2 24.2 Some college, no degree 22.4 29.5 27.5 31.1 30.1 Associate's degree 9.7 8.9 7.4 6.7 4.3 Bachelor's degree 19.6 29.2 24.9 31.5 27.8 Master's degree 7.6 9.7 9.6 7.8 10.3 Professional degree 1.6 2.0 2.0 1.2 0.7 Doctorate 1.2 1.4 1.2 1.2 1.2 Decline to state 0.0 0.8 1.5 1.5 1.1 Household income
0-20 20.1 11.6 13.8 7.4 11.5 20-40 24.0 22.9 27.2 22.5 23.3 40-60 18.8 21.9 20.9 18.2 15.6 60-80 12.7 16.3 15.0 16.2 14.0 80-100 8.4 8.6 6.8 11.9 10.7 100-120 5.1 5.9 4.6 6.6 9.9 120+ 10.9 7.7 6.2 11.3 10.0 Decline to state 0.0 5.0 5.5 5.8 4.9 Race
Asian 3.3 7.4 3.5 5.5 5.1 Black 13.1 11.8 13.2 13.0 10.6
14
RECS MWO Owners
MWO CMWO Raw AMT
Wtd AMT
Raw AMT
Wtd AMT
White 68.0 70.6 68.7 68.3 72.5 Hispanic 12.6 5.7 11.0 5.7 7.3 Other 2.9 3.3 2.3 3.7 1.0 Decline to state - 1.2 1.3 3.8 3.5 Number of people per household
1 26.6 11.4 26.6 8.4 26.6 2 31.8 26.8 31.8 29.9 31.8 3 16.2 25.2 16.2 24.8 16.2 4 14.0 21.3 14.0 21.1 14.0 5+ 11.3 15.4 11.3 15.8 11.3 Presence of each age category in response
under 20 37.0 45.5 37.1 44.1 40.7 20-29 23.1 53.9 25.3 62.9 32.3 30-39 24.9 30.2 37.1 27.0 37.4 40-49 28.2 24.5 25.6 21.1 24.8 50-59 27.1 27.4 27.5 25.6 19.9 60-69 18.9 14.7 17.4 18.2 16.3 70+ 17.6 5.8 6.2 5.2 3.2 Region
New England 4.8 5.3 4.8 6.0 4.8 Mid Atlantic 12.9 13.2 12.9 19.8 12.9 East North Central 15.8 16.3 15.8 13.0 15.8 West North Central 7.2 6.7 7.2 7.0 7.2 South Atlantic 21.2 22.3 21.2 21.0 21.2 East South Central 6.3 4.8 6.3 5.5 6.3 West South Central 11.4 8.1 11.4 7.4 11.4 Mountain North 3.4 3.3 3.4 2.1 3.4 Mountain South 2.0 2.8 2.0 3.4 2.0 Pacific 14.8 17.3 14.8 14.9 14.8
2.5.3 Analytical Methodology Most results presented in this report are based on simple analysis of the weighted survey data. However, some of the analyses required more detailed methodologies, which are described here.
2.5.3.1 Determination of Microwave Type (MWO Survey) Shipment data from Appliance Magazine (2008) show that approximately 2% of shipments (as of 2007) are convection microwave ovens. This fraction has held
15
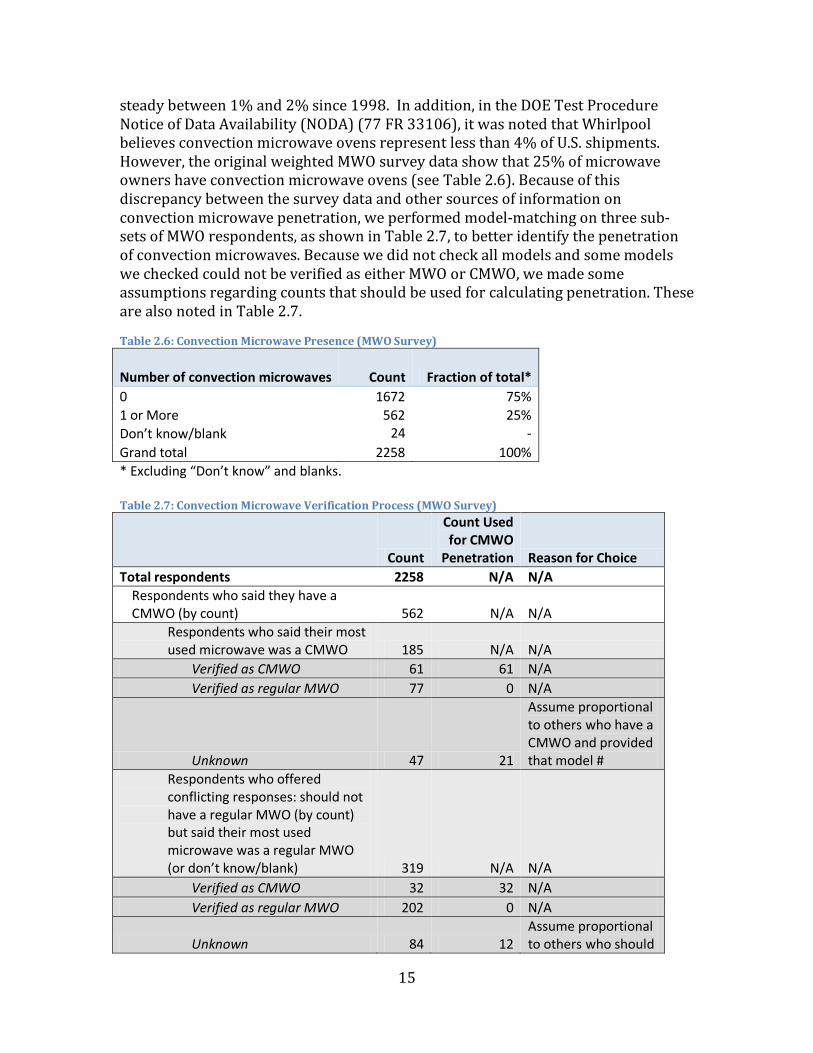
steady between 1% and 2% since 1998. In addition, in the DOE Test Procedure Notice of Data Availability (NODA) (77 FR 33106), it was noted that Whirlpool believes convection microwave ovens represent less than 4% of U.S. shipments. However, the original weighted MWO survey data show that 25% of microwave owners have convection microwave ovens (see Table 2.6). Because of this discrepancy between the survey data and other sources of information on convection microwave penetration, we performed model-matching on three sub-sets of MWO respondents, as shown in Table 2.7, to better identify the penetration of convection microwaves. Because we did not check all models and some models we checked could not be verified as either MWO or CMWO, we made some assumptions regarding counts that should be used for calculating penetration. These are also noted in Table 2.7. Table 2.6: Convection Microwave Presence (MWO Survey)
Number of convection microwaves Count Fraction of total* 0 1672 75% 1 or More 562 25% Don’t know/blank 24 - Grand total 2258 100% * Excluding “Don’t know” and blanks. Table 2.7: Convection Microwave Verification Process (MWO Survey)
Count
Count Used for CMWO
Penetration Reason for Choice Total respondents 2258 N/A N/A
Respondents who said they have a CMWO (by count) 562 N/A N/A
Respondents who said their most used microwave was a CMWO 185 N/A N/A
Verified as CMWO 61 61 N/A Verified as regular MWO 77 0 N/A
Unknown 47 21
Assume proportional to others who have a CMWO and provided that model #
Respondents who offered conflicting responses: should not have a regular MWO (by count) but said their most used microwave was a regular MWO (or don’t know/blank) 319 N/A N/A
Verified as CMWO 32 32 N/A Verified as regular MWO 202 0 N/A
Unknown 84 12 Assume proportional to others who should
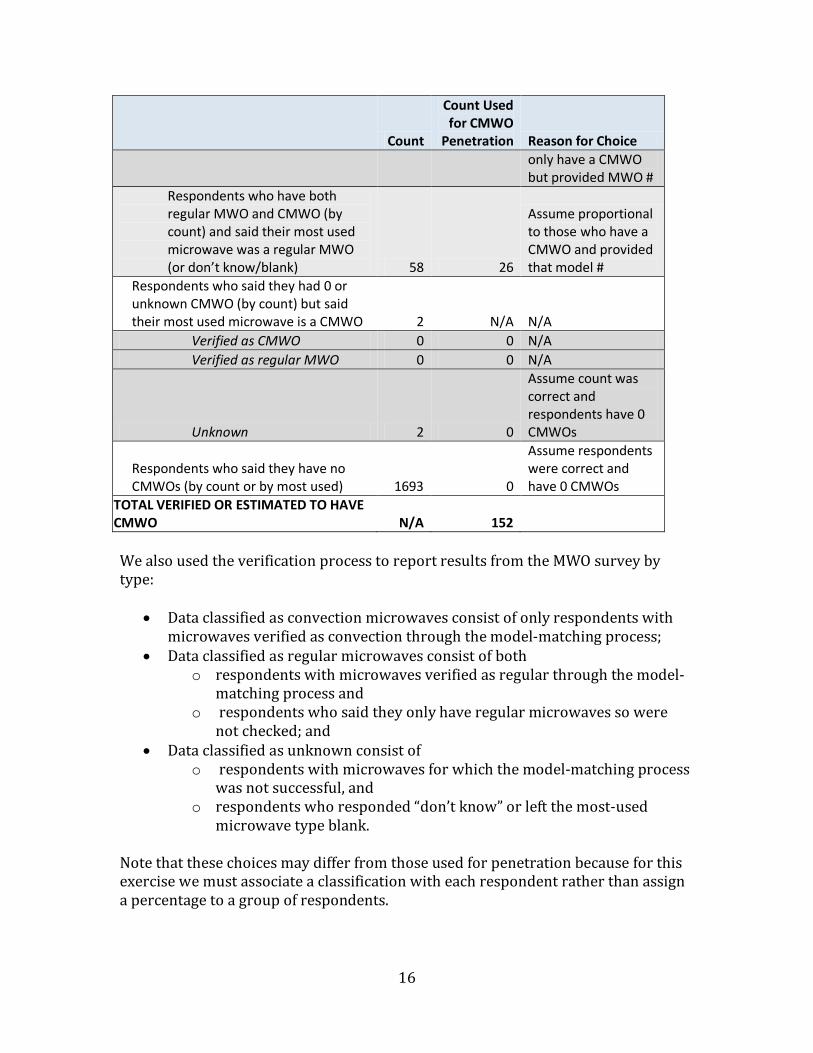
16
Count
Count Used for CMWO
Penetration Reason for Choice only have a CMWO but provided MWO #
Respondents who have both regular MWO and CMWO (by count) and said their most used microwave was a regular MWO (or don’t know/blank) 58 26
Assume proportional to those who have a CMWO and provided that model #
Respondents who said they had 0 or unknown CMWO (by count) but said their most used microwave is a CMWO 2 N/A N/A
Verified as CMWO 0 0 N/A Verified as regular MWO 0 0 N/A
Unknown 2 0
Assume count was correct and respondents have 0 CMWOs
Respondents who said they have no CMWOs (by count or by most used) 1693 0
Assume respondents were correct and have 0 CMWOs
TOTAL VERIFIED OR ESTIMATED TO HAVE CMWO N/A 152 We also used the verification process to report results from the MWO survey by type:
• Data classified as convection microwaves consist of only respondents with microwaves verified as convection through the model-matching process;
• Data classified as regular microwaves consist of both o respondents with microwaves verified as regular through the model-
matching process and o respondents who said they only have regular microwaves so were
not checked; and • Data classified as unknown consist of
o respondents with microwaves for which the model-matching process was not successful, and
o respondents who responded “don’t know” or left the most-used microwave type blank.
Note that these choices may differ from those used for penetration because for this exercise we must associate a classification with each respondent rather than assign a percentage to a group of respondents.
17
We did a model verification process for the CMWO survey and the CMWO survey final results are only from verified CMWOs.
2.5.3.2 Calculation of Mean Annual Usage The MWO and CMWO surveys ask about frequency of use and average heating times by offering ranges of answers (see Q6 in Appendix A and Q4 in Appendix B.) In order to develop mean annual usage statistics, we assigned values to each range. The assigned value is the average of the range, with the following exceptions where one end of the range is unknown: “At least 10 minutes” is assigned 10 minutes; “More than 5 times a day” is assigned 5 times a day; “One hour or more” is assigned one hour; “More than once a day” is assigned two times a day (to differentiate it from the “once a day” option); “Once a year or less” is assigned once a year.
3 Final results This section presents the results from the weighted MWO and CMWO survey data.
3.1 Microwave ownership The MWO survey was directed toward microwave owners only (as opposed to the full U.S. population), and as such, it does not verify the penetration of microwaves. According to RECS 2009, 96% of U.S. homes use a microwave oven.
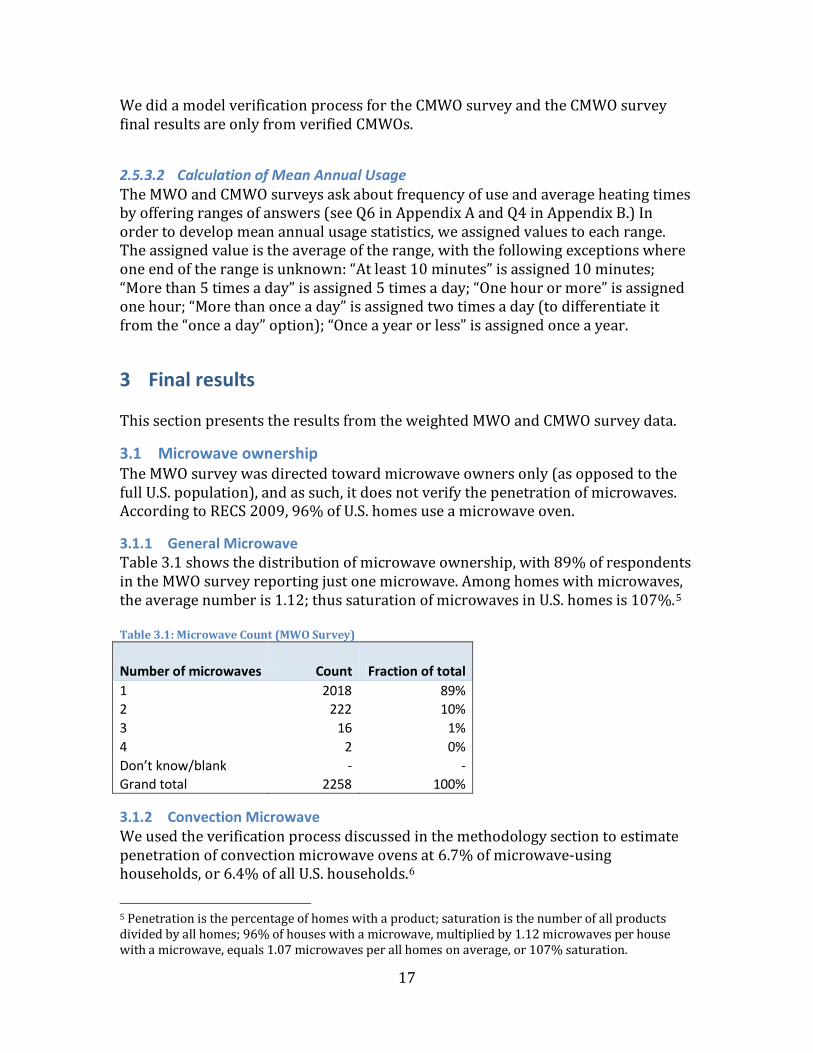
3.1.1 General Microwave Table 3.1 shows the distribution of microwave ownership, with 89% of respondents in the MWO survey reporting just one microwave. Among homes with microwaves, the average number is 1.12; thus saturation of microwaves in U.S. homes is 107%.5
Table 3.1: Microwave Count (MWO Survey)
Number of microwaves Count Fraction of total 1 2018 89% 2 222 10% 3 16 1% 4 2 0% Don’t know/blank - - Grand total 2258 100%
3.1.2 Convection Microwave We used the verification process discussed in the methodology section to estimate penetration of convection microwave ovens at 6.7% of microwave-using households, or 6.4% of all U.S. households.6
5 Penetration is the percentage of homes with a product; saturation is the number of all products divided by all homes; 96% of houses with a microwave, multiplied by 1.12 microwaves per house with a microwave, equals 1.07 microwaves per all homes on average, or 107% saturation.

18
Table 3.2 shows the distribution of convection microwaves from the CMWO survey, with 96% of convection microwave owners having only one convection microwave.7
The average number of convection microwaves per owner is 1.05; therefore the saturation of convection microwaves in U.S. households is 6.7%.
Table 3.2: Convection Microwave Count (CMWO Survey)
Number of convection microwaves Count Fraction of total 1 627 96% 2 22 3% 3 4 1% Don’t know/blank - - Grand total 653 100%
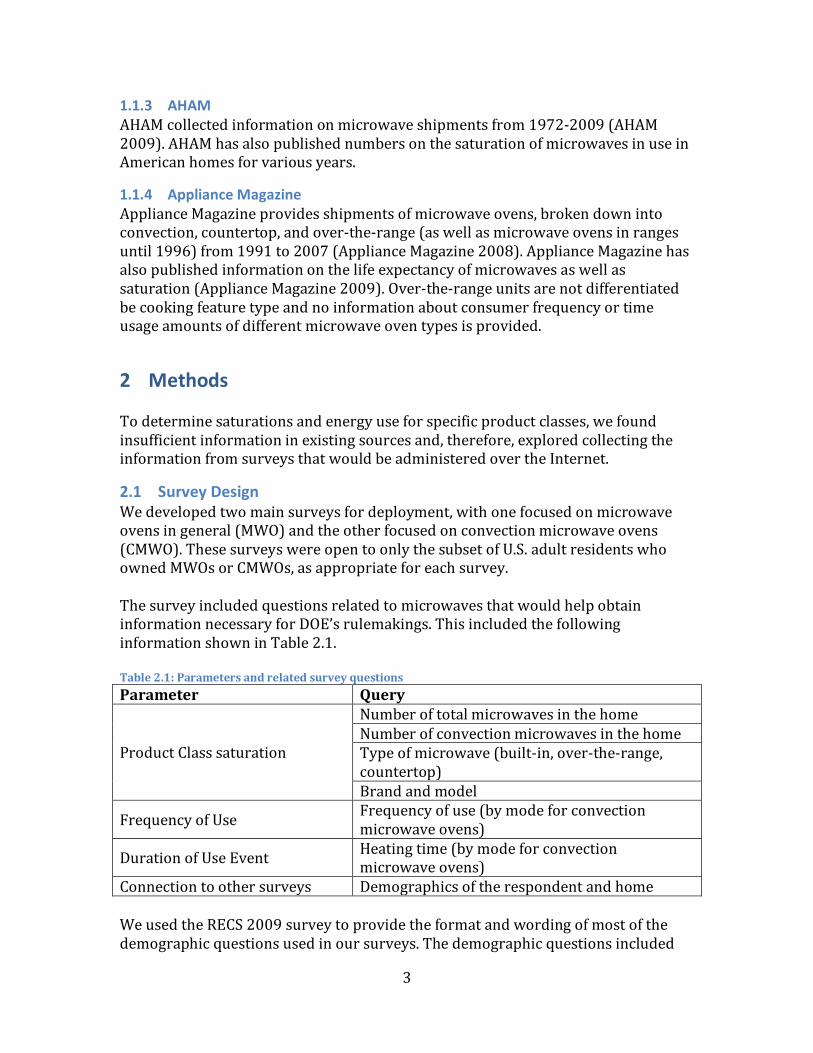
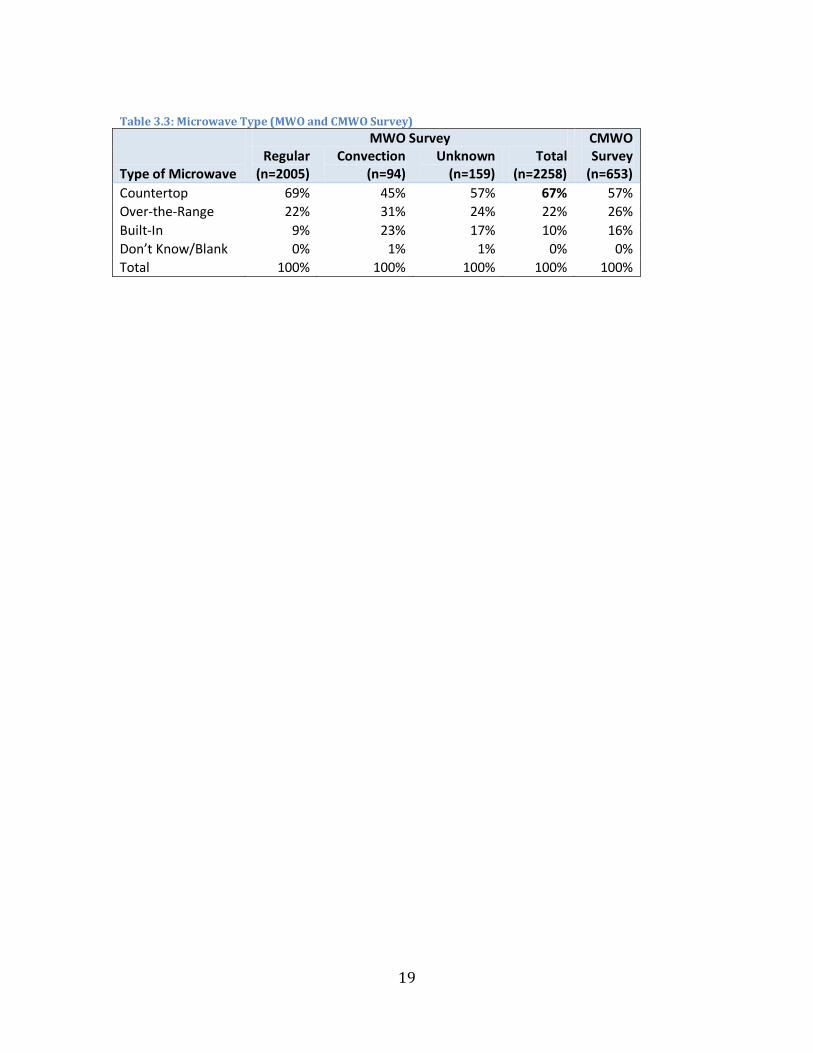
3.2 Microwave Type Microwaves are generally sold as countertop, over-the-range, or built-in models. Figure 7 shows this breakdown across all microwaves in the MWO survey; approximately two-thirds of microwaves are countertop models. Table 3.3 shows the breakdown by microwave classification as determined from the MWO survey, as well as for convection microwaves in the CMWO survey. Note that we did not perform any verification of microwave type other than the regular/convection distinction discussed earlier.
Figure 7: Microwave Type (MWO Survey; n=2258)
6 96% of U.S. households have a microwave, and 6.7% of these have a CMWO, which totals 6.4% of all households. 7 Although this question was also asked in the general microwave survey, we do not report it here because of the large number of respondents who may be incorrect about whether or not they have a convection microwave.
Countertop, 67%
Over-the-Range, 22%
Built-In, 10%
19
Table 3.3: Microwave Type (MWO and CMWO Survey)
Type of Microwave
MWO Survey CMWO Survey
(n=653) Regular
(n=2005) Convection
(n=94) Unknown
(n=159) Total
(n=2258) Countertop 69% 45% 57% 67% 57% Over-the-Range 22% 31% 24% 22% 26% Built-In 9% 23% 17% 10% 16% Don’t Know/Blank 0% 1% 1% 0% 0% Total 100% 100% 100% 100% 100%
20
3.3 Microwave Use
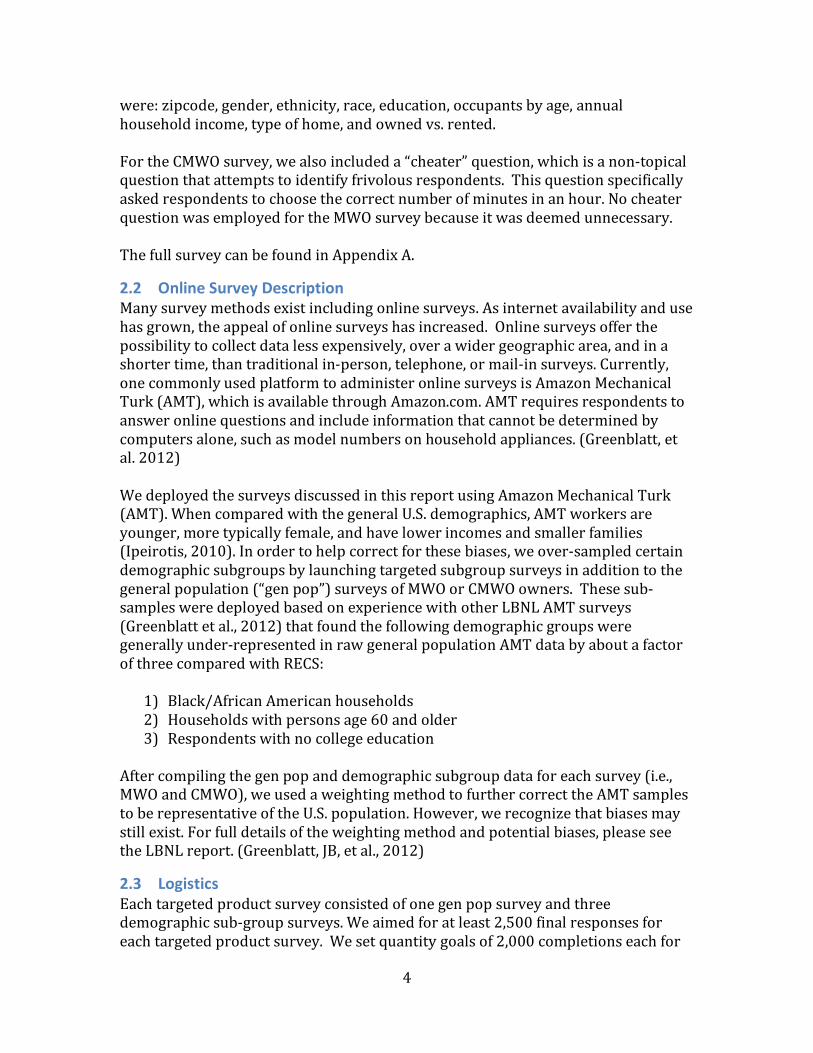
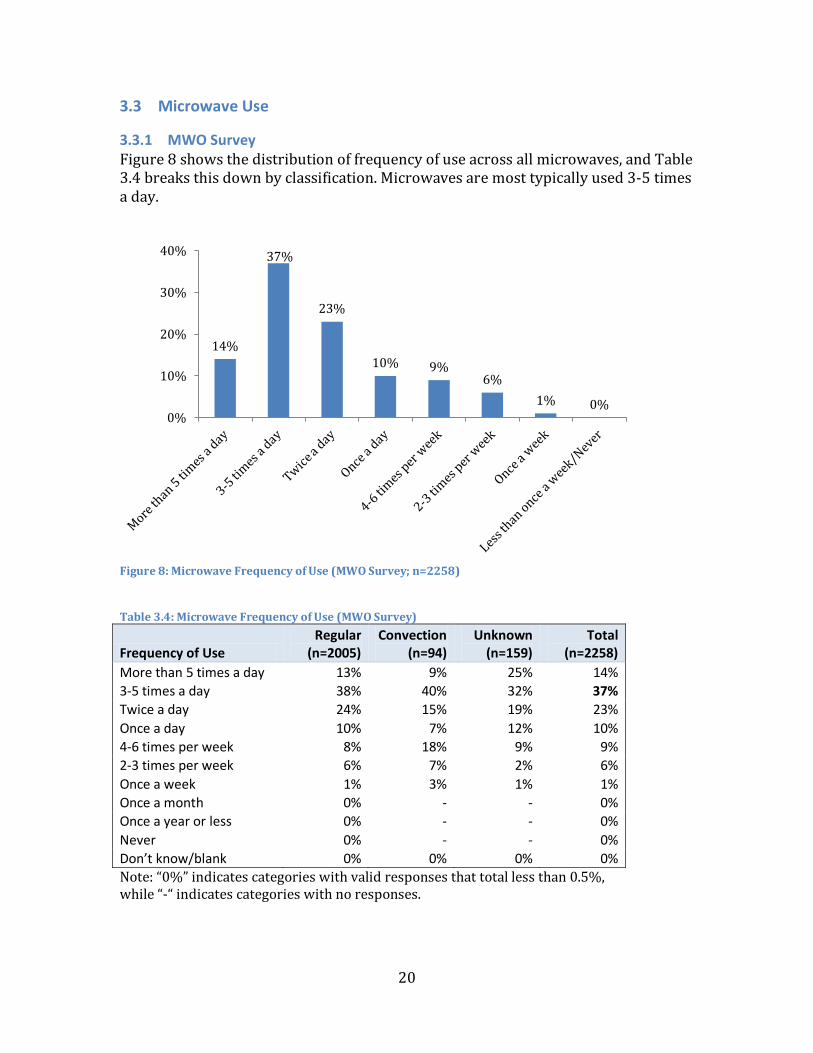
3.3.1 MWO Survey Figure 8 shows the distribution of frequency of use across all microwaves, and Table 3.4 breaks this down by classification. Microwaves are most typically used 3-5 times a day.
Figure 8: Microwave Frequency of Use (MWO Survey; n=2258)
Table 3.4: Microwave Frequency of Use (MWO Survey)
Frequency of Use Regular
(n=2005) Convection
(n=94) Unknown
(n=159) Total
(n=2258) More than 5 times a day 13% 9% 25% 14% 3-5 times a day 38% 40% 32% 37% Twice a day 24% 15% 19% 23% Once a day 10% 7% 12% 10% 4-6 times per week 8% 18% 9% 9% 2-3 times per week 6% 7% 2% 6% Once a week 1% 3% 1% 1% Once a month 0% - - 0% Once a year or less 0% - - 0% Never 0% - - 0% Don’t know/blank 0% 0% 0% 0% Note: “0%” indicates categories with valid responses that total less than 0.5%, while “-“ indicates categories with no responses.
14%
37%
23%
10% 9% 6%
1% 0% 0%
10%
20%
30%
40%
21
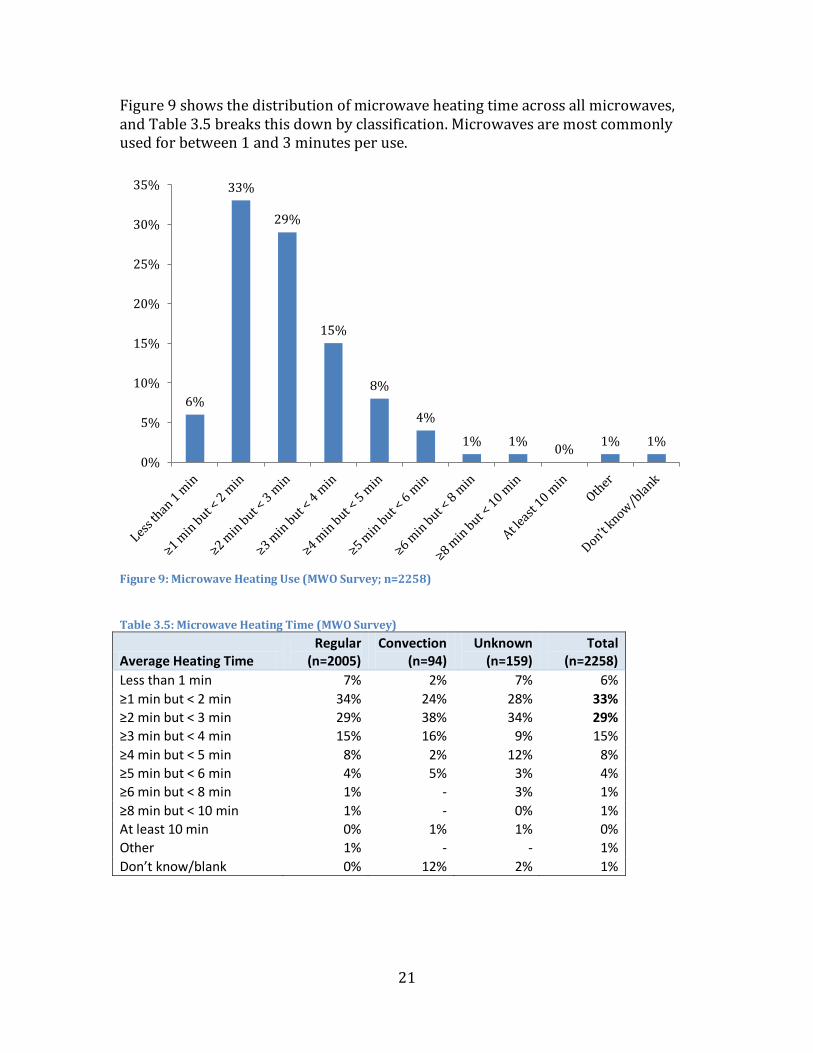
Figure 9 shows the distribution of microwave heating time across all microwaves, and Table 3.5 breaks this down by classification. Microwaves are most commonly used for between 1 and 3 minutes per use.
Figure 9: Microwave Heating Use (MWO Survey; n=2258)
Table 3.5: Microwave Heating Time (MWO Survey)
Average Heating Time Regular
(n=2005) Convection
(n=94) Unknown
(n=159) Total
(n=2258) Less than 1 min 7% 2% 7% 6% ≥1 min but < 2 min 34% 24% 28% 33% ≥2 min but < 3 min 29% 38% 34% 29% ≥3 min but < 4 min 15% 16% 9% 15% ≥4 min but < 5 min 8% 2% 12% 8% ≥5 min but < 6 min 4% 5% 3% 4% ≥6 min but < 8 min 1% - 3% 1% ≥8 min but < 10 min 1% - 0% 1% At least 10 min 0% 1% 1% 0% Other 1% - - 1% Don’t know/blank 0% 12% 2% 1%
6%
33%
29%
15%
8%
4%
1% 1% 0% 1% 1% 0%
5%
10%
15%
20%
25%
30%
35%
22
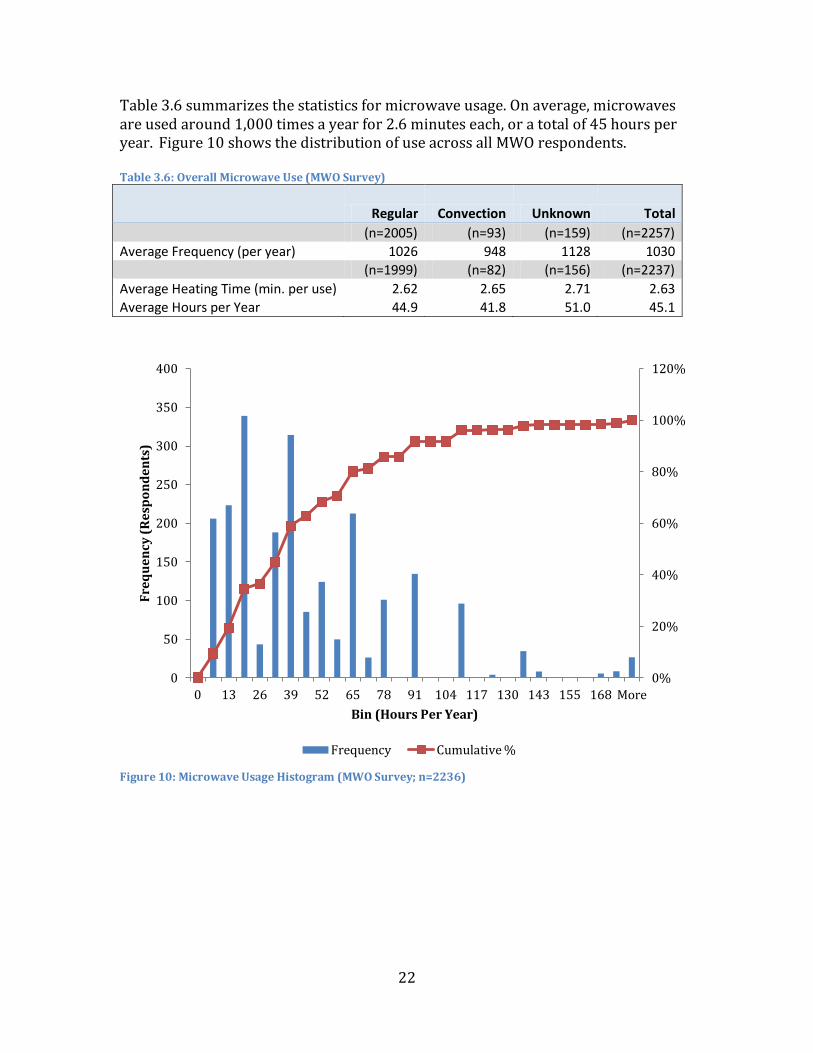
Table 3.6 summarizes the statistics for microwave usage. On average, microwaves are used around 1,000 times a year for 2.6 minutes each, or a total of 45 hours per year. Figure 10 shows the distribution of use across all MWO respondents. Table 3.6: Overall Microwave Use (MWO Survey)
Regular Convection Unknown Total
(n=2005) (n=93) (n=159) (n=2257)
Average Frequency (per year) 1026 948 1128 1030
(n=1999) (n=82) (n=156) (n=2237)
Average Heating Time (min. per use) 2.62 2.65 2.71 2.63 Average Hours per Year 44.9 41.8 51.0 45.1
Figure 10: Microwave Usage Histogram (MWO Survey; n=2236)
0%
20%
40%
60%
80%
100%
120%
0
50
100
150
200
250
300
350
400
0 13 26 39 52 65 78 91 104 117 130 143 155 168 More
Freq
uenc
y (R
espo
nden
ts)
Bin (Hours Per Year)
Frequency Cumulative %
23
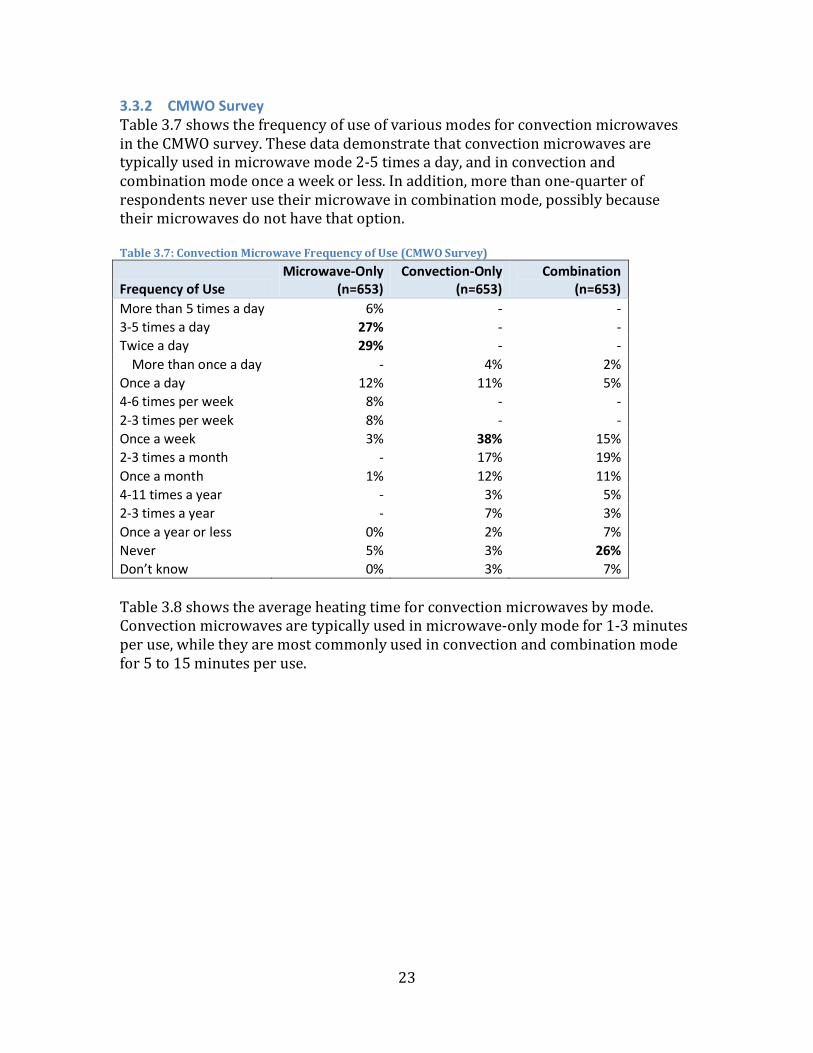
3.3.2 CMWO Survey Table 3.7 shows the frequency of use of various modes for convection microwaves in the CMWO survey. These data demonstrate that convection microwaves are typically used in microwave mode 2-5 times a day, and in convection and combination mode once a week or less. In addition, more than one-quarter of respondents never use their microwave in combination mode, possibly because their microwaves do not have that option. Table 3.7: Convection Microwave Frequency of Use (CMWO Survey)
Frequency of Use Microwave-Only
(n=653) Convection-Only
(n=653) Combination
(n=653) More than 5 times a day 6% - - 3-5 times a day 27% - - Twice a day 29% - -
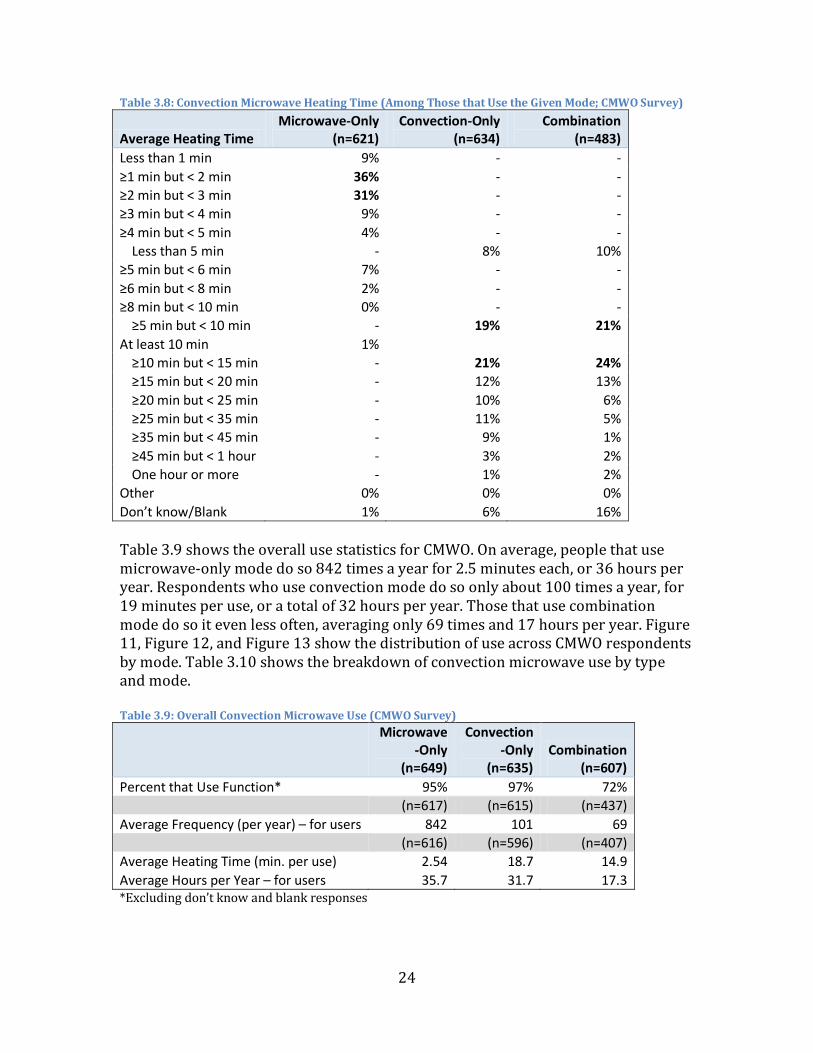
More than once a day - 4% 2% Once a day 12% 11% 5% 4-6 times per week 8% - - 2-3 times per week 8% - - Once a week 3% 38% 15% 2-3 times a month - 17% 19% Once a month 1% 12% 11% 4-11 times a year - 3% 5% 2-3 times a year - 7% 3% Once a year or less 0% 2% 7% Never 5% 3% 26% Don’t know 0% 3% 7% Table 3.8 shows the average heating time for convection microwaves by mode. Convection microwaves are typically used in microwave-only mode for 1-3 minutes per use, while they are most commonly used in convection and combination mode for 5 to 15 minutes per use.
24
Table 3.8: Convection Microwave Heating Time (Among Those that Use the Given Mode; CMWO Survey)
Average Heating Time Microwave-Only
(n=621) Convection-Only
(n=634) Combination
(n=483) Less than 1 min 9% - - ≥1 min but < 2 min 36% - - ≥2 min but < 3 min 31% - - ≥3 min but < 4 min 9% - - ≥4 min but < 5 min 4% - -
Less than 5 min - 8% 10% ≥5 min but < 6 min 7% - - ≥6 min but < 8 min 2% - - ≥8 min but < 10 min 0% - - ≥5 min but < 10 min - 19% 21%
At least 10 min 1% ≥10 min but < 15 min - 21% 24% ≥15 min but < 20 min - 12% 13% ≥20 min but < 25 min - 10% 6% ≥25 min but < 35 min - 11% 5% ≥35 min but < 45 min - 9% 1% ≥45 min but < 1 hour - 3% 2% One hour or more - 1% 2%
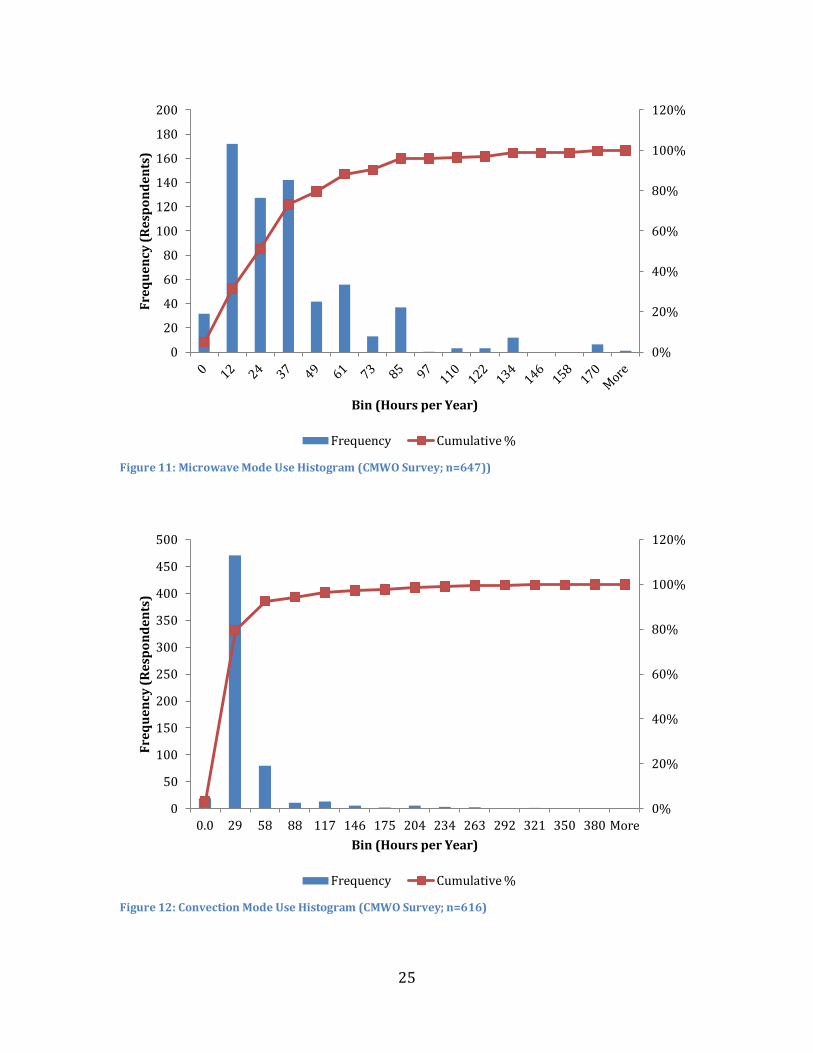
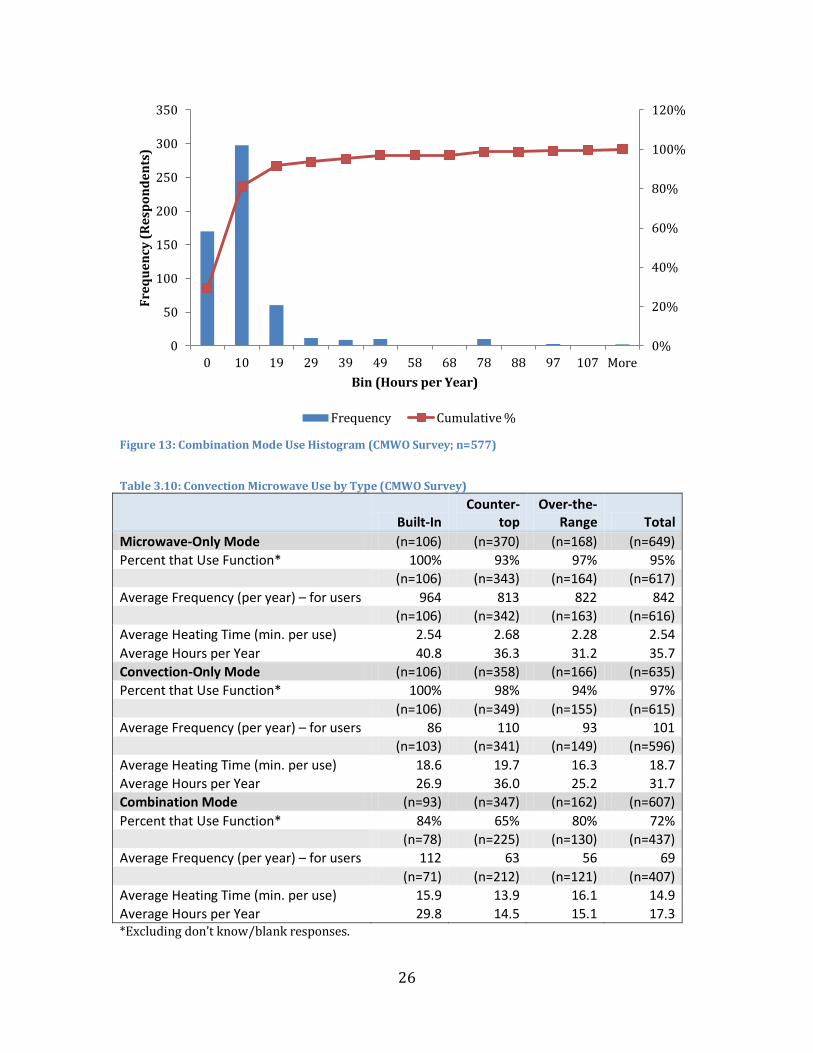
Other 0% 0% 0% Don’t know/Blank 1% 6% 16% Table 3.9 shows the overall use statistics for CMWO. On average, people that use microwave-only mode do so 842 times a year for 2.5 minutes each, or 36 hours per year. Respondents who use convection mode do so only about 100 times a year, for 19 minutes per use, or a total of 32 hours per year. Those that use combination mode do so it even less often, averaging only 69 times and 17 hours per year. Figure 11, Figure 12, and Figure 13 show the distribution of use across CMWO respondents by mode. Table 3.10 shows the breakdown of convection microwave use by type and mode. Table 3.9: Overall Convection Microwave Use (CMWO Survey)
Microwave-Only
(n=649)
Convection-Only
(n=635) Combination
(n=607) Percent that Use Function* 95% 97% 72%
(n=617) (n=615) (n=437)
Average Frequency (per year) – for users 842 101 69
(n=616) (n=596) (n=407)
Average Heating Time (min. per use) 2.54 18.7 14.9 Average Hours per Year – for users 35.7 31.7 17.3 *Excluding don’t know and blank responses
25
Figure 11: Microwave Mode Use Histogram (CMWO Survey; n=647))
Figure 12: Convection Mode Use Histogram (CMWO Survey; n=616)
0%
20%
40%
60%
80%
100%
120%
0
20
40
60
80
100
120
140
160
180
200
Freq
uenc
y (R
espo
nden
ts)
Bin (Hours per Year)
Frequency Cumulative %
0%
20%
40%
60%
80%
100%
120%
0
50
100
150
200
250
300
350
400
450
500
0.0 29 58 88 117 146 175 204 234 263 292 321 350 380 More
Freq
uenc
y (R
espo
nden
ts)
Bin (Hours per Year)
Frequency Cumulative %
26
Figure 13: Combination Mode Use Histogram (CMWO Survey; n=577)
Table 3.10: Convection Microwave Use by Type (CMWO Survey)
Built-In
Counter-top
Over-the-Range Total
Microwave-Only Mode (n=106) (n=370) (n=168) (n=649) Percent that Use Function* 100% 93% 97% 95%
(n=106) (n=343) (n=164) (n=617)
Average Frequency (per year) – for users 964 813 822 842
(n=106) (n=342) (n=163) (n=616)
Average Heating Time (min. per use) 2.54 2.68 2.28 2.54 Average Hours per Year 40.8 36.3 31.2 35.7 Convection-Only Mode (n=106) (n=358) (n=166) (n=635) Percent that Use Function* 100% 98% 94% 97%
(n=106) (n=349) (n=155) (n=615)
Average Frequency (per year) – for users 86 110 93 101
(n=103) (n=341) (n=149) (n=596)
Average Heating Time (min. per use) 18.6 19.7 16.3 18.7 Average Hours per Year 26.9 36.0 25.2 31.7 Combination Mode (n=93) (n=347) (n=162) (n=607) Percent that Use Function* 84% 65% 80% 72%
(n=78) (n=225) (n=130) (n=437)
Average Frequency (per year) – for users 112 63 56 69
(n=71) (n=212) (n=121) (n=407)
Average Heating Time (min. per use) 15.9 13.9 16.1 14.9 Average Hours per Year 29.8 14.5 15.1 17.3 *Excluding don’t know/blank responses.
0%
20%
40%
60%
80%
100%
120%
0
50
100
150
200
250
300
350
0 10 19 29 39 49 58 68 78 88 97 107 More
Freq
uenc
y (R
espo
nden
ts)
Bin (Hours per Year)
Frequency Cumulative %
27
4 Conclusions We performed this study to achieve the following three goals to supplement the limited understanding of usage patterns of MWOs and CMWO:
1. To differentiate types of households that have CMWOs from those having MWOs without the convection feature, and then develop a profile of the types of households that own CMWOs. We divided the population of microwave ovens into two general product types: (1) microwave-only ovens and countertop convection microwave ovens and (2) built-in and over-the-range convection microwave ovens.
2. To determine when CMWOs are used in convection mode. 3. To estimate the frequency and duration of cooking events for both product
classes.
For this study, we gathered more details on microwave oven ownership and use along with household demographics through Amazon Mechanical Turk (AMT) than what is found in publically available information. All survey responses were weighted by their demographics with a simultaneous weighting method to represent the targeted general MWO owners’ population. We found agreement in all demographic distributions when comparing the weighted MWO survey data to a reference sample of RECS 2009 microwave owners. Although demographics in the weighted CMWO survey data does not match the RECS MWO owners as well as the weighted MWO data, the weighted CMWO data show an overall improvement in representativeness of most demographic variables. With the weighted survey data, we can identify the types of households that own CMWOs. We can also estimate the amount of time both product types are used; and, therefore, how much energy each product type consumes. We found that MWOs are used 3 to 5 times per day for 1 to 3 minutes per cooking event. We also found that 6.4% of U.S. households have a CMWO. CMWOs typically are used in microwave mode 2 to 5 times a day for 1 to 3 minutes per cooking event, and are used in convection and combination mode once a week or less. Despite a relatively small sample size and some sampling challenges, we were able to develop results for our study goals. The survey and data analyzing process, however, was not without challenges. When we analyzed our survey data, a few shortcomings in the survey design were observed. First, we ended up collecting fewer responses than we targeted. Second, we did not include more specific questions that would have better assisted in the verification of responses about product type ownership. Third, the survey format we designed may have increased the time necessary to process the data. These challenges provide insight to enable a refinement for future work in this area. Below, we include a brief evaluation of our
28
current survey effort focusing on survey design and weighting methodology, and opportunities for improvement in the future.
1. Requiring respondents to provide a model number for microwave oven units would provide a larger subsample of MWO owners (parent) from which we could weight the CMWO survey (child), thus avoiding the potential effect of income on CMWO usage that may be present in our results.
2. Having model numbers might also simplify matching and verifying models and would enable greater accuracy in estimating the market penetration and saturation of each product class.
3. Using survey software that allows for programmed skip patterns and answer checks would avoid some of the cleaning and verification issues that we experienced with the data. Programmed skip patterns and answer checks could improve the survey experience for the respondent as well.
Despite those challenges, conducting online product-specific surveys still appear to be a viable means to better understanding of ownership and usage pattern by different product types. Since the survey designers have flexibility to administer surveys to achieve their research goals, it is extremely important to have a well-designed survey which not only consists of clear questions but also verification questions to identify inconsistent responses. We should use this study as an opportunity to learn the advantages and shortcomings of this method and to reach more complete results in future work.
5 Acknowledgments The authors wish to thank the following individuals for their invaluable contributions to one or more components of this study: Samantha I. Infeld, Stacy Pratt, and Gregory J. Rosenquist.
6 References AHAM (2009). “AHAM 2009 Fact Book.” Association of Home Appliance Manufacturers, Washington, DC.. Appliance Magazine (2008). “Appliance Statistical Review 55th Annual Report A Ten-Year Review 1998-2007 of the U.S. Appliance Industry,” Appliance Magazine, May 2008, pp. 36-39.
29
Appliance Magazine (2009), “The Life Expectancy/Replacement Picture,” Appliance Magazine. 2009. 64(9): pp. 65–66. DOE (2012a).”Supplemental Notice of Proposed Rulemaking (SNOPR) for Microwave Oven Standby Mode and Off Mode Standards,” U.S. Department of Energy, Federal Register, 77 FR 8526, 14 February. http://www1.eere.energy.gov/buildings/appliance_standards/pdfs/mwo_snopr_fr_version_final_2_15_12.pdf. DOE (2012b). “Supplemental Notice of Proposed Rulemaking (SNOPR) for Microwave Oven Standby and Off Mode Test Procedure,” Federal Register, 77 FR 28805, 16 May. http://www1.eere.energy.gov/buildings/appliance_standards/pdfs/mwotp_snopr_iec_provisions_5_16_12.pdf. Greenblatt, JB, Hung-Chia (Dominique) Yang, Louis-Benoit Desroches, Scott J. Young, Bereket Beraki, Sarah K. Price, Stacy Pratt, Henry Willem, and Sally M. Donovan. (2012). “U.S. residential consumer product information: Validation of methods for post-stratification weighting of Amazon Mechanical Turk surveys.” Lawrence Berkeley National Laboratory, LBNL report number pending. Ipeirotis, P. (2010). “Demographics of Mechanical Turk.” http://www.behind-the-enemy-lines.com/2010/03/new-demographics-of-mechanical-turk.html. McNary, B. and C. Berry (2012). “How Americans are Using Energy in Homes Today,” ACEEE Summer Study 2012, 12-17 August, Pacific Grove, CA. http://www.aceee.org/files/proceedings/2012/data/papers/0193-000024.pdf. RECS (2009). “2009 RECS Survey Data,” Residential Energy Consumption Survey (RECS). U.S. Energy Information Administration, U.S. Department of Energy. http://www.eia.gov/consumption/residential/data/2009/.

30
Appendix A: Microwave Oven -- General Population Survey

31
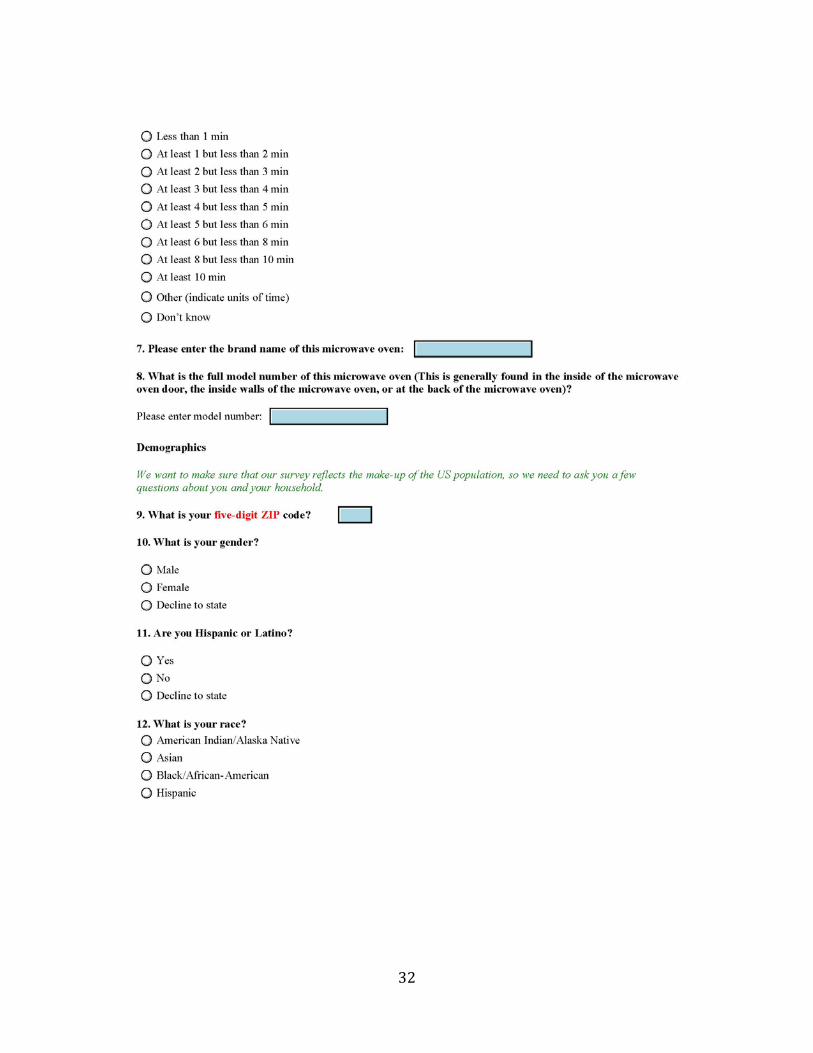
32

33
34
35
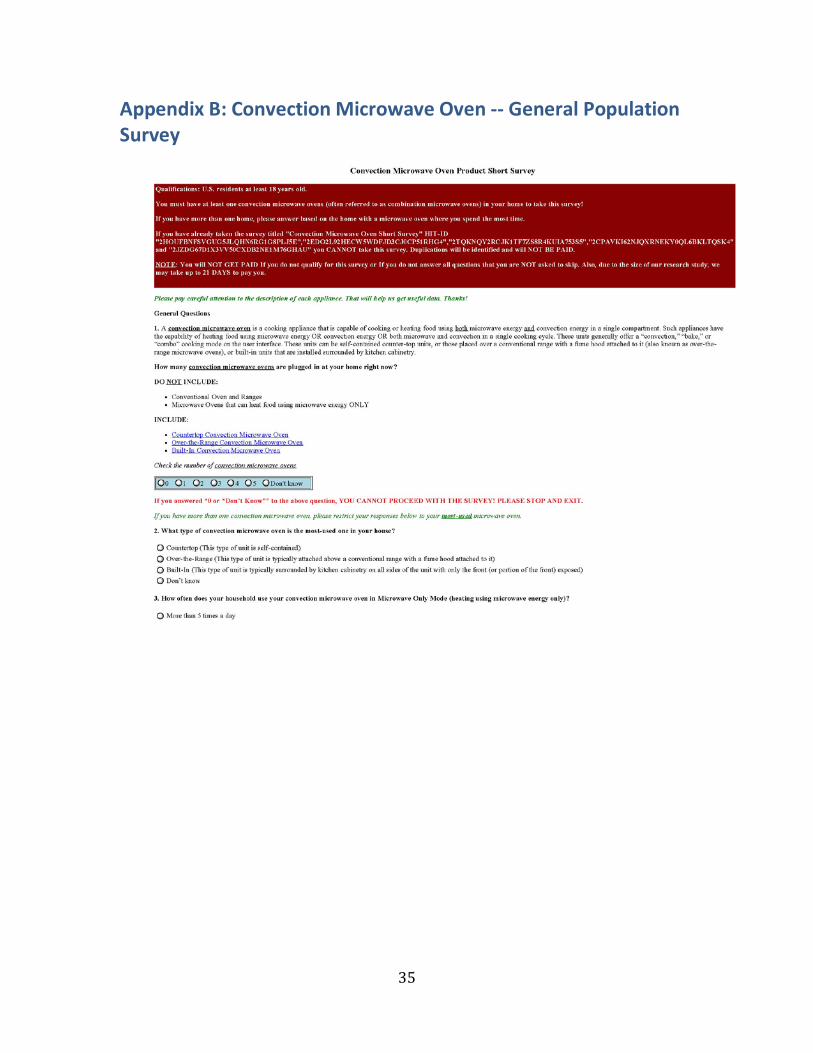
Appendix B: Convection Microwave Oven -- General Population Survey
36
37

38