Laura Cozzi Ottawa, 18 November 2016 - Carleton University · © OECD/IEA 2016 © OECD/IEA 2016...
13
© OECD/IEA 2016 © OECD/IEA 2016 Laura Cozzi Ottawa, 18 November 2016
Transcript of Laura Cozzi Ottawa, 18 November 2016 - Carleton University · © OECD/IEA 2016 © OECD/IEA 2016...
© OECD/IEA 2016 © OECD/IEA 2016
Laura Cozzi Ottawa, 18 November 2016
© OECD/IEA 2016
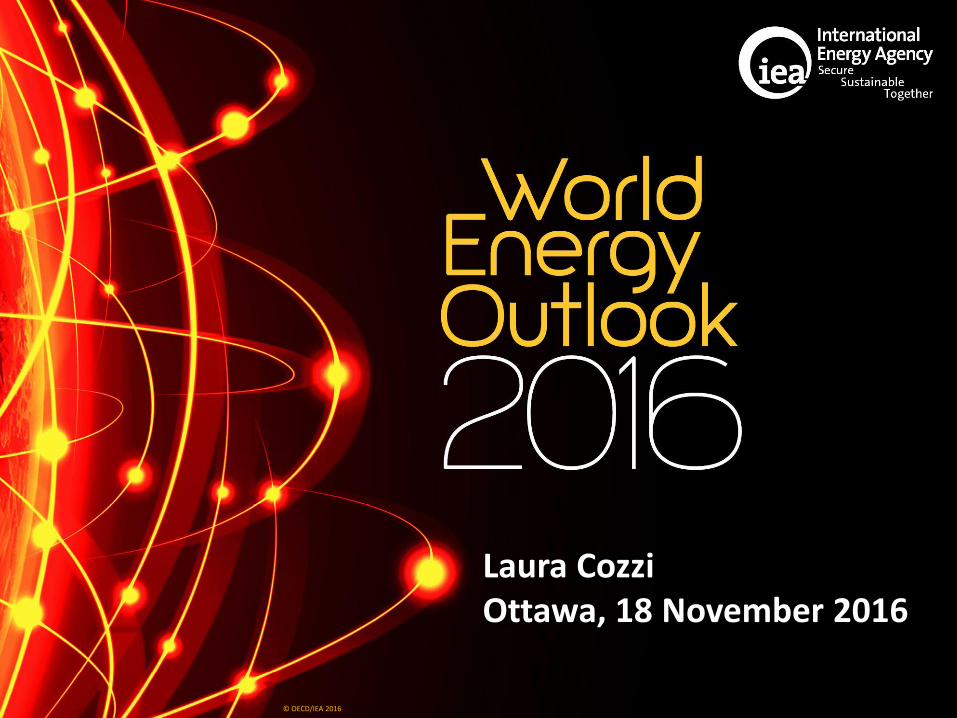
Key points of orientation:
Middle East share in global oil production in 2016 at highest level for 40 years
Transformation in gas markets deepening with a 30% rise in LNG
Additions of renewable capacity in the power sector higher in 2015 than coal, gas, oil and nuclear combined
Energy sector in the spotlight as the Paris Agreement enters into force
Billions remain without basic energy services
There is no single story about the future of global energy; policies will determine where we go from here
The global energy context today
© OECD/IEA 2016
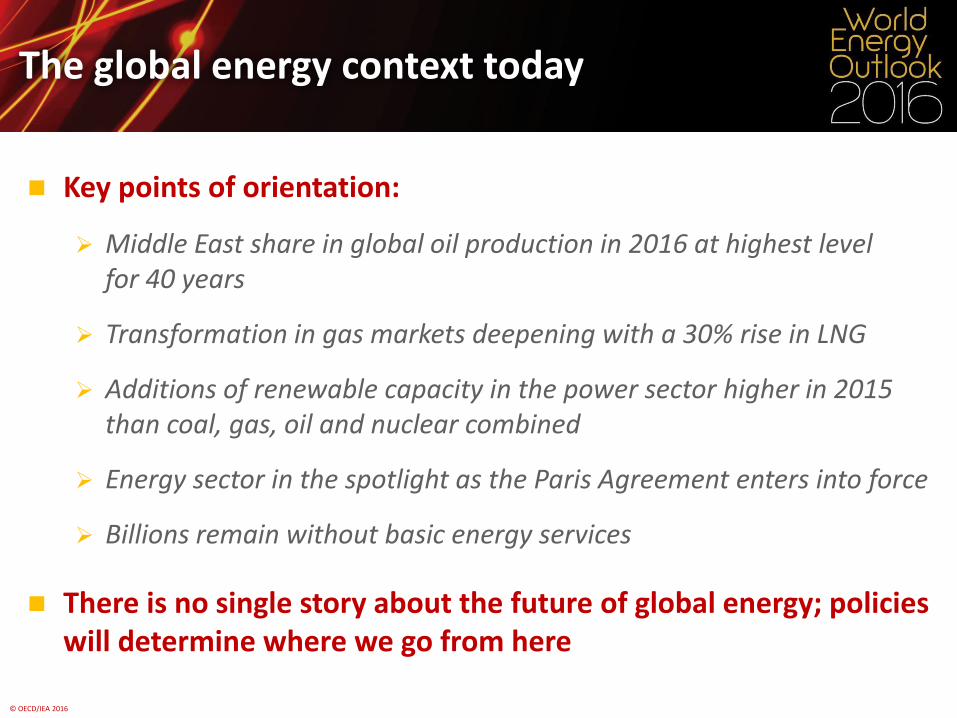
Change in total primary energy demand
Low-carbon fuels & technologies, mostly renewables, supply nearly half of the increase in energy demand to 2040
Low- carbon
Oil Gas Coal
A new ‘fuel’ in pole position
500
1 000
1 500
2 000 1990-2015 2015-2040
Mto
e
Low- carbon
Oil Gas Coal
Nuclear
Nuclear
Ren
ewab
les
Ren
ewab
les
Rest of world
European Union Latin
America
India
US
Africa
China
© OECD/IEA 2016
1 000
2 000
3 000
4 000
TWh
1 500
3 000
4 500
6 000
TWh
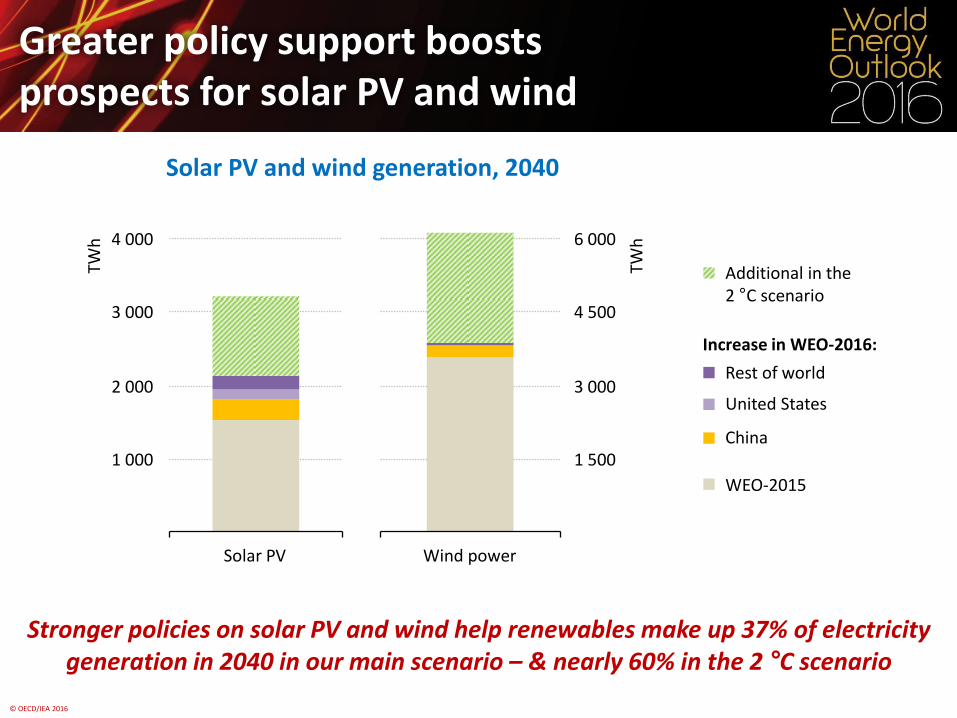
Greater policy support boosts prospects for solar PV and wind
Solar PV and wind generation, 2040
Stronger policies on solar PV and wind help renewables make up 37% of electricity generation in 2040 in our main scenario – & nearly 60% in the 2 °C scenario
Additional in the 2 °C scenario
Rest of world
United States
China
WEO-2015
Increase in WEO-2016:
Solar PV Wind power
© OECD/IEA 2016
300
600
900
1 200 Mtoe
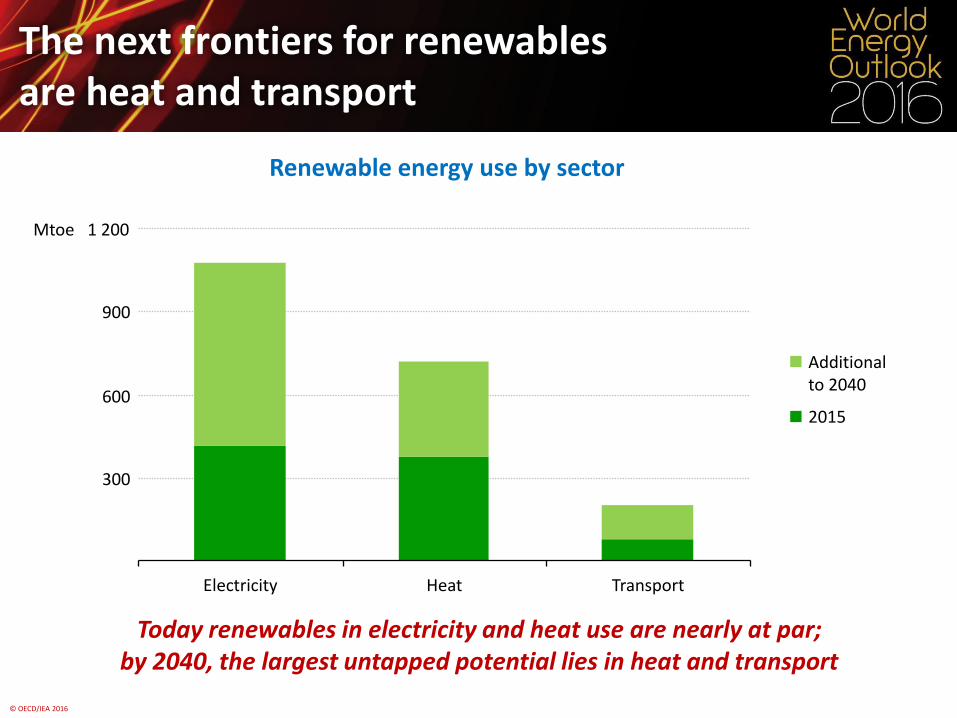
The next frontiers for renewables are heat and transport
Renewable energy use by sector
Today renewables in electricity and heat use are nearly at par; by 2040, the largest untapped potential lies in heat and transport
Electricity Heat Transport
Additional to 2040
2015

© OECD/IEA 2016
Net oil imports
The energy transition provides instruments to address traditional energy security concerns, while shifting attention to electricity supply
A suite of tools to address energy security
5
10
15
20
2014 2040
mb
/d
Switch to electric and natural gas vehicles
Switch to renewables
Efficiency improvements
Increase in oil production 2014-2040
Net oil imports
United States
2014 2040
European Union
2014 2040
China
2014 2040
India
Reduction in net oil imports due to:

© OECD/IEA 2016
Approvals of new conventional crude oil projects in 2015-2016 have fallen to the lowest level since the 1950s
If approvals remains low in 2017, an unprecedented effort will be needed to avoid a supply-demand gap in a few years’ time
US tight oil provides a potential lifeline, but cannot be relied upon to cover a major shortfall in the ‘baseload’ of oil supply
Without a pick-up in investment, or a rapid slowdown in demand growth, the stage is set for the next boom-and-bust cycle for oil
Entering a period of greater oil market volatility
© OECD/IEA 2016
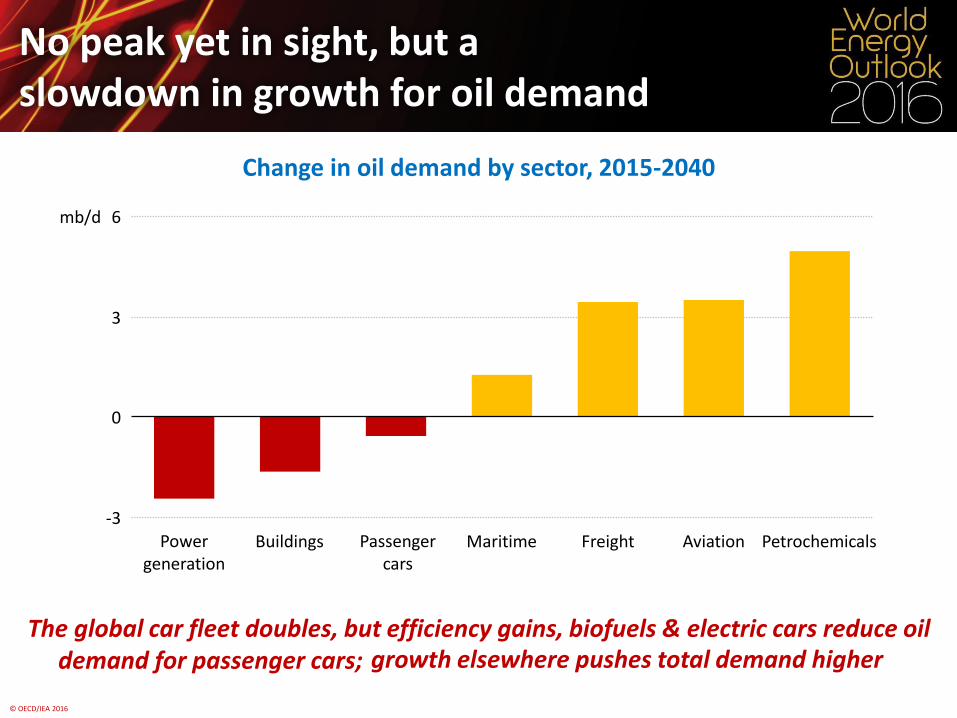
-3
0
3
6 mb/d
The global car fleet doubles, but efficiency gains, biofuels & electric cars reduce oil
Change in oil demand by sector, 2015-2040
No peak yet in sight, but a slowdown in growth for oil demand
Power generation
Buildings Passenger cars
Maritime Freight Aviation Petrochemicals
demand for passenger cars;
growth elsewhere pushes total demand higher
© OECD/IEA 2016
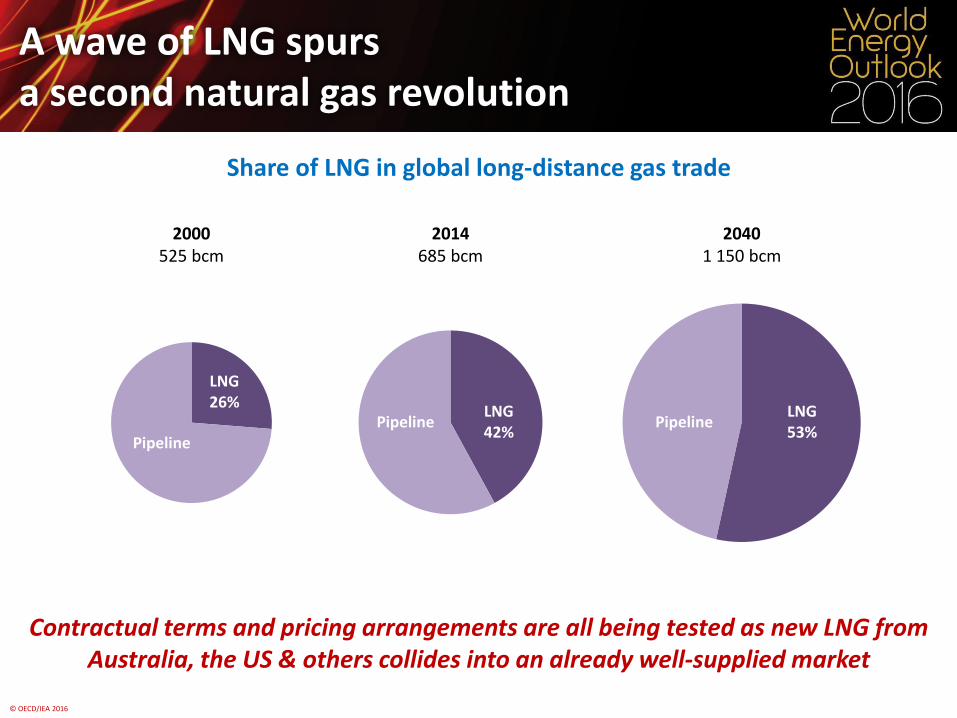
A wave of LNG spurs a second natural gas revolution
Share of LNG in global long-distance gas trade
Contractual terms and pricing arrangements are all being tested as new LNG from Australia, the US & others collides into an already well-supplied market
2014 685 bcm
2040 1 150 bcm
2000 525 bcm
LNG 53%
Pipeline Pipeline LNG 42%
Pipeline
LNG 26%
© OECD/IEA 2016
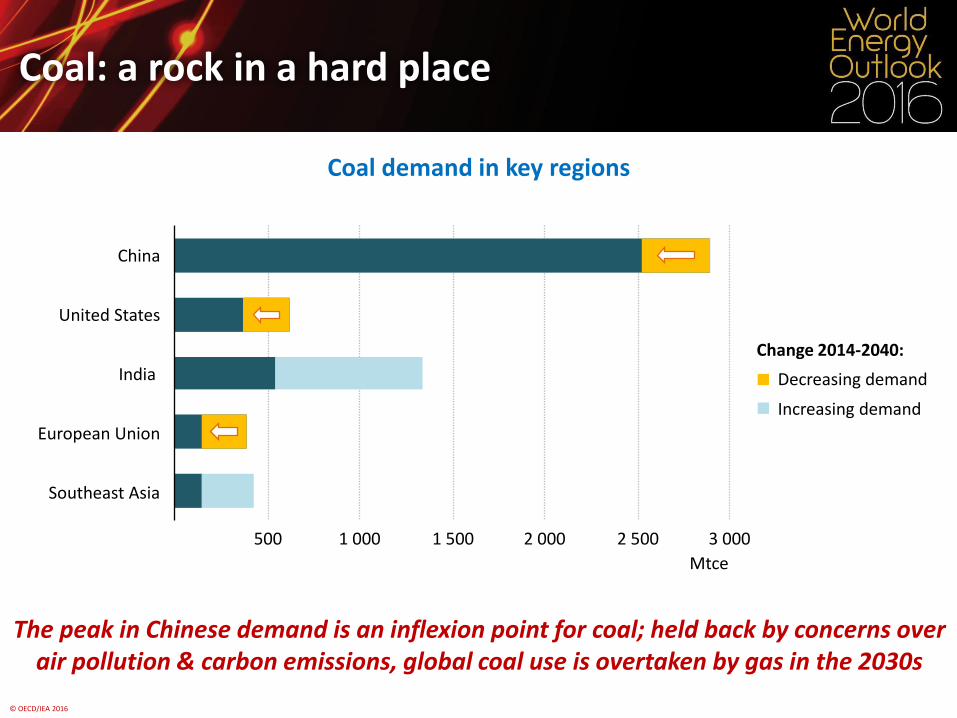
Coal demand in key regions
The peak in Chinese demand is an inflexion point for coal; held back by concerns over air pollution & carbon emissions, global coal use is overtaken by gas in the 2030s
Coal: a rock in a hard place
500 1 000 1 500 2 000 2 500 3 000
Southeast Asia
European Union
India
United States
China
Mtce
2014
Decreasing demand
Change 2014-2040:
Increasing demand
© OECD/IEA 2016
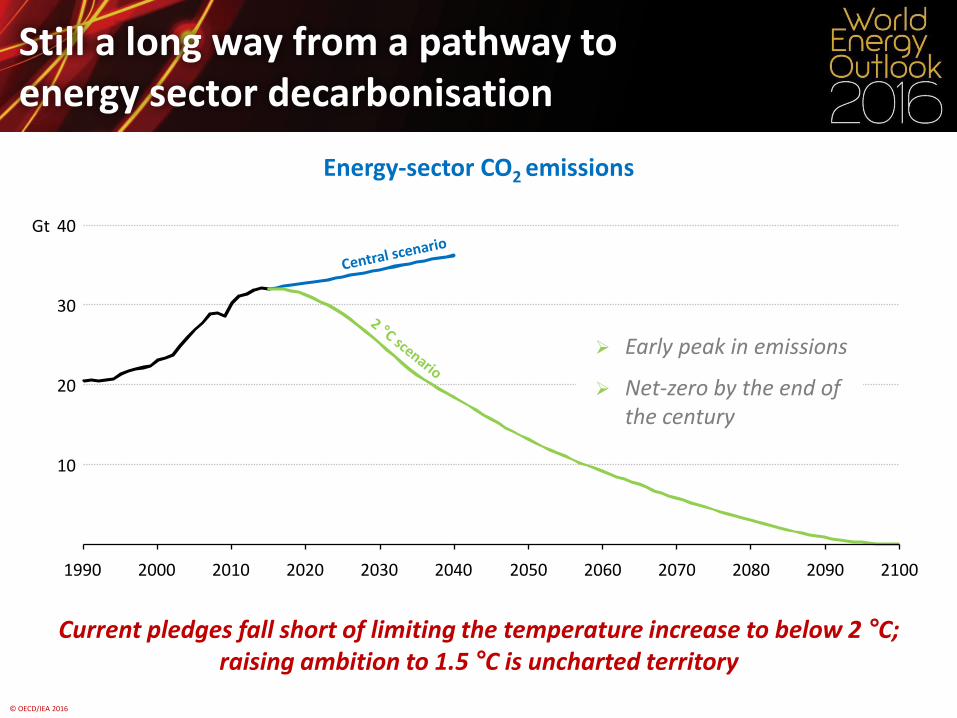
Current pledges fall short of limiting the temperature increase to below 2 °C; raising ambition to 1.5 °C is uncharted territory
Energy-sector CO2 emissions
Still a long way from a pathway to energy sector decarbonisation
10
20
30
40
1990 2000 2010 2020 2030 2040
Gt
2060 2080 2100 2050 2070 2090
Early peak in emissions
Net-zero by the end of the century
© OECD/IEA 2016
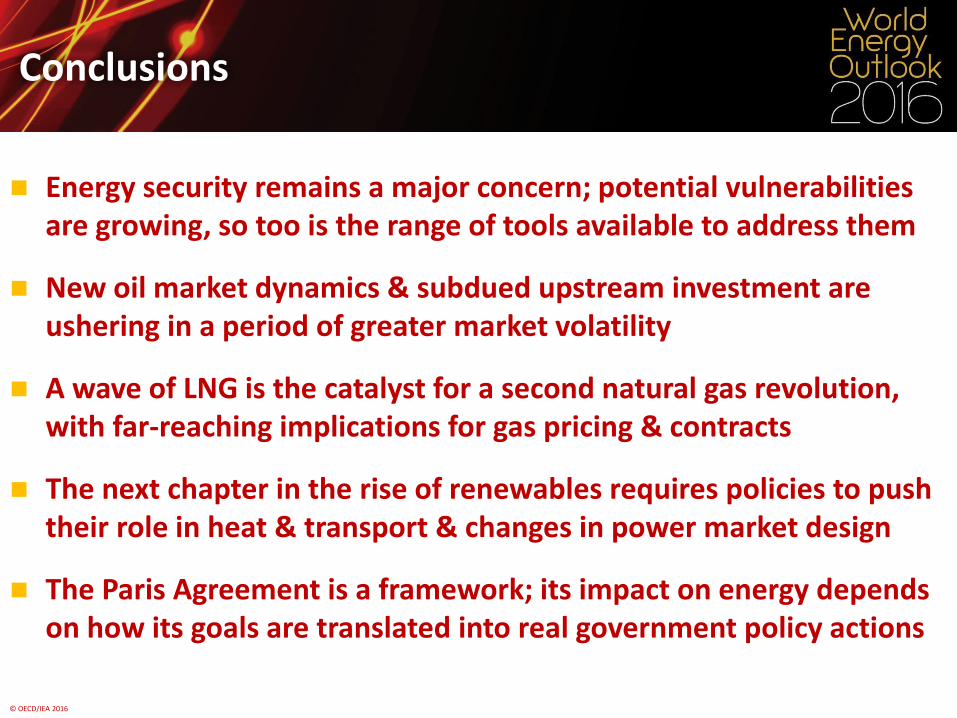
Energy security remains a major concern; potential vulnerabilities are growing, so too is the range of tools available to address them
New oil market dynamics & subdued upstream investment are ushering in a period of greater market volatility
A wave of LNG is the catalyst for a second natural gas revolution, with far-reaching implications for gas pricing & contracts
The next chapter in the rise of renewables requires policies to push their role in heat & transport & changes in power market design
The Paris Agreement is a framework; its impact on energy depends on how its goals are translated into real government policy actions
Conclusions
© OECD/IEA 2016 © OECD/IEA 2016
www.worldenergyoutlook.org @IEA @IEABirol