Latin America - Cornell Universityusda.mannlib.cornell.edu/usda/ers/WRS/1980s/1985/WR… · ·...
49
Latin America Economic Research Service RS-85-9 JI:Jiy 1985 Latin America maintains positive trade balance with us_ Trade with Region
-
Upload
nguyenphuc -
Category
Documents
-
view
215 -
download
1
Transcript of Latin America - Cornell Universityusda.mannlib.cornell.edu/usda/ers/WRS/1980s/1985/WR… · ·...

Latin America Economic Research Service
RS-85-9 JI:Jiy 1985
Latin America maintains positive trade balance with us_
Trade with Region

CONTENTS
Page Page
Special Articles: 4 Latin America's Financial
Situation 23 Shifts in Soybean and Soybean
Product Exports from South America 5 Mexico 25 Canadian- Latin American Agricultural Trade 8 The Caribbean 28 P.L. 480 Needs in Latin America
10 Central America 30 Use of Exchange Rates in Latin America 13 Andean Countries 15 Argentina
35 The 1985 Farm Bill Proposals: Implications for Latin America.
20 Brazil 3 8 List of Tables
Coordinator John Link (202) 447-8133
Contributors Edward Allen H. Christine Bolling Richard N. Brown, Jr. Carol Goodloe Jorge Hazera C.S. Kim
Statistics Ricardo Krajewski Richard Shelton
Myles Mielke Arthur Morey Ray Motha David Stallings Nydia Suarez
Electronic Word-Processing Mary Oliver Brenda Powell Linda Turner
International Economics Division, Economic Research Service U.S. Department of Agriculture, Washington, D.C. 20250
Approved by the World Agricultural Outlook Board. Summary released June 7,1985. Latin America Outlook and Situation is one in a series of 11 regional reports published annually by the Economic Research Service. Other titles in the series: North America and Oceania, Western Europe, USSR, China, East Asia, South Asia, Southeast Asia, Eastern Europe, Middle East and North Africa, and Sub- Saharan Africa. Annual subscriptions and single copies are available from the Superintendent of Documents, U.S. Government Printing Office, Washington, D.C. 20402. For ordering and pricing information, call the GPO order desk at (202) 783-3238.
2
Summaries of each report are available on several electronic information systems. For details, call (402) 472-1892 or (301) 588-1572. Full reports, including tables, are provided by the system on (402) 472-1892.
Subscribers to the regional report series will receive renewal notices from the Government Printing Office approximately 90 days before their subscriptions expire. Notices will be sent ONLY ONCE and should be returned promptly to ensure uninterrupted service.
NOTE: All information and data in this report are on a calendar year basis, volume is in metric tons, and area is in hectares, unless otherwise specified.

.... SUMMARY
Most Latin American economies improved in 1984. The outlook for 1985 is for continued improvement, although it will be a while before conditions reach previous historical highs. Last year's growth came primarily from higher exports and larger agricultural output.
Although the improvements are encouraging, domestic demand is still depressed and investments are stagnant. Governments in most countries will continue policies to insulate their economies from wide variations in the world market. A few, however, like Brazil, are seeking to open freer, market--oriented trade. Exchange rates will remain managed to provide many countries with favorable trading conditions. Furthermore, the rapidly increasing population, combined with already large urban areas, will keep pressuring the Governments to provide inexpensive sources of food.
Agricultural output during 1984 increased from a year earlier largely because of the better weather: output increased in 21 of the 25 countries. Per capita production for the region was up 2 percent. Crops such as wheat, corn, sugarcane, and soybeans increased, while coffee and livestock products declined.
The balance of agricultural trade between the region and the United States favored Latin America by nearly $2 billion in 1984, compared with $1 billion a year earlier. Although U.S. exports to Latin America were up 1 percent, to $5.3 billion, they might have been lower if not for increased credit through P.L. 480 and GSM-102 programs. Meanwhile, imports from the region jumped 27 percent, to $7.2 billion, giving Latin America a definite edge.
Grains and feeds were the main U.S. agricultural exports, at $2.4 billion, accounting for 45 percent of the total. Oilseeds and products, at $1.6 billion, made up an additional 30 percent. The principal market was Mexico, which took $2 billion. U.S. agricultural imports from the region came mostly from Brazil, at $2.1 billion, and Mexico, at $1.3 billion. Coffee accounted for a third of the total U.S. agricultural imports from the region at $2.4 billion.
In this issue of the Latin America Outlook and Situation,several special articles examine specific factors affecting U.S. agricultural trade with the region. These include the region's financial situation, global economic conditions, food aid needs, and implications for Latin America of proposed U.S. agricultural programs.
3

ERRATA
Both columns in table 5, page 44 should be labeled exports
Both columns in table 5, page 45 should be labeled imports

LATIN AMERICA'S FINANCIAL SITUATION
In late spring 1985, almost 3 years since Mexico announced it was unable to meet payments on its international debt, the financial tensions facing Latin America appear to have eased. Debt reschedulings, growth in exports, reductions in interest rates, and cutbacks in fiscal and import expenditures have reduced the demand for foreign exchange and increased its supply in Latin American economies.
The improvement, however, has come at great cost to the region through foregone output, consumption, and employment. High inflation rates in Argentina, Brazil, and elsewhere may even be threatening the gains of the past 2 years. These setbacks aside, it is the region's debt that will likely continue to pose economic hardship through the remainder of the decade and beyond.
Following widespread recessions in 1982 · and 1983 and depressed growth in 1981, 1984 marked economic improvement for most Latin American countries. Still, 1984 growth, estimated at 2 to 3 percent, is only half the 6-percent average growth rate of the 1970's.
In constant U.S. dollars, private consumption probably increased marginally in 1984, after declining 9 percent from 1981 to 1983. Overall investment likely picked up slightly after dropping 25 percent the previous 2 years.
Exports, the mainstay of foreign exchange earnings, staged a remarkable comeback in 1984. They rose an estimated 18 percent in nominal U.S. dollars, after declining 10 percent during 1982 and 1983. The general improvement in domestic conditions was reflected in the growth in value of merchandise imports, an estimated 7 percent, following declines of 21 and 33 percent in 1982 and 1983, respectively.
Despite this gain, the region's imports of goods and services in 1984, (measured in constant U.S. dollars) was lower than in 1973, and a full 40 percent below the 1981 peak. This reflects the region's overall lower demand.
The 1984 estimate of gross domestic product (GDP), measured in constant dollars,
4
1· .. .,.
remained below 1980, despite the 2- to 3-percent gain from 1983. These reductions from 1981 peaks help reveal the extent policies attack the internal causes of the 1982-83 debt problems and the extent the shortfall of foreign exchange shrank aggregate demand and output. Reductions in internal investment since 1980 will limit output over the next several years and will likely hold output below its potential for years to come. Investments in 1984 lagged behind 1974 despite a 2-percent increase from 1983.
Austerity policies effectively reduced the area's goods and services (the current account balance) trade deficit. Policies' major elements were usually to devalue the nation's currency, reduce subsidies on consumer goods and tariffs on imported goods, and keep wage increases below inflation.
In the aggregate, these policies were successful. The clearest illustration lies in the dramatic reduction in the region's current account deficit, from $41 billion in 1981 to a mere $3 billion in 1984. This reduction was made possible through contractionary policies that cut back imports and the 1983-84 U.S. recovery that led to increased exports.
Also helping reduce the deficit was the debt rescheduling for Mexico, Brazil, and other countries. This allowed them to defer repayments of principal and interest on loans originally scheduled to be repaid during 1982-84. A subsequent agreement between Mexico and creditors will defer payments originally scheduled over 1985-89 until the 1990's. Brazil and Argentina are negotiating with their creditors to reschedule current payments until the 1990's.
Controlling Latin America's debt problem and restoring output and demand will depend on both international and internal factors. Internationally, demand for Latin America's exports and credits from Western banks must continue to increase and interest rates must remain stable. Currently, Latin America's export volumes are fore cast to increase roughly 5 percent a year through the remainder of the decade, and total trade values are forecast to increase about 13 percent. These rates are likely to be sufficient as long as they exceed the interest rates charged on Latin America's debt.

A major question is the future of credit_ flows from Western banks. From 1981 through the third quarter of 1984, such flows increased at an average of 7 percent annually, much below the 34-percent average during the late 1970's. A continuation of this slow rate will likely keep internal output and demand below the rates of the 1970's.
Within the region, inflation must be brought under control to help stabilize savings and investment decisions. Inflation is one critical area that has worsened since the onset of Latin America's debt problem. In 1984, inflation, as measured by consumer prices, had nearly doubled 1982's 80 percent.
Much of this acceleration in price can be attributed to a near doubling of money growth, from 72 percent in 1982 to 130 percent in 1984. Perhaps, this monetary uncertainty will subside once the internal banking problems in Brazil, Argentina, and elsewhere stabilize. Until then, however, the region may remain financially unsteady despite improvements internationally. [Art Morey (202) 447-8470]
MEXICO
The Mexican economy is expected to continue to recover from 2 years of recession, albeit at a much slower pace than during the previous decade. This slow recovery, combined with falling real wages and high unemployment, will curb the demand for many commodities, including food. In addition, tight fiscal policies because of the country's serious financial situation will force reductions in food subsidies.
The grain sector will be significantly affected by all these developments because grain consumption comprises a major part of the Mexican diet and grains account for about one-third of the value of all food imports. Furthermore, the United States is the major supplier of grains to Mexico.
Demand for grains has shown a strong upward trend in Mexico since the early 1970's. The increase has been a response to the strong economy, a growing population, and subsidized retail prices. The modest growth in Mexico's grain production has been insufficient to supply its expanding market. This has turned Mexico from a net exporter of
grain to a net importer. As the market grew, the United States increased its sales of grain to Mexico. However, in recent years, growing competition from other suppliers has cut into the U.S. share of this market. The 1982 financial crisis and the ensuing economic recession will shape how Mexico changes its policies to accommodate the new austerity situation.
Trends in Mexican Grain Trade
Prior to the early 1970's, Mexico was a net grain exporter. Today, it is a major importer, averaging 5-6 million tons a year. Grain imports reached 8. 5 million tons during the 1980/81 marketing year, following a severe drought. Although production is increasing, imports tend to follow a production pattern whereby drought occurs in 4 of every 10 years. About one-fourth of the cropland is irrigated, but irrigation depends heavily on rainfall to fill reservoirs.
Of the major imported grains, sorghum has increased most, from an average under 100 tons in the 1970's to over 2 million tons by the early 1980's. By then, corn and wheat imports averaged 3 million and 1 million tons, respectively, but rice has averaged only around 100 tons. Two major droughts during the 1979/80 and 1981/82 crop years have caused wide fluctuations in production and imports of all crops.
For corn, the U.S. share of the Mexican grain market has grown over the past 14 years; for sorghum, it has stayed virtually the same; and for wheat, it has declined (see table). Compared with the U.S. share of Mexico's
The changing U.S. share of Mexican agricultural and grain markets
Year Wheat Corn Sorghum Total
Percent
1970/72 98 82 83 1975/77 64 71 61 1980/82 80 100 91 1983 I 98 97 1984 6 100 85
Sources: O.N.6 Trade Data Summary for Mexico, 1967-77; US A, ERS, U.S. Foreign
58 62 72 88 81
Agricultural trade Statistical Report, various years; S.A.R.H., OGEA, Econotecnia Agricola: Consumes Aparentes de Productos Agricolas, 1925-1982.
s

total agricultural market, the United States has maintained a larger share of its grain market, although the composition of trade has changed.
Canada and Argentina have been selling feed wheat to Mexico in recent years, which has apparently reduced Mexico's demand for imports of other feed grains. Sorghum, most of which is purchased from the United States, has been primarily affected. Argentina competes directly for Mexico's sorghum imports. So far in 1985, Argentina has accounted for over one-third of the announced sales of sorghum to Mexico. Argentina also sold 200,000 tons of corn for April-August shipment.
Currently, all rice and most other coarse grain imports are from non-U.S. suppliers. Asian countries (primarily Thailand) and Costa Rica supplied all of Mexico's rice imports last year, and all barley now comes from Canada.
Characteristics of the Mexican Grain Market
Grains provide more than half of the calorie and protein requirements in the Mexican diet. Based on a 1977 consumer survey, lower income groups spent from one-third to two-fifths of their food budget on cereals, including beans. This group represented about one-third of the total population, now estimated at 76-77 million people. Middle- to high-income groups spent 15-20 percent of their food expenditure on cereals.
Within the cereal category, corn is the preferred grain of the low- to middle-income groups. Only at high income levels does the share of corn in the cereal diet fall below SO percent. The growth in per capita demand for corn has been less than that for wheat since the late 1960's. Wheat products become progressively more important in grain consumption as incomes rise. The growth in demand for rice, the other grain directly consumed by humans, has been relatively stagnant.
The demand for grain sorghum has shown the most rapid growth of all grains, with per capita consumption doubling between the late 1960's and early 1980's. Over 90 percent of sorghum is consumed as feed, primarily for
6
poultry and hogs. Demand for livestock products was stimulated by strong economic growth and by consumer subsidies during the 1970's. The Mexican Government encouraged its country's consumption of livestock products, in particular eggs and milk, to improve the overall diet.
With the population growing at over 3 percent a year during the 1970's, and with real income increasing almost 7 percent a year, l/ demand for grains and other goods grew. Demand for grains that have a relatively low income elasticity, like corn, were carried along by the strong population growth, while those with high income elasticities, like wheat and sorghum, experienced additional growth from the rapid rise in real incomes.
Government food policies also led to changes in grain demand during the 1970's. To keep food costs for low-income families minimal and to reduce inflationary pressures, 2_1 the Mexican Government placed retail price ceilings on several basic food commodities including corn tortillas, wheat bread rolls, and rice. In addition, grain sorghum used for feed was subsidized to mixed feed processors.
Over time, the increase in price-controlled commodities was less than the change in general prices. Except for corn, the increase in the retail prices of grains during 1968-82 was slower than either the Consumer Price Index (CPI) or the Food Price Index (FPI). The annual increase in white bread and rice, for example, averaged 13.3 and 14.3 percent, respectively, while similar rates for the CPI and FPI were 17.9 and 17.6 percent, respectively.
Surprisingly, the real price of corn increased faster than other grains and the general price indexes, averaging 21.8 percent a year. 'JI This contrasted with the Government's philosophy to offer cheap food
ll As measured by compound growth in real GDP.
~/Food and beverage expenditures account for 40-45 percent of total Mexican consumer expenditures.
'J/Based on the price of corn dough which is used to make tortillas, a staple in the Mexican diet.

to low-income families, most of whom consume corn as their principal cereal: so this led to wheat and other grains being substituted for corn, because of both the income factor (higher elasticities) and the price substitution factor.
Recent Economic Trends and Trade Prospects
Over the next few years, cheaper foods could be preferred at the expense of higher priced alternatives. This implies a growing demand for grain commodities, and within the grain complex, an increasing share for corn and wheat, if consumer subsidies continue.
Improving real incomes will encourage the consumption of wheat over corn and promote the demand for feed grains through the livestock sector. With no significant production improvements, reliance on grain imports during the next few years will continue, and perhaps grow, as the Mexican economy recovers from 2 years of recession.
Economic Recovery and Growth in Demand. Significant changes in Mexico's economic prospects have occurred since 1982. To meet the International Monetary Fund's guidelines for its serious foreign debt, Mexico has slowed inflation, reduced imports, limited Government spending, and curtailed foreign borrowing.
The economy showed positive growth signs in 1984. However, economic reform was costly, with high unemployment and falling real wages yet to recover. Government deficit spending has been greatly reduced, but has fallen short of target levels. Partly as a result, inflation has not fallen as fast as expected, reaching 59 percent in 1984.
Although the economy has shown signs of recovery, it will take time to make up for 2 years of economic recession. Falling real wages, high unemployment, and rising prices are constraining demand for consumer goods. Continued import restrictions will contribute to higher prices unless consumption is further subsidized. Under current economic conditions, however, this is unlikely.
Food Policies and Demand. To help meet its austerity goals, the Mexican Government is reducing consumer and producer subsidies. In 1984, controlled prices on corn and wheat
products were increased faster than other commodities to reduce large Government transfers for food subsidies. These were estimated at $1.4 billion, three-quarters of which were for corn tortillas and bread rolls alone. Prices also were raised for electricity and petroleum products, adding to the cost of food production and marketing. The Government wants to eliminate all food subsidies during 1985, except those for corn tortillas and bread rolls. It has already eliminated sorghum and soymeal subsidies to livestock producers.
As a result, demand will probably shift to subsidized grain products and away from nonsubsidized commodities. With price controls on milk and eggs removed, demand could shift to lower priced protein alternatives, such as grains and oilseeds. If corn and wheat products continue to be sold at ceiling prices, their increased consumption will be at the expense of other foods.
Demand for grain sorghum could be more affected by price changes than either of the other two major grains. Demand for sorghum, as well as for other feed components, is directly tied to the demand in livestock products. Improving economic conditions generally favor this demand, but Mexico's livestock industry is slowly recovering from the effects of the recession. The elimination of sorghum subsidies to the mixed feed industry and removing retail price subsidies on eggs and milk (proposed for 1985) will also limit the growth in demand for sorghum, even if real incomes rise.
Grain Production Prospects. Prospects for improving grain production in the near future are not encouraging. Generally the amount of available water limits how much grain area can be expanded. Wheat, rice, and sorghum cultivation rely heavily on irrigation (35-90 percent), but irrigation depends highly on rainfall, which has been erratic.
By the mid-1970's, the big technology advances in enhancing yield appear to have been played out. Mexico is already a major user of fertilizer, chemicals, and improved seed varieties. So further advances are limited. Current policies are also aimed at reducing input subsidies to producers. [Myles Mielke (202) 447-8133]
7

THE CARIBBEAN*
Caribbean economies are holding their own. Slight increases in real GDP will probably be recorded for the Caribbean Islands when final 1984 statistics are published. Growth, however, appears to have eluded several countries for another year, while Cuba, perhaps, is doing better than most. Haiti, Jamaica, and the Dominican Republic struggled with severe financial constraints in 1984, but succeeded in maintaining output. Domestic food production is up slightly but export agriculture and mining remain depressed.
Weather Near Normal in 1984
More normal weather returned to the Caribbean in 1984. Favorable conditions for fall harvests were observed in nearly every country except along the northern coast of South America. But preliminary estimates of total agricultural output did not show as much improvement as anticipated.
Below average precipitation in the Greater Antilles during the first 5 months of 1984 helped the sugar harvests, but reduced some spring cereal and vegetable harvests. Cuba, for example, had a bumper sugarcane harvest, while spring rice yields were well below average. Spring rice and grain yields in the Dominican Republic were also adversely affected. In Antigua, a severe water shortage led to emergency imports of fresh water from Dominica in the spring and summer of 1984.
Above-average precipitation along the northern coast of South America reduced fall rice and sugarcane yields, according to reports from Venezuela and Guyana. Early reports for 1985 suggest normal conditions prevail throughout most of the region, although some excessive dryness was again reported for parts of the Greater Antilles during the January-March quarter of 1985.
Agricultural Outlook Improves Slightly
Except for Cuba, where a bumper cane harvest dominated increases in agricultural
* The nations and territories included in the Caribbean are Guyana, Suriname, French Guiana, and all the islands in and around the Caribbean Sea.
8
output, indexes of total agricultural output remained nearly stagnant in 1984. Continuing market problems for traditional exports, such as sugar and beef, have reduced incentives to expand production and may cause total agricultural output to decline in 1985. Food production for domestic consumption, however, appears to be up in nearly every Caribbean country, as the substitution of domestic food crops for export crops continues.
Per capita food and agricultural output, however, lagged population growth in 1984 except in Cuba, Barbados, and Suriname. Stronger growth in food crop output is expected in 1985 and 1986 because several governments have decided to continue raising producer prices to minimize imports. New opportunities for duty-.free export to the United States, under the Caribbean Basin Initiative, may also have a positive effect on fruit and vegetable production in 1985 and 1986.
Caribbean Agricultural Trade Remains Strong
Caribbean Island imports of agricultural products are dominated by wheat, corn, rice, and oilseed products. Wheat imports have remained close to 2. 0 million tons annually for the past 4 years, with corn imports accounting for another 1.0 million tons. Wheat is imported primarily for direct human consumption, and corn for livestock feed. Import volume is expected to be slightly higher in 1985 because prices will be lower and demand will change little.
Major agricultural exports of the Caribbean continue to be sugar, bananas, coffee, rice, and citrus. Sugar dominates export trade, with about 9.0 million tons annually. Cuba is the primary sugar exporter, followed distantly by the Dominican Republic. About 4.0 million tons annually of Cuban sugar goes to Eastern Bloc countries and another 3.0 million are sold in other markets.
No significant changes are anticipated in exports of these major products for the next year or two. Long-run increases in Caribbean exports, if any, are most likely to occur among minor commodities, such as fruits, vegetables, and nuts, which may be exported to the United States, Canada, or Western Europe.

Major agricultural imports and exports of the Caribbean 1/
Conmodity 1981 1982 1983 1984 2/ 1985 3/
1,000 tons
Imports Wheat 1970 1940 2000 1950 2050
Cuba 1250 1270 1300 1200 1250 Other 720 670 700 750 BOO
Corn 1165 970 995 1000 1040 Cuba 575 400 405 400 400 Other 590 570 590 600 640
Rice 503 481 445 420 440 Cuba 225 250 225 220 230 Other 278 231 220 200 210
Exports Sugar 8593 9171 8367 9200 9080
Cuba 7071 7734 6792 7600 7500 Dom. Rep. 864 816 955 950 940 Other 658 621 620 650 640
Bananas 160 145 165 170 170 Coffee 4/ 53 60 55 60 65 Rice 5/ 173 209 160 180 160 Citrus 6/ 192 200 210 220 240
1/ Except Puerto Rico, the U.S. Virgin Islands, and the French West Indies. 2/ Estimated. 3/ Projected. 4/ Primarily Haiti and the Dominican Republic. 5/ Guyana and Suriname. 6/ Primarily Cuba.
Agricultural Trade with United States Rises in 1984
In 1984, the value of U.S. agricultural exports to and imports from the Caribbean increased. In 1985, both are expected to decrease. Cuba, however, is not a factor because the United States has not traded with Cuba for several years.
Strong demand and higher prices for many tropical products entering U.S. markets in 1984 provided Caribbean countries with enough additional foreign exchange to replenish some basic food and feed reserves.
U.S. imports of Caribbean agricultural products jumped from $470 million in 1983 to $576 million in 1984. Sugar, molasses, coffee, cocoa, tobacco, and fresh fruits and vegetables continue to dominate this trade. These traditional commodities account for 80 to 90 percent of what the United States spends annually on Caribbean agricultural products.
Although higher prices for U.S. grains and oilseed products increased the value of U.S. sales to the Caribbean in 1984, lower prices in 1985, coupled with weaker demand in the
region, are expected to depress sales value 5 to 10 percent in 1985. As of April 1, 1985, U.S. agricultural sales to the region may be off $90 million by the end of the year.
Although droughts, hurricanes, and other natural disasters can quickly reverse short-term trends, the U.S. share of Caribbean agricultural imports and exports has remained relatively constant over the past 10 years. Currently the United States buys about 40 percent of all non-Cuban agricultural exports and supplies about 40 percent of non- Cuban agricultural imports.
Furthermore, no major shifts are expected in U .S.-Caribbean trade in the next few years so long as the United States continues to offer substantial quantities of food aid (P.L. 480 programs) to needy countries. It also appears that U.S. agricultural trade with the region will decline for another year or two before expanding again in the late 1980's. Depressed economic conditions, resulting from the worldwide recession of the early 1980's, have forced all countries to import only essentials until incomes begin to grow again as they did in the 1960's and 1970's. [Dick Brown (202) 447-8133]
u.s. agricultural trade with the Caribbean
Item 1981 1982 1983 1984 1985 1/
Mi II ion dollars
U.S. Exports to Caribbean 843 815 784 844 750
u.s. Imports from Caribbean 637 426 470 576 460
1/ Estimated.
CENTRAL AMERICA
The near-term economic and agricultural outlook for the Central American corm tries will continue to be closely related to military and political developments. The internal political instability being experienced in these countries has greatly aggravated the region's economic problems. Production difficulties, weak balance-of-payments, and tight public finances will likely continue as long as the disruption created by the political problems
9

Agricultural Response to Caribbean Basin Initiative Will Take Time
Even in a "developed nation" such as the United States, accelerated economic development takes time, effort, and money to plan and implement. Predictions of miracles from the Caribbean Basin Initiative (CBI), therefore, have not materialized.
But the President and his supporters in Congr~ss realize it takes many months and sometimes years to test new seeds and fertilizers to build new processing and transportation ' fac!l!t!es,.and to construct warehouse and port fac1 l1t1es 1n any country. That is why CBI supporters asked Congress for a new development program for the Caribbean Basin with a 12-year planning horizon. Statistically verifiable increases in export production, therefore, cannot be expected during the first 3 to 5 years of the program.
In August 1983, Congress enacted the Caribbean Basin Economic Recovery Act (CBERA). This act primarily defines what U.S. Government agencies may or may not do in support of the President's CBI. Leaders in the Basin (Central America, the Caribbean Islands, and the Guiana's) were very disappointed that congressional lobbyists obtained special exclusions from duty-free treatment for sugar, canned tuna, petroleum, clock parts, and a wide variety of leather, clothing, and textile products, because these items were considered to be ones for which production could be expanded most rapidly. The only remaining items for which production can be expanded quickly, therefore, are nontraditional fruits and vegetables, and perhaps selected labor intensive assembly line products.
Although the 12-year duty-free treatment provision of CBERA did not become effective until January I, 1984, several notewor·thy benefits have accrued since the CBI was formally outlined in February 1982. First, U.S. businesses are taking a new look at their opportunities in the region. Second, various U.S. Government agencies have "tooled up" to provide technical assistance to any firm or organization searching for productive options in the Caribbean and Central America. Third, most countries have been inundated with enthusiastic visitors searching for new and viable economic opportunities.
The CBI has therefore successfully created a new sense of enthusiasm and hope among the public and private sectors in the United States and the Caribbean Basin. Successes so far, however, have been limited to a few "success stories," such as
10
U.S. imports of selected agricultural products from Central America and the Caribbean
Agricultural products 1979 1980 1981 1982 1983 1984
Million dollars
Total 1/ 2,085 2,156 I ,865 I ,535 I, 755 I ,918
Bananas Coffee Beef and
veal Sugar Molasses Cocoa Tobacco
Subtotal
Other 21
268 890
308 335
33 126 25
292 739
226 657
31 76 18
360 433
183 636
47 65 20
363 506
165 264
23 68 29
392 400 524 599
133 100 425 429
29 40 65 99 49 72
I ,985 2,039 I, 745 I ,418 I ,617 I, 739
100 (5%)
117 (5%)
120 (6%)
117 (a%)
138 <a%>
179 (9%)
1/ Cuba, Guyana, Suriname, Puerto Rico, and U.S. Virgin Islands excluded. 21 Nontraditional. Source: ERS-USDA Trade Statistics.
new joint-ventures between U.S. and CBI firms, which have been signed, sealed, and implemented.
In a year or two, the anticipated growth may begin to show up in production and trade statistics. However, no statistically significant deviations from trend can be observed in U.S. imports of nontraditional agricultural products from CBI countries since the CBI was first proposed.
Nontraditional agricultural imports from CBI countries showed some signs of growth in 1983 and 1984, but only I or 2 percent. However, these variations could also have resulted from temporary market variations generated by the severe freezes in Florida since 1980, the implementation of the new U.S. global sugar quota in 1982, and other factors. But if the nontraditional subtotal continues to grow by I or 2 percent a year in 1985 and 1986, a stronger case for measuring positive effects of the CBI on Caribbean Basin agriculture may become evident. [Dick Brown and Nydia Suarez (202) 447-81331

persists. Substantial concessional foreign assistance will be significantly weakened by war and political tensions.
Unless political conditions in the region are stabilized, the economic decline is unlikely to be halted. Without economic growth, the social and political pressures underlying the tensions in the region v.rill inevitably increase.
Political Problems Affect Economy
The severe economic, social, and political crises in Central America come from both external and internal factors. The world economic recession, lower prices for the region's major exports, increased foreign borrowing at high interest rates to cover trade deficits, and increased prices of imports are some of the principal external factors that have drained the countries' international reserves, reduced fiscal revenues, and limited international bank credit. In addition, the internal political instability and violence that have prevailed throughout the region have aggravated the economic situation as foreign investors, bankers, and tourists have drastically diminished their activities in these countries.
The civil war in El Salvador and the Sandinista Government in Nicaragua under seige show no signs of cessation. The efforts by counter-revolutionaries to overthrow the Sandinista regime in Nicaragua have brought Nicaragua close to war with Honduras and have severely damaged relations with Costa Rica. In spite of all these problems, five of the seven countries of Central America--Guatemala, El Salvador, Honduras, Nicaragua, and Costa Rica---have participated in the negotiating process launched by the Contadora Group at the beginning of 1983. The Contadora Group (Colombia, Mexico, Panama, and Venezuela) is seeking a nonmilitary solution to the region's problems.
Economic Conditions Improved in 1984, But Serious Problems Remain
Although individual country patterns exhibit some differences, a consistent regional pattern of slowed economic growth has prevailed. Regional growth, which was sustained at impressive annual rates (5-6 percent) during the 1960's and early 1970's, began to falter in 1979, and by 1982, most of
Changes in Central Jl.rrerican real GOP
1977 1979 1982 1983 1984 1/
Percent
Costa Rica 8.9 4.9 --6.9 2.3 3.0 El Salvador --6.0 -1.8 -5.6 0.0 1.5 Guatemala 7.8 4.7 -3.5 -2.7 0.0 Honduras II. 5 6.8 -1.8 -0.5 2.0 Nicaragua --8.4 -26.5 -1.2 4.6 0.6 Panama I • I 4.5 5.2 0.4 0.0
1/ Preliminary estimates. Source: International Monetary Fund, International
Financial Statistics, 1984 Yearbook.
the countries' economies showed negative growth.
Changes in economic growth per capita have been even weaker in recent years. Between 1960 and 1975, however, per capita growth was quite strong, reflecting the dynamism of the world economy and sharply increased regional trade under the auspices of the Central American Common Market (CACM). Costa Rica, El Salvador, Guatemala, Honduras, and Nicaragua established the Common Market in 1960 by signing the General Treaty on Central American Economic Integration.
This abolished all tariffs on merchandise trade among the countries. The most dynamic sector was manufacturing, pushed by the expanded market and industrial development policies created as part of the economic integration process. However, pressures created by balance--of-payments deficits and political disagreements between the countries in 1982 forced some countries to impose trade restrictions upon others, interrupting the regional trading system patronage of the CACM.
Economic activity declined sharply in Nicaragua and El Salvador after 1975. During 1980-1982, economic activity in Costa Rica, El Salvador, Guatemala, and Honduras declined substantially in per capita terms. Only Panama was able to maintain its economic momentum, at least until 1982. However, by 1983, real economic activity declined. The result has been dramatic. In Costa Rica, Guatemala, and Honduras, the absolute levels of real per capita income in 1982 barely equaled that of 1976. In El Salvador and Nicaragua, real per capita
11

income had fallen to the levels of the early 1960's.
The region's current economic crisis is also partly attributable to a number of basic structural problems of the regional economic system. Some of these structural problems are:
• Agriculture dominates the regional economy. In 1983, it generated approximately 23 percent of GDP, accounted for about 52 percent of the region's exports, and employed over 50 percent of the labor force. During the 1960's and early 1970's, traditional
Changes in per capita real GOP of six Central American countries
Annual average
1960- 1970- 1975- 1980-1970 1975 1980 1982 1983
.,
Percent
Costa Rica 2.7 3.4 2.6 -9.2 -I. 7 El Salvador 2.1 2.3 -2.8 -10.6 -2.8 Guatemala 2.2 2.1 2.5 --4.2 --4.7 Honduras 1.5 --0. I 2.5 -4.0 -4.0 Nicaragua 3.7 2.1 -7.7 0.2 0.5 Panama 4.8 1.6 1.5 1.6 -1.0
17 Preliminary estimates.
1984 1/
--0.5 -2.2 -3.5 -1.0 -2.3 0.0
Source: International Monetary Fund, International Financial Statistics, 1984 Yearbook; Inter-American Development Bank; Economic and Social Progress in Latin America, 1984 Report.
Central America--Principal economic indicators, 1983
Per capita GOP GOP CPI* Population
Mi II ion dollars** Do I I arsn Mi II ion
Costa Rica 3,487 I ,465 345.6 2.38 El Salvador 3,324 632 145.3 5.26 Guatemala 9,298 I, 235 I II .9 7.53 Honduras 2,706 665 121.2 4.07 Nicaragua 2,833 I ,090 202.6 2.60 Panama 4,392 2, 164 114.2 2.03
lf 1980 = 100 n = 1982 doll ar·s. Source: Inter-American Development Bank; Economic
and Social Progress in Latin America, 1984 Report. International Monetary Fund, International Finanical Statistics, 1984 Yearbook.
12
•
•
•
exports(coffee, sugar, bananas, cotton, and beef) contributed significantly to growth under favorable world market conditions. However, the small farm sector producing the bulk of the region's food crops did not receive the incentives necessary to increase production and with a regional population growth averaging 2. 7 percent a year, the region's capacity to meet its increasing food demand declined.
Dependence continues on a narrow range of agricultural products for export earnings. In 1983, five products accounted for 65 percent of total export earnings. Coffee alone made up 35 percent. This makes Central America particularly vulnerable to cyclical swings in world commodity prices.
Income distribution in Central America remains sharply skewed. United Nations estimates for Central America undertaken in 1974 indicate that in 1970 the wealthiest 5 percent of the population commanded 31 percent of the national income. The poorest 50 percent, meanwhile, controlled only 15 percent.
The gaps between the richest and the poorest have tended to widen over time. In Guatemala and Costa Rica the real per capita income of the poorest 20 percent of the population fell between 1970 and 1980. At the same time, the share of income going to the emerging middle class increased in most countries of the region.
Current estimates put unemployment at 40-45 percent.
U.S. Agricultural Trade with Central America
The U.S. agricultural trade deficit with Central American countries during calendar year 1984 increased almost 6 percent from the previous year. Despite the turmoil, Central American agricultural exports to the United States remain high. Unlike most U.S. trading partners, all seven Central American countries can claim a favorable balance of trade with 'the United States.

Nevertheless, Central America continues to count on the United States as both buyer and seller. U.S. agricultural imports from Central America equal about 10 percent of the total U.S. agricultural imports, but about 40 percent of Central America's agricultural exports. At the same time U.S. agricultural exports to Central America represent only 1 percent of total U.S. agricultural exports, but about 40-45 percent of Central America's agricultural imports.
U.S. farm commodity exports to Central America advanced only 2 percent from calendar year 1983's low of $380.3 million, to $387.5 million in 1984. Exports to Belize, El Salvador, Guatemala, and Honduras were up considerably. However, exports to Costa Rica, Nicaragua, and Panama showed a 50-percent decline.
Gains in U.S. imports from Belize, Costa Rica, Guatemala, and Honduras more than offset declines from El Salvador, Nicaragua, and Panama. Total agricultural imports jumped from 1983's high of $1.299 billion to $1.357 billion in 1984.
The increase in the value of 1984 U.S. agricultural exports to Central America was mostly the result of a higher volume of exports instead of higher prices. However, the volume of grain (especially rice and corn) exports to Costa Rica and Honduras fell appreciably, reflecting harvest recoveries in these two countries from the 1983 drought. Other major exports to this region are oilseed cake and meal, fruits and vegetables, fats, oils, and greases (primarily tallow).
The rise in the value of U.S. agricultural imports from the region was due to higher prices offsetting volume declines for many products. Coffee, bananas, sugar, and beef accounted for almost 90 percent of total agricultural imports value in 1984.
U.S. agricultural exports to El Salvador, one of our major agricultural markets in Central America, totaled $100.9 million in 1984, up 17 percent from the previous year, accounting for about 26 percent of total agricultural exports to the region. El Salvador's share of U.S. agricultural exports to the region has increased in the last few years due to increases in P.L. 480 aid. Wheat,
oilseeds, oilseed products, and tallow were the main products exported to El Salvador.
The outlook for agricultural trade between the United States and Central America in the next few years is filled with uncertainty. Reasons are the political controversy between countries, differences in political ideas between the United States and Nicaragua, and continuing problems of inflation and balance of payments.
The trade sanction just recently imposed by the United States on Nicaragua reduces the potential Central American market. The sanction will have little effect on the U.S. economy. However, the already fragile Nicaraguan economy could be impacted. Nicaraguan exports to the United States are primarily agricultural, but levels have been declining since 1980 and alternative buyers have been established.
U.S. exports to Nicaragua are primarily nonagricultural but include a high proportion of agricultural inputs such as fertilizers, seeds, insecticides, and machinery. Replacing suppliers for some of these items could be a problem for Nicaragua.
U.S. exports to this region for 1985 may decline to $350 million. [Nydia Suarez (202) 447-8133]
ANDEAN COUNTRIES
U.S. agricultural exports to the Andean countries (Venezuela, Colombia, Peru, Chile, Bolivia, and Ecuador) are expected to level off at $1.5 billion in 1985. Wheat, feed grains, oilseeds, and products will continue to be the principal U.S. exports to the Andean countries. The projected increase in agricultural production in 1985, following the rebound of 1984, will lead to increased overall food supplies in the region, and reduced import needs.
Domestic demand will still be driven mostly by population growth, because per capita real income is expected to increase in only two of the six Andean countries. The weak balance of payments and the restrictive import policies put in place to improve balance of payments will continue to limit imports for most of these countries.
13

Economic gr·owth in Andean countries
Annua I gro1·dh in rea I GOP
1984 1985
Venezuela -I. 7 I Peru 2.1 3 Ecuador 3 2 Bolivia -5 -3 Chile 6 5 Colombia 3 3
Source: Foreign Agriculture Service, Annual Attache Reports and ERS estimates.
Economic Situation Generally Improves
The Andean countries generally showed some limited growth in real income in 1984, although some, like Bolivia, continued their downward slide. The 1985 outlook for most of these countries is for somewhat higher growth, but it may not match population growth.
The balance of payments has continued to limit import capacity for most Andean countries. These countries have already limited imports to favorably balance their trade. This year, increased export earnings have also improved their trade balances. Repayment of the foreign debt continues to drag down their import potential, although the rescheduling of debt by most has relieved some of the pressure that debt service alone had put on them.
ln Venezuela, public debt has been restructured, but not private debt. Chile has signed a letter of intent to meet the financial targets it had agreed upon with the International Monetary Fund (lMF), but February negotiations were interrupted by the resignation of the Minister of Finance. The lMF has frozen disbursements of new money to Peru since the nation failed to meet its agreed upon target for mid-1983 debt restructuring.
Crop Production
ln 1984, the Andean region's agricultural output was 5 percent higher than in 1983, mostly because of better weather and increased price incentives to farmers. The region harvested larger corn, rice, wheat, and barley crops, increasing overall food supply sharply.
14
Total cereal output of 9.4 million tons is 15 percent higher than last year. Oilseed and product output rebounded in 1984 and is expected to be up again in 1985. Cotton is also coming back for a regional total output of 1.1 million bales, after several years of decline associated with weak world market prices and more profitable alternative crops.
Among export crops, cocoa beans and bananas have increased as the producing countries recovered from El Nino, but coffee production declined slightly because of poor growing conditions in Colombia. Among livestock products, poultry is back on trend in most c01mtries.
Several developments in Andean agricultural production are noteworthy.
• Peru's and Bolivia's agricultural production did increase, but no higher than during the late 1970's. So per capita production has declined. The 1985 Peruvian rice crop may also be lower because of a decline in area planted.
• ln Colombia, the Cauca Valley had abnormally heavy rain in November, causing a decline in the corn, rice, and sorghum crops harvested in December 1984 to January 1985. About 20,000 to 40,000 tons of grain sorghum and 20,000 tons of soybeans may have to be imported to fill this short-term production gap. Total soybean and sorghum imports are expected to be 85,000 tons and 100,000 tons, respectively.
• ln Venezuela, the dry season was prolonged but the rainy season that usually ends in October extended into December. While corn and sorghum overcame the drought, rice production declined 9 percent. Venezuela, however, will draw down stocks rather than import.
• Chile, the only noteworthy wheat producer, continues to expand its production, having gone from 850,000 tons to over 1 million tons. The outlook is for 1.25 million- tons in 1985. Increases in producer prices and other Government policies to encourage production have led to this continued sharp increase.
Andean Agricultural Imports
The Andean countries will probably import less in 1985 than in 1984. Improved production and limited economic growth are curbing import needs, with Venezuela, the dominant market in the region, probably importing $1.2 billion compared with $1.3 billion in 1984.
The region's wheat imports are expected to decline 10 percent, to 3.8 million tons, mostly because of Chile's drive toward self-sufficiency in wheat. Chile's wheat imports are expected to drop from 1 million
tons to 700,000 tons. Regional corn imports remain at 1.8 million tons. Sorghum will increase to 400,000 tons as Venezuela, the principal importer, continues to increase poultry production with domestically manufactured feed.
Oilseed and oilseed product imports will also decline because of increased domestic output in most countries. Chilean and Peruvian fish meal exports and Argentine and Brazilian soybean product exports are limiting the potential of U.S. soybean exports to the Andean countries.
El Nino
The coastal region between northern Peru and the equator is often described as a zone of conflict between genuinely warm waters from the north and the cool Peru coastal current from the south. The warm waters advance farthest south during the Southern Hemisphere's summer season.
At irregular intervals of several years, however, the warm equatorial counter current advances unusually far south along the coast of Peru, displacing the normally cool coastal waters. This southward invasion of warm water, the El Nino, appears to be associated with large-scale atmospheric anomalies. Rainfall patterns are disrupted so that normally dry areas are inundated with spells of torrential rain and accompanying severe flooding and erosion. But rainfal I in other regions is simultaneously reduced, causing drought.
El Nino occurrences have been documented as far back as 1891. Over the past 30 years, El Nino events occurred during 1957, 1963, 1965, 1969, 1972/73, 1975, 1976, and 1982/83. The 1972/73 episode was particularly intense for 2 consecutive years, but the recent 1982/83 El Nino event was as bad, if not worse. During this recent season, drought afflicted much of Mexico, southern Peru, and Bolivia while torrential rains caused serious flooding in northeastern Argentina, southern Paraguay, northern Peru, and Ecuador.
Large-scale regional effects are associated with the occurrence of an El Nino event. Often, the wet El Nino year in Ecuador and northern Peru occurs simultaneously with a drought in northeast Brazil, two regions separated by a broad continent. Rainfal I variability is extremely high in northeast Brazil.
The link between the two areas of abnormal weather appears to be found with the Intertropical Convergence Zone, which is a major rainfall producing mechanism of the tropics. The position of the zone deviates from its usual location, which is normally only a few degrees south of the equator during summer months. During abnormal years, the zone is situated farther south of the equator in Peru and north of its usual position in the western South Atlantic, off northeast Brazil.
Consequently, wetness and floods characterize the weather in Peru while intensified drought
occurs in northeast Brazi I. The result can devastate agriculture because rains may fail completely for an entire year or may occur sporadically during critical crop growth phases. This is what happened in northeast Brazil in 1982/83 when corn yields dropped about 60 percent from the year before.
El Nino wil I reappear randomly during the next several years. When it does, sharp deviations from production trends can be expected, with consequential impacts on agricultural consumption and trade. [Ray Motha, WAOB (202) 447-57161
Guayaquil SeasonaP and El Nino Precipitation Percentile ranking 100
~ f * .. .. . :: f: 80 ,_ I .. .. .. .. .. . . . . . . . . . . ~ .. . . . . . . . .
$ : : : . . : . . . . . . . 60 Lm :: :
I~ • • •
40
20
0
~ : : i : . . . .. . . . . .. . ~= : : , .. . . .. . . $ ::
eEl Nino year
. . . . ... : ·. : . .
•.. : \ : . . . . . . . . . . . . ··~
11 December-May
. . ~ t f . .. . . .. . . .. . . . . . . . . . . . . . . . . . . . . . : : . _:_ . . . . . . . . . . . . . . :: :: .. .. : : . . :
. . . . . . . . . . .. . . .. .. . . .. .. .. .. . . . . .. ..
. . . . . . . . . . . . . . . .. . . . . . . . . __:__ . . . . . . . . . . . . . .. . f .. l
I
1950 1955 1960 1965 1970 1975 1980 This graph presents the seasonal (December through May) rainfal I pattern, in terms of percentile rankings, reported at Guayaquil, Ecuador, for the past 33 years (195!-83). High rankings represent wet episodes. Years with rainfal I rankings above 70 percent were associated with El Ninos. These show that wet episodes occur about once in every 3-4 years. The most extreme recorded occurrences have been 2-10 years apart. However, the more persistent and unusually severe El Nino episodes, which are responsible for global implications, exhibit large fluctuations in intensity, area coverage, and duration. The highly variable nature of this ocean-atmosphere anomaly makes it impossible to predict.
15
In addition to production changes affecting the outlook for U.S. agricultural exports, other significant changes are occurring.
• The competition for U.S. grain export markets in the Andean countries is changing. Peru has already bought 700,000 tons of wheat from Argentina, and Bolivia, 45,000 tons since October 1, 1984.
• While Colombia and Venezuela have had poor rice crops, they will draw from large carryover stocks rather than import.
• The major dampening factor in the Venezuela market is the new set of official exchange rates. Grains and oilseeds have been imported at the preferential exchange rate of 4.3 bolivares per dollar, but will be subject to a 7 .5-bolivares-per-dollar rate at the end of 1985.
• Venezuela's corn imports from the United States could increase. Venezuela is seeking alternative supplies of yellow for white corn since South Africa, its major supplier, has limited supplies for export. Venezuela's soybean meal imports from the United States also remain strong.
• Ecuador will expand the use of imported feed grains as it continues to develop its fresh water shrimp industry.
• Devaluations have changed relative prices between countries. This has led to reversals in trade patterns in border areas. Venezuela, for example, no longer imports live cattle from Colombia, and its vegetable oils, poultry, and feeds are now flowing into Colombian markets. Colombia has also become a new market for Ecuadorean wheat, barley, fats, and oils.
Many of the Andean countries have positive balances of trade with the United States because of tropical product exports. Exports of bananas and cocoa beans are expected to be larger in 1985 as Ecuador, the principal producer and exporter, gets its production back on trend. Coffee exports are staying up, despite production shortfalls in
16
Colombia, the region's principal producer. Coffee stocks are being drawn down to supply exports. Cotton exports are triple 1984's as production increases in Colombia and Peru.
New products are becoming major export items for the Andean region: fresh water shrimp from Ecuador, fresh deciduous fruits from Chile, soybeans and products from Bolivia.· These products are joining the ranks of such nontraditional exports as fresh flowers from Colombia. Sugar, coffee, and cocoa beans, however, are still the region's major agricultural export earners. Coca and marijuana are major illicit foreign exchange earners of the region although the exact amount of earnings from these products is not known. [Chris Bolling (202) 447-8133]
ARGENTINA
Sluggish Economy and Farm Sector
Economic growth and agricultural output in Argentina have not declined, despite serious economic problems. The economic outlook is little changed from a year earlier and calls for continued slow growth and high inflation. In 1984, the economy grew at 2.8 percent and inflation at 700 percent.
Area harvested was down in 1985, reflecting sluggishness in the farm sector and poor weather during winter wheat planting in June. However, estimates indicate that crop production was up 8 percent with a 2-percent decrease in area offsetting a 10-percent increase in yield. Forecasts for 1985 put exports up 12 percent at 29.5 million tons, compared with 26.3 million in 1984/85. Next year's crop area is forecast to increase by about 3 percent, reflecting increased planting of wheat, sunflower, soybean, and corn. Production, however, is expected to be down slightly, reflecting a return to normal yields.
Crop and Livestock Production in Transition
Argentina has nearly 20 million hectares in field crops, up almost 9 percent since 1982. Grain area has been decreasing for the last 2 years, with wheat dropping 20 percent since 1982. Some of the grain decrease has been offset by a SO-percent increase in oilseed

Argentine grains and oilseeds: Area, yield, and production
1982 1983 1984 21 1985 3/ 1986 4/
Harvested area (mil lion hectares)
Grains 5/ 12.6 13.9 13.4 12.4 12.6 Oi I seeds 6/ 5.0 5.5 6.2 6.8 7.1 Total 17.6 19.4 19.6 19.2 19.7
Yield (tons per hectare)
Grains 2.1 2.4 2.3 2.7 2..5 Oi I seeds 1.5 1.4 1.6 I. 7 1.6 Total 2.0 2.1 2.1 2.3 2.2
Production (mi II ion tons)
Grains 27.0 33.5 30.3 33.1 32.0 Oi I seeds 7.3 7.7 10.3 11.1 II. 3 Total 34.3 41.2 40.6 44.2 43.3
1/ Year beginning in December (t-1) for wheat, flaxseed, oats, barley, and rye-- all harvested in December, and year beginning March/April (t) for corn, sorghum, sunflower, soybeans, etcetera which are harvested in March/April: where t = year. 2/ Preliminary. 3/ Estimate. 4/ Forecast. 5/ Mostly wheat, corn, and sorghum. 6/ Mostly soybean, sunflower, and flaxseed.
area, to soybeans and sunflowers. Moreover, the practice of double-cropping soybeans with wheat is diminishing.
The decrease in double-cropping explains some of the overall area decline in recent years. Soybeans are usually 80 percent double-cropped with wheat, but early planted soybeans are beginning to compete for wheat areas in northern Buenos Aires and southern Santa Fe provinces. Wheat area might also diminish in some of the single-crop regions of south--central Buenos Aires, due to competition from higher yielding sunflower varieties.
Despite lower wheat area, yields may stabilize wheat output. The Government has implemented programs to improve yields and increase crop technology, particularly in fertilizer applications for wheat.
Argentina has a large cattle herd, but most of it is fed on pastures. So only one-third of the country's feed grain production is used domestically. Pastures account for nearly 20 million hectares in the fertile region known as the humid Pampa.
These pastures could easily be converted to crop production, representing a potential doubling of Argentine crop output. Cattle inventories, however, are forecast to increase over the next several years, so cropland expansion into pasture areas is not expected. Conversely, improvements in pasture carrying-capacity should keep croplands from being converted to pastures.
With the Government seeking to increase crop technology, competition has increased for pastures, adding volatility to the beef and veal outlook. Moreover, EC export subsidies have reduced prices and demand for Argentine beef exports.
U.S. and Argentine Market Shares
Argentina is a major farm competitor with the United States, exporting many of the same crops. It is second only to the United States in coarse grain and raw soybean exports, and it ranks fourth in wheat exports after the United States, Canada, and Australia; fifth if the European Community is included as a single exporter.
Although Argentina and the United States are major farm competitors, both nations share an interest in developing free trade in
Crop
Exports of selected crops from Argentina, U.S., and world, 1983/84-1984/85 average 1/
Argentina U.S.
Mi II ion tons
World
Wheat 8.1 39.2 104.2 Rice 0.2 2.1 12.1 Coarse grains 10.8 57 .I %.3 Oi I seeds 2/ 3.2 21.2 33.0 0 i I seed mea I 21 4. I 4.7 29.7 Ve~etable oi I 3/ 1.5 I. 7 14.5 To al 27.9 290.0 298.8
1/ Excludes intra-EC trade. Local Argentine marketing year; (t) for wheat, and (t+l) for rice, coarse grains, oilseeds, and oilseed by-products -- where t = year. This convention is used for comparing southern hemisphere crop exports with U.S. crop exports. Local U.S. marketing years for the United States and the world, except for wheat (July/June), and rice (calendar year). 2/ Soybeans, cottonseed, peanuts, sunflower, flaxseed. 3/ Includes oil from the following: corn, soybean, sunflowerseed, flaxseed, cottonseed, peanuts, and other vegetable and marine oils. For the U.S. and Argentina; net exports of vegetable oils.
17

agricultural products. This position distinguishes Argentina as a relatively free-trade exporter.
Argentina is aligned with the United States in its opposition to EC export subsidies for beef and grain. Still, the United States is concerned with Argentina's use of export tax differentials for oilseeds, taxing oilseed product exports at a lower rate than unprocessed oilseeds. Because oilseed crushers benefit, an indirect subsidy results for exports of vegetable oils and oilseed meals (see special article, "Shifts in Soybean Production in South America").
For its part, the Argentine Government has openly criticized U.S. export credit (GSM-102) and food aid (P. L. 480) sales to third country markets, claiming they subsidize U.S. wheat exports. This is particularly true of U.S. exports to Chile and Brazil where Argentina wants a greater market share. Meanwhile, the United States holds that export credit guarantees are needed to help offset price undercutting by competitors and that the guarantees cover commercial credit sales and do not distort market prices.
Grain, Oilseed, and Oilseed Product Markets
In recent years, Argentina has expanded its share of the Latin American wheat market and reduced its dependence on Soviet buying. For 1983/84, (Dec./Nov.), Argentina exported nearly 2 million tons of wheat to Latin America, up from about 400,000 tons in 1980/81. Sales to the Middle East were also near 2 million tons, up from about 400,000 tons in 1981/82.
Meanwhile, the Soviet share of Argentine wheat exports fell from a high of 75 percent in 1980/81 to a forecast 25 percent in 1984/85. In 1984/85, the People's Republic of China is expected to import about 700,000 tons of Argentine wheat, compared with none in 1983/84 and 3 million tons in 1982/83.
For the last 3 years, Argentina has exported about 5 million tons each of corn and sorghum. However, export projections for 1985/86 reflect a considerable shift to corn exports (8.6 million tons) with a concurrent decline in sorghum exports (3.3 million tons). This shift is due to a lower sorghum/ corn price ratio.
The major markets for Argentine coarse grains include the USSR, Japan, Iran, Spain, Italy, Germany, Cuba, and Venezuela. The long-term agreement with the USSR calls for 4 million tons of corn and sorghum annually, but it will expire in December 1985. Japan's coarse grain purchases are almost exclusively sorghum: more than 2 million tons in 1984/85 (Mar./Feb.). Iranian purchases, on the other hand, are almost all corn: about 1 million tons in 1984/85.
Oilseed product exports from Argentina are expanding rapidly, from 2 million tons in 1981/82 to a forecast 6 million tons in 1985/86.1/
l/ For oilseed products, marketing year 1985/86 is equivalent to the year beginning December 1984 and ending March 1986, to represent one marketing year for flaxseed (Dec./Nov.), sunflower, cottonseed, and peanuts (Mar./Feb.), and soybeans (Apr./Mar.).
Argentine exports by destination: 1983/84-1984/85 average 1/
Wheat Corn/sorghum Soybeans }_/ Vegetable oi Is 0 i I seed mea I s Total
East Europe USSR
4,032 4,210
395 260 290
9,187
West Europe
139 1,615 1,565
209 I, 971 5,499
Asia
1,852 1,977
35 81 82
4,027
Latin America
1,000 tons
I, 314 956 183 215 194
2,862
Middle East North Africa
1,448 I, 105
46 160 281
3,040
Total 21
8,863 10,427 2,235 I ,159 2,864
25,548
1/ Averaging Argentine local marketing years: (t-1) for wheat and (t) for corn, sorghum, and soybean; where t =year. Avera~ing calendar year 1983 and Jan/Sep 1984 for vegetable oils and oilseed meals. 2/ Includes other desttnations, in Africa. 3/ Soybeans represent about 92 percent of Argentine raw oilseed exports, for the period average.
18

Most of the increase is coming from soybean meal. These exports are forecast at 2.8 million tons for 1985/86, up from less than 1 million in 1981/82. Export tax incentives for soybean crushers have caused soybean meal exports to expand rapidly and lower the amount of raw soybeans available for export.
Overall, exports of oilseed products are double those of unprocessed oilseeds. Nearly 100 percent of the Argentine sunflowerseed, flaxseed, cottonseed, and peanut crops are crushed domestically, compared with only
Comparing Argentine and U.S. Crop Prices
The difference between Argentine and U.S. grain prices indicates how much the two countries can compete with each other in world markets. However, making such a comparison is not a straightforward procedure. Each country has several different price levels (wholesale vs. export, for example). In 1984, Argentine wholesale prices were about 75 percent of export prices, while U.S. wholesale prices were about 90 percent of the export price.
The Buenos Aires wholesale crop price is useful in measuring Argentine producer prices because it is near what the farmer receives. It should be compared only with the relevant U.S. wholesale price. To do this, use the official Argentine exchange rate to convert the Argentine peso price into to a $U.S. dollar equivalent. In 1984, Argentine wholesale prices were about $45 a ton less for wheat, $30 less for corn, and $90 less for soybeans than were U.S. wholesale prices.
The wholesale price differential gives some indication of the differences in farm costs and r·eturns to crop production in the two countries. However, it does not reflect the difference in grain prices that each country uses in world trade. In 1984, Buenos Aires export prices were about $20 a ton less for wheat and soybeans, and $8 a ton less for corn than U.S. Gulf prices. Argentine crop exports are discounted to offset higher transportation costs from South America to the major markets, including high demurrage costs.
High export taxes are levied on Argentine grain before it reaches the international market. This accounts for the 25-percent margin between the who I esa I e and export prices. Argentine expor·t tax rates are not based on Buenos Aires wholesale prices or on export prices. Instead they are tied to U.S. prices. The Argentine Government specifies a "reference price," which is based on U.S. dollar prices. The Government then applies an export tax that is a percentage of the exported commodity's reference price. Although the reference price and the application of export taxes d i stor·ts the exchange va I ue of export earnings, these distortions are reflected in the wholesale price, so the official exchange rate should be used to convert the Argentine peso prices to a U.S. dollar equivalent.
about 50 percent for soybeans. Soybeans account for about 90 percent of Argentina's raw oilseed exports. Raw oilseeds and oilseed product exports averaged 2.4 and 4.8 million tons, respectively, for 1983/84- 1984/85. Raw soybeans and soybean product exports averaged 2.2 and 2.5, respectively.
Soybean exports to Western Europe averaged roughly 1.6 million tons for 1983/84-1984/85, or about 70 percent of total soybean exports from Argentina. Western Europe also accounts for about 70 percent of Argentine oilseed meal exports, that is, about 2 million tons annually, including roughly 800,000 tons each of soybean meal and sunflowerseed meal. Argentine vegetable oil exports are evenly distributed over several regions of the world.
Export Outlook for Argentine Grains and Oilseeds
Over the next few years, the volume of Argentine crop and byproduct exports is expected to increase despite low producer prices, tight credit, a poor investment climate, and vintage transportation and port facilities. The farm sector in Argentina accounts for only 15 percent of GDP, but farm exports account for about 70 percent of export earnings and 20 percent of federal revenues. So, the Government is promoting farm exports and generating a trade surplus of about $4 billion annually to pay foreign debts and reduce fiscal deficits.
Government programs designed to increase crop technology will result in higher yields. Also cropland could expand if pastures for beef cattle are reduced, but this is not expected. In December 1983, the Government reduced import tariffs and taxes on fertilizer, herbicides, and pesticides. This year's record wheat yield was helped by a 50-percent boost in fertilizer use (to 98,000 tons of nitrogen). Use in 1985 is projected up an additional 40 percent. Nonetheless, only 15 percent of Argentine wheat area is fertilized (compared with 75 percent for the United States) and it may take a few years before the benefits of higher crop technology are realized.
Despite lower prices for farm inputs, Argentine crop exports are subject to burdensome export tariffs, about 25 percent of the export price. Export taxes account for the
19

Argentine crop prices, 1984 1/
Crop Period Domestic 2/ Export 3/
($U.S. per metric ton)
Wheat Dec/May 97.26 132.83 Corn Mar/Aug 101.27 138.67 Sor~um Mar/Aug 74.71 107.67 Soy an Apr/Sep 179.20 258.00
1/ Average price for the first half of the marketing year in Argentina, since this is when most of the crop is sold. For wheat the year begins in December 1983. During the last two marketing years, 78 percent of total ~heat exports occurred during the first 6 months; 81 percent for corn and sorghum, and 90 percent for soybeans. 2/ The wholesale peso price in Argentina converted to $US dollars, using the official exchange rate. 3/ Export price, FOB, Buenos Aires.
25-percent margin between export and wholesale prices. Low domestic prices, in turn, reduce the level of farm technology, farm yields, and farm exports. [Jorge Hazera (202) 447-8133]
BRAZIL
Brazilian crop production increased in 1984 and is increasing in 1985, especially in export-oriented commodities. Livestock production has fallen, primarily due to weak domestic demand. G DP growth in 1984 was concentrated in the export sectors and real wage rates continued the decline of the previous year.
Improved, but less than ideal, weather permitted a sharp recovery in crop production and exports in 1984. However, meat demand fell, causing the livestock sector to decline about 10 percent. Overall, the value of agricultural production increased nearly 4 percent and agricultural exports increased over 16 percent. Prices favored export crops, but production of grains for domestj.c consumption also increased.
In 1985, the production trends evident in 1984 will likely continue. Livestock production will be less dynamic than crop production, especially export crops. However, domestic demand may play a greater role in 1985 G DP growth, although per capita growth is likely to be small. Political changes in 1985
20
are likely to alter the agricultural policies that will shape crop production in 1986.
Crop and Livestock Production
Except for coffee, cocoa, and manioc, major Brazilian crop production increased in 1984. Corn (1.5 million tons) soybeans (O.S million tons) and rice (1.2 million tons) posted major increases. Prices for frozen concentrated orange juice (FCOJ) increased at the same time that orange production increased--over 5 percent. A greater percentage was frozen, and F C 0 J production increased over 40 percent. In 1985, a smaller corn crop will be offset by greater coffee and cotton crops, and continued expansion of soybean and F C 0 J production.
Sluggish domestic demand for meat has combined with saturated export markets to decrease livestock production. In 1984 production fell for all major meat categories. Increased processed beef exports cushioned the decline in beef and veal (-8 percent). Reduced broiler exports pushed poultry production down as fast. Pork, milk, and eggs all suffered from poor domestic demand. Some recovery is likely in 1985, but production will probably not return to 1983 levels. A stagnant livestock sector indicates continued reduced domestic demand for feed grains and soybean meal.
Domestic Consumption
Although exports led Brazilian GDP in a modest recovery for 1984, real wage rates did not recover. Despite some increase in employment, per capita consumption expenditures probably fell. Food consumption of most marketed commodities declined. However, better weather increased food supplies, especially in the poverty stricken northeast, where there are many subsistence farmers. Wheat imports increased because subsidized bread remains the cheapest food available to the urban poor.
Agricultural Exports
Coffee exports ($2.8 billion) were Brazil's largest foreign exchange earner in 1984, while soybeans and products ($2.6 billion) fell to second place. However, the value of orange juice exports more than doubled, reaching $1.4

billion and accounting for most of the increase in agricultural exports.
In 1985, continued low prices for soybean meal may limit that sector's export revenue increases. Quality problems during early 1985 have complicated coffee marketings. However, FCOJ prices and production remain high. Cotton exports will increase. On balance, Brazilian agricultural exports in 1985 may again reach $10 billion, but are unlikely to exceed 1984's record $10.5 billion.
Policy Changes Likely in 1985
Changes in Brazilian agriculture in 1985 may not be caused by production problems or trade flows, but by political change. Twenty years of military rule ended in March 1985 when a civilian Government assumed power. However, President-elect Neves's illness and death contributed to continued delays in decisionmaking. A consensus on a new agricultural policy has not yet occurred.
As the new Government assumes control, changes in Brazilian agricultural policy appear likely. Over the last 3 years, austerity measures have reduced support for agriculture. However, a maxi-devaluation in 1983 did stimulate foreign demand for most Brazilian export crops. The civilian Government is committed to increase domestic food supplies through greater agricultural production at the same time it maintains the debt service. Existing policy instruments cannot meet these objectives, so new tools are probable. However, without the strong leadership of Neves, some agricultural groups may resist radical changes.
Debt Service Depends on Agricultural Exports. Brazil's trade surplus, $12 billion in 1984, is a major source of foreign exchange; it is also allowing Brazil to pay the interest on its over $100 billion external debt. Alternative sources are limited. Major additional borrowing would exacerbate the long-term problem. Because the Government has pledged to service the international debt, large trade surpluses must be maintained.
Agriculture generates a large portion of Brazil's exports. Over the last 10 years, agriculture's share of exports has fallen from roughly 60 to 40 percent, because exports have diversified. Although coffee bean exports
topped the list in 1984, agricultural exports have also diversified, with FCOJ exports a good example.
World commodity price developments largely determine export revenues. Diversification can be stabilizing. For example, in 1984, exceptionally high prices for orange juice partially offset low prices for sugar and soybean meal. However, real agricultural commodity prices have historically trended downward, and are expected to remain low in the foreseeable future. Greater export volumes will have to generate the needed foreign exchange.
Political Commitment to Increase Food Production. During his campaign, Neves made promises to make more food available in Brazil. Despite the substantial wealth of Brazil, a skewed income distribution leaves many Brazilians undernourished. Most estimates measure malnutrition in the scores of millions. The politicians now taking control of Government will likely be more sensitive to hunger than their military predecessors. Even though Neves has died, his stance on food supplies will carry weight.
Neves also pledged to make expanded agriculture a "top priority." This has been repeated by major economic appointees throughout the Government. The new minister of agriculture is a politician from the rural State of Rio Grande do Sul, reinforcing the profarmer stance. Increased emphasis on crops for domestic consumption combines the profarmer and antimalnutrition policies.
Recently, corn and rice farm prices have been below import prices , so support prices for these crops can efficiently be increased in 1985/86. However, the maxi-devaluation in 1983 made export crops (soybeans and cotton) very attractive, so a large corn price increase would be needed to switch area back to corn. To avoid the obvious problems of reduced production for export, the new Government says it will try to provide sufficient incentives to agriculture to expand total planted area.
Budgetary Constraints. Fighting inflation, now running well over 200 percent, is also an important objective for the Brazilian Government. Monetary and fiscal budgets are being reigned in. The general tightening of
21

credit hurts those in agriculture as well as other users of commercial credit.
Moreover, one of the first acts of the new Government was to freeze the budget. In such an environment, expensive programs to encourage agricultural production are not possible.
Monetary Reform and Agricultural Credit. The "monetary" budget is the source for subsidized agricultural credit. The Bank of Brazil (a commercial bank) has open lines of credit with the Central Bank. These were not effectively controlled or monitored, so it was painless to extend subsidized credit to agriculture through the Bank of Brazil, because the cost was not clearly defined.
Reorganization and control of the monetary budget has and will continue to reduce the supply of easy credit. This font of easy credit has been a most effective policy tool encouraging past agricultural development, but will no longer be an attractive alternative.
A New System of Agricultural Stabilization and Support Possible. The stated policy objectives of the Brazilian Government include:
• Fighting inflation through reduced government deficits;
• Servicing foreign debt with trade surpluses, including agricultural exports;
• Reducing malnutrition through increased supplies of domestic food;
• Supporting expanded area and production in agriculture; and
• Moving towards a free market for major field crops.
22
Previous incentives to agriculture tended to violate some of these policy objectives. Subsidized credit is inflationary and who it goes to is often discriminatory. Tax credits for exports increased budget deficits, contributing to inflation and encouraging export crops at the expense of crops for domestic consumption. Export quotas and tax barriers denied farmers access to world markets.
Some components of what appears to be a new system have been introduced. Free trade in soybeans, cotton, and corn, subject to safeguards to be announced later, was implemented in August 1984. The safeguards would not need to be announced unless conflicts of interest arise during the marketing of the 1984/85 crop. Neves' death has contributed to the delayed decision.
Major proposals from the Brazilian Government's financial agencies, trade institutions, and international agencies include systems of variable levies or Government intervention stocks set in relation to world prices (as stabilized by U.S. programs) so as not to be too expensive. Such a radical change is opposed by some in the ministry of agriculture who prefer traditional support prices and subsidized credit.
As long as austerity measures limit the transfer of resources from the Government to the agricultural sector, Brazilian policy changes are unlikely to increase competition with U.S. crops sold on the international market. However, Brazilian farmers are reluctant to move toward free trade while commodity prices are low and some competitor policies, especially in the EC, subsidize exports. [Ed Allen (202) 447-8133]

SHIFTS IN SOYBEAN AND SOYBEAN PRODUCT EXPORTS FROM SOUTH AMERICA
Ed Allen Jorge Hazera 11
Abstract: Brazil and Argentina are increasing soybean production, and exports of soybeans and products will also increase. Brazilian policy is allowing soybeans greater access to the world market, increasing bean exports. However, Argentina has implemented differential export taxes which encourage exports of soybean meal and oil at the expense of soybeans. The Argentine and Brazilian policies offset each other, and in 1985, exports from South America will increase for both beans and products.
Keywords: Soybeans, soybean meal, policy, differential export taxes, Argentina, and Brazil.
The United States exports about 24 million tons of raw soybeans and soybean products each year. Exports from South America are about 15 million tons. Brazil is the world's largest exporter of soybean oil and meal. Argentina and Paraguay are large soybean exporters. Changes in Brazilian and Argentine farm policies affect the production of soybeans and their products, impacting on the U.S. soybean industry. These policies can also affect the composition of soybean exports, that is, soybeans versus soybean oil and meal.
Brazilian trade liberalization in 1984 increased soybean producers' access to world market prices as soybean meal prices fell relative to soybeans and soybean oil. Expanded marketing opportunities helped Brazilian farmers increase soybean area for 1985. On the other hand, trade liberalization will result in more exports of soybeans rather than meal and oil, and the availability of soybeans for Brazilian crushers is expected to fall.
In Argentina, tax incentives for soybean crushers have resulted in the rapid expansion of oil and meal exports, and the reduced availability of raw soybeans for export. Because of lower prices, wheat area has been declining for 3 years, and this has helped boost soybean area, including more high- yielding single-cropped soybeans. Argentine soybeans
11 Agricultural economists, International Economics Division, ERS.
are usually 80 percent double-cropped with wheat, resulting in lower yields.
Forecasts indicate that South America will export 18.2 million tons of soybeans and soybean products in 1985/86 (local marketing year); 10.6 million tons will be exported as meal, 6.1 million tons will be exported as raw soybeans and 1. 5 million tons will be exported as oil. Based on this forecast, overall soybean and soybean product exports will be up 24 percent from the 1981/82-1984/85 average; soybean exports, up 52; soybean meal, up 12; and soybean oil, up 19.
Debt Problems Reshape Farm Policies in Brazil
Brazilian policies,---including export quotas, differential export taxes, subsidized credit, tax remittances, and duty-free bean imports if the products were exported---helped Brazil become the largest soybean meal and soybean oil exporter in the world. However, export intervention also meant that Brazilian farmers had to sell to domestic crushers, often at prices below the world market. But as long as the farmers received subsidized credit for agricultural inputs, planted area continued to increase and export intervention was not overly burdensome.
Then, in the early 1980's, austerity measures reduced available subsidized credit, and many tax incentives were suspended. Profits in the soybean industry were squeezed. Some farmers shifted to alternate crops and soybean area stopped expanding.
23

Brazil implemented a 30-percent maxi-devaluation of the cruzeiro in early 1983 to increase exports and generate a trade surplus. This was done to pay foreign debts. During 1983, the devaluation was offset by a special export tax, but this was rapidly phased out. The maxi-devaluation increased the profitability of soybean exports, since dollar earnings generated more cruzieros than before the devaluation. Soybean production rose to records in 1984 and 1985, reflecting the increased profitability of cash crops for export.
Early in 1984, exports of soybeans and soybean oil were reduced by Government export quotas. The marketing delays caused by the quotas resulted in even lower prices for Brazilian exporters, since world prices continued to fall. Even soybean crushers became disenchanted with Government intervention.
Area, production, and use of soybeans and soybean products in South America
Year 1/ 1981/83 1981/82 1983/85 1984/85 1985/86 change average preliminary
Percent I ,000 I ,000 tons tons
Brazi I Area harvested 4.5 8,540 9,500 Production 6.8 14,4% 16,200 Soybean export 26.8 I ,299 3,000 Crush (3.6) 12,974 12,600 Meal export (4.8) 8,016 7,700 Oi I export (9.0) 987 900
Argentina Area harvested 36.4 2,202 3,150 Production 43.5 4,656 6,600 Soybean export 3.0 2,203 2,450 Crush 100.2 2,251 3,850 Meal export 120.5 I ,504 2,750 Oi I export 144.5 269 550
Total 2/ Area harvested 9.7 II, 140 13,120 Production 13.9 19,720 23,550 Soybean export 7.0 3,977 6,075 Crush 5.2 15,283 16,550 Meal export I .4 9,554 10,509 Oi I export 10.5 I ,256 I ,450
1/ 1981/83, for example, means the average for marketing years 1981/82 - 1982/83. Combining local marketing years--Feb/Jan for Brazil, and Apr/Mar for Argentina and Paraguay. 2/ Total includes Paraguay.
24
In Brazil, Producers Gain Access to World Prices
In an important policy shift, the Brazilian Government announced increased free trade in agriculture in August 1984. Soybean farmers now had access to world markets. Brazilian farmers expanded soybean area, despite low world prices, expecting competition between exporters and crushers to force domestic curshers to pay more for beans. The only significant policy still in effect that discourages soybean exports is the differential export tax, currently 13 percent for soybeans, 11.1 for soybean meal, and 8 for soybean oil.
Nonetheless, world soybean meal prices in April and May 1985 have been relatively low, and early season export registrations indicate a large increase in Brazilian raw soybean exports for the year beginning February 1985. Even with bean exports doubling, low world soybean prices have left Brazilian farmers disillusioned. In the interior producing regions, farm prices are below support prices, resulting in the Government purchase of soybeans for the first time in recent years.
Increased exports of raw soybeans will reduce the available soybeans for domestic crushers in Brazil. Moreover, domestic vegetable oil demand in Brazil may exceed availabilities if exporters bid away enough supplies. This is distinctly possible given the strength of vegetable oil prices in the export market. Brazil may find itself importing vegetable oils later in the season. Alternatively, legal safeguards may be invoked to reduce soybean exports and help crushers, but this would likely lower farm prices. In any case, if raw soybean exports accelerate too rapidly, some intervention is likely.
In Argentina Policies Aid Soybean Crushers
Soybean oil and meal exports from Argentina are expanding rapidly, resulting from Brazilian-type differential export taxes--taxing oil and meal exports at a lower rate than the soybean equivalent. As of March 1985, the tax on soybean exports was 26.5 percent of the export price, and 11.5 percent on soybean oil and meal. For 1985, soybean production is estimated at 6.6 million tons, down from 6.8 million in 1984. But soybean

product exports are forecast to reach 3.3 million tons, up from 2.7 million a year earlier.
Since 1981/82, oilseed crush in Argentina has expanded by about a million tons each year. Two-thirds is from the soybean crush, which is increasing by about 650,000 tons a year. Soybean crush is forecast at 3.9 million tons in 1985/86, up from 3.6 a year earlier. Total oilseed crush is forecast to reach 7.6 million tons, up from 6. 7 in 1984/85.
Besides the incentive provided by the differential export tax, higher exports of soybean oil and meal could result from the following factors:
• Argentina has increased its crush dramatically in recent years, from 4.8 million tons in 1982/83 to a forecast 7.6 million in 1985/86. Additional crushing facilities are under construction, even though present crush capacity is not fully used at all times of the year.
• Multi-use crushing plants crush flaxseed in the first 3 months of the year (beginning in December), then sunflowerseed during the next 3-6 months. Soybeans are used for any additional capacity.
• Soybean meal exports depend largely on the amount of soybeans sold for export early in the marketing year. Usually around May or June, exports bid away enough of the soybean crop so that domestic supplies are insufficient for full utilization of crushing capacity. Crushers are averse to holding large inventories, so stocks are usually depleted before the end of the season.
• While only half of the soybean crop is crushed, nearly all sunflower and flaxseed production is crushed. So a lower crush of other oilseeds would free additional, early-season capacity for soybeans.
CANADIAN-LATIN AMERICAN AGRICULTURAL TRADE
Carol Goodloe 11
Abstract: Most Canadian trade takes place with Western Hemisphere countries. Although the United States dominates total Canadian imports and exports, the U.S. presence is less significant for agricultural trade. Latin America is a small but significant exporter to and importer from Canada.
Keywords: Canada, Latin America, agricultural trade.
Most Canadian trade takes place with Western Hemisphere countries-- the United States and Latin America. In 1984, over three-fourths of Canadian trade was with Western Hemisphere countries. However, the United States dominates these statistics, accounting for 75 percent of Canada's exports and 71 -percent of imports. Latin American countries provide 5 percent of Canada's total imports, chiefly crude oil from Mexico, and take about 3 percent of Canada's exports.
11 Agricultural economist, International Economics Division, ERS.
Nevertheless, agricultural share of this two-way trade is important both to Canada and to Latin America.
Individual countries and commodities are important to Canada's export performance--grains to Cuba and Brazil, dairy products to Mexico, and meat and vegetable products to the Caribbean. Canada, in turn, takes about 5 percent of Latin America's agricultural exports, mostly tropical or plantation crops, such as coffee, sugar, cocoa, and horticultural products. In addition, Canada maintains ties to the region through
25
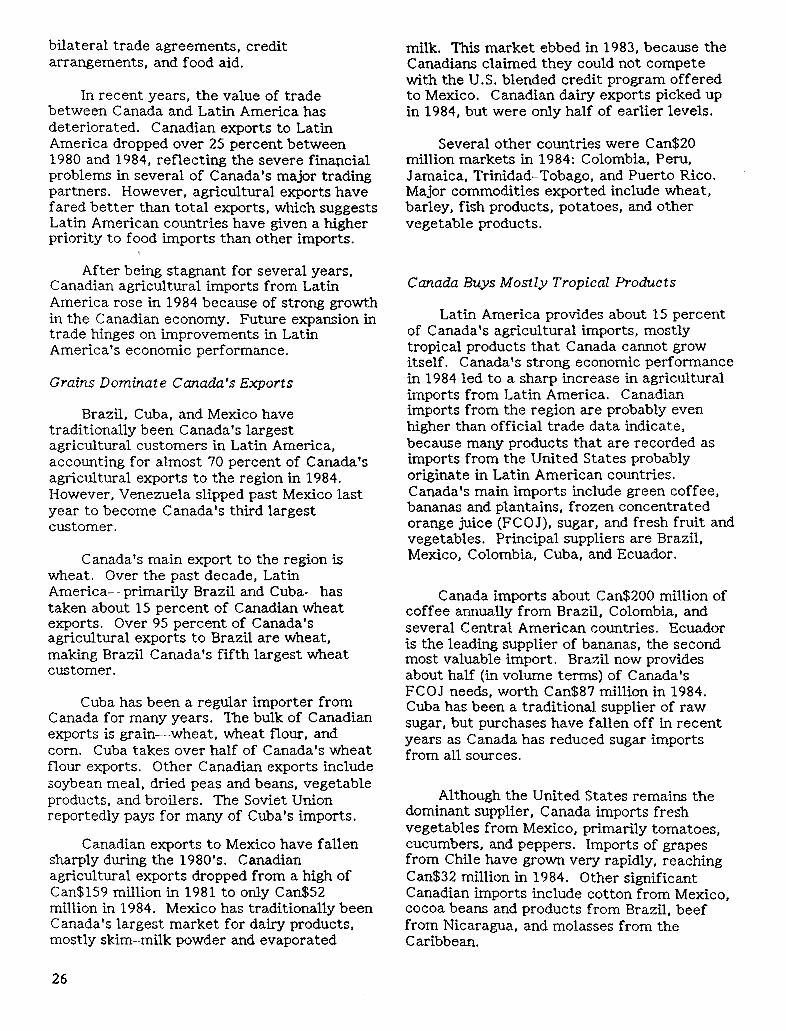
bilateral trade agreements, credit arrangements, and food aid.
In recent years, the value of trade between Canada and Latin America has deteriorated. Canadian exports to Latin America dropped over 25 percent between 1980 and 1984, reflecting the severe finat1cial problems in several of Canada's major trading partners. However, agricultural exports have fared better than total exports, which suggests Latin American countries have given a higher priority to food imports than other imports.
After being stagnant for several years, Canadian agricultural imports from Latin America rose in 1984 because of strong growth in the Canadian economy. Future expansion in trade hinges on improvements in Latin America's economic performance.
Grains Dominate Canada's Exports
Brazil, Cuba, and Mexico have traditionally been Canada's largest agricultural customers in Latin America, accounting for almost 70 percent of Canada's agricultural exports to the region in 1984. However, Venezuela slipped past Mexico last year to become Canada's third largest customer.
Canada's main export to the region is wheat. Over the past decade, Latin America-- primarily Brazil and Cuba---has taken about 15 percent of Canadian wheat exports. Over 95 percent of Canada's agricultural exports to Brazil are wheat, making Brazil Canada's fifth largest wheat customer.
Cuba has been a regular importer from Canada for many years. The bulk of Canadian exports is grain---wheat, wheat flour, and corn. Cuba takes over half of Canada's wheat flour exports. Other Canadian exports include soybean meal, dried peas and beans, vegetable products, and broilers. The Soviet Union reportedly pays for many of Cuba's imports.
Canadian exports to Mexico have fallen sharply during the 1980's. Canadian agricultural exports dropped from a high of Can$159 million in 1981 to only Can$52 million in 1984. Mexico has traditionally been Canada's largest market for dairy products, mostly skim-milk powder and evaporated
26
milk. This market ebbed in 1983, because the Canadians claimed they could not compete with the U.S. blended credit program offered to Mexico. Canadian dairy exports picked up in 1984, but were only half of earlier levels.
Several other countries were Can$20 million markets in 1984: Colombia, Peru, Jamaica, Trinidad-Tobago, and Puerto Rico. Major commodities exported include wheat, barley, fish products, potatoes, and other vegetable products.
Canada Buys Mostly Tropical Products
Latin America provides about 15 percent of Canada's agricultural imports, mostly tropical products that Canada cannot grow itself. Canada's strong economic performance in 1984 led to a sharp increase in agricultural imports from Latin America. Canadian imports from the region are probably even higher than official trade data indicate, because many products that are recorded as imports from the United States probably originate in Latin American countries. Canada's main imports include green coffee, bananas and plantains, frozen concentrated orange juice (FCOJ), sugar, and fresh fruit and vegetables. Principal suppliers are Brazil, Mexico, Colombia, Cuba, and Ecuador.
Canada imports about Can$200 million of coffee annually from Brazil, Colombia, and several Central American countries. Ecuador is the leading supplier of bananas, the second most valuable import. Bra~dl now provides about half (in volume terms) of Canada's FCOJ needs, worth Can$87 million in 1984. Cuba has been a traditional supplier of raw sugar, but purchases have fallen off in recent years as Canada has reduced sugar imports from all sources.
Although the United States remains the dominant supplier, Canada imports fresh vegetables from Mexico, primarily tomatoes, cucumbers, and peppers. Imports of grapes from Chile have grown very rapidly, reaching Can$32 million in 1984. Other significant Canadian imports include cotton from Mexico, cocoa beans and products from Brazil, beef from Nicaragua, and molasses from the Caribbean.

Trade Encouraged by Agreements and Credit
Canada maintains bilateral agreements with several countries and provides credit to purchase agricultural products. ln addition, 98 percent (by value) of all Canadian imports from the Caribbean Basin are admitted duty free or are given preferential access.
The Canadian Wheat Board (CWB) has conducted wheat trade with Brazil since 1970 under long-term agreements. The CWB had a similar agreement with Jamaica between 1979-81. These agreements generally provide for minimum and maximum quantities and specify shipping periods, but not prices.
These agreements have been accompanied by CWB medium-term commercial credit. The CWB borrows from the banking system at one-quarter percent below the prime rate. The credit is backed by the Federal Government and is provided for up to 3 years. In addition to Brazil and Jamaica, Haiti, Peru, and Mexico have received CWB credit in the past. Brazil's repayments to the CWB are reportedly in arrears.
The Export Development Corporation (EDC), similar to the U.S. Export-Import Bank, occasionally offers credit for agricultural products. Mexico and Chile
currently have a line of credit with the EDC. Since 1981, Canada has had an agreement with Mexico to hold periodic talks on Mexico's food needs and Canada's ability to fill them.
In 1983, the Canadian Government created an agricultural export agency, CANAG REX, designed to facilitate farm product exports. In mid-1984, CANAGREX helped arrange a line of credit to the National Bank of Cuba to import various Canadian commodities, including soybean meal, corn, seed potatoes, beans, and turkey. However, this action proved to be CANAGREX's first and last, as the new Canadian Government dissolved it in late 1984.
Although Canada is not a major provider of food aid to the region, food- aid shipments started increasing in the mid-1970's, after being practically nonexistent. (Canadian food aid has generally gone to Asian and African countries.) Canada has donated about 100,000 tons of wheat and wheat flour over the past decade. Nicaragua, Jamaica, Columbia, and Peru have been the principal recipients. Canada also provides small amounts of fish products, rapeseed oil, dairy products, and pulses. These food-aid transactions are generally grants rather than long- term concessionalloans, such as those used by the United States. [Carol Goodloe 447-8378]
Canadian-Latin American trade
Canadian exports 1/ Canadian imports
Year South America Cen. Am. and Caribbean South America Cen. Am. and Caribbean
Agri. Total Agri. Total Agri. Total Agri. Total
M i I I i on Can $
1980 551 2,315 615 I I 535 341 3,015 435 I ,035 1981 338 1,897 726 1,874 349 3,250 497 I ,892 1982 377 1,501 562 I ,470 393 2,694 360 I ,627 1983 430 I, 316 572 I ,412 388 2,047 357 I, 765 1984 485 1,416 470 I, 374 462 2,441 398 2,280
ll 1984 is estimated.
27

P.L. 480 NEEDS IN LATIN AMERICA
H. Christine Bolling Richard N. Brown Jr.
Nydia Suarez*
Abstract: President Reagan has requested $257 million of P.L. 480 aid to Latin America and the Caribbean for 1985/86. This paper is a short survey of the historical con_text of these requests. Major recipient countries, major U.S. commodities, and major types of programs are identified. The factors affecting 1984/85 p .L. 480 exports are discussed, especially recent economic developments in the main recipient countries in Latin America.
Keywords: Latin America; P.L. 480, Title 1, II, and III programs.
The U.S. food aid program is based on Public Law (P.L.) 480, passed in 1954, and its subsequent amendments. P. L. 480 currently has Title I, fl, and III programs.
Under Title I, the United States offers long- term credit for the sale of agricultural commodities to recipient countries. Title II authorizes grants for emergencies or ongoing humanitarian programs. The current Title III contains the Food for Development Program and ties funds from the local sale of P. L. 480 Title I commodities to agricultural development and related programs in the recipient countries.
The administration has requested $257 million for P.L. 480 aid to Latin America and the Caribbean for 1985/86. This represents 13 percent of the total U.S. budget request for economic and military aid to Latin America.
P. L. 480 aid to Latin America is now double contributions in 1974175, although it dipped for several years in the late 1970's. Tn 1974175, Chile was the largest recipient, but as the political and economic climate of Latin America changed, the leading recipient changed. Haiti, Bolivia, Peru, the Dominican Repub1ic, and El Salvador have all had the lead at one time or another. Furthermore, since 1970, P.L. 480 aid to Latin America has shifted from Title 11 to Title I programs, mostly because of Latin America's strong economic growth at the time.
1/ Agricultural economists, International Economics Division, ERS.
28
U.S. P.L. 480 aid to Latin America
Shan~ of toial agd-
Appl icanh 1983/84 1984/85 1985/86 cuI tur·a I actura I request r·equest impor·ts
the U.S.
$Million Percen1
El Salvador 52 44 51 53 Dominican
Republic 27 35 31 42 Jamaica 20 35 30 14 Peru 43 25 29 19 Bolivia 27 20 29 79 Haiti 16 15 26 23 Costa Rica 23 28 23 45 Guatemala 6 16 19 8 Honduras 19 15 18 42
Total Latin America 233 233 257 5
Source: Foreign Agricultural Trade of the United States, January/February 1985 and supplemental data.
El Salvador has been the leading recipient of P.L. 480 aid since 1982/83. In 1983/84, Peru, Bolivia, and the Dominican Republic were second, third, and fourth, respectively, when temporary food deficits were generated by the El Nino disaster. In 1984/85, the Dominican Republic, Jamaica, and Costa Rica will be leading recipients after El Salvador.
Wheat is the leading commodity sold through P.L. 480, followed by corn, soybean oil, and rice. Together they account for about 80 percent of the total P. L. 480 dollar value sent to Latin America and the Caribbean. In 1983/84, P .L. 480 exports of wheat to the region were $94 million.

P.L. 480 exports make up less than 5 percent of U.S. agricultural sales to Latin America, but for some countries they are the major source of imported bulk commodities. In 1983/84, 53 percent of U.S. agricultural sales to El Salvador and 79 percent to Bolivia were P.L. 480. About 40 percent of sales to the Dominican Republic, Costa Rica, and Honduras were also P. L. 480 aid.
Factors Affecting 1984/85 P.L. 480 Exports
The general economic climate, rather than natural disaster, is expected to be the principal determinant of food aid needs this year. Many Latin American countries have faced deteriorating economic conditions since the late 1970's, keeping their aid needs high. Much of this aid is used to give these countries some relief from their balance-of-payments deficits. The outlook by country is as follows:
• Peru's current economic crisis and chronic shortage of food will keep food-aid needs up. In FY 1985, the Government of Peru has requested $17 million for wheat and flour and $8 million for imports of vegetable oil under Title I.
• Bolivia's economy has been in a tailspin since 1977, and Bolivia has one of the lowest per capita incomes in Latin America. Moreover, Bolivia's national diet is chronically short of calories, according to what the Food and Agricultural Organization considers to be nutritionally adequate. In mid-March, USDA authorized Bolivia to purchase $10 million of U.S. wheat under P.L. 480 Title
·I, and it is considering an additional $10 million of Title I aid. The Government of Bolivia had requested $40 million through titles I and Ill, mostly because of its current severe economic problems.
• El Salvador will continue to be the largest recipient of P. L. 480 aid because of the ongoing civil strife. Before the Civil War, P.L. 480 aid to EL Salvador was about $2 million. Now it is over $50 million and is an important part of the annual U.S. aid package to El Salvador. The Government of El Salvador has requested wheat, vegetable oil, and tallow for this fiscal year. Until the political situation
becomes more stable, El Salvador is expected to remain a primary concessional market for U.S. agricultural commodities.
• P.L. 480 to Costa Rica was less than a million dollars until 1982, when the Costa Rican Government found itself in serious financial trouble. Costa Rica's P. L. 480 request for this year is $28 million for wheat, corn, and soybeans. So far, the United States has granted $21.4 million.
• Guatemala's aid needs have been increasing steadily since FY 1982. Over the past few years, however, Guatemala's relatively strong economy has deteriorated, and there is now a serious foreign exchange shortage. The country has requested $16 million for wheat and tallow. The agreement is in the formal negotiation stage.
• Honduras is the poorest Central American country, but is self-sufficient in all grains but wheat. It has requested $15 million for wheat, and so far this year, $10 million has been approved.
• Jamaica has required P.L. 480 food aid in recent years just to maintain nutritional standards. From the mid-1970's to now, aid has more than doubled. The current allocation of $35 million for 1984/85 represents a large increase from the previous year's $20 million. The Jamaican package includes wheat, flour, rice, feed grains, and vegetable oil.
• The Dominican Republic also faces zero economic growth and balance-of--payments problems. Current estimates suggest it will take at least another 2 years for the country to recover from the recent worldwide economic slowdown, which severely curtailed export sales. The Dominican Republic will use P.L. 480 aid to import wheat, flour, feed grains; and vegetable oils.
• Haiti has the lowest per capita income of the Caribbean, a negative economic growth rate, and a chronic food supply problem. Wheat remains the primary food-aid commodity, although additional supplies of corn, rice, and soybean oil would be consumed if available.
29

USE OF EXCHANGE RATES IN LATIN AMERICA
David Stallings l/
Abstract: Exchange rates in Latin America may be used as instruments of trade or monetary policy. For the 19 Latin American countries most important to l!·S. commercial agricultural trade, weighted nominal exchange rates have dechned sharply from 1971 to 1984. Real exchange rates have also fallen in value.
Keywords: Latin America, inflation, exchange rates, monetary policy, trade policy.
Two types of exchange rate regimes predominate in Latin American countries: fixed and adjustable. The fixed exchange rate countries peg the value of their currency (most frequently against the U.S. dollar) and leave it constant for long periods of time. Those countries with adjustable exchange rates vary the value of their money based on a set of indicators, such as domestic inflation or import unit values. Governments may also use exchange rates as explicit policy tools.
Latin American nations use exchange rates for their currencies in a much different manner than developed countries such as the United States and Canada. Most of the world's industrial countries allow their currencies to achieve values (against the U.S. dollar) as determined in organized (and legal) foreign exchange markets. Active policies on the part of governments such as the United States and Canada to systematically alter the international price of their monies are sporadic and often ineffective.
The countries of Latin America, on the other hand, use their exchange rates for a variety of policies deemed important by their central governments. The price of foreign exchange (in terms of U.S. dollars) is set and altered by the Governments of most countries in the region, with only spotty, disorganized, and generally illegal ''black" markets established as alternatives.
Exchange rate policies may be used--through price incentives or rationing, for example--in an effort to regulate trade. Another, and perhaps more important,
1/ Agricultural economist, International Economics Division, ERS.
30
function of rigidly fixed exchange rates is as a tool for the conduct of monetary policy.
Exchange Rate Movements in Latin America
The price that must be paid for U.S. dollars plays a large role in the total value of U.S. exports, including agricultural exports, sold to Latin America. An increase in the price paid for dollars also means, other things being equal, a higher price for U.S. products.
The following countries have maintained the same official exchange rate during 1971-84: Guatemala, El Salvador, Honduras, Panama (which uses U.S. dollars), the Bahamas, Haiti, the Dominican Republic, and Netherlands Antilles. Abrupt changes from constant values to lower ones have occurred in Mexico, Costa Rica, Jamaica, Venezuela, Ecuador, Chile, and Peru. The last has experienced rapidly accelerating inflation since 1974. Finally, Colombia, Brazil, and Argentina devalue frequently to offset high rates of inflation (table A).
Table B presents the weighted average exchange rates for Latin American countries. Weights are the proportion of U.S. commercial agricultural exports to the 19 countries in table A during 1979-81. Inclusion of extremely high inflation countries, such as Brazil and Argentina, has resulted in a nominal appreciation in the U.S. dollar of 3,500 percent since 1980, and 500 percent in 1984 alone. One hundred of these weighted units purchased one U.S. dollar in 1973. By the last quarter of 1984, that same dollar would have cost almost 126,000 of these same units.
Although changes are dramatic, the use of nominal exchange rates can be seriously

Table A.-Exchange rates for major Latin American countries, in units per dollar 1/
Country (currency) 1971 1972 1973 1974 1975 1976 1977 1978 1979 1980 1981 1982 1983
Mexico (pesos) 12.5 12.5 12.5 12.5 12.5 15.426 22.573 22.767 22.805 22.951 24.515 56.402 120.09 Guatemala (quetzales) I I I I I I I I I I I I I El Salvador (colones) 2.5 2.5 2.5 2.5 2.5 2.5 2.5 2.5 2.5 2.5 2.5 2.5 2.5 Honduras ( I61T4'i ras) 2 2 2 2 2 2 2 2 2 2 2 2 2 Costa Rica (colones) 6.6258 6.635 6.6468 7.93 8.57 8.57 8.57 8.57 8.57 8.57 21.763 37.407 41.094 Panama Cba I boas) I I I I I I I I I I I I I Bahamas
<Bahamian do II ars) Jamaica
(Jamaica dollars) 0.82197 0.80283 0.909 0.909 0.909 0.909 0.909 1.4491 1.7633 1.7814 1.7814 I. 7814 1.9322 Haiti (gourdes) 5 5 5 5 5 5 5 5 5 5 5 5 5 Dominican Republic
(pesos) Trinidad-Tobago
<TI dollars) 1.9749 1.9213 1.9592 2.0532 2.1698 2.4357 2.4 2.4 2.4 2.4 2.4 2.4 2.4 Netherlands Anti lies
Cgui lders) 1.8834 1.8 1.8 1.8 1.8 1.8 1.8 1.8 1.8 1.8 1.8 1.8 1.8 Colanbia (pesos) 19.932 21.866 23.637 26.064 30.92 34.694 36.775 39.095 42.55 47.28 54.491 64.085 78.854 Venezuela
(bo I i vares) 4.4467 4.4 4. 3045 4.285 4.285 4.289 4.2925 4.2925 4.2925 4.2925 4.2925 4.2925 4.2975 Ecuador (sucres) 25 25 25 25 25 25 25 25 25 25 25 30.026 44.115 Peru (so I es) 38.7 38.7 38.7 38.7 40.54 56.42 83.81 156.33 224.55 288.86 422.32 697.57 1628.5 Chile (pesos) 0.012 0.01 0.111 0.832 4.911 13.054 21.52 31.656 37.246 39 39 50.9 78.842 Brazi I (cruzeiros) 5.2 5.93 6.13 6.7 8.13 10.67 14.14 18.07 26.95 52.71 93.12 179.51 577.04 Argentina
(pesos Argentinas) 0.0005 0.0008 0.0009 0.0009 0.0037 0.0140 0.0408 0.0796 0.1317 0.1837 0.4403 2.5923 10.530
Table A.-Exchange Rates for major Latin American countries, in units per dollar--continued
Mexico (pesos) Guatemala (quetzales) El Salvador (colones) Honduras (lempiras) Costa Rica (colones) Panama (balboas) Bahamas
(Bahamian dollars) Jamaica (Jamaica dollars) Haiti (gourdes) Dominican Republic
(pesos) Trinidad-Tobago
(TT do I I ars) Neth. Anti lies Colombia (pesos) Venezuela
(bo I i vares) Ecuador (sucres) Peru (soles) Chi I e (pesos) Brazil (cruzeiros) Argentina (pesos)
102.02 I
2.5 2
40.25 I
II
114.2 1
2.5 2
40.297 I
1983
Ill
126.12 I
2.5 2
41.273 I
IV
138.04 I
2.5 2
42.557 I
I. 7814 5
I. 7814 5
I. 7814 5
2.3846 5
2.4 1.8
72.134
4.2925 33.913 1099.7 74.961 326.43 5.7520
2.4 1.8
76.345
4.2974 43.473 1411.6 75.342 475.8 7.820
2.4 1.8
80.872
4.3 47.248 1844.3 79.753 638.36 10.733
2.4 1.8
86.066
4.3 51.825 2158.7 85.312
867.5 17.814
149.96 I
2.5 2
43.4 I
1984
II
161.87 I
2.5 2
43.53 I
Ill
173.73 I
2.5 2
44.233 I
IV
185.74 I
2.5 2
46.967 I
3.3143 5
3.8701 5
4.0278 5
4.5591 5
2.4 1.8
91.6
5.5698 56.444 2447.4 88.052 1140.7 27.837
2.4 1.8
97.426
7.5 60.942 3024.2 89.99
1514.4 41.181
2.4 1.8
103.79
7.5 65.581
3707 95.625 2004.7 69.344
2.4 1.8
110.43
7.5 67.175 4680.9 120.95 2732.3 132.23
1/ Official exchange rates. (Information is incomplete, unreliable, or unavailable for "black market" or other unofficial exchange rates; these are not included.) Source: International Financial Statistics, International Monetary Fund, 1984 Yearbook
and May, 1985.
1984
167.83 I
2.5 2
44.533 I
3.9428 5
2.4
1.8 100.82
7.0175 62.535 3464.9 98.656
1848
67.649
31
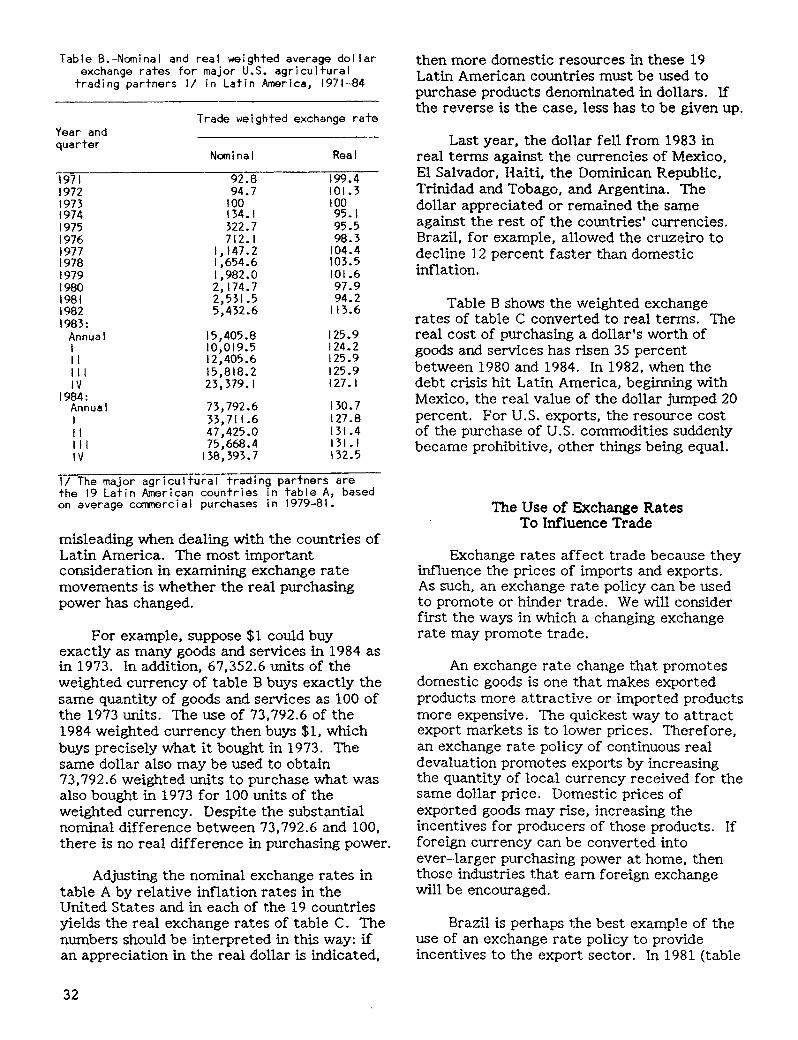
Table B.-Nominal and real weighted average dollar exchange rates for major U.S. agricultural
trading partners 1/ in Latin America, 1971-84
Trade weighted exchange rate Year and quarter
Nominal Real
1971 92.8 199.4 1972 94.7 101.3 1973 100 100 1974 134.1 95.1 1975 322.7 95.5 1976 712.1 98.3 1977 1,147.2 104.4 1978 I ,654.6 103.5 1979 I, 982.0 101.6 1980 2,174.7 97.9 1981 2,531.5 94.2 1982 5,432.6 113.6 1983:
Annual 15,405.8 125.9 I 10,019.5 124.2 II 12,405.6 125.9 Ill 15,818.2 125.9 IV 23,379.1 127 .I
1984: Annual 73,792.6 130.7 I 33,711.6 127.8 II 47,425.0 131.4 Ill 75,668.4 131. I IV 138,393.7 132.5
1/ The major agricultural trading partners are the 19 Latin American countries in table A, based on average commercial purchases in 1979-81.
misleading when dealing with the countries of Latin America. The most important consideration in examining exchange rate movements is whether the real purchasing power has changed.
For example, suppose $1 could buy exactly as many goods and services in 1984 as in 1973. In addition, 67,352.6 units of the weighted currency of table B buys exactly the same quantity of goods and services as 100 of the 1973 units. The use of 73,792.6 of the 1984 weighted currency then buys $1, which buys precisely what it bought in 1973. The same dollar also may be used to obtain 73,792.6 weighted units to purchase what was also bought in 1973 for 100 units of the weighted currency. Despite the substantial nominal difference between 73,792.6 and 100, there is no real difference in purchasing power.
Adjusting the nominal exchange rates in table A by relative inflation rates in the United States and in each of the 19 countries yields the real exchange rates of table C. The numbers should be interpreted in this way: if an appreciation in the real dollar is indicated,
32
then more domestic resources in these 19 Latin American countries must be used to purchase products denominated in dollars. If the reverse is the case, less has to be given up.
Last year, the dollar fell from 1983 in real terms against the currencies of Mexico, El Salvador, Haiti, the Dominican Republic, Trinidad and Tobago, and Argentina. The dollar appreciated or remained the same against the rest of the countries' currencies. Brazil, for example, allowed the cruzeiro to decline 12 percent faster than domestic inflation.
Table B shows the weighted exchange rates of table C converted to real terms. The real cost of purchasing a dollar's worth of goods and services has risen 35 percent between 1980 and 1984. In 1982, when the debt crisis hit Latin America, beginning with Mexico, the real value of the dollar jumped 20 percent. For U.S. exports, the resource cost of the purchase of U.S. commodities suddenly became prohibitive, other things being equal.
The Use of Exchange Rates To Influence Trade
Exchange rates affect trade because they influence the prices of imports and exports. As such, an exchange rate policy can be used to promote or hinder trade. We will consider first the ways in which a changing exchange rate may promote trade.
An exchange rate change that promotes domestic goods is one that makes exported products more attractive or imported products more expensive. The quickest way to attract export markets is to lower prices. Therefore, an exchange rate policy of continuous real devaluation promotes exports by increasing the quantity of local currency received for the same dollar price. Domestic prices of exported goods may rise, increasing the incentives for producers of those products. If foreign currency can be converted into ever-larger purchasing power at home, then those industries that earn foreign exchange will be encouraged.
Brazil is perhaps the best example of the use of an exchange rate policy to provide incentives to the export sector. In 1981 (table

Maxi co (pesos)
Guatemala ( quetza I es)
El Salvador (colones)
Honduras (la..,iras)
Coste Rica (colones)
Panama (balboas)
Bahamas • <Bahamian dollars)
Jamaica (Jamaica dollars)
Haiti (gourdes) Daninican Republic
(p4!1SOS) Trinidad-Tobago
en dollars) Nether I ands Ant I I I es
Cgui lders) ColOmbia (pesos) Venezuela
(bo I i vares) Ecuador (sucres) Peru (soles) Chi I e (pesos) Brazi I (cruzeiros) Argentina (pesos)
1971
26.92
1.26
3.37
2.05
9.04
0.9479
0.9820
2.02 6.17
1.27
3.19
2.20 60.90
4.74 37.08
24B.71 589.20 51.06 24.55
Table C.-Real Exchange Rates II for major Latin American countries, in units per dollar
1972
27.61
1.27
3.43
2.01
8.73
0.9321
0.9338
1.94 6.18
1.22
2.94
2.09 60.93
4.72 35.57
240.34 5.08
44.30 40.64
1973
25.14
1.18
3.42
2.03
8.07
0.9245
0.9390
1.98 5.35
1.12
2.76
2.05 57.88
4.70 33.35
232.80 29.91 42.91 48.51
1974
22.58
1.12
3.25
1.99
8.20
0.8781
0.9200
1.73 5.16
1.10
2.63
1.91 56.97
4.79 30.02
220.83 35.54 40.88 26.91
1975
21.37
1.08
2.98
2.05
8.25
0.9095
0.9120
1.61 4.82
1.05
2.60
1.80 60.04
4.82 28.44
204.42 48.59 41.80 48.32
1976
24.12
1.04
2.94
2.07
8.44
0.9250
0.9250
1.55 4.77
1.03
2.80
1.81 59.28
4.67 27.16
226.66 43.79 40.96 38.70
1977
29.15
0.98
2.80
2.03
8.63
0.9424
0.9546
1.48 4.77
0.97
2.62
1.83 50.31
4.62 25.92
258.42 40.00 40.34 42.90
1978
26.91
0.98
2.66
2.08
8.76
0.9730
0.9682
1.89 5.27
1.01
2.56
1.82 48.86
4.64 24.69
328.59 45.17 39.98 37.84
1979
25.40
0.98
2.59
2.04
8.91
1.0126
0.9877
1.98 5.24
1.03
2.48
1.82 47.43
4.60 24.89
314.96 44.34 43.41 23.30
1980
22.95
1.00
2.50
2.00
8.57
1.0000
1.0000
1.78 5.00
1.00
2.40
1.80 47.28
4.29 25.00
288.86 39.00 52.71 18.37
1981
21.31
0.99
2.40
2.00
17.52
1.0289
0.9937
1.74 5.02
1.03
2.32
1.77 47.19
4.09 24.42
265.97 35.97 50.00 23.77
1982
32.49
1.05
2.28
1.93
16.81
1.0550
0.9941
1.74 4.92
1.01
2.21
1.77 47.26
3.95 26.78
283.22 45.29 51.65 56.07
1983
35.38
1.09
2.08
1.82
14.38
1.0587
0.9861
1.74 4.61
1.00
1.95
1.78 50.13
3.84 27.35
323.29 56.94 70.90 53.00
1984
31.21
1.14
1.94
1.82
14.58
1.0859
0.9898
2.90 4.52
0.83
1.79
1.82 57.57
5.88 30.83
341.29 61.99 79.74 48.74
Continued 1/ Real exchange rates per dollar are computed as the nominal exchange rate multipl led by the ratio of the U.S. consumer price index to the
relevant home country's own consumer price index. Source: lnternationa Financial Statistics, International Monetary Fund, 1984 Yearbook and May, 1985.
Table C.-Real exchange rates 1/ for major Latin American countries, in units per dollar---continued
Mex i co (pesos) Guatemala (quetzales) El Salvador (colones) Honduras (lempiras) Costa Rica (colones) Panama (balboas) Bahamas
(Bahamian dollars) Jamaica
(Jamaica dollars) Haiti (gourdes) Dominican Republic
(pesos) Trinidad-Tobago
CTT dol Iars) Netherlands Antilles
(guilders) Colombia (pesos) Venezuela
(bot i vares) Ecuador (sucres) Peru (soles) Chile (pesos) Brazil (cruzeiros) Argentina (pesos)
36.58 I .07 2. !6 1.85
14.33 1.0476
0.9810
I .68 4.72
0.99
1.99
1.77 48.40
3.88 25.37
303.08 58.13 60.74 56.47
1983
II
35.67 1.08 2.14 1.83
13.89 1.0580
0.9836
1.65 4.54
1.01
1.96
I. 79 48.45
3.86 28.64
315.60 55.91 70.55 56.63
Ill
35.25 1.10 2.06 1.80
14.48 1.0638
0.9886
1.57 4.62
1.01
I .95
I .78 50.75
3.84 27.10
333.18 56.43 71.34 51.64
IV
34.67 I. II 1.99 1.81
14.82 1.0650
0.9927
2.05 4.58
0.98
1.93
1.79 52.83
3.79 28.12
334.18 57.40 76.05 51.95
32.48 1.12 1.97 1.81
14.74 1.0735
0.9888
2.71 4.55
0.93
1.82
1.80 54.92
4.91 29.64
316.04 58.91 77.09 52.24
II
1984
31.42 1.13 1.96 1.81
14.41 1.0847
0.9866
2.95 4.49
0.86
1.80
1.81 56.13
6.35 30.56
328.46 58.31 79.30 47.21
Ill
31.01 1.14 1.96 1.82
14.33 1.0911
IV
30.36 I. 15 1.91 1.82
14.84 1.0932
0.9969 0.9876
2.81 4.52
0.81
I. 79
1.82 58.48
6.19 32.13
343.95 60.64 79.56 46.06
3.11 4.54
0.75
I. 76
1.83 60.52
6.02 31.10
365.57 69.16 81.98 50.69
33

C), $1 from exports earned 50 real cruzeiros. By 1984, that same dollar (in constant dollar prices) earned almost 80, a 60-percent greater return than the increase in domestic prices. This, in effect, provides a 60-percent margin for price declines (in dollars), still yielding the same domestic purchasing power as before the devaluation. Brazil has considerable incentive to pursue exactly such a policy, given its need to service debt by earning dollars.
The opposite is an exchange rate policy that discourages exports. This is clearly the case with Mexico and Argentina in 1984. Both
Most Critical Factor Affecting U.S. Grain Exports to Latin America:
Debt, Prices, or Production?
U.S. exports of agricultural commodities to Latin American countries jumped $2.4 billion during 1979-80, but dropped $1.9 billion, to $4.4 billion, during 1981-82. Many believe the severe debt problems Latin America began experiencing in 1980 were responsible for this decline. Some, however, see domestic production and international prices as the causes. But alI of the factors might have caused the recent decline simultaneously. The question is, how much did each one contribute?
Canonical correlation analysis can be used to separate the effect of each factor. 1/ This technique has been used with time series data covering 1973-82 to evaluate the relationships between wheat, corn, soybean, and rice i mpor·ts for (i) debt service (defined by the payments of principal and interest), Cii) domestic production, and (iii) international prices in each country of the region. The results show that foreign debt had the greatest relative effect on grain imports in 14 countries, domestic production in 6, and international price in 4:
The 14 nations whose imports are most constrained by debt represent 58 percent of the 1982 regional debt, totaling $274 bil I ion, not including Argentina. The nations whose imports are most affected by domestic production account for 35 percent, and those constrained mostly by price levels account for 7 percent.
The four price-constrained nations imported about 7 percent of total U.S. agricultural exports to Latin America during 1979-83; debt-constrained and production-constrained nations each accounted for about 47 percent (see figure). Although debt-constrained countries have a severe burden of debt services, their imports of U.S. agricultural commodities have been relatively stable (average $2,266 mil lion with standard deviation of 337) compared with those of the production-constrained nations (average $2,349 mil lion with standard deviation of 700).
The measurement of relative variation of imports is 0.15 for the debt-constrained countries, compared with 0.30 for the production-constrained countries. Furthermore, chan9es in imports of U.S. agricultural
34
countries had real exchange rates (table C) that appreciated against the dollar in 1984. In other words, a dollar of exported goods earned fewer real pesos than in the previous year.
The Use of Exchange Rates in Monetary Policy
Countries such as Guatemala that maintain fixed exchange rates also use exchange rates as their indirect instruments to control the domestic money supply. The result is to coordinate the domestic economic environment with that which exists abroad.
commodities by the production-constrained nations represented 63 percent of recent large swings in U.S. exports to Latin American countries.
On the other hand, changes in imports by the debt-constrained nations accounted for 29 percent of the variability and imports by the price-constrained nations accounted for 8 percent. It is worthwhile to note that the production-constrained countries accounted for 96 percent of the increase in U.S. agricultural exports to Latin America ($0.8 billion) during the period 1982-83.
This analysis shows that domestic production, not debt problems, has recently been the major factor causing the large swings in Latin American imports of U.S. agricultural products. Consequently, even if the Latin American debt cr.isis is resolved, other factors wi II continue to influence the variability of U.S. agricultural exports to this region. [C.S. Kim (202) 447-81331
U.S. Agricultural Exports to Region Billion U.S. dollars
7
6
5
4
3
2
U.S. Exports to Latin America
Production-constrained ~~UIIIIIIIIIIIIIIP~
~~~~ 1\llllllllllllllllliiiiiiiii\IIIV ~lftw..... .. ~~"""" -~~¥/'"""/ '""~''' Debt-constrained ''' 111111111~·""" 11111
~\\ ''"''' ~' Price-constrained ,_,_,_,_,_,_,_,_,_,_,_,
0 ~------~--------~--------~------~ 1979 80 81 82 83 1/ Canonical correlation is a multivariate
statistical method whereby the dependency between two sets of variables, each consisting of more than one variable, is examined. Linear functions of the variables in each of the two sets are obtained so that correlation between the variable set is maximized. Parameters derived in canonical correlation provide the weights of variables of each of the sets.

Fixed exchange rate countries maintain the value of their currency by standing ready to buy or sell whatever quantities of foreign exchange are necessary to keep the balance of payments at zero. This is generally done through a central bank via changes in a country's foreign exchange reserves. These reserves are deposits of foreign currency, such as U.S. dollars, held by the government.
If there is a balance- of-payment deficit, more domestic money is being exchanged for foreign currency than vice-versa. Foreign exchange reserves are being drawn down as domestic money is absorbed by the central bank. The decline in domestic money slows domestic expenditures on both home and foreign goods. Domestic prices may also decline. When the money supply falls far enough, the reserve outflow is halted. With a balance-of-payment surplus, the money supply
expands and imports increase until the accumulation of reserves ceases.
Abrupt Changes in Exchange Rates
Sudden exchange rate devaluations are often caused by depletion of foreign exchange reserves. Rarely does the accumulation of foreign exchange lead as rapidly to an appreciation. Without an ample supply of reserves, domestic money cannot be converted to foreign currencies, and all trade may suffer. In addition, foreign exchange may be rationed, leading to preferential treatment for some industries.
A particularly severe shortage occurred in Mexico during 1982. It was difficult for any Mexican individual or company to obtain foreign currencies, and trade fell to a virtual standstill for the last half of the year.
THE 1985 FARM BILL PROPOSALS: IMPLICATIONS FOR LATIN AMERICA
John E. Link 1/
Abstract: The 1985 U.S. farm bill proposals could affect the farm sector in Latin America. The impact will depend upon the different countries' internal policies and their linkages between domestic and international markets for the major commodities. Net farm trade between the U.S. and the region is expected to change little over the next few years in response to the new proposals.
Keywords: U.S. farm bill, Latin America, trade.
Progress on the proposed Agricultural Adjustment Act of 1985 is being followed not only by the farm sector in this country, but by farmers and governments around the world. Because the United States is one of the largest exporters of agricultural products in the world, its domestic policies and programs will have long-term and far-reaching implications for farm trade, production, and consumption throughout the world. '!:_/
11 This material and analysis is from the ongoing work in the Western Hemisphere Branch, International Economics Division, ERS. John Link is an agricultural economist for the Western Hemisphere Branch, International Economics Division, ERS.
Some of basic ideas of the proposed 19 85 farm bill are to make the U.S. farm economy less dependent on the Government, reduce public expenditures, and permit market forces to allocate resources. According to Normile, the proposal, if passed, would lower current support prices. She also states that such a reduction would lower world prices because of the U.S. importance in world trade. Other commodities would be affected through changes in relative prices.
'!:_/ See Mary Anne Normile's article, "The 1985 Farm Bill: Implications for Canada, Australia and New Zealand" in North America and Oceania Outlook and Situation Report (RS-85--1), Economic Research Service, April 1985.
35

At the present time there are numerous proposals and just what the new farm bill will look like is uncertain. There does seem to be a consensus that most of the proposals would result in lower prices, at least in the short run.
To analyze the implications for Latin American agriculture, two scenarios were developed. Scenario 1 represents a continuation of current price expectations. Scenario 2 represents lower world prices. Nonagricultural policies and factors such as population and income growth were held constant in both cases. Population growth is assumed to remain high and economic conditions are expected to improve in the late 1980's and early 1990's.
Latin American governments use a range of policy tools for protecting their economies from wide fluctuations in world market conditions. These policies can greatly affect direction and magnitude of response to change in world agricultural markets. However, they also are subject to rapid, unanticipated modification, cancellation, or reversal upon changes in governmental regime. The implication of this for projecting long-run Latin American response to lowered world commodity prices is that government instability leads to uncertainty regarding policy direction and reduces the reliability of historically derived estimates of long-run responsiveness.
Latin American wheat imports under scenario 1 are expected to grow about 2. 7 percent annually through the early 1990's. But with lower price expectation under scenario 2, wheat import demand by the Latin American region would increase over scenario 1. The opposite is true for wheat exports from Latin America. Wheat exports from the region would grow more slowly under scenario 2 and reach an absolute level less than projected for scenario 1 as Argentine producers reacted to lower prices.
The region's corn and sorghum imports are expected to continue their upward trend under both scenarios, but scenario 2 would accelerate that increase somewhat. Exports would decline through the late 1980's and then increase in response to improved economic conditions under both scenarios.
36
Latin American soybean imports would remain constant throughout the period under both price scenarios. However, exports are expected to increase because of changes in Brazilian and Argentine policies.
The region's soybean meal imports are expected to remain about constant, with slight adjustments up and down over the period, under both scenarios. The soybean meal export picture is just the opposite of soybean exports. Meal exports are expected to be higher under scenario 2 than scenario 1, again due to policy shifts in Argentina and Brazil.
The region's cotton imports are expected to be the same under both scenarios. Cotton exports from Latin America would be higher at the start of the period under scenario 2, then moderate so that by 1991 exports would be the same under both scenarios.
These regional trends are largely determined by individual countries' responses to the lower commodity prices expected to develop under the proposals.
Argentine Exports Could Slow
Argentina's export supply responsiveness is much lower for downward than for upward changes in world prices. The Argentine Government has both the capability and proclivity to rapidly adjust export taxes and exchange rates in order to insulate its producers from a sudden drop in world prices. Therefore, the lower world prices (scenario 2) would slow the growth of Argentine grain/oilseed exports, but would not reduce these exports from current levels.
Decreases in wheat area could offset higher yields. The Argentine Government subsidizes fertilizer use, and grain yields, particularly wheat, benefit from this program. However, lower wheat prices might force the Government to abandon the fertilizer subsidy, since fertilizer use increases production costs and reduces pricing flexibility.
Argentine multi-enterprise farms are sensitive to relative commodity prices. The lower prices (scenario 2) would accelerate the production of soybeans and the export of soy products, and slow growth in wheat and feed

grain production. As wheat area responded to a lower wheat/soybean price ratio, more soybean area and higher yields due to earlier planted soybeans would be expected. This would tend to accelerate Argentine soybean meal exports under scenario 2, since soy products are favored by the differential export taxes.
Brazil Expected To Continue Pushing Exports
Brazil's foreign debt burden makes large agricultural exports a financial necessity. The country's need for foreign exchange exerts considerable pressure to export despite lower trade prices. Continued devaluation of the Brazilian cruziero may offset much of the effect of lower world prices and cause some shifts among export crops, depending on relative prices. Increased price uncertainty would encourage marginally higher stock holding. But the lower price scenario would not result in significantly lower Brazilian exports of oilseeds and oilseed products or imports of wheat.
Brazil is reestablishing its position as a major cotton exporter as world cotton/soybean price ratios favor cotton. The lower world price scenario would accelerate this shift. Soybean trade liberalization channels most additional production into exports as beans instead of soybean meal. Soybean meal and oil exports are reduced slightly in the first years of scenario 2 but recover to scenario 1 levels in later years.
Little Change Expected in Mexican Policies
Mexican domestic demand has expanded much more rapidly than supply. The politics of food self -sufficiency has periodically resulted in the protection of domestic producers through high price supports and trade restriction. Little import response for basic staples, com and wheat in particular, is expected under scenario 2 because consumption of these products is already subsidized below world prices.
Mexico is not expected to substantially alter its domestic price protection policies, but there may be a gradual reduction of the subsidies during the period. Mexican domestic prices of cotton, sorghum, and soybean
products will be more sensitive to external price changes, especially since feed subsidies on soybean meal and sorghum are being phased out.
Mexican imports of both wheat and coarse grains would be higher under scenario 2. Cotton exports would be lower.
In the Rest of Latin America, Food Demand Not Affected Much
The Caribbean, Central American, and Andean regions are net importers of food grains and feed. Variability in import demand for food grains is more strongly related to domestic production levels than to world prices. However, demand for feed grains and soybean meal is more responsive to world prices.
Therefore, imports of feed (coarse grain and soybean meal) are would be higher under scenario 2 than under scenario 1. Coarse grain imports would decrease from the mid-1980's level under both scenarios. For food, demand shows little difference between the scenarios. Wheat imports in the rest of Latin America are expected to continue their upward trend. Cotton is exported from many Latin American countries. Because world demand for cotton is highly sensitive to price, cotton exports from Latin America are expected to be higher for most of the period under scenario 2 than under scenario 1.
Net Farm Trade Would Change Little
Scenario 2 (lower prices) indicates that Latin American imports of wheat, coarse grain, soybeans, and soybean meal would be equal to or exceed those under scenario 1 and that, except for soybean meal, exports of those commodities from the region would be lower. While the U.S. may increase its share of the Latin American market, this is not certain. Because of policies that range, for different countries, from economic isolation to an inflexible requirements for imported food, little short-run change in net farm trade between the U.S. and Latin America is expected to result from a short-run decline in world commodity prices. It is only under conditions of long-term low world prices that wheat, coarse grain, or soybean exports from Latin American competitors with the U.S. would decrease. [John Link (202) 447-8133]
37

Page Table
39 1
40 2 41 3
43 4 45 5 46 6
38
LIST OF TABLES
Latin America: Population, gross domestic product, and gold and foreign exchange holdings Latin America: Indexes of total and per capita agricultural and food production Area and production of selected agricultural products by principal Latin American Countries or regions Latin America: Production of selected agricultural products Latin America: Exports and Imports of selected agricultural commodities U.S. Agricultural trade with Latin America

Table I.-Latin America: Population, gross domestic product, and gold and foreign exchange holdings 1/
Country
Mexico
Barbados Cuba 5/ Dominican Republic Haiti Jamaica Trinidad & Tobago other Caribbean Islands
Belize Guyana Suriname
Caribbean
Costa Rica El Salvador Guatemala Honduras Nicaragua Panama
Central America
Argentina Paraguay Uruguay
Brazi I Bolivia Chile Colombia Ecuador Peru Venezuela
Andean
TOTAL LATIN AMERICA
Population Gross domestic product
1983 1984 Change 1982.2/ 1983.3/ 1984.3/
Mi II ions Percent Mil. dol. Percent Percent
73.8
0.3 9.9 6.2 5.5 2.3 I. I 1.5
0.2 0.8 0.4
28.3
2.5 4.8 7.8 4.1 2.8 2.0
24.1
29.6 3.5 3.0
131.3 6.1
II. 7 27.5 9.2
18.7 16.4
89.6
383.1
75.8
0.3 9.9 6.4 5.7 2.4 1.2 1.5
0.2 0.8 0.4
28.6
2.6 4.9 8.1 4.2 2.9 2.0
24.8
30.1 3.6 3.1
134.4 6.3
11.9 27.9 9.5
19.1 16.9
91.6
392.0
2.7
0.4 0.4 2.6 1.9 I. 7 1.5 o.o .o
0.4 2.0
1.4
2.6 2.7 3.1 3.4 3.5 2.0
3.0
1.6 2.9 6.0
2.4 3.3 1.7 1.5 3.3 2.1 3.0
2.2
2.3
2,38760
622 25, 113 6,756 I ,582 2,966 3,066 2,052
125 538 874
43,693.6
2,464 3,358 8,357 2,351 2,554 3,682
22,766.6
144,590 5,129 8,909
210,660 7' 189
28,260 33,596 13,497 22,911 68,275
173,727.9
848,235.9
-4.7
0.5 3.0 o.o 0.2
-1.0 2.0 2.5
0.2 -5.0 -2.0
1.8
-3.0 0.0
-2.5 -1.4 2.0 1.0
-1.0
3.1 -5.0 -7.0
-3.2 -6.0 -1.0
1.0 -3.0
-12.0 -4.5
-3.8
-2.4
1.0
1.0 2.5 2.0 0.0 0.5 2.0 2.5
1.0 -3.0 -2.0
2.0
-2.0 -5.0
1.0 -1.0 0.0 3.0
-0.2
2.0 1.0 2.0
4.1 0.5 5.5 3.0 2.0 3.5
-1.5
1.5
I. I
Gold and foreign exchange holdings /4
1983 1984
Mil. dol.
4,744.0
126.6 150.0 202.6
15.2 63.2
2,106.8 300.0
9.3 6.5
78.8
3,059.0
346.3 180.0 232.1 114.7 233.2 206.7
1,312.9
1,357.0 684.1 610.0
4,562.0 197 .I
2,603.0 2,932.7
768.8 1765.4
II ,082.0
19,349.0
35,677.9
6,782.7
135.9 300.0 165.6 19.2 50.0
I, 359.0 280.0
6.2 7.0
41.6
2,364.4
357.7 185.6 296.5 116.2 100.0 81.6
1,137.6
2,043.0 545.0 577.0
11,996.0 269.8
2,868.9 426.0 735.5
2,045.3 12,340.0
18,685.5
44,131.2
Change
Percent
43.0
7.3 100.0 -18.3 26.3
-20.9 -35.5 -6.7
-33.5 7.9
-47.2
-22.7
3.3 3.1
27.7 1.3
-57 .I -60.5
-13.4
50.6 -20.3 -5.4
163.0 36.9 10.2
-85.5 -4.3 15.9 11.4
-3.4
23.7
1/ Regional totals include only those countrie::: for which data are :::hown and may not add up becaU$t:! of rounding. 21 Economic and Social Progress in Latin America, 1984, lOB and individual country reports. 3/ Estimates of growth in real terms. 4/ International Financial Statistics, IMF, May 1985. 5/ Banco National de Cuba, Economic Report, August 1982. 1984 data ERS Estimates.
39

Table 2.-Latin America: Indexes of total and per capita agricultural and food production 1/
Total Per Capita
Agriculture Food Agriculture Food
Country 1982 1983 1984 1982 1983 1984 1982 1983 1981 1982 1983 1984 ----
Base: 1976-78 = 100
Mexico 113 120 114 115 123 116 99 102 95 112 106 101
Barbados 94 97 110 94 97 110 92 95 108 92 95 108 Cuba 134 122 139 134 123 140 130 118 133 130 118 133 Dominican Republic 105 Ill 109 109 114 116 92 94 90 95 97 96 Haiti 105 107 109 104 105 107 97 97 97 96 96 96 Jamaica 81 82 86 80 80 83 76 75 77 74 73 75 T r i n i dad/1 obago 86 89 89 85 88 88 79 80 79 78 80 78
Caribbean 117 113 122 118 113 124 109 104 110 110 104 112
Costa Rica 119 118 121 102 107 105 103 100 100 88 91 I 87 El Salvador 92 89 95 87 86 101 86 81 84 81 78 89 Guatemala 99 95 103 112 109 115 83 78 82 94 89 91 Honduras 119 117 124 122 125 133 102 97 99 104 103 107 Nicaragua 95 83 95 88 89 96 80 68 75 74 73 76 Panama Ill 115 114 110 115 114 101 103 100 101 103 100
Central America 103 99 106 103 104 109 90 84 88 90 89 90
Argentina 116 Ill 121 119 114 124 106 100 107 109 103 110 Bolivia 114 79 100 114 76 97 100 68 83 100 65 81 Brazi I 118 122 129 118 117 126 105 105 109 105 101 107 Chile 112 Ill 117 112 Ill 117 103 101 105 103 101 105 Colombia 121 119 121 121 120 122 109 106 105 110 106 105 Ecuador 130 108 113 130 110 '15 114 92 94 114 94 95 Guyana 97 84 85 95 82 83 95 81 82 93 79 80 Paraguay 127 125 130 126 121 124 110 105 107 109 102 102 Peru 98 86 99 100 83 97 86 74 83 88 71 81 Suriname 129 126 130 129 126 130 128 124 125 128 124 125 Uruguay 109 110 112 107 108 110 107 108 109 105 106 107 Venezuela 118 117 119 120 118 120 99 95 94 101 96 95
South America 117 116 123 118 114 122 105 101 105 106 100 104
Latin America 115 115 120 117 115 121 103 100 102 104 100 103
1/ Revised data for 1982 and 1983; preliminary for . Source: Economic Research Service, USDA, Indices of Agricultural Production.
40

Table 3.--Area and production of selected agricultural products by principal Latin American countries or regions 1/
Area 21 Production Coomodity by country
1982 1983 1984 3/ 1982 1983 1984 3/
I ,000 hectares I ,000 tons Wheat:
Mexico 950 840 950 4,200 3,200 4,200 Argentina 7,320 6,880 5,900 15,000 12,300 13,200 Brazi I 2,828 I ,900 I ,900 I ,849 2, 100 I ,821 Chile 374 359 471 650 586 850 Uruguay 295 270 280 420 380 400
Tota II, 767 10,249 9,501 22,119 18,566 20,471
Rice(rough): Mexico 170 170 130 510 435 375 Cuba 160 150 155 497 462 480 Dominican Republic 120 130 135 331 388 400 Haiti 50 50 50 105 % 120 Costa Rica 76 88 70 211 267 211 Nicaragua 41 38 45 131 135 169 Panama 95 106 % 187 120 187 Argentina 81 129 125 277 475 400 Brazi I 5,350 6,000 6,000 7,800 9,000 9,000 Colombia 481 397 354 2,070 I, 732 1,5% Guyana, 95 90 90 276 205 210 Peru 160 180 200 706 630 850 Suriname 60 60 65 244 251 279 Uruguay 70 75 80 337 389 414 Venezuela 223 164 151 671 450 408
Total 7,232 7,827 7,746 14,353 15,035 15,099
Corn: Mexico 6,000 6,500 6,300 7,000 9,300 9,500 Haiti 250 250 250 170 180 190 El Salvador 238 241 242 408 438 502 Guatemala 846 760 850 I, 100 988 I ,005 Honduras 290 290 350 385 490 520 Nicaragua 193 180 170 182 210 200 Ar~entina Bo ivia
2,970 286
3,025 261
3,250 9,000 9,200 II, 300 322 450 338 489
Brazi I II ,050 12,700 12,000 19,500 21,000 20,000 Colombia 643 582 590 893 864 864 Paraguay 350 370 400 465 420 450 Peru 347 340 390 625 592 720 Venezuela 305 316 313 501 487 550
Total 23,768 25,815 25,427 40,679 44,507 46,290
Grain Sorghum: Mexico I, 100 I ,400 I, 300 2,800 4,000 3,800 Haiti 120 120 125 110 115 120 El Salvador 119 110 116 123 121 139 Nicaragua 35 44 52 54 95 136 Argentina 2,519 2,370 2,050 8,000 7,200 6,800 Colombia 298 272 236 575 595 570 Uruguay 70 75 75 75 140 140 Venezuela 220 197 239 377 364 472
Total 4,481 4,588 4,193 12, 114 12,630 12,177
41

Table 3.-Area and production of selected agricultural products by_principal Latin American countries or regions--continued 1/
Area 2/ Production Corrrnodity by country
1982 1983 1984 3/ 1982 1983 1984 3/
I, 000 hectares I ,000 tons Beans, dry:
Mexico I ,600 I ,900 I ,600 800 I, 100 800 Dominican Republic 50 . 50 50 41 35 40 Haiti 92 90 90 35 34 34 El Salvador 49 49 50 38 42 48 Nicara~ua 50 50 50 60 60 60 Argentina 180 180 188 130 180 195 Brazi I 6,000 4,077 5,329 2,950 I, 700 2,639 Chile 122 86 85 162 84 94 Paraguay 80 80 80 60 60 60 Peru 57 50 55 49 50 55 Venezuela 62 74 62 32 36 30
Total 8,342 6,686 7,639 4,357 3,381 4,055
Potatoes: Mexico 73 67 79 I ,054 805 950 Cuba 13 13 14 226 230 235 Ar~entina 95 105 105 I ,817 2,018 2,018 Bo ivia 174 117 130 900 302 800 Braz i I 180 190 168 2,100 I ,818 2,221 Chile 80 70 90 842 684 I ,036 Colombia 165 161 160 2,149 2,034 I ,980 Peru 180 150 160 I ,832 I, 300 I ,400
Total 960 873 906 10,920 9,191 10,640
Cotton: Mexico 204 245 320 188 226 272 Guatemala 49 51 60 48 60 76 Nicaragua 90 117 120 76 85 87 Argentina 395 360 510 153 Ill 180 Brazi I 2,070 2,125 I ,960 645 655 658 Colombia 149 56 119 88 33 77 Paraguay 270 240 280 90 80 90 Peru 83 95 120 32 72 86
Total 3,310 3,289 3,489 I, 320 I, 322 I ,526
Peanuts: Mexico 45 45 40 50 60 55 Argentina 166 125 157 270 250 307 Brazi I 235 210 150 305 250 220
Total 446 380 347 625 560 582
Soybeans: Mexico 370 350 350 550 600 550 Argentina I ,986 2,281 2,800 4,150 4,200 6,775 Brazi I 8,202 8,136 9, 320 12,835 14,750 15,200 Paraguay 420 350 420 600 520 550
Total 10,978 11,117 12,890 18,135 20,070 23,075
Tobacco: Mexico 42 42 41 68 60 55 Cuba 55 50 48 45 40 38 Dominican Repub I ic 35 24 25 43 36 32 Argentina 56 60 63 68 64 67 Brazi I 245 285 285 378 378 415 Colombia 25 29 23 28 35 28
Total 458 490 485 630 613 635
T/ Includes crops harvested mainly in year shown. Latin America totals are for those countries for which data are shown. 2/ Harvested area insofar as possible. 3/ Preliminary. Sources: Economic Research Service. Foreign A~ricultural Service, USDA; Food and Agricultural Organization of the Uni ed Nations.
42

Table 4.-Latin America: Production of selected agricultural products 1/
Conmodity I ,000 tons by country: 1982 1983 1984 2/
Coffee: Mexico 272 262 269
I ,000 tons Dominican Republic 51 66 50 Costa Rica 138 124 141
Crops: El Salvador 174 168 172 Cassava: Guatemala 153 140 152
Cuba 330 300 300 Honduras 85 108 78 Dominican Republic 162 163 165 Nicaragua 71 43 60 Haiti 260 260 260 Brazi I 1065 1800 1620 Bolivia 288 180 280 Colombia 860 798 780 Brazi I 24500 23000 22096 Total 2869 3509 3322 Colombia 2000 1555 1754 Paraguay 2100 2200 2300 Livestock and Peru 295 347 350 poultry products: Total 29935 28005 27505 Beef and vea I :
Sugar, centrifugal Mexico 1381 1229 1318 (raw): Cuba 160 165 170 Mexico 3078 3242 3405 Dominican Republic 49 49 46 Cuba 8210 7200 8500 Costa Rica 77 67 62 Dominican Republic 1219 1159 1100 El Salvador 30 30 30 Other Caribbean 850 820 850 Guatemala 75 63 64 (include Belize) Honduras 68 66 65 Central America 1716 1731 1750 Nicaragua 54 45 45 (less Belize) Argentina 2579 2384 2570 Argentina 1617 1621 1535 Brazi I 2400 2400 2200 Brazi I 8346 9000 9500 Colombia 684 619 629 Colombia 1281 1332 1283 Uruguay 383 412 314 Peru 614 450 626 Venezuela 337 340 330 Venezuela 360 360 365 Total 8277 7869 7843 Total 27291 26915 28914 Pork:
Cottonseed: Mexico 998 1223 942 Mexico 313 377 460 Argentina 230 232 235 El Salvador 64 59 45 Brazi I 970 950 860 Guatemala 138 76 95 Colombia 101 110 112 Honduras 10 6 7 Total 2299 2515 2149 Nicaragua 136 127 175 Poultry Meat: Argentina i90 220 333 Mexico 561 538 560 Brazi I 1164 1198 1007 Dominican Republic 66 72 68 Colombia 140 61 152 Argentina 218 214 245 Paraguay 175 141 180 Brazi I 1596 1580 1450 Peru 130 60 110 Venezuela 304 290 332 Total 2560 2325 2564 Total 2745 2694 2655
Cocoa Beans: Milk: Mexico 35 38 38 Mexico 10069 9855 7699 Dominican Republic 39 43 42 Cuba 900 950 950 Brazi I 300 339 346 Dominican Republic 357 358 360 Ecuador 88 55 55 Argentina 5652 5300 5200 Total 462 475 481 Brazi I 10100 10700 10500
Bananas: Chile 1055 927 910 Mexico 1240 1617 1500 Colombia 2956 2941 3090 Cuba 220 210 220 Total 31089 31031 28709 Dominican Republic 320 325 330 Eggs: Costa Rica 1050 939 726 Mexico 550 588 624 Guatemala 480 490 500 Argentina 175 180 180 Honduras 1509 1500 1600 Brazi I 560 500 472 Nicaragua 157 160 180 Chile 67 61 63 Panama 600 615 600 Peru 47 45 46 Brazi I 5260 5200 5100 Total 1399 1374 1385 Ecuador /3 1720 1295 1524 Woo I , shorn: Peru 740 740 740 Argentina 152 155 158 Venezuela 921 933 964 Brazi I 30 30 30
Total 14217 14024 13984 Uruguay 78 82 84 Total 260 267 272
Conf1nued
1/ Crops harvested mainly in year shown; cocoa Agricultural Service, USDA; Food and Agricultural beans and coffee harvest beyin in year shown. Organization of the United Nations, Production 2/ Preliminary. 3/ Exportab e type only. Yearbook of Agriculture 1983. Sources: Economic Research Serv1ce and Foreign
43

Table 5.-Latin America: Exports and imports of selected agr i cuI tura I conmodi ties---continued
Conmodity Imports Conmodity Imports by country by country
1982 1983 1/ 1984 21 1982 1983 II 1984 21
1000 tons 1,000 tons
Wheat (including flour in wheat equivalent): Mexico 15 10 10 Cocoa Beans: Arrontina 9868 7857 8300 Mexico 3 12 10
otal 9883 7867 8310 Dominican Republic 31 38 36 Rice, mil led basis:
Argentina 97 71 185 Brazi I 143 152 107
Colombia 2 7 25 Ecuador 83 55 48
Guyana 78 35 30 Total 260 257 201 Suriname 131 125 130 Beef and Veal:/3 Uruguay 228 171 225 Costa Rica 42 33 20
Total 536 409 595 Honduras 23 20 18 Corn: Nicaragua 10 15 12
Argentina 5765 6056 5448 Argentina 522 Brazi I 700 0 178 415 248
Total 6465 6056 5626 Brazi I 357 440 500
Sorghum: Colombia 18 14 7 Argentina 5544 5197 4170 Uruguay 169 225 134
Total 5544 5197 4170 Total 1141 1122 939 Sugar, raw basis: Cotton, raw:
Cuba 7734 6792 7500 Mexico 126 69 100 Barbados 86 65 89 Guatemala 42 46 52 Dominican Republic 816 955 950 Nicaragua 74 76 80 Jamaica 130 135 155 Trinidad & Tobago 50 62 65 Argentina 64 25 60
Belize 104 Ill 97 Brazi I 152 0 33
Costa Rica 55 64 58 Colombia 18 8 26 El Salvador 56 78 103 Peru 60 30 35 Guatemala 180 278 250 Paraguay 112 73 83 Honduras 87 Ill 102 Total 648 327 469 Nicaragua 97 129 100 Tobacco, unmanufactured: Panama 112 100 60 Mexico 19 18 16 Argentina 553 770 310 Cuba 10 3 5 Brazi I 2588 2150 3477 Colombia 314 300 214 Dominican Republic 12 12 15
Guyana 265 255 230 Argentina 26 25 25
Peru 62 92 119 Brazi I 145 155 161 Total 13289 12447 13879 Colombia II 9 9
Coffee, green or roasted: Para~uay 9 13 14 Mexico 126 179 162 To al 232 235 245 Cuba 8 8 9 Soybeans: Dominican Republic 34 36 33 Argentina 2151 1338 3132 Haiti 23 20 30 Brazi I 797 1316 1561 Costa Rica 96 99 102 El Salvador 140 144 174 Paraguay 830 610 430
Guatemala 122 127 138 Total 3778 3264 5123
Honduras 57 74 63 Soybean Mea I :
Nicaragua 59 61 60 Argentina 1209 1765 2450
Brazi I 888 931 1030 Bot ivia 21 30 30 Colombia 551 539 625 Brazi I 7956 8206 7613
Total 2104 2217 2426 Paraguay 16 49 56 Bananas, plaintains, fresh: Uruguay 3 3 5
Guadeloupe 100 100 100 Tot a 9205 10053 10153 Jamaica 21 25 26 Martinique 80 80 80 Soybean 0 i I :
Windward Is. 112 110 100 Argentina 220 298 475
Costa Rica 999 989 990 Brazi I 889 959 929 Guatemala 350 306 308 Total 1109 1257 1404 Honduras 812 635 830 Barley: Nicaragua 50 50 50 Argentina 40 20 40 Panama 545 572 500 Uruguay 65 118 125 Brazi I 59 92 5 Colombia 778 752 900
Tota 105 138 165
Ecuador 1254 800 974 Total 5160 4511 4863 Continued
Continued
44

Table 5.-Latin America: Exports and imports selected-agricultural commodities
Conrnodity Exports Conrnodity Exports by country by country
1982 1983 1/ 1984 21 1982 1983 1/ 1984 2/
1000 tons 1000 tons Soybean Meal:
Wheat: Mexico 39 169 118 Mexico 518 463 342 Cuba 140 154 160 Cuba 1270 1300 1200 Dominican Republic 55 75 81 Dominican Republic 160 200 175 Chile 43 34 30 Haiti 155 158 170 Peru 30 36 40 Jamaica 175 180 190 Venezuela 500 496 585 Trinidad & Tobago 105 110 120 Total 807 964 1014 Costa Rica 100 115 110 Soybean 0 i I : El Salvador 100 119 150 Mexico 107 I 88 Guatemala 104 125 140 Dominican Republic 34 35 37 Honduras 81 70 112 Bolivia 20 20 20 Nicaragua 57 0 50 Chile 75 104 80 Panama 59 62 65 Colombia 126 90 63 Brazi I 4170 4100 5000 Ecuador 40 55 50 Colombia 564 697 580 Peru 69 97 50 Chile 992 1158 959 Venezuela 47 57 100 Peru 968 972 972 Total 518 459 488 Venezuela 773 868 1000 Barley:
Total 10351 10747 11335 Mexico 3 85 83 Rice, milled basis: Cuba 85 50 70
Mexico I 50 168 Chile 0 0 12 Cuba 200 225 220 Colombia 98 118 150 Jamaica 44 48 50 Peru 48 38 50 Trinidad & Tobago 43 55 50 Total 234 291 365 Brazi I 124 400 500 Apples: Chile 21 31 8 Mexico 4 I I Peru 58 101 48 Venezuela 12 2 I
Total 491 910 1044 Brazi I 185 180 180 Corn: Total 201 183 182
Mexico 226 4790 2511 Pulses: Cuba 410 405 400 Mexico 147 2 50 Dominican Republic 165 255 175 Cuba 90 90 95 Jamaica 150 170 172 Colombia 26 21 20 Trinidad & Tobago 120 125 120 Venezuela 62 94 80 Brazi I 0 500 200 Total 325 207 245 Chile 397 144 36 Beef and Vea I : Peru 480 402 300 Brazi I 21 20 25 Venezuela 1033 1380 1600 Venezuela 59 18 6
Total 2981 8171 5514 Total 80 38 31 Sorghum:
Mexico 1489 3409 2775 1/ Revised. 2/ Preliminary. 3/ Carcass-weight Venezuela 287 339 basis; excludes fats and offal.
Total 1489 3696 3114 Sources: Economic Research Service and Foreign Sugar, raw basis: Agricultural Service, USDA; Food and Agricultural
Mexico 418 850 289 Organization of the United Nations. Chile 181 203 177 Uruguay 25 27 25 Venezuela 333 377 150
Total 957 1457 641 Bananas, plaintains, fresh:
Argentina 161 150 150 Venezuela 130 133 130
Total 291 283 280 Soybeans:
Mexico 537 1056 1674 Dominican Republic 23 19 12 Haiti 69 90 75 Jamaica 62 90 63 Brazi I 1251 33 150 Peru 2 8 0 Venezuela 79 70 114
Total 2023 1366 2088
Continued
45

Table 6.-u.s. Agricultural trade with Latin America
Exports Imports Country
1982 1983 1984 II 1982 1983 1984 II
Mi I I ions Dot Iars
Mexico I 156.3 1942.4 2014.7 I 158.3 1279.4 1278.0
Bahamas 63.6 65.0 70.4 I • I 1.8 4.2 Barbados 28.4 30.2 32.5 12.3 9. I 7.4 Bermuda 40.1 42.1 44.2 0.2 0.1 0. I Dominican Republic 177.1 160.2 167.5 333.0 366.4 458.9 French West Indies It .8 7.3 6.4 1.2 0.3 0.8 Haiti 67.6 70.5 72.9 37.3 40.7 38.7 Jamaica I I I .4 I 19.5 144.8 10.8 26.0 29.9 Leeward & Windward Isles 48.7 45.6 58.7 4.7 8.6 7.2 Netherlands Anti I les 82.9 76. I 76.6 I. 7 0.2 1.5 Trinidad & Tobago 144.2 140. I I 31.3 4.8 2.8 It .5 Other Caribbean Islands 9.4 It .o 14.1 0.2
Caribbean 785.2 767.6 819.3 407. I 455.9 560.4
Belize 8.4 7.2 8.6 20.5 13.7 18.4 Costa Rica 44.2 52.9 41.8 263.0 269.6 310.1 El Salvador 54.9 86.2 100.9 189.0 243.4 231.2 Guatemala 67.5 68.3 89.5 237.8 294.4 361.8 Honduras 33.3 41.2 45.6 260.2 263.4 282.1 Nicaragua 22.9 23.8 15.4 68.4 81.2 47. I Panama 86.7 100.9 85.7 86.8 133.7 107.3
Central America 317.9 380.3 387.5 I 125.7 1299.4 1358.0
Argentina I 7. I 18. I 18.8 252.5 281.0 313.5 Bot ivia 18.1 48.5 24.0 19.1 18.3 6.6 Brazi I 525.0 478.7 508.2 1498.2 1655.5 21 tO. I Chile 245.9 205.5 154.6 96.1 126.4 157. I Colombia 282.8 250.1 213.8 545.3 569.5 714.9 Ecuador 104.7 I 15.0 151.4 347.1 290.0 412.0 French Guiana 0.5 0.3 0.2 0. I Guyana 7.9 3.5 4.5 18.7 13.7 16.1 Paraguay 2.2 I • I I • I 24.6 28.3 27.0 Peru 278. I 310.6 176.2 136.3 130.3 167.0 Suriname 21.2 20.2 19.5 0.2 0. I Uruguay 3.4 6. I 7.9 12.9 13.4 20.0 Venezuela 670.8 664.9 782.5 10.9 15.8 32.5
South America 2177.7 2122.6 2062.7 2961.9 3142.3 3976.9
Total Latin America 4437 .I 5212.9 5284.2 5653.0 6177.0 7173.3
Total World 36627.0 36098.0 37826.0 15341.0 16530.0 19324.0
Percentage of world Latin America 12. I 14.4 14.0 36.8 37.4 37. I
----Not available. 1/ Preliminary Sources: Bureau of the Census, Foreign Agricultural Service, USDA.
46

Economic Indicators of the Farm Sector Order Form
r------------------- _;-:_::-:~il~ij~~~~:~~~~~~~~i~~ 1 Enclosed is $ 0 check. Credit Card Orders Only
I 0 money order. or charge to my L!!J Depos•t Account No VISA•
I I I I I I I I 1-0
Total charges$ ______ F1ll m the boxes below
: Order No.--- {EB] Exp1rat1on Date I I I I J Month/Year L. -L. _.L-L.
1 Mall to: Superintendent of Documents I U.S. Government Printing Office
I Washington, D.C. 20402
Please enter my subscription to Economic Indicators of the Farm Sector (ECI FS) for one year at $15.00 Domestic; $18.75 Foreign.
I For Olllce Uae Only
I Ouant1ty Charges
I ___ Enclosed ___ To be ma•led __ _
I ___ Subscr•pl•ons __ _
Poslage -------1 Fore•gn handhng -----
1 MMOB
OPNR
Name-F•rs! Las!
I I I I I I I I I I I I I I UPNS
---Ooscounl PLEASE PRINT OR TYPE I I ~~ I Make checks payable to Super~ntendent of Documents
L---------------------------------~
47

UNITED STATES DEPARTMENT OF AGRICULTURE WASHINGTON, D.C. 20250
OFFICIAL BUSINESS PENALTY FOR PRIVATE USE, $300
Moving? To change your address send this sheet with label intact, showing new address, to EMS, Room 228, 1301 New York Avenue, NW, USDA, Washington, D.C. 200054788
FIRST.CLASS MAIL
POSTAGE & FEES PAID USDA
PERMIT NO. G-145
Keep tabs on farm income and expenses with the Economic Indicators of the Farm Sector series.
This series of five separate reports, offered now on a subscription basis, explores the economic status of U.S. farms to give you a comprehensive update on where U.S. agriculture is headed.
Here are the titles you will be receiving:
Income and Balance Sheet Statistics State Income and Balance Sheet Statistics Farm Sector Review Production and Efficiency Statistics Costs of Production
......... ~~~·~Subscriptions may be purchased from:
E)lpenseS Superintendent of Documents U.S. Government Printing Office Washington, D.C. 20402
Send $15 ($18.75 for foreign subscribers) in check or money order to Superintendent of Documents. Request the Economic Indicators of the Farm Sector (ECI FS) series.