Lateral behavior of steel frames with discretely connected ... · Lateral behavior of steel frames...
211
LATERAL BEHAVIOR OF STEEL FRAMES WITH DISCRETELY CONNECTED PRECAST CONCRETE I NFILL PANELS P.A. Teeuwen
Transcript of Lateral behavior of steel frames with discretely connected ... · Lateral behavior of steel frames...

LATERAL BEHAVIOR OF STEEL FRAMES
WITH DISCRETELY CONNECTED
PRECAST CONCRETE INFILL PANELS
P.A. Teeuwen

Bouwstenen 139
ISBN 978-90-6814-622-6
NUR-code 955
© 2009 by P.A. Teeuwen
Cover design by A.W.M. van Gennip
Printed by Eindhoven University Press Facilities,
Eindhoven University of Technology, The Netherlands

LATERAL BEHAVIOR OF STEEL FRAMES
WITH DISCRETELY CONNECTED
PRECAST CONCRETE INFILL PANELS
PROEFSCHRIFT
ter verkrijging van de graad van doctor aan de Technische Universiteit Eindhoven,
op gezag van de rector magnificus, prof.dr.ir. C.J. van Duijn,
voor een commissie aangewezen door het College voor Promoties in het openbaar
te verdedigen op donderdag 26 november 2009 om 16.00 uur
door
Paulus Andreas Teeuwen
geboren te Geldrop

Dit proefschrift is goedgekeurd door de promotoren:
prof.ir. C.S. Kleinman
en
prof.ir. H.H. Snijder
Copromotor:
dr.ir. H. Hofmeyer

Samenstelling van de promotiecommissie:
prof.ir. J. Westra Technische Universiteit Eindhoven
prof.ir. C.S. Kleinman Technische Universiteit Eindhoven
prof.ir. H.H. Snijder Technische Universiteit Eindhoven
dr.ir. H. Hofmeyer Technische Universiteit Eindhoven
prof.dr.ir. L. Taerwe Universiteit Gent
prof.ir. F.S.K. Bijlaard Technische Universiteit Delft
prof.ir. D.R.W. Martens Technische Universiteit Eindhoven

vi | P a g e
ACKNOWLEDGEMENTS
Successfully finishing this thesis has only been possible with the help from other persons
whom I own some words of gratitude to for a diversity of reasons.
First of all, I wish to express my sincere gratitude to professor Cees Kleinman and
professor Bert Snijder, for offering me the doctoral student position in this research
project and for their supervision, encouragement, and generous support towards the
completion of this thesis. Furthermore, my gratitude extends to Herm Hofmeyer for his
scientific contribution and valuable guidance during the project.
Besides, I wish to thank the staff of the Pieter van Musschenbroek laboratory at
Eindhoven University of Technology, especially Eric Wijen and Theo van de Loo, for their
professional assistance before and during the experiments, yet also for the pleasant
informal conversations during the breaks.
Furthermore, I would like to thank my (former) fellow doctoral students, for providing me
support in various ways and for a good atmosphere at the office and at social events
outside of work. I also would like to thank the student Jan-Pieter Kansen for his
contribution to this thesis.
Finally, I wish to thank my parents and friends and especially my girlfriend Elke. Thank you
for listening to me and encouraging me in difficult times. Without your patience and
understanding, as well as your moral support, this thesis would not have been possible.
Paul Teeuwen
Eindhoven, September 2009

vii | P a g e
SUMMARY
Lateral behavior of steel frames with discretely connected precast concrete infill panels
As an alternative to the conventional structures for tall buildings, a hybrid lateral load
resisting structure has been designed at Eindhoven University of Technology. It consists of
discretely connected precast concrete panels with window openings in steel frames, and is
a new application in infilled frames. Besides the structural advantages of hybrid
construction, this structure offers an alternative construction method, improving the
constructability of tall buildings. This will result in more economical and high quality
buildings.
The infilled frame is a type of structure that has proven to be effective and efficient in
bracing low-rise and medium-rise buildings to resist in-plane lateral loads. It acts by
composite action between the infill and its surrounding frame. Structural interaction
between the two components produces a composite structure with a complicated
behavior due to the fact that the frame and the infill mutually affect each other. Since the
early fifties extensive research has been done into the composite behavior of infilled
frames with masonry and cast-in-place concrete infills without openings. However, the
application of discretely connected concrete panels with openings as bracing elements in
steel frame structures has not been performed yet and represents a new area of research
in infilled frames.
The main objective of this investigation is to develop practical universally applicable
design models for infilled steel frames with discretely connected precast concrete panels,
allowing for an accurate prediction of the strength, stiffness and deformation capacity of
this type of structure. In order to develop these design models, the structure has been
subjected to experimental, numerical and analytical investigation.
First, full-scale tests on single-storey, single-bay infilled frame structures were carried out.
Objectives of this experimental study were to observe the general behavior of the infilled
frame in terms of stiffness, strength and failure modes. In addition, experiments were
performed on components of the discrete panel-to-frame connection.
Subsequently, finite element models were developed and validated by simulating the
experiments. For this purpose, finite element analyses taking non-linear material and
structural behavior into account were performed. It has been shown that the finite
element model developed for the overall infilled frame behavior can be used to predict
the lateral load versus deflection relationship and the ultimate lateral load with good

S u m m a r y
viii | P a g e
accuracy. Accordingly, the validated finite element model has been used to carry out a
parameter study to investigate various configurations of the infilled frame. Four
parameters have been studied with respect to their influence on the structural response.
These parameters are the frame member dimensions, the rotational stiffness of the frame
joints, the infilled frame aspect ratio and the panel opening geometry.
From the simulated load-deformation curves, structural characteristics have been derived.
These have served as a verification for the developed analytical models for the prediction
of the lateral stiffness, the ultimate lateral load and deformation capacity of the structure
under consideration. The analytical models are based on the concept of the equivalent
diagonal strut, considering the structure as an equivalent braced frame system with a
compression diagonal replacing the infill.
Finally, a practical method for designing steel frames with discretely connected precast
concrete infill panels has been proposed. The aim of this method is to get a good
prediction of the internal forces and the lateral deflection in the preliminary phase of the
design, without the use of advanced computer simulations. The design method provides a
useful guideline that a design engineer can follow, in order to design building structures
consisting of steel frames with discretely connected precast concrete infill panels,
resulting in a ductile structure, possessing both adequate strength and stiffness.

ix | P a g e
SYMBOLS
Each symbol used in this thesis is explained where it is introduced. The list below gives an
overview of the symbols that are frequently used in this thesis, subdivided according to
the field of application they belong to.
Symbols relevant for bolt-nut assemblies:
Latin symbols:
��� : Shear area for bolt threads [mm2] ��� : Shear area for nut threads [mm
2] �� : Nominal area of the bolt shank [mm
2] �� : Tensile stress area of the bolt [mm
2] �� : Modification factor for nut dilation [-] �� : Modification factor for thread bending applied for the bolt [-] � : Modification factor for thread bending applied for the nut [-] : Nominal diameter (of the nut) [mm] � : Minor diameter of the nut [mm] � : Pitch diameter of the nut [mm] �� : Nominal diameter of the bolt [mm] � : Major diameter of the bolt [mm] �� : Pitch diameter of the bolt [mm] � : Minor (root) diameter of the bolt [mm] �� : Young’s modulus of the bolt material [N/mm
2] � : Breaking load of the bolt [N] � : Stripping load for bolt-nut assembly [N] �� : Stripping load for bolt threads [N] �� : Stripping load for nut threads [N] ��� : Tensile strength of the bolt material [N/mm
2] ��� : Tensile strength of the nut material [N/mm
2] ��� : Yielding strength of the bolt material [N/mm
2] ��� : Yielding strength of the nut material [N/mm
2] �� : Stiffness of the bolt [N/mm] �� : Length of the bolt shank [mm] ��� : Length of the bolt thread included in the grip [mm] � : Nut height [mm] �� : Effective nut height for stripping strength [mm] � : Pitch of the thread [mm] � : Width across the flats of nut [mm]

S y m b o l s
x | P a g e
Symbols relevant for analytical models for semi-integral infilled frames
Latin symbols:
� : Cross-sectional area of a steel section [mm2] �� : Shear area of a steel section [mm
2] � : Height of the panel opening [mm] � : Width of the panel opening [mm] � : Width of a steel section [mm] � : Strength of the panel-to-frame connection [N] �� : Strength of component � of the panel-to-frame connection [N] : Lateral load [N] ! : Strength of the infill panel [N] �;�# : Strength of the semi-integral infilled frame [N] $! : Dead weight of the infill panel [N] % : Width of the gap between the panel and frame [mm] & : Column height between centerlines of beams [mm] ' : Height of the infill panel [mm] ' : Height of a steel section [mm] '( : Height of the panel’s equivalent frame [mm] ) : Second moment of area [mm
4] �� : Stiffness of the panel-to-frame connection [N/mm] ��� : Stiffness of component � of the panel-to-frame connection [N/mm] ��;*## : Effective stiffness of the panel-to-frame connection [N/mm] ��;��� : Initial stiffness of the panel-to-frame connection [N/mm] � ;�+, : Lateral stiffness resulting from column deformation [N/mm] � ;# : Lateral stiffness of the bare frame [N/mm] � ;�# : Lateral stiffness of the semi-integral infilled frame [N/mm] � ;! : Lateral stiffness resulting from panel deformation [N/mm] � ;-�+� : Lateral stiffness resulting from connection deformations [N/mm] �! : Diagonal panel stiffness [N/mm] � : Beam length between centerlines of column [mm] ���.�� : Length of the frame diagonal [mm] / : Length of infill panel [mm] /( : Length of the panel’s equivalent frame [mm] /��.�� : Length of the panel diagonal [mm] 01 : Resistance of the beam-to-column joint [Nmm] 2 : Fillet radius [mm] 31 : Rotational stiffness of the beam-to-column joint [Nmm/rad] 4# : Thickness of the flange of a steel section [mm] 4! : Thickness of the infill panel [mm] 45 : Thickness of the web of a steel section [mm] 6 : Distance of the bolts with respect to the column or beam [mm]

S y m b o l s
xi | P a g e
Greek symbols:
7 : Ratio of the total length to the flexible part of a beam [-] 8 : Ratio of the total length to the flexible part of a column [-] 9 : Lateral deflection [mm] : : Correction factor [-] ; : Factor accounting for the relative stiffness of the frame to the infill [-] <# : Angle between the frame diagonal and the beam [rad] <! : Angle between the panel diagonal and the beam [rad]
Symbols relevant for materials
Latin symbols:
�� : Young’s modulus of concrete [N/mm2] �� : Young’s modulus of steel [N/mm
2] �� : Compressive strength of concrete [N/mm
2] ��= : Design compressive strength of concrete [N/mm
2] ��> : Characteristic cylinder compressive strength of concrete [N/mm
2] ��? : Mean value of the compressive strength of concrete [N/mm
2] ��� : Tensile strength of concrete [N/mm
2] ��� : Stress limit for struts and nodes [N/mm
2] �� : Ultimate tensile strength of steel [N/mm
2] �� : Yield stress of steel [N/mm
2] $# : Fracture energy of concrete [N/mm] $� : Shear modulus of steel [N/mm
2] ��;� : Reduction factor for the strength of struts in strut-and-tie models [-] ��;� : Reduction factor for the strength of nodes in strut-and-tie models [-]
Greek symbols:
7 : Shear retention factor for concrete [-] 8� : Partial safety factor for concrete [-] 8� : Partial safety factor for steel [-] @� : Poisson’s ratio of concrete [-] @� : Poisson’s ratio of steel [-]

xii | P a g e
CONTENTS
Chapter 1: INTRODUCTION ........................................................................................ 1
1.1 Infilled steel frames with precast concrete panels ................................................. 1
1.2 Motivation and relevance ...................................................................................... 2
1.3 Problem statement and objectives ........................................................................ 3
1.4 Research method ................................................................................................... 4
1.5 Thesis outline ......................................................................................................... 5
Chapter 2: LITERATURE REVIEW ................................................................................. 7
2.1 Infilled frames: State of the art .............................................................................. 7
2.1.1 Analysis of infilled frames .............................................................................. 8
2.1.2 Effect of openings ........................................................................................ 13
2.1.3 Infilled frames with precast concrete panels ............................................... 17
2.1.4 Section conclusions ...................................................................................... 18
2.2 Structural bolts ..................................................................................................... 19
2.2.1 Standard bolts: dimensions, grades and strengths ...................................... 19
2.2.2 Strength considerations ............................................................................... 19
2.2.3 Stiffness considerations ............................................................................... 23
2.3 Strut-and-tie modeling of concrete ...................................................................... 24
2.3.1 Historical overview of strut-and-tie modeling ............................................. 26
2.3.2 Strength of struts and nodal zones .............................................................. 27
Chapter 3: CONCEPTUAL DESIGN .............................................................................. 29
3.1 Discrete panel-to-frame connection .................................................................... 29
3.2 Mechanical model ................................................................................................ 33
3.2.1 Structural characteristics frame joints ......................................................... 34
3.2.2 Structural characteristics discrete panel-to-frame connections .................. 34
3.2.3 Structural properties precast concrete panel with window opening .......... 37
3.3 Chapter conclusions ............................................................................................. 38
Chapter 4: EXPERIMENTS .......................................................................................... 39
4.1 Component experiments ...................................................................................... 39
C o n t e n t s
xiii | P a g e
4.1.1 Bolts in compression .................................................................................... 39
4.1.2 Flanges in bending with web in compression .............................................. 42
4.1.3 Plate in compression .................................................................................... 44
4.1.4 Bolt with cap on plate in compression ......................................................... 47
4.2 Full-scale experiments .......................................................................................... 49
4.2.1 Test setup and test program ........................................................................ 49
4.2.2 Experimental observations and results ........................................................ 55
4.3 Chapter conclusions ............................................................................................. 66
Chapter 5: FINITE ELEMENT MODELING .................................................................... 69
5.1 Component modeling ........................................................................................... 69
5.1.1 Mesh and elements ..................................................................................... 70
5.1.2 Material properties ...................................................................................... 71
5.1.3 Boundary conditions and loading ................................................................ 72
5.1.4 Solution procedure ...................................................................................... 72
5.1.5 Validation of finite element model .............................................................. 73
5.2 Full-scale modeling .............................................................................................. 74
5.2.1 Mesh and elements ..................................................................................... 74
5.2.2 Material properties ...................................................................................... 75
5.2.3 Boundary conditions and loading ................................................................ 79
5.2.4 Solution procedure ...................................................................................... 79
5.2.5 Validation of finite element model .............................................................. 79
5.3 Chapter conclusions ............................................................................................. 84
Chapter 6: PARAMETER STUDIES ............................................................................... 85
6.1 Component behavior ............................................................................................ 85
6.1.1 Parameters considered ................................................................................ 85
6.1.2 Material properties ...................................................................................... 86
6.1.3 Geometrical properties ................................................................................ 86
6.1.4 Results .......................................................................................................... 86
6.2 Full-scale behavior ............................................................................................... 90
6.2.1 Parameters considered ................................................................................ 91
6.2.2 Material properties ...................................................................................... 94
6.2.3 Results parameter study .............................................................................. 94
6.3 Chapter conclusions ............................................................................................. 97

C o n t e n t s
xiv | P a g e
Chapter 7: ANALYTICAL MODELING .......................................................................... 99
7.1 Lateral stiffness modeling .................................................................................... 99
7.1.1 Basic model ................................................................................................ 100
7.1.2 Advanced model ........................................................................................ 106
7.1.3 Lateral stiffness model ............................................................................... 112
7.2 Ultimate lateral load modeling .......................................................................... 112
7.2.1 Dead weight panel ..................................................................................... 113
7.2.2 Ultimate lateral load models ..................................................................... 114
7.3 Validation of analytical models.......................................................................... 115
7.4 Chapter conclusions ........................................................................................... 118
Chapter 8: DESIGN RECOMMENDATIONS ................................................................ 119
8.1 Design method ................................................................................................... 119
8.2 Design example .................................................................................................. 122
8.3 Towards a completely integrated tall building system ...................................... 139
8.4 Chapter conclusions ........................................................................................... 142
Chapter 9: CONCLUSIONS & RECOMMENDATIONS ................................................. 143
9.1 Conclusions ........................................................................................................ 143
9.2 Recommendations for future research .............................................................. 145
REFERENCES ................................................................................................................. 147
C o n t e n t s
xv | P a g e
APPENDIXES
APPENDIX A .................................................................................................................. 155
A.1 Resistance of H-section subject to transverse compression ............................... 155
APPENDIX B .................................................................................................................. 159
B.1 Test specimens ................................................................................................... 159
B.2 Measurement results ......................................................................................... 165
APPENDIX C .................................................................................................................. 167
C.1 Moment-rotation curves for rotational springs used in FE-analyses ................. 167
C.2 Comparison of FE- and experimental results ..................................................... 168
C.2.1 Measured and simulated strains................................................................ 168
C.2.2 Experimental and simulated crack patterns .............................................. 169
APPENDIX D .................................................................................................................. 171
D.1 Results parameter study on component ............................................................ 171
D.2 Reinforcement configuration for panels used in parameter study .................... 174
D.3 Results parameter study on infilled frame ......................................................... 179
APPENDIX E .................................................................................................................. 183
E.1 Derivation of equations [7-21] to [7-24] ............................................................ 183
E.2 Derivation of equations [7-27] to [7-31] ............................................................ 188
E.3 0-B-C-diagrams used for equivalent frame members ..................................... 191
CURRICULUM VITAE ..................................................................................................... 195

xvi | P a g e
1 | P a g e
Chapter 1: INTRODUCTION
Scope of the chapter
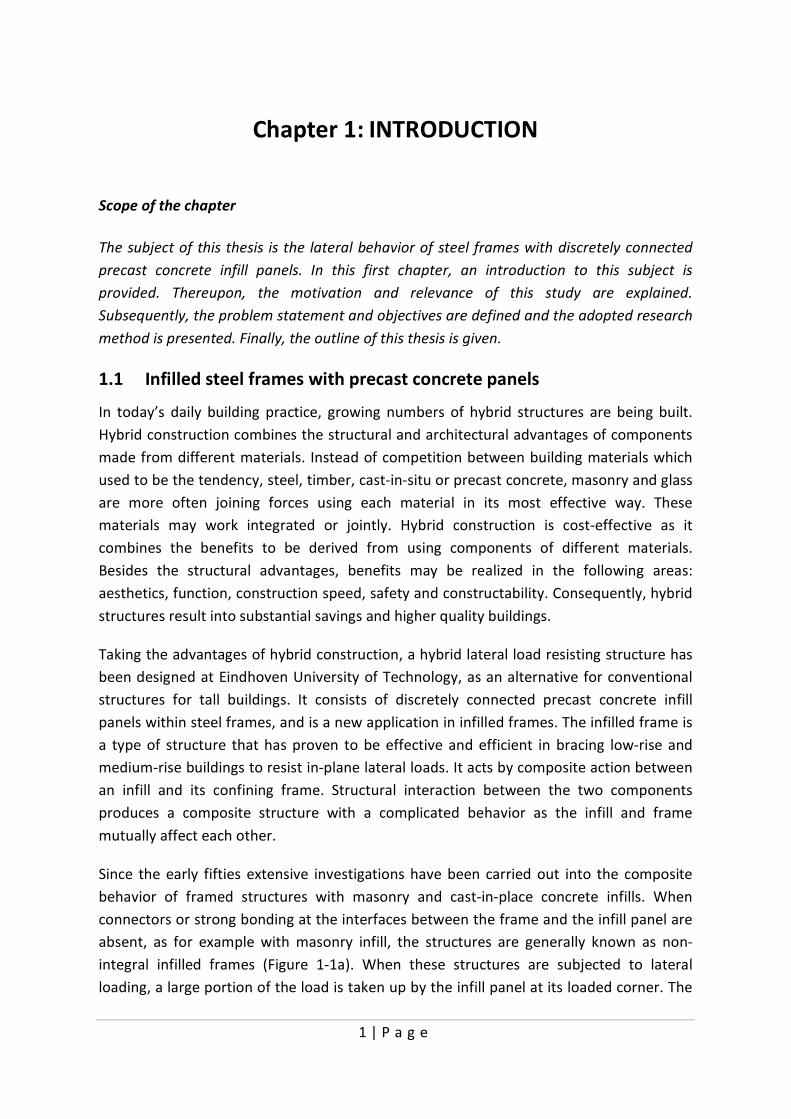
The subject of this thesis is the lateral behavior of steel frames with discretely connected
precast concrete infill panels. In this first chapter, an introduction to this subject is
provided. Thereupon, the motivation and relevance of this study are explained.
Subsequently, the problem statement and objectives are defined and the adopted research
method is presented. Finally, the outline of this thesis is given.
1.1 Infilled steel frames with precast concrete panels
In today’s daily building practice, growing numbers of hybrid structures are being built.
Hybrid construction combines the structural and architectural advantages of components
made from different materials. Instead of competition between building materials which
used to be the tendency, steel, timber, cast-in-situ or precast concrete, masonry and glass
are more often joining forces using each material in its most effective way. These
materials may work integrated or jointly. Hybrid construction is cost-effective as it
combines the benefits to be derived from using components of different materials.
Besides the structural advantages, benefits may be realized in the following areas:
aesthetics, function, construction speed, safety and constructability. Consequently, hybrid
structures result into substantial savings and higher quality buildings.
Taking the advantages of hybrid construction, a hybrid lateral load resisting structure has
been designed at Eindhoven University of Technology, as an alternative for conventional
structures for tall buildings. It consists of discretely connected precast concrete infill
panels within steel frames, and is a new application in infilled frames. The infilled frame is
a type of structure that has proven to be effective and efficient in bracing low-rise and
medium-rise buildings to resist in-plane lateral loads. It acts by composite action between
an infill and its confining frame. Structural interaction between the two components
produces a composite structure with a complicated behavior as the infill and frame
mutually affect each other.
Since the early fifties extensive investigations have been carried out into the composite
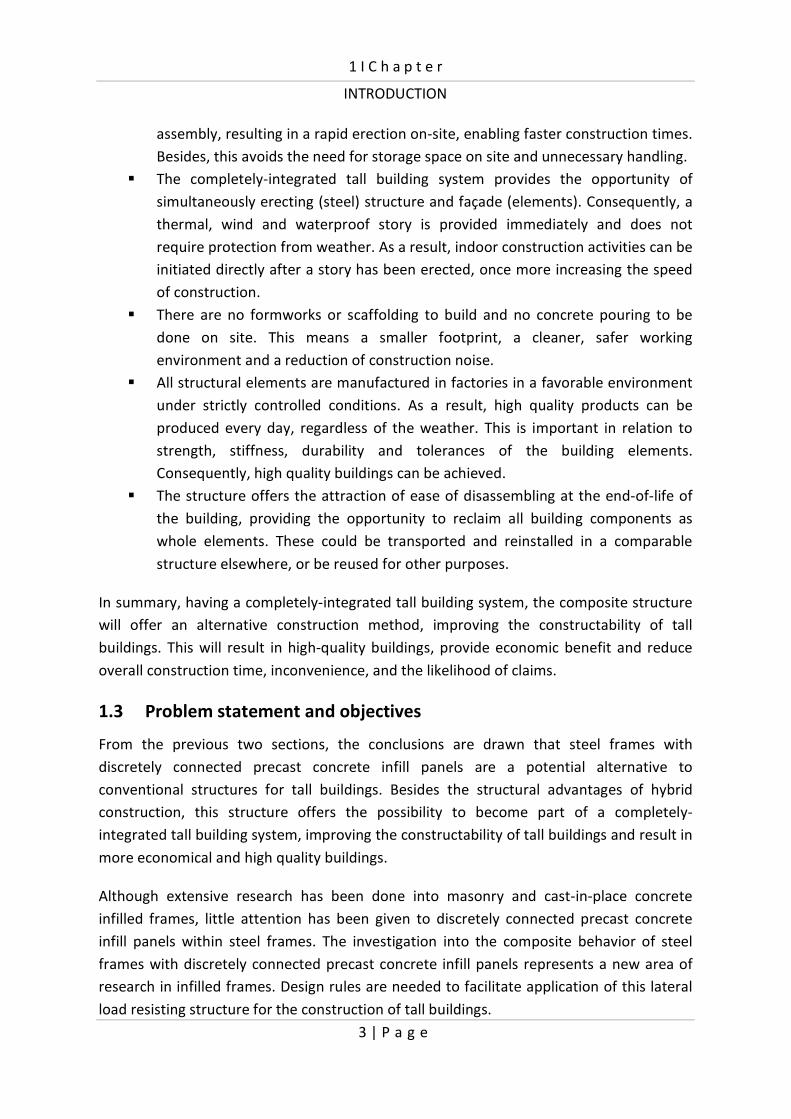
behavior of framed structures with masonry and cast-in-place concrete infills. When
connectors or strong bonding at the interfaces between the frame and the infill panel are
absent, as for example with masonry infill, the structures are generally known as non-
integral infilled frames (Figure 1-1a). When these structures are subjected to lateral
loading, a large portion of the load is taken up by the infill panel at its loaded corner. The

1 I C h a p t e r
INTRODUCTION
2 | P a g e
provision of strong bonding or connectors at the interface enables the infill and frame to
act compositely. These infilled frames are known as fully-integral infilled frames (Figure
1-1b). Part of the shearing load is transmitted from the frame to the infill panel through
the connectors. A variety of methods have been developed for the design and analysis of
non-integral and fully-integral infilled frames.
Discretely connected precast concrete infill panels may be able to provide similar
improvements to frame structures as masonry and cast-in-place concrete infills. However,
the application of discrete interface connections between the infill and frame results in
completely different behavior from non-integral or fully integral infilled frames. Infilled
frames with discrete connections between frame and panel are termed semi-integral
infilled frames (Figure 1-1c), and represent a new area of research in infilled frames.
Figure 1-1: Classification of infilled frames
1.2 Motivation and relevance
Apart from the stiffening and strengthening effect of infills on frames as explained above,
the concept of discretely connected precast concrete panels within steel frames offers the
possibility to be developed into a so-called completely integrated tall building system. This
involves entirely prefabricated elements arriving ready for installation on-site, supplied
with insulation, windows, an outer skin of cladding and preinstalled installations for
vertical transport within the building such as heating, ventilation, and air conditioning
(HVAC), cable ducts, and water and sanitation systems. Such a building system may
considerably improve the constructability of tall buildings as follows:
� The completely-integrated building system enables the assembly of tall buildings
directly from a truck. The prefabricated elements can be scheduled to arrive “just
in time” so they can be lifted directly from a truck into place with a minimum of
manpower. Therefore, on-site building activities will in essence be restricted to
a) Non-integral b) Fully-integral c) Semi-integral
Precast concreteMasonry In-situ concrete
1 I C h a p t e r
INTRODUCTION
3 | P a g e
assembly, resulting in a rapid erection on-site, enabling faster construction times.
Besides, this avoids the need for storage space on site and unnecessary handling.
� The completely-integrated tall building system provides the opportunity of
simultaneously erecting (steel) structure and façade (elements). Consequently, a
thermal, wind and waterproof story is provided immediately and does not
require protection from weather. As a result, indoor construction activities can be
initiated directly after a story has been erected, once more increasing the speed
of construction.
� There are no formworks or scaffolding to build and no concrete pouring to be
done on site. This means a smaller footprint, a cleaner, safer working
environment and a reduction of construction noise.
� All structural elements are manufactured in factories in a favorable environment
under strictly controlled conditions. As a result, high quality products can be
produced every day, regardless of the weather. This is important in relation to
strength, stiffness, durability and tolerances of the building elements.
Consequently, high quality buildings can be achieved.
� The structure offers the attraction of ease of disassembling at the end-of-life of
the building, providing the opportunity to reclaim all building components as
whole elements. These could be transported and reinstalled in a comparable
structure elsewhere, or be reused for other purposes.
In summary, having a completely-integrated tall building system, the composite structure
will offer an alternative construction method, improving the constructability of tall
buildings. This will result in high-quality buildings, provide economic benefit and reduce
overall construction time, inconvenience, and the likelihood of claims.
1.3 Problem statement and objectives
From the previous two sections, the conclusions are drawn that steel frames with
discretely connected precast concrete infill panels are a potential alternative to
conventional structures for tall buildings. Besides the structural advantages of hybrid
construction, this structure offers the possibility to become part of a completely-
integrated tall building system, improving the constructability of tall buildings and result in
more economical and high quality buildings.
Although extensive research has been done into masonry and cast-in-place concrete
infilled frames, little attention has been given to discretely connected precast concrete
infill panels within steel frames. The investigation into the composite behavior of steel
frames with discretely connected precast concrete infill panels represents a new area of
research in infilled frames. Design rules are needed to facilitate application of this lateral
load resisting structure for the construction of tall buildings.
1 I C h a p t e r
INTRODUCTION
4 | P a g e
The main objective of this investigation is to develop practical universally applicable
design models for infilled steel frames with discretely connected precast concrete panels,
allowing for an accurate prediction of the strength, stiffness and deformation capacity of
this structure.
These design models will provide a first step in the design of semi-integral infilled frames,
and will be suited to serve as a basis for developing design rules in standards, finally
facilitating the application of this lateral load resisting structure.
1.4 Research method
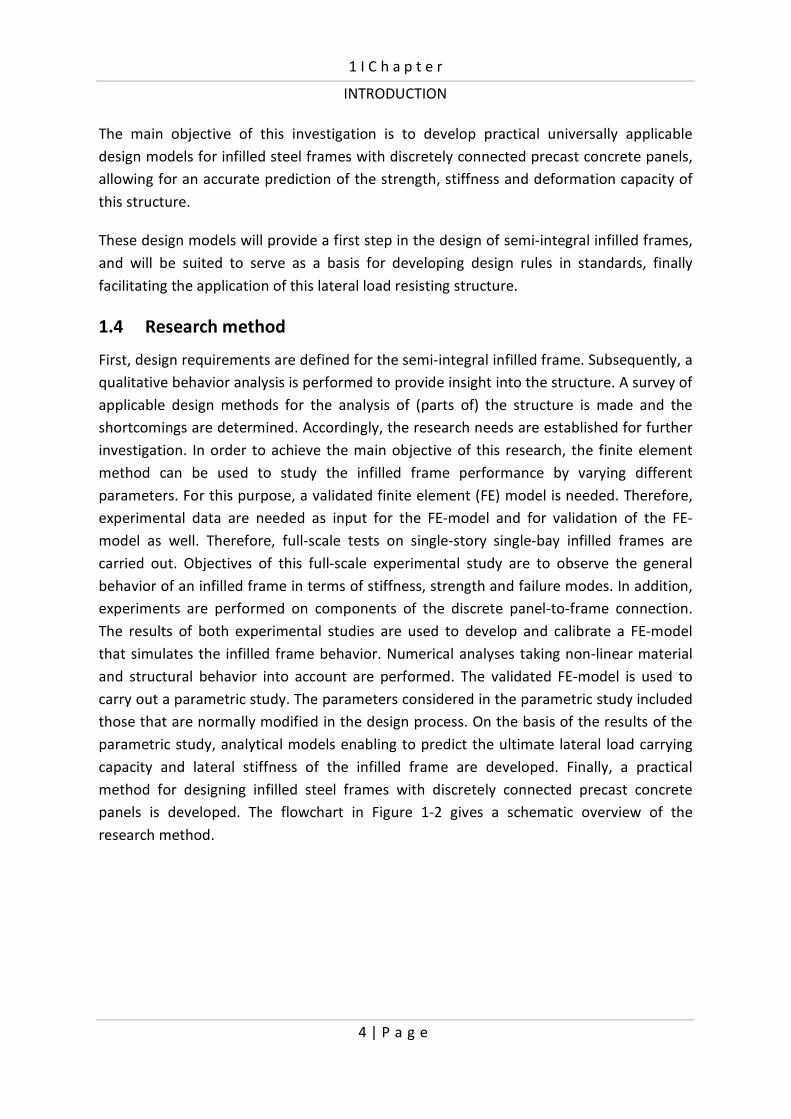
First, design requirements are defined for the semi-integral infilled frame. Subsequently, a
qualitative behavior analysis is performed to provide insight into the structure. A survey of
applicable design methods for the analysis of (parts of) the structure is made and the
shortcomings are determined. Accordingly, the research needs are established for further
investigation. In order to achieve the main objective of this research, the finite element
method can be used to study the infilled frame performance by varying different
parameters. For this purpose, a validated finite element (FE) model is needed. Therefore,
experimental data are needed as input for the FE-model and for validation of the FE-
model as well. Therefore, full-scale tests on single-story single-bay infilled frames are
carried out. Objectives of this full-scale experimental study are to observe the general
behavior of an infilled frame in terms of stiffness, strength and failure modes. In addition,
experiments are performed on components of the discrete panel-to-frame connection.
The results of both experimental studies are used to develop and calibrate a FE-model
that simulates the infilled frame behavior. Numerical analyses taking non-linear material
and structural behavior into account are performed. The validated FE-model is used to
carry out a parametric study. The parameters considered in the parametric study included
those that are normally modified in the design process. On the basis of the results of the
parametric study, analytical models enabling to predict the ultimate lateral load carrying
capacity and lateral stiffness of the infilled frame are developed. Finally, a practical
method for designing infilled steel frames with discretely connected precast concrete
panels is developed. The flowchart in Figure 1-2 gives a schematic overview of the
research method.

1 I C h a p t e r
INTRODUCTION
5 | P a g e
Figure 1-2: Flowchart of the research method
1.5 Thesis outline
This thesis is divided into 9 chapters. In the chapter at issue, the topic of research has
been introduced and the motivation for the research has been explained. In chapter 2, a
state-of-the-art review on infilled frames is presented. Besides, background material on
structural bolts as well as strut-and-tie modeling of concrete is presented, as a thorough
understanding of those is necessary for this research. In chapter 3, the conceptual design
of an infilled steel frame with a discretely connected precast concrete panel is elucidated.
A discrete panel-to-frame connection is introduced that enables steel frames and precast
concrete panels to act compositely when subject to lateral loading. Subsequently, the
behavior of the structure is qualitatively analyzed. Chapter 4 presents a detailed
description of the experiments that were carried out, and discusses the results. Chapter 5
treats the finite element study that was conducted. A comparison between the
experimental and numerical results is presented. In chapter 6 parameter studies are
Development of
analytical models
Component tests
Full-scale tests
Material tests
Development and
validation of FE-model
for infilled frame
Development and validation
of FE-model for a component
Parametric study on
infilled frame
Practical method
for design of
infilled frame
Parametric study
on a component
Definition of design
requirements
Qualitative
behavior analysis
Determination of
research needs

1 I C h a p t e r
INTRODUCTION
6 | P a g e
described and discussed. The derivation of analytical models for predicting the ultimate
lateral load carrying capacity and the lateral stiffness is outlined in chapter 7. In chapter 8,
a method for designing infilled steel frames with discretely connected precast concrete
panels will be presented. Besides, a worked out design example is provided to
demonstrate the application of the design method. Finally, main conclusions and
recommendations for further research are summarized in chapter 9.

7 | P a g e
Chapter 2: LITERATURE REVIEW
Scope of the chapter
This chapter presents a literature review of the state-of-the-art of infilled frames (section
2.1). Furthermore, background material on structural bolts (section 2.2) as well as strut-
and-tie modeling of concrete (section 2.3) is presented, as a thorough understanding of
those is necessary for this research.
2.1 Infilled frames: State-of-the-art
The structural design of tall buildings is predominantly dictated by the requirements for
stiffness and stability. A lateral load resisting system has to provide the building with
sufficient strength and stiffness to resist lateral loads mainly caused by wind pressure or
earthquakes. Traditionally, tall buildings were designed to make use of a single type of
lateral load resisting system, initially simple moment resisting frames, braced frames and
shear wall systems. The trend towards bigger and taller buildings created a demand for
more efficient and innovative structural systems. One of these structures is the infilled
frame, a lateral load resisting structure combining a frame with an infill acting as bracing
within the frame. Gravity loads acting on the structure are supported by the frame
structure only, while lateral loads are transferred to the foundation by composite action
between the infill and its confining frame. Because of the stiffening and strengthening
effect of infills on frames, the drift of the frame structure under lateral loading is
considerably reduced.
Although the contribution of infills to the lateral stiffness and strength of frame structures
has long been recognized, structural engineers have for a long time largely ignored their
influence. Usually infill panels were considered as architectural, non-structural elements
and designed according to criteria such as fire resistance and sound proofing. Main
reasons were the lack of knowledge concerning the composite behavior of infilled frames
and the lack of practical methods for predicting their stiffness and strength. However,
ignoring the infills resulted in substantial inaccuracy in predicting the lateral stiffness
which was not only conservative, but it could even critically cause certain elements in the
lower parts of the structure to be overloaded (Stafford Smith, B., 1962).
It has been shown by many investigators that the contribution of infills to the lateral
stiffness and strength of frames has great potential. However, due to the complexity of
the interaction between infill and frame and the great number of influencing parameters,
the structure is still poorly understood. There are no universally accepted design
guidelines regarding infilled frames. Consequently, most of the current design codes do

2 I C h a p t e r
LITERATURE REVIEW
8 | P a g e
not contain design guidelines for this type of structure. In the following section, a general
review of the different analytical methods used for the analysis of infilled frames is
presented. Thereafter, the effect of openings on infilled frame behavior and the
application of precast concrete infill panels within frames are explicitly treated.
2.1.1 Analysis of infilled frames
Over the past few decades, several methods for the analysis of infilled frames have been
proposed in the literature by various investigators. These methods can be divided into two
groups, depending on the degree of refinement used to represent the structure. The first
group consists of the macro models to which belong the simplified models that are based
on a physical understanding of the structure. The second group involves the micro models
including the finite element formulations, taking into account local effects in detail. Both
types of methods will be discussed hereafter.
Macro models
The basic characteristic of the macro models is that they aim at predicting the overall
stiffness and failure loads of infilled frames, without considering all possible failure modes
of local failure. This group of models can be subdivided to their origin into the following
three categories, based on:
� the concept of the equivalent diagonal strut
� the concept of the equivalent frame
� the theory of plasticity
Equivalent diagonal strut analogy
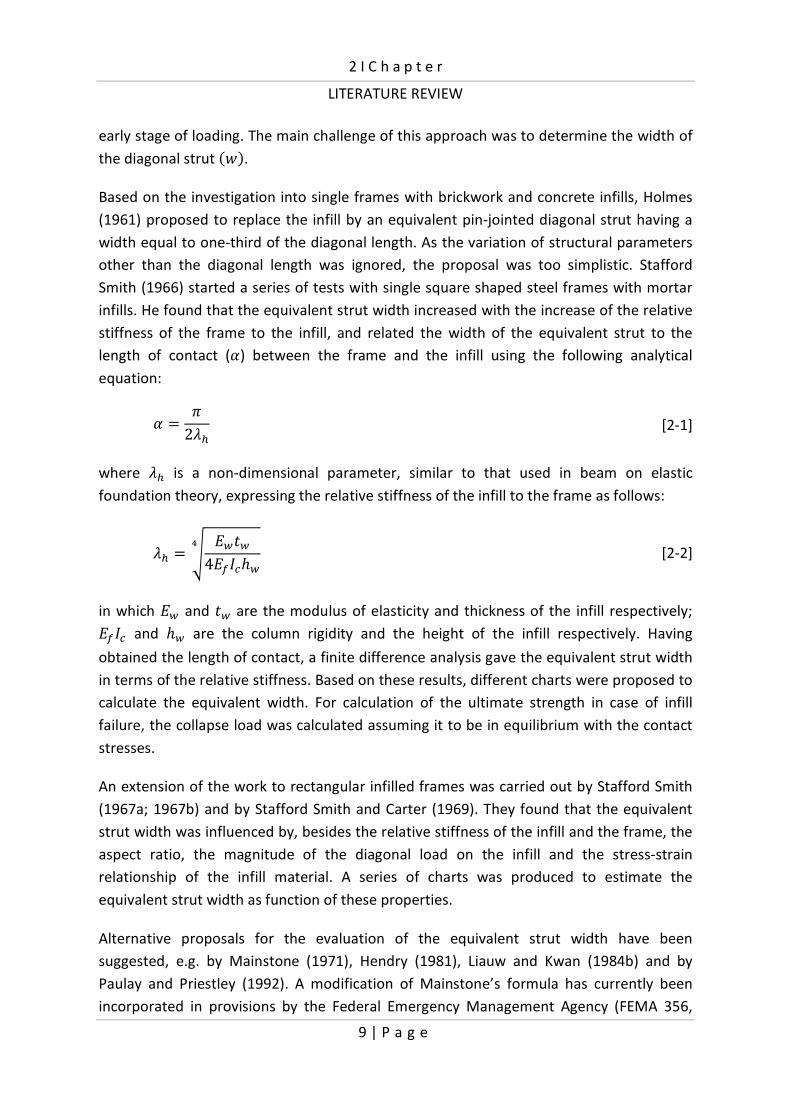
The simplest (and most developed)
method for the analysis of non-integral
infilled frames is based on the concept
of the equivalent diagonal strut. This
concept was initially proposed by
Polyakov (1956) and later developed
by other investigators. In this method,
the infilled frame structure is modeled
as an equivalent braced frame system
with a compression diagonal replacing
the infill (Figure 2-1).
Figure 2-1: Equivalent diagonal strut analogy
This analogy was justified by observation of the phenomenon of slip and separation
between the frame and infill except in the vicinity of the two compression corners at an
w
F
2 I C h a p t e r
LITERATURE REVIEW
9 | P a g e
early stage of loading. The main challenge of this approach was to determine the width of
the diagonal strut DEF. Based on the investigation into single frames with brickwork and concrete infills, Holmes
(1961) proposed to replace the infill by an equivalent pin-jointed diagonal strut having a
width equal to one-third of the diagonal length. As the variation of structural parameters
other than the diagonal length was ignored, the proposal was too simplistic. Stafford
Smith (1966) started a series of tests with single square shaped steel frames with mortar
infills. He found that the equivalent strut width increased with the increase of the relative
stiffness of the frame to the infill, and related the width of the equivalent strut to the
length of contact (G) between the frame and the infill using the following analytical
equation:
G H I2K [2-1]
where K is a non-dimensional parameter, similar to that used in beam on elastic
foundation theory, expressing the relative stiffness of the infill to the frame as follows:
K H L �5454�#)�'5N [2-2]
in which �5 and 45 are the modulus of elasticity and thickness of the infill respectively; �#)� and '5 are the column rigidity and the height of the infill respectively. Having
obtained the length of contact, a finite difference analysis gave the equivalent strut width
in terms of the relative stiffness. Based on these results, different charts were proposed to
calculate the equivalent width. For calculation of the ultimate strength in case of infill
failure, the collapse load was calculated assuming it to be in equilibrium with the contact
stresses.
An extension of the work to rectangular infilled frames was carried out by Stafford Smith
(1967a; 1967b) and by Stafford Smith and Carter (1969). They found that the equivalent
strut width was influenced by, besides the relative stiffness of the infill and the frame, the
aspect ratio, the magnitude of the diagonal load on the infill and the stress-strain
relationship of the infill material. A series of charts was produced to estimate the
equivalent strut width as function of these properties.
Alternative proposals for the evaluation of the equivalent strut width have been
suggested, e.g. by Mainstone (1971), Hendry (1981), Liauw and Kwan (1984b) and by
Paulay and Priestley (1992). A modification of Mainstone’s formula has currently been
incorporated in provisions by the Federal Emergency Management Agency (FEMA 356,

2 I C h a p t e r
LITERATURE REVIEW
10 | P a g e
2000). Alas, the diverse expressions for E result in a wide difference in effective widths for
the equivalent diagonal strut. Consequently, none of them has been accepted in any
design code. The common agreement, however, is that the width of the equivalent strut
decreases when the parameter K increases.
In the last decades it has become clear that one single strut is not sufficient to model the
complex behavior of the infilled frame, as local effects resulting from the interaction
between the infill and the surrounding frame are not reflected by connecting only the two
loaded corners of the frame by a single strut. As a result, bending moments and shear
forces in the frame members are not modeled realistically and the location of potential
plastic hinges cannot be adequately predicted. More complex macro-models were then
proposed by many researchers, all based on a number of diagonal struts. Figure 2-2 (a) to
(e) show multiple strut models as reported in the state-of-the-art report on analytical
modeling of infilled frames by Crisafulli et al. (2000). In spite of increasing complexity, the
main advantage of these models is the ability to represent the actions in the frame more
accurately.
Figure 2-2: Modified diagonal strut models
F
F
F
(a) (b)
(c) (d)
(e)
F
F
2 I C h a p t e r
LITERATURE REVIEW
11 | P a g e
Equivalent frame analogy
Liauw (1972) proposed the equivalent frame method for stiffness prediction of fully-
integral infilled frames. This analysis method was based on the fact that the infill panel
increases the frame’s stiffness and strength by magnitudes which depend on the
dimensions and the properties of the infill. Therefore, the actual frame was transformed
into an equivalent frame with section properties of the columns and beams derived from
composite T-sections. The dimensions of the equivalent frame were obtained from the
centroidal axes of the actual infilled frame. Having transformed the actual structure into
an equivalent frame, it was then possible to analyze the equivalent frame using standard
structural analysis methods. The validity of the method was found to depend on the
capacity of the shear connectors to sustain the composite action without allowing
separation of the infill.
Plastic analysis
Since the diagonal strut concept was not suitable to predict the ultimate strength of
infilled frames, plastic design principles were proposed to predict the collapse load of the
structure.
Wood (1978) proposed a plasticity-based theory in which the stress redistribution at
ultimate limit state and the importance of the bending strength of the frame were
recognized. He assumed that plastic hinges developed at the corners of the bounding
frame and that the infill panel was in a state of pure shear strain. Four different collapse
modes were identified based on observations of full-scale as well as model tests. Liauw
and Kwan conducted an extensive study on the behavior of infilled frames and developed
a plasticity based method to deal with non-integral (Liauw, T. C. et al., 1983) and integral
infilled frames (Liauw, T. C. et al., 1984b). In this method, stress redistribution due to the
development of cracks and crushing of the infill towards collapse, and of the shear
strength at the infill/frame interface provided by the shear connectors were taken into
account. This study of single-bay infilled frames was later extended by Liauw and Lo (1988)
and by Kwan et al. (1990) to multi-bay infilled frames. They performed experiments using
small-scale models having up to two bays and four stories.
Extending the plasticity based methods used by Wood and Liauw and Kwan, which
assumed failure by collapse mechanisms due to development of plastic hinges in the
frames, Saneinejad and Hobbs (1995) observed that concentrated stresses preceded the
formation of collapse mechanisms. They proposed a strut model that is based on the
development of plasticity in the infill at the loaded corners. Collapse loads determined by
the method of Saneinejad and Hobbs were consistently closer to experimental values than
those according to earlier methods.
2 I C h a p t e r
LITERATURE REVIEW
12 | P a g e
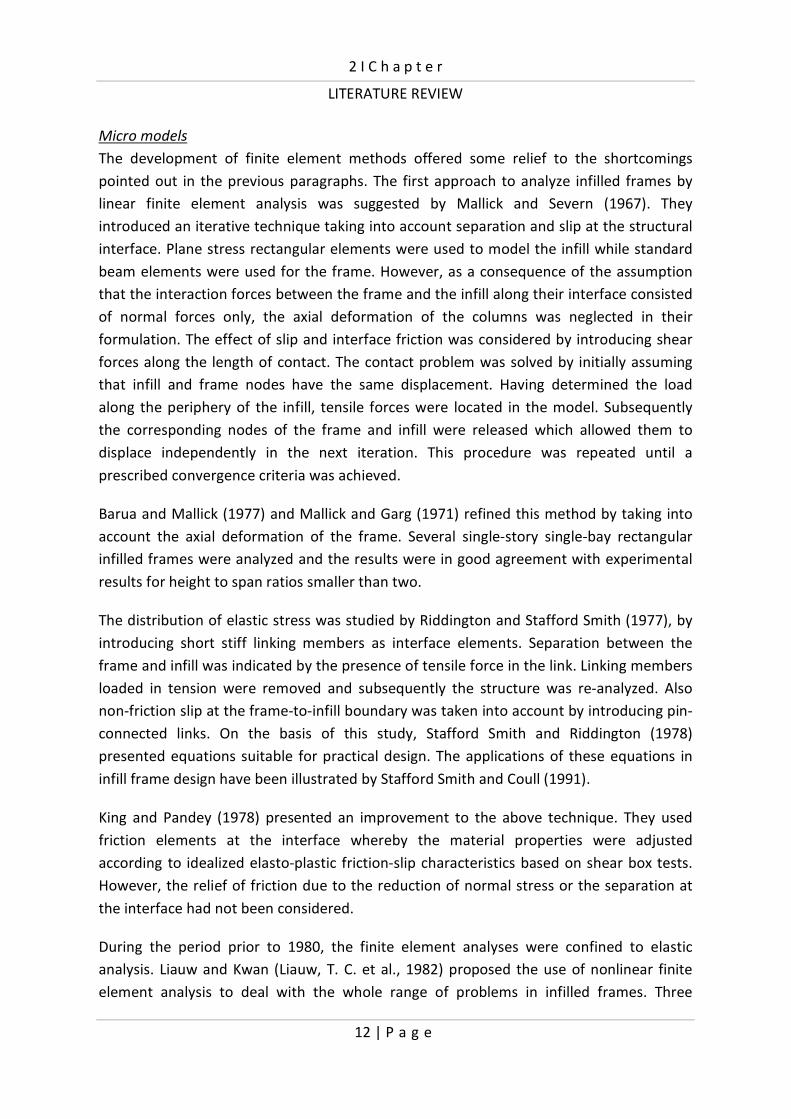
Micro models
The development of finite element methods offered some relief to the shortcomings
pointed out in the previous paragraphs. The first approach to analyze infilled frames by
linear finite element analysis was suggested by Mallick and Severn (1967). They
introduced an iterative technique taking into account separation and slip at the structural
interface. Plane stress rectangular elements were used to model the infill while standard
beam elements were used for the frame. However, as a consequence of the assumption
that the interaction forces between the frame and the infill along their interface consisted
of normal forces only, the axial deformation of the columns was neglected in their
formulation. The effect of slip and interface friction was considered by introducing shear
forces along the length of contact. The contact problem was solved by initially assuming
that infill and frame nodes have the same displacement. Having determined the load
along the periphery of the infill, tensile forces were located in the model. Subsequently
the corresponding nodes of the frame and infill were released which allowed them to
displace independently in the next iteration. This procedure was repeated until a
prescribed convergence criteria was achieved.
Barua and Mallick (1977) and Mallick and Garg (1971) refined this method by taking into
account the axial deformation of the frame. Several single-story single-bay rectangular
infilled frames were analyzed and the results were in good agreement with experimental
results for height to span ratios smaller than two.
The distribution of elastic stress was studied by Riddington and Stafford Smith (1977), by
introducing short stiff linking members as interface elements. Separation between the
frame and infill was indicated by the presence of tensile force in the link. Linking members
loaded in tension were removed and subsequently the structure was re-analyzed. Also
non-friction slip at the frame-to-infill boundary was taken into account by introducing pin-
connected links. On the basis of this study, Stafford Smith and Riddington (1978)
presented equations suitable for practical design. The applications of these equations in
infill frame design have been illustrated by Stafford Smith and Coull (1991).
King and Pandey (1978) presented an improvement to the above technique. They used
friction elements at the interface whereby the material properties were adjusted
according to idealized elasto-plastic friction-slip characteristics based on shear box tests.
However, the relief of friction due to the reduction of normal stress or the separation at
the interface had not been considered.
During the period prior to 1980, the finite element analyses were confined to elastic
analysis. Liauw and Kwan (Liauw, T. C. et al., 1982) proposed the use of nonlinear finite
element analysis to deal with the whole range of problems in infilled frames. Three

2 I C h a p t e r
LITERATURE REVIEW
13 | P a g e
different types of elements were used to study infilled frame behavior. Simple bar
elements capable of simulating both separation and slip were used to model the infill-to-
frame interface. The infill panel was modeled by triangular plane stress elements while
standard prismatic bending elements were used for the frame. Nonlinearities of the
material and the structural interface were taken into account. Also, the initial lack of fit at
the interface was considered. The nonlinear behavior of concrete infills in steel frames
without shear connectors (Liauw, T. C. et al., 1984a) and with shear connectors (Kwan, K.
H. et al., 1984) was experimentally and numerically studied. These researchers found that
for non-integral infilled frames nonlinearity arose mainly from crushing of the loaded
corners of the infill and thereupon yielding of the frame and that the effects on the
stiffness degradation were significant. For fully-integral infilled frames, nonlinearity arose
mainly from cracking and crushing of the infill material, yielding of the infill-frame
connection and formation of plastic hinges in the frame. The provision of shear connectors
considerably reduced the stress concentrations in the compression corners of the infills as
well as the magnitudes of frame shear and moment at the joints. The nonlinear finite
element method showed good agreement with experimental results for both lateral
stiffness and ultimate strength.
From that time on, the finite element method has been extensively used as a research
instrument in both static and dynamic analyses of infilled frames, e.g. (Afefy, H. M. et al.,
2002; Asteris, P. G., 2008; Dawe, J. L. et al., 2001; Ghosh, A. K. et al., 2002; Moghaddam, H.
A. et al., 2006; Ng'andu, B. M., 2006; Puglisi, M. et al., 2009).
2.1.2 Effect of openings
Infills are often provided with openings to accommodate doors and windows. Their
location and size may have significant effect on the stiffness and load carrying capacity of
the composite structure. Depending on their location, openings can interrupt the
development of a main compression strut in the infill. Although many investigations have
been carried out on solid infilled frames, the available literature on infilled frames with
openings is relatively limited.
The effect of openings on the behavior of infilled frames was experimentally investigated
by Benjamin and Williams (1958). They conducted a series of experiments on infills with
central window openings, with dimensions proportional to the infill dimensions by a ratio
of one third, and measured a 50% reduction of the ultimate strength.
As reported by Mallick and Garg (1971), Coull tested in 1966 a few infilled frames having
central openings with and without reinforcement around the openings. He observed that
these openings reduced the stiffness and strength of infilled frames by about 60 - 70% and
by 45% respectively as compared with a solid infill panel. The effect of nominal
2 I C h a p t e r
LITERATURE REVIEW
14 | P a g e
reinforcement around the openings was negligible considering first cracking load and
strength. The failures occurred due to crushing of one of the loaded corners of the infill
panel. Considerable cracking of the infill panels had occurred before failure.
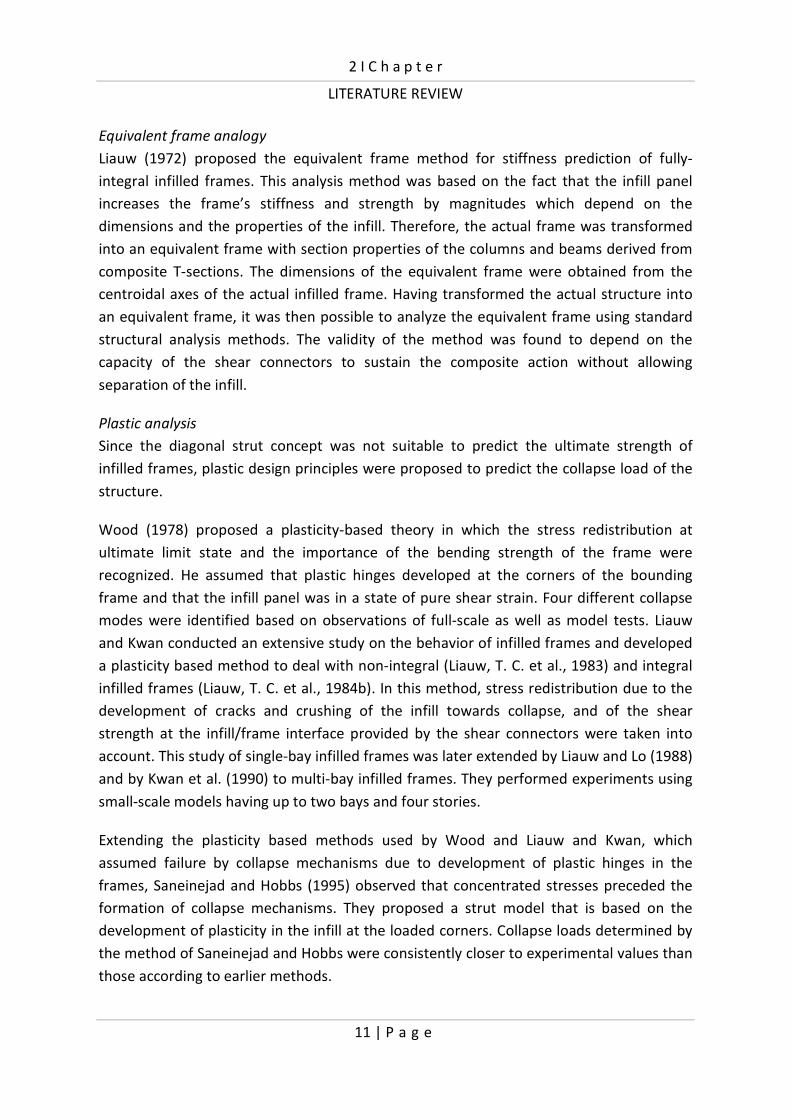
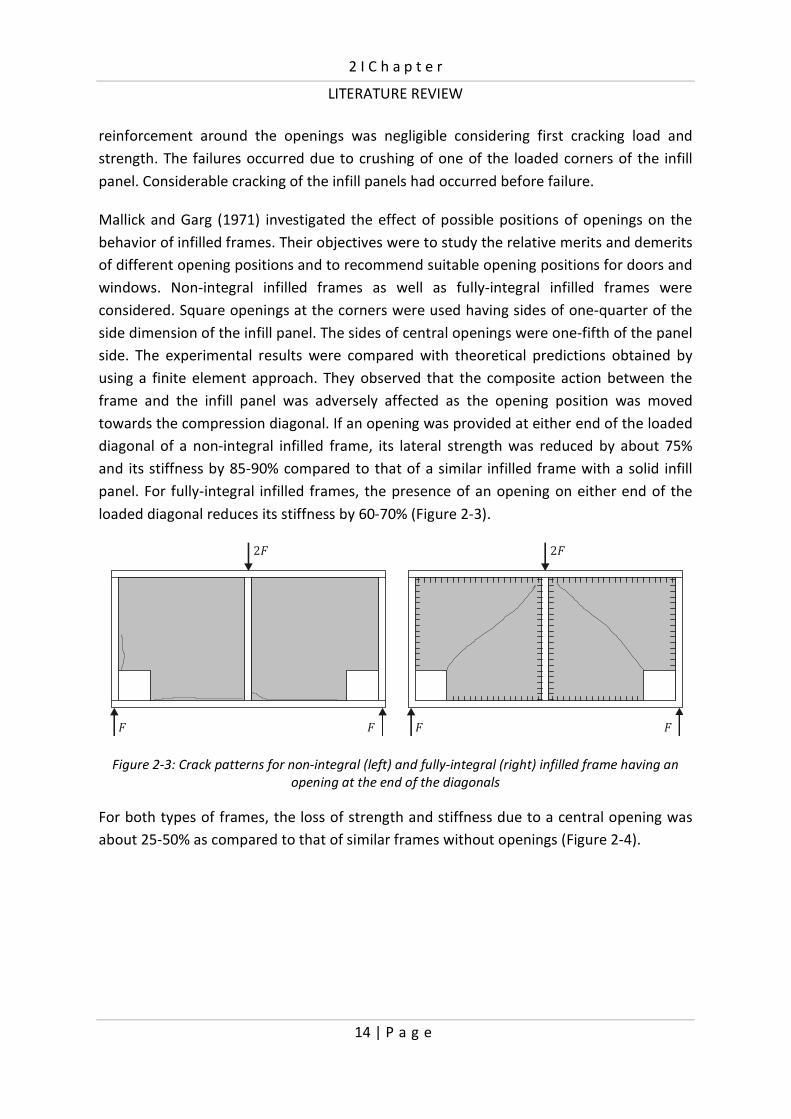
Mallick and Garg (1971) investigated the effect of possible positions of openings on the
behavior of infilled frames. Their objectives were to study the relative merits and demerits
of different opening positions and to recommend suitable opening positions for doors and
windows. Non-integral infilled frames as well as fully-integral infilled frames were
considered. Square openings at the corners were used having sides of one-quarter of the
side dimension of the infill panel. The sides of central openings were one-fifth of the panel
side. The experimental results were compared with theoretical predictions obtained by
using a finite element approach. They observed that the composite action between the
frame and the infill panel was adversely affected as the opening position was moved
towards the compression diagonal. If an opening was provided at either end of the loaded
diagonal of a non-integral infilled frame, its lateral strength was reduced by about 75%
and its stiffness by 85-90% compared to that of a similar infilled frame with a solid infill
panel. For fully-integral infilled frames, the presence of an opening on either end of the
loaded diagonal reduces its stiffness by 60-70% (Figure 2-3).
Figure 2-3: Crack patterns for non-integral (left) and fully-integral (right) infilled frame having an
opening at the end of the diagonals
For both types of frames, the loss of strength and stiffness due to a central opening was
about 25-50% as compared to that of similar frames without openings (Figure 2-4).
2F
FF
2F
FF

2 I C h a p t e r
LITERATURE REVIEW
15 | P a g e
Figure 2-4: Crack patterns for non-integral (left) and fully-integral (right) infilled frame having a
central opening
About the position of openings they concluded that door openings could be best located
in the centre of the lower half of the panel. Window openings could be best located in the
mid-height region of the left or right half of the panel, as near to the vertical edge of the
panel as possible.
Liauw (1972) pointed out that when treating an infilled frame with an opening, the
concept of replacing the infill by an equivalent diagonal strut is inappropriate. He
proposed an approximate method of analysis using the equivalent frame method.
Experimental results on the stiffness of two elastic models having various sizes of openings
in the infill were compared with analytical results. The comparison showed good
agreement when the opening was more than 50% of the full infill area. The method was
on the conservative side when the opening was less than 50% of the full infill area.
The behavior of multi-story infilled frames, consisting of four-story steel frames with
reinforced concrete infills with or without door openings was investigated by Liauw and
Lee (1977). Non-integral infilled frames as well as fully-integral infilled frames were
considered. They approached the diagonal strut analogy with the use of the strain energy
method to establish the sectional area of the equivalent diagonal strut. The method
enabled the predictions of stiffness and strength of infilled frames with or without
opening in the infill panel. They observed that the structural behavior of a non-integral
infilled frame changed when doorways in the infills were crossing the compression
diagonal, producing bending and shearing in the walls and the beams of the infill panel.
The stiffness and strength was drastically reduced. In fully-integral infilled frames the
provision of openings in the infills did not change the basic behavior of the structure and
the reductions in stiffness and strength were relatively moderate. With the exception of
the strength prediction, good agreements between experimental and analytical results
were obtained in terms of mode of failure and stiffness.
2F 2F
FF FF
2 I C h a p t e r
LITERATURE REVIEW
16 | P a g e
Dawe and Seah (1989) studied the effect of openings in masonry infills in steel frames.
They found that the inclusion of steel reinforcement around the opening increased the
initial stiffness, but did not increase the ultimate strength. Furthermore, they found that
openings located away from the diagonal strut resulted in a slightly higher ultimate load
than for openings located nearer to the diagonal. Therefore, and while the lateral load is
normally applied in both directions, they concluded that the best location to
accommodate door openings is the center of the wall.
Asteris (2003) studied the influence of infill panel openings on the behavior of brickwork
infilled plane frames. A detailed parametric study was carried out using as parameters the
position and the percentage of the masonry infill panel opening for the case of single-story
single-bay infilled frames. He found that an increase in the opening percentage led to a
decrease on the lateral stiffness of infilled frames, reaching 87% for a bare frame (100%
opening). For openings exceeding 50%, the stiffness factor remained practically constant.
Furthermore, it was shown that the overall action between the frame and the infill is
adversely affected as the opening position is moved towards the compression diagonal.
The non-linear in-plane behavior of masonry-infilled steel frames with openings was
numerically investigated by Mohebkhah et al. (2008). A finite element model was used to
investigate the effect of door opening positions on the lateral stiffness, the ductility and
the collapse load of such frames. It was found that the model could be used to predict the
collapse load and joint cracking patterns and to explore the possible failure modes of
masonry-infilled steel frames with a given location for openings and relative area. Results
from the numerical modeling and previous experimental studies found in literature were
compared which indicated a good correlation. A further analysis was performed to
investigate the effect of door frame confinement on the lateral capacity of a specimen
with a central opening. The analysis showed that, by adding a conventional door frame,
the lateral load capacity of the infilled frame specimen increased up to 28%.
Mondal and Jain (2008) performed an investigation into the lateral stiffness of masonry
infilled reinforced concrete frames with central openings. They proposed a reduction
factor for the effective width of a diagonal strut over that of the solid infill to calculate its
initial stiffness when a central window opening is present. Experimental results available
from published literature were supplemented by finite element analyses. They concluded
that the effect of an opening on the initial lateral stiffness of infilled frames should be
neglected if the area of opening was less than 5% of the area of the infill panel, meaning
that the frame should be analyzed as a solid infilled frame. They also pointed out that the
effect of an infill on the initial lateral stiffness of infilled frames may be ignored if the area
of opening exceeds 40% of the area of the infill panel, which means that the frame should
be analyzed as a bare frame.

2 I C h a p t e r
LITERATURE REVIEW
17 | P a g e
2.1.3 Infilled frames with precast concrete panels
With the rise of the precast concrete industry, a new area of research in infilled frames
was created. A precast infill panel system for strengthening of existing concrete frame
buildings was first investigated by Frosch. The objectives were to develop an infill system
that eliminated the application of interface dowels, the application of extensive concrete
formwork and the pouring of large volumes cast-in-place concrete. In the system, several
precast concrete panel elements were used to assemble an infill wall. The panels were
provided with shear keys along the side to allow for force transfer, and were connected to
one another through the use of reinforced cast-in-place closure strips. Connection to the
existing frame was realized by the application of steel pipes (shear lugs) which eliminated
the need for interface dowels. Connection tests (Frosch, R. J., 1999a; Frosch, R. J., 1999b)
as well as large scale tests (Frosch, R. J., 1996) were carried out to verify the performance
of connection details and to study the overall system behavior. Design and detailing
guidelines for the precast infill wall system were developed to provide engineers with a
method for proportioning the various elements of the precast infill wall system.
At Eindhoven University of Technology a research program on infilled steel frames with
discretely connected precast concrete infill panels (semi-integral infilled frames) was
initiated, aiming at development of design rules for this composite structure. In a
numerical study (Tang, R. B. et al., 2003) the influence of discrete interface connections on
the structural behavior of a square steel frame with a precast concrete infill panel subject
to lateral load was investigated. This study was limited to linear elastic analysis. Ten
different patterns of discrete interface connections were numerically investigated for
which the number and the locations of the connections were varied. It was observed that
interface connections on beams were more efficient than on columns, and that the lateral
stiffness of the structure improved when connections were located closer to the frame
joints. It could be observed that the contribution of discretely connected panels to the
performance of steel frames was significant and they concluded that semi-integral infilled
frames might achieve similar improvements in structural performance as fully-integral
infilled frames.
In subsequent experimental research (Hoenderkamp, J. C. D. et al., 2005; Hoenderkamp, J.
C. D. et al., 2007) tests on individual panel-to-frame connections were performed. This
connection consisted of steel plates precast in pockets at the edge of the panel and was
designed for a failure mechanism consisting of bearing failure in the bolt holes in order to
avoid brittle failure. The connection was assumed to act as a hinge, and able to transfer
normal and shear forces. As a result, the infill panel was loaded in both compression and
tension. Thereupon, a full-scale experiment was performed on a single-story single-bay
infilled frame. However, the infilled frame did not fail by the anticipated failure
mechanism as the structure failed by anchor pull-out.
2 I C h a p t e r
LITERATURE REVIEW
18 | P a g e
Simultaneously, a second type of discrete panel-to-frame connection was developed at
Eindhoven University of Technology. This connection consisted of structural bolts on the
column and beam of the frame, confining the precast concrete infill panel within the
frame. The connections were located in the panel corners, and assumed to transfer
compressive forces only. Therefore, the effect of the infill panel was more similar to the
action of a diagonal strut bracing the frame. Full-scale experiments were performed on a
single-story single-bay infilled frame. The structural system acted as was expected.
However the discrete interface connection appeared to be too weak. The flanges of the
steel frame deformed plastically under the compression produced by the bolts. In a
subsequent study, the capacity of the connection was increased by situating backing
plates on the flanges either with or without diaphragms between the flanges. Also, the
effect of a window opening in the infill panel was experimentally investigated (Teeuwen,
P. A. et al., 2006). It was found that, even provided with window openings, the
contribution of precast concrete infill panels to the performance of steel frames was
substantial. However, this time plastic deformation occurred at the, in the panel corners
installed, steel angles, under the compression produced by the bolts.
2.1.4 Section conclusions
The presented state-of-the-art review on infilled frames shows that extensive
investigations have been done into the structural behavior of infilled frames with masonry
and cast-in-place concrete infills. Several analytical models have been developed to
describe the composite infilled frame behavior. However, so far none of them has been
accepted in the current design codes.
Although a lot of the investigations were conducted on infilled frames with solid infills,
few studies have been conducted on infilled frames with openings. Those studies that
were carried out are mainly restricted to masonry infills. It has been demonstrated that
the presence of an opening in the infill substantially alters the performance of infilled
frames. Furthermore, recommendations have been made for suitable opening positions
within an infill.
The application of precast concrete infill panels created a new area of research in infilled
frames. It has been shown that discretely connected precast concrete panels in steel
frames might achieve good structural performance. Even with window opening, the
contribution of the infill to the frame has shown to be significant. However, more research
is needed to investigate the interaction between the panel and frame through discrete
interface connections, and to develop analytical methods for the design of this type of
infilled frame.

2 I C h a p t e r
LITERATURE REVIEW
19 | P a g e
2.2 Structural bolts
In this section the background of standard hexagonal bolts and nuts is presented. The
dimensions, grades and strengths of the structural bolts are discussed. Subsequently, a
survey of current considerations for predicting the strength and stiffness of bolts subject
to tensile loading is presented.
2.2.1 Standard bolts: dimensions, grades and strengths
There are many systems for specifying the dimensions of bolts. In large parts of the world
the ISO metric screw thread has replaced the much older systems. Metric screws are
specified by the ISO 261 and ISO 262 standards. A metric ISO screw thread is designated
by the letter M followed by two numbers, both expressed in millimeters and separated by
the multiplication sign “×” (e.g. M24x3.0). The ‘M’ indicates that the bolt is metric. The
following number is the nominal diameter in millimeters. The last number gives the pitch
of the thread. Threads other than the ISO metric threads commonly used are Unified
Thread Standard, (UTS), which is still in common use in the United States and Canada,
British Standard Whitworth (BSW) and British Association screw threads (BA). However,
these will not be discussed further in this work.
High-strength bolts usually have a hexagonal head with an ISO strength rating stamped on
the head. This indication exists of two numbers separated by a decimal point. The number
before the point is the guaranteed minimal tensile ultimate strength D���F in N/mm2
divided by 100. The number after the point is 10 times the ratio of the tensile yielding
strength or 0.2% proof strength O���P to the tensile ultimate strength. For example, a
property class 4.6 bolt has a nominal (minimum) tensile ultimate strength of 400 N/mm2,
and a tensile yield strength of 0.6 times tensile ultimate strength or 0.6 Q 400 = 240
N/mm2. Most commonly used bolts are 4.6, 8.8, 10.9 and 12.9 bolts.
For nuts, a minimal tensile strength is not directly prescribed. The indication of the grade
for steel nuts exists of one number that matches the first number of the bolt with the
highest grade that enables the nut to be loaded up till a certain proof stress without
stripping of the threads in the nut. The proof strength of a standard nut is generally
greater than the proof strength of the bolt with which it is supposed to be used. Designers
prefer bolt failure to nut failure because a failure of the bolt is more obvious.
2.2.2 Strength considerations
Tensile loading is the most fundamental mode of loading bolts. Failure of a bolt under
axial tensile loading generally occurs in one of three modes: 1) tension failure through the
shank or threaded section of the bolt, 2) stripping of the bolt threads, or 3) stripping of the
nut threads.

2 I C h a p t e r
LITERATURE REVIEW
20 | P a g e
Structural bolts are designed so that tension failure of the bolt will occur before stripping
of the threads. A general-purpose bolt breaks in tension through the threads, as if it were
breaking through an equivalent solid shank with a diameter between that of the pitch and
minor diameters. The area of this equivalent shank is called the tensile stress area of the
bolt D��F, which can be calculated with the following empirical equation:
�� H I4 D�� R 0.9382�F� [2-3]
Where:
�� = nominal diameter of the bolt [mm]
� = pitch of the thread [mm]
The breaking load ( �) of a bolt is related to its tensile stress area as follows:
� H ����� [2-4]
Thread stripping is a shear failure which occurs either by stripping of the threads of the
bolt or by stripping of the threads of the nut, depending on their relative strengths. If the
nut threads are stronger than the bolt threads, thread failure occurs by stripping of the
thread of the bolt at a diameter established by the minor diameter of the thread of the
bolt. If the bolt threads are stronger than the nut threads however, thread failure will
occur by stripping of the thread of the nut at a diameter established by the major
diameter of the thread of the bolt.
To prevent thread stripping failure, bolt-nut assemblies are designed based on Alexander’s
theory (Alexander, E. M., 1977), a calculation method in which the minimum nut height
and the proof load are calculated from the geometrical conditions of a bolt-nut assembly
and the mechanical properties of their materials. According to this theory it is possible to
calculate the bolt stripping strength D ��F and the nut stripping strength D ��F with the
following equations:
�� H ���√3 �������
[2-5]
�� H ���√3 ������
With:
��� H I���� Y�2 Z 1√3 D�� R �F\
��� H I���� Y�2 Z 1√3 D� R �F\
2 I C h a p t e r
LITERATURE REVIEW
21 | P a g e
Where:
��� = bolt thread shear area [mm2]
��� = nut thread shear area [mm2]
��= effective nut height for stripping [mm] (for standard nuts �� H 0.75)
� = minor diameter of the nut thread [mm]
� = pitch diameter of the nut thread [mm]
� = major diameter of the bolt thread [mm]
�� = pitch diameter of the bolt thread [mm]
� = pitch of the thread [mm]
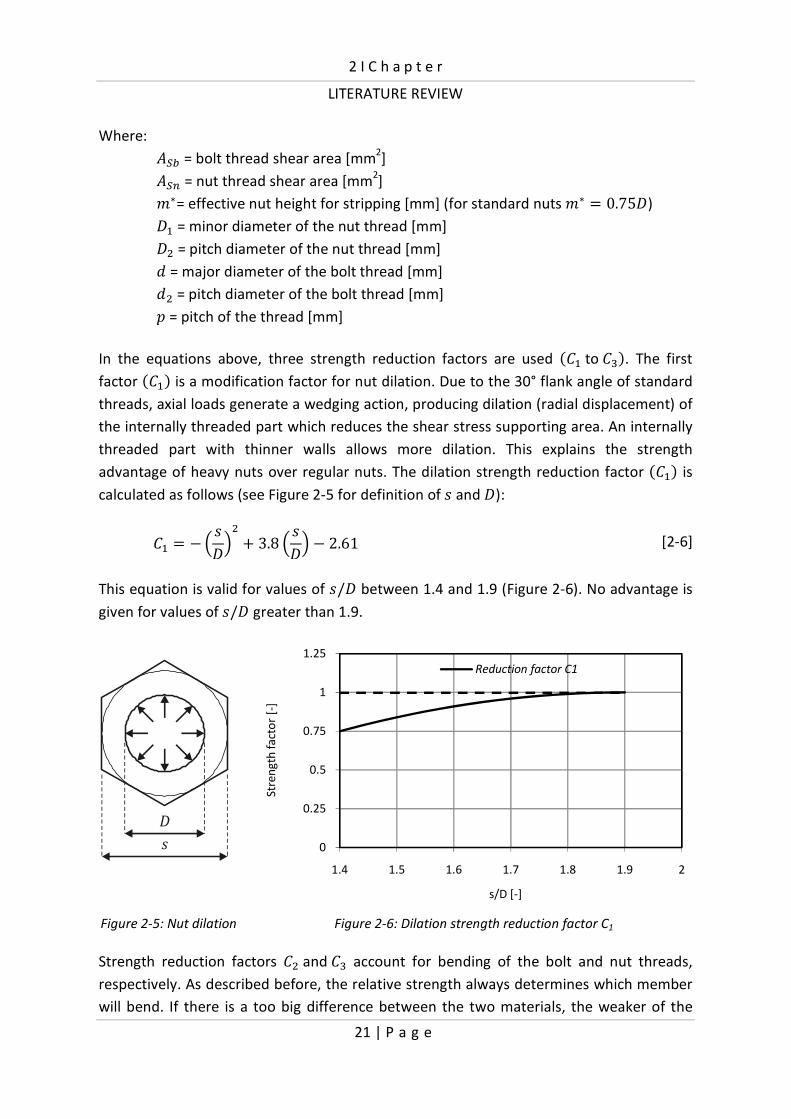
In the equations above, three strength reduction factors are used D�� to �F. The first
factor D��F is a modification factor for nut dilation. Due to the 30° flank angle of standard
threads, axial loads generate a wedging action, producing dilation (radial displacement) of
the internally threaded part which reduces the shear stress supporting area. An internally
threaded part with thinner walls allows more dilation. This explains the strength
advantage of heavy nuts over regular nuts. The dilation strength reduction factor D��F is
calculated as follows (see Figure 2-5 for definition of � and ):
�� H R`�a� Z 3.8 `�a R 2.61 [2-6]
This equation is valid for values of �/ between 1.4 and 1.9 (Figure 2-6). No advantage is
given for values of �/ greater than 1.9.
Figure 2-5: Nut dilation Figure 2-6: Dilation strength reduction factor C1
Strength reduction factors �� and � account for bending of the bolt and nut threads,
respectively. As described before, the relative strength always determines which member
will bend. If there is a too big difference between the two materials, the weaker of the
D
s 0
0.25
0.5
0.75
1
1.25
1.4 1.5 1.6 1.7 1.8 1.9 2
Stre
ng
th f
act
or
[-]
s/D [-]
Reduction factor C1

2 I C h a p t e r
LITERATURE REVIEW
22 | P a g e
two threads will deflect under the relatively stiff action of the other. This creates a form of
thread disengagement that again reduces the shear stress supporting area. As the
engaged threads bend, there is less effective thread shear area. Also, the bent thread has
a decreased flank angle, creating more dilation. The strength ratio d� is defined as follows:
d� H ������������ [2-7]
Depending of the value of d�, the strength reduction factors �� and � can be determined
with the following empirical equations:
�� H 5.594 R 13.682d� Z 14.107d��R6.057d� Z 0.9353d�e Dfor 1 f d� f 2.2F [2-8]
�� H 0.897 Dfor d� g 1F
� H 0.728 Z 1.769d� R 2.896d��Z1.296d� Dfor 0.4 f d� f 1F [2-9]
� H 0.897 Dfor d� h 1F Figure 2-7 graphically shows the relationship between the reduction factors D�� and �F, and the strength ratio d�.
Figure 2-7: Strength reduction factors C2 and C3 for thread bending
Several other factors as coefficient of friction, dynamic friction, corrosion and temperature
can also modify the strength. However, these are out of the scope of this research, and
will therefore not be considered.
0.85
0.95
1.05
1.15
1.25
0.4 0.6 0.8 1 1.2 1.4 1.6 1.8 2
Str
en
gth
fa
cto
r [-
]
Strength ratio [-]
Reduction factor C2
Reduction factor C3
bolt stripsnut strips

2 I C h a p t e r
LITERATURE REVIEW
23 | P a g e
2.2.3 Stiffness considerations
The process of determining the bolt (elastic) stiffness is based on basic applied mechanics.
When an axial load is applied to the ends of a straight cylindrical rod, it stretches. The
stiffness of an axially loaded member can be expressed by the following equation:
� H ��� [2-10]
However, the preceding equation is applicable only to parts with a uniform cross-section.
Bolts typically have significant changes in geometry. The cross-sectional area of the bolt’s
shank (��) is larger than that of its threaded portion (��). This difference in area can be
represented by considering a component spring with different stiffnesses in series.
Accordingly, the bolt stiffness (��) is given by the following equation:
�� H Y ����� Z������\
i� [2-11]
The bolt shank length D��F and the bolt threaded length included in the grip D���F should
include a part of the head and nut thickness respectively, to allow for local deformations.
Recommendations for the value of the factor j in equation [2-12] range from 0.3 to 0.6.
�� H Yj����� Z ����� Z������ Z j�����\
i� [2-12]
Eurocode 3 EN 1993-1-8 (2005), which deals with connection design in detail, defines the
stiffness for a single bolt-row (2 bolts) as follows:
�� H 1.6 Y �����\i�
[2-13]
where �� is the bolt elongation length, taken as equal to the grip length plus half the sum
of the height of the bolt head and the height of the nut.
Swanson and Leon (2001) investigated the elastic-plastic behavior of bolted T-stub
connection components. Based on observations on T-stub component tests and individual
bolt tests, the bolt stiffness model represented in Table 2-1 was developed, incorporating
a variable bolt stiffness that captures the changing behavior of the bolts as a function of
the loads that they are subjected to. The bolt stiffness model is made up of four linear
segments. The first segment models the bolt before its pretension is overcome. Until the
pretension is overcome, the bolts are assumed to be infinitely rigid. The second segment
models the bolt during the linear-elastic portion of its response, according to equation
[2-11]. The third segment models the bolt after initial yielding has started. A limit of 85%

2 I C h a p t e r
LITERATURE REVIEW
24 | P a g e
of the tensile capacity is used to identify the onset of yielding. The fourth segment models
the bolt after it has reached a plastic state.
Table 2-1: Bolt stiffness model
Segment Bolt load Bolt stiffness
1 0 g f �;k ��;� H 1000 ��
2 �;k g f 0.85 � ��;� H ��
3 0.85 � g f 0.90 � ��; H 0.10��
4 0.90 � g f � ��;e H 0.02��b
2.3 Strut-and-tie modeling of concrete
For the design of structural concrete components, it is common practice to subdivide a
structure into two different kinds of regions. The first ones are the B-regions, where B
stands for beam or Bernoulli. For B-regions the Bernoulli hypothesis of a cross-section
remaining plane after bending is satisfied. Therefore, the design of a B-region is well
understood and the entire flexural and shear behavior can be predicted by relatively
simple calculations using conventional beam theory and parallel chord truss analogy
respectively. The second types of regions are D-regions, where D stands for disturbed or
discontinuity. The D-regions, in contrast, are those parts of a structure where the above
standard methods do not apply. D-regions include parts near abrupt changes in geometry
(geometrical discontinuities) or concentrated forces (statical discontinuities). Based on St.
Venant's principle, the extent of a D-region spans about one section depth of the region
on either side of the discontinuity. Familiar types of these regions are joints, corners,
corbels, openings and deep beams. An example of the division between B-regions and D-
regions in a beam with concentrated load and opening is shown in Figure 2-8.
Figure 2-8: B-regions (white) and D-regions (grey) of a beam with concentrated load and opening
The Strut-and-Tie Method (STM) forms an analysis and design methodology for all types of
D-regions in structural concrete. In this method, internal stresses are assumed to be
transferred through a truss mechanism. The tensile ties and compressive struts serve as
truss members connected by nodes. Struts are the compression members of a strut-and-
tie model and represent concrete stress fields whose principal compressive stresses are
predominantly along the centerline of the strut. The geometry of a strut varies widely and
h
h
hh
h hh h’ h’
h’
h’
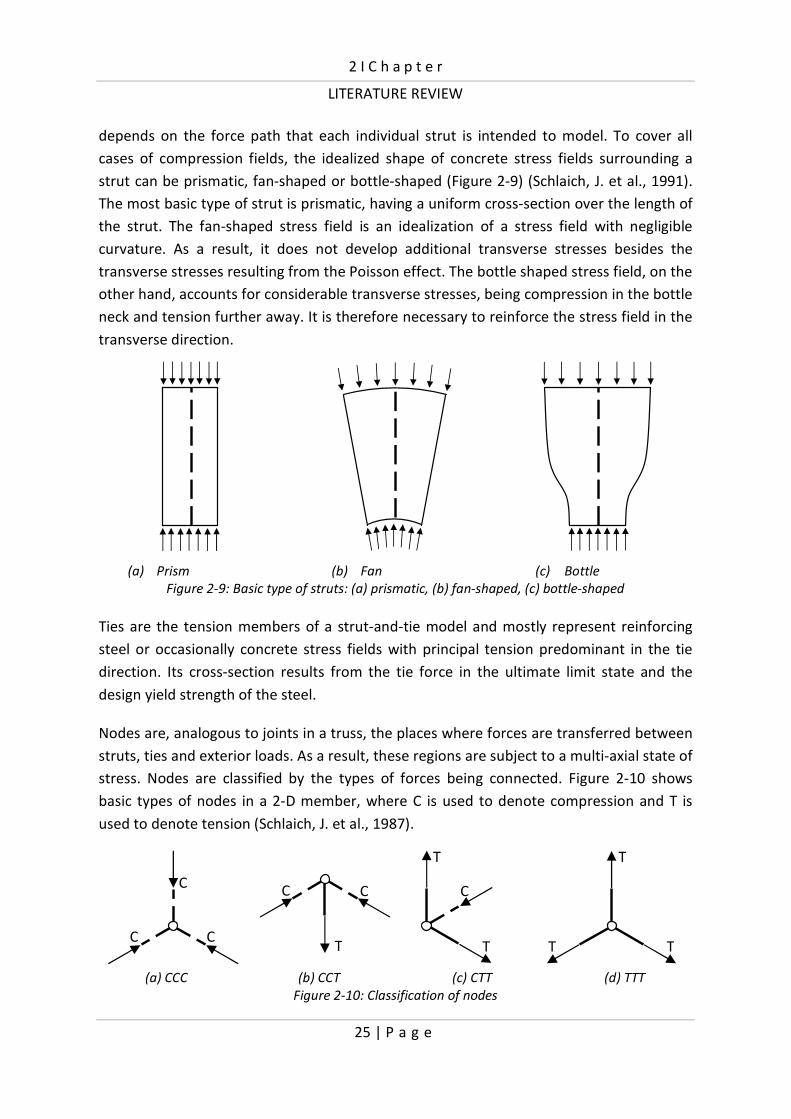
2 I C h a p t e r
LITERATURE REVIEW
25 | P a g e
depends on the force path that each individual strut is intended to model. To cover all
cases of compression fields, the idealized shape of concrete stress fields surrounding a
strut can be prismatic, fan-shaped or bottle-shaped (Figure 2-9) (Schlaich, J. et al., 1991).
The most basic type of strut is prismatic, having a uniform cross-section over the length of
the strut. The fan-shaped stress field is an idealization of a stress field with negligible
curvature. As a result, it does not develop additional transverse stresses besides the
transverse stresses resulting from the Poisson effect. The bottle shaped stress field, on the
other hand, accounts for considerable transverse stresses, being compression in the bottle
neck and tension further away. It is therefore necessary to reinforce the stress field in the
transverse direction.
(a) Prism (b) Fan (c) Bottle
Figure 2-9: Basic type of struts: (a) prismatic, (b) fan-shaped, (c) bottle-shaped
Ties are the tension members of a strut-and-tie model and mostly represent reinforcing
steel or occasionally concrete stress fields with principal tension predominant in the tie
direction. Its cross-section results from the tie force in the ultimate limit state and the
design yield strength of the steel.
Nodes are, analogous to joints in a truss, the places where forces are transferred between
struts, ties and exterior loads. As a result, these regions are subject to a multi-axial state of
stress. Nodes are classified by the types of forces being connected. Figure 2-10 shows
basic types of nodes in a 2-D member, where C is used to denote compression and T is
used to denote tension (Schlaich, J. et al., 1987).
(a) CCC (b) CCT (c) CTT (d) TTT
Figure 2-10: Classification of nodes
C
C C
T
T T
T
T
C
T
C C

2 I C h a p t e r
LITERATURE REVIEW
26 | P a g e
To allow safe transfer of strut and tie forces through nodal zones, the concrete stress
levels in nodes may not exceed the concrete limiting strength in the nodal zone. The
strength of concrete in nodal zones depends on a number of factors, including
confinement provided by compressive reactions or by transverse reinforcement, the effect
of strain discontinuities within the nodal zones and the splitting stresses resulting from
intersecting tension ties (Yun, Y. M. et al., 1996). Considerable research has been
conducted in an effort to determine the limiting strength of concrete in nodal zones. An
extensive literature study regarding the approaches for evaluating the limits of nodal zone
strengths is presented in a publication of Yun (2006).
The strut-and-tie model accounts for the distribution of both flexure and shear. It is based
on the lower-bound theory of limit analysis which implies that there is no unique strut-
and-tie model for a given problem. In other words, more than one admissible strut-and-tie
model may be developed for each load case as long as the selected truss is in equilibrium
with the boundary forces and the stresses in the struts, ties, and nodes do not exceed
allowable limit stresses. The lower-bound theorem guarantees that the capacity obtained
from all statically admissible stress fields is lower than or equal to the actual collapse load.
Although the STM is also applicable to B-regions, the STM is not preferred to the
conventional beam theory for the design for flexure and the parallel chord truss analogy
for the design for shear. An example of a strut-and-tie model for a deep beam is shown in
Figure 2-11.
Figure 2-11: Example of strut-and-tie model for deep beam
2.3.1 Historical overview of strut-and-tie modeling
The idea of the strut-and-tie method came from the truss analogy method introduced
independently by Ritter (1899) and Mörsch (1908), who at the beginning of the 20th
century investigated the resultants of the internal stresses by means of truss models. The
model was used to idealize the flow of force in a cracked concrete beam. The application
of plasticity based design procedures to the design of structural discontinuities provided
the opportunity to follow the forces through a structure.
CCT
CCC
Tie
Strut
2 I C h a p t e r
LITERATURE REVIEW
27 | P a g e
Drucker (1961) proposed the application of stress fields to reinforced concrete beam
design, based on the concept of the lower bound theorem of limit analysis. Schlaich
started in 1979 to work on strut-and-tie models for disturbed regions (D-regions) in
concrete structures to explain the structural behavior in these regions. He further
developed the strut-and-tie concept and summarized the knowledge on strut-and-tie
models in a landmark paper (Schlaich, J. et al., 1987). Schlaich and Schäfer (1991)
developed strut and tie models by utilizing stress trajectories from finite element analysis.
Directions of struts and ties were taken in accordance with the directions of principal
compressive and tensile stresses determined with the finite element analysis. Approaches
for determination of the effective stress levels of concrete struts and for verifying the
bearing capacity of nodal zones in strut-and-tie models were proposed by Yun and
Ramirez (1996). The effective stress levels of the concrete struts were determined by
implementing the principal stress ratios of finite element analysis corresponding to the
strut regions of the strut-and-tie model. This method was extended with a nonlinear strut-
and-tie model approach (Yun, Y. M., 2000). Muttoni et al. (1997) developed the method
with stress fields, closely related to the strut-and-tie method, using limit state analysis to
structural concrete. They pointed out that the limit state theory of perfect plasticity
provides a consistent scientific basis, from which simple and, above all, clear models may
be derived to determine the statical strength of reinforced concrete structures. Liang
(2002) developed a performance-based strut-and-tie modeling procedure for reinforced
concrete. His optimization procedure consists of eliminating the lowest stressed portions
from the structural concrete member to find the actual load path. It is proposed that
minimizing the strain energy is equivalent to maximizing the overall stiffness of a structure
and that the strut-and-tie system should be based on system performance (overall
stiffness) instead of component performance (compression struts and tension ties). Most
of the studies are mainly focused on two dimensional structures. In the work of Leu
(2006), a strut-and-tie design methodology is proposed for three dimensional reinforced
concrete structures.
2.3.2 Strength of struts and nodal zones
Although extensive research has been performed in an effort to determine the limiting
strength of concrete struts and nodal zones, substantial differences exist between the
results. These differences mainly originate from uncertainties associated with defining the
characteristics of an idealized truss within a continuum of structural concrete. For
European practice, recommendations for design by the STM can be found in the FIP
recommendation (FIP Commission 3 on Practical Design, 1999). Provisions for the STM
have been incorporated in Eurocode 2 (EN 1992-1-1, 2004). These will be applied in this
study and are for that reason presented here:

2 I C h a p t e r
LITERATURE REVIEW
28 | P a g e
Stress limits according to Eurocode 2 EN 1992
The stress limit ��� for struts should be obtained from:
��� H ����= [2-14]
With:
��= H ��>/8� [2-15]
Where:
��= = design compressive strength of concrete
��> = characteristic cylinder compressive strength of concrete
8� = partial safety factor for concrete
�� = 1.0 for struts in uni-axial compression or with transverse compression
�� = 0.6 (1- ��>/250) for struts with transverse tension
The concrete compressive stresses in the nodal zone boundaries are limited as follows:
��� H �� l1 R ��>250m ��= [2-16]
Where:
�� = 1.00 for CCC nodes
�� = 0.85 for CCT nodes
�� = 0.75 for CTT nodes
�� = 3.00 for CCC nodes in a three axial state of stress.
For more detailed information considering the strut-and-tie approach, reference is made
to an extensive state-of-the-art report by the ASCE-ACI Committee 445 on Shear and
Torsion (ASCE-ACI Committee 445, 1998).

29 | P a g e
Chapter 3: CONCEPTUAL DESIGN
Scope of the chapter
In this chapter, two existing discrete panel-to-frame connections are evaluated on their
practical and structural performance. Based on this evaluation, one discrete panel-to-
frame connection is selected for application in this research project. Next, a mechanical
system is presented, representing the structural behavior of a semi-integral infilled frame
constructed with the selected connection. Considering the mechanical system, a survey of
applicable design methods is made and the shortcomings are listed. Thereupon the
research needs are established for further investigation.
3.1 Discrete panel-to-frame connection
Essential parts of the semi-integral infilled frame are the discrete interface connections
between the precast concrete panel and the steel frame. Considering that all interaction
between the panel and the frame occurs through these connections, they may
significantly influence the overall infilled frame behavior and thus largely determine its
structural characteristics.
To obtain a building system which restricts on-site building activities principally to
assembly works, well-designed discrete panel-to-frame connections are required. Besides
enabling panel and frame to act compositely when laterally loaded, the connections must
contribute to the improvement of the constructability. Therefore, the following additional
requirements were defined for the panel-to-frame connections:
� The connections must enable a fast erection on site.
� The connections should allow the assembly to be performed with a minimum of
manpower.
� The connections must enable adoption of manufacturing and site erection
tolerances.
� The connections and their reinforcement detailing may not adversely influence
economic manufacturing of the precast panels and their transport.
� The connections must allow inspection and adjustment in a simple way.
� The connections must allow to be designed to govern the strength of the
structure, providing a safe and controllable failure mechanism for the structure.
Although most requirements are quite straight forward and familiar in (precast)
construction, the last point may need some more clarification.

3 I C h a p t e r
CONCEPTUAL DESIGN
30 | P a g e
The infilled frame structure is meant to be designed such, that the strength of the
structure will be governed by the panel-to-frame connections. For that purpose, a safe
failure mechanism is necessary which can be aimed for in advance. Consequently, good
ductility should be achieved.
In section 2.1.3 it was mentioned that two different types of discrete panel-to-frame
connections have been developed at Eindhoven University of Technology. These two
connection types show completely different structural behavior characteristics, which also
results in dissimilar overall infilled frame behavior. The first type (Type I) consists of two
steel plates which are connected together (Figure 3-1a). One plate is welded to a single U-
shaped reinforcing bar that acts as an anchor bolt. This plate is precast at mid-section in a
pocket at the edge of the panel. The second plate is welded to the steel beam. The two
plates are connected together with two bolts, leaving a small gap between panel and
frame along the complete panel circumference. The connection is assumed to act as a
hinge, enabling the transfer of normal and shear force between panel and frame. As a
result, the infill panel is loaded in both compression and tension, similarly to X-bracing in a
trussed frame. The connections are designed for a failure mechanism consisting of bearing
failure in the bolt holes of the steel plates.
The second connection type (Type II) is realized by structural bolts on the column and
beam in every corner of the steel frame (Figure 3-1b). The precast concrete infill panel is
confined within the steel frame by these bolts, leaving a small gap between panel and
frame along the complete panel circumference. To introduce forces into the panel, steel
angles are cast in the concrete at every corner of the panel. The connections are located in
the panel corners, and are unable to transfer tensile forces. Therefore, only the bolts in
the compression corners are active in a laterally loaded system. Consequently, the infill
panel has to act as a diagonal under compression what makes the effect of the infill panel
similar to the action of a diagonal compression strut bracing the frame. The connections
are designed for a bolt failure mechanism, aiming at bolt shear through the nut.
For this study, one connection type is selected for further investigation. In order to make a
well-founded decision, both connection types are judged on their practical and structural
performance. First of all, the properties of both connection types are tested against the
requirements concerning the manufacturing and construction process that were defined
in the previous paragraphs. A survey of this is provided in Table 3-1. As demonstrated by
the table, both connections meet the requirements to a reasonably high degree. Although
some of the requirements are satisfied by both types on the same level, connection Type
II shows important advantages in the assembly procedure and the adoption of tolerances
which is expected to considerably increase the speed of construction. Therefore, based on
the requirements concerning construction, connection Type II is preferred to Type I.

3 I C h a p t e r
CONCEPTUAL DESIGN
31 | P a g e
Figure 3-1: discrete panel-to-frame connections
Table 3-1: Properties discrete panel-to-frame connection concerning manufacturing and construction
Requirement Type I Type II
Fast erection on site - Dry connection; functions
immediately after assembly
- Dry connection; functions
immediately after assembly
Assembly procedure - Panel needs to be lifted into
exact position by crane
- Panel needs temporary strutting
until the top beam is installed
- Tightening 8 bolts
- Bolts enable exact positioning of
the panels in both horizontal and
vertical direction by setting the bolts
- Panel can be fixed directly by the
bolts on the columns
- Tightening 16 bolts;
Adoption of tolerances - Tolerances can be adopted only
if bolt holes are reamed on site
- Tolerances can be adopted in both
horizontal and vertical direction by
adjusting bolts
Manufacturing and
transport
- No special mould needed
- Connections can be used to lift
the panel
- No special mould needed
- Lifting equipment required
Inspection and adjustment - Possible - Possible
Desired failure mode
governing the strength
- Bearing failure mechanism in
the bolt holes of the steel plates
- Bolt failure mechanism, aiming at
bolt shear through nut
F F
a) Type I b) Type II
Anchor bar
Steel angle
cast-in-concrete
Anchor plate
cast-in-concrete
Gusset plate welded to steel beam Structural bolt

3 I C h a p t e r
CONCEPTUAL DESIGN
32 | P a g e
Secondly, the structural performance of both connection types and the consequences for
the overall infilled frame behavior are evaluated. Therefore, stiffness and strength
(including failure) properties of both structural systems are compared:
� Stiffness properties
As pointed out by Tang et al. (Tang, R. B. et al., 2003) the lateral stiffness of a
semi-integral infilled frame improves when the connections are located closer to
the frame joints. Connection Type I requires a substantial anchoring length of the
welded anchor bar, which demands a considerable length away from the panel
corners. Connection Type II, on the other hand, can be located close to the frame
joints, resulting in a higher stiffness. Besides, no large bending moments are
introduced in the members of the steel frame by the action of the panel.
Consequently, for Type II the infilled frame behavior shows more resemblance to
the extensively investigated and well-known non-integral infilled frame, which
already has proven to be effective and efficient in bracing multi-story buildings.
� Strength properties
Concrete shows good structural performance under compression but behaves
significantly worse in tension. Therefore, tensile forces applied to a concrete
element must usually be carried back into the reinforcement. Particularly close to
edges, the transfer of high tensile forces might even become critical, and result in
concrete edge breakout failure. This failure mode is often observed for
connections installed at less than critical edge distance under either tension or
shear loading. For this failure mode not the connection but the concrete fails,
which was also the case for the full-scale experiment using connection Type I
(Hoenderkamp, J. C. D. et al., 2005). The application of connections in concrete
close to edges, subject to large tensile forces might provide a limited capacity
accompanied by brittle failure behavior.
For connection Type II the anticipated failure mode is a bolt failure mechanism
consisting of bolt shear through the nut. In case of a bolt failure, the bolts can
rather easily be replaced while the steel structure and the concrete panel remain
undamaged. Although yielding of the steel angle under the axial compression of
the bolts was observed during the previous full-scale experiment with connection
Type II (Teeuwen, P. A. et al., 2006), it worked out that this could be prevented by
making relative simple adjustments to the connection.
In summary, also from structural point of view, connection Type II is preferred to Type I.
Consequently, connection Type II is selected to be further developed, and applied for this
study.
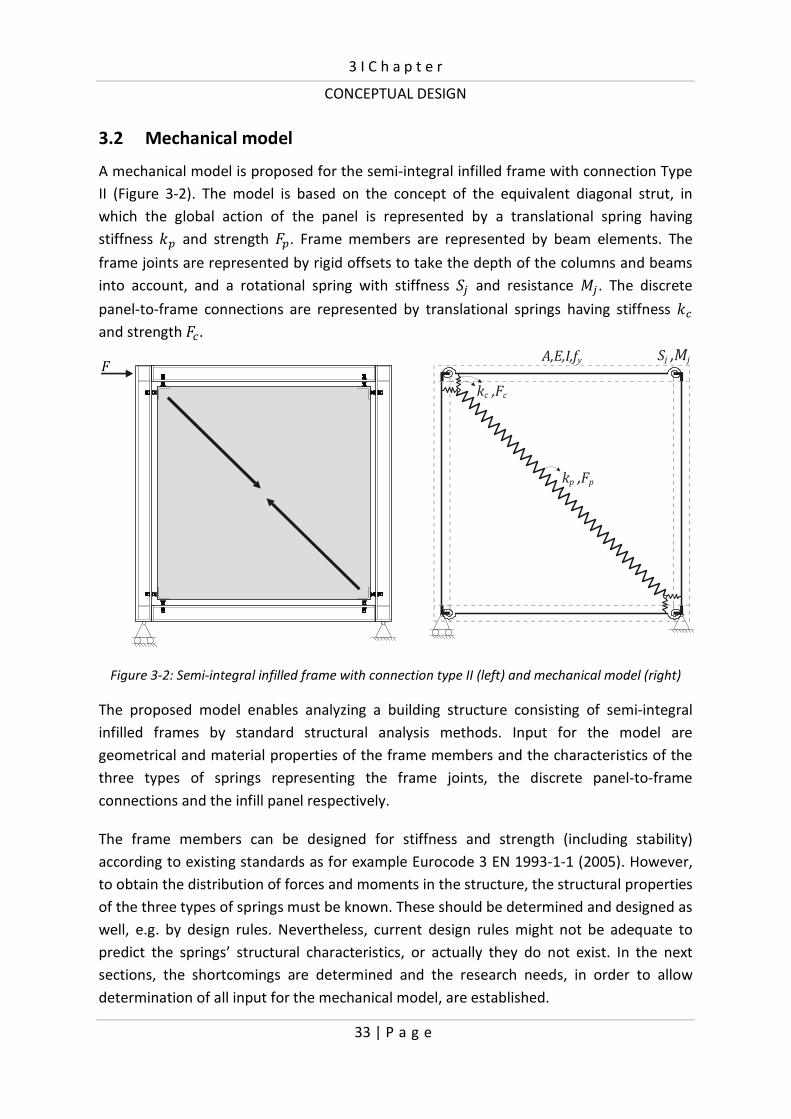
3 I C h a p t e r
CONCEPTUAL DESIGN
33 | P a g e
3.2 Mechanical model
A mechanical model is proposed for the semi-integral infilled frame with connection Type
II (Figure 3-2). The model is based on the concept of the equivalent diagonal strut, in
which the global action of the panel is represented by a translational spring having
stiffness �! and strength !. Frame members are represented by beam elements. The
frame joints are represented by rigid offsets to take the depth of the columns and beams
into account, and a rotational spring with stiffness 31 and resistance 01. The discrete
panel-to-frame connections are represented by translational springs having stiffness ��
and strength �.
Figure 3-2: Semi-integral infilled frame with connection type II (left) and mechanical model (right)
The proposed model enables analyzing a building structure consisting of semi-integral
infilled frames by standard structural analysis methods. Input for the model are
geometrical and material properties of the frame members and the characteristics of the
three types of springs representing the frame joints, the discrete panel-to-frame
connections and the infill panel respectively.
The frame members can be designed for stiffness and strength (including stability)
according to existing standards as for example Eurocode 3 EN 1993-1-1 (2005). However,
to obtain the distribution of forces and moments in the structure, the structural properties
of the three types of springs must be known. These should be determined and designed as
well, e.g. by design rules. Nevertheless, current design rules might not be adequate to
predict the springs’ structural characteristics, or actually they do not exist. In the next
sections, the shortcomings are determined and the research needs, in order to allow
determination of all input for the mechanical model, are established.
Sj ,Mj
kc ,Fc
kp ,Fp
FA,E,I,fy
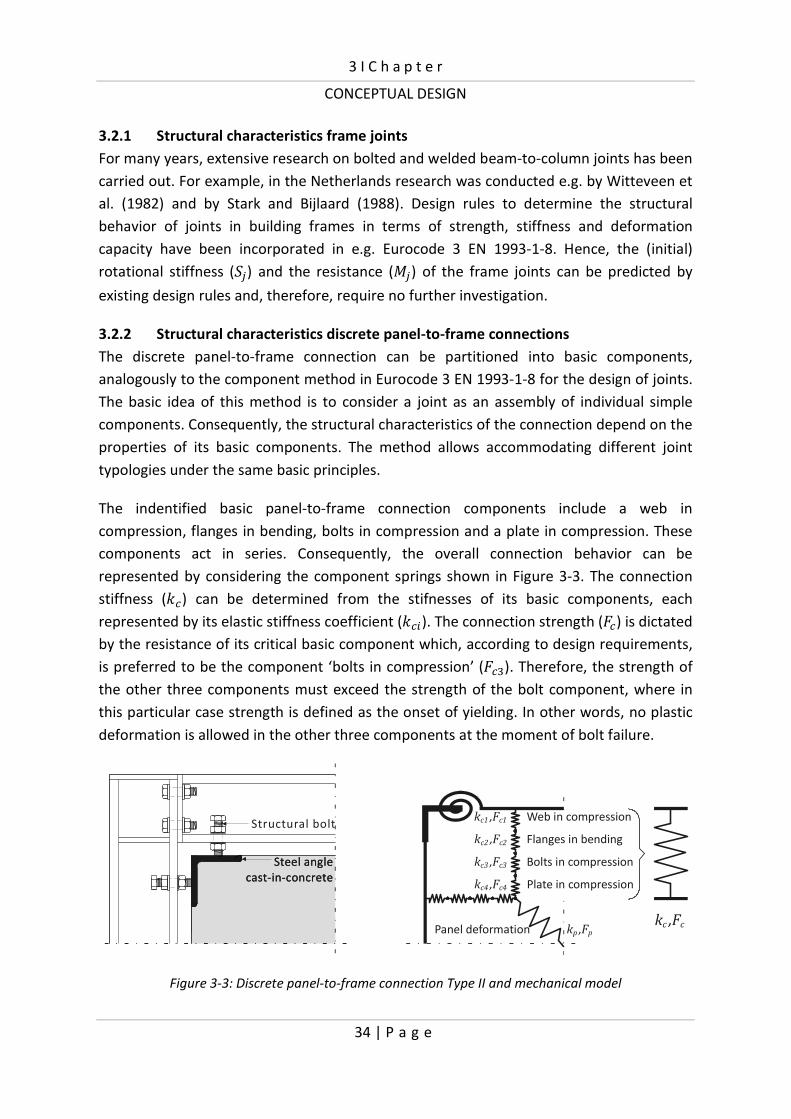
3 I C h a p t e r
CONCEPTUAL DESIGN
34 | P a g e
3.2.1 Structural characteristics frame joints
For many years, extensive research on bolted and welded beam-to-column joints has been
carried out. For example, in the Netherlands research was conducted e.g. by Witteveen et
al. (1982) and by Stark and Bijlaard (1988). Design rules to determine the structural
behavior of joints in building frames in terms of strength, stiffness and deformation
capacity have been incorporated in e.g. Eurocode 3 EN 1993-1-8. Hence, the (initial)
rotational stiffness (31) and the resistance (01) of the frame joints can be predicted by
existing design rules and, therefore, require no further investigation.
3.2.2 Structural characteristics discrete panel-to-frame connections
The discrete panel-to-frame connection can be partitioned into basic components,
analogously to the component method in Eurocode 3 EN 1993-1-8 for the design of joints.
The basic idea of this method is to consider a joint as an assembly of individual simple
components. Consequently, the structural characteristics of the connection depend on the
properties of its basic components. The method allows accommodating different joint
typologies under the same basic principles.
The indentified basic panel-to-frame connection components include a web in
compression, flanges in bending, bolts in compression and a plate in compression. These
components act in series. Consequently, the overall connection behavior can be
represented by considering the component springs shown in Figure 3-3. The connection
stiffness (��) can be determined from the stifnesses of its basic components, each
represented by its elastic stiffness coefficient (���). The connection strength ( �) is dictated
by the resistance of its critical basic component which, according to design requirements,
is preferred to be the component ‘bolts in compression’ ( �). Therefore, the strength of
the other three components must exceed the strength of the bolt component, where in
this particular case strength is defined as the onset of yielding. In other words, no plastic
deformation is allowed in the other three components at the moment of bolt failure.
Figure 3-3: Discrete panel-to-frame connection Type II and mechanical model
Flanges in bending
Bolts in compression
Plate in compression
Panel deformation kc c,F
kc1 ,Fc1
kc2 c2,F
kc4 c4,F
kp p,F
Web in compression
kc3 c3,FSteel angle
cast-in-concrete
Structural bolt
Steel angle
cast-in-concrete
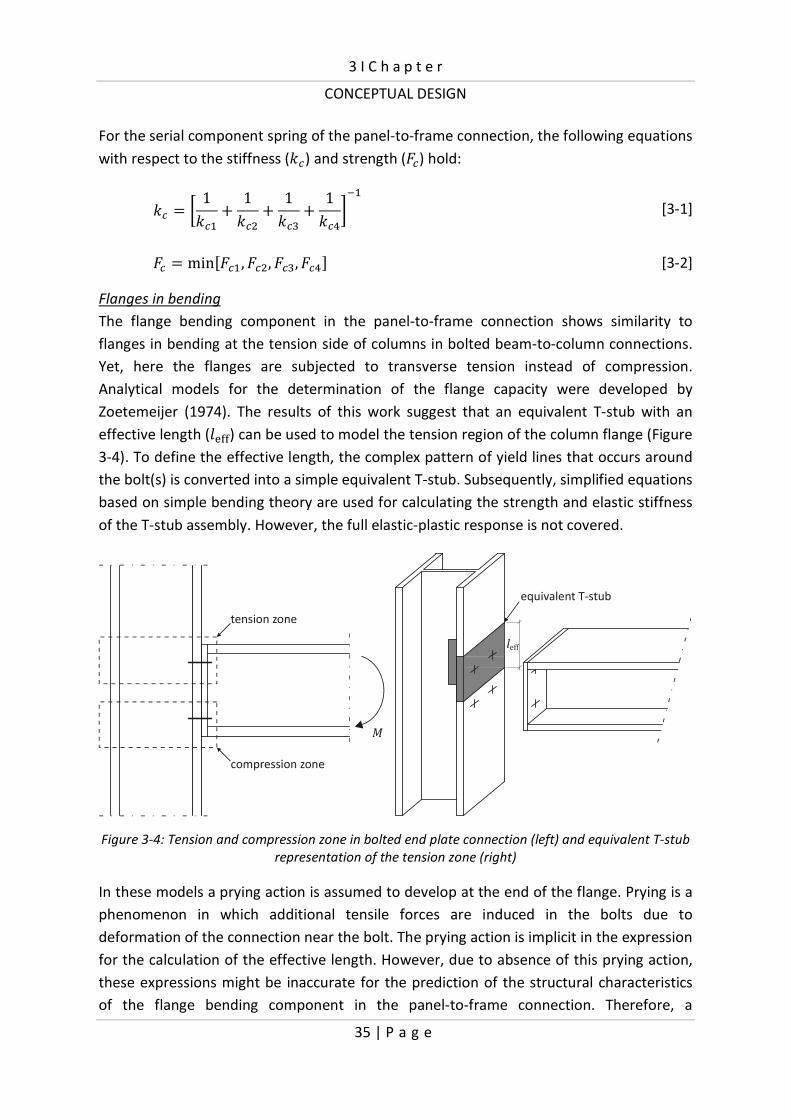
3 I C h a p t e r
CONCEPTUAL DESIGN
35 | P a g e
For the serial component spring of the panel-to-frame connection, the following equations
with respect to the stiffness (��) and strength ( �) hold:
�� H Y 1��� Z 1��� Z 1�� Z 1��e\i�
[3-1]
� H minq ��, ��, �, �es [3-2]
Flanges in bending
The flange bending component in the panel-to-frame connection shows similarity to
flanges in bending at the tension side of columns in bolted beam-to-column connections.
Yet, here the flanges are subjected to transverse tension instead of compression.
Analytical models for the determination of the flange capacity were developed by
Zoetemeijer (1974). The results of this work suggest that an equivalent T-stub with an
effective length (/tuu) can be used to model the tension region of the column flange (Figure
3-4). To define the effective length, the complex pattern of yield lines that occurs around
the bolt(s) is converted into a simple equivalent T-stub. Subsequently, simplified equations
based on simple bending theory are used for calculating the strength and elastic stiffness
of the T-stub assembly. However, the full elastic-plastic response is not covered.
Figure 3-4: Tension and compression zone in bolted end plate connection (left) and equivalent T-stub
representation of the tension zone (right)
In these models a prying action is assumed to develop at the end of the flange. Prying is a
phenomenon in which additional tensile forces are induced in the bolts due to
deformation of the connection near the bolt. The prying action is implicit in the expression
for the calculation of the effective length. However, due to absence of this prying action,
these expressions might be inaccurate for the prediction of the structural characteristics
of the flange bending component in the panel-to-frame connection. Therefore, a
leff
M
tension zone
compression zone
equivalent T-stub
3 I C h a p t e r
CONCEPTUAL DESIGN
36 | P a g e
numerical parametric study will be performed to find the full elastic-plastic behavior of H-
flanges in bending (section 6.1). In this study, the effect of the position of the bolt with
respect to the end plate on the structural response will be investigated for several types of
H-sections. In order to validate the FE-model (section 5.1), component experiments will be
carried out (section 4.1.2).
Web in compression
A web subject to transverse compression applied directly through the flange may fail in
one of the following three ways. The most likely form of failure is web crushing. In this
case, the local stresses developed in the web exceed the yield strength of the steel. For
slender webs, it is possible that failure occurs by buckling of the web or by some form of
local instability known as web crippling. Eurocode 3 EN 1993-1-5 (2006) covers each of the
three failure modes (buckling, crippling, crushing) for fabricated or rolled beam sections.
However, when the load is applied indirectly via bending of the flanges to the web, web
crushing, web crippling and web buckling are not likely to occur while flange yielding
governs the strength. A calculation to demonstrate this, based on the regulations by
Eurocode 3 EN 1993-1-5, is provided in Appendix A. Accordingly, only the stiffness of the
web in compression is of interest. Therefore, the web stiffness will be considered as well
in the numerical parametric study concerning the component flange bending (section 6.1).
Bolts in compression
As compressive loading is a less conventional mode of loading bolts, design rules for bolts
subject to compressive loading are lacking. As pointed out in section 2.2.2, bolts and nuts
are designed so that tension failure of the bolt occurs before stripping of the threads.
However, when subject to compressive loading, other failure behavior might govern the
strength of a bolt-nut assembly. To provide insight into the behavior of bolts subject to
compressive loading, experiments will be carried out (section 4.1.1). Besides, the
application of Alexander’s theory to bolts subject to compressive loading will be validated.
Plate in compression
When compressing a bolt to a steel plate, the stress state under the bolt is not a simple
uni-axial state of stress but a more complex tri-axial state of stress. Although no plastic
deformation is desired in this component before bolt failure takes place, yielding of the
steel angle under the compression produced by the bolts was observed during previous
full-scale experiments. Therefore improvements have to be made to the connection.
Experiments will be carried out to provide insight into the behavior of steel plates subject
to compression produced by bolts (section 4.1.3). Based on the findings, the connection
will be improved. Then, the modified component will be subject to experimental
investigation in order to determine its structural characteristics (section 4.1.4).
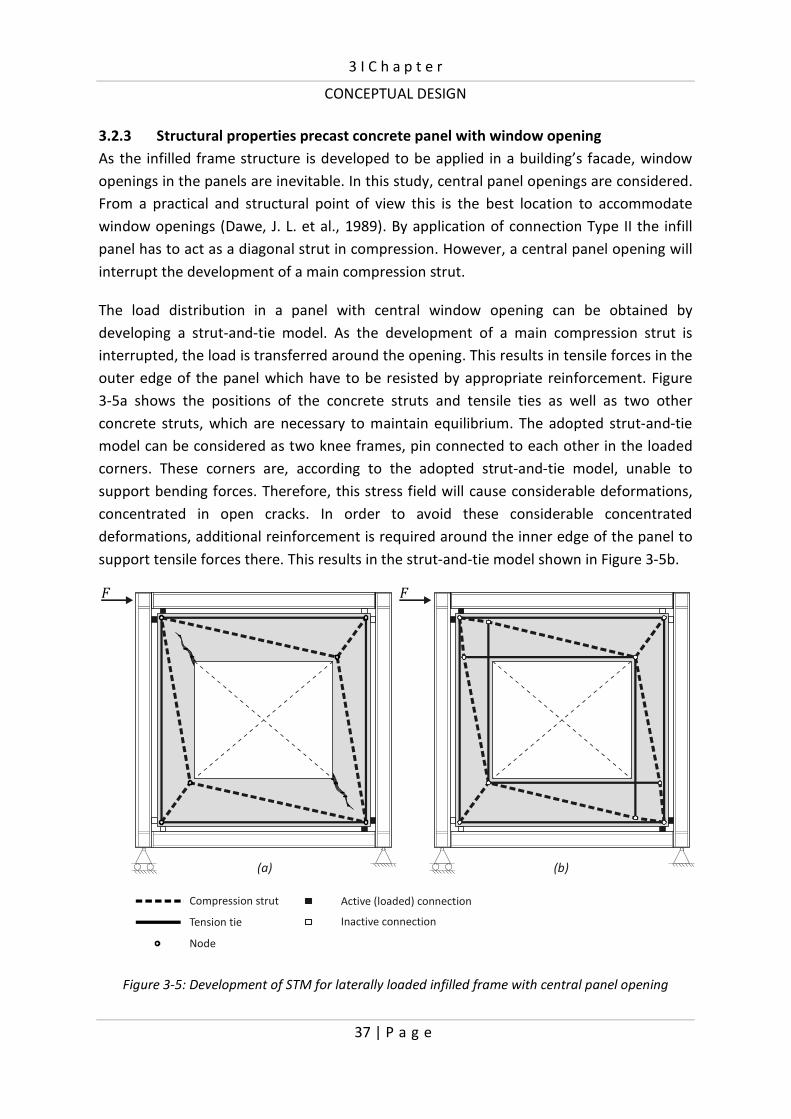
3 I C h a p t e r
CONCEPTUAL DESIGN
37 | P a g e
3.2.3 Structural properties precast concrete panel with window opening
As the infilled frame structure is developed to be applied in a building’s facade, window
openings in the panels are inevitable. In this study, central panel openings are considered.
From a practical and structural point of view this is the best location to accommodate
window openings (Dawe, J. L. et al., 1989). By application of connection Type II the infill
panel has to act as a diagonal strut in compression. However, a central panel opening will
interrupt the development of a main compression strut.
The load distribution in a panel with central window opening can be obtained by
developing a strut-and-tie model. As the development of a main compression strut is
interrupted, the load is transferred around the opening. This results in tensile forces in the
outer edge of the panel which have to be resisted by appropriate reinforcement. Figure
3-5a shows the positions of the concrete struts and tensile ties as well as two other
concrete struts, which are necessary to maintain equilibrium. The adopted strut-and-tie
model can be considered as two knee frames, pin connected to each other in the loaded
corners. These corners are, according to the adopted strut-and-tie model, unable to
support bending forces. Therefore, this stress field will cause considerable deformations,
concentrated in open cracks. In order to avoid these considerable concentrated
deformations, additional reinforcement is required around the inner edge of the panel to
support tensile forces there. This results in the strut-and-tie model shown in Figure 3-5b.
Figure 3-5: Development of STM for laterally loaded infilled frame with central panel opening
Compression strut
Tension tie
Node
Active (loaded) connection
Inactive connection
F F
(a) (b)

3 I C h a p t e r
CONCEPTUAL DESIGN
38 | P a g e
This strut-and-tie model can be applied to determine the required amount of
reinforcement, to provide the demanded strength ( !) of infill panels with window
openings. However, a simple method to establish the panel stiffness (�!) does not exist
yet. Therefore, in order to come to design models for the determination of the panel
stiffness, the size and vertical position of the panel opening will be experimentally
investigated (section 4.2). This allows the development of a finite element model (section
5.2) to be used in parameter studies (section 6.2). Based on the results of these studies, a
simple model to find the equivalent panel stiffness, as a function of parameters, as
opening position, geometry and the reinforcement, will be developed.
3.3 Chapter conclusions
In this chapter, a discrete panel-to-frame connection was selected for further study. This
connection comprises structural bolts on the column and beam in every corner of the
steel frame, confining the precast concrete panel within the steel frame. Thereupon, a
mechanical model was proposed for the semi-integral infilled frame with the preferred
panel-to-frame connection. This model enables analyzing a building structure consisting of
semi-integral infilled frames by standard structural analysis methods. Input for the model
are geometrical and material properties of the frame structure and the structural
characteristics of springs representing the frame joints, panel-to-frame connections and
the infill panel respectively. Research will be carried out in order to enable determination
of all required structural characteristics by design methods. A survey of the available and
required design methods is provided in Table 3-2.
Table 3-2: Design methods for elements in mechanical model
Strength
Symbol Method
Stiffness
Symbol
Method
Frame:
Members B, v,0 EN 1993-1-1 �, �, ) Applied mechanics
Joints 01 EN 1993-1-8 31 EN 1993-1-8
Panel-to-frame connection: � Component method: �� Component method:
Web in compression �� Excluded ��� To be defined
Flanges in bending �� To be defined ��� To be defined
Bolts in compression � Theory§2.2.3
to be validated
�� Theory §2.2.3
Plate in compression �e To be defined ��e To be defined
Panel: ! STM �! To be defined

39 | P a g e
Chapter 4: EXPERIMENTS
Scope of the chapter
This chapter presents the experimental part of this study. Section 4.1 treats the
experiments that were performed to study the behavior of the four basic components of
the panel-to-frame connection described in chapter 3. The various test programs carried
out and test setups applied are described, and the test results are presented and discussed.
Thereupon, an elaborated description of the full-scale experimental study for studying the
composite characteristics of the semi-integral infilled frame is provided in section 4.2. The
test setup, measurements and procedures used are explained and the test results are
presented and evaluated. The concluding section 4.3 summarizes the most important
findings.
4.1 Component experiments
In the previous chapter, a mechanical model was presented for the semi-integral infilled
frame. In this model, the discrete panel-to-frame connection is partitioned into four basic
components. The identified components include ‘web in compression’, ‘flanges in
bending’, ‘bolts in compression’ and ‘plate in compression’. This section presents various
experiments that are carried out in order to study the structural behavior of these
components. The results will be used to validate a finite element model (section 5.1) and
to calibrate springs that represent the discrete panel-to-frame connection in finite
element models for full-size laterally loaded semi-integral infilled frames (section 5.2).
4.1.1 Bolts in compression
First of all, experiments are carried out to study the desired failure mechanism for the
semi-integral infilled frame, being a bolt failure consisting of bolt shear through the nut.
Therefore, high-strength bolt-nut assemblies are tested in compression. The results are
used as well to validate the applicability of Alexander’s theory (Alexander, E. M., 1977) for
strength prediction of bolt-nut assemblies in compression.
Test setup and test program
High-strength M24 bolt-nut assemblies are tested by compressive loading in a
compression test setup (Figure 4-1). The load is applied under controlled displacement
conditions. For this purpose the loading plate is controlled at 0.10 mm/min. Deformations
are measured with three linear variable differential transformers (LVDTs) equally divided
around the circumference of the shank of the bolt. Based on these three measurements,
the average deformation in the middle of the bolt can be derived. Additionally, it can be
shown whether, besides to normal force, the bolt is subject to bending moment. The LVDT

4 I C h a p t e r
EXPERIMENTS
40 | P a g e
measuring distance applied is 50 mm. For the fastening of the LVDTs to the bolt, a fixing
medium is designed.
Figure 4-1: Overview of test setup for component ‘bolts in compression’
Regular bolt-nut combinations (RC), being nuts with a grade indication that matches the
first number of the bolts with which they are used, as well as unusual combinations (UC)
are tested in compression. The latter combinations are also dealt with in order to possibly
find failure mechanisms with a large deformation capacity. A survey of the test program is
provided in Table 4-1. All tests are carried out twice, indicated with the character A or B
respectively at the end of the test code.
Table 4-1: Test program for component ‘bolts in compression’
Combination Bolt grade Nut grade
M24-RC1.A; M24-RC1.B 8.8 8
M24-UC1.A; M24-UC1.B 8.8 10
M24-RC2.A; M24-RC2.B 10.9 10
M24-UC2.A; M24-UC2.B 10.9 8
Tensile tests are performed on test coupons made out of bolts from the same series as
used for the tests, to determine the actual material properties of the bolts. Table 4-2 gives
the yield stress O���P (equivalent to the 0.2 proof stress for the 10.9 bolts) and the
ultimate tensile stress D���F of the bolts applied.
Table 4-2: Bolt material properties
Test coupon wxy [N/mm2] wzy [N/mm
2]
8.8M24 bolt 571 768
10.9M24 bolt 1028 1112
It is noticeable that the strength properties of the 8.8M24 bolt are lower than its nominal
properties (��� = 640 N/mm2 and ��� = 800 N/mm
2).
Loading plate
Structural bolt
Nut
Loading base
Loading plate with hole
LVDT LVDT
LVDT fix
L =50 mm0
δ
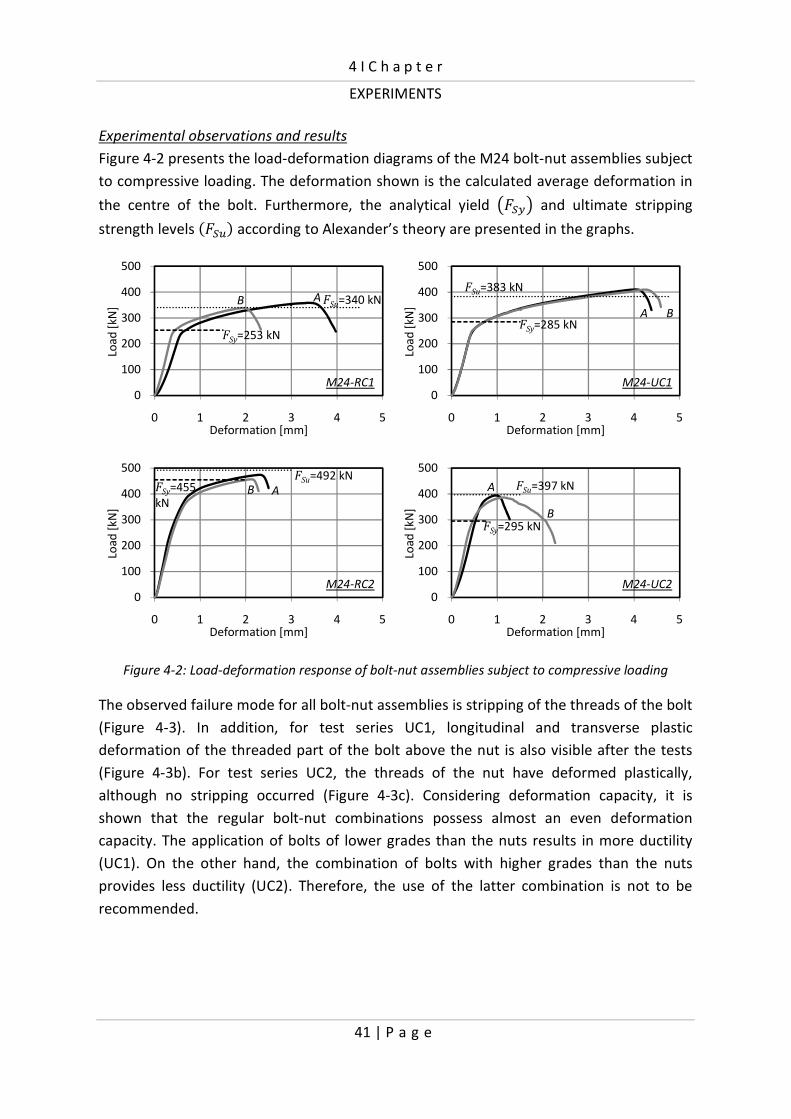
4 I C h a p t e r
EXPERIMENTS
41 | P a g e
Experimental observations and results
Figure 4-2 presents the load-deformation diagrams of the M24 bolt-nut assemblies subject
to compressive loading. The deformation shown is the calculated average deformation in
the centre of the bolt. Furthermore, the analytical yield O ��P and ultimate stripping
strength levels D ��F according to Alexander’s theory are presented in the graphs.
Figure 4-2: Load-deformation response of bolt-nut assemblies subject to compressive loading
The observed failure mode for all bolt-nut assemblies is stripping of the threads of the bolt
(Figure 4-3). In addition, for test series UC1, longitudinal and transverse plastic
deformation of the threaded part of the bolt above the nut is also visible after the tests
(Figure 4-3b). For test series UC2, the threads of the nut have deformed plastically,
although no stripping occurred (Figure 4-3c). Considering deformation capacity, it is
shown that the regular bolt-nut combinations possess almost an even deformation
capacity. The application of bolts of lower grades than the nuts results in more ductility
(UC1). On the other hand, the combination of bolts with higher grades than the nuts
provides less ductility (UC2). Therefore, the use of the latter combination is not to be
recommended.
0
100
200
300
400
500
0 1 2 3 4 5
Loa
d [
kN]
Deformation [mm]
M24-RC1
AB
FSy=253 kN
FSu=340 kN
0
100
200
300
400
500
0 1 2 3 4 5Lo
ad
[kN
]
Deformation [mm]
M24-UC1
BA
FSu=383 kN
FSy=285 kN
0
100
200
300
400
500
0 1 2 3 4 5
Loa
d [
kN]
Deformation [mm]
M24-RC2
ABFSy=455
kN
FSu=492 kN
0
100
200
300
400
500
0 1 2 3 4 5
Loa
d [
kN]
Deformation [mm]
M24-UC2
A
BFSy=295 kN
FSu=397 kN

4 I C h a p t e r
EXPERIMENTS
42 | P a g e
(a) (b) (c)
Figure 4-3: Bolt thread stripping failure with some yielding of the threaded part (b) or the nut (c)
Discussion of test results
The average experimentally found failure loads are presented in Table 4-3 together with
the bolt yield strength ( ��), the tensile strength ( ��) and the ultimate stripping strength
( ��) according to Alexander’s theory. In the last column, a comparison is made between
the analytically determined stripping strength and the experimental strength.
Table 4-3: Survey of experimental and analytical results
Combination Tensile strength {|x [kN]{|z [kN]
Stripping strength {}z [kN]
Experimental
strength [kN]
Comparison
M24-RC1 202 271 340 349 -3%
M24-UC1 202 271 383 410 -6%
M24-RC2 363 393 492 465 +6%
M24-UC2 363 393 397 391 +2%
The results show that, unlike bolts subject to tensile loading, bolts subject to compressive
loading fail by thread stripping failure and not by axial failure of the bolt, although some
yielding of the bolt takes place. Good agreement is shown between the experimentally
found ultimate strengths and the ultimate strength predictions according to Alexander’s
theory. Therefore, this theory can be applied for prediction of the stripping strength of
bolt-nut assemblies subject to compressive loading.
4.1.2 Flanges in bending with web in compression
A test program is carried out to study the component ‘flanges in bending’ in combination
with the component ‘web in compression’. The main objective of the test results is to
validate the finite element model used for studying these two components (section 5.1).
Test setup and test program
HE200B sections with welded end plates are subject to transverse compressive loading,
introduced by 10.9M24 bolts on the flanges, in a compression test setup. The load is
applied under controlled displacement conditions. For this purpose the loading plate is
controlled at 0.10 mm/min in the elastic range and at 0.20 mm/min in the plastic range.
LVDTs are used to measure displacements under the bolts and under the end of the

4 I C h a p t e r
EXPERIMENTS
43 | P a g e
outside of the flanges. 3 strain gauges with lengths of 10 mm, equally divided around the
shank of the bolt, are used to measure strains at the bolt surface. These measurements
allow determination of the load distribution over the two bolts. Figure 4-4 gives an
overview of the test setup. The geometry of the test specimen is shown in Figure 4-5. Two
identical tests are performed.
Figure 4-4: Overview of test setup for component ‘flanges in bending with web in compression’
Figure 4-5: Geometry test specimen
The steel of the HE200B section is grade S355. To determine the actual material
properties, tensile tests are performed on test coupons taken from the flanges and web of
the section. Table 4-4 gives the yield stress O��P and the ultimate tensile stress D��F. Table 4-4: Material properties HE200B sections
Test coupon taken from: wx [N/mm2] wz [N/mm
2]
Web 423 519
Flange 356 465
Loading base
Loading plate
Structural bolt
HE200B section
LVDT ALVDT B
Strain gauges
LVDT A
Welded end plate
t=15mm
δ
100 20015
20
0
10
0
Ø26
[mm]
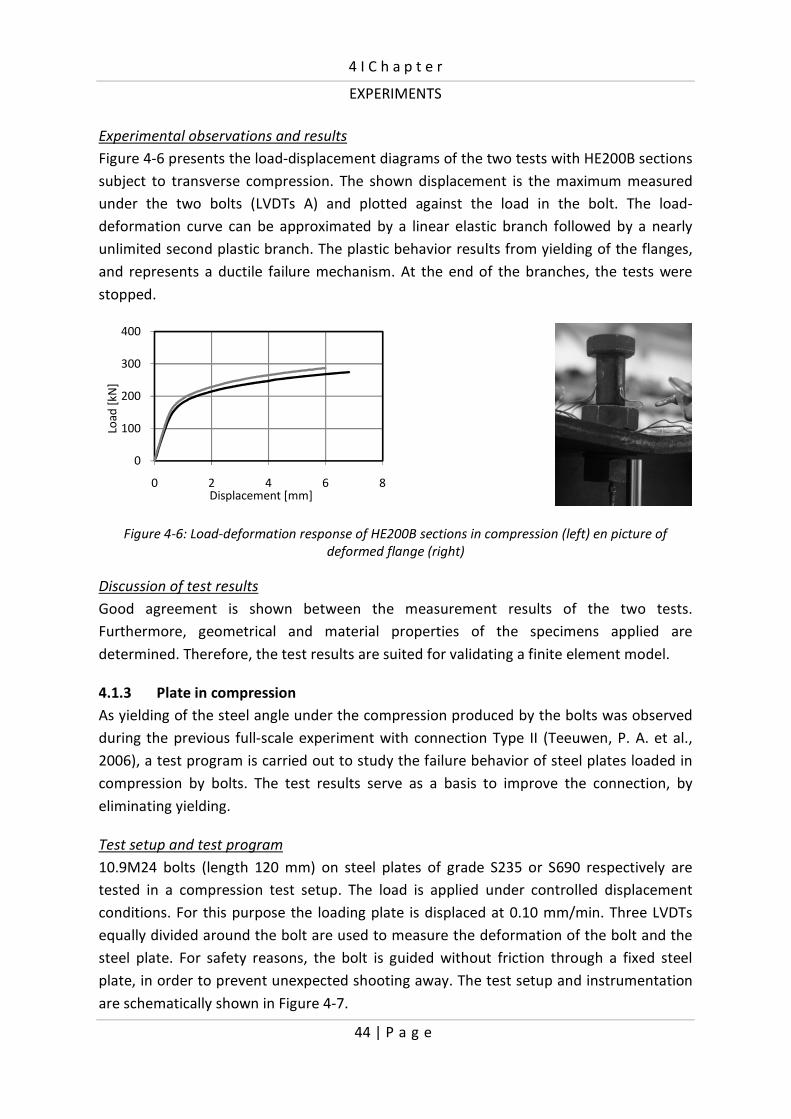
4 I C h a p t e r
EXPERIMENTS
44 | P a g e
Experimental observations and results
Figure 4-6 presents the load-displacement diagrams of the two tests with HE200B sections
subject to transverse compression. The shown displacement is the maximum measured
under the two bolts (LVDTs A) and plotted against the load in the bolt. The load-
deformation curve can be approximated by a linear elastic branch followed by a nearly
unlimited second plastic branch. The plastic behavior results from yielding of the flanges,
and represents a ductile failure mechanism. At the end of the branches, the tests were
stopped.
Figure 4-6: Load-deformation response of HE200B sections in compression (left) en picture of
deformed flange (right)
Discussion of test results
Good agreement is shown between the measurement results of the two tests.
Furthermore, geometrical and material properties of the specimens applied are
determined. Therefore, the test results are suited for validating a finite element model.
4.1.3 Plate in compression
As yielding of the steel angle under the compression produced by the bolts was observed
during the previous full-scale experiment with connection Type II (Teeuwen, P. A. et al.,
2006), a test program is carried out to study the failure behavior of steel plates loaded in
compression by bolts. The test results serve as a basis to improve the connection, by
eliminating yielding.
Test setup and test program
10.9M24 bolts (length 120 mm) on steel plates of grade S235 or S690 respectively are
tested in a compression test setup. The load is applied under controlled displacement
conditions. For this purpose the loading plate is displaced at 0.10 mm/min. Three LVDTs
equally divided around the bolt are used to measure the deformation of the bolt and the
steel plate. For safety reasons, the bolt is guided without friction through a fixed steel
plate, in order to prevent unexpected shooting away. The test setup and instrumentation
are schematically shown in Figure 4-7.
0
100
200
300
400
0 2 4 6 8
Loa
d [
kN]
Displacement [mm]
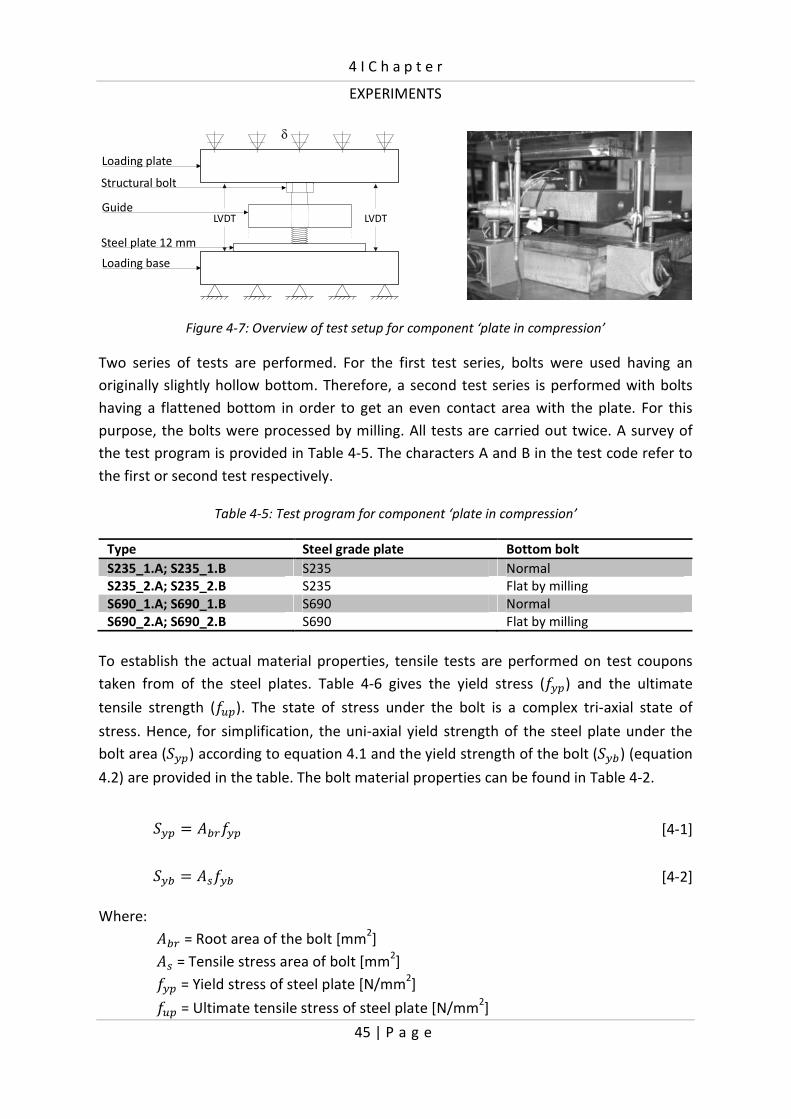
4 I C h a p t e r
EXPERIMENTS
45 | P a g e
Figure 4-7: Overview of test setup for component ‘plate in compression’
Two series of tests are performed. For the first test series, bolts were used having an
originally slightly hollow bottom. Therefore, a second test series is performed with bolts
having a flattened bottom in order to get an even contact area with the plate. For this
purpose, the bolts were processed by milling. All tests are carried out twice. A survey of
the test program is provided in Table 4-5. The characters A and B in the test code refer to
the first or second test respectively.
Table 4-5: Test program for component ‘plate in compression’
Type Steel grade plate Bottom bolt
S235_1.A; S235_1.B S235 Normal
S235_2.A; S235_2.B S235 Flat by milling
S690_1.A; S690_1.B S690 Normal
S690_2.A; S690_2.B S690 Flat by milling
To establish the actual material properties, tensile tests are performed on test coupons
taken from of the steel plates. Table 4-6 gives the yield stress (��!) and the ultimate
tensile strength (��!). The state of stress under the bolt is a complex tri-axial state of
stress. Hence, for simplification, the uni-axial yield strength of the steel plate under the
bolt area (3�!) according to equation 4.1 and the yield strength of the bolt (3��) (equation
4.2) are provided in the table. The bolt material properties can be found in Table 4-2.
3�! H ��.��! [4-1]
3�� H ����� [4-2]
Where:
��. = Root area of the bolt [mm2]
�� = Tensile stress area of bolt [mm2]
��! = Yield stress of steel plate [N/mm2]
��! = Ultimate tensile stress of steel plate [N/mm2]
Loading plate
Structural bolt
Guide
Steel plate 12 mm
Loading base
LVDTLVDT
δ

4 I C h a p t e r
EXPERIMENTS
46 | P a g e
Table 4-6: Material properties and strengths
Test coupon wx~ [N/mm2] wz~ [N/mm
2] }x~[kN] }xy[kN]
S235 318 419 103 363
S690 837 872 271 363
Experimental observations and results
Figure 4-8 presents the load-deformation response of the compression tests on bolts on
steel plates. The presented deformation is the calculated average deformation in the
centre of the bolt. All tests are stopped around 400 kN. It is shown that the flattening of
the bottom of the bolt (2A, 2B) results in a shorter settling stage and a higher stiffness.
Considering the tests with flattened bottoms, the diagram of the test on steel plate S235
shows a curved behavior. Plastic deformation of the steel plate (Figure 4-9) occurs at an
early stage of loading. No plastic deformation is visual at the bolt.
The diagram of the test on steel plate S690 can, after a settling stage, be approached
reasonably accurately with bi-linear behavior. Plastic deformation hardly occurred at the
steel plate (Figure 4-9) but it did at the bolt. The onset of yielding occurs around 350 kN ,
corresponding to the yield strength of the bolt (3��) which is substantially greater than the
uni-axial yield strength of the steel plate under the bolt area (3�!= 271 kN).
Figure 4-8: Load-deformation response of compression tests on bolts on steel plates
S235 S690
Figure 4-9: Imprints of bolts in steel plates
0
100
200
300
400
500
0 1 2 3 4
Loa
d [
kN]
Deformation [mm]
S235
1.B
1.A2.A 2.B
0
100
200
300
400
500
0 1 2 3 4
Loa
d [
kN]
Deformation [mm]
S690
2.A
1.A
1.B2.B
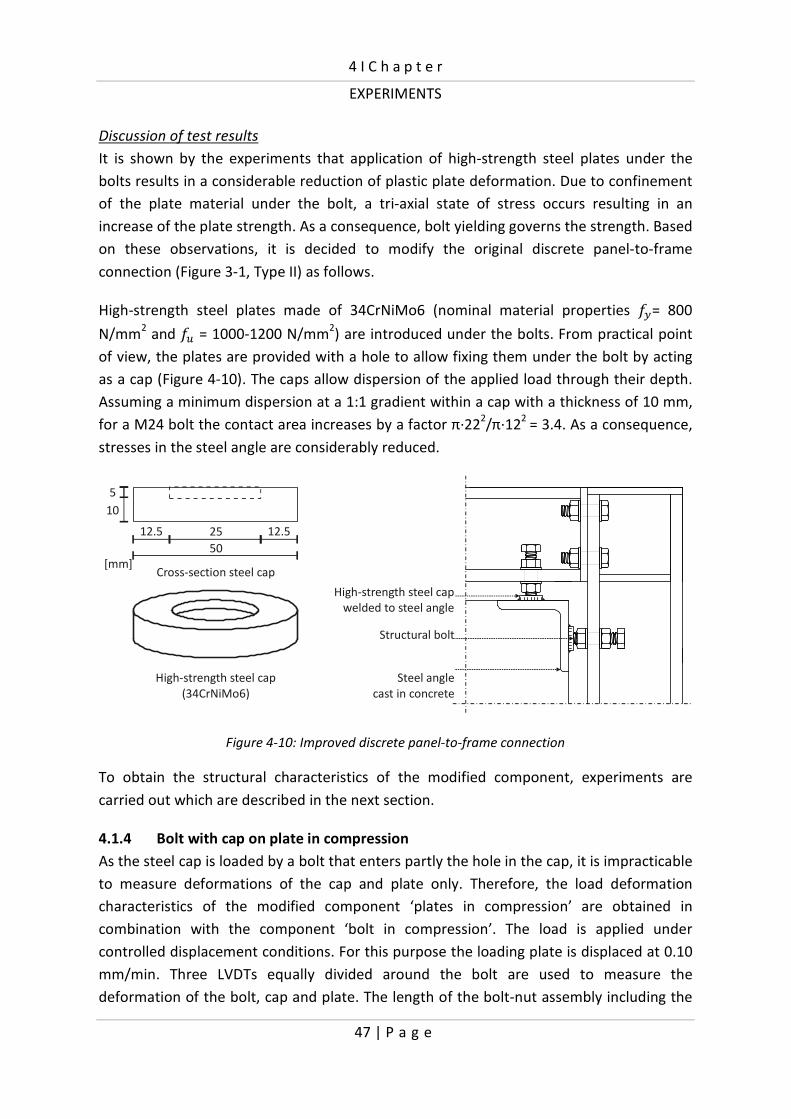
4 I C h a p t e r
EXPERIMENTS
47 | P a g e
Discussion of test results
It is shown by the experiments that application of high-strength steel plates under the
bolts results in a considerable reduction of plastic plate deformation. Due to confinement
of the plate material under the bolt, a tri-axial state of stress occurs resulting in an
increase of the plate strength. As a consequence, bolt yielding governs the strength. Based
on these observations, it is decided to modify the original discrete panel-to-frame
connection (Figure 3-1, Type II) as follows.
High-strength steel plates made of 34CrNiMo6 (nominal material properties ��= 800
N/mm2 and �� = 1000-1200 N/mm
2) are introduced under the bolts. From practical point
of view, the plates are provided with a hole to allow fixing them under the bolt by acting
as a cap (Figure 4-10). The caps allow dispersion of the applied load through their depth.
Assuming a minimum dispersion at a 1:1 gradient within a cap with a thickness of 10 mm,
for a M24 bolt the contact area increases by a factor π·222/π·12
2 = 3.4. As a consequence,
stresses in the steel angle are considerably reduced.
Figure 4-10: Improved discrete panel-to-frame connection
To obtain the structural characteristics of the modified component, experiments are
carried out which are described in the next section.
4.1.4 Bolt with cap on plate in compression
As the steel cap is loaded by a bolt that enters partly the hole in the cap, it is impracticable
to measure deformations of the cap and plate only. Therefore, the load deformation
characteristics of the modified component ‘plates in compression’ are obtained in
combination with the component ‘bolt in compression’. The load is applied under
controlled displacement conditions. For this purpose the loading plate is displaced at 0.10
mm/min. Three LVDTs equally divided around the bolt are used to measure the
deformation of the bolt, cap and plate. The length of the bolt-nut assembly including the
Structural bolt
High-strength steel cap
welded to steel angle
Steel angle
cast in concrete
High-strength steel cap
(34CrNiMo6)
50
[mm]
5
10
12.5 12.525
Cross-section steel cap
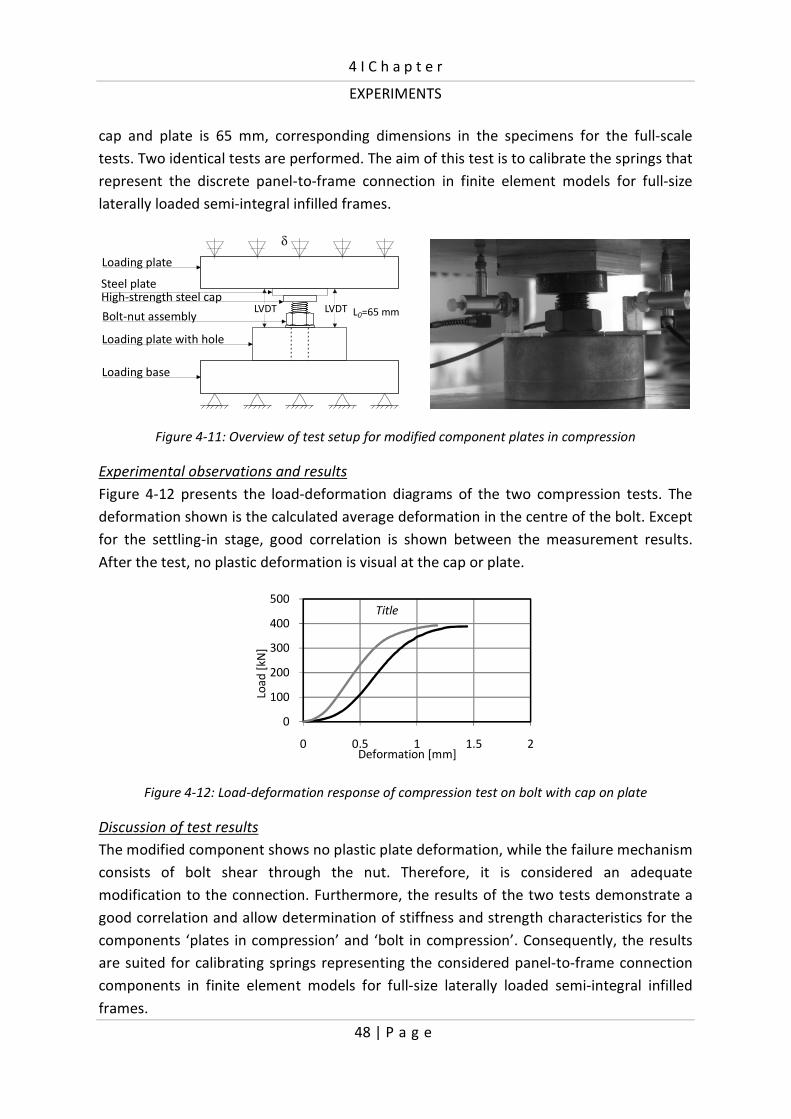
4 I C h a p t e r
EXPERIMENTS
48 | P a g e
cap and plate is 65 mm, corresponding dimensions in the specimens for the full-scale
tests. Two identical tests are performed. The aim of this test is to calibrate the springs that
represent the discrete panel-to-frame connection in finite element models for full-size
laterally loaded semi-integral infilled frames.
Figure 4-11: Overview of test setup for modified component plates in compression
Experimental observations and results
Figure 4-12 presents the load-deformation diagrams of the two compression tests. The
deformation shown is the calculated average deformation in the centre of the bolt. Except
for the settling-in stage, good correlation is shown between the measurement results.
After the test, no plastic deformation is visual at the cap or plate.
Figure 4-12: Load-deformation response of compression test on bolt with cap on plate
Discussion of test results
The modified component shows no plastic plate deformation, while the failure mechanism
consists of bolt shear through the nut. Therefore, it is considered an adequate
modification to the connection. Furthermore, the results of the two tests demonstrate a
good correlation and allow determination of stiffness and strength characteristics for the
components ‘plates in compression’ and ‘bolt in compression’. Consequently, the results
are suited for calibrating springs representing the considered panel-to-frame connection
components in finite element models for full-size laterally loaded semi-integral infilled
frames.
Loading plate
High-strength steel cap
Bolt-nut assembly
Loading base
Loading plate with hole
LVDTLVDT L =65 mm0
Steel plate
δ
0
100
200
300
400
500
0 0.5 1 1.5 2
Loa
d [
kN]
Deformation [mm]
Title

4 I C h a p t e r
EXPERIMENTS
49 | P a g e
4.2 Full-scale experiments
In order to provide insight into the composite behavior between steel frames and
discretely connected precast concrete infill panels provided with window openings, full-
scale experiments on single-story single-bay infilled frame structures have been
conducted. The main objective of the full-scale experiments is to observe the general
behavior of the structure in terms of stiffness, strength and ductility. At the same time,
the influence of the chosen parameter, being the size and position of the window opening,
is investigated. The results of these experiments are used to validate a finite element
model for full-size laterally loaded semi-integral infilled frames (section 5.2).
4.2.1 Test setup and test program
Test rig
A specifically designed test rig has been used to perform the full scale tests on the infilled
frame structures (Figure 4-13a). This test rig is composed of two rigid triangular frames,
constructed of HE300B members. These two triangular frames are transversely linked
through rigid steel members at their corners. A specimen can be positioned between the
two triangular frames and is supported on two different supports. At the side of the jack,
the lower corner of the specimen is fixed in the vertical direction to the test rig by four
steel M30 rods (Support A, Figure 4-13c). This support is intended to act as a roller support
with a restrained displacement in vertical direction only. At the opposite lower corner, the
specimen is supported in a heavy steel block which restrains the specimen from both
horizontal and vertical displacement (Support B, Figure 4-13d). This support is supposed to
act as a pin support. A specimen can be loaded laterally by a hydraulic jack that is coupled
to the top corner of the triangular frames by stiff steel plates, acting at the height of the
top beam centre (Figure 4-13b). This jack has a stroke of 200 mm and a capacity of 2 MN.

4 I C h a p t e r
EXPERIMENTS
50 | P a g e
Figure 4-13: Test rig with mounted specimen
Measurements
The behavior of a specimen under lateral loading is recorded as follows (a scheme of the
arrangement of the instrumentation is shown in Figure 4-14):
The global position of the specimen in relation to the ground is measured with LVDTs and
digital clock gauges (DCGs) at the four corners of both frame (� to �) and panel (� to ��). The LVDTs and DCGs were fixed to independent, stand alone, measuring frames.
Deformations of the panel are measured across both diagonals (δ� to δ�e) with Cable-
Extension Position Transducers (PTs). To find the strain distribution in the precast concrete
panel, strain gauge rosettes (gauge lengths 60 mm) are placed on specific locations
(Rosettes A to K) on one side of the panel. These locations are situated in the centre of the
compression struts , and on nodes between these struts (see strut-and-tie model provided
in Figure 3-5). Since due to cracking of concrete in tension zones rosettes will be damaged
c) Support A d) Support B
Jack Specimen3m
3m
Test rig
A B
a) Test rig with mounted specimen b) Loading point
M30 rods
Steel block
Test rig
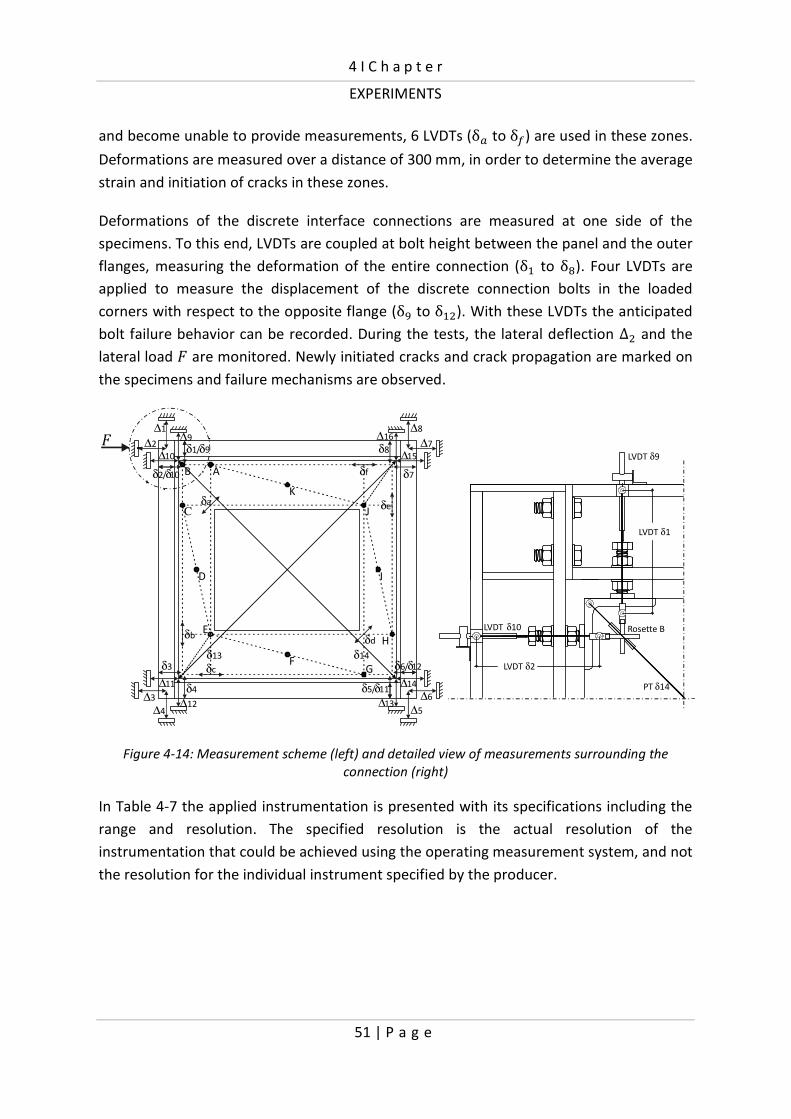
4 I C h a p t e r
EXPERIMENTS
51 | P a g e
and become unable to provide measurements, 6 LVDTs (δ� to δ#) are used in these zones.
Deformations are measured over a distance of 300 mm, in order to determine the average
strain and initiation of cracks in these zones.
Deformations of the discrete interface connections are measured at one side of the
specimens. To this end, LVDTs are coupled at bolt height between the panel and the outer
flanges, measuring the deformation of the entire connection (δ� to δ�). Four LVDTs are
applied to measure the displacement of the discrete connection bolts in the loaded
corners with respect to the opposite flange (δ� to δ��). With these LVDTs the anticipated
bolt failure behavior can be recorded. During the tests, the lateral deflection Δ� and the
lateral load are monitored. Newly initiated cracks and crack propagation are marked on
the specimens and failure mechanisms are observed.
Figure 4-14: Measurement scheme (left) and detailed view of measurements surrounding the
connection (right)
In Table 4-7 the applied instrumentation is presented with its specifications including the
range and resolution. The specified resolution is the actual resolution of the
instrumentation that could be achieved using the operating measurement system, and not
the resolution for the individual instrument specified by the producer.
AB
C
D
E
F
K
J
I
H
G
∆1
δ1/δ9 δ8
δ4 δ5/δ11
δ2/δ10 δ7
δ3 δ6/δ12
δf
δe
δc
δb δd
δa
∆2
δ13 δ14
∆10
∆9
∆15
∆16
∆11
∆12
∆14
∆13
∆8
∆7
∆4
∆3
∆5
∆6
LVDT δ9
LVDT δ1
LVDT δ10
LVDT δ2
Rosette B
PT δ14
F

4 I C h a p t e r
EXPERIMENTS
52 | P a g e
Table 4-7: Specification of applied instrumentation
Instrument Model Range [mm] Resolution [mm]
LVDTs Δ1, Δ8 HBM W20 TK +/- 20 0.01
LVDT Δ2 HBM W50TS +/- 50 0.01
LVDT Δ7 Celesco PT1A +/- 50 0.05
LVDT Δ9 HBM W10TK +/- 10 0.01
DCGs Δ3, Δ4, Δ11, Δ12,
Δ13, Δ 14
Mitutoyo IDF150 50 0.003
DCG Δ5 Mitutoyo IDU 1025 25 0.01
DCG Δ6, Mitutoyo IDC112B 10 0.001
PTs Δ10 + Δ15 Celesco PT1 series +/- 50 0.05
LVDT Δ16 HBM W10TK +/- 10 0.01
LVDTs δ1 δ4 δ5 δ8 HBM W20 +/- 20 0.01
LVDTs δ2, δ3, δ6, δ7 HBM W10K +/- 10 0.01
LVDTs δ9 + δ11 Solartron AX/5/S +/- 5 0.001
LVDTs δ10 + δ12 SM3 +/- 1.5 0.001
PTs δ13 + δ14 Celesco PT1A +/- 25 0.025
LVDTs δa to δf SM3 +/- 1.5 0.001
Strain Gauge A to K PLR-60-11 2 % 1 μm/m
Test specimens
The single-story, single-bay, 3 by 3 m infilled frame structure subject to lateral loading
consists of a simply connected steel frame, constructed of HE180M sections in S235 for
columns and beams. The discrete panel-to-frame connections, designed for a ‘bolt failure’
mechanism, are constructed with 8.8 bolts with grade 8 nuts. To investigate the effect of
the size and position of the window opening in the infill panel on the infilled frame
behavior, five different panel geometries are tested. The geometrical properties are
provided in Table 4-8. Each panel is tested twice, resulting in a total number of 10 full-
scale tests. As no failure of the frame is expected, only two identical steel frames are used
for the entire test program. The five precast reinforced concrete panels (/ Q ' Q 4 =
2700×2700×200 mm3) are alternately discretely connected to one of the steel frames.
Table 4-8: Test program full-scale tests
Designation Height window
opening [mm]
Opening % [%] Vertical position x/y
[-]
FS-1A; FS-1B 1050 25.9 1.20
FS-2A; FS-2B 1350 33.3 1.25
FS-3A; FS-3B 1500 37.0 1.00
FS-4A; FS-4B 1650 40.7 1.330
FS-5A; FS-5B 1800 44.4 1.00
The design of the main bending reinforcement is performed using the strut-and-tie
method, outlined in section 2.3. The “standard method” of the shear design procedure
that can be found in Eurocode 2 EN 1992-1-1 is used to design the members of the
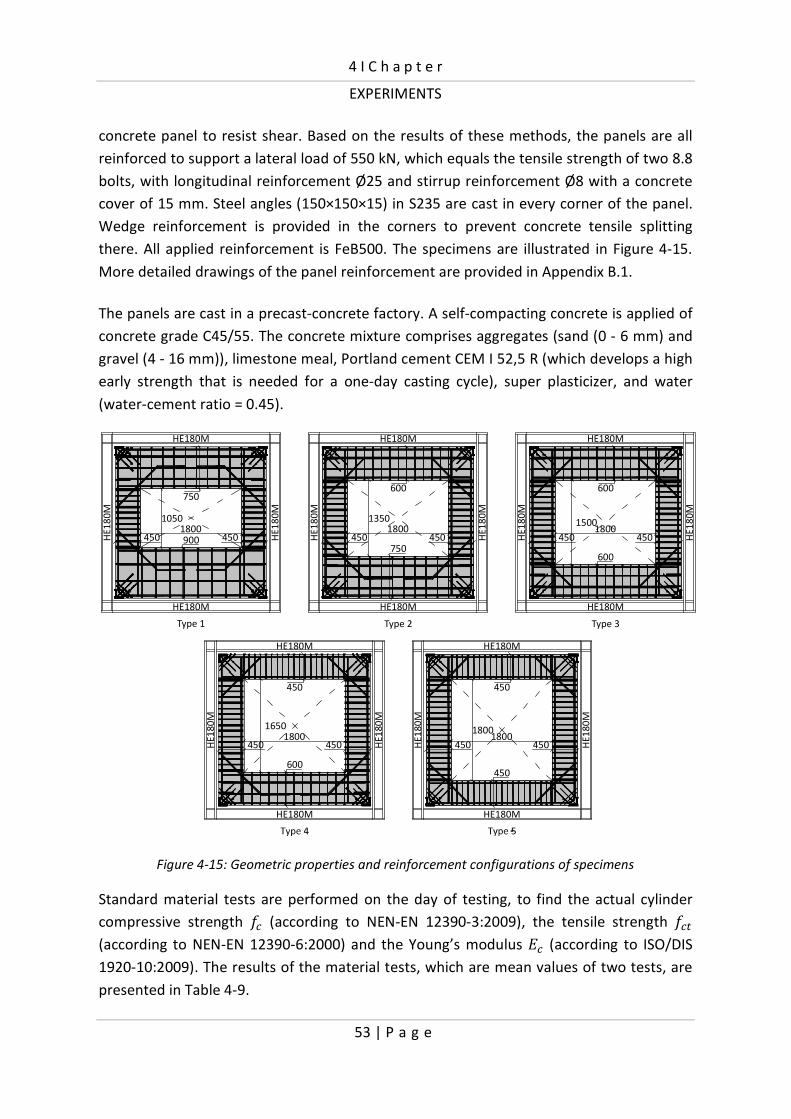
4 I C h a p t e r
EXPERIMENTS
53 | P a g e
concrete panel to resist shear. Based on the results of these methods, the panels are all
reinforced to support a lateral load of 550 kN, which equals the tensile strength of two 8.8
bolts, with longitudinal reinforcement Ø25 and stirrup reinforcement Ø8 with a concrete
cover of 15 mm. Steel angles (150×150×15) in S235 are cast in every corner of the panel.
Wedge reinforcement is provided in the corners to prevent concrete tensile splitting
there. All applied reinforcement is FeB500. The specimens are illustrated in Figure 4-15.
More detailed drawings of the panel reinforcement are provided in Appendix B.1.
The panels are cast in a precast-concrete factory. A self-compacting concrete is applied of
concrete grade C45/55. The concrete mixture comprises aggregates (sand (0 - 6 mm) and
gravel (4 - 16 mm)), limestone meal, Portland cement CEM I 52,5 R (which develops a high
early strength that is needed for a one-day casting cycle), super plasticizer, and water
(water-cement ratio = 0.45).
Figure 4-15: Geometric properties and reinforcement configurations of specimens
Standard material tests are performed on the day of testing, to find the actual cylinder
compressive strength �� (according to NEN-EN 12390-3:2009), the tensile strength ��� (according to NEN-EN 12390-6:2000) and the Young’s modulus �� (according to ISO/DIS
1920-10:2009). The results of the material tests, which are mean values of two tests, are
presented in Table 4-9.
1800450 450 450
450 450
1050 1350 1500
1800
1800 1800
1800 1800
HE180M
HE180M
HE
18
0M
HE
18
0M
1650
HE180M
HE180M
HE
18
0M
HE
18
0M
HE180M
HE180M
HE
18
0M
HE
18
0M
HE180M
HE180M
HE
18
0M
HE
18
0M
HE180M
HE180M
HE
18
0M
HE
18
0M
Type 1 Type 3Type 2
450450 450
450 450
450
600
600
450
450
600
750
750
900
600

4 I C h a p t e r
EXPERIMENTS
54 | P a g e
Table 4-9: Material properties concrete
Panel type w� [N/mm2] w�� [N/mm
2] �� [N/mm
2]
1 62.2 3.9 3.54E+04
2 64.4 3.9 3.67E+04
3 70.6 4.2 3.66E+04
4 75.6 4.4 3.70E+04
5 66.0 3.9 3.72E+04
Testing procedures
In order to quantify the contribution of an infill panel to the stiffness of its confining frame
structure, the stiffness of the bare frame structure (without the infill) has to be known. For
that reason, the bare frame is tested each time before mounting the precast concrete infill
panel within the frame. Therefore, first the beams and columns are assembled. The bolts
in the beam-to-column connections are torque controlled tightened up to a specified
torque of 400 Nm, to obtain identical initial stiffnesses of the bare frames for all tests as
best possible. Other conditions that might influence the coefficient of friction and so the
torque as e.g. surface conditions, corrosion and temperature, are supposed to remain
unchanged as each time the same series of bolts are used within identical climatic
circumstances. The test procedure of the bare frames involves a preload up to 20 kN to
close up initial gaps and contact tolerances between the specimen and the test rig. After
the unloading, the bare frames are loaded again up to a load of 60 kN. This load is chosen
such, that deformations of the frame are in the elastic range and therefore do not
influence the infilled frame behavior.
After the bare frame is tested, it is fixed to the, from practical point of view, horizontally
positioned panel. Then, the discrete connection bolts are placed and tightened up to a
specified torque of 275 Nm, once again to provide identical boundary conditions as best
possible for all tests. Since the infilled-frames are assembled in a horizontal position, the
dead weight does not influence the initial prestress levels in the bolts. After erecting the
infilled frame structure and thereupon installing the measurement instrumentation, it is
positioned in the test rig. The testing procedure of the infilled frames involves a preload of
50 kN (and unloading), for reasons stated earlier. Next, the infilled frames are loaded up to
failure. For both bare frame and infilled frame, the load is applied under controlled
displacement conditions. For this purpose the stroke of the jack is controlled at 1
mm/min. At this rate, the duration of the tests with the infilled frames is about 1 hour.
As mentioned before, all panels are tested a second time. To this end, the panel is turned
around its vertical axis of symmetry and replaced in the confining frame. By doing this, the
tension zones where cracks have developed during the first test with the panel become
compression zones during the second test, causing the cracks to close. The possible effect
of the initially present cracks on the global structural behavior is investigated by making

4 I C h a p t e r
EXPERIMENTS
55 | P a g e
measurements on the panels. Again, the bare frame structure is tested before the panel is
mounted.
Finally, after the last infilled frame test is carried out, one bare frame is loaded up to
failure in order to provide additionally insight into the non-linear behavior of the bare
frame.
4.2.2 Experimental observations and results
This chapter presents the results of the full-scale experiments. First, the overall load-
deflection behavior is discussed. Next, the local panel behavior and the local connection
behavior are considered. The most relevant results describing the major characteristics
are presented in this chapter. A survey of the measurement results is provided in
Appendix B.2.
Overall behavior
Figure 4-16 presents the lateral load-deflection response of the most severely deflected
bare frame. The graph shows the actual deflection of the specimen, which means that a
correction has been made for rigid body displacements and rotations. These occur as a
result of deformations of the test rig and sliding of the specimen in its supports, and have
to be deducted from the total measured deflection to obtain the actual deflection of the
specimen only. In order to determine the actual lateral deflection of a specimen, the
displacement measured at the loaded upper corner of the specimen (Δ�) is reduced by the
displacements due to rigid body translation and rotation measured at the specimen
corners by LVDTs Δe, Δ� and Δ� (for the measurement scheme, see Figure 4-14).
Figure 4-16: Load-deflection response bare frame
0
20
40
60
80
100
120
140
0 10 20 30 40 50 60
Late
ral l
ao
d [
kN]
Lateral deflection [mm]
kini;bf
ktan;bf
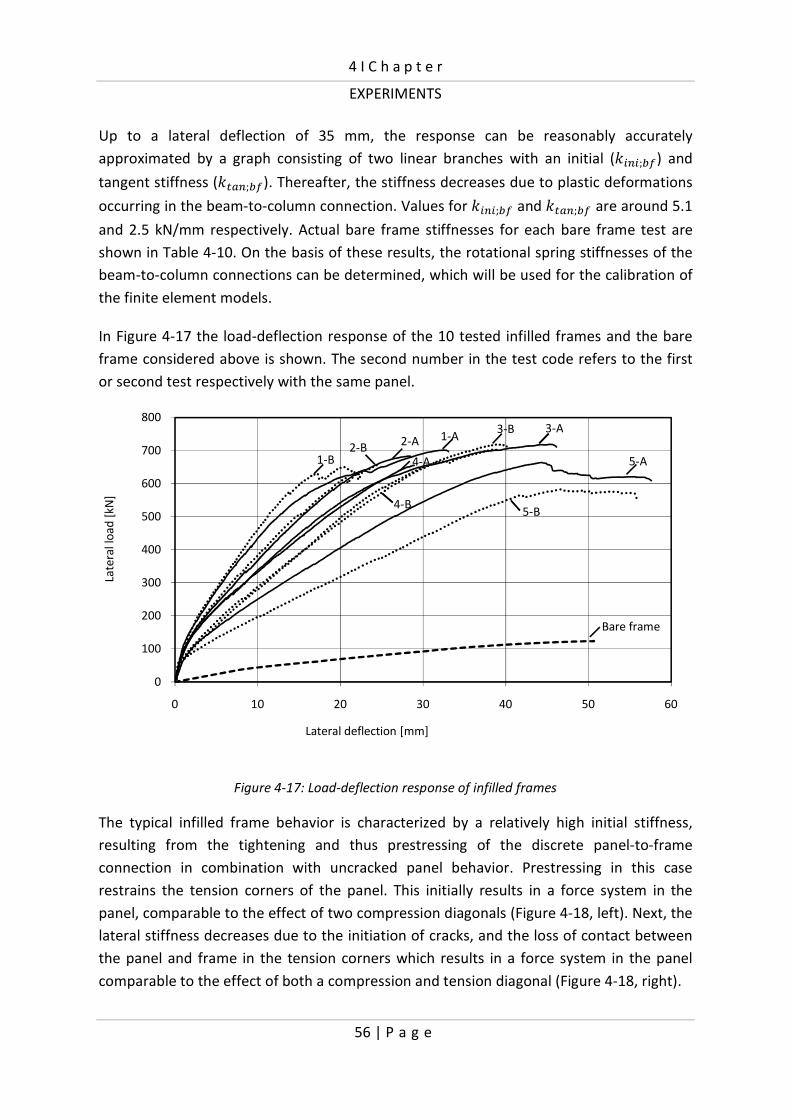
4 I C h a p t e r
EXPERIMENTS
56 | P a g e
Up to a lateral deflection of 35 mm, the response can be reasonably accurately
approximated by a graph consisting of two linear branches with an initial (����;�#) and
tangent stiffness (����;�#). Thereafter, the stiffness decreases due to plastic deformations
occurring in the beam-to-column connection. Values for ����;�# and ����;�# are around 5.1
and 2.5 kN/mm respectively. Actual bare frame stiffnesses for each bare frame test are
shown in Table 4-10. On the basis of these results, the rotational spring stiffnesses of the
beam-to-column connections can be determined, which will be used for the calibration of
the finite element models.
In Figure 4-17 the load-deflection response of the 10 tested infilled frames and the bare
frame considered above is shown. The second number in the test code refers to the first
or second test respectively with the same panel.
Figure 4-17: Load-deflection response of infilled frames
The typical infilled frame behavior is characterized by a relatively high initial stiffness,
resulting from the tightening and thus prestressing of the discrete panel-to-frame
connection in combination with uncracked panel behavior. Prestressing in this case
restrains the tension corners of the panel. This initially results in a force system in the
panel, comparable to the effect of two compression diagonals (Figure 4-18, left). Next, the
lateral stiffness decreases due to the initiation of cracks, and the loss of contact between
the panel and frame in the tension corners which results in a force system in the panel
comparable to the effect of both a compression and tension diagonal (Figure 4-18, right).
0
100
200
300
400
500
600
700
800
0 10 20 30 40 50 60
Late
ral l
oa
d [
kN]
Lateral deflection [mm]
5-A1-B
3-A3-B2-A 1-A
2-B
4-B
4-A
5-B
Bare frame

4 I C h a p t e r
EXPERIMENTS
57 | P a g e
Figure 4-18: Initial force system in panel with restraints in tension corners (left) and after loss of
contact between the panel and frame in the tension corners (right)
The behavior then can be considered linear up to around 500 kN, followed by a non-linear
branch and finally failure. For test numbers 1-A to 4-B, failure of the infilled frame
structures occurred by shearing of the panel-to-frame connection bolts through the nuts
by stripping of the threads of the bolts (Figure 4-19).
Figure 4-19: ‘Bolt shear through nut’ failure
Although the differences between the normal force levels in the bolts are only marginal,
the bolts on the lower beam should fail first since these bolts support the largest part of
the panel’s dead weight. However, the observed specific location of the failed bolts differs
for all tests (Table 4-10). This might be explained by the scatter in the material properties
of the bolts or by the presence of less or more friction between the bolt shaft and the nut.
For test numbers 2-B and 4-A rather brittle failure behavior was observed while for the
remaining tests a small decrease of the load was observed after the ultimate load is
reached, preceding the final failure point. All failure modes were accompanied by a loud
σp
σp
F
F
C1 T1
T2 C2
C = Compression corner
T = Tension corner
R
R
F
F
C1 T1
T2 C2
R=0
loss of contact
loss of contact
R=0
σp = Prestressing
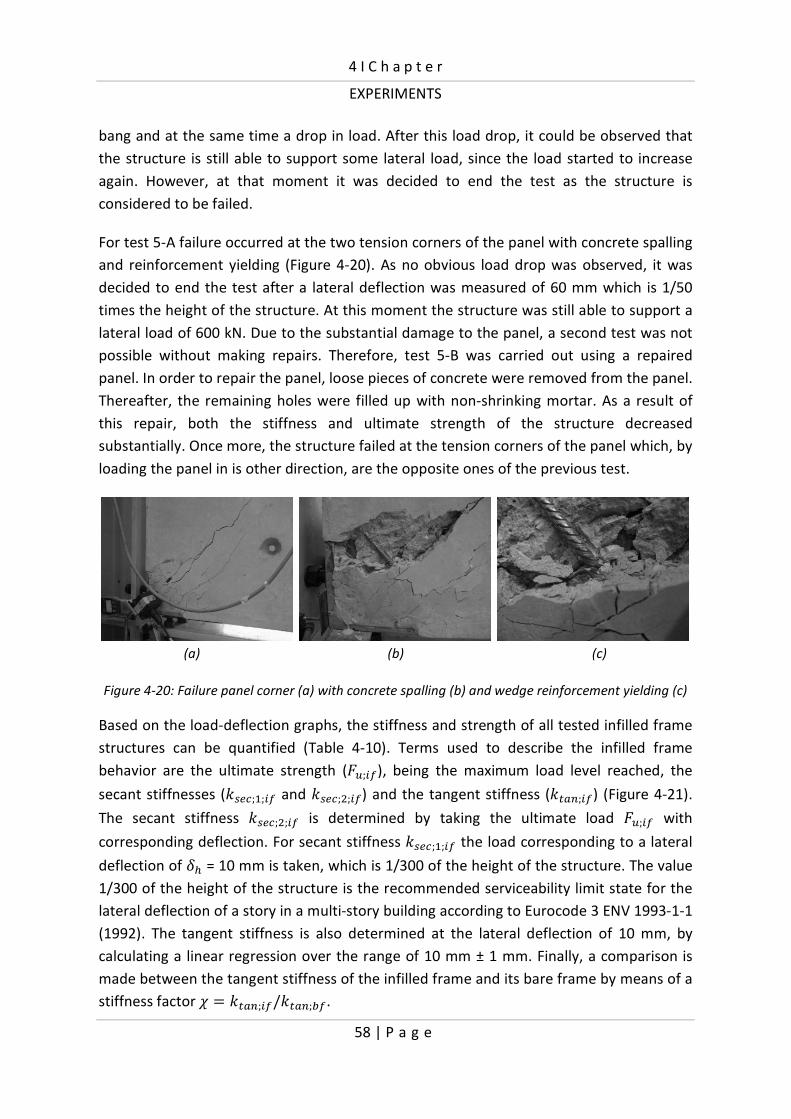
4 I C h a p t e r
EXPERIMENTS
58 | P a g e
bang and at the same time a drop in load. After this load drop, it could be observed that
the structure is still able to support some lateral load, since the load started to increase
again. However, at that moment it was decided to end the test as the structure is
considered to be failed.
For test 5-A failure occurred at the two tension corners of the panel with concrete spalling
and reinforcement yielding (Figure 4-20). As no obvious load drop was observed, it was
decided to end the test after a lateral deflection was measured of 60 mm which is 1/50
times the height of the structure. At this moment the structure was still able to support a
lateral load of 600 kN. Due to the substantial damage to the panel, a second test was not
possible without making repairs. Therefore, test 5-B was carried out using a repaired
panel. In order to repair the panel, loose pieces of concrete were removed from the panel.
Thereafter, the remaining holes were filled up with non-shrinking mortar. As a result of
this repair, both the stiffness and ultimate strength of the structure decreased
substantially. Once more, the structure failed at the tension corners of the panel which, by
loading the panel in is other direction, are the opposite ones of the previous test.
(a) (b) (c)
Figure 4-20: Failure panel corner (a) with concrete spalling (b) and wedge reinforcement yielding (c)
Based on the load-deflection graphs, the stiffness and strength of all tested infilled frame
structures can be quantified (Table 4-10). Terms used to describe the infilled frame
behavior are the ultimate strength ( �;�#), being the maximum load level reached, the
secant stiffnesses (��*�;�;�# and ��*�;�;�#) and the tangent stiffness (����;�#) (Figure 4-21).
The secant stiffness ��*�;�;�# is determined by taking the ultimate load �;�# with
corresponding deflection. For secant stiffness ��*�;�;�# the load corresponding to a lateral
deflection of 9 = 10 mm is taken, which is 1/300 of the height of the structure. The value
1/300 of the height of the structure is the recommended serviceability limit state for the
lateral deflection of a story in a multi-story building according to Eurocode 3 ENV 1993-1-1
(1992). The tangent stiffness is also determined at the lateral deflection of 10 mm, by
calculating a linear regression over the range of 10 mm ± 1 mm. Finally, a comparison is
made between the tangent stiffness of the infilled frame and its bare frame by means of a
stiffness factor � H ����;�#/����;�#.

4 I C h a p t e r
EXPERIMENTS
59 | P a g e
Figure 4-21: Illustration of terms for consideration of infilled frame behavior
Table 4-10: Test results infilled frames
Test
No.
Frame stiffness ����;yw ����;yw
Infilled frame stiffness ����;�;�w ����;�;�w ����;�w
� Strength {z;�w [kN]
Failure
location*
FS-1A 5.1 2.5 43.5 21.5 29.8 11.9 701 C1-C
FS-1B 5.2 2.4 46.1 31.7 32.0 13.3 650 C2-B
FS-2A 5.4 2.4 36.9 24.2 27.6 11.5 684 C1-C
FS-2B 5.4 2.8 38.2 26.8 25.3 9.0 658 C2-B
FS-3A 5.8 2.1 33.9 15.9 22.6 10.8 719 C2-C
FS-3B 4.7 2.4 28.0 18.4 19.3 8.0 719 C2-C
FS-4A 4.6 2.4 33.2 18.4 20.3 8.5 656 C1-C
FS-4B 4.9 2.6 28.7 18.5 20.7 8.0 704 C2-C
FS-5A 5.2 2.5 25.1 15.0 16.1 6.4 664 (Panel)
FS-5B 4.8 2.6 20.1 12.5 10.3 4.0 583 (Panel)
*See Figure 4-18 for locations C1 and C2. -C and -B refer to the panel-to-column and panel-
to-beam connection respectively.
The results in Table 4-10 show that the observed lateral stiffness of the infilled frames
ranges between 4.0 and 13.3 times the bare frame stiffness, depending on the size of the
window opening. Besides, all specimen types are able to support a lateral load of 583 kN
or more. As mentioned before, for four panel geometries (type 1 to 4), the discrete
connections were governing the strength of the structure as aimed at by design while for
the test with the largest opening (type 5) the infill panel failed first.
Panel behavior
Figure 4-22 shows the load-deformation response of the infill panels, measured over the
compression and tension diagonal of the panels respectively (Figure 4-14: δ� and δ�e). As
mentioned before, for test 5-A and 5-B the ultimate strength of the panel is exceeded
which is also shown in the graphs by the comparatively large (plastic) deformations. For all
Late
ral l
oa
d [
kN]
Lateral deflection [mm]
ksec;1
ksec;2
Fu;if
δh = 1/300 H
ktan;if

4 I C h a p t e r
EXPERIMENTS
60 | P a g e
other tests, the ultimate strength of the panels is not reached which is shown by the
reasonably straight path at the top of the graphs, implying that some strength and
deformation capacity are left. Furthermore, the graphs indicate a decrease of panel
stiffness resulting from reusing the panels for the second test.
Figure 4-22: Deformation panels measured over the compression (left) and tension (right) diagonal
Principal Strains/Stresses
During each test 12 rectangular rosettes have been used to measure the strains on the
concrete panel. Given the measurements of 3 independent strains from the 3 gauges in a
rectangular rosette, it is possible to calculate the principal strains and their orientation
with respect to the rosette. For a rosette with gauges labeled a, b and c as shown in Figure
4-23, the principal strains �� and �� and the principal direction � can be calculated with
equations 4-3 and 4-4 respectively (Sharpe, W. N. J., 2008).
��,� H �� Z ��2 � 1√2�D�� R ��F� Z D�� R ��F� [4-3]
� H �� tani� l�� R 2�� Z ���� R �� m [4-4]
Figure 4-23: Rectangular rosette gauge orientation
0
200
400
600
800
-50-40-30-20-100
Late
ral l
oa
d [
kN]
Diagonal deformation [mm]
1-A
2-A 3-A
5-A
4-B
5-B
1-B
3-B
4-A2
-B
0
200
400
600
800
0 10 20 30 40 50
Late
ral l
oa
d [
kN]
Diagonal deformation [mm]
5-B
5-A1
-A1
-B 2-A 3
-A
3-B
4-B
4-A
2-B
c
a
b
ε1
θ
ε2

4 I C h a p t e r
EXPERIMENTS
61 | P a g e
For the following discussion, the principal strains are represented as Mohr’s circles. Each
Mohr’s circle is drawn with its centre coinciding with the centre of the rosette. The arrow
and its length represent the direction and the magnitude of the minor principal strain (��).
The direction of the major principal strain (��) is perpendicular to minor principal strain,
and its magnitude can be read from the Mohr’s circle, being the distance to the �-axis.
Examples of some possible configurations to illustrate this, are given in Figure 4-24.
�� < �� < 0
(bi-axial compression)
�� < 0 < ��
(combined tension and compression)
0 < �� < ��
(bi-axial tension)
Figure 4-24: Some possible Mohr’s circle configurations
Figure 4-25 and Figure 4-26 give the principal strain distribution for test 1-A, 3-A, and 5-A
at identical load levels ( = 250 kN and = 500 kN). If a cross is shown in the figure, the
rosette is damaged by cracks entering the compression zone, and therefore the
corresponding measurements are unusable. It can be seen that the qualitative strain
distribution for all panels is fairly the same. Obviously, the panel with the largest window
opening and thus the smallest concrete cross-sections shows the highest strains which can
also be seen in the figure.
Figure 4-25: Principal strains represented as Mohr’s circles for test 1-A
ε1ε2
y
ε1ε2
y
0
y
0 ε2 ε1
100 μm F = 250 kN
Test 1-A
100 μm F = 500 kN
Test 1-A
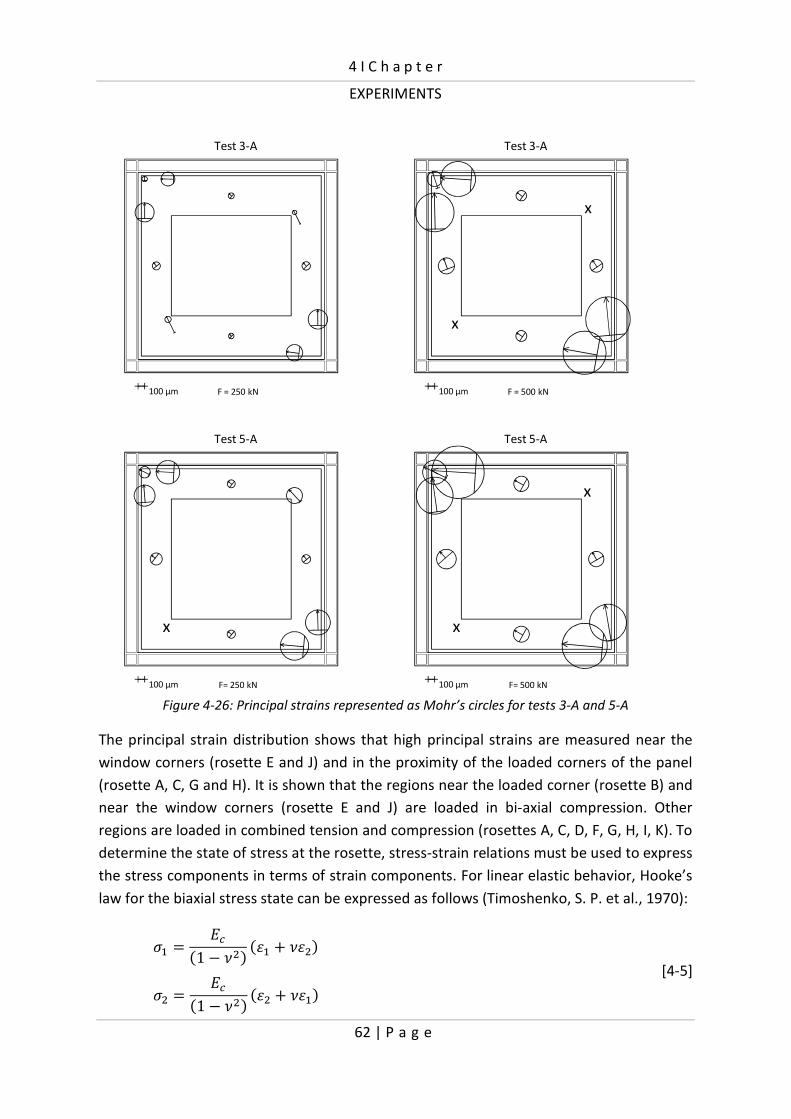
4 I C h a p t e r
EXPERIMENTS
62 | P a g e
Figure 4-26: Principal strains represented as Mohr’s circles for tests 3-A and 5-A
The principal strain distribution shows that high principal strains are measured near the
window corners (rosette E and J) and in the proximity of the loaded corners of the panel
(rosette A, C, G and H). It is shown that the regions near the loaded corner (rosette B) and
near the window corners (rosette E and J) are loaded in bi-axial compression. Other
regions are loaded in combined tension and compression (rosettes A, C, D, F, G, H, I, K). To
determine the state of stress at the rosette, stress-strain relations must be used to express
the stress components in terms of strain components. For linear elastic behavior, Hooke’s
law for the biaxial stress state can be expressed as follows (Timoshenko, S. P. et al., 1970):
�� H ��D1 R @�F D�� Z @��F [4-5]
�� H ��D1 R @�F D�� Z @��F
100 μm F = 250 kN
Test 3-A
100 μm F = 500 kN
Test 3-A
x
x
100 μm F= 250 kN
Test 5-A
x
100 μm F= 500 kN
Test 5-A
x
x
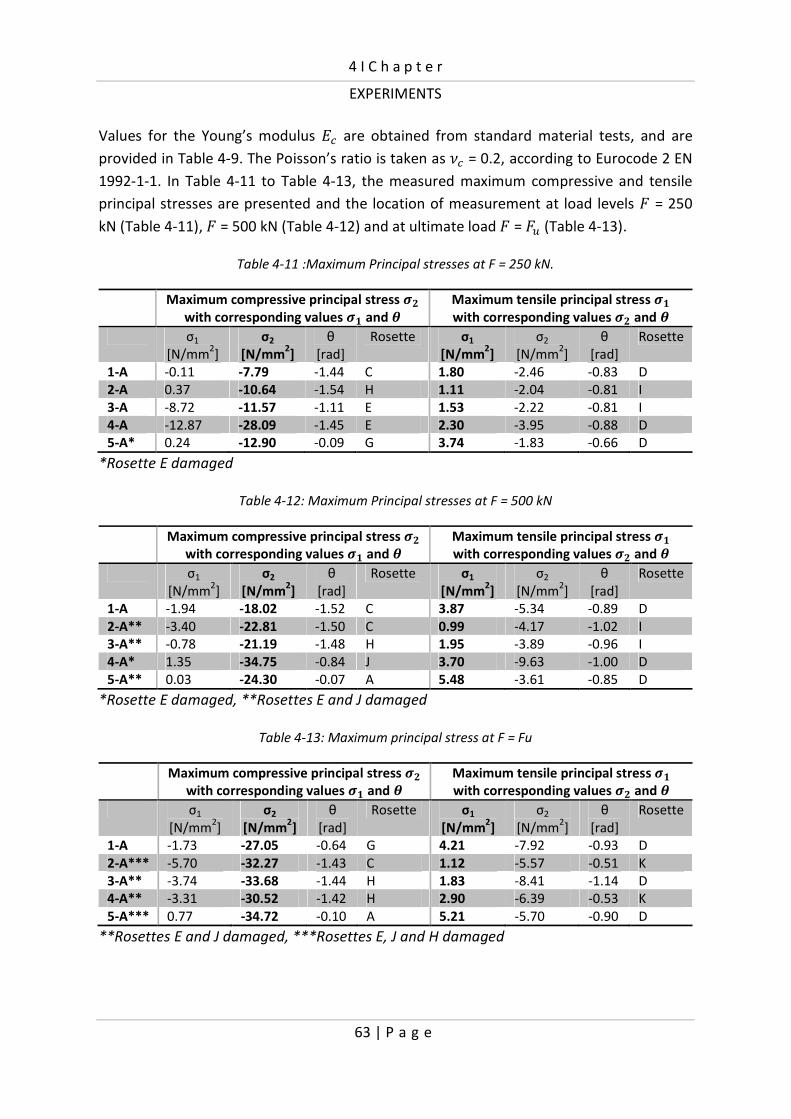
4 I C h a p t e r
EXPERIMENTS
63 | P a g e
Values for the Young’s modulus �� are obtained from standard material tests, and are
provided in Table 4-9. The Poisson’s ratio is taken as @� = 0.2, according to Eurocode 2 EN
1992-1-1. In Table 4-11 to Table 4-13, the measured maximum compressive and tensile
principal stresses are presented and the location of measurement at load levels = 250
kN (Table 4-11), = 500 kN (Table 4-12) and at ultimate load = � (Table 4-13).
Table 4-11 :Maximum Principal stresses at F = 250 kN.
Maximum compressive principal stress ��
with corresponding values �� and �
Maximum tensile principal stress ��
with corresponding values �� and �
σ1
[N/mm2]
σ2
[N/mm2]
θ
[rad]
Rosette σ1
[N/mm2]
σ2
[N/mm2]
θ
[rad]
Rosette
1-A -0.11 -7.79 -1.44 C 1.80 -2.46 -0.83 D
2-A 0.37 -10.64 -1.54 H 1.11 -2.04 -0.81 I
3-A -8.72 -11.57 -1.11 E 1.53 -2.22 -0.81 I
4-A -12.87 -28.09 -1.45 E 2.30 -3.95 -0.88 D
5-A* 0.24 -12.90 -0.09 G 3.74 -1.83 -0.66 D
*Rosette E damaged
Table 4-12: Maximum Principal stresses at F = 500 kN
Maximum compressive principal stress ��
with corresponding values �� and �
Maximum tensile principal stress ��
with corresponding values �� and �
σ1
[N/mm2]
σ2
[N/mm2]
θ
[rad]
Rosette σ1
[N/mm2]
σ2
[N/mm2]
θ
[rad]
Rosette
1-A -1.94 -18.02 -1.52 C 3.87 -5.34 -0.89 D
2-A** -3.40 -22.81 -1.50 C 0.99 -4.17 -1.02 I
3-A** -0.78 -21.19 -1.48 H 1.95 -3.89 -0.96 I
4-A* 1.35 -34.75 -0.84 J 3.70 -9.63 -1.00 D
5-A** 0.03 -24.30 -0.07 A 5.48 -3.61 -0.85 D
*Rosette E damaged, **Rosettes E and J damaged
Table 4-13: Maximum principal stress at F = Fu
Maximum compressive principal stress ��
with corresponding values �� and �
Maximum tensile principal stress ��
with corresponding values �� and �
σ1
[N/mm2]
σ2
[N/mm2]
θ
[rad]
Rosette σ1
[N/mm2]
σ2
[N/mm2]
θ
[rad]
Rosette
1-A -1.73 -27.05 -0.64 G 4.21 -7.92 -0.93 D
2-A*** -5.70 -32.27 -1.43 C 1.12 -5.57 -0.51 K
3-A** -3.74 -33.68 -1.44 H 1.83 -8.41 -1.14 D
4-A** -3.31 -30.52 -1.42 H 2.90 -6.39 -0.53 K
5-A*** 0.77 -34.72 -0.10 A 5.21 -5.70 -0.90 D
**Rosettes E and J damaged, ***Rosettes E, J and H damaged
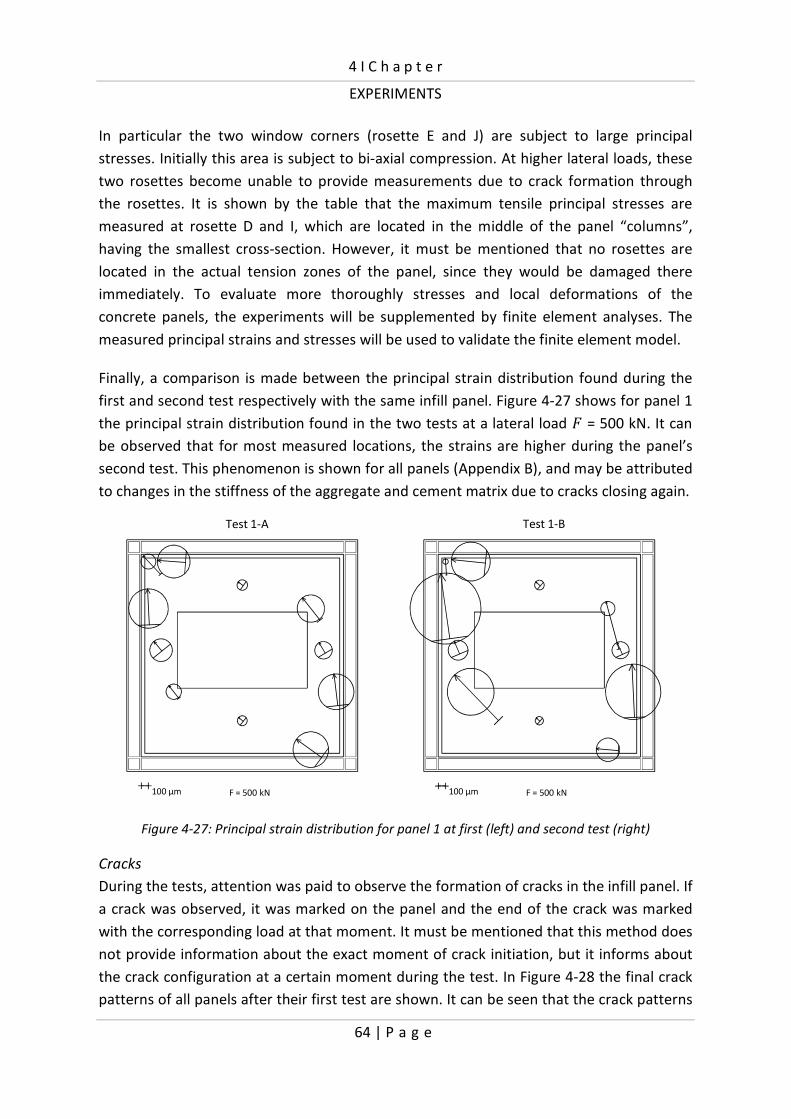
4 I C h a p t e r
EXPERIMENTS
64 | P a g e
In particular the two window corners (rosette E and J) are subject to large principal
stresses. Initially this area is subject to bi-axial compression. At higher lateral loads, these
two rosettes become unable to provide measurements due to crack formation through
the rosettes. It is shown by the table that the maximum tensile principal stresses are
measured at rosette D and I, which are located in the middle of the panel “columns”,
having the smallest cross-section. However, it must be mentioned that no rosettes are
located in the actual tension zones of the panel, since they would be damaged there
immediately. To evaluate more thoroughly stresses and local deformations of the
concrete panels, the experiments will be supplemented by finite element analyses. The
measured principal strains and stresses will be used to validate the finite element model.
Finally, a comparison is made between the principal strain distribution found during the
first and second test respectively with the same infill panel. Figure 4-27 shows for panel 1
the principal strain distribution found in the two tests at a lateral load = 500 kN. It can
be observed that for most measured locations, the strains are higher during the panel’s
second test. This phenomenon is shown for all panels (Appendix B), and may be attributed
to changes in the stiffness of the aggregate and cement matrix due to cracks closing again.
Figure 4-27: Principal strain distribution for panel 1 at first (left) and second test (right)
Cracks
During the tests, attention was paid to observe the formation of cracks in the infill panel. If
a crack was observed, it was marked on the panel and the end of the crack was marked
with the corresponding load at that moment. It must be mentioned that this method does
not provide information about the exact moment of crack initiation, but it informs about
the crack configuration at a certain moment during the test. In Figure 4-28 the final crack
patterns of all panels after their first test are shown. It can be seen that the crack patterns
100 μm F = 500 kN
Test 1-A
100 μm F = 500 kN
Test 1-B
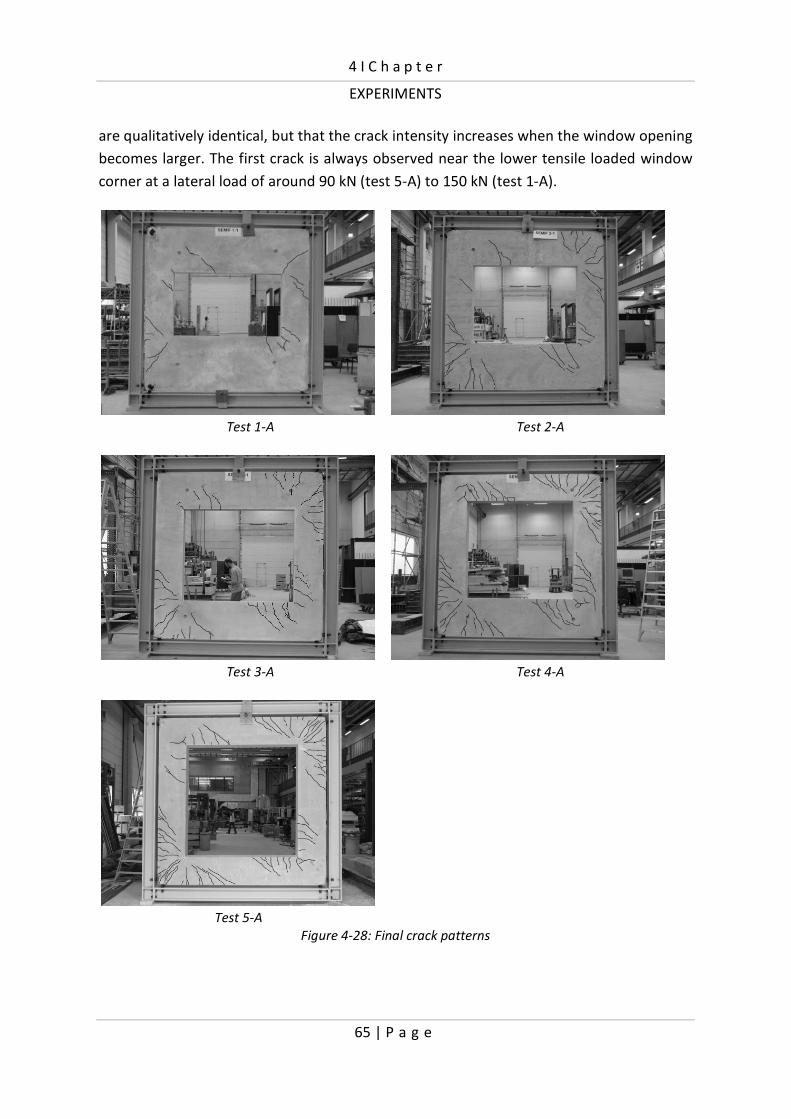
4 I C h a p t e r
EXPERIMENTS
65 | P a g e
are qualitatively identical, but that the crack intensity increases when the window opening
becomes larger. The first crack is always observed near the lower tensile loaded window
corner at a lateral load of around 90 kN (test 5-A) to 150 kN (test 1-A).
Test 1-A Test 2-A
Test 3-A Test 4-A
Test 5-A
Figure 4-28: Final crack patterns

4 I C h a p t e r
EXPERIMENTS
66 | P a g e
Discrete panel-to-frame connection behavior
Considering the discrete panel-to-frame connection behavior, the results of two (arbitrary)
tests are discussed. Figure 4-29 shows for test 4-A and 4-B the load-deformation behavior
of the discrete interface connection, measured between the head of the discrete
connection bolts and their opposite flanges (Figure 4-14: δ� to δ��). This displacement
comprises deformation due to flange bending together with shear deformation of the bolt
through the nut, including the anticipated bolt failure. The elastic behavior of both graphs
is quite comparable. However, a large difference is shown for the plastic and failure
behavior. The cross in the graphs indicates the moment of failure of bolt shear through
the nut. It is shown that the location of failure for the two tests is not the same (δ�k and δ�� respectively). Furthermore, the graphs of test 4-A show a much more brittle failure
behavior than the graphs of test 4-B. This explains the rather sudden failure behavior that
was observed in the overall load-deflection behavior.
Figure 4-29: Load-deformation behavior panel-to-frame connection tests 4A (left) and 4B (right)
4.3 Chapter conclusions
An experimental study consisting of various test programs was carried out to provide
insight into the structural behavior of the four identified components of the discrete
panel-to-frame connection. The results of these tests are used for calibration and/or
validation of finite element models presented in the next chapter. Notable conclusions
regarding this study are:
� Unlike bolts subject to tensile loading, bolts subject to compressive loading fail by
thread stripping failure and not by yielding of the bolt. The use of bolts with
lower grades than the nuts results in more ductile behavior while for the bolt
combined with nuts with lower strength less ductility occurs. Applicability of
Alexander’s theory for bolt-nut assemblies subject to compression has
successfully been validated.
� Based on the observation that the application of high-strength steel plates under
the compression bolts results in a considerable reduction of plastic plate
0
200
400
600
800
0 1 2 3 4
Late
ral l
oa
d [
kN]
Deformation [mm]
4A
x
δ10δ12 δ11 xδ9
x
δ10δ12 δ11 xδ9
0
200
400
600
800
0 1 2 3 4
Late
ral l
oa
d [
kN]
Deformation [mm]
4B
δ10δ12 δ11x
δ9
4 I C h a p t e r
EXPERIMENTS
67 | P a g e
deformation while bolt yielding governs the strengths, an improvement is made
for the component ‘plate in compression’ by adding high-strength steel caps
between the bolts and the steel angle.
� HE200B sections have been subject to transverse compression introduced via
bolts on the flanges. The test results allow validating a finite element model for
studying the components ‘flanges in bending’ and ‘web in compression’.
Thereupon, a full-scale test program was carried out for studying infilled frame behavior
of semi-integral infilled frames provided with window openings. The test program
consisted of ten full-scale tests on single-story, single-bay, 3 by 3 m infilled frame
structures with five different opening geometries. The following conclusions are drawn
with regard to the structural behavior of the tested infilled frame structures:
� The typical infilled frame behavior is characterized by a relatively high initial
stiffness, resulting from a force system in the panel comparable to the effect of
two compression diagonals. Next, the lateral stiffness decreases due to the
initiation of cracks, and the loss of contact between the panel and frame in the
tension corners, providing a force system in the panel comparable to the effect of
both a compression and tension diagonal. The behavior then can be considered
linear up to around 500 kN, followed by a non-linear branch and finally failure.
� For eight tests, failure of the infilled frame structures occurred by the preferred
panel-to-frame connection failure, consisting of shearing of the bolts through the
nuts by stripping of the threads of the bolts. Some of these bolt failures were
rather sudden and brittle. The specific location of failure differed for all tests.
After failure of the bolts, the structure was still able to support the lateral load.
Failure of the bolts does not result in failure of the structure, as force
transmission is redirected to the loaded corners of the frame by contact pressure
between frame and panel. Therefore, the rather brittle bolt failure behavior can
be considered as an acceptable failure mechanism. For the tests with the largest
window opening, the infill panel governed the strength of the structure. It failed
at the two tension corners of the panel by concrete spalling and reinforcement
yielding.
� The discretely connected precast concrete infill panels with window openings
significantly improved the performance of the steel frames. The observed
tangent stiffnesses range between 4 and 13 times the bare frame stiffness.


69 | P a g e
Chapter 5: FINITE ELEMENT MODELING
Scope of the chapter
This chapter presents finite element models developed for studying the structural behavior
of the components ‘flanges in bending with web in compression’ (section 5.1) and the
behavior of semi-integral infilled frames with window openings (section 5.2). An
elaborated description of the design of the models is provided. Subsequently, in order to
check the validity of the finite element models, they are compared with the component
experiment for ’flanges in bending with web in compression’ or the full-scale experiments
respectively. At the end of this chapter (section 5.3), conclusions regarding the simulations
of these experiments are given.
5.1 Component modeling
A finite element model is developed for simulating the component experiment ‘flanges in
bending with web in compression’ (section 4.1.2). For this purpose, the finite element
program ANSYS, release 11.0 (ANSYS Inc., 2007) is used. The validated finite element
model is developed to be used in a parameter study in order to find the strength and
stiffness characteristics of other H-sections (having different dimensions) subject to
transverse compression introduced indirectly through the flanges.
The choice of the FE-method depends on the problem to be analyzed. To find the plastic
resistance, material non-linear behavior has to be taken into account. Therefore, the tests
are simulated performing physical nonlinear analyses, using material properties obtained
from tensile tests on test coupons taken from the same member as the specimens are
made from.
In chapter 3 it was demonstrated, based on regulations by Eurocode 3 EN 1993-1-5, that
applying a transverse load indirectly via bending of the flanges to the web, the strength is
governed by flange yielding and not by a web failure mechanism. Accordingly, the FE-
model is to be developed for simulating flange yielding mechanisms only. As a
consequence, geometrical imperfections and residual stresses can be ignored as these are
not to influence the plastic resistance for flange yielding mechanisms. Because the flanges
are not sensitive to buckling, and the displacements are relative small and thus the
resulting stiffness changes are insignificant, geometrical linear analyses are performed.
To obtain a reliable finite element model, the geometry (Figure 5-1a) (the section height
('), section width (�), web thickness (45) and flange thickness (4#)) is modeled accurately
as measured. A description of the finite element model is provided in the next paragraph.

5 I C h a p t e r
FINITE ELEMENT MODELING
70 | P a g e
5.1.1 Mesh and elements
The cross-section of wide flange beams can be divided into different areas: the top and
bottom flange, the web and the fillets (Figure 5-1a). To model the cross-section, two
different element types can be used: shell and solid elements. Shell elements generally
require less input than solid elements, reducing the calculation time. However, using these
elements, the exact geometry cannot be modeled as the fillets are ignored while the web
and flange slightly overlap.
As the contribution of the fillets is expected to be of substantial influence on the results,
solid elements instead of shell elements are used to model the H-section. The FE-model
consists of 8-node (SOLID 45) and 20-node (SOLID 95) structural solids. SOLID 95 is a
higher order version of SOLID 45 which can tolerate irregular shapes without much loss of
accuracy.
Half a section is modeled by taking advantage of symmetry (Figure 5-1a). Besides, to
reduce the number of elements, degrees of freedom and so the calculation time, only the
upper half of the section is modeled, because it was experimentally observed that
deformations are largely localized in the upper flange. Moreover, deformations of the
lower half are marginal in comparison with deformations of the upper half, due to
dispersion of the applied load through the depth of the section (Figure 5-1b).
Figure 5-1: Model design
Figure 5-2a illustrates the finite element model. Four elements (SOLID 45) through the
thickness are applied to model the flange and the web (Figure 5-2c). This is generally the
recommended minimum number to correctly describe the shear stress due to Saint
Venant-torsion (la Poutré, D. B., 2005). For the parts of the flange near the bolt hole, a fine
mesh is used as large stress gradients are expected at this location. Parts further away
have a courser mesh. A detailed view of the mesh surrounding the bolt hole (SOLID 95) is
presented in Figure 5-2b.
b
h
cross-sectional symmetrie axis
F
modeled
part
modeled part
yx
FF
yz
a) b)
h
r
tw
top flange
bottom flange
web
fillet
tf
tf
tp
tf
tf

5 I C h a p t e r
FINITE ELEMENT MODELING
71 | P a g e
Figure 5-2: Finite element model
5.1.2 Material properties
Tensile tests on coupons, taken from the flanges and the web of the same HE200B section
as the specimens were made from, were performed to determine the actual material
properties of the test specimens (Table 4-4). As a substantial difference is shown between
the material properties of the flange and the web, it was decided to use the material
properties with the lowest strength, being those of the flanges, for the entire model. This
is a conservative assumption which is not likely to influence the results, as the
experiments showed that flange failure governed the strength with no yielding of the web.
Since the finite element program uses true stresses and true strains, and not engineering
stresses and strains as measured, a conversion has to be carried out according to
equations [5-1] and [5-2] (ANSYS Inc., 2007). The measured and true stress-strain
relationships of a representative tensile test on a coupon taken from the flange are
presented in Figure 5-3. Note that for small-strain response, true strain and engineering
strain are essentially identical.
�. H �*D1 Z �.F [5-1]
�. H lnD1 Z �*F [5-2]
Where:
�. = true stress [N/mm2]
�* = engineering stress [N/mm2]
�. = true strain [mm/mm]
�* = engineering strain [mm/mm]
a) c)
1
b)
y
xz
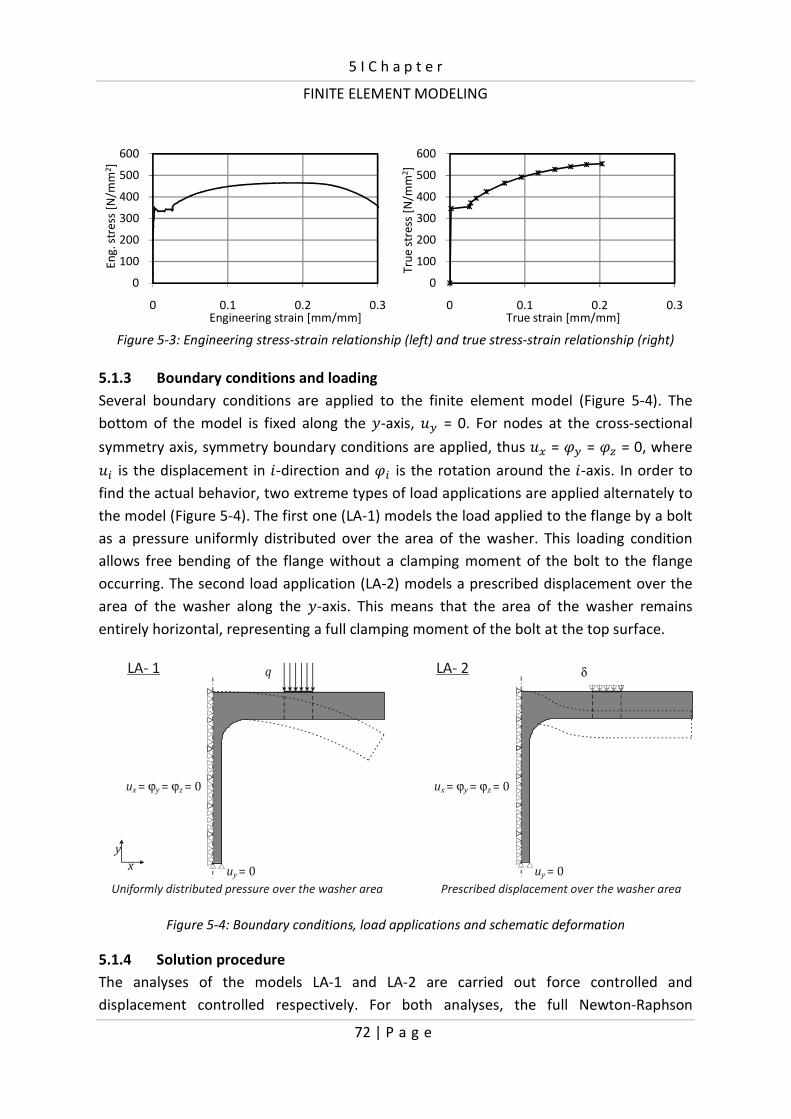
5 I C h a p t e r
FINITE ELEMENT MODELING
72 | P a g e
Figure 5-3: Engineering stress-strain relationship (left) and true stress-strain relationship (right)
5.1.3 Boundary conditions and loading
Several boundary conditions are applied to the finite element model (Figure 5-4). The
bottom of the model is fixed along the �-axis, �� = 0. For nodes at the cross-sectional
symmetry axis, symmetry boundary conditions are applied, thus �� = <� = < = 0, where �� is the displacement in �-direction and <� is the rotation around the �-axis. In order to
find the actual behavior, two extreme types of load applications are applied alternately to
the model (Figure 5-4). The first one (LA-1) models the load applied to the flange by a bolt
as a pressure uniformly distributed over the area of the washer. This loading condition
allows free bending of the flange without a clamping moment of the bolt to the flange
occurring. The second load application (LA-2) models a prescribed displacement over the
area of the washer along the �-axis. This means that the area of the washer remains
entirely horizontal, representing a full clamping moment of the bolt at the top surface.
Figure 5-4: Boundary conditions, load applications and schematic deformation
5.1.4 Solution procedure
The analyses of the models LA-1 and LA-2 are carried out force controlled and
displacement controlled respectively. For both analyses, the full Newton-Raphson
0
100
200
300
400
500
600
0 0.1 0.2 0.3
En
g. s
tre
ss [
N/m
m2]
Engineering strain [mm/mm]
0
100
200
300
400
500
600
0 0.1 0.2 0.3
Tru
e s
tre
ss [
N/m
m2]
True strain [mm/mm]
u x y z = = = 0ϕ ϕ
LA- 1
Uniformly distributed pressure over the areawasher
LA- 2
Prescribed displacement over the washer area
y
x
q
uy = 0
u x y z = = = 0ϕ ϕ
δ
uy = 0
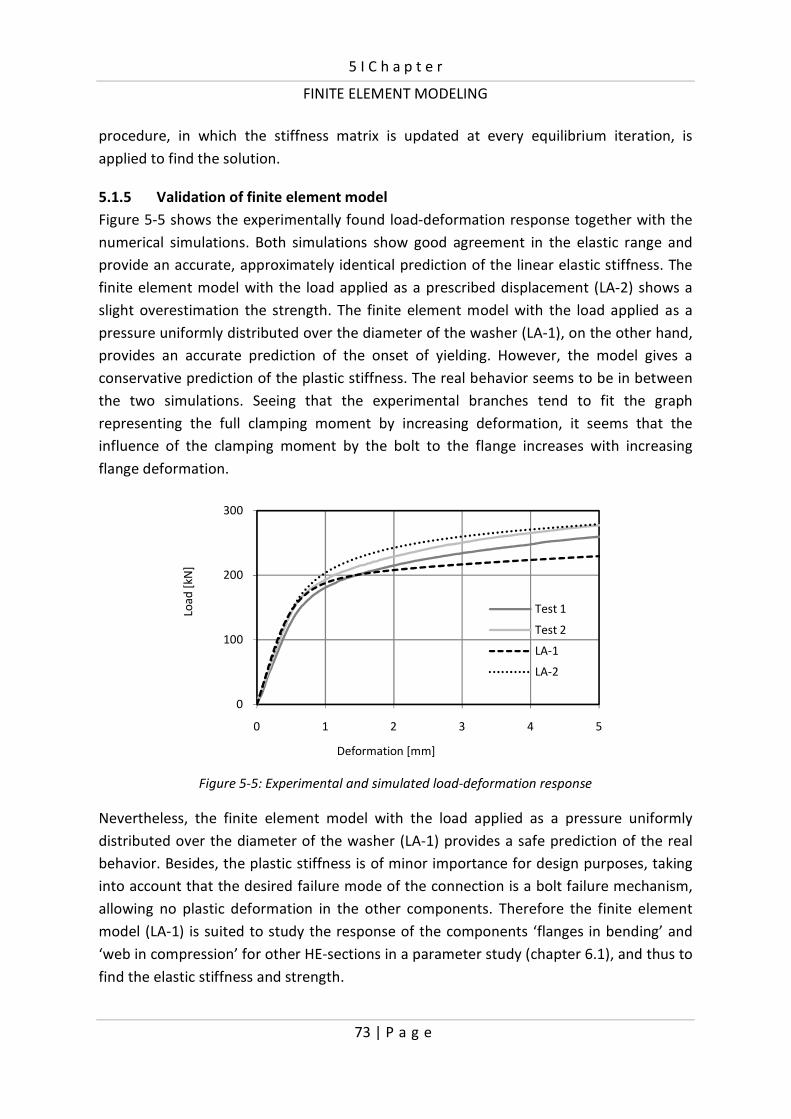
5 I C h a p t e r
FINITE ELEMENT MODELING
73 | P a g e
procedure, in which the stiffness matrix is updated at every equilibrium iteration, is
applied to find the solution.
5.1.5 Validation of finite element model
Figure 5-5 shows the experimentally found load-deformation response together with the
numerical simulations. Both simulations show good agreement in the elastic range and
provide an accurate, approximately identical prediction of the linear elastic stiffness. The
finite element model with the load applied as a prescribed displacement (LA-2) shows a
slight overestimation the strength. The finite element model with the load applied as a
pressure uniformly distributed over the diameter of the washer (LA-1), on the other hand,
provides an accurate prediction of the onset of yielding. However, the model gives a
conservative prediction of the plastic stiffness. The real behavior seems to be in between
the two simulations. Seeing that the experimental branches tend to fit the graph
representing the full clamping moment by increasing deformation, it seems that the
influence of the clamping moment by the bolt to the flange increases with increasing
flange deformation.
Figure 5-5: Experimental and simulated load-deformation response
Nevertheless, the finite element model with the load applied as a pressure uniformly
distributed over the diameter of the washer (LA-1) provides a safe prediction of the real
behavior. Besides, the plastic stiffness is of minor importance for design purposes, taking
into account that the desired failure mode of the connection is a bolt failure mechanism,
allowing no plastic deformation in the other components. Therefore the finite element
model (LA-1) is suited to study the response of the components ‘flanges in bending’ and
‘web in compression’ for other HE-sections in a parameter study (chapter 6.1), and thus to
find the elastic stiffness and strength.
0
100
200
300
0 1 2 3 4 5
Loa
d [
kN]
Deformation [mm]
Test 1
Test 2
LA-1
LA-2
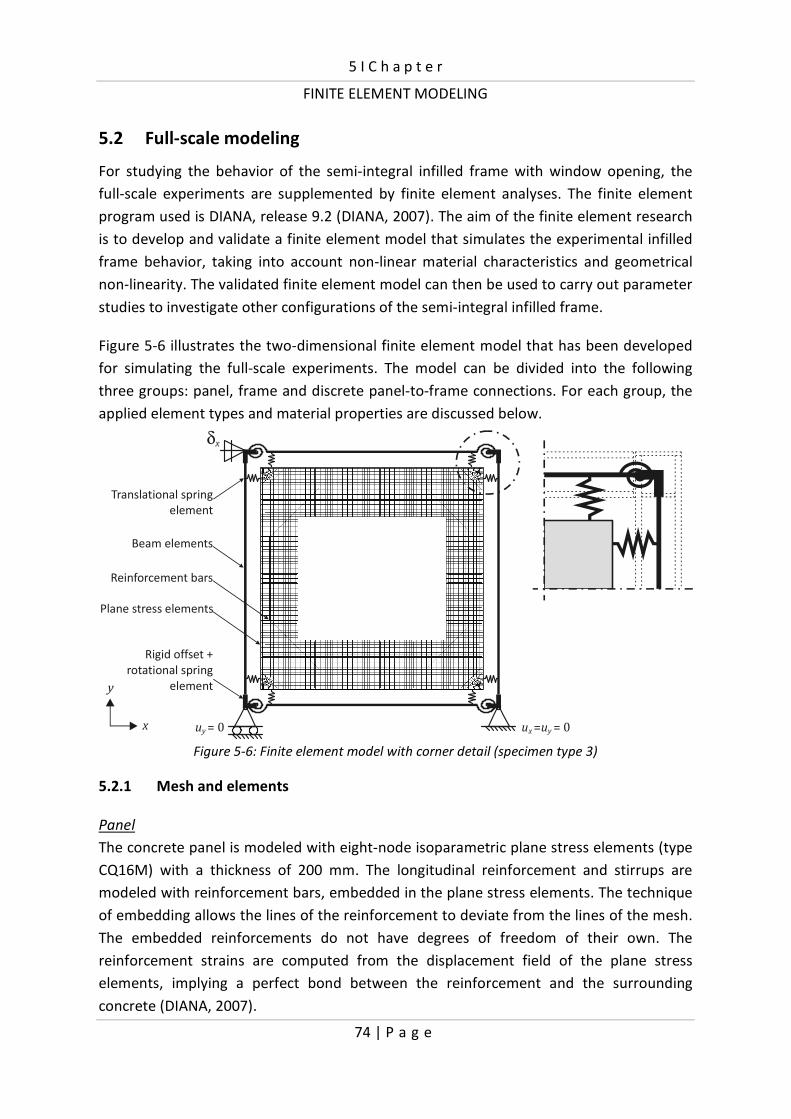
5 I C h a p t e r
FINITE ELEMENT MODELING
74 | P a g e
5.2 Full-scale modeling
For studying the behavior of the semi-integral infilled frame with window opening, the
full-scale experiments are supplemented by finite element analyses. The finite element
program used is DIANA, release 9.2 (DIANA, 2007). The aim of the finite element research
is to develop and validate a finite element model that simulates the experimental infilled
frame behavior, taking into account non-linear material characteristics and geometrical
non-linearity. The validated finite element model can then be used to carry out parameter
studies to investigate other configurations of the semi-integral infilled frame.
Figure 5-6 illustrates the two-dimensional finite element model that has been developed
for simulating the full-scale experiments. The model can be divided into the following
three groups: panel, frame and discrete panel-to-frame connections. For each group, the
applied element types and material properties are discussed below.
Figure 5-6: Finite element model with corner detail (specimen type 3)
5.2.1 Mesh and elements
Panel
The concrete panel is modeled with eight-node isoparametric plane stress elements (type
CQ16M) with a thickness of 200 mm. The longitudinal reinforcement and stirrups are
modeled with reinforcement bars, embedded in the plane stress elements. The technique
of embedding allows the lines of the reinforcement to deviate from the lines of the mesh.
The embedded reinforcements do not have degrees of freedom of their own. The
reinforcement strains are computed from the displacement field of the plane stress
elements, implying a perfect bond between the reinforcement and the surrounding
concrete (DIANA, 2007).
δx
Beam elements
Translational spring
element
Rigid offset +
rotational spring
element
Plane stress elements
y
x uy = 0 u ux y = = 0
Reinforcement bars

5 I C h a p t e r
FINITE ELEMENT MODELING
75 | P a g e
Frame
The three-node, two-dimensional class-III beam element (type CL9BE) is used to model the
frame members. This element is based on the Mindlin–Reissner theory which takes shear
deformation into account. This theory assumes that the cross-sections remain planar but
not necessary perpendicular to the deformed beam axis, contrary to the Bernoulli beam
theory which does not take shear deformation into account, assuming cross-sections to
remain planar as well as normal to the deformed beam-axis. The sectional properties of
the beam elements correspond to the sections used experimentally (HE180M). The beam-
to-column connection is modeled with a rigid offset to take the column and beam depth
into account, and a two-node rotational spring element (type SP2RO), representing the
stiffness of this connection.
Discrete panel-to-frame connection
The discrete panel-to-frame connections are represented by two-node translational spring
elements (type SP2TR), and are only able to support axial compressive forces. An initial
force in the springs is applied in order to represent the pretensioning resulting from the
torque controlled tightening of the bolts.
5.2.2 Material properties
Panel
Prior to cracking, concrete can be modeled sufficiently accurately as isotropic, linear
elastic (de Borst, R., 2002). The initial Young’s modulus (��) is determined by performing
standard material tests on concrete prisms. The Poisson’s ratio of concrete under uni-axial
compressive stress ranges from 0.15 to 0.22, with a representative value of 0.19 or 0.20
(ASCE Task Committee on Concrete and Masonry Structure, 1982). For this study, a
Poisson’s ratio is adopted of @� = 0.2. To find the actual tensile strength (���) and
compressive strength (��), standard material tests are performed with concrete 150 mm
cubes. A survey of the applied material properties is provided in Table 5-1.
In addition, a non-linear concrete material model is used that combines the Drucker-
Prager plasticity model for the compressive regime with a smeared cracking model for the
tensile regime. For the behaviour of the concrete in compression the Drucker-Prager yield
surface limits the elastic state of stress (Figure 5-7). The DIANA software evaluates the
yield surface using the current state of stress, the angle of internal friction (¡) and the
cohesion (¢). According to a recommendation by the DIANA software manual (DIANA,
2007), the angle of internal fiction of the concrete is approximated to be ¡ = 10°. The
cohesion (¢) can then be calculated as follows:
¢ H �� D1 R sin ¡F2 cos¡ [5-3]

5 I C h a p t e r
FINITE ELEMENT MODELING
76 | P a g e
Figure 5-7: Failure surface in two dimensional principal stress space
For the smeared crack approach, a multi-directional fixed crack model is applied, in which
typically the direction of the normal to the crack is fixed upon initiation of the crack. A
linear stress cut-off criterion is applied (Figure 5-7), which means that a crack arises if the
major principal tensile stress exceeds the minimum of ��� and ���D1 Z �,��*.�,/��F, with �,��*.�, being the lateral principal stress. Besides, a linear tension softening based on the
fracture energy of concrete ($#) is adopted according to the CEB-FIP Model Code (Comité
Euro-International du Béton, 1993) (Figure 5-8a). The area under the tension-softening
curve gives the fracture energy. The fracture energy of concrete is the energy required to
propagate a tensile crack of unit area, and is released in an element if the tensile strength
is exceeded. Subsequently, the deformations localize in the element. With this approach
the results obtained are objective with regard to mesh refinement.
The facture energy is related to the compressive strength and the maximum aggregate
size, and has been estimated from equation [5-4] (Comité Euro-International du Béton,
1993).
$# H $#kD��?/��?kFk.¦ [5-4]
With:
��? H ��> Z � [5-5]
Where:
$#k = Base value of fracture energy depending on the maximum aggregate size
�?��. For this study, �?�� = 16 mm, resulting in $#k = 0.030 Nmm/mm2
��? = Mean value of compressive strength [N/mm2]
��?k = 10 N/mm2
��> = Characteristic compressive strength
Δ� = 8 N/mm2
σ1
σ2
fc
fct
fc
fct
linear stress cut-off
Drucker-Prager yield surface

5 I C h a p t e r
FINITE ELEMENT MODELING
77 | P a g e
Subsequently, the found fracture energy has been adapted proportionally to the ratio
between the nominal strength according to Eurocode 2 and the measured tensile strength
(for $#, see Table 5-1).
Due to cracking of concrete, the shear stiffness is reduced, generally known as shear
retention. A constant shear retention factor 7 = 0.2 is used which is a commonly adopted
value (de Borst, R., 2002). When the cracked concrete is unloaded in tension, the secant
modulus is used to evaluated the stiffness (Figure 5-8a). For unloading of concrete in
compression, the elastic stiffness is adopted for stiffness calculations (Figure 5-8b).
a) b)
Figure 5-8: Material modeling of concrete in tension (a) and compression (b)
Table 5-1: Material properties concrete
Panel type
�� [N/mm2]
Measured w� [N/mm2]
w�� [N/mm2]
Calculated §w[Nmm/mm2]
1 3.54E+04 62.2 3.9 0.097
2 3.67E+04 64.4 3.9 0.099
3 3.66E+04 70.6 4.2 0.104
4 3.70E+04 75.6 4.4 0.109
5 3.72E+04 66.0 3.9 0.097
For the embedded reinforcement bars, a Young’s modulus of �� = 2.0E+05 N/mm2 is
taken. The stress-strain curve of the reinforcement bars is assumed to be elastic-perfectly
plastic, with yielding according to the Von Mises criterion, with a yield stress equal to �� =
560 N/mm2.
Frame
For the frame, steel having the elastic material properties for the Young’s modulus �� =
2.1E+05 N/mm2 and the Poisson’s ratio @� = 0.3 is used, in combination with Von Mises
plasticity (�� = 235 N/mm2). The rotational springs representing the beam-to-column
connections are calibrated on the load-deflection curves of the full-scale tests with the
bare frames by means of simulating these tests by varying rotational spring characteristics.
The moment-rotation curve for the rotational springs for specimen type 3 is shown in
Figure 5-9. The curves used for all other simulations are provided in Appendix C.1.
ε
σ
fct
unload/reload response
ε
σ
fc
unload/reload response
Gf

5 I C h a p t e r
FINITE ELEMENT MODELING
78 | P a g e
Figure 5-9: Moment-rotation response for
rotational springs for specimen type 3
Figure 5-10: Load-deformation response for
translational springs for all specimen types
Discrete panel-to-frame connection
The discrete panel-to-frame connections are modeled with non-linear translational spring
elements, with no tension capacity. Input is the stiffness diagram presented in Figure 5-10.
The initial connection stiffness (��;���) is composed of the structural characteristics
obtained from the component experiment ‘bolt with cap on plate in compression’ (Figure
5-11) in combination with results from a finite element simulation using the FE-model
presented in section 5.1 for the HE180M section experimentally used (Figure 5-12).
Figure 5-11: Load-deformation response of
compression tests on bolt with cap on plate ,
with bilinear approximation
Figure 5-12: Load-deformation response for
HE180M section subject to transverse load
introduced indirectly through the flanges
Combining the found linear elastic stiffnesses gives the initial connection stiffness (��;���) of the discrete panel-to-frame connection as follows :
��;��� H ¨ 1��©ª« Z12��¬ªN
i� [5-6]
The factor 2 in the equation accounts for two bolts found in one panel-to-frame
connection.
0
20
40
60
80
100
0 0.005 0.01 0.015 0.02 0.025
Mo
me
nt
[kN
m]
Rotation [rad]
0
100
200
300
400
500
600
700
0 0.5 1 1.5 2 2.5 3
Axi
al c
om
pre
ssio
n [
kN]
Deformation [mm]
kc;ini
pretensioning level = 100 kN
0
100
200
300
400
500
0 0.5 1 1.5 2
Loa
d [
kN]
Deformation [mm]
kc3 + kc4
0
200
400
600
800
1000
0 1 2 3 4 5
Loa
d [
kN]
Deformation [mm]
HE180M
kc1+2

5 I C h a p t e r
FINITE ELEMENT MODELING
79 | P a g e
Subsequently, the non-linear branch of the compression test on the bolts applied for the
discrete panel-to-frame connection (Figure 4-2: M24-RC1.B) is superposed on this initial
connection stiffness (��;���). Combined, this gives the load-deformation response
presented in Figure 5-10, to be used for each translation spring for all specimen types.
5.2.3 Boundary conditions and loading
Support conditions matching the test-setup are used (Figure 5-6). The loads applied to the
finite element model include initial prestressing of the translational springs, representing
the tightening of the panel-to-frame connection (load case 1), the dead weight (load case
2), and horizontal loading at the left upper corner up to failure (load case 3). In the finite
element analyses, the prestressing load from the bolts (100 kN) is simulated with initial
stresses and applied to the infilled frame first. After the structure has become in an
equilibrium condition, the dead weight is applied to the infilled frame. This order of
loading is correct, since the bare frame was fixed to the horizontally positioned panel.
Therefore, the dead weight initially did not influence the prestressing forces in the bolts.
Finally, the lateral load is applied to the left upper corner of the infilled frame.
5.2.4 Solution procedure
A displacement controlled procedure is applied to impose the load up to failure, using the
regular Newton-Raphson iteration procedure to find the solution. A phased analysis that
comprises two calculation phases is conducted, to enable determining the effect of the
prestressing and erecting of the specimen. Between the two phases, the finite element
model changes by addition of a constraint in the left upper corner, which is needed to
apply the prescribed lateral displacement to the model. The results from the first phase
are automatically used as initial values in the second phase.
5.2.5 Validation of finite element model
Validation of the finite element model is accomplished by comparing the following
experimental and numerical results: the global load-deflection behavior, the ultimate load
with corresponding failure mode, the local panel and connection deformations and the
final crack patterns. The results for specimen type 3 have been selected for a more
detailed discussion. Results for the other specimen types can be found in Appendix C.2.
To explicitly treat the structural behavior of the infilled frame at the different stages of
loading, the deformed shapes of specimen 3 are shown (Figure 5-13), presenting the
deformation after the prestress load from the bolts and the dead weight only are applied
to the model (δ = 0) (left) and at ultimate deflection δ = δ� (right). As a result of the
tightening of the bolts, the infill panel is slightly uniformly-prestressed in the steel frame.
The magnitude of the prestress loads is initially equal in all springs. After the dead load is
applied to the model, the beam springs at the bottom of the model (T2-B and C2-B) are

5 I C h a p t e r
FINITE ELEMENT MODELING
80 | P a g e
further loaded while the upper beam springs (T1-B and C1-B) are slightly unloaded.
Thereafter, the horizontal load is applied to the model resulting in gradually unloading of
the springs in the unloaded corners of the infilled frame (T1-B, T1-C, T2-B and T2-C).
Although the translational springs in the unloaded corners are still in contact with the
panel at ultimate deflection, they are unstressed since they are unable to support axial
tensile forces. This is correct, as loss of contact between infill panel and frame in the
tension corners was visually observed during the tests. Figure 5-14 gives the progress of
the load in the springs versus the time.
(deformations scaled 1000x) (deformations scaled 10x)
Figure 5-13: Deformed finite element model of specimen type 3
Figure 5-14: Axial load in translational springs versus time
From these figures it can be observed that under lateral load, the infill panel tends to act
as a diagonal strut bracing the steel frame. However, due to the presence of the opening
in the panel, direct support from the load to the support by a strut under compression is
impossible. Therefore the load is transferred around the opening to the support by
inclined normal forces, giving double curvature bending of the panel members, which is
confirmed by the deformed shape of the panel (Figure 5-13, right).
C1-B T1-B
T2-C
C1-C
T2-B C2-B
C2-C
T1-C
After prestressing and
dead load are applied
At ultimate deflection
0
100
200
300
400
500
600
700
0 20 40 60 80
Nx
[kN
]
Time [-]
Beam springs
C1-B
C2-B
T1-B
T2-B
0
100
200
300
400
500
600
700
0 20 40 60 80
Nx
[kN
]
Time [-]
Column springs
C1-C
C2-C
T1-C
T2-C

5 I C h a p t e r
FINITE ELEMENT MODELING
81 | P a g e
The simulated and experimental global responses (test numbers n-A) of all specimens are
presented with dashed and solid lines respectively in Figure 5-15. Comparison shows that
the load-deflection behavior obtained from the finite element analysis is quite similar to
the experimental results for each test. The initial higher stiffness is present, followed by
the approximately linear branch and finally failure. The simulated failure modes of
specimens 1 to 4 are connection failure, which are identical to the experimental failure.
However, contrary to the experimentally found locations of failure (for locations, see
Table 4-10), the specific failure locations for all simulations are identical, being the vertical
translational spring in the right lower corner (Figure 5-13: C2-B). Theoretically this is
correct, since this translational spring is, besides the lateral load, also loaded with a major
part of the dead weight of the infill panel. However, there is only a slight difference with
the magnitude of the axial forces in the other loaded springs at ultimate load (± 2.5%, see
Figure 5-14), and other phenomena such as the exact magnitude of the prestress load and
the level of friction in the connections may also contribute to the experimental location of
failure. Therefore, the experimentally found failure locations in some tests can differ from
the simulated ones.
Figure 5-15: Experimental and simulated load-deflection response of infilled frame
For tests 5A and 5B, the infill panel failed first in the experiments, with considerable
deformations concentrated in open cracks and yielding of the wedge reinforcement.
Although the finite element simulation indicates panel failure with yielding of the wedge
reinforcement (Figure 5-17), the smeared crack model is not appropriate to adequately
describe the post-peak behavior. To obtain a more accurate post-peak prediction, the
0
100
200
300
400
500
600
700
800
0 10 20 30 40 50 60
Late
ral l
oa
d [
kN]
Lateral deflection [mm]
5-A1-A
3-A2-A
4-A
Bare frame
Experiment
FEM
VIVI II
III

5 I C h a p t e r
FINITE ELEMENT MODELING
82 | P a g e
concrete model could be supplied with discrete cracks. In this combined approach, the
smeared crack model is used to model the distributed cracking and concrete crushing,
while interface elements are inserted between the continuum elements along the
potential crack path, where major cracking can be expected based on the experimental
observations. However, panel failure will be prevented in the design, since the panel-to-
frame connection will be designed to govern the strength of the structure. Therefore, the
smeared crack approach is satisfactory for design purposes as meant in this thesis.
Besides the global behavior, also the accuracy of the simulated local behavior of the infill
panel is investigated. Six LVDTs (Figure 4-14: δ� to δ#) were positioned on the concrete
panel surface, measuring local deformations over a distance of 300 mm in order to
determine average strains and crack initiation in the tension zones of the panel. For each
LVDT measurement, a comparison is made between the experiment and the simulation. In
Figure 5-16 the measured and simulated average strains for test 3 are presented (LDVTs δ�, δ= and δ*). It is shown that the finite element model qualitatively represents the
strains on the surface of the concrete panel reasonably accurate. The discrepancies
between the experimental and simulated strains, in particular present in the early stage of
loading, can be explained by the fact that the FE-model is based on the principle of
smeared cracks while the measurement, in contrary, incorporates discrete cracking. As a
result, the differences fade out during loading, increasing the discrete crack intensity, as
shown by the figure. Also for the other simulations (Appendix C.2.1), sufficient agreement
is shown between the measured and simulated local panel deformations. Therefore, also
by this check, the finite element model may be considered to be validated.
Figure 5-16: Measured and simulated strains for specimen type 3
To provide a better understanding of the stress distribution in the infill panel, the
deformed shape of the panel of specimen 3, together with a contour plot of the major
0
100
200
300
400
500
600
700
800
0 0.0005 0.001 0.0015 0.002 0.0025 0.003
Late
ral l
oa
d [
kN]
Average strain [mm/mm]
δc Test δc FEM
δd Test δd FEM
δe Test δe FEM

5 I C h a p t e r
FINITE ELEMENT MODELING
83 | P a g e
principal stresses at ultimate load is shown in Figure 5-18. The figure shows that the two
window corners loaded in compression are subjected to large compressive stresses.
Concrete crushing is indicated in the elements surrounding these window corners when
considering the Von Mises plastic strains. This phenomenon is shown in all simulated
tests. Confirmed by the fact that in none of the simulations the crushed area expands to
other elements than the ones directly surrounding the window corner, the high plastic
strains may be attributed to the geometrical discontinuity (right angle) that is present at
the window corners.
Figure 5-17: Yielding wedge
reinforcement (specimen type 5)
Figure 5-18: Deformed panel with minor (compressive)
principal stresses in N/mm2 (specimen type 3)
Figure 5-19 shows for specimen type 3 the smeared crack pattern of the concrete panel at
ultimate load, together with the experimentally found crack pattern (see Appendix C.2.2
for the crack patterns of the other specimen types). Considering the experimental crack
patterns it can be noticed that the patterns are qualitatively identical while the crack
intensity increases when the window opening becomes larger. Comparing the
experimental crack patterns with the simulated ones, good qualitative agreement
between the numerical crack patterns and the experimental crack patterns is observed.
Figure 5-19: Experimental (left) and simulated (right) crack patterns (specimen type 3)
Yielding
Yielding

5 I C h a p t e r
FINITE ELEMENT MODELING
84 | P a g e
The comparisons presented above between experimental results and numerical
predictions of the semi-integral infilled frame indicate that the finite element model used
in this study is adequate, and that the corresponding results are reliable. The finite
element investigation will, therefore, be further extended to investigate other
configurations of semi-integral infilled frames in a parametric study that serves as
verification for the development of design models.
5.3 Chapter conclusions
A finite element model has been developed for studying the combined components
‘flanges in bending’ and ‘web in compression’. Two types of load applications were applied
alternately to the finite element model. The model with the load applied to the flange by a
bolt as pressure uniformly distributed over the area of the washer (LA1) is able to predict
the linear elastic stiffness and the onset of yielding. The model provides a conservative
prediction of the plastic behavior. Because the plastic stiffness is of minor importance for
design purposes of this structure, the model is appropriate to carry out parameter studies
in order to find the response of other HE-sections subject to transverse compression
introduced through the flanges (chapter 6.1).
Finite element models have been developed, simulating the response of the tested semi-
integral infilled frames with window openings. The simulations were performed taking
into account non-linear material properties based on tests and geometrical non-linearity.
The models have been validated with the full-scale test results. A comparison between the
full-scale experiments and simulations shows that the finite element models are able to
predict the lateral load versus deflection relationship of the semi-integral infilled frame,
and the ultimate lateral load for all failure mechanisms. Therefore, it is concluded that the
finite element model is well suited for studying the infilled frame performance by varying
different parameters (chapter 6.2).
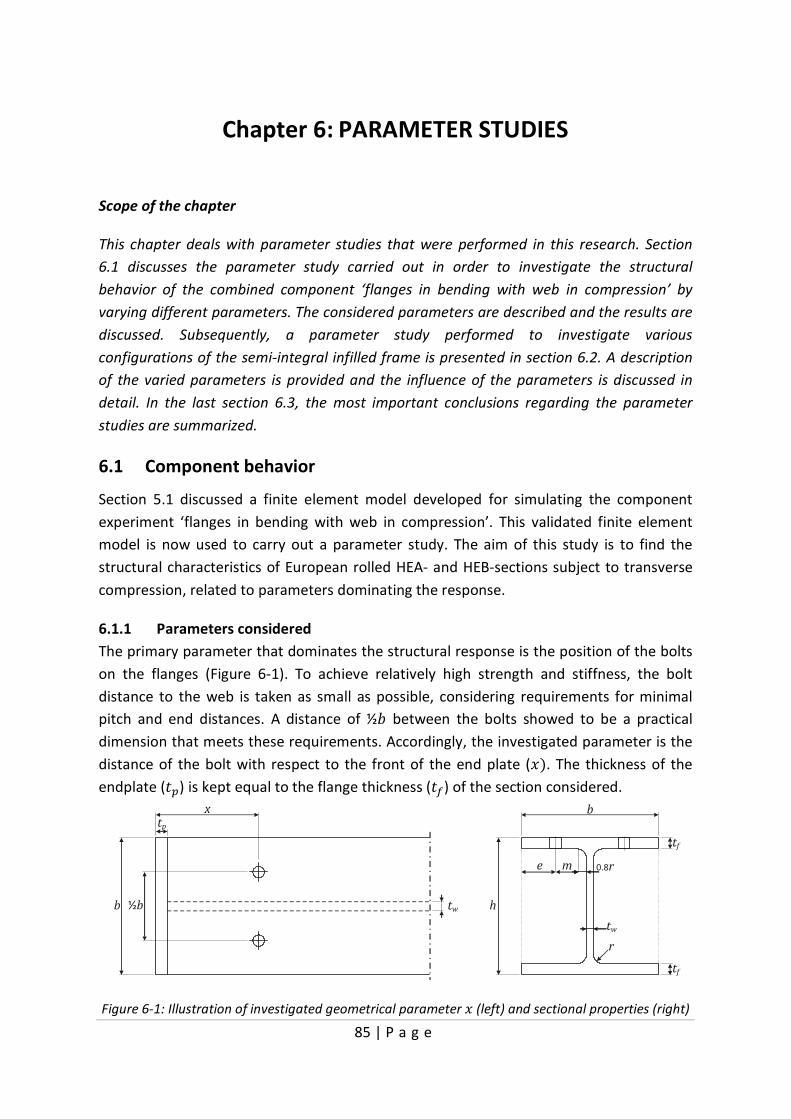
85 | P a g e
Chapter 6: PARAMETER STUDIES
Scope of the chapter
This chapter deals with parameter studies that were performed in this research. Section
6.1 discusses the parameter study carried out in order to investigate the structural
behavior of the combined component ‘flanges in bending with web in compression’ by
varying different parameters. The considered parameters are described and the results are
discussed. Subsequently, a parameter study performed to investigate various
configurations of the semi-integral infilled frame is presented in section 6.2. A description
of the varied parameters is provided and the influence of the parameters is discussed in
detail. In the last section 6.3, the most important conclusions regarding the parameter
studies are summarized.
6.1 Component behavior
Section 5.1 discussed a finite element model developed for simulating the component
experiment ‘flanges in bending with web in compression’. This validated finite element
model is now used to carry out a parameter study. The aim of this study is to find the
structural characteristics of European rolled HEA- and HEB-sections subject to transverse
compression, related to parameters dominating the response.
6.1.1 Parameters considered
The primary parameter that dominates the structural response is the position of the bolts
on the flanges (Figure 6-1). To achieve relatively high strength and stiffness, the bolt
distance to the web is taken as small as possible, considering requirements for minimal
pitch and end distances. A distance of ½� between the bolts showed to be a practical
dimension that meets these requirements. Accordingly, the investigated parameter is the
distance of the bolt with respect to the front of the end plate (6F. The thickness of the
endplate (4!) is kept equal to the flange thickness (4#) of the section considered.
Figure 6-1: Illustration of investigated geometrical parameter 6 (left) and sectional properties (right)
b
x
b½
tp
b
h
tf
tf
tw
e m 0.8r
r
tw
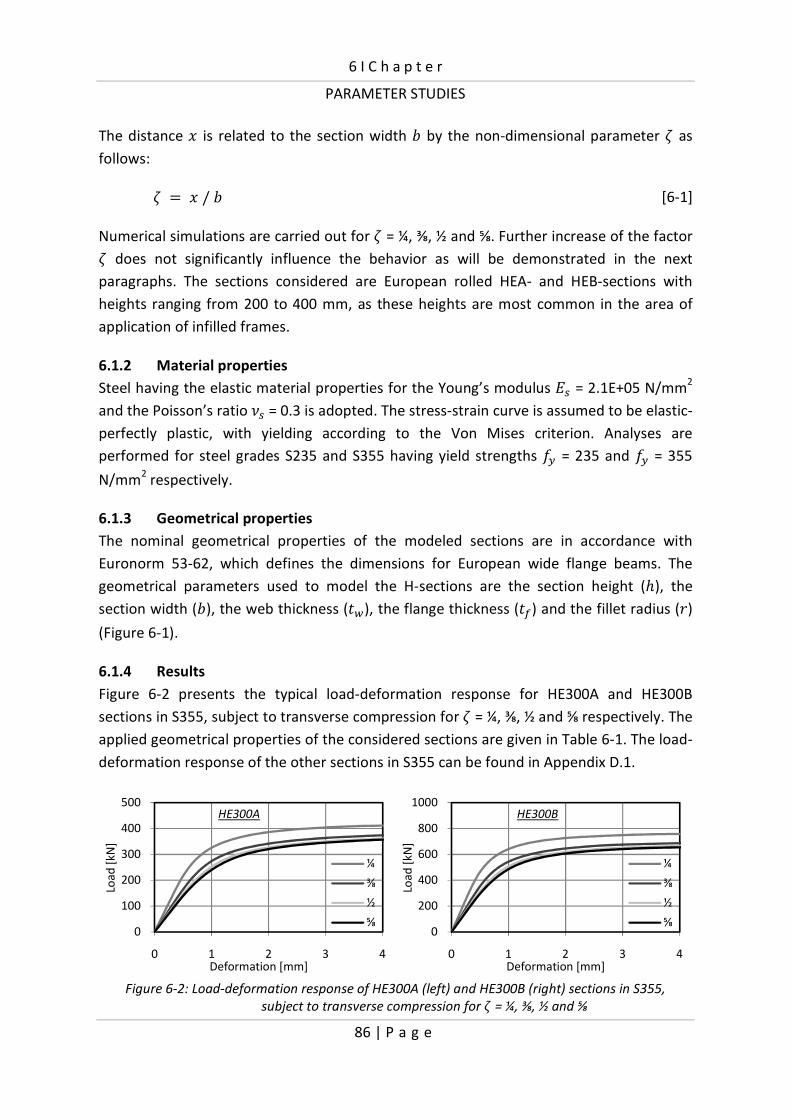
6 I C h a p t e r
PARAMETER STUDIES
86 | P a g e
The distance 6 is related to the section width � by the non-dimensional parameter ® as
follows:
® H 6 / � [6-1]
Numerical simulations are carried out for ® = ¼, ⅜, ½ and ⅝. Further increase of the factor ® does not significantly influence the behavior as will be demonstrated in the next
paragraphs. The sections considered are European rolled HEA- and HEB-sections with
heights ranging from 200 to 400 mm, as these heights are most common in the area of
application of infilled frames.
6.1.2 Material properties
Steel having the elastic material properties for the Young’s modulus �� = 2.1E+05 N/mm2
and the Poisson’s ratio @� = 0.3 is adopted. The stress-strain curve is assumed to be elastic-
perfectly plastic, with yielding according to the Von Mises criterion. Analyses are
performed for steel grades S235 and S355 having yield strengths �� = 235 and �� = 355
N/mm2 respectively.
6.1.3 Geometrical properties
The nominal geometrical properties of the modeled sections are in accordance with
Euronorm 53-62, which defines the dimensions for European wide flange beams. The
geometrical parameters used to model the H-sections are the section height ('), the
section width (�), the web thickness (45), the flange thickness (4#) and the fillet radius (2)
(Figure 6-1).
6.1.4 Results
Figure 6-2 presents the typical load-deformation response for HE300A and HE300B
sections in S355, subject to transverse compression for ® = ¼, ⅜, ½ and ⅝ respectively. The
applied geometrical properties of the considered sections are given in Table 6-1. The load-
deformation response of the other sections in S355 can be found in Appendix D.1.
Figure 6-2: Load-deformation response of HE300A (left) and HE300B (right) sections in S355,
subject to transverse compression for ® = ¼, ⅜, ½ and ⅝
0
100
200
300
400
500
0 1 2 3 4
Loa
d [
kN]
Deformation [mm]
HE300A
¼
⅜
½
⅝0
200
400
600
800
1000
0 1 2 3 4
Loa
d [
kN]
Deformation [mm]
HE300B
¼
⅜
½
⅝

6 I C h a p t e r
PARAMETER STUDIES
87 | P a g e
Table 6-1: Nominal values of geometrical properties of European rolled H300A and H300B sections
HE300A HE300B ¯ [mm] 290 300 y [mm] 300 300 �° [mm] 8.5 11 �w [mm] 14 19 ± [mm] 27 27
It is shown that the load-deformation characteristics for both sections are qualitatively
identical. Nevertheless, the stiffness and strength of the HE300B section are
approximately twice as large as those of the HE300A section, which is to be attributed
principally to the differences between the flange and web thicknesses. Furthermore, it can
be seen that for both sections the variation between the response for ® = ½ and ⅝ is very
small. This means that for a distance from the bolt to the end plate 6 > ⅝�, the
contribution of the end plate can be considered negligible.
Based on the obtained load-deformation curves, the structural characteristics are derived.
For this purpose, several methods are available. An overview of approaches given in
literature can be found in a publication of Steenhuis et al. (Steenhuis, C. M. et al., 2002),
which deals with the derivation of the strength, stiffness and rotation capacity of steel and
composite joints. In this publication, five different approaches are discussed. In all
approaches, the elastic stiffness is simply taken as the initial stiffness. Yet, for
determination of the strength, different approaches are applied. In two of the approaches,
the strength is determined by drawing a line through the part of the test curve with the
post limit stiffness. Subsequently, the strength is taken at the intersection with the vertical
axis or with the line of the initial stiffness respectively. In a different approach, the
strength is chosen as 0.9 times the ultimate strength. Finally, two approaches are
discussed which are based on a secant stiffness, taken as one third of the initial stiffness.
Accordingly, the intersection of the secant stiffness with the test curve defines the
strength.
However, the approaches discussed above are not suited for this study. Drawing a line
through the post-limit stiffness of the curve seems to result in a rather arbitrarily strength
(Figure 6-3: ��), as there is no obvious linear post limit stiffness. Furthermore, an
ultimate strength is not found in the simulated curves. Finally, taking the secant stiffness
as one third of the initial stiffness, and then taking the intersection with the test curve
gives extensive plastic deformation (Figure 6-3: ��). This latter approach will not be
selected as the design of the semi-integral infilled frame is based on bolt failure and no
plastic deformation of other components, as defined in section 3.2.2.
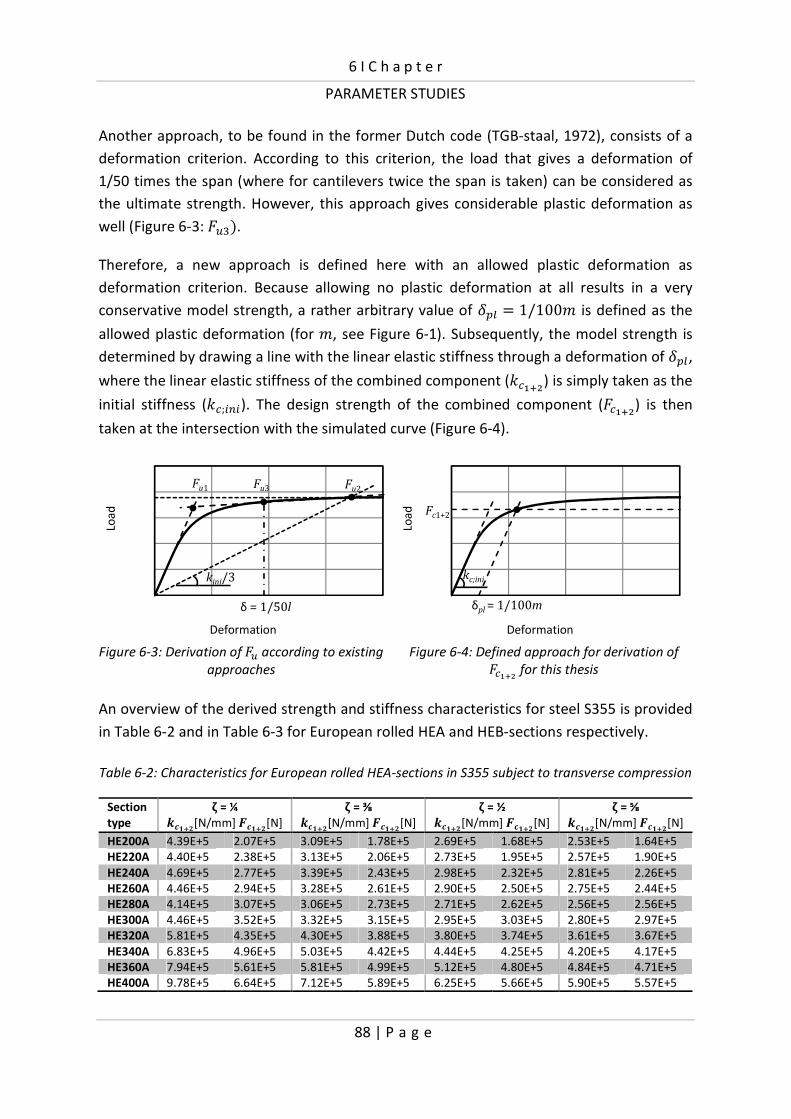
6 I C h a p t e r
PARAMETER STUDIES
88 | P a g e
Another approach, to be found in the former Dutch code (TGB-staal, 1972), consists of a
deformation criterion. According to this criterion, the load that gives a deformation of
1/50 times the span (where for cantilevers twice the span is taken) can be considered as
the ultimate strength. However, this approach gives considerable plastic deformation as
well (Figure 6-3: �F. Therefore, a new approach is defined here with an allowed plastic deformation as
deformation criterion. Because allowing no plastic deformation at all results in a very
conservative model strength, a rather arbitrary value of 9!, H 1/100� is defined as the
allowed plastic deformation (for �, see Figure 6-1). Subsequently, the model strength is
determined by drawing a line with the linear elastic stiffness through a deformation of 9!,, where the linear elastic stiffness of the combined component (��©ª«) is simply taken as the
initial stiffness (��;���). The design strength of the combined component ( �©ª«) is then
taken at the intersection with the simulated curve (Figure 6-4).
Figure 6-3: Derivation of � according to existing
approaches
Figure 6-4: Defined approach for derivation of �©ª« for this thesis
An overview of the derived strength and stiffness characteristics for steel S355 is provided
in Table 6-2 and in Table 6-3 for European rolled HEA and HEB-sections respectively.
Table 6-2: Characteristics for European rolled HEA-sections in S355 subject to transverse compression
Section
type
² = ¼ ���ª�[N/mm] {��ª�[N]
² = ⅜ ���ª�[N/mm] {��ª�[N]
² = ½ ���ª�[N/mm] {��ª�[N]
² = ⅝ ���ª�[N/mm] {��ª�[N]
HE200A 4.39E+5 2.07E+5 3.09E+5 1.78E+5 2.69E+5 1.68E+5 2.53E+5 1.64E+5
HE220A 4.40E+5 2.38E+5 3.13E+5 2.06E+5 2.73E+5 1.95E+5 2.57E+5 1.90E+5
HE240A 4.69E+5 2.77E+5 3.39E+5 2.43E+5 2.98E+5 2.32E+5 2.81E+5 2.26E+5
HE260A 4.46E+5 2.94E+5 3.28E+5 2.61E+5 2.90E+5 2.50E+5 2.75E+5 2.44E+5
HE280A 4.14E+5 3.07E+5 3.06E+5 2.73E+5 2.71E+5 2.62E+5 2.56E+5 2.56E+5
HE300A 4.46E+5 3.52E+5 3.32E+5 3.15E+5 2.95E+5 3.03E+5 2.80E+5 2.97E+5
HE320A 5.81E+5 4.35E+5 4.30E+5 3.88E+5 3.80E+5 3.74E+5 3.61E+5 3.67E+5
HE340A 6.83E+5 4.96E+5 5.03E+5 4.42E+5 4.44E+5 4.25E+5 4.20E+5 4.17E+5
HE360A 7.94E+5 5.61E+5 5.81E+5 4.99E+5 5.12E+5 4.80E+5 4.84E+5 4.71E+5
HE400A 9.78E+5 6.64E+5 7.12E+5 5.89E+5 6.25E+5 5.66E+5 5.90E+5 5.57E+5
Loa
d
Deformation
kini/3
δ = 1/50l
Fu1 Fu3 Fu2
Loa
d
Deformation
kc;ini
δpl = 1/100m
Fc1+2

6 I C h a p t e r
PARAMETER STUDIES
89 | P a g e
Table 6-3: Characteristics for European rolled HEB-sections in S355 subject to transverse compression
Section
type
² = ¼ ���ª�[N/mm] {��ª�[N]
² = ⅜ ���ª�[N/mm] {��ª�[N]
² = ½ ���ª�[N/mm] {��ª�[N]
² = ⅝ ���ª�[N/mm] {��ª�[N]
HE200B 12.63E+5 4.79E+5 8.58E+5 4.04E+5 7.36E+5 3.81E+5 6.89E+5 3.72E+5
HE220B 11.84E+5 5.18E+5 8.16E+5 4.43E+5 7.03E+5 4.19E+5 6.59E+5 4.10E+5
HE240B 12.15E+5 5.81E+5 8.38E+5 4.99E+5 7.21E+5 4.72E+5 6.75E+5 4.61E+5
HE260B 11.19E+5 6.00E+5 7.86E+5 5.21E+5 6.81E+5 4.96E+5 6.40E+5 4.86E+5
HE280B 10.19E+5 6.19E+5 7.22E+5 5.40E+5 6.27E+5 5.14E+5 5.89E+5 5.03E+5
HE300B 10.01E+5 6.63E+5 7.29E+5 5.89E+5 6.42E+5 5.67E+5 6.08E+5 5.57E+5
HE320B 12.06E+5 7.71E+5 8.72E+5 6.85E+5 7.65E+5 6.59E+5 7.23E+5 6.48E+5
HE340B 13.53E+5 8.45E+5 9.74E+5 7.51E+5 8.52E+5 7.22E+5 8.04E+5 7.11E+5
HE360B 15.08E+5 9.20E+5 10.81E+5 8.19E+5 9.43E+5 7.88E+5 8.88E+5 7.77E+5
HE400B 17.55E+5 10.27E+5 12.54E+5 9.24E+5 10.88E+5 8.90E+5 10.23E+5 8.78E+5
Figure 6-5 presents the load-deformation response for HE300A and 300B sections in S235
and S355 respectively, for ζ = ½. It is shown that the initial stiffness is identical for both
steel grades. Nevertheless, the strength of the sections in S355 is considerably larger.
Figure 6-5: Load-deformation response of HE300A and HE300B sections in S235 and S355 (® = ½)
Table 6-4 gives the strength of HE300A and HE300B sections in S235 and S355 respectively
and the ratio between them. To guarantee this factor to be valid for all other sections as
well, two more analyses were performed for the most extreme sections considered in
S235, which are HE200A and HE400B (ζ = ½) (the graphs can be found in Appendix D.1).
Table 6-4: Model strength of HEA and HEB sections in S235 and S355 respectively
HEA S235 S355 Ratio HEB S235 S355 Ratio
200; ² = ½ 118 168 0.70 300; ² = ¼ 460 663 0.69
300; ² = ¼ 245 352 0.70 300; ² = ⅜ 410 589 0.70
300; ² = ⅜ 220 315 0.70 300; ² = ½ 394 567 0.69
300; ² = ½ 212 303 0.70 300; ² = ⅝ 389 557 0.70
300; ² = ⅝ 209 297 0.70 400; ² = ½ 617 890 0.69
It is shown that there exists a constant ratio of 0.7 between the strengths of the
considered sections in S235 and S355. Accordingly, the design strength of the other
sections in S235 can be found by multiplying the strength of the section in S355 with a
0
100
200
300
400
500
0 1 2 3 4
Loa
d [
kN]
Deformation [mm]
HE300A
S235
S3550
200
400
600
800
0 1 2 3 4
Loa
d [
kN]
Deformation [mm]
HE300B
S235
S355

6 I C h a p t e r
PARAMETER STUDIES
90 | P a g e
factor equal to 0.7. An overview of the derived characteristics (��©ª« and �©ª«) for steel in
S235 is provided in Table 6-5 and Table 6-6.
Table 6-5: Characteristics for European rolled HEA-sections in S235 subject to transverse compression
Section
type
² = ¼ ���ª�[N/mm] {��ª�[N]
² = ⅜ ���ª�[N/mm] {��ª�[N]
² = ½ ���ª�[N/mm] {��ª�[N]
² = ⅝ ���ª�[N/mm] {��ª�[N]
HE200A 4.39E+5 1.45E+05 3.09E+5 1.25E+05 2.69E+5 1.18E+05 2.53E+5 1.15E+05
HE220A 4.40E+5 1.67E+05 3.13E+5 1.44E+05 2.73E+5 1.37E+05 2.57E+5 1.33E+05
HE240A 4.69E+5 1.94E+05 3.39E+5 1.70E+05 2.98E+5 1.62E+05 2.81E+5 1.58E+05
HE260A 4.46E+5 2.06E+05 3.28E+5 1.83E+05 2.90E+5 1.75E+05 2.75E+5 1.71E+05
HE280A 4.14E+5 2.15E+05 3.06E+5 1.91E+05 2.71E+5 1.83E+05 2.56E+5 1.79E+05
HE300A 4.46E+5 2.46E+05 3.32E+5 2.21E+05 2.95E+5 2.12E+05 2.80E+5 2.08E+05
HE320A 5.81E+5 3.05E+05 4.30E+5 2.72E+05 3.80E+5 2.62E+05 3.61E+5 2.57E+05
HE340A 6.83E+5 3.47E+05 5.03E+5 3.09E+05 4.44E+5 2.98E+05 4.20E+5 2.92E+05
HE360A 7.94E+5 3.93E+05 5.81E+5 3.49E+05 5.12E+5 3.36E+05 4.84E+5 3.30E+05
HE400A 9.78E+5 4.65E+05 7.12E+5 4.12E+05 6.25E+5 3.96E+05 5.90E+5 3.90E+05
Table 6-6: Characteristics for European rolled HEB-sections in S235 subject to transverse compression
Section
type
² = ¼ ���ª�[N/mm] {��ª�[N]
² = ⅜ ���ª�[N/mm] {��ª�[N]
² = ½ ���ª�[N/mm] {��ª�[N]
² = ⅝ ���ª�[N/mm] {��ª�[N]
HE200B 12.63E+5 3.35E+05 8.58E+5 2.83E+05 7.36E+5 2.67E+05 6.89E+5 2.60E+05
HE220B 11.84E+5 3.63E+05 8.16E+5 3.10E+05 7.03E+5 2.93E+05 6.59E+5 2.87E+05
HE240B 12.15E+5 4.07E+05 8.38E+5 3.49E+05 7.21E+5 3.30E+05 6.75E+5 3.23E+05
HE260B 11.19E+5 4.20E+05 7.86E+5 3.65E+05 6.81E+5 3.47E+05 6.40E+5 3.40E+05
HE280B 10.19E+5 4.33E+05 7.22E+5 3.78E+05 6.27E+5 3.60E+05 5.89E+5 3.52E+05
HE300B 10.01E+5 4.64E+05 7.29E+5 4.12E+05 6.42E+5 3.97E+05 6.08E+5 3.90E+05
HE320B 12.06E+5 5.40E+05 8.72E+5 4.80E+05 7.65E+5 4.61E+05 7.23E+5 4.54E+05
HE340B 13.53E+5 5.92E+05 9.74E+5 5.26E+05 8.52E+5 5.05E+05 8.04E+5 4.98E+05
HE360B 15.08E+5 6.44E+05 10.81E+5 5.73E+05 9.43E+5 5.52E+05 8.88E+5 5.44E+05
HE400B 17.55E+5 7.19E+05 12.54E+5 6.47E+05 10.88E+5 6.23E+05 10.23E+5 6.15E+05
The strength of a flange ( �©ª«) is influenced by axial stresses (��+?;´=) in the member
resulting from axial force or bending moment. Therefore, a reduction of the strength
because of possible local buckling has to be contemplated. According to e.g. ENV 1993-1-1
Annex J, the possible reduction of the moment resistance of the column flange should be
allowed for when the maximum longitudinal compressive stress ��+?;´= exceeds 180
N/mm2 by multiplying the flange strength by a reduction factor �#� (Zoetemeijer, 1975):
�#� H 2��;#� R 180 R ��+?;´=2��;#� R 360 [6-2]
Generally, the reduction factor �#� is 1.0 and no reduction is necessary. It can therefore be
omitted in preliminary calculations.
The derived flange characteristics are to be used to find the overall panel-to-frame
connection stiffness and strength (chapter 7).

6 I C h a p t e r
PARAMETER STUDIES
91 | P a g e
6.2 Full-scale behavior
In the previous chapter (section 5.2), a finite element model was presented, developed in
order to supplement the full-scale experimental behavior of the semi-integral infilled
frames. This validated finite element model is now used to perform a parameter study.
The aim of this study is to investigate other configurations of the semi-integral infilled
frame in order to further improve the understanding of the structural response of this
composite structure. Besides, a wide range of results is provided, serving as verification
for the development of design models.
6.2.1 Parameters considered
The parameters investigated are the frame member dimensions, the rotational stiffness of
the frame joints, the infilled frame aspect ratio and the panel opening geometry including
reinforcement layout. Each parameter is described below.
Frame member dimensions
The test specimens consisted of frame members HE180M only. This frame is applied in the
parameter study as well and is denoted as ‘weak frame’. In addition, a more practical
frame is studied, consisting of HE400B columns and HE320A beams (denoted as ‘strong
frame’). This frame has been chosen based on practical considerations for the design of
ten to twenty-story high commercial buildings. In practice, the increased section height of
the frame members reduces the space between the columns and beams, requiring a
smaller panel. However, in order to evaluate the effect of the frame members only, the
height and width of the panel are kept constant for each aspect ratio in the parameter
study. The geometrical properties for the frame members used are provided in Table 6-7.
By changing the frame members, the characteristics of the panel-to-frame connection
change as well. Figure 6-6 shows the load deformation response of the panel-to-frame
connections for the sections applied. The graphs were composed in the same way as
described in section 5.2.2, having the linear elastic stiffness for the combined component
‘flanges in bending with web in compression’ obtained from Table 6-2 or Table 6-3.
Figure 6-6: Load-deformation characteristics of panel-to-frame connections
0
100
200
300
400
500
600
700
0 1 2 3 4
Loa
d [
kN]
Deformation [mm]
HE180M
HE400B
HE320A
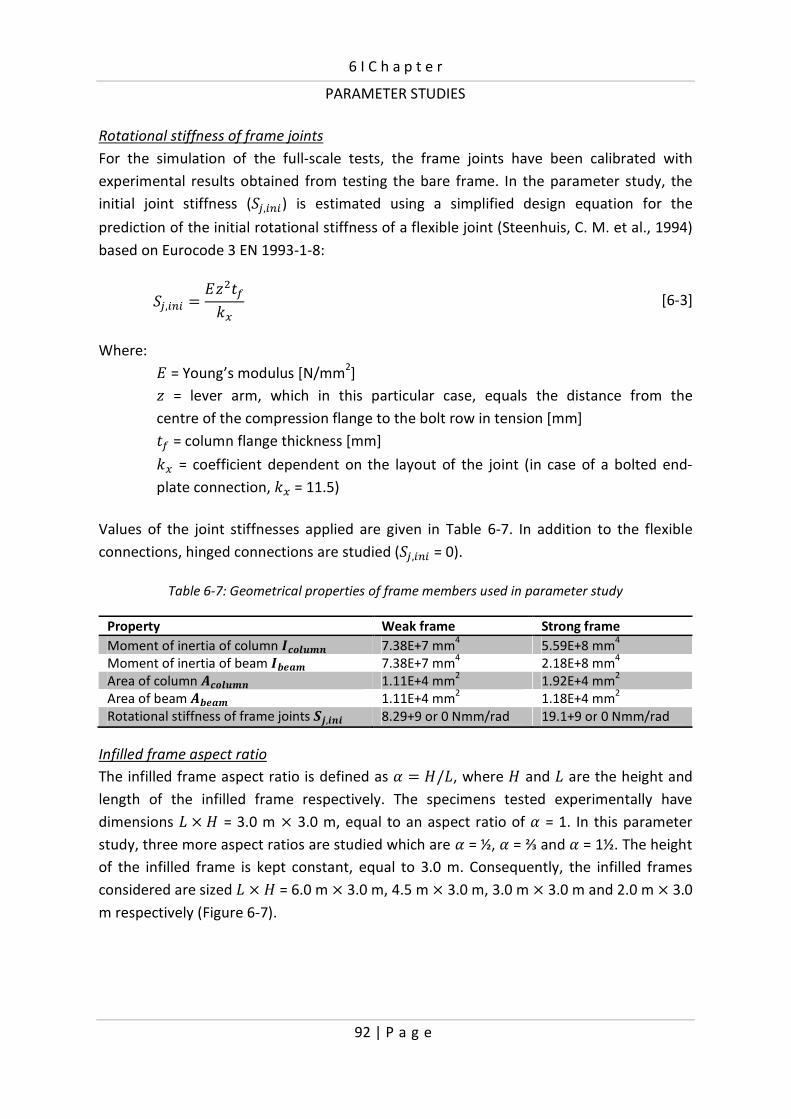
6 I C h a p t e r
PARAMETER STUDIES
92 | P a g e
Rotational stiffness of frame joints
For the simulation of the full-scale tests, the frame joints have been calibrated with
experimental results obtained from testing the bare frame. In the parameter study, the
initial joint stiffness (31,���) is estimated using a simplified design equation for the
prediction of the initial rotational stiffness of a flexible joint (Steenhuis, C. M. et al., 1994)
based on Eurocode 3 EN 1993-1-8:
31,��� H �µ�4#�� [6-3]
Where:
� = Young’s modulus [N/mm2]
µ = lever arm, which in this particular case, equals the distance from the
centre of the compression flange to the bolt row in tension [mm]
4# = column flange thickness [mm]
�� = coefficient dependent on the layout of the joint (in case of a bolted end-
plate connection, �� = 11.5)
Values of the joint stiffnesses applied are given in Table 6-7. In addition to the flexible
connections, hinged connections are studied (31,��� = 0).
Table 6-7: Geometrical properties of frame members used in parameter study
Property Weak frame Strong frame
Moment of inertia of column ¶�·¸z¹� 7.38E+7 mm4 5.59E+8 mm
4
Moment of inertia of beam ¶y��¹ 7.38E+7 mm4 2.18E+8 mm
4
Area of column º�·¸z¹� 1.11E+4 mm2 1.92E+4 mm
2
Area of beam ºy��¹ 1.11E+4 mm2 1.18E+4 mm
2
Rotational stiffness of frame joints }»,��� 8.29+9 or 0 Nmm/rad 19.1+9 or 0 Nmm/rad
Infilled frame aspect ratio
The infilled frame aspect ratio is defined as G H &/�, where & and � are the height and
length of the infilled frame respectively. The specimens tested experimentally have
dimensions � Q & = 3.0 m Q 3.0 m, equal to an aspect ratio of G = 1. In this parameter
study, three more aspect ratios are studied which are G = ½, G = ⅔ and G = 1½. The height
of the infilled frame is kept constant, equal to 3.0 m. Consequently, the infilled frames
considered are sized � Q & = 6.0 m Q 3.0 m, 4.5 m Q 3.0 m, 3.0 m Q 3.0 m and 2.0 m Q 3.0
m respectively (Figure 6-7).

6 I C h a p t e r
PARAMETER STUDIES
93 | P a g e
Panel opening geometry
The five panel opening geometries investigated experimentally are considered in the
parameter study as well. Consequently, each aspect ratio includes five panel opening
geometries (henceforward referred to as panel type). The dimensions of the window
openings result from keeping the heights of the panel members (indicated with 6, � and µ
in Figure 6-7) constant. The applied dimensions for 6, � and µ are given in Table 6-8. The
thickness of the panels is kept constant (45 = 200 mm). The reinforcement is determined
in accordance with the panel opening geometry using the strut-and-tie model presented
in Figure 3-5 (see Appendix D.2 for the panel geometries with corresponding
reinforcement configurations).
Figure 6-7: Investigated aspect ratios and transformed panel opening geometry
Table 6-8: Applied dimensions for 6, � and µ
Panel type ¼ [mm] x [mm] ½ [mm]
1 900 750 450
2 750 600 450
3 600 600 450
4 600 450 450
5 450 450 450
α = ⅔
α = ½
α = 1
α = 1½
x
x
x
x
y y
y y
z z z z
zzzz
3 m
3 m
3 m
3 m
4.5 m 3 m
6 m 2 m
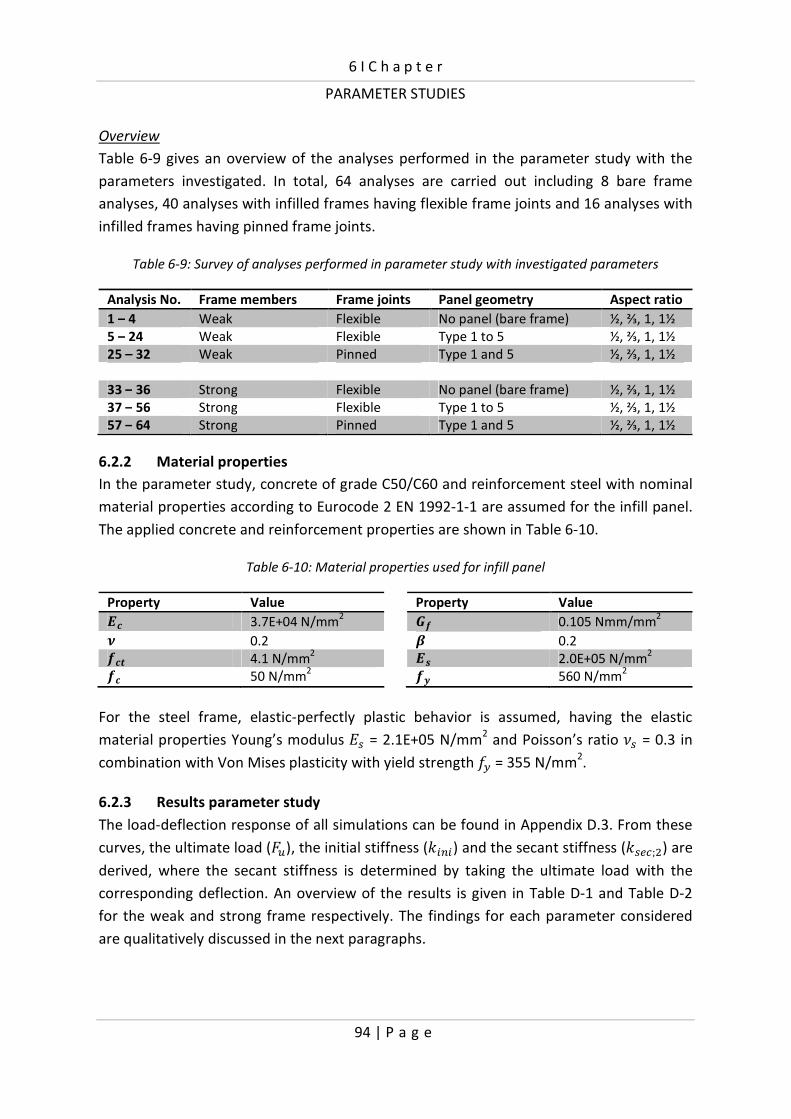
6 I C h a p t e r
PARAMETER STUDIES
94 | P a g e
Overview
Table 6-9 gives an overview of the analyses performed in the parameter study with the
parameters investigated. In total, 64 analyses are carried out including 8 bare frame
analyses, 40 analyses with infilled frames having flexible frame joints and 16 analyses with
infilled frames having pinned frame joints.
Table 6-9: Survey of analyses performed in parameter study with investigated parameters
Analysis No. Frame members Frame joints Panel geometry Aspect ratio
1 – 4 Weak Flexible No panel (bare frame) ½, ⅔, 1, 1½
5 – 24 Weak Flexible Type 1 to 5 ½, ⅔, 1, 1½
25 – 32 Weak Pinned Type 1 and 5 ½, ⅔, 1, 1½
33 – 36 Strong Flexible No panel (bare frame) ½, ⅔, 1, 1½
37 – 56 Strong Flexible Type 1 to 5 ½, ⅔, 1, 1½
57 – 64 Strong Pinned Type 1 and 5 ½, ⅔, 1, 1½
6.2.2 Material properties
In the parameter study, concrete of grade C50/C60 and reinforcement steel with nominal
material properties according to Eurocode 2 EN 1992-1-1 are assumed for the infill panel.
The applied concrete and reinforcement properties are shown in Table 6-10.
Table 6-10: Material properties used for infill panel
Property Value Property Value �� 3.7E+04 N/mm2 §w 0.105 Nmm/mm
2 ¾ 0.2 ¿ 0.2 w�� 4.1 N/mm
2 �� 2.0E+05 N/mm
2 w� 50 N/mm
2 wx 560 N/mm
2
For the steel frame, elastic-perfectly plastic behavior is assumed, having the elastic
material properties Young’s modulus �� = 2.1E+05 N/mm2 and Poisson’s ratio @� = 0.3 in
combination with Von Mises plasticity with yield strength �� = 355 N/mm2.
6.2.3 Results parameter study
The load-deflection response of all simulations can be found in Appendix D.3. From these
curves, the ultimate load ( �), the initial stiffness (����) and the secant stiffness (��*�;�) are
derived, where the secant stiffness is determined by taking the ultimate load with the
corresponding deflection. An overview of the results is given in Table D-1 and Table D-2
for the weak and strong frame respectively. The findings for each parameter considered
are qualitatively discussed in the next paragraphs.

6 I C h a p t e r
PARAMETER STUDIES
95 | P a g e
Influence of frame member dimensions
The load-deflection response of two infilled frames constructed with a weak frame (grey
line) and strong frame (black line) respectively are shown in Figure 6-8 (G = 1, panel type
3). The dashed line in the matching color shows the bare frame behavior of the
corresponding infilled frame.
Figure 6-8: Load-deflection response of (infilled) frames with weak and strong frame respectively
It is shown that, despite the considerably higher bare frame stiffness of the strong frame,
the difference in the initial infilled frame stiffness is low. Furthermore, a comparable
ductility is achieved. However, applying the strong frame, the ultimate strength of the
infilled frame considerably increases. This is also the case for the other aspect ratios and
panel types (see Appendix D.3 for results).
By changing the frame members, the characteristics of the panel-to-frame connections
change as well. The influence of these connections is demonstrated by considering infilled
frames having pinned frame joints. The load-deflection response of two infilled frames
with panel type 1 and type 5, having a weak (grey line) and strong (black line) frame
respectively are shown in Figure 6-9, for G = ⅔ and for G = 1½. Despite the fact that both
bare frame stiffnesses are zero, the strong frame gives for G = ⅔. a higher infilled frame
stiffness. However, for G = 1½, the structure with the weaker HE180M frame acts stiffer.
This is to be attributed to the stiffness of the panel-to-frame connection and
demonstrates that the infilled frame exhibits complex behavior.
0
200
400
600
800
1000
0 10 20 30
Late
ral l
oa
d [
kN]
Lateral deflection [mm]
strong frame
weak frame
3
α=1
Sj;ini = flexible
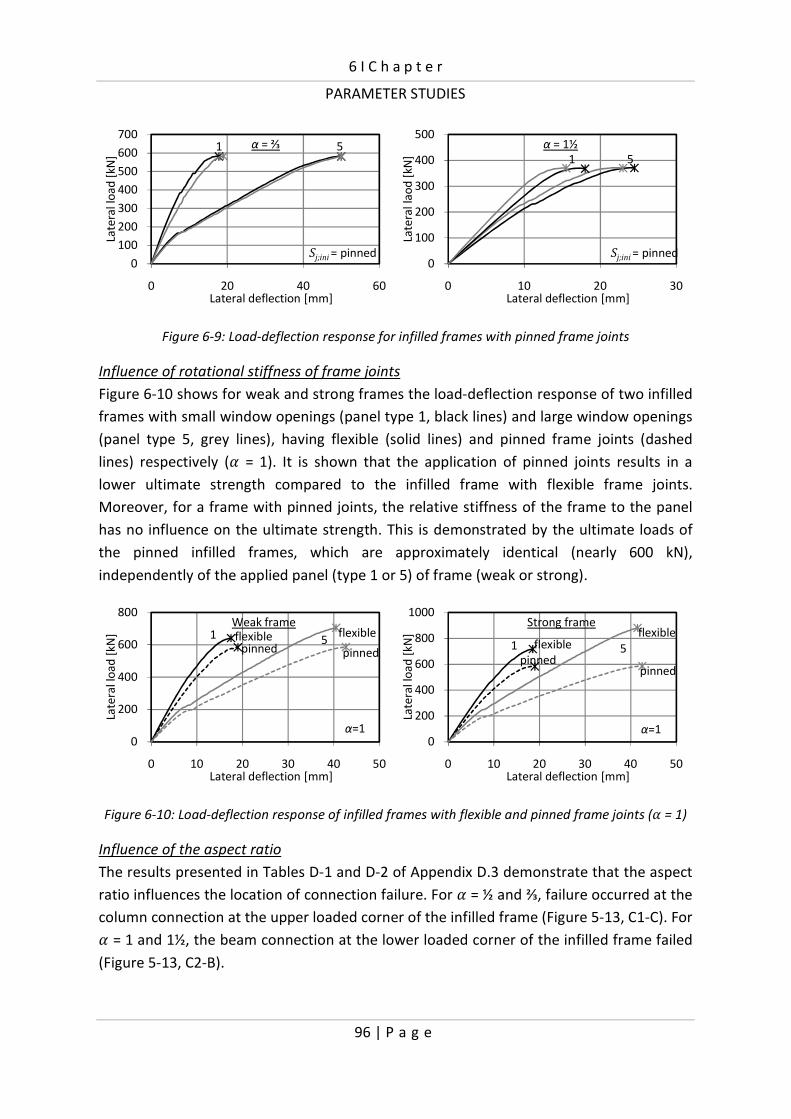
6 I C h a p t e r
PARAMETER STUDIES
96 | P a g e
Figure 6-9: Load-deflection response for infilled frames with pinned frame joints
Influence of rotational stiffness of frame joints
Figure 6-10 shows for weak and strong frames the load-deflection response of two infilled
frames with small window openings (panel type 1, black lines) and large window openings
(panel type 5, grey lines), having flexible (solid lines) and pinned frame joints (dashed
lines) respectively (G = 1). It is shown that the application of pinned joints results in a
lower ultimate strength compared to the infilled frame with flexible frame joints.
Moreover, for a frame with pinned joints, the relative stiffness of the frame to the panel
has no influence on the ultimate strength. This is demonstrated by the ultimate loads of
the pinned infilled frames, which are approximately identical (nearly 600 kN),
independently of the applied panel (type 1 or 5) of frame (weak or strong).
Figure 6-10: Load-deflection response of infilled frames with flexible and pinned frame joints (G = 1)
Influence of the aspect ratio
The results presented in Tables D-1 and D-2 of Appendix D.3 demonstrate that the aspect
ratio influences the location of connection failure. For G = ½ and ⅔, failure occurred at the
column connection at the upper loaded corner of the infilled frame (Figure 5-13, C1-C). For G = 1 and 1½, the beam connection at the lower loaded corner of the infilled frame failed
(Figure 5-13, C2-B).
0
100
200
300
400
500
600
700
0 20 40 60
Late
ral l
oa
d [
kN]
Lateral deflection [mm]
α = ⅔1 5
Sj;ini = pinned0
100
200
300
400
500
0 10 20 30
Late
ral l
ao
d [
kN]
Lateral deflection [mm]
α = 1½
1 5
Sj;ini = pinned
0
200
400
600
800
0 10 20 30 40 50
Late
ral l
oa
d [
kN]
Lateral deflection [mm]
Weak frameflexible
pinnedpinnedflexible1 5
α=10
200
400
600
800
1000
0 10 20 30 40 50
Late
ral l
oa
d [
kN]
Lateral deflection [mm]
Strong frame
pinnedpinned
flexibleflexible1 5
α=1

6 I C h a p t e r
PARAMET
Influence of the panel opening geometry
The effects of the size and position of the win
investigated (section 4.2). The tests showed that a
infill to the frame results in a decrease of the lateral stiffness
study are presented in Figure 6-11, showing the load
frames with panel type 1 to 5, having
show in addition to the decrease of stiffness
effect is more evident considering the strong
Figure 6-11: Load-deflection response of
Figure 6-12 graphically demonstrates that th
contribution of the bare frame. The shaded part under the bare frame
between the ultimate strengths defined by the infilled frame
and the infilled frames with the flexible connections.
Figure 6-12: Illustration of increase of strength attributed
The results of this study serve as verification for the development of analytical models,
be presented in the next chapter.
0
200
400
600
800
1000
0 20 40
Late
ral l
oa
d [
kN]
Lateral deflection [mm]
Weak frame
1 2 3 4 5Sj;ini = flexible
0
200
400
600
800
1000
0
Late
ral l
oa
d [
kN]
6 I C h a p t e r
PARAMETER STUDIES
97 | P a g e
geometry
size and position of the window opening has experimentally been
. The tests showed that a decrease of the relative stiffness of the
crease of the lateral stiffness. The results of the parameter
, showing the load-deflection response for infilled
a weak and strong frame respectively. The results
show in addition to the decrease of stiffness an increase of the ultimate strength. This
strong frame.
deflection response of infilled frames with varied panel opening geometries
that the increase of strength can be attributed to the
shaded part under the bare frame curve exactly fits
between the ultimate strengths defined by the infilled frames with pinned frame joints
with the flexible connections.
Illustration of increase of strength attributed to bare frame
The results of this study serve as verification for the development of analytical models, to
60
α=1
= flexible
0
200
400
600
800
1000
0 20 40 60
Late
ral l
oa
d [
kN]
Lateral deflection [mm]
Strong frame1 2 3 4 5
Sj;ini = flexible
α=1
20 40 60Lateral deflection [mm]
Strong frame
pinned
flexible
α=1
bare frame

6 I C h a p t e r
PARAMETER STUDIES
98 | P a g e
6.3 Chapter conclusions
A first parameter study was carried out to find the strength and stiffness characteristics of
European rolled HEA- and HEB-sections with heights ranging from 200 to 400 mm, subject
to transverse compression introduced indirectly through the flanges. The parameters
considered were the distance of the bolt with respect to the end plate and the section
type. Based on the obtained load-deformation graphs, the linear elastic stiffness and
design strength were derived. These are to be used to find the overall panel-to-frame
connection stiffness and strength (chapter 7).
A second parameter study was performed to investigate various configurations of the
semi-integral infilled frame. Four parameters have been studied with respect to their
influence on the structural response. These parameters are the frame member
dimensions, the rotational stiffness of the frame joints, the infilled frame aspect ratio and
the panel opening geometry. The major findings are summarized below:
� For infilled frames with flexible joints, an increase of the relative stiffness of the
frame to the infill results in an increase of the ultimate strength and secant
stiffness.
� For infilled frames with flexible joints, an increase of the window opening and
thus a decrease of the relative stiffness of the infill to the frame results in a
decrease of the secant stiffness and in an increase of the ultimate strength and
deformation capacity.
� For infilled frames with pinned frame joints, the ultimate strength is independent
of the relative stiffness of the infill to the frame.
� The aspect ratio of the infilled frame defines the location of connection failure.
From the simulated load-deformation curves, characteristics were derived which serve as
a verification for the development of analytical models for the prediction of the lateral
stiffness, the ultimate lateral load and deformation capacity of the semi-integral infilled
frame (chapter 7).

99 | P a g e
Chapter 7: ANALYTICAL MODELING
Scope of the chapter
This chapter discusses analytical models to predict the lateral stiffness (section 7.1) and the
ultimate lateral load (section 7.2) of the semi-integral infilled frame with a window
opening. In these models, the strength of the structure is supposed to be governed by the
panel-to-frame connections. A description of the development of these models is given.
Subsequently, the analytical models are compared with the results obtained from the
parameter study discussed in the previous chapter, in order to check their validity (section
7.3). The concluding section 7.4 summarizes the most important results.
7.1 Lateral stiffness modeling
In chapter 3, the mechanical model shown in Figure 7-1a was proposed for the semi-
integral infilled frame. However, for a good understanding, a basic representation of this
model (Figure 7-1b) is used first to approach the semi-integral infilled frame analytically.
Afterwards, the analytical model for the basic model will be extended, allowing the
application for the (originally proposed) advanced model as well.
In the basic model, the strut is pin-connected directly to the frame corners, neglecting the
(rigid) offset. Furthermore, the translational springs representing the panel-to-frame
connections are situated at one end of the strut between the strut and the frame, using
one equivalent spring in horizontal and vertical direction respectively. Accordingly, the
spring stiffnesses of the equivalent springs equal ½��,�+,�?� and ½��,�*�? respectively.
(a) Advanced model (b) Basic model
Figure 7-1: Mechanical models for the semi-integral infilled frame with a window opening
B
D
A
C
kp
B’
ϕf
½kc;beam
½kc;col
D’
B
CD
A
Fh
D’
B’
kc;beam
kc;col
kp
kc;beam
kc;col
B
D

7 I C h a p t e r
ANALYTICAL MODELING
100 | P a g e
7.1.1 Basic model
The basic model (Figure 7-1b) is a statically indeterminate system; stiffness and strength
depend on the relative stiffness between the diagonal strut including its connections to
the frame and the surrounding frame. The load versus deflection response of this model
can be represented by the spring system shown in Figure 7-2. The spring system
represents the lateral load-displacement response between node D (loaded node) and
node B (fixed node) of the infilled frame (Figure 7-1b). The spring system consists of a
spring representing the bare frame stiffness (� ;#) which acts in parallel with three serial
springs (the bracing system), representing a stiffness resulting from the panel deformation
(� ;!), a stiffness resulting from the deformations of the panel-to-frame connections
(� ;-�+�) and a stiffness resulting from frame column lengthening (� ;�+,). The latter is a
result from the action of the infill panel on the frame, giving additionally to a compression
force in the panel diagonal, a tensile force in the loaded frame column, and thus has to be
considered a component of the bracing system as well.
Figure 7-2: Spring system representing lateral load-deflection response of basic model
Accordingly, the following equation holds for the spring system and thus for the lateral
stiffness the semi-integral infilled frame (� ;�#):
� ;�# H 9 H � ;# Z ¨ 1� ;! Z 1� ;-�+� Z 1� ;�+,i�
[7-1]
In the following sections, equations for the four stiffness terms are derived.
Stiffness of the bare frame
To find the bare frame stiffness, the braced frame from Figure 7-1b is considered having
an infinitely small strut, thus �! = 0 (Figure 7-3). In this case, the load is supported by the
bare frame only. The structural behavior is analyzed elastically, allowing the use of the
principle of superposition. Consequently, the structure may be analyzed for separate load
cases and the individual components of stress, strain and displacements are additive.
Fh
kh;f
kh; on∑c kh;colkh;pδh
D B
Bracing system
Bare frame

7 I C h a p t e r
ANALYTICAL MODELING
101 | P a g e
Figure 7-3: Basic model having an infinitely small strut, thus �! = 0
Figure 7-4 gives the diagrams of forces for the laterally loaded bare frame:
Bending moment Normal force Shear force
Figure 7-4: Diagrams of forces for laterally loaded bare frame
The total deflection at the top of the frame consists of a deflection due to bending of the
columns, beams and rotation in the beam-to-column connections (9 �;#), a deflection due
to the axial deformation of the columns and beams (9 �;#) and a deflection due to the
shear deformation of the columns and beams (9 ;#).
For convenience, two factors (7# and 8#) are introduced to express the contribution of the
rigid ends of the beams and columns as follows:
7# H �� R '� [7-2]
H
L
kp=0
ϕf ½hb
½hb
½ ch½ ch
SjEIb,A hb, b
EIc,A hc, c
Fh
½ tanFh fϕ
¼ HFh ½Fh ½Fh
½ tanFh fϕ
kp=0 kp=0
Fh Fh
½Fh
½Fh ftanϕ ½Fh ftanϕ
kp=0
Fh
¼ HFh
¼ HFh¼ HFh½Fh

7 I C h a p t e r
ANALYTICAL MODELING
102 | P a g e
8# H && R '� [7-3]
where � and & are the length and height of the frame respectively, and '� and '� the
section height of the column and beam.
The elastic deflection of the bare frame due to bending of the frame members (9 �;#) is
equal to the sum of the deflection caused by double curvature bending of the beams (first
term in equation [7-4]), double curvature bending of the columns (second term in
equation) and rotation of the flexible beam-to-column connections (third term in
equation):
9 �;# H �&�24�7#)� Z
&24�8#)� Z
&�47#�31 [7-4]
The elastic deflection of the bare frame due to axial deformations (9 �;#) is equal to the
sum of the axial deformation of the beams (first term in equation [7-5]), plus the
horizontal component resulting from the (vertical) axial deformation of the columns
(second term in equation).
9 �;# H �2�7#�� Z & tan<#2�8#�� tan <# [7-5]
The elastic deflection of the bare frame due to shear deformations (9 ;#) is equal to the
sum of the shear deformation of the columns (first term in equation [7-6]), plus the
horizontal component resulting from the shear deformation of the beams (second term in
equation).
9 ;# H &2$8#��;� Z & tan <#2$7#��;� [7-6]
where �� is the shear area of the cross-section, for rolled wide flange beams to be derived
according to the following equation (Eurocode 3 EN 1993-1-1):
�� H � R 2�4# Z D45 Z 22F4# [7-7]
Having obtained the deflections due to bending moment, normal force and shear force,
the stiffness of the bare frame (� ;#) can be found by dividing the lateral load by the
sum of the deflections:
� ;# H ∑9 �;# [7-8]

7 I C h a p t e r
ANALYTICAL MODELING
103 | P a g e
Stiffness of the bracing system
To find the stiffness of the bracing system, the braced frame from Figure 7-1b is
considered having pinned frame joints, thus 31 = 0. In this case, the load is supported by
axial compression in the strut and axial tension in the loaded column only (Figure 7-5).
Other frame members remain unloaded. Stiffness terms are derived for the three
components of the bracing system. Again, the structural behavior is analyzed elastically,
allowing the use of the principle of superposition.
Figure 7-5: Normal force diagram for basic model having pinned frame joints, thus 31 = 0
Strut
First, the stiffness resulting from strut deformation is derived. Assuming an axial force in
the strut equal to B�;��.�� , the lateral deflection due to deformation of the strut equals:
9 ;��.�� H B�;��.���! 1cos<# [7-9]
Accordingly, the stiffness resulting from strut deformation (� ;!F is given by:
� ;! H 9 ;��.�� H �!cos<#B�;��.�� [7-10]
Panel-to-frame connections
Next, the stiffness resulting from deformations of the panel-to-frame connections are
derived. Assuming an axial load in the panel-to-column and the panel-to-beam
connections equal to B�;�;�+, and B�;�;�*�? respectively, the lateral deflection due to
connection deformations equals:
H
L
Sj=0
kp
ϕf
½kc;beam
½kc;col
7 I C h a p t e r
ANALYTICAL MODELING
104 | P a g e
9 ;-�+� H B�;�;�+,����;�+, ZB�;�;�*�?����;�*�? tan <# [7-11]
Accordingly, the stiffness resulting from connection deformations (� ;-�+�) is given by:
� ;-�+� H 9 ;-�+� H l2B�;�;�+,��;�+, Z 2B�;�;�*�?��;�*�? tan <#m
[7-12]
Column
Finally, the stiffness resulting from column deformation is derived. Assuming a tensile
force in the column equal to B�;�+,, the lateral deflection due to column deformation
equals:
9 ;�+, H B�;�+,&��� tan <# [7-13]
Consequently, the stiffness resulting from column deformation (� ;�+,) equals:
� ;�+, H 9 ;�+, H ���B�;�+,& tan<# [7-14]
Having obtained the stiffness coefficients � ;#, � ;!, � ;-�+� and � ;�+, , equation 7-1 gives
the overall stiffness of the semi-integral infilled frame, represented by the basic model.
Though, the diagonal panel stiffness �! is still unknown. A method to derive the diagonal
panel stiffness is presented in the following paragraph.
Derivation diagonal panel stiffness
In order to find the diagonal panel stiffness D�!F, the panel is modelled as an equivalent
frame having dimensions '’ by /’ and sectional properties �)�+, , �)�;�+! and �)�;�+��+?
(Figure 7-6). Rigid arms are used to model the depth of the columns and beams.
Because the dimensions of the equivalent frame deviate from the original panel, the
action and reaction forces are displaced. Consequently, the equivalent frame should
additionally to the lateral load  be loaded by two bending moments 0� and 0� as well.
However, these will be compensated for by a correction factor, presented in the next
paragraphs.

7 I C h a p t e r
ANALYTICAL MODELING
105 | P a g e
Figure 7-6: Infill panel with equivalent frame representation
Likewise for the bare frame, two factors (7! and 8!) are defined to express the
contribution by the rigid ends of the beams and columns:
7! H /(� [7-15]
8! H '(� [7-16]
The lateral stiffness of the equivalent frame is determined considering deformations due
to bending of the frame members only. The deflection of the equivalent frame due to
lateral load  is equal to the sum of the horizontal displacements caused by double
curvature bending of the top beam (first term in equation [7-17]), double curvature
bending of the bottom beam (second term in equation) and double curvature bending the
of the columns (third term in equation):
9 ;! H  /Ã'(�487!�)�;�+! Z  /Ã'(�487!�)�;�+��+? Z  '(248!�)�+, [7-17]
H  '(�O8!�)�+,7!�)�;�+��+?/( Z 8!�)�+,7!�)�;�+!/( Z 27!�)�;�+��+?7!�)�;�+!'(P487!�)�;�+!7!�)�;�+��+?8!�)�+,
Since the equivalent frame (beam model) offers a poor representation for the in-plane
loaded plate structure (continuum), and additionally because the bending moments 0�
and 0� and shear and axial deformations were not taken into account, a correction factor : is introduced. This factor can be determined by making linear elastic finite element
calculations of a plate structure and its equivalent frame as previously defined.
Subsequently, the correction factor : equals the quotient of the found lateral deflections
as follows:
M1
M2
ba
l
l’
h’h
EIb;top
EIb;bottom
EIc h’
l’
Ph
Ph
ϕp
hb;top
hb;bottom
hcol
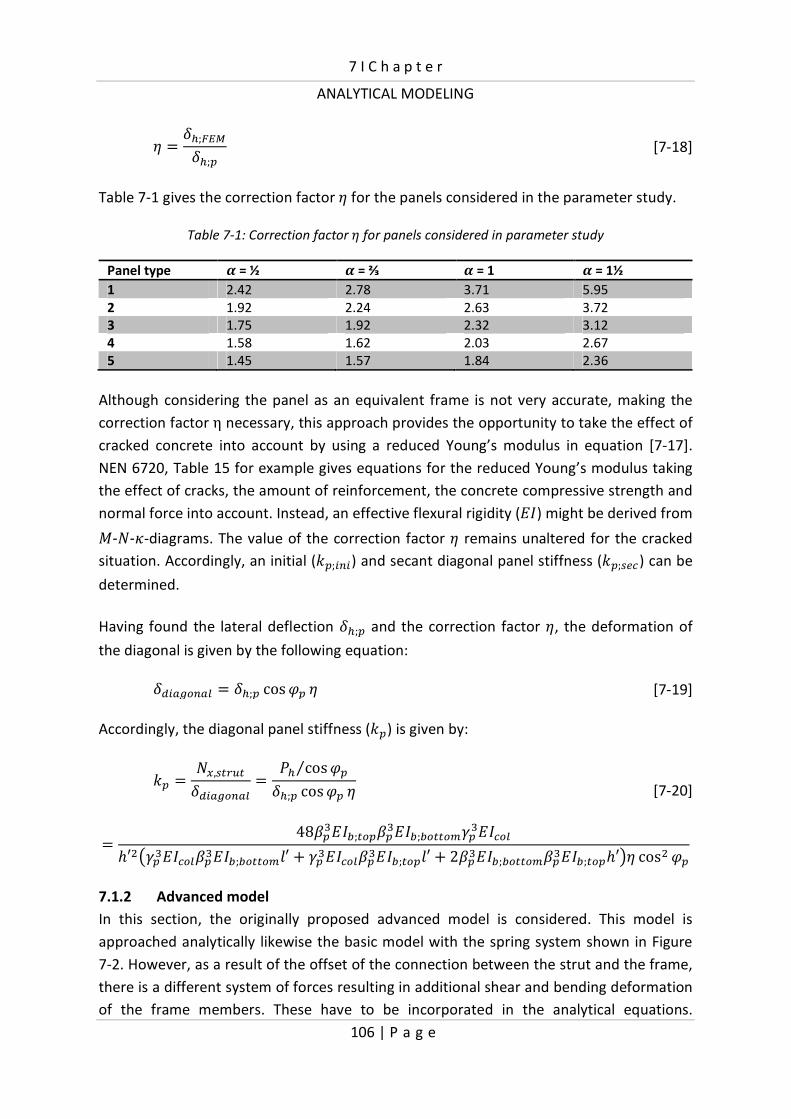
7 I C h a p t e r
ANALYTICAL MODELING
106 | P a g e
: H 9 ;Ä´Å9 ;! [7-18]
Table 7-1 gives the correction factor : for the panels considered in the parameter study.
Table 7-1: Correction factor : for panels considered in parameter study
Panel type Æ = ½ Æ = ⅔ Æ = 1 Æ = 1½
1 2.42 2.78 3.71 5.95
2 1.92 2.24 2.63 3.72
3 1.75 1.92 2.32 3.12
4 1.58 1.62 2.03 2.67
5 1.45 1.57 1.84 2.36
Although considering the panel as an equivalent frame is not very accurate, making the
correction factor η necessary, this approach provides the opportunity to take the effect of
cracked concrete into account by using a reduced Young’s modulus in equation [7-17].
NEN 6720, Table 15 for example gives equations for the reduced Young’s modulus taking
the effect of cracks, the amount of reinforcement, the concrete compressive strength and
normal force into account. Instead, an effective flexural rigidity (�)) might be derived from 0-B-C-diagrams. The value of the correction factor : remains unaltered for the cracked
situation. Accordingly, an initial (�!;���) and secant diagonal panel stiffness (�!;�*�) can be
determined.
Having found the lateral deflection 9 ;! and the correction factor :, the deformation of
the diagonal is given by the following equation:
9=���+��, H 9 ;! cos<! : [7-19]
Accordingly, the diagonal panel stiffness (�!) is given by:
�! H B�,��.��9=���+��, H  cos<!⁄9 ;! cos<! :
[7-20]
H 487!�)�;�+!7!�)�;�+��+?8!�)�+,'(�O8!�)�+,7!�)�;�+��+?/( Z 8!�)�+,7!�)�;�+!/( Z 27!�)�;�+��+?7!�)�;�+!'(P: cos�<!
7.1.2 Advanced model
In this section, the originally proposed advanced model is considered. This model is
approached analytically likewise the basic model with the spring system shown in Figure
7-2. However, as a result of the offset of the connection between the strut and the frame,
there is a different system of forces resulting in additional shear and bending deformation
of the frame members. These have to be incorporated in the analytical equations.
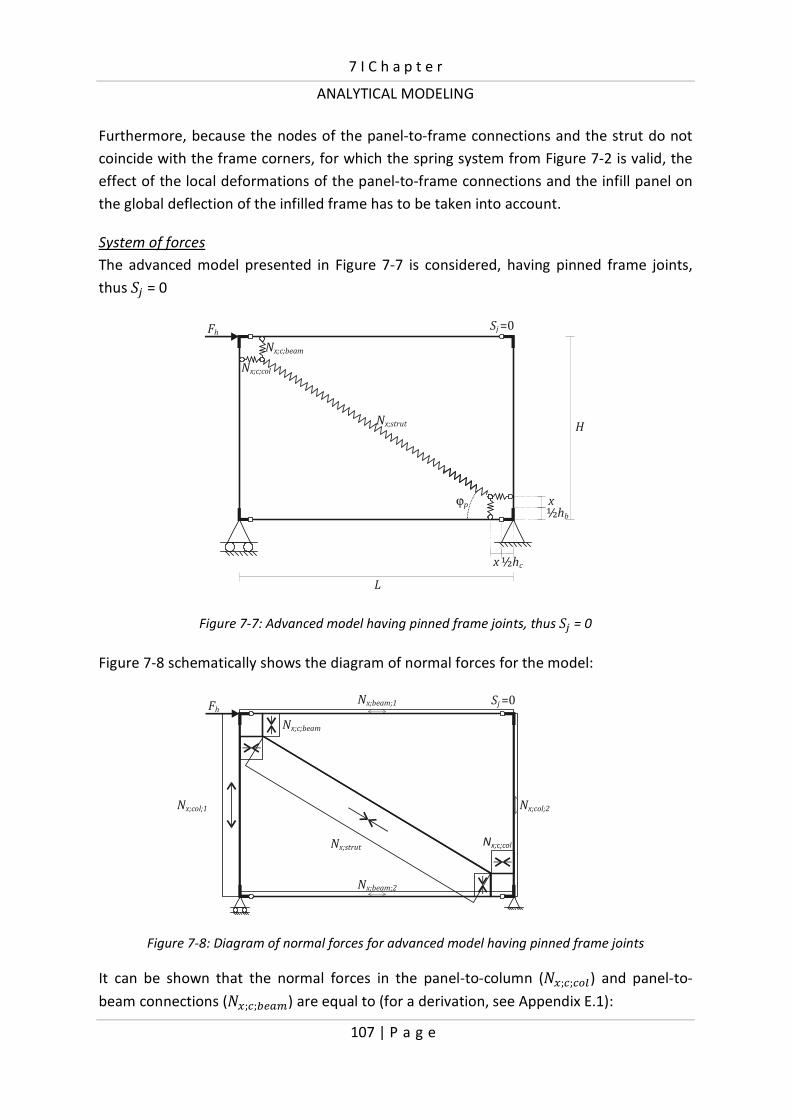
7 I C h a p t e r
ANALYTICAL MODELING
107 | P a g e
Furthermore, because the nodes of the panel-to-frame connections and the strut do not
coincide with the frame corners, for which the spring system from Figure 7-2 is valid, the
effect of the local deformations of the panel-to-frame connections and the infill panel on
the global deflection of the infilled frame has to be taken into account.
System of forces
The advanced model presented in Figure 7-7 is considered, having pinned frame joints,
thus 31 = 0
Figure 7-7: Advanced model having pinned frame joints, thus 31 = 0
Figure 7-8 schematically shows the diagram of normal forces for the model:
Figure 7-8: Diagram of normal forces for advanced model having pinned frame joints
It can be shown that the normal forces in the panel-to-column (B�;�;�+,) and panel-to-
beam connections (B�;�;�*�?) are equal to (for a derivation, see Appendix E.1):
H
L
Nx;c;beam
Nx;c;col
Nx;strut
ϕp
Sj =0Fh
½ chx
½hb
x
Sj =0Fh
Nx;c;beam
Nx;c;colNx;strut
Nx;beam;1
Nx;beam;2
Nx;col;1 Nx;col;2

7 I C h a p t e r
ANALYTICAL MODELING
108 | P a g e
B�;�;�+, H &D& R '� R 26F7# [7-21]
B�;�;�*�? H B�;�;�+, tan <! H tan <! &D& R '� R 26F7# [7-22]
Accordingly, the normal force in the strut (B�;��.��) is given by:
B�;��.�� H B�;�;�+,cos<! H &D& R '� R 26F7# cos<! [7-23]
The axial force in the loaded column (B�;�+,;�) equals (for a derivation, see Appendix E):
B�;�+,;� H B�;�;�*�? l� R '� R 6� R '� m H D� R '� R 6F & tan<!D� R '�FD& R '� R 26F7# [7-24]
Due to the offset of the panel-to-frame connection with respect to the frame corners,
bending and shear deformations take place in the frame members. Therefore, an effective
panel-to-frame connection spring stiffness (��;*##) is derived, which includes stiffness
coefficients for shear (��;É) and bending deformation (��;Å) in addition to the initial spring
stiffness (��;���) as follows:
1��;*## H 1��;��� Z 1��;É Z 1��;Å [7-25]
Where:
��;��� = Initial connection stiffness
��;É = Stiffness resulting from shear deformation
��;Š= Stiffness resulting from bending deformation
The initial connection stiffness ��;���, is given by the following equation:
��;��� H ¨ 1��©ª« Z12��¬ªN
i� [7-26]
Where:
��©ª« = Stiffness coefficient for flanges with web in compression
��¬ªN = Stiffness coefficient for bolt with cap in compression
The effective panel-to-frame connection spring stiffness is to be used afterwards in
equation [7-35].

7 I C h a p t e r
ANALYTICAL MODELING
109 | P a g e
To derive the stiffness coefficients for shear and bending deformation, the shear force and
bending moment diagrams for a beam and column member as schematically shown in
Figure 7-9 are considered.
Figure 7-9: Stiffness coefficients for discrete interface connection
The stiffness coefficient resulting from shear deformation for the panel-to-beam
connection is given by (for derivation, see Appendix E.2):
��;É;�*�? H $��;�D� R '�FD� R '� R 6F6 [7-27]
The stiffness coefficient resulting from shear deformation for the panel-to-column
connection is given by (for derivation, see Appendix E.2):
��;É;�+, H $��;�D& R '�FD& R '� R 6F6 [7-28]
The stiffness coefficient resulting from bending deformation for the panel-to-beam
connection is given by (for derivation, see Appendix E.2):
for 31=0
��;Å;�*�? H 3�)�D� R '�FD� R '� R 6F�6� [7-29]
kc;ini;beamEIb
kc;V;beam
kc;M,beam
EIc
kc;V;col kc;M;col
H
½ chx
½hb
x
Fh
L
V
Vkc;ini;col

7 I C h a p t e r
ANALYTICAL MODELING
110 | P a g e
for 31 ≠ 0
��;Å;�*�? H ∞ [7-30]
For 31 ≠ 0, deformations due to bending moment showed to be negligible (considering
magnitudes for 6 which are in the application of the infilled frame). Consequently, the
stiffness coefficient for bending is taken ��;Å H ∞.
The stiffness coefficient resulting from bending deformation for the panel-to-column
connection is given by (for derivation, see Appendix E.2):
for 31=0
��;Å;�+, H 3�)�D& R '�FD& R '� R 6F�6� [7-31]
for 31 ≠ 0
��;Å;�+, H ∞ [7-32]
Extending equations for the basic model to allow application for the advanced model
The spring system from Figure 7-2 represents the load-displacement response between
node D and node B of the basic model (see Figure 7-1a). In the advanced model, the nodes
between the panel-to-frame connections and the strut (nodes D’ and B’, see Figure 7-1b)
do not coincide with the frame corners (nodes D and B, see Figure 7-1b). As a
consequence, to allow the application of the spring system for the advanced model, the
effect of (local) displacements between node D’ and B’ on (global) displacements between
node D and B has to be taken into account.
This is done, assuming a linear relation between the local and global displacements, by
multiplying the local displacements by (���.��//��.��), where ���.�� is the (diagonal) length
between node D and B, and /��.�� the (diagonal) length between nodes D’ and B’.
Accordingly, equation [7-10] for the stiffness resulting from strut deformation (� ;!) for
the basic model is extended to the following equation for the advanced model:
� ;! H �!cos<#B�;��.�� `���.��/��.�� a
[7-33]
Substitution of B�;��.�� given by equation [7-23], gives the following equation:

7 I C h a p t e r
ANALYTICAL MODELING
111 | P a g e
� ;! H �!cos<# cos<!/��.��D& R '� R 26F7#&���.�� [7-34]
Equation [7-12] for the stiffness resulting from connection deformations (� ;-�+�)
according to the basic model is extended to the following equation for the advanced
model as follows:
� ;-�+� H `���.��/��.�� a l2B�,�,�+,��;*##;�+, Z 2B�,�;�*�?��;*##;�*�? tan <#m
[7-35]
Where B�,�,�+, and B�,�;�*�? are given by equation [7-21] and [7-22] respectively.
Substitution gives the following equation:
� ;-�+� H ��;*##;�*�?��;*##;�+,/��.��D& R '� R 26F7#2&���.��O��;*##;�*�? Z ��;*##;�+,tan <! tan <#P [7-36]
The equation for the stiffness resulting from column deformation (� ;�+,) according to the
basic model is suited for the advanced model as well. Consequently, the stiffness resulting
from strut deformation is given by equation [7-14], where B�;�+,�?� is given by equation
[7-24]. Substitution gives the following equation:
� ;�+, H ���D� R '�FD& R '� R 26F7#&� tan <! tan <# D� R '� R 6F [7-37]
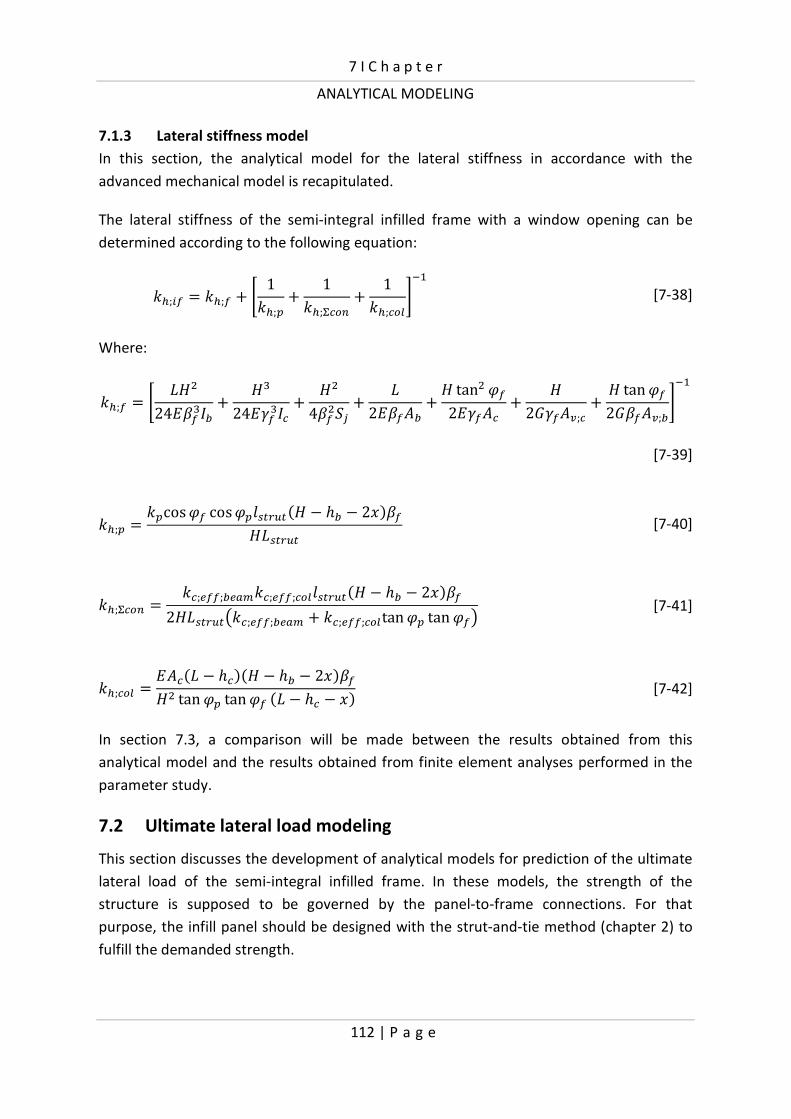
7 I C h a p t e r
ANALYTICAL MODELING
112 | P a g e
7.1.3 Lateral stiffness model
In this section, the analytical model for the lateral stiffness in accordance with the
advanced mechanical model is recapitulated.
The lateral stiffness of the semi-integral infilled frame with a window opening can be
determined according to the following equation:
� ;�# H � ;# Z ¨ 1� ;! Z 1� ;-�+� Z 1� ;�+,i�
[7-38]
Where:
� ;# H ¨ �&�24�7#)� Z
&24�8#)� Z
&�47#�31 Z
�2�7#�� Z & tan� <#2�8#�� Z &2$8#��;� Z & tan<#2$7#��;�i�
[7-39]
� ;! H �!cos<# cos<!/��.��D& R '� R 26F7#&���.�� [7-40]
� ;-�+� H ��;*##;�*�?��;*##;�+,/��.��D& R '� R 26F7#2&���.��O��;*##;�*�? Z ��;*##;�+,tan <! tan <#P [7-41]
� ;�+, H ���D� R '�FD& R '� R 26F7#&� tan <! tan <# D� R '� R 6F [7-42]
In section 7.3, a comparison will be made between the results obtained from this
analytical model and the results obtained from finite element analyses performed in the
parameter study.
7.2 Ultimate lateral load modeling
This section discusses the development of analytical models for prediction of the ultimate
lateral load of the semi-integral infilled frame. In these models, the strength of the
structure is supposed to be governed by the panel-to-frame connections. For that
purpose, the infill panel should be designed with the strut-and-tie method (chapter 2) to
fulfill the demanded strength.
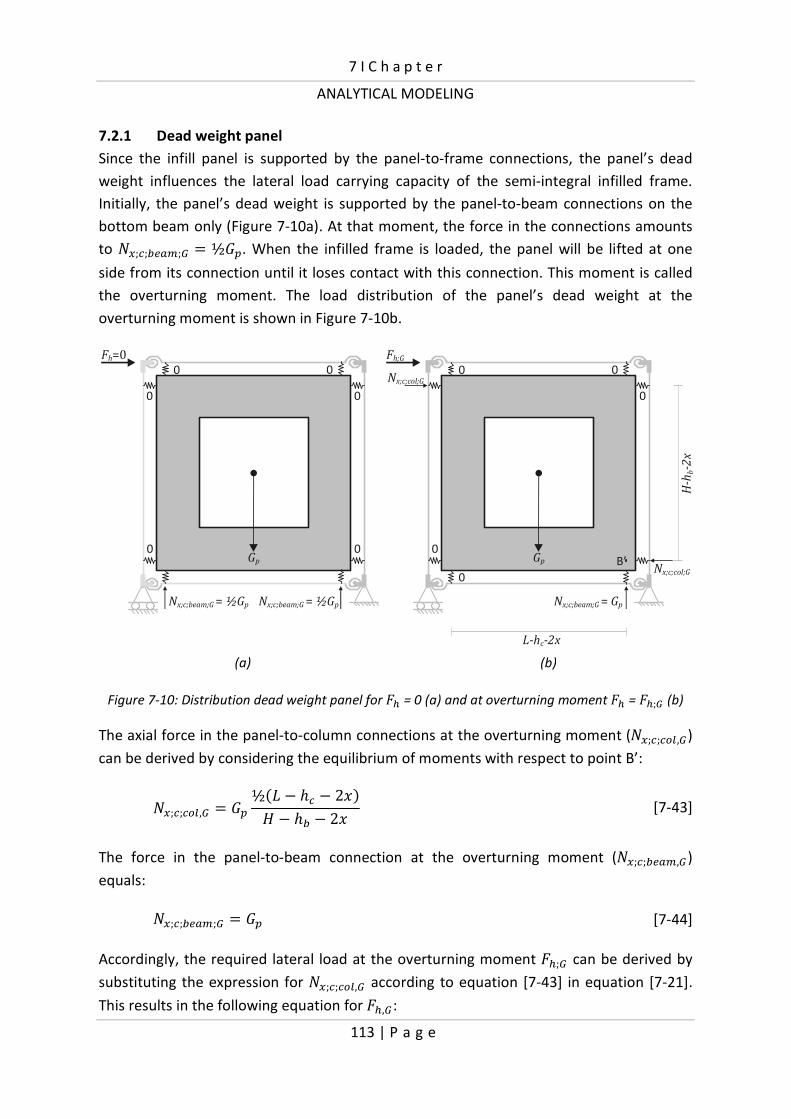
7 I C h a p t e r
ANALYTICAL MODELING
113 | P a g e
7.2.1 Dead weight panel
Since the infill panel is supported by the panel-to-frame connections, the panel’s dead
weight influences the lateral load carrying capacity of the semi-integral infilled frame.
Initially, the panel’s dead weight is supported by the panel-to-beam connections on the
bottom beam only (Figure 7-10a). At that moment, the force in the connections amounts
to B�;�;�*�?;Ë H ½$!. When the infilled frame is loaded, the panel will be lifted at one
side from its connection until it loses contact with this connection. This moment is called
the overturning moment. The load distribution of the panel’s dead weight at the
overturning moment is shown in Figure 7-10b.
(a) (b)
Figure 7-10: Distribution dead weight panel for = 0 (a) and at overturning moment = ;Ë (b)
The axial force in the panel-to-column connections at the overturning moment (B�;�;�+,,Ë)
can be derived by considering the equilibrium of moments with respect to point B’:
B�;�;�+,,Ë H $!½D� R '� R 26F& R '� R 26 [7-43]
The force in the panel-to-beam connection at the overturning moment (B�;�;�*�?,Ë)
equals:
B�;�;�*�?;Ë H $! [7-44]
Accordingly, the required lateral load at the overturning moment ;Ë can be derived by
substituting the expression for B�;�;�+,,Ë according to equation [7-43] in equation [7-21].
This results in the following equation for ,Ë:
Fh=0
N ½Gx;c;beam;G p= N ½Gx;c;beam;G p=
Gp
00
00
0 0
N Gx;c;beam;G p=
Gp
0
0
0 0
Fh;G
0Nx;c;col;G
Nx;c;col;G
L- -2xhc
H-
-2x
hb
B’

7 I C h a p t e r
ANALYTICAL MODELING
114 | P a g e
;Ë H $!½D� R '� R 26F7#& [7-45]
7.2.2 Ultimate lateral load models
The results of the parameter study showed that failure can occur by one of two possible
modes of failure, depending on the aspect ratio of the infilled frame. These are referred to
as panel-to-beam connection failure and panel-to-column connection failure. The
equations for calculating the resistance for both failure modes are derived in the following
paragraph.
To find the ultimate lateral load, two load cases have to be considered, which are the
panel’s dead load ($!) and the lateral load ( ). The panel’s dead load generates the
lateral load carrying capacity ( ,Ë) according to equation [7-45]. Consequently, the
corresponding forces in the panel-to-column and panel-to-beam connection given by
equations [7-43] and [7-44] respectively have to be subtracted from the connection
capacity ( �). The remaining connection capacity can be utilized for loading by strut action.
The relation between the force in the panel-to-frame connections and the lateral load for
strut action is given by equations [7-21] and [7-22]. Accordingly, this results in the
following equations for the resistance for the two failure modes:
Mode 1: Panel-to-column connection failure
�;�# H 1; Í ;Ë Z ÍD& R '� R 26F7#& Î D �;�+, R B�;�;�+,,ËFÎ [7-46]
Where ; accounts for the relative stiffness of the frame (� ;#F to the infilled frame
(��#;�*�F according to the following equation:
; H 1 R � ;#��#;�*� [7-47]
The factor ; determines what part of the lateral load is supported by the frame and what
part by composite action between the infill and the frame (strut action) and thus actually
utilizes the connection capacity.
Substitution of the expressions for B�;�;�+,,Ë and ,Ë given by equations [7-43] and [7-45]
respectively results in:
�;�# H �;�+, D& R '� R 26F7#;& [7-48]
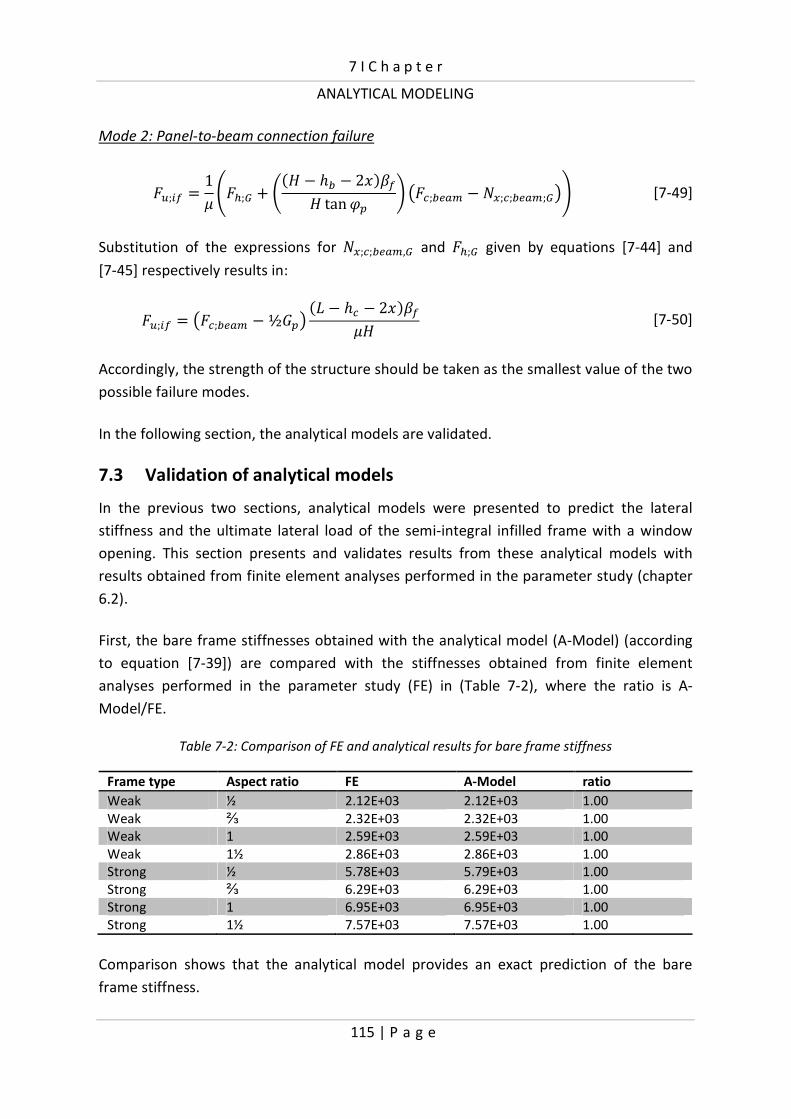
7 I C h a p t e r
ANALYTICAL MODELING
115 | P a g e
Mode 2: Panel-to-beam connection failure
�;�# H 1; Ï ;Ë Z ÍD& R '� R 26F7#& tan<! Î O �;�*�? R B�;�;�*�?;ËPÐ [7-49]
Substitution of the expressions for B�;�;�*�?,Ë and ;Ë given by equations [7-44] and
[7-45] respectively results in:
�;�# H O �;�*�? R½$!P D� R '� R 26F7#;& [7-50]
Accordingly, the strength of the structure should be taken as the smallest value of the two
possible failure modes.
In the following section, the analytical models are validated.
7.3 Validation of analytical models
In the previous two sections, analytical models were presented to predict the lateral
stiffness and the ultimate lateral load of the semi-integral infilled frame with a window
opening. This section presents and validates results from these analytical models with
results obtained from finite element analyses performed in the parameter study (chapter
6.2).
First, the bare frame stiffnesses obtained with the analytical model (A-Model) (according
to equation [7-39]) are compared with the stiffnesses obtained from finite element
analyses performed in the parameter study (FE) in (Table 7-2), where the ratio is A-
Model/FE.
Table 7-2: Comparison of FE and analytical results for bare frame stiffness
Frame type Aspect ratio FE A-Model ratio
Weak ½ 2.12E+03 2.12E+03 1.00
Weak ⅔ 2.32E+03 2.32E+03 1.00
Weak 1 2.59E+03 2.59E+03 1.00
Weak 1½ 2.86E+03 2.86E+03 1.00
Strong ½ 5.78E+03 5.79E+03 1.00
Strong ⅔ 6.29E+03 6.29E+03 1.00
Strong 1 6.95E+03 6.95E+03 1.00
Strong 1½ 7.57E+03 7.57E+03 1.00
Comparison shows that the analytical model provides an exact prediction of the bare
frame stiffness.
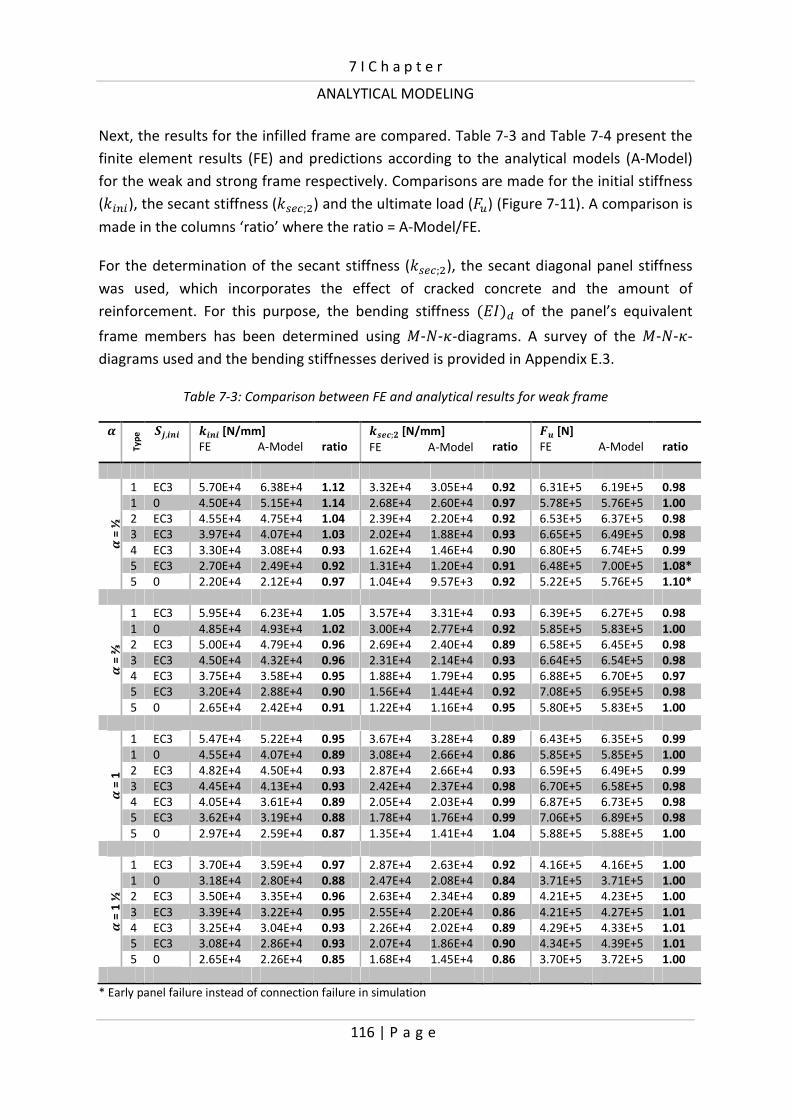
7 I C h a p t e r
ANALYTICAL MODELING
116 | P a g e
Next, the results for the infilled frame are compared. Table 7-3 and Table 7-4 present the
finite element results (FE) and predictions according to the analytical models (A-Model)
for the weak and strong frame respectively. Comparisons are made for the initial stiffness
(����), the secant stiffness (��*�;�) and the ultimate load ( �) (Figure 7-11). A comparison is
made in the columns ‘ratio’ where the ratio = A-Model/FE.
For the determination of the secant stiffness (��*�;�), the secant diagonal panel stiffness
was used, which incorporates the effect of cracked concrete and the amount of
reinforcement. For this purpose, the bending stiffness D�)F= of the panel’s equivalent
frame members has been determined using 0-B-C-diagrams. A survey of the 0-B-C-
diagrams used and the bending stiffnesses derived is provided in Appendix E.3.
Table 7-3: Comparison between FE and analytical results for weak frame
Æ
Ty
pe
}»,��� ���� [N/mm]
FE A-Model
ratio
����;� [N/mm]
FE A-Model
ratio
{z [N]
FE A-Model
ratio
Æ = ½
1 EC3 5.70E+4 6.38E+4 1.12 3.32E+4 3.05E+4 0.92 6.31E+5 6.19E+5 0.98
1 0 4.50E+4 5.15E+4 1.14 2.68E+4 2.60E+4 0.97 5.78E+5 5.76E+5 1.00
2 EC3 4.55E+4 4.75E+4 1.04 2.39E+4 2.20E+4 0.92 6.53E+5 6.37E+5 0.98
3 EC3 3.97E+4 4.07E+4 1.03 2.02E+4 1.88E+4 0.93 6.65E+5 6.49E+5 0.98
4 EC3 3.30E+4 3.08E+4 0.93 1.62E+4 1.46E+4 0.90 6.80E+5 6.74E+5 0.99
5 EC3 2.70E+4 2.49E+4 0.92 1.31E+4 1.20E+4 0.91 6.48E+5 7.00E+5 1.08*
5 0 2.20E+4 2.12E+4 0.97 1.04E+4 9.57E+3 0.92 5.22E+5 5.76E+5 1.10*
Æ = ⅔
1 EC3 5.95E+4 6.23E+4 1.05 3.57E+4 3.31E+4 0.93 6.39E+5 6.27E+5 0.98
1 0 4.85E+4 4.93E+4 1.02 3.00E+4 2.77E+4 0.92 5.85E+5 5.83E+5 1.00
2 EC3 5.00E+4 4.79E+4 0.96 2.69E+4 2.40E+4 0.89 6.58E+5 6.45E+5 0.98
3 EC3 4.50E+4 4.32E+4 0.96 2.31E+4 2.14E+4 0.93 6.64E+5 6.54E+5 0.98
4 EC3 3.75E+4 3.58E+4 0.95 1.88E+4 1.79E+4 0.95 6.88E+5 6.70E+5 0.97
5 EC3 3.20E+4 2.88E+4 0.90 1.56E+4 1.44E+4 0.92 7.08E+5 6.95E+5 0.98
5 0 2.65E+4 2.42E+4 0.91 1.22E+4 1.16E+4 0.95 5.80E+5 5.83E+5 1.00
Æ = 1
1 EC3 5.47E+4 5.22E+4 0.95 3.67E+4 3.28E+4 0.89 6.43E+5 6.35E+5 0.99
1 0 4.55E+4 4.07E+4 0.89 3.08E+4 2.66E+4 0.86 5.85E+5 5.85E+5 1.00
2 EC3 4.82E+4 4.50E+4 0.93 2.87E+4 2.66E+4 0.93 6.59E+5 6.49E+5 0.99
3 EC3 4.45E+4 4.13E+4 0.93 2.42E+4 2.37E+4 0.98 6.70E+5 6.58E+5 0.98
4 EC3 4.05E+4 3.61E+4 0.89 2.05E+4 2.03E+4 0.99 6.87E+5 6.73E+5 0.98
5 EC3 3.62E+4 3.19E+4 0.88 1.78E+4 1.76E+4 0.99 7.06E+5 6.89E+5 0.98
5 0 2.97E+4 2.59E+4 0.87 1.35E+4 1.41E+4 1.04 5.88E+5 5.88E+5 1.00
Æ = 1 ½
1 EC3 3.70E+4 3.59E+4 0.97 2.87E+4 2.63E+4 0.92 4.16E+5 4.16E+5 1.00
1 0 3.18E+4 2.80E+4 0.88 2.47E+4 2.08E+4 0.84 3.71E+5 3.71E+5 1.00
2 EC3 3.50E+4 3.35E+4 0.96 2.63E+4 2.34E+4 0.89 4.21E+5 4.23E+5 1.00
3 EC3 3.39E+4 3.22E+4 0.95 2.55E+4 2.20E+4 0.86 4.21E+5 4.27E+5 1.01
4 EC3 3.25E+4 3.04E+4 0.93 2.26E+4 2.02E+4 0.89 4.29E+5 4.33E+5 1.01
5 EC3 3.08E+4 2.86E+4 0.93 2.07E+4 1.86E+4 0.90 4.34E+5 4.39E+5 1.01
5 0 2.65E+4 2.26E+4 0.85 1.68E+4 1.45E+4 0.86 3.70E+5 3.72E+5 1.00
* Early panel failure instead of connection failure in simulation

7 I C h a p t e r
ANALYTICAL MODELING
117 | P a g e
Table 7-4: Comparison between FE and analytical results for strong frame
Æ
Ty
pe
}»,��� ���� [N/mm]
FE A-Model
ratio
����;� [N/mm]
FE A-Model
ratio
{z [N]
FE A-Model
ratio
Æ = ½
1 EC3 6.75E+4 6.79E+4 1.01 3.74E+4 3.43E+4 0.92 6.92E+5 6.93E+5 1.00
1 0 5.85E+4 5.97E+4 1.02 3.02E+4 2.80E+4 0.93 5.78E+5 5.76E+5 1.00
2 EC3 5.35E+4 5.14E+4 0.96 2.78E+4 2.57E+4 0.93 7.44E+5 7.43E+5 1.00
3 EC3 4.65E+4 4.46E+4 0.96 2.39E+4 2.24E+4 0.94 7.77E+5 7.76E+5 1.00
4 EC3 3.85E+4 3.46E+4 0.90 1.92E+4 1.82E+4 0.95 8.46E+5 8.44E+5 1.00
5 EC3 3.16E+4 2.87E+4 0.91 1.75E+4 1.57E+4 0.90 8.41E+5 9.13E+5 1.09*
5 0 2.47E+4 2.25E+4 0.91 1.13E+4 9.82E+3 0.87 5.37E+5 5.76E+5 1.07*
Æ = ⅔
1 EC3 6.70E+4 6.42E+4 0.96 4.08E+4 3.65E+4 0.89 7.02E+5 7.04E+5 1.00
1 0 5.80E+4 5.54E+4 0.95 3.29E+4 2.95E+4 0.90 5.85E+5 5.83E+5 1.00
2 EC3 5.60E+4 5.06E+4 0.90 3.13E+4 2.76E+4 0.88 7.44E+5 7.54E+5 1.01
3 EC3 5.05E+4 4.62E+4 0.91 2.72E+4 2.52E+4 0.93 7.75E+5 7.77E+5 1.00
4 EC3 4.44E+4 3.91E+4 0.88 2.31E+4 2.17E+4 0.94 8.21E+5 8.21E+5 1.00
5 EC3 3.70E+4 3.24E+4 0.88 1.99E+4 1.83E+4 0.92 8.99E+5 8.89E+5 0.99
5 0 2.90E+4 2.56E+4 0.88 1.38E+4 1.19E+4 0.86 5.81E+5 5.83E+5 1.00
Æ = 1
1 EC3 5.50E+4 5.03E+4 0.91 3.97E+4 3.47E+4 0.87 7.15E+5 7.31E+5 1.02
1 0 4.65E+4 4.15E+4 0.89 3.16E+4 2.70E+4 0.85 5.84E+5 5.85E+5 1.00
2 EC3 4.95E+4 4.46E+4 0.90 3.21E+4 2.94E+4 0.91 7.55E+5 7.68E+5 1.02
3 EC3 4.65E+4 4.17E+4 0.90 2.81E+4 2.69E+4 0.95 7.88E+5 7.91E+5 1.00
4 EC3 4.25E+4 3.74E+4 0.88 2.41E+4 2.37E+4 0.99 8.34E+5 8.30E+5 1.00
5 EC3 3.86E+4 3.39E+4 0.88 2.22E+4 2.13E+4 0.96 8.83E+5 8.72E+5 0.99
5 0 3.08E+4 2.62E+4 0.85 1.72E+4 1.42E+4 0.82 5.88E+5 5.88E+5 1.00
Æ = 1 ½
1 EC3 3.54E+4 3.32E+4 0.94 2.95E+4 2.70E+4 0.92 5.01E+5 5.15E+5 1.03
1 0 2.75E+4 2.48E+4 0.90 2.14E+4 1.89E+4 0.89 3.70E+5 3.71E+5 1.00
2 EC3 3.40E+4 3.17E+4 0.93 2.77E+4 2.50E+4 0.90 5.13E+5 5.32E+5 1.04
3 EC3 3.30E+4 3.09E+4 0.94 2.67E+4 2.39E+4 0.90 5.20E+5 5.43E+5 1.04
4 EC3 3.20E+4 2.97E+4 0.93 2.51E+4 2.26E+4 0.90 5.33E+5 5.58E+5 1.05
5 EC3 3.10E+4 2.86E+4 0.92 2.33E+4 2.14E+4 0.92 5.53E+5 5.76E+5 1.04
5 0 2.30E+4 2.04E+4 0.89 1.55E+4 1.35E+4 0.87 3.72E+5 3.72E+5 1.00
* Early panel failure instead of connection failure in simulation
Figure 7-11: Simulated behavior (solid lines) with analytical prediction (dashed lines)
Comparison shows that the analytical model for lateral stiffness and the model for the
ultimate lateral load provide an adequate prediction of the actual behavior.
0
200
400
600
800
0 5 10 15 20 25
Late
ral l
oa
d [
kN]
Lateral deflection [mm]
Strong frame; α = ½
Sj;ini =flexible
Sj;ini =pinned
Fu
Fu
ksec;2
kini
0
100
200
300
400
500
0 5 10 15 20 25
Late
ral l
oa
d [
kN]
Lateral deflection [mm]
Weak frame; α = 1½
Sj;ini =flexible
Sj;ini =pinned
Fu
Fu
ksec;2
kini

7 I C h a p t e r
ANALYTICAL MODELING
118 | P a g e
7.4 Chapter conclusions
Analytical models have been developed for the lateral stiffness and for the ultimate lateral
load of the semi-integral infilled frame with a window opening. The models are based on
the concept of the equivalent diagonal strut, considering the structure as an equivalent
braced frame system with a compression diagonal replacing the infill.
The load versus deflection response of the equivalent braced frame is represented by a
spring system consisting of a spring representing the bare frame stiffness which acts in
parallel with three serial springs (bracing system) representing the panel, the discrete
interface connections and the frame column. Equations for the four stiffness terms were
derived.
The derived equations for the stiffness terms for the bare frame, the discrete interface
connections and the frame column result from elementary applied mechanics. To obtain
the stiffness term for the diagonal strut, the panel is modeled as an equivalent frame.
Accordingly, the stiffness from bending of the equivalent frame members is derived
according to applied mechanics. A correction factor was introduced to account for the
inconsistency between the panel and its representation as an equivalent frame. Although
inaccurate, considering the panel as an equivalent frame provides the opportunity to take
the effect of cracked concrete into account by using a reduced Young’s modulus.
Accordingly, an initial and secant lateral infilled frame stiffness can be found.
Ultimate lateral load models have been developed based on the assumption that the
panel-to-frame connections govern the strength of the structure. Two failure modes are
recognized, which are panel-to-column connection failure and panel-to-beam connection
failure. Strength equations have been derived for both failure modes. Accordingly, the
strength of the structure is equal to the smallest value of the two possible failure modes.
The analytical models have been compared with the results obtained from finite element
analyses performed in the parameter study. The analytical models showed to provide an
accurate prediction of the actual behavior. An example to demonstrate the feasibility of
the analytical models in design is treated in the next chapter.
119 | P a g e
Chapter 8: DESIGN RECOMMENDATIONS
Scope of the chapter
In this chapter, a design method for structures consisting of semi-integral infilled frames
with window openings is presented (section 8.1). The aim of this method is to get a good
prediction of the internal forces and the lateral deflection in the preliminary phase of the
design, without the use of advanced computer simulations. Subsequently, an example is
treated to demonstrate the application of the design method (section 8.2). Next,
recommendations for the development of the structure into a completely integrated tall
building system are given in sections 8.3, and a building construction method is proposed
for the structure. Finally, at the end of this chapter (section 8.4), the most important
findings are summarized.
8.1 Design method
The design of a high-rise building in the preliminary phase requires a simple design
method in order to make decisions with regard to the approximate dimensions of the
individual structural elements and subsequently to get a good impression of the lateral
deflection (Hoenderkamp, J. C. D. et al., 2000; Hoenderkamp, J. C. D. et al., 2003). For a
building structure consisting of semi-integral infilled frames provided with window
openings, such a design method is not available yet. However, based on the previous
chapters, the following method is proposed:
Step 1: Obtain the internal design forces
To obtain the internal design forces for the semi-integral infilled frame, the
building structure should initially be idealized as a braced frame having
compression diagonals only. In this initial phase, all connections in the braced
frame are assumed to be hinged. Consequently, the design forces for the beams,
columns and struts result from the overall loads on the structure and the
geometry, using simple equations based on applied mechanics.
Step 2: Design the frame members
Having obtained the internal design forces in the structure, the frame members
can be designed for stiffness and strength (including stability) according to
existing standards.

8 I C h a p t e r
DESIGN RECOMMENDATIONS
120 | P a g e
Step 3: Design the frame joints
Having dimensioned the frame members, the frame joints are to be designed.
Design methods for the design of joints are given by e.g. Eurocode 3 in EN 1993-
1-8. The (initial) rotational stiffness of the joint will additionally be needed to
establish the semi-integral infilled frame stiffness in step 6.
Step 4: Design the panel-to-frame connections
Having obtained the design forces for the struts, the panel-to-column and panel
to-beam connections can be designed as follows:
a) Design the connection (position of the bolts on the flanges) and select the
corresponding strength and stiffness characteristic for web with flanges
subject to transverse compression introduced indirectly through the flanges D �©ª«, ��©ª«F from Tables 6-2, 6-3, 6-5 or 6-6.
b) Establish the design force for the panel-to-column and panel-to-beam
connections, according to equations [7-21] and [7-22] respectively.
c) Select the bolt size and bolt grade. The bolt-nut assembly should be designed
for strength according to Alexander’s theory, discussed in section 2.2.2.
d) Check the flange capacity in order to allow a bolt failure mechanism to
govern the strength of the structure. If the flange capacity of the previous
selected frame is insufficient, a larger section should be selected. Instead
backing plates could be added to increase the flange capacity only locally.
e) Establish the effective connection spring stiffness (��;*##) according to
equation [7-25].
Step 5: Design the panels
The required panel reinforcement to fulfill the demanded strength ( !) to allow
bolt failure governing the strength of the structure should be determined by
using the strut-and-tie method. The strut-and-tie model to be used for an infill
panel with panel opening is (schematically) shown in Figure 3-5. Having obtained
the required reinforcement, an initial and secant equivalent diagonal panel
stiffness (�!;��� and �!;�*� ) can be derived according to the method described in
chapter 7. This method is summarized as follows:
a) Model the panel as an equivalent frame
b) Establish the correction factor : according to equation [7-18] by means of
linear elastic finite element analysis
c) Determine the diagonal panel stiffness according to equation [7-20]

8 I C h a p t e r
DESIGN RECOMMENDATIONS
121 | P a g e
Step 6: Determine the stiffness of the single-story, single-bay semi-integral infilled frame
The stiffness of a single-story single-bay semi-integral infilled frame can be
determined according to equation [7-38].
Step 7: Check the strength of the single-story, single-bay semi-integral infilled frame
Having obtained the actual stiffness, a check has to be made for the strength
according to the equations [7-48] and [7-50].
Step 8: Determine the deflection of the total structure
Finally, the deflection of the entire structure is determined. For this purpose, two
stiffnesses have to be taken into account. The first one is the global bending
stiffness for bending due to axial strains in the columns. Here, the individual
bending stiffness of the columns is ignored. The second stiffness is the lateral
(shear) stiffness of the infilled frames. Furthermore, the deflection resulting from
rotation of the foundation has to be considered. The deflection for bending
added to the deflection for shear and the deflection resulting from rotation of the
foundation gives the total deflection of the structure. Finally, a check has to be
made for the total deflection of the structure to comply with the serviceability
limit state requirements. Generally, the maximum allowable lateral displacement
is taken as 1/500 times the height of the structure.
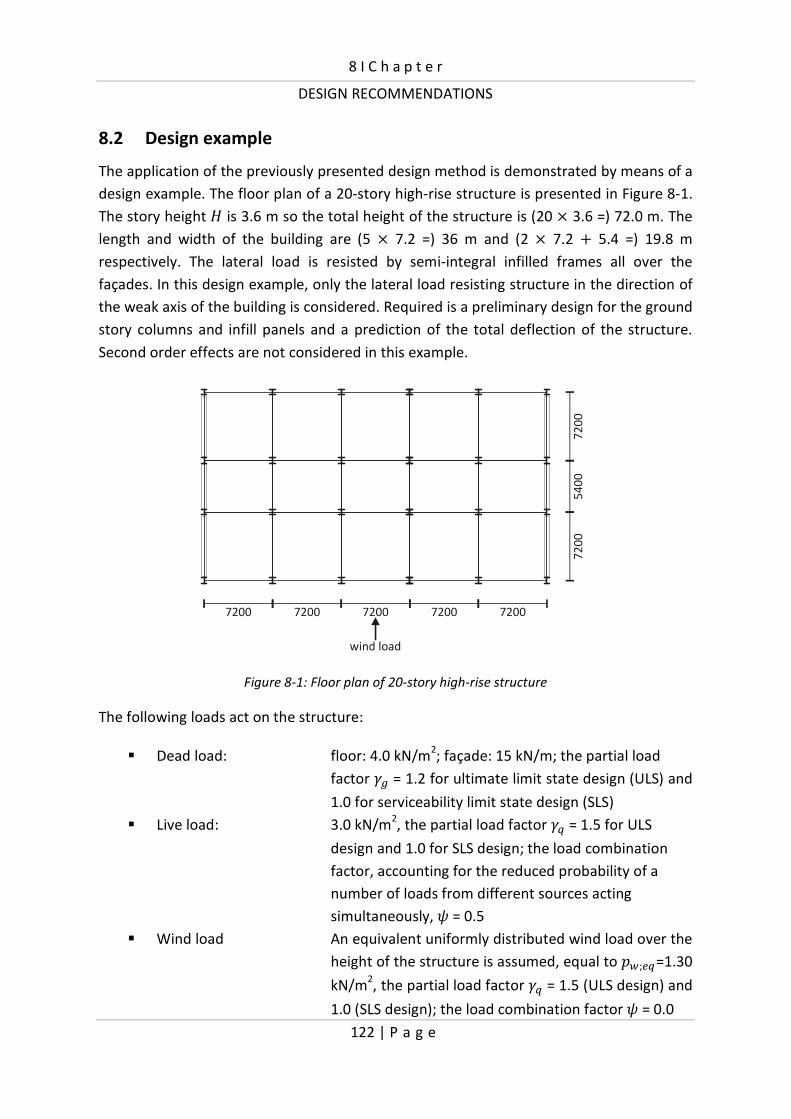
8 I C h a p t e r
DESIGN RECOMMENDATIONS
122 | P a g e
8.2 Design example
The application of the previously presented design method is demonstrated by means of a
design example. The floor plan of a 20-story high-rise structure is presented in Figure 8-1.
The story height & is 3.6 m so the total height of the structure is (20 Q 3.6 =) 72.0 m. The
length and width of the building are (5 Q 7.2 =) 36 m and (2 Q 7.2 Z 5.4 =) 19.8 m
respectively. The lateral load is resisted by semi-integral infilled frames all over the
façades. In this design example, only the lateral load resisting structure in the direction of
the weak axis of the building is considered. Required is a preliminary design for the ground
story columns and infill panels and a prediction of the total deflection of the structure.
Second order effects are not considered in this example.
Figure 8-1: Floor plan of 20-story high-rise structure
The following loads act on the structure:
� Dead load: floor: 4.0 kN/m2; façade: 15 kN/m; the partial load
factor 8� = 1.2 for ultimate limit state design (ULS) and
1.0 for serviceability limit state design (SLS)
� Live load: 3.0 kN/m2, the partial load factor 8Ñ = 1.5 for ULS
design and 1.0 for SLS design; the load combination
factor, accounting for the reduced probability of a
number of loads from different sources acting
simultaneously, Ò = 0.5
� Wind load An equivalent uniformly distributed wind load over the
height of the structure is assumed, equal to �5;*Ñ=1.30
kN/m2, the partial load factor 8Ñ = 1.5 (ULS design) and
1.0 (SLS design); the load combination factor Ò = 0.0
7200 7200 7200 7200 7200
72
00
72
00
54
00
wind load
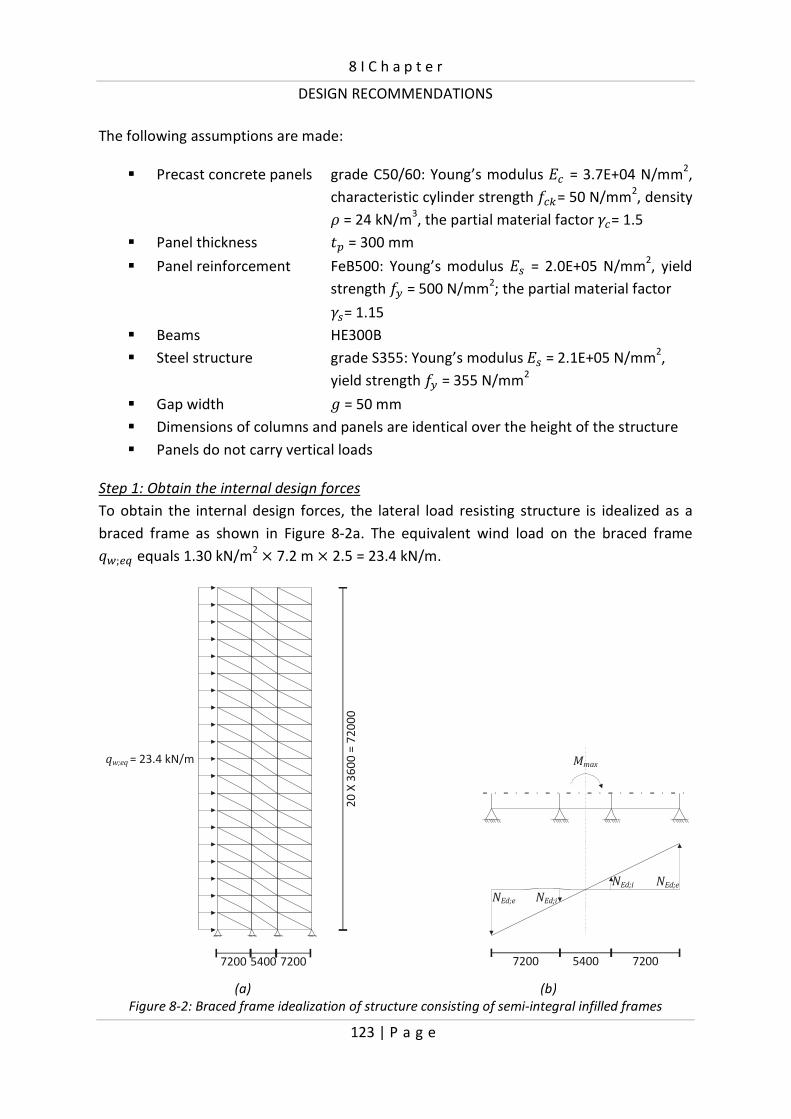
8 I C h a p t e r
DESIGN RECOMMENDATIONS
123 | P a g e
The following assumptions are made:
� Precast concrete panels grade C50/60: Young’s modulus �� = 3.7E+04 N/mm2,
characteristic cylinder strength ��>= 50 N/mm2, density
Ó = 24 kN/m3, the partial material factor 8�= 1.5
� Panel thickness 4! = 300 mm
� Panel reinforcement FeB500: Young’s modulus �� = 2.0E+05 N/mm2, yield
strength �� = 500 N/mm2; the partial material factor
8�= 1.15
� Beams HE300B
� Steel structure grade S355: Young’s modulus �� = 2.1E+05 N/mm2,
yield strength �� = 355 N/mm2
� Gap width % = 50 mm
� Dimensions of columns and panels are identical over the height of the structure
� Panels do not carry vertical loads
Step 1: Obtain the internal design forces
To obtain the internal design forces, the lateral load resisting structure is idealized as a
braced frame as shown in Figure 8-2a. The equivalent wind load on the braced frame Ô5;*Ñ equals 1.30 kN/m2 Q 7.2 m Q 2.5 = 23.4 kN/m.
(a) (b)
Figure 8-2: Braced frame idealization of structure consisting of semi-integral infilled frames
20
X 3
60
0 =
72
00
0
7200 72005400
q eq w; = 23.4 kN/m
7200 72005400
NEd;i
NEd;i
NEd;e
NEd;e
Mmax

8 I C h a p t e r
DESIGN RECOMMENDATIONS
124 | P a g e
The axial forces in the columns and diagonals are derived using simple equations based on
applied mechanics as follows:
� Ultimate axial forces in the columns
Axial force in the columns due to wind load:
0?�� H Ô5;*Ñ8Ñ&�2 H 23.4 Q 1.5 Q 72�
2 H 9.10 Q 10e kNm
This moment is supported by axial forces in the exterior columns (B´=;*) and the interior
columns (B´=;�) (Figure 8-2b). The axial forces in the columns are assumed linearly related
to the distance to the neutral axis of the braced frame. Consequently, it can be shown that
the normal force in the exterior column B´=;* equals:
B´=;* H B´=;�D2.7 Z 7.2F2.7 H �� B´=;� Accordingly the axial forces in the columns due to the wind load are equal to:
B´=;*;5��= H 9.10 Q 10eO5.4 Q �� Z 19.8P H 4277 kN
B´=;�;5��= H �� Q 4277 H 1166 kN
The axial force in an exterior ground floor (façade) column due to vertical loads equals:
Contributory area: 3.6 Q 3.6 = 12.96 m2
Dead load �: 12.96 Q 4.0 + 7.2 Q 15 = 159.8 kN
Live load Ñ: 12.96 Q 3.0 = 38.9 kN
B´=;*;�*.� H 20O8� �P Z 20O8ÑÒ ÑP
B´=;*;�*.� H 20D1.2 Q 159.8F Z 20D1.5 Q 0.5 Q 38.9F H 4419 kN
The ultimate axial force in the column including wind load equals:
B´=;*;�*.�×5��= H 4419 Z 4277 H 8696 kN
The axial force in an interior ground floor (façade) column due to the vertical loads equals:
Contributory area: 3.6 Q 6.3 = 22.68 m2
Dead load �: 22.68 Q 4.0 + 6.3 Q 15 = 185.2 kN
Live load Ñ: 22.68 Q 3.0 = 68.0 kN
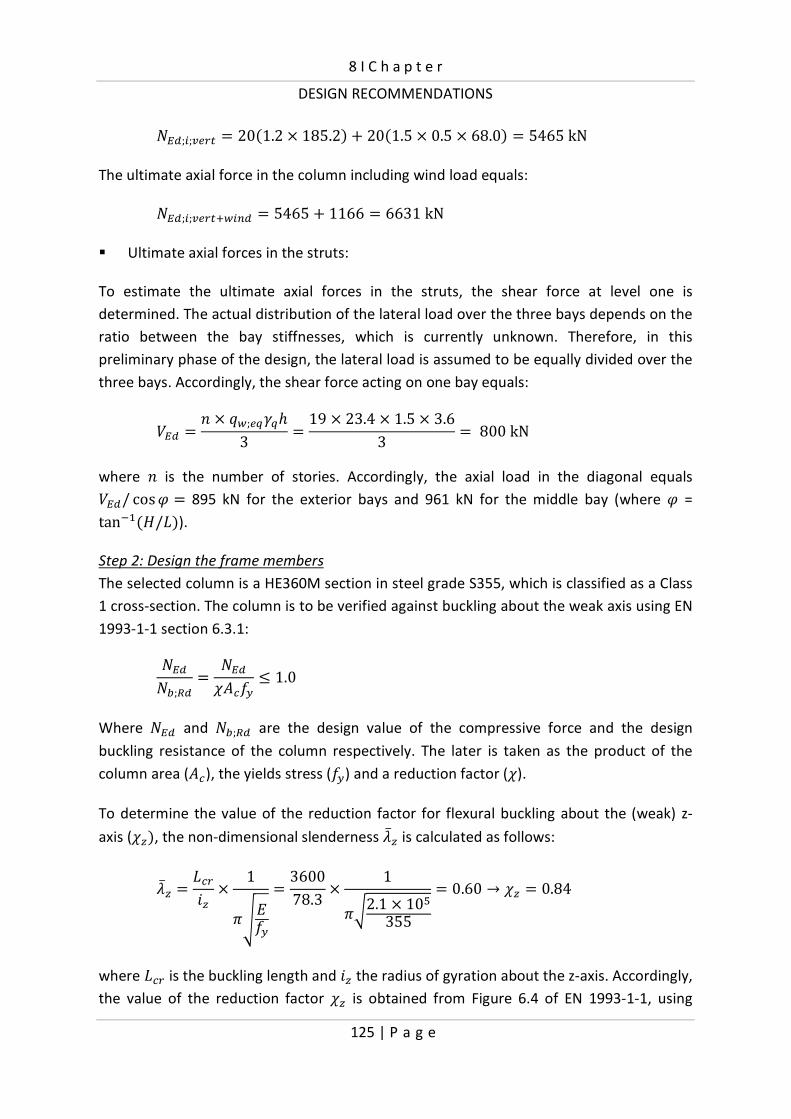
8 I C h a p t e r
DESIGN RECOMMENDATIONS
125 | P a g e
B´=;�;�*.� H 20D1.2 Q 185.2F Z 20D1.5 Q 0.5 Q 68.0F H 5465 kN
The ultimate axial force in the column including wind load equals:
B´=;�;�*.�×5��= H 5465 Z 1166 H 6631 kN
� Ultimate axial forces in the struts:
To estimate the ultimate axial forces in the struts, the shear force at level one is
determined. The actual distribution of the lateral load over the three bays depends on the
ratio between the bay stiffnesses, which is currently unknown. Therefore, in this
preliminary phase of the design, the lateral load is assumed to be equally divided over the
three bays. Accordingly, the shear force acting on one bay equals:
v́ = H Ø Q Ô5;*Ñ8Ñ'3 H 19 Q 23.4 Q 1.5 Q 3.63 H 800 kN
where Ø is the number of stories. Accordingly, the axial load in the diagonal equals v́ =/ cos < H 895 kN for the exterior bays and 961 kN for the middle bay (where < = tani�D&/�F).
Step 2: Design the frame members
The selected column is a HE360M section in steel grade S355, which is classified as a Class
1 cross-section. The column is to be verified against buckling about the weak axis using EN
1993-1-1 section 6.3.1:
B´=B�;Ù= H B´=����� g 1.0
Where B´= and B�;Ù= are the design value of the compressive force and the design
buckling resistance of the column respectively. The later is taken as the product of the
column area (��), the yields stress (��) and a reduction factor (�).
To determine the value of the reduction factor for flexural buckling about the (weak) z-
axis (� F, the non-dimensional slenderness KÚ is calculated as follows:
KÚ H ��.� Q 1IL���
H 360078.3 Q 1IÛ2.1 Q 10�355
H 0.60 Ü � H 0.84
where ��. is the buckling length and � the radius of gyration about the z-axis. Accordingly,
the value of the reduction factor � is obtained from Figure 6.4 of EN 1993-1-1, using
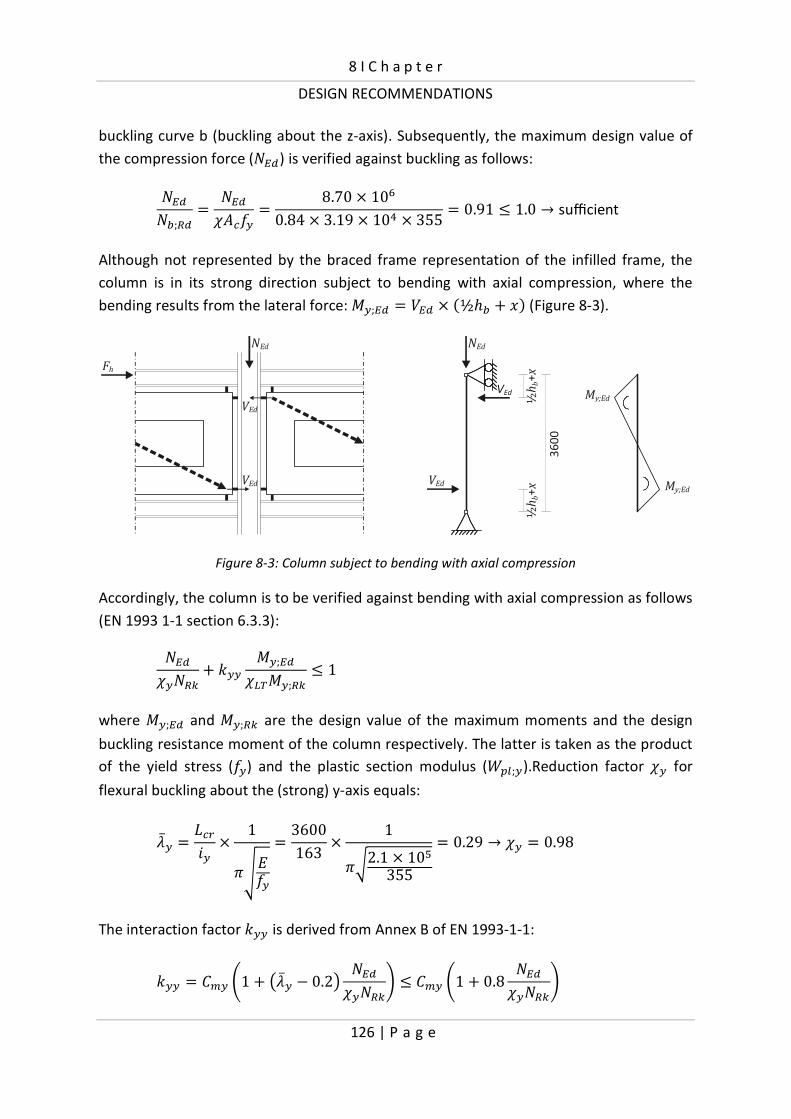
8 I C h a p t e r
DESIGN RECOMMENDATIONS
126 | P a g e
buckling curve b (buckling about the z-axis). Subsequently, the maximum design value of
the compression force (B´=) is verified against buckling as follows:
B´=B�;Ù= H B´=����� H 8.70 Q 10�0.84 Q 3.19 Q 10e Q 355 H 0.91 g 1.0 Ü sufficient
Although not represented by the braced frame representation of the infilled frame, the
column is in its strong direction subject to bending with axial compression, where the
bending results from the lateral force: 0�;´= H v́ = Q D½'� Z 6F (Figure 8-3).
Figure 8-3: Column subject to bending with axial compression
Accordingly, the column is to be verified against bending with axial compression as follows
(EN 1993 1-1 section 6.3.3):
B´=��BÙ> Z ��� 0�;´=�ÝÞ0�;Ù> g 1
where 0�;´= and 0�;Ù> are the design value of the maximum moments and the design
buckling resistance moment of the column respectively. The latter is taken as the product
of the yield stress (��) and the plastic section modulus (ß!,;�).Reduction factor �� for
flexural buckling about the (strong) y-axis equals:
K� H ��.�� Q 1IL���
H 3600163 Q 1IÛ2.1 Q 10�355
H 0.29 Ü �� H 0.98
The interaction factor ��� is derived from Annex B of EN 1993-1-1:
��� H �?� Í1 Z OKÚ� R 0.2P B´=��BÙ>Î g �?� Í1 Z 0.8 B´=��BÙ>Î
VEd
VEd
NEd
36
00
My;Ed
My;Ed
½h
b+
x½
hb+
xFh
VEd
VEd
NEd

8 I C h a p t e r
DESIGN RECOMMENDATIONS
127 | P a g e
The equivalent uniform moment factor �?� is derived from Table B.3 of EN 1993-1-1:
�?� H 0.6 Z 0.4Ò h 0.4 where Ò = -1
Accordingly,
�?� H 0.4
��� H 0.4 Í1 Z D0.29 R 0.2F 8.70 Q 10�0.98 Q 1.13 Q 10¦Îg 0.4 Í1 Z 0.8 8.70 Q 10�0.98 Q 1.13 Q 10¦Î
��� H 0.43
Subsequently, the maximum design value of the compression force and bending moment
are verified against buckling as follows:
8.70 Q 10�0.98 Q 1.13 Q 10¦ Z 0.43 Q 2.10 Q 10�1.0 Q 1.77 Q 10� H 0.84 g 1.0 Ü sufficient
Having dimensioned the frame members, the panel dimensions result from the frame
member heights ('� = 395 and '� = 300 mm) and the gap width % = 50 mm. Accordingly,
the panel dimensions / Q ' are 6705 Q 3200 mm and 4905 Q 3200 mm for the exterior
and interior bay respectively.
Step 3: Design the frame joints
A complete frame joint design is not considered in this example. Design rules for frame
joints can be found in e.g. Eurocode 3 EN 1993-1-8. For this example, an initial joint
stiffness (31,���) is estimated using design equation [6-3]. A bolted end plate connection is
assumed (�� =11.5), with a lever arm (centre of compression to the bolt row in tension) µ
= 200 mm. This gives the following initial rotational stiffness for the frame joints:
31,��� H �µ�4#�� H 2.1 Q 10� Q 200� Q 4011.5 H 29.2 Q 10 kNm/rad
This rotational stiffness will be needed to establish the infilled frame stiffness in step 6.
Step 4: Design the panel-to-frame connections
a) Design the connection
The position of the bolts on the flanges is taken ® H 6 / � = ⅜. Accordingly the distance 6
for the columns and beams (� = 300 mm) equals 112.5 mm. Subsequently, the

8 I C h a p t e r
DESIGN RECOMMENDATIONS
128 | P a g e
characteristics for the HE300B section for ® = ⅜ are taken from Table 6-3 and shown in
Table 8-1. The HE360M characteristics were derived performing a numerical simulation for
that section with the finite element discussed in section 5.1.
Table 8-1: Used characteristics for sections subject to transverse compression
Section ���ª� [kN/m] {��ª�[kN]
HE300B 7.29E+05 589
HE360M 37.4E+05 1501
b) Estimate the design force for the panel-to-frame connections
Having obtained the maximum lateral load acting on a single-story, single-bay infilled
frame (v́ =), the load that acts on the panel-to-column and panel-to-beam connection can
be derived using equations [7-21] and [7-22]:
� For the exterior bays:
7# H �� R '� H 72007200 R 395 H 1.06
B�;�;�+, H v́ =&D& R '� R 26F7# H 800 Q 3600D3600 R 300 R 225F1.06 H 885 kN
B�;�;�*�? H B�;�;�+, tan<! H 414kN
� For the interior bay:
7# H �� R '� H 54005400 R 395 H 1.08
B�;�;�+, H v́ = &D& R '� R 26F7# H 800 3600D3600 R 300 R 225F1.08 H 868 kN
B�;�;�*�? H B�;�;�+, tan<! H 559kN
Thus, the maximum panel-to-column and panel-to-beam connection forces equal 885 kN
and 559 kN respectively.
c) Select the bolt size and bolt grade
8.8M30 bolts with grade 8 nuts are selected to construct the connection. For this bolt-nut
assembly, the stripping strength is determined according to Alexander’s theory (see
chapter 2.2). The shear areas of the bolt (���) and nut threads (���) equal:

8 I C h a p t e r
DESIGN RECOMMENDATIONS
129 | P a g e
��� H I���� Y�2 Z 1√3 D�� R �F\ ��� H I Q 22.5 Q 26.2113.5 Q Y3.52 Z 1√3 D27.727 R 26.211F\ H 1389.7 mm2 ��� H I���� Y�2 Z 1√3 D� R �F\ ��� H I Q 22.5 Q 30.0003.5 Q Y3.52 Z 1√3 D30.000 R 27.727F\ H 1855.4 mm2
Reduction factors �� to �:
�� H R`�a� Z 3.8 `�a R 2.61 H Rl4630m
� Z 3.8 l4630m R 2.61 H 0.87
d� H ������������ H 800 Q 1855.4800 Q 1389.7 H 1.34
�� H 5.594 R 13.682d� Z 14.107d��R6.057d� Z 0.9353d�e H 1.03
� H 0.897
Accordingly, the bolt ( ��) and nut ( ��) thread stripping strengths are:
�� H ���√3 ������� H 640√3 Q 1389.7 Q 0.87 Q 1.03 H 460 kN
�� H ���√3 ������ H 640√3 Q 1855.4 Q 0.87 Q 0.897 H 535 kN
Bolt thread stripping failure governs the strength of the bolt-nut assembly. The strength of
two bolts equals 2 ��= 920 kN which is larger than the maximum panel-to-column force
(B�;�;�+,): B�;�;�+,2 �� H 885920 H 0.96 g 1.0 Ü sufficient
d) Check the flange capacity
To allow bolt failure governing the strength of the structure, the flange capacity (as
defined in chapter 6) of the previous selected column ( �;�+,) must be larger than the
capacity of the two bolts:

8 I C h a p t e r
DESIGN RECOMMENDATIONS
130 | P a g e
�;�+,2 �� H 1501920 H 1.63 h 1.0 Ü sufficient
Finally, the flange capacity of the beam ( �;�*�?) is checked against the maximum panel-
to-beam connection force (B�;�;�*�?) as follows:
B�;�;�*�? �;�*�? H 559589 H 0.95 g 1.0 Ü sufficient
Because the margin on the panel-to-beam connection is larger than the margin on the
panel-to-column connection (0.95 and 0.96 respectively), bolt failure of the panel-to-
column connection will govern the strength of the structure, although the difference is
only marginal. Backing plates should be applied to increase the beam flange capacity, in
order to guarantee the bolts of the panel-to-column connection to govern the strength.
e) Determine the effective connection stiffness
Subsequently, the effective panel-to-frame connection stiffness (��,*##) according to
equation [7-25] is calculated, which includes, in addition to the initial spring stiffness
(��;���), stiffness coefficients for shear (��;É) and bending deformation (��;Å).
The initial connection stiffness consists of two components which are the flange with web
stiffness (��©ª«) and the bolt with cap stiffness (��¬ªN). The flange with web stiffness is
given in Table 8-1. The bolt with cap stiffness is predicted using the experimentally
determined stiffness for a M24 bolt with cap as follows:
O��¬ªNPÅk H ��;Åk��;Å�e Q O��¬ªNPÅ�e H 561353 Q 6.0 Q 10� H 9.5 Q 10� kN/m
Accordingly, the initial panel-to-beam connection stiffness equals (using equation [7-26]):
��;���;�*�? H ¨ 1��©ª« Z12��¬ªN
i� H Y 17.29 Q 10� Z 12 Q 9.5 Q 10�\i�
H 5.27 Q 10� kN/m
and the initial panel-to-column connection spring stiffness:
��;���;�+, H Y 137.4 Q 10� Z 12 Q 9.5 Q 10�\i� H 1.26 Q 10� kN/m
The stiffness coefficient resulting from shear deformation for the panel-to-beam
connection given by equation [7-27]:

8 I C h a p t e r
DESIGN RECOMMENDATIONS
131 | P a g e
��;É;�*�? H $��;�D� R '�FD� R '� R 6F6 H 8.08 Q 10e Q 4743 Q D7200 R 395FD7200 R 395 R 112.5F112.5H 3.46 Q 10� kN/m
The stiffness coefficient resulting from shear deformation for the panel-to-column
connection is given by equation [7-28]:
��;É;�+, H $��;�D& R '�FD& R '� R 6F6 H 8.08 Q 10e Q 10240 Q D3600 R 300FD3600 R 300 R 112.5F112.5H 3.92 Q 10� kN/m
The stiffness coefficient resulting from bending deformation is considered negligible (31 ≠
0). Accordingly, the effective panel-to-column and panel-to-frame connection stiffness is:
��,*##;�*�? H 1��;���;�*�? Z 1��;É;�*�? H Y 15.27 Q 10� Z 13.46 Q 10�\i�
H 4.57 Q 10�kN/m
��,*##;�+, H 1��;���;�+, Z 1��;É;�+, H Y 11.26 Q 10� Z 13.92 Q 10�\i�
H 9.53 Q 10� kN/m
Step 5: Design the panels
The required amount of reinforcement to provide the demanded strength such that bolt
failure governs the strength ( ! > 920 kN) is determined with the strut-and-tie method.
Figure 8-4 shows the panels with the strut-and-tie models (struts 1 to 10, ties 11 to 18 and
nodes A to J) for the middle and exterior bays. The distance from the nodes to panel edges
is taken 75 mm. The strut-and-tie models are analyzed elastically to find the internal
forces in the individual members. Subsequently, the material properties of the struts,
nodes and ties are determined and the dimensions of the struts and nodes are evaluated.
a) Interior bay b) Exterior bay
Figure 8-4: Infill panels with strut-and-tie models
5200 7507503400 750750
15
50
75
09
00
7
3
1
2
45
6
8
9
10
11 15 17 13
12
16
14
18
A
B
H J
G
F
EDI
C
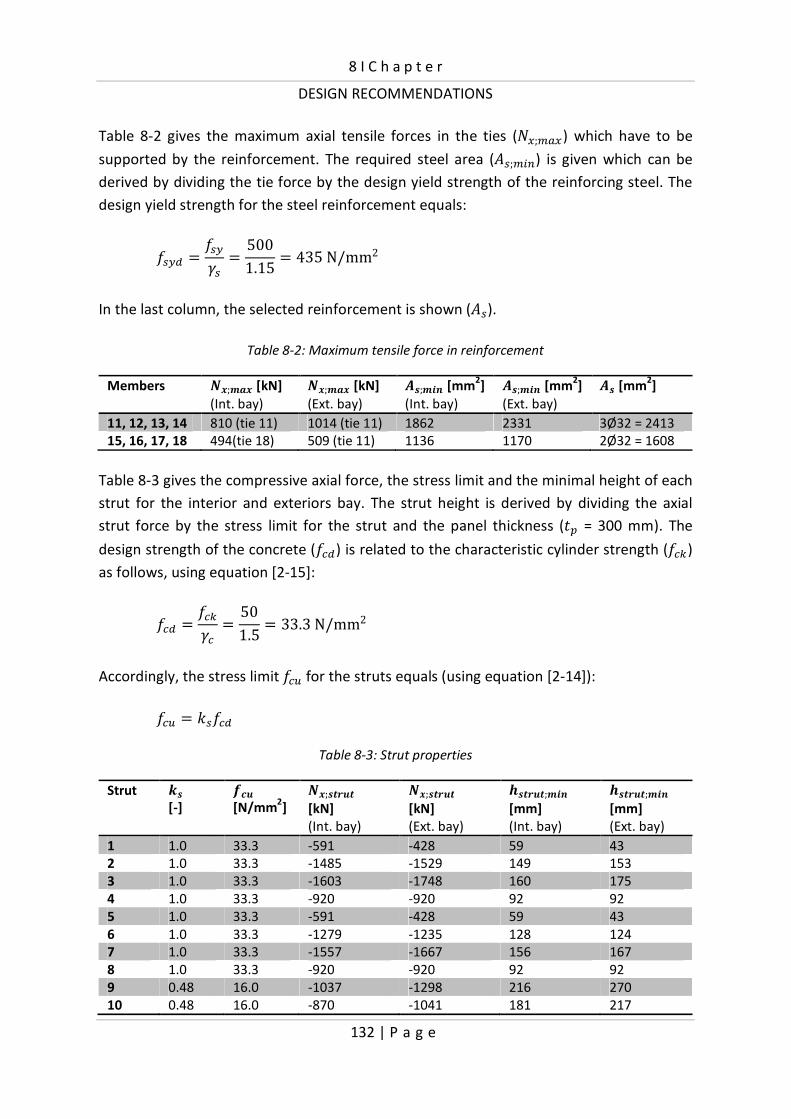
8 I C h a p t e r
DESIGN RECOMMENDATIONS
132 | P a g e
Table 8-2 gives the maximum axial tensile forces in the ties (B�;?��) which have to be
supported by the reinforcement. The required steel area (��;?��) is given which can be
derived by dividing the tie force by the design yield strength of the reinforcing steel. The
design yield strength for the steel reinforcement equals:
���= H ���8� H 5001.15 H 435 N/mm2
In the last column, the selected reinforcement is shown (��).
Table 8-2: Maximum tensile force in reinforcement
Members â¼;¹�¼ [kN]
(Int. bay)
â¼;¹�¼ [kN]
(Ext. bay)
º�;¹�� [mm2]
(Int. bay)
º�;¹�� [mm2]
(Ext. bay)
º� [mm2]
11, 12, 13, 14 810 (tie 11) 1014 (tie 11) 1862 2331 3Ø32 = 2413
15, 16, 17, 18 494(tie 18) 509 (tie 11) 1136 1170 2Ø32 = 1608
Table 8-3 gives the compressive axial force, the stress limit and the minimal height of each
strut for the interior and exteriors bay. The strut height is derived by dividing the axial
strut force by the stress limit for the strut and the panel thickness (4! = 300 mm). The
design strength of the concrete (��=) is related to the characteristic cylinder strength (��>)
as follows, using equation [2-15]:
��= H ��>8� H 501.5 H 33.3 N/mm2
Accordingly, the stress limit ��� for the struts equals (using equation [2-14]):
��� H ����=
Table 8-3: Strut properties
Strut ��
[-]
w�z
[N/mm2]
â¼;��±z� [kN]
(Int. bay)
â¼;��±z� [kN]
(Ext. bay)
¯��±z�;¹��
[mm]
(Int. bay)
¯��±z�;¹��
[mm]
(Ext. bay)
1 1.0 33.3 -591 -428 59 43
2 1.0 33.3 -1485 -1529 149 153
3 1.0 33.3 -1603 -1748 160 175
4 1.0 33.3 -920 -920 92 92
5 1.0 33.3 -591 -428 59 43
6 1.0 33.3 -1279 -1235 128 124
7 1.0 33.3 -1557 -1667 156 167
8 1.0 33.3 -920 -920 92 92
9 0.48 16.0 -1037 -1298 216 270
10 0.48 16.0 -870 -1041 181 217
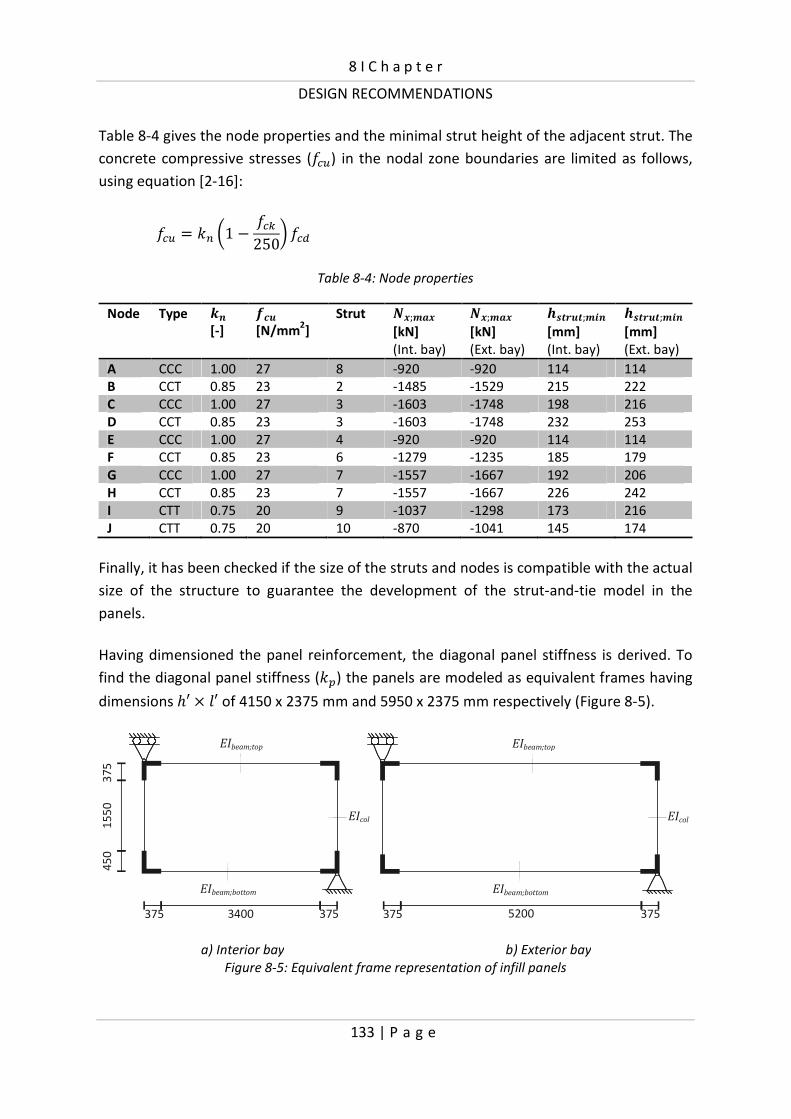
8 I C h a p t e r
DESIGN RECOMMENDATIONS
133 | P a g e
Table 8-4 gives the node properties and the minimal strut height of the adjacent strut. The
concrete compressive stresses (���) in the nodal zone boundaries are limited as follows,
using equation [2-16]:
��� H �� l1 R ��>250m ��=
Table 8-4: Node properties
Node Type ��
[-]
w�z
[N/mm2]
Strut â¼;¹�¼
[kN]
(Int. bay)
â¼;¹�¼
[kN]
(Ext. bay)
¯��±z�;¹��
[mm]
(Int. bay)
¯��±z�;¹��
[mm]
(Ext. bay)
A CCC 1.00 27 8 -920 -920 114 114
B CCT 0.85 23 2 -1485 -1529 215 222
C CCC 1.00 27 3 -1603 -1748 198 216
D CCT 0.85 23 3 -1603 -1748 232 253
E CCC 1.00 27 4 -920 -920 114 114
F CCT 0.85 23 6 -1279 -1235 185 179
G CCC 1.00 27 7 -1557 -1667 192 206
H CCT 0.85 23 7 -1557 -1667 226 242
I CTT 0.75 20 9 -1037 -1298 173 216
J CTT 0.75 20 10 -870 -1041 145 174
Finally, it has been checked if the size of the struts and nodes is compatible with the actual
size of the structure to guarantee the development of the strut-and-tie model in the
panels.
Having dimensioned the panel reinforcement, the diagonal panel stiffness is derived. To
find the diagonal panel stiffness (�!) the panels are modeled as equivalent frames having
dimensions '( Q /( of 4150 x 2375 mm and 5950 x 2375 mm respectively (Figure 8-5).
a) Interior bay b) Exterior bay
Figure 8-5: Equivalent frame representation of infill panels
52003400375 375 375 375
15
50
37
54
50
EIbeam;top
EIbeam;bottom
EIcol
EIbeam;top
EIbeam;bottom
EIcol
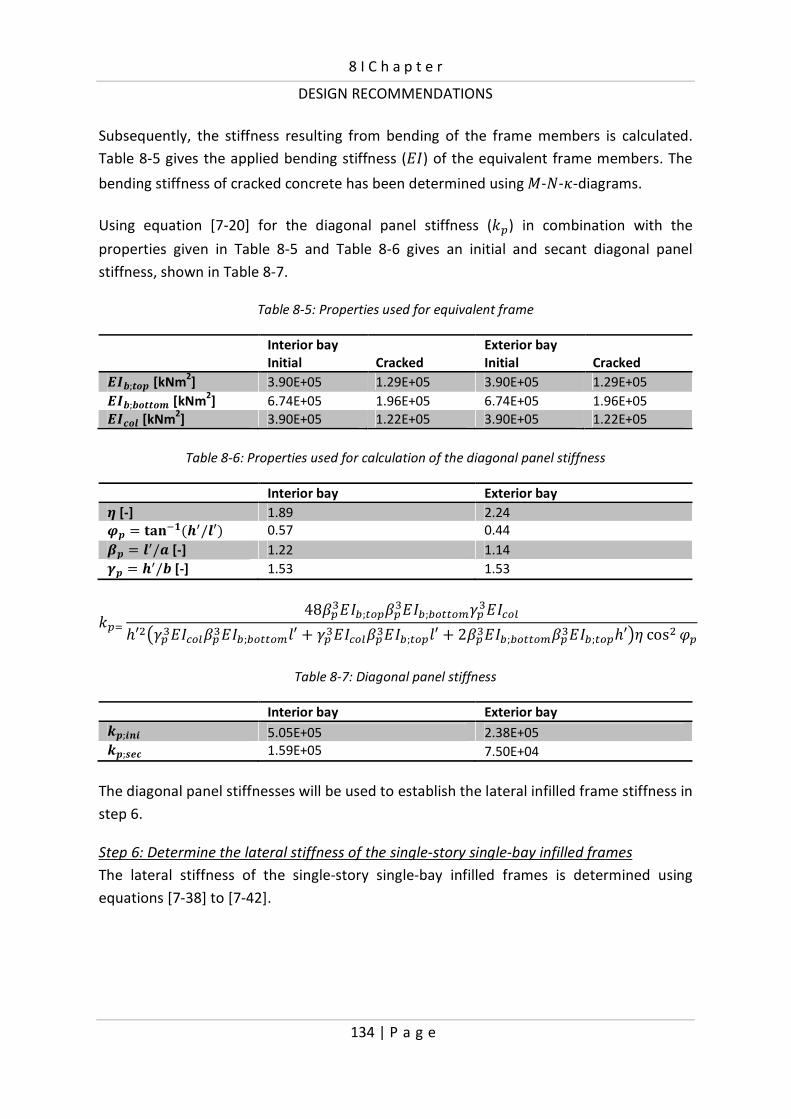
8 I C h a p t e r
DESIGN RECOMMENDATIONS
134 | P a g e
Subsequently, the stiffness resulting from bending of the frame members is calculated.
Table 8-5 gives the applied bending stiffness (��) of the equivalent frame members. The
bending stiffness of cracked concrete has been determined using �-�-�-diagrams.
Using equation [7-20] for the diagonal panel stiffness (��) in combination with the
properties given in Table 8-5 and Table 8-6 gives an initial and secant diagonal panel
stiffness, shown in Table 8-7.
Table 8-5: Properties used for equivalent frame
Interior bay
Initial
Cracked
Exterior bay
Initial
Cracked
�; �� [kNm2] 3.90E+05 1.29E+05 3.90E+05 1.29E+05
�;�� �� [kNm2] 6.74E+05 1.96E+05 6.74E+05 1.96E+05
��� [kNm2] 3.90E+05 1.22E+05 3.90E+05 1.22E+05
Table 8-6: Properties used for calculation of the diagonal panel stiffness
Interior bay Exterior bay
� [-] 1.89 2.24
�� � ��������/�� 0.57 0.44
!� � ��/" [-] 1.22 1.14
#� � ��/� [-] 1.53 1.53
��$48'�
(��);*+�'�(��);)+**+,-�(��.+/
0�12-�(��.+/'�(��);)+**+,3� 4 -�(��.+/'�
(��);*+�3� 4 2'�(��);)+**+,'�
(��);*+�0�67 cos1 ;�
Table 8-7: Diagonal panel stiffness
Interior bay Exterior bay
<�;=>= 5.05E+05 2.38E+05
<�;?@� 1.59E+05 7.50E+04
The diagonal panel stiffnesses will be used to establish the lateral infilled frame stiffness in
step 6.
Step 6: Determine the lateral stiffness of the single-story single-bay infilled frames
The lateral stiffness of the single-story single-bay infilled frames is determined using
equations [7-38] to [7-42].

8 I C h a p t e r
DESIGN RECOMMENDATIONS
135 | P a g e
� Interior bay:
Frame: � = 5400 mm; &=3600 mm; tan <# H &/� =0.59; ���.�� = �/ cos<#=6490 mm
Panel: / = 4900 mm; ' = 3200 mm; tan<! H '// = 0.57; /��.�� = �/ cos<! = 5679 mm
Beams HE300B: )� = 2.52E+08 mm4; '� = 300 mm; �� = 1.49E+04 mm
2;
��;� = 4.74E+03 mm2
Columns HE360M: )� = 8.49E+08 mm4; '� = 395 mm; �� = 3.19E+04 mm
2;
��;� = 1.02E+04 mm2 31 = 29.2E+10
9 Nmm/rad 6 = 112.5 mm 7# H �/D� R '�F = 1.08 8# H &/D& R '�F = 1.09
� ;# H ¨ �&�24�7#)� Z
&24�8#)� Z
&�47#�31 Z
�2�7#�� Z& tan� <#2�8#�� Z &2$8#��;�Z & tan<#2$7#��;�
i� H 6.45 Q 10 kN/m
� ;!;��� H �!;���cos<# cos<!/��.��D& R '� R 26F7#&���.�� H 2.85 Q 10� kN/m
� ;!;�*� H �!;�*�cos<# cos<!/��.��D& R '� R 26F7#&���.�� H 8.95 Q 10e kN/m
� ;-�+� H ��;*##;�*�?��;*##;�+,/��.��D& R '� R 26F7#2&���.��O��;*##;�*�? Z ��;*##;�+,tan <! tan <#P H 2.03 Q 10� kN/m
� ;�+, H ���D� R '�FD& R '� R 26F7#&� tan <! tan <# D� R '� R 6F H 4.08 Q 10� kN/m
��# H � ;# Z ¨ 1� ;! Z 1� ;-�+� Z 1� ;�+,i�
��w;��� H 6.45 Q 10 Z Y 12.85 Q 10� Z 12.03 Q 10� Z 14.08 Q 10�\i�
H �. �� Q �êë kNkNkNkN////mmmm
��w;��� H 6.45 Q 10 Z Y 18.95 Q 10e Z 12.03 Q 10� Z 14.08 Q 10�\i�
H ì. íì Q �êî kNkNkNkN////mmmm

8 I C h a p t e r
DESIGN RECOMMENDATIONS
136 | P a g e
� Exterior bays:
Frame: � = 7200 mm; &=3600 mm; tan <# H &/� =0.46; ���.�� = �/ cos<#=8050 mm
Panel: / = 6700 mm; ' = 3200 mm; tan<! H '// = 0.44; /��.�� = �/ cos<! = 7259 mm
Beams HE300B: )� = 2.52E+08 mm4; '� = 300 mm; �� = 1.49E+04 mm
2;
��;� = 4.74E+03 mm2
Columns HE360M: )� = 8.49E+08 mm4; '� = 395 mm; �� = 3.19E+04 mm
2;
��;� = 1.02E+04 mm2 31 = 29.2E+10
9 Nmm/rad 6 = 112.5 mm 7# H �/D� R '�F = 1.06 8# H &/D& R '�F = 1.09
� ;# H ¨ �&�24�7#)� Z
&24�8#)� Z
&�47#�31 Z
�2�7#�� Z& tan� <#2�8#�� Z &2$8#��;�Z & tan<#2$7#��;�
i� H 5.66 Q 10 kN/m
� ;!;��� H �!;���cos<# cos<!/��.��D& R '� R 26F7#&���.�� H 1.57 Q 10� kN/m
� ;!;�*� H �!;�*�cos<# cos<!/��.��D& R '� R 26F7#&���.�� H 4.95 Q 10e kN/m
� ;-�+� H ��;*##;�*�?��;*##;�+,/��.��D& R '� R 26F7#2&���.��O��;*##;�*�? Z ��;*##;�+,tan <! tan <#P H 2.61 Q 10� kN/m
� ;�+, H ���D� R '�FD& R '� R 26F7#&� tan <! tan <# D� R '� R 6F H 7.31 Q 10� kN/m
��# H � ;# Z ¨ 1� ;! Z 1� ;-�+� Z 1� ;�+,i�
��w;��� H 5.66 Q 10 Z Y 11.57 Q 10� Z 12.61 Q 10� Z 17.31 Q 10�\i�
H �. ê� Q �êë kNkNkNkN////mmmm
��w;��� H 5.66 Q 10 Z Y 14.95 Q 10e Z 12.61 Q 10� Z 17.31 Q 10�\i�
H î. íê Q �êî kNkNkNkN////mmmm

8 I C h a p t e r
DESIGN RECOMMENDATIONS
137 | P a g e
Step 7: Check the strength of the infilled frames
� interior bay:
$! H D4.9 Q 3.2 R 3.4 Q 1.55F Q 0.3 Q 24 H 75 kN
; H 1 R � ;#��#;�*� H 1 R 6.45 Q 10 6.76 Q 10e H 0.90
Mode 1: Panel-to-column connection failure (according to equation [7-48]):
{z;�w H �;�;�+, D& R '� R 26F7#;& H 920 D3600 R 300 R 225F1.080.90 Q 3600 H ïðí kNkNkNkN
Mode 2: Panel-to-beam connection failure (according to equation [7-50]):
{z;�w H O �;�;�*�? R½$!P D� R '� R 26F7#;&H D589 R½ Q 75F D5400 R 395 R 225F1.080.90 Q 3600 H ñíð kNkNkNkN
Thus, the ultimate strength of the single-story single-bay (interior) infilled frame equals
873 kN and is governed by panel-to-beam connection failure.
� Exterior bays:
$! H D6.7 Q 3.2 R 5.2 Q 1.55F Q 0.3 Q 24 H 96 kN
; H 1 R � ;#��#;�*� H 1 R 5.66 Q 10 4.70 Q 10e H 0.88
Mode 1: Panel-to-column connection failure (according to equation [7-48]):
{z;�w H �;�;�+, D& R '� R 26F7#;& H 920 D3600 R 300 R 225F1.060.88 Q 3600 H ïîë kNkNkNkN
Mode 2: Panel-to-beam connection failure (according to equation [7-50]):
{z;�w H O �;�;�*�? R½$!P D� R '� R 26F7#;&H D589 R½ Q 96F D7200 R 400 R 225F1.060.88 Q 3600 H ��ñï kNkNkNkN
Thus, the ultimate strength of the single-story single-bay (exterior) infilled frame equals
945 kN and is governed by panel-to-column connection failure.

8 I C h a p t e r
DESIGN RECOMMENDATIONS
138 | P a g e
Finally, a check is made for ultimate strength of the structure. Therefore, the design value
of the lateral load v́ = (obtained in step 1) is compared with the minimum lateral
resistance of the structure as follows:
v́ = �;�# H 800873 H 0.92 g 1.0 Ü sufficient
Step 8: Determine the horizontal deflection of the building
The horizontal deflection of the building consists of two components: flexure due to axial
forces in the columns, and shear due to panel deformations. Rotation of the foundation
due to axial forces in the piles is not considered in this design example.
The total axial bending stiffness of the braced frame equals:
��¢� Hò��� Q ¢�� H 2 Q D210 Q 3.19 Q 10e Q D2.7� Z 9.9�FF H 1.41 Q 10� kNm2
where �� is the column area and ¢� is the distance to the neutral axis of the braced frame.
Accordingly, the deflection at the top due to bending (9�) equals:
9� H 18 Ô*Ñ8Ñ&e
D��¢�F H 23.4 Q 1.0 Q 72e8 Q 1.41 Q 10� H 0.056 m
The shear stiffness of one story is assumed to be equal to the sum of the three previously
obtained single bay stiffnesses. As a consequence, the contribution of the frame is slightly
overestimated as the bending stiffness of 2 columns and 3 beams are twice taken into
account. However, due to the nature of the semi-integral infilled frame, major part of the
load is transferred trough the panels while the contribution of the frame is only marginal.
Therefore, this assumption is acceptable for preliminary design considerations.
Accordingly, the shear stiffness for one story (��#;��+.*�) equals:
��#;��+.*� H 2��#;�*�;*�� Z ��#;�*�;��� H 2 Q 4.70 Q 10e Z 6.76 Q 10e H 1.62 Q 10� kN/m
The deflection of a single story due to shear force equals:
9� H v���#;��+.*�
Accordingly the deflection at the top of the structure due to shear (9�) is the sum of the
story deflections (see Table 8-8) and equals:
9� Hò9���é�
H 0.104 m
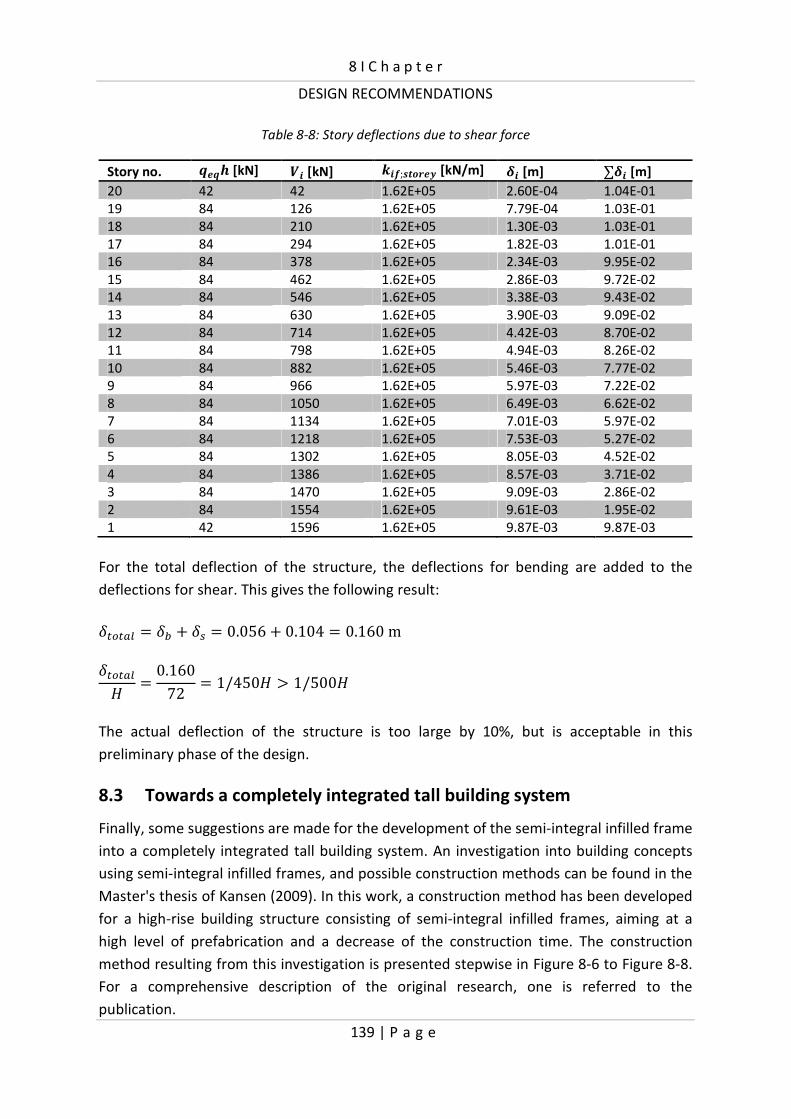
8 I C h a p t e r
DESIGN RECOMMENDATIONS
139 | P a g e
Table 8-8: Story deflections due to shear force
Story no. ó�ó¯ [kN] ô� [kN] ��w;��·±�x [kN/m] õ� [m] ∑õ� [m]
20 42 42 1.62E+05 2.60E-04 1.04E-01
19 84 126 1.62E+05 7.79E-04 1.03E-01
18 84 210 1.62E+05 1.30E-03 1.03E-01
17 84 294 1.62E+05 1.82E-03 1.01E-01
16 84 378 1.62E+05 2.34E-03 9.95E-02
15 84 462 1.62E+05 2.86E-03 9.72E-02
14 84 546 1.62E+05 3.38E-03 9.43E-02
13 84 630 1.62E+05 3.90E-03 9.09E-02
12 84 714 1.62E+05 4.42E-03 8.70E-02
11 84 798 1.62E+05 4.94E-03 8.26E-02
10 84 882 1.62E+05 5.46E-03 7.77E-02
9 84 966 1.62E+05 5.97E-03 7.22E-02
8 84 1050 1.62E+05 6.49E-03 6.62E-02
7 84 1134 1.62E+05 7.01E-03 5.97E-02
6 84 1218 1.62E+05 7.53E-03 5.27E-02
5 84 1302 1.62E+05 8.05E-03 4.52E-02
4 84 1386 1.62E+05 8.57E-03 3.71E-02
3 84 1470 1.62E+05 9.09E-03 2.86E-02
2 84 1554 1.62E+05 9.61E-03 1.95E-02
1 42 1596 1.62E+05 9.87E-03 9.87E-03
For the total deflection of the structure, the deflections for bending are added to the
deflections for shear. This gives the following result:
9�+��, H 9� Z 9� H 0.056 Z 0.104 H 0.160 m
9�+��,& H 0.16072 H 1/450& ö 1/500&
The actual deflection of the structure is too large by 10%, but is acceptable in this
preliminary phase of the design.
8.3 Towards a completely integrated tall building system
Finally, some suggestions are made for the development of the semi-integral infilled frame
into a completely integrated tall building system. An investigation into building concepts
using semi-integral infilled frames, and possible construction methods can be found in the
Master's thesis of Kansen (2009). In this work, a construction method has been developed
for a high-rise building structure consisting of semi-integral infilled frames, aiming at a
high level of prefabrication and a decrease of the construction time. The construction
method resulting from this investigation is presented stepwise in Figure 8-6 to Figure 8-8.
For a comprehensive description of the original research, one is referred to the
publication.
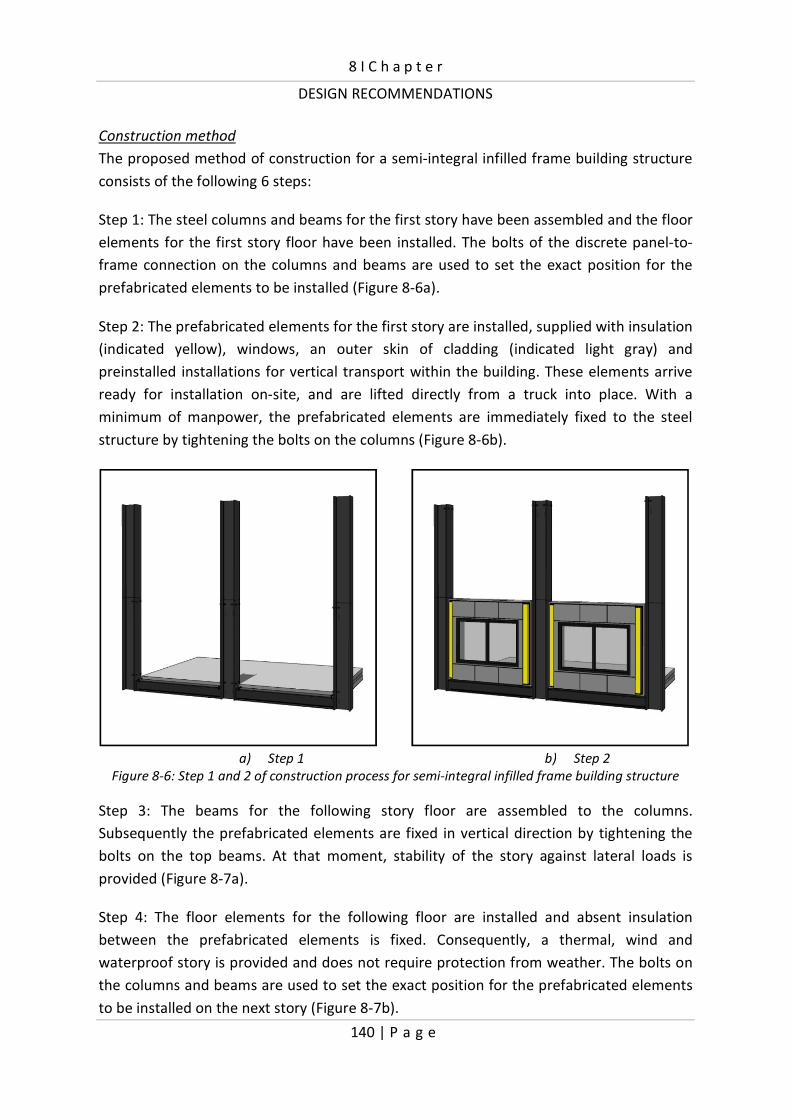
8 I C h a p t e r
DESIGN RECOMMENDATIONS
140 | P a g e
Construction method
The proposed method of construction for a semi-integral infilled frame building structure
consists of the following 6 steps:
Step 1: The steel columns and beams for the first story have been assembled and the floor
elements for the first story floor have been installed. The bolts of the discrete panel-to-
frame connection on the columns and beams are used to set the exact position for the
prefabricated elements to be installed (Figure 8-6a).
Step 2: The prefabricated elements for the first story are installed, supplied with insulation
(indicated yellow), windows, an outer skin of cladding (indicated light gray) and
preinstalled installations for vertical transport within the building. These elements arrive
ready for installation on-site, and are lifted directly from a truck into place. With a
minimum of manpower, the prefabricated elements are immediately fixed to the steel
structure by tightening the bolts on the columns (Figure 8-6b).
a) Step 1 b) Step 2
Figure 8-6: Step 1 and 2 of construction process for semi-integral infilled frame building structure
Step 3: The beams for the following story floor are assembled to the columns.
Subsequently the prefabricated elements are fixed in vertical direction by tightening the
bolts on the top beams. At that moment, stability of the story against lateral loads is
provided (Figure 8-7a).
Step 4: The floor elements for the following floor are installed and absent insulation
between the prefabricated elements is fixed. Consequently, a thermal, wind and
waterproof story is provided and does not require protection from weather. The bolts on
the columns and beams are used to set the exact position for the prefabricated elements
to be installed on the next story (Figure 8-7b).
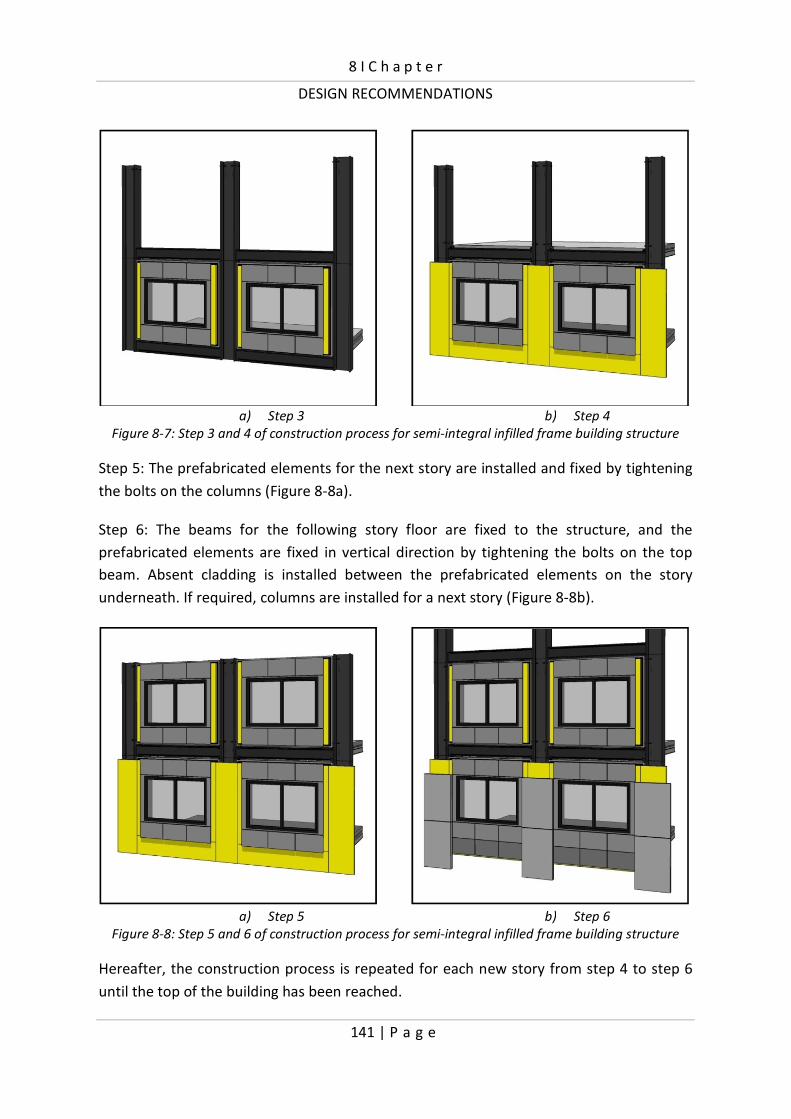
8 I C h a p t e r
DESIGN RECOMMENDATIONS
141 | P a g e
a) Step 3 b) Step 4
Figure 8-7: Step 3 and 4 of construction process for semi-integral infilled frame building structure
Step 5: The prefabricated elements for the next story are installed and fixed by tightening
the bolts on the columns (Figure 8-8a).
Step 6: The beams for the following story floor are fixed to the structure, and the
prefabricated elements are fixed in vertical direction by tightening the bolts on the top
beam. Absent cladding is installed between the prefabricated elements on the story
underneath. If required, columns are installed for a next story (Figure 8-8b).
a) Step 5 b) Step 6
Figure 8-8: Step 5 and 6 of construction process for semi-integral infilled frame building structure
Hereafter, the construction process is repeated for each new story from step 4 to step 6
until the top of the building has been reached.

8 I C h a p t e r
DESIGN RECOMMENDATIONS
142 | P a g e
In the Master's thesis of Kansen, a high-rise building structure consisting of a combination
of semi-integral infilled frames and a central core has successfully been designed. This has
resulted in the building shown in Figure 8-9. The work demonstrates the significant
contribution of semi-integral infilled frames to the overall lateral building stiffness.
Figure 8-9: High-rise building with semi-integral infilled frames and core structure (Kansen, 2009)
8.4 Chapter conclusions
A design method, incorporating the in the previous chapter developed analytical models
for the evaluation of stiffness and strength, was presented for the design of building
structures consisting of semi-integral infilled frames with window openings. Subsequently,
a design example demonstrated the application of the design method.
The design example showed that the analytical models are useful for the evaluation of the
stiffness and strength in the preliminary phase of the design, in order to make decisions
with regard to the approximate dimensions of the individual structural elements, without
the use of advanced computer simulations.
The design method provides a useful guideline that a structural engineer can easily follow,
resulting in a ductile structure, possessing both adequate strength and stiffness.
A building construction method was proposed for the semi-integral infilled frame. The
method provides an alternative construction method for tall buildings, resulting in a high
level of prefabrication thus in high quality buildings and a considerable decrease of the on-
site construction time.

143 | P a g e
Chapter 9: CONCLUSIONS & RECOMMENDATIONS
Scope of the chapter
This concluding chapter presents the overall conclusions of the research described in this
thesis (section 9.1). Recommendations for future research are given (section 9.2).
9.1 Conclusions
An infilled frame is a type of structure that has shown to be effective and efficient in
bracing low-rise and medium-rise building structures to resist in-plane lateral loads.
Gravity loads acting on the building structure are supported by the frame structure only,
while lateral loads are resisted by composite action between the infill and its confining
frame. The interaction between the infill and the frame is generally achieved by contact
pressure or continuous bonding.
The application of discrete connections between precast concrete infill panels and steel
frame structures represents a new area of research in infilled frames. The main objective
of this investigation was to develop practical universally applicable design models for this
type of structure. Based on the research described in this thesis, the following conclusions
can be drawn.
Experiments
Discretely connected precast concrete panels with openings can be successfully used to
provide lateral stability to steel frames. Applying discrete panel-to-frame connections
consisting of structural bolts on the column and beam in every corner of the steel frame,
acting under compression only, the overall behavior of this structure is comparable to that
of a braced frame with a compression diagonal only. Designed for a panel-to-frame
connection failure by a bolt failure mechanism, the connection fails by shearing of the
bolts through the nuts by stripping of the threads, providing a safe failure mechanism for
the structure as failure of the bolts does not result in collapse of the structure.
Accordingly, good ductility is achieved. Alexander’s theory can be applied for an accurate
strength prediction of the bolt-nut assembly in the discrete panel-to-frame connection.
Finite element modeling
A three dimensional finite element model consisting of solid elements is most suited to
accurately simulate the local behavior of H-sections subject to transverse compression
introduced indirectly through the flange. Using such a model, the structural characteristics
of European rolled HEA- and HEB-sections related to the position of the load on the flange
have successfully been determined.

9 I C h a p t e r
CONCLUSIONS & RECOMMENDATIONS
144 | P a g e
A two-dimensional finite element model developed for simulating the full-scale
experiments is able to predict the lateral load versus deflection relationship and the
ultimate lateral load with good accuracy. The finite element model simulates connection
failure as well as panel failure. The non-linear material model used for concrete,
combining the Drucker-Prager plasticity model for the compressive regime with a smeared
cracking model for the tensile regime, is well suited to accurately model the behavior of
the infill panel.
The complex composite behavior of the structure is endorsed by the observation that
parameters that affect the relative stiffness between the infill panel and frame influence
the ultimate lateral load of the structure as well.
Analytical modeling
Analytical models based on the concept of the equivalent diagonal strut, considering the
structure as an equivalent braced frame system with a compression diagonal replacing the
infill, provide an accurate prediction of the behavior of steel frames with discretely
connected precast concrete infill panels. The models are useful for the evaluation of the
stiffness and strength of the structure in the preliminary phase of the design. The practical
design method incorporating the analytical models provides a useful guideline for
structural engineers in order to design building structures consisting of semi-integral
infilled frames.
Construction technology
The semi-integral infilled frame offers an alternative construction method for tall
buildings, enabling the assembly of tall buildings with entirely prefabricated elements
directly from a truck. A considerable decrease of the on-site construction time is achieved
as building activities are mainly restricted to assembly works, while high quality buildings
can be realized as the building elements are manufactured in favorable environments
under strictly controlled conditions.

9 I C h a p t e r
CONCLUSIONS & RECOMMENDATIONS
145 | P a g e
9.2 Recommendations for future research
Based on the research presented in this thesis, the following recommendations for future
research into semi-integral infilled frames are given:
� Due to the extent of the full-scale tests, only a limited number of tests has been
carried out, considering square infilled-frames only (aspect ratio 1). Although other
aspect ratios have been numerically investigated, it is recommended to extend the
experimental research to other aspect ratios, to investigate other possible failure
mechanisms such as out-of-plane failure of the infill panel.
� In practice, the semi-integral infilled frame will, in addition to in-plane loading, be
loaded out of the plane of the structure as a result of wind pressure on the façade.
Besides the possible out-of-plane failure of the infill panel as mentioned in the
previous point, the failure mechanism and ultimate load of the bolts might
substantially be influenced when loaded by a combination of compression and shear.
Therefore, it is recommended to investigate the behavior of the structure under a
combination of in-plane and out-of-plane loading.
� In the current thesis, the behavior of semi-integral infilled frames under in-plane
monotonic loading has been studied. However, in practice building structures are
subject to reversed and cyclic loading because of the nature of lateral loads.
Therefore, it is recommended to investigate the cyclic behavior of the structure.
� Infilled frame systems are often applied in seismic zones. Therefore, it is
recommended to evaluate the earthquake response of the semi-integral infilled frame
and to develop design rules to allow application of the structure in seismic areas as
well.

147 | P a g e
REFERENCES
Afefy, H. M., Taher, S. E. F., Khalil, A. H. A., and Issa, M. E. (2002), Statistically equivalent
nonlinear finite element model for infilled RC framed systems, Engineering
Computations, Vol 19(2), pp 190-205
Alexander, E. M. (1977), Analysis and design of threaded assemblies, SAE Papers (No.
770420), pp 1-15
ANSYS Inc. (2007), ANSYS V11.0 User Manual, Canonsburg, PA, USA
ASCE Task Committee on Concrete and Masonry Structure (1982), State-of-the-art report
on finite element analysis of reinforced concrete, ASCE, New York, 553 p
ASCE-ACI Committee 445 (1998), Recent approaches to shear design of structural
concrete, Journal of Structural Engineering - ASCE, Vol 124(12), pp 1375-1471
Asteris, P. G. (2003), Lateral stiffness of brick masonry infilled plane frames, Journal of the
Structural Division - ASCE, Vol 129(8), pp 1071-1079
Asteris, P. G. (2008), Finite element micro-modelling of infilled frames, Electronic Journal
of Structural Engineering, Vol 8, pp 1-11
Barua, H. K and Mallick, S. K. (1977), Behaviour of mortar infilled steel frames under lateral
load, Building and Environment, Vol 12, pp 263-272
Benjamin, J. R. and Williams, H. A. (1958), The behaviour of one-storey brick shear walls,
Journal of the Structural Division - ASCE, Vol 84(4), pp 1723/1-1723/30
Comité Euro-International du Béton (1993), CEB-FIP Model Code 1990, Thomas Telford,
London, 437 p
Crisafulli, F. J., Carr, A. J., and Park, R. (2000), Analytical modelling of infilled frame
structures - a general review, Bulletin of the New Zealand Society for Earthquake
Engineering, Vol 33(1), pp 30-47
Dawe, J. L. and Seah, C. K. (1989), Behaviour of masonry infilled steel frames, Canadian
Journal of Civil Engineering, Vol 16(6), pp 865-876
Dawe, J. L., Seah, C. K., and Liu, Y. (2001), A computer model for predicting infilled frame
behaviour, Canadian Journal of Civil Engineering, Vol 28(1), pp 133-148
de Borst, R. (2002), Fracture in quasi-brittle materials: a review of continuum damage-
based approaches, Engineering Fracture Mechanics, Vol 69(2), pp 95-112

R e f e r e n c e s
148 | P a g e
DIANA (2007), DIANA users manual - release 9.2, TNO Diana B.V., Delft, The Netherlands
Drucker, D. C. (1961), On structural concrete and the theorems of limit analysis,
International Association for Bridge and Structural Engineering, IABSE-Reports 21, pp
45-59
EN 1992-1-1 (2004), Eurocode 2: Design of concrete structures - Part 1-1: General rules and
rules for buildings, CEN, Brussels
EN 1993-1-1 (2005), Eurocode 3: Design of steel structures - Part 1-1: General rules and
rules for buildings, CEN, Brussels
EN 1993-1-5 (2006), Eurocode 3: Design of steel structures - Part 1-5: General rules - Plated
structural elements, CEN, Brussels
EN 1993-1-8 (2005), Eurocode 3: Design of steel structures - Part 1-8: Design of joints, CEN,
Brussels
ENV 1993-1-1 (1992), Eurocode 3: Design of steel structures - Part 1-1: General rules and
rules for buildings, CEN, Brussels
FEMA 356 (2000), Prestandard and commentary for the seismic rehabilitation of buildings,
Federal Emergency Management Agency, Washington
FIP Commission 3 on Practical Design (1999), Practical design of structural concrete,
Fédération Internationale de la Précontrainte, London, 113 p
Frosch, R. J. (1996), Seismic rehabilitation using precast infill walls, Ph.D. Dissertation,
University of Texas at Austin, 224 p
Frosch, R. J. (1999a), Panel connections for precast concrete infill walls, ACI Structural
Journal, Vol 96(4), pp 467-472
Frosch, R. J. (1999b), Shear transfer between concrete elements using steel pipe
connection, ACI Structural Journal, Vol 96(6), pp 1003-1008
Ghosh, A. K. and Amde, A. M. (2002), Finite element analysis of infilled frames, Journal of
the Structural Division - ASCE, Vol 128(7), pp 881-889
Hendry, A. W. (1981), Structural brickwork, MacMillan, London, 209 p
Hoenderkamp, J. C. D., Hofmeyer, H., and Snijder, H. H. (2005), Composite behaviour of
steel frames with precast concrete infill panels, Proceedings of the 4th European
conference on steel, space & composite structures (Vol B), Druck und Verlagshaus
Mainz GmbH, Aachen, pp 31-40
R e f e r e n c e s
149 | P a g e
Hoenderkamp, J. C. D., Hofmeyer, H., and Snijder, H. H. (2007), Experimental
investigations into in-plane stiffness and strength of steel frames with precast
concrete infill panels, Proceedings of the 5th international conference on advances in
steel structures (Vol. 3), Research Publising Services, Singapore/Chennai, pp 826-832
Hoenderkamp, J. C. D. and Snijder, H. H. (2000), Approximate analysis of high-rise frames
with flexible connections, The Structural Design of Tall Buildings, Vol 9(3), pp 233-250
Hoenderkamp, J. C. D. and Snijder, H. H. (2003), Preliminary analysis of high-rise braced-
frames with facade riggers, Journal of Structural Engineering - ASCE, Vol 129(5), pp
640-647
Holmes, M. (1961), Steel frames with brickwork and concrete infilling, Proceedings of the
Institution of Civil Engineers - Structures and Buildings, Vol 19, pp 473-478
ISO/DIS 1920-10 (2009), Testing of concrete - Part 10: Determination of static modulus of
elasticity in compression
Kansen, J. P. S. (2009), Hybrid Verticality, Report number A-2009.3, Eindhoven University
of Technology, 190 p (in Dutch)
King, G. J. W. and Pandey, P. C. (1978), The analysis of infilled frames using finite elements,
Proceedings of the Institution of Civil Engineers, Vol 65(4), pp 749-760
Kwan, K. H. and Liauw, T. C. (1984), Nonlinear analysis of integral infilled frames,
Engineering Structures, Vol 6(3), pp 223-231
Kwan, K. H., Lo, C. G., and Liauw, T. C. (1990), Large-scale model tests and plastic analysis
of multibay infilled frames, Proceedings of the Institution of Civil Engineers, Vol
89(Part 2), pp 261-277
la Poutré, D. B. (2005), Inelastic spatial stability of circular wide flange steel arches, Ph.D.
Dissertation, Eindhoven University of Technology, XII + 188 p
Leu, L. J., Huang, C. W., Chen, C. S., and Liao, Y. P. (2006), Strut-and-tie design
methodology for three-dimensional reinforced concrete structures, Journal of
Structural Engineering - ASCE, Vol 132(6), pp 929-938
Liang, Q. Q., Uy, B., and Steven, G. P. (2002), Performance-based optimization for strut-tie
modeling of structural concrete, Journal of Structural Engineering - ASCE, Vol 128(6),
pp 815-823
Liauw, T. C. (1972), An approximate method of analysis for infilled frames with or without
opening, Building Science, Vol 7(4), pp 233-238

R e f e r e n c e s
150 | P a g e
Liauw, T. C. and Kwan, K. H. (1982), Non-linear analysis of multistorey infilled frames,
Proceedings of the Institution of Civil Engineers, Vol 73(2), pp 441-454
Liauw, T. C. and Kwan, K. H. (1983), Plastic theory of non-integral infilled frames,
Proceedings of the Institution of Civil Engineers, Vol 75, pp 379-396
Liauw, T. C. and Kwan, K. H. (1984a), Nonlinear behaviour of non-integral infilled frames,
Computers & Structures, Vol 18(3), pp 551-560
Liauw, T. C. and Kwan, K. H. (1984b), Plastic design of infilled frames, Proceedings of the
Institution of Civil Engineers, Vol 77, pp 367-377
Liauw, T. C. and Lee, S. W. (1977), On the behaviour and the analysis of multi-storey
infilled frames subject to lateral loading, Proceedings of the Institution of Civil
Engineers, Vol 63(PART 2), pp 641-656
Liauw, T. C. and Lo, C. G. (1988), Multibay infilled frames without shear connectors, ACI
Structural Journal, Vol 85(4), pp 423-428
Mainstone, R. J. (1971), On the stiffnesses and strengths of infilled frames, Proceedings of
the Institution of Civil Engineers, Supplement IV, pp 57-90
Mallick, D. V. and Garg, R. P. (1971), Effect of openings on the lateral stiffness of infilled
frames, Proceedings of the Institution of Civil Engineers - Structures and Buildings, Vol
49, pp 193-209
Mallick, D. V. and Severn, R. T. (1967), The behavior of infilled frames under static loading,
Proceedings of the Institution of Civil Engineers, Vol 38, pp 639-656
Moghaddam, H. A., Mohammadi, M. G., and Ghaemian, M. (2006), Experimental and
analytical investigation into crack strength determination of infilled steel frames,
Journal of Constructional Steel Research, Vol 62(12), pp 1341-1352
Mohebkhah, A, Tasnimi, A. A., and Moghadam, H. A. (2008), Nonlinear analysis of
masonry-infilled steel frames with openings using discrete element method, Journal
of Constructional Steel Research, Vol 64(12), pp 1463-1472
Mondal, G. and Jain, S. K. (2008), Lateral stiffness of masonry infilled reinforced concrete
(RC) frames with central opening, Earthquake Spectra, Vol 24(3), pp 701-723
Mörsch, E. (1908), Der Eisenbetonbau, seine Theorie und Anwendung, Wittwer, Stuttgart
Muttoni, A., Schwartz, J., and Thürlimann, B. (1997), Design of concrete structures with
stress fields, Birkhäuser, Basel, 143 p

R e f e r e n c e s
151 | P a g e
NEN-EN 12390-3 (en) (2009), Testing hardened concrete - Part 3: Compressive strength of
test specimens, Nederlands Normalisatie-instituut, Delft
NEN-EN 12390-6 (en) (2000), Testing hardened concrete - Part 6: Tensile splitting strength
of test specimens, Nederlands Normalisatie-instituut, Delft
Ng'andu, B. M. (2006), Bracing steel frames with calcium silicate element walls, Ph.D.
Dissertation, Eindhoven University of Technology, XII + 187 p
Paulay, T. and Priestley, M. J. N. (1992), Seismic design of reinforced concrete and masonry
buildings, John Wiley & Sons, Chichester, 744 p
Polyakov, S. V. (1956), On the interaction between masonry filler walls and enclosing
frame when loaded in the plane of the wall, Translation in Earthquake Engineering,
Earthquake Engineering Research Institute, San Francisco, pp 36-42
Puglisi, M., Uzcategui, M., and Florez-Lopez, J. (2009), Modeling of masonry of infilled
frames, Part II: Cracking and damage, Engineering Structures, Vol 31(1), pp 119-124
Riddington, J. R. and Stafford Smith, B. (1977), Analysis of infilled frames subject to racking
with design recommendations, Structural Engineer, Vol 55(6), pp 263-268
Ritter, W. (1899), Die Bauweise Hennebique, Schweizerische Bauzeitung, Vol Bd. XXXIII(7),
pp 59-61
Saneinejad, A. and Hobbs, B. (1995), Inelastic design of infilled frames, Journal of the
Structural Division - ASCE, Vol 121(4), pp 634-650
Schlaich, J. and Schäfer, K. (1991), Design and detailing of structural concrete using strut-
and-tie models, Structural Engineer, Vol 69(6), pp 113-125
Schlaich, J., Schäfer, K., and Jennewein, M. (1987), Toward a consistent design of
structural concrete, Journal of the prestressed concrete institute, Vol 32(3), pp 74-150
Sharpe, W. N. J. (2008), Springer handbook of experimental solid mechanics, Springer, New
York, 1098 p
Stafford Smith, B. (1962), Lateral stiffness of infilled frames, Journal of the Structural
Division - ASCE, Vol 88(6), pp 183-199
Stafford Smith, B. (1966), Behaviour of square infilled frames, Journal of the Structural
Division - ASCE, Vol 92(1), pp 381-403
Stafford Smith, B. (1967a), Methods for predicting the lateral stiffness and strength of
multi-storey infilled frames, Building Science, Vol 2(3), pp 247-257

R e f e r e n c e s
152 | P a g e
Stafford Smith, B. (1967b), The composite behaviour of infilled frames, Tall buildings:
Proceedings of a Symposium on Tall Buildings, Pergamon Press, London, pp 481-495
Stafford Smith, B. and Carter, C. (1969), A method of analysis for infilled frames,
Proceedings of the Institution of Civil Engineers, Vol 44, pp 31-48
Stafford Smith, B. and Coull, A. (1991), Tall building structures - analysis and design, John
Wiley and Sons Inc., New York, 537 p
Stafford Smith, B. and Riddington, J. R. (1978), The design of masonry infilled steel frames
for bracing structures, Structural Engineer, Vol 56(1), pp 1-7
Stark, J. W. B. and Bijlaard, F. S. K. (1988), Design rules for beam-to-column connections in
Europe, Journal of Constructional Steel Research, Vol 10, pp 415-462
Steenhuis, C. M., Gresnigt, N., and Weynand, K. (1994), Pre-design of semi-rigid joints in
steel frames, Proceedings of the Second State of the Art Workshop Prague, pp 131-
140
Steenhuis, C. M., Vrouwenvelder, A. C. W. M., van Herwijnen, F., and Snijder, H. H. (2002),
Definitions of resistance and deformation capacity for non-sway steel and composite
structures, Heron, Vol 47(1), pp 3-27
Swanson, J. A. and Leon, R. T. (2001), Stiffness modelling of bolted T-stub connections,
Journal of Structural Engineering, Vol 127(5), pp 498-505
Tang, R. B., Hoenderkamp, J. C. D., and Snijder, H. H. (2003), Preliminary numerical
research on steel frames with precast reinforced concrete infill panels, Proceedings
of the 1st conference on structural stability and dynamics, Taipei, pp 575-580
Teeuwen, P. A., Kleinman, C. S., and Snijder, H. H. (2006), The effect of window openings
on the composite behaviour of infilled steel frames with precast concrete infill
panels, Proceedings of the 8th international conference on steel, space & composite
structures, CI-Premier Pte Ltd, Singapore, pp 185-192
Timoshenko, S. P. and Goodier, J. N. (1970), Theory of elasticity, 3rd ed., McGraw-Hill, New
York, 567 p
Witteveen, J., Stark, J. W. B., Bijlaard, F. S. K., and Zoetemeijer, P. (1982), Welded and
bolted beam-to-column connections, Journal of the Structural Division - ASCE, Vol
108(2), pp 433-455
Wood, R. H. (1978), Plasticity, composite action and collapse design of unreinforced shear
wall panels in frames, Proceedings of the Institution of Civil Engineers - Structures and
Buildings, Vol 65(JUNE), pp 381-411

R e f e r e n c e s
153 | P a g e
Yun, Y. M. (2000), A refined strut-tie model approach and its application tool, Proceedings
of the Institution of Civil Engineers - Structures and Buildings, Vol 140(1), pp 13-24
Yun, Y. M. (2006), Strength of two-dimensional nodal zones in strut-tie models, Journal of
Structural Engineering - ASCE, Vol 132(11), pp 1764-1783
Yun, Y. M. and Ramirez, J. A. (1996), Strength of struts and nodes in strut-tie model,
Journal of Structural Engineering - ASCE, Vol 122(1), pp 20-29
Zoetemeijer, P. (1974), A design method for the tension side of statically loaded, bolted
beam-to-column connections, Heron, Vol 20(1), pp 1-59
Zoetemeijer, P. (1975), Influence of normal, bending and shear stresses in the web of
European rolled sections, Report no. 6-75-18, Stevin Laboratory, Delft University of
Technology


155 | P a g e
APPENDIX A
A.1 Resistance of H-section subject to transverse compression
The resistance of an H-section subject to transverse compression applied indirectly via the
flanges is governed by one of the following modes of failure:
� Yielding of the flanges
� Yielding of the web close to the flange
� Crippling of the web in the form of localized buckling
� Buckling of the web over most of the depth of the section
However, when the load is resisted by shear force in the web and not transferred directly
to the other flange through the web, buckling failure does not occur.
A calculation is made to demonstrate that yielding of the flanges is the governing failure
mode for HEA- and HEB-sections subject to compression applied indirectly via the flanges.
The equations applied are derived from Eurocode 3, EN 1993. In these equations, the
length of stiff bearing (��) is included. This length depends, in the case of loading indirectly
via the flanges, on the dispersion of the load over the width of the flange at an angle <
(Figure A-1). Although the value of < is not exactly known, adopting a conservative value
will demonstrate that the web failure mechanisms are not likely to occur, and that
consequently flange yielding governs the strength.
Figure A-1: Definition of geometrical parameters
In the following calculations, no dispersions of the load over the width of the flange is
assumed (< = 0). Accordingly, the length of stiff bearing (��) is taken equal to the diameter
of the washer, which equals 44 mm for M24.
The following equations from Eurocode 3 EN 1993, are applied to find the resistance of
the web in compression (EN 1993-1-5) and the flange in bending (EN 1993-1-8):
ss
ϕ
Conservative assumption
More realistic assumption
b
hw
tw
e m 0.8r
r
h b ½b
tf
tf
tw

A I A p p e n d i x
156 | P a g e
Transverse loading resistance web
The transverse loading resistance ( Ù=) of the web of rolled beams is given by the
following equation (equation 6.1 of EN 1993-1-5):
Ù= H 45�*##��58Å�
Where:
45 = thickness of the web [mm]
��5 = yield strength of the web [N/mm2]
8� = partial factor for resistance of members to instability assessed by member
checks [-]
�*## is the effective length for resistance to transverse forces [mm], which should
be determined from:
�*## H �Ä/�
Where:
�Ä = the reduction factor due to local buckling [-]
/� = the effective loaded length, appropriate to the length of stiff bearing [mm]
The reduction factor �Ä is to be determined from:
�Ä H 0.5KÚÄ g 1.0
Where:
KÚÄ H L/�45��5 �.
�. H 0.9�� 45'5
�Ä H 6 Z 2 l'5� m�
Where:
'5 = distance between the flanges as indicated in Figure A-1 [mm]
� = length of the unstiffened web [mm]

A I A p p e n d i x
157 | P a g e
The effective loaded length (/�) is calculated as follows:
/� H �� Z 24#O1 Z ��� Z��P
Where: �� = length of stiff bearing as indicated in Figure A-1 [mm] �� and �� are two dimensionless parameters, to be obtained from:
�� H ��#�#��545
�� H 0.02 Í'54# Î� if KÚÄ ö 0.5
�� H 0 if KÚÄ ö 0.5
Bending resistance flange
The bending resistance of the flange in bending is determined using an equivalent T-stub
in tensions. Accordingly, the tension resistance of the T-stub flange ( Þ,Ù=F is obtained
from (Table 6.2 of EN 1993-1-8):
Þ,Ù= H 40!,� DMode 1: complete yielding of the flangeF Where 0!, is given by:
0!, H 0.25/*##4#���#8Åk
Where:
4# = thickness of the flange [mm]
��# = yield strength of the flange [N/mm2]
/*## H the smaller of 4� Z 1.25ø and 2I�
ø = edge distance to the bolt as indicated in Figure A-1 [mm]
� = distance as indicated in Figure A-1 [mm]
8� = partial factor for resistance of cross-sections whatever the class is [-]
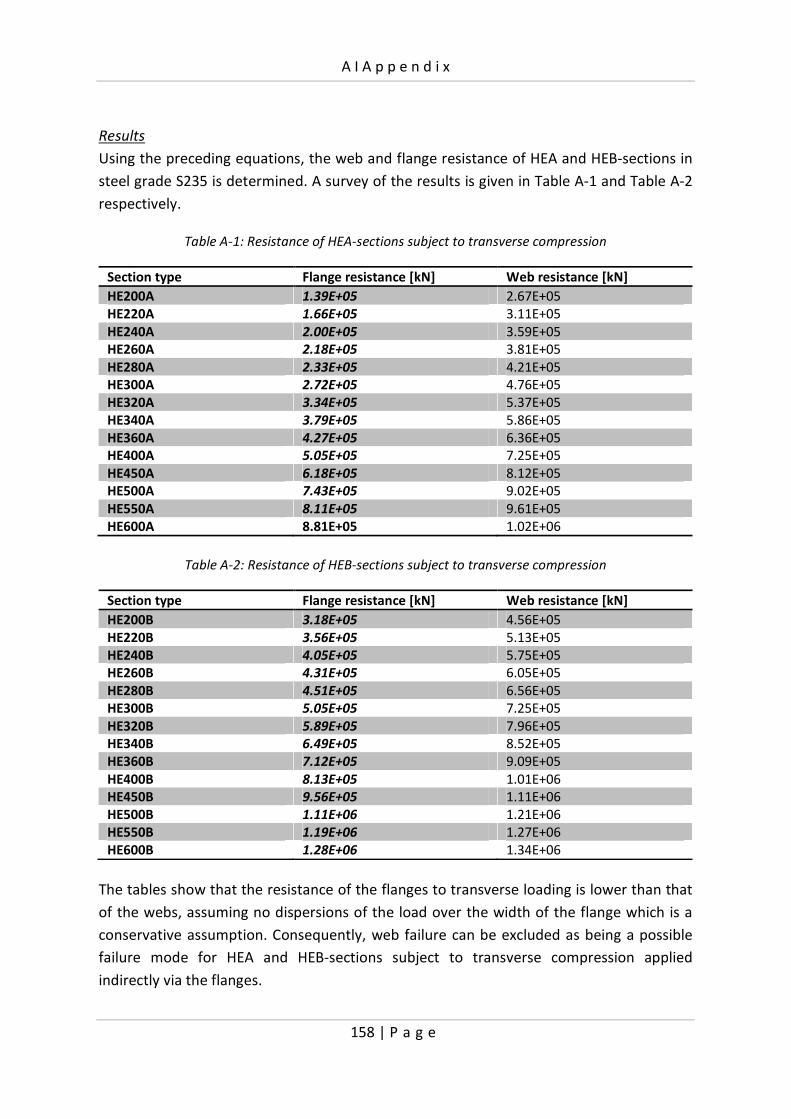
A I A p p e n d i x
158 | P a g e
Results
Using the preceding equations, the web and flange resistance of HEA and HEB-sections in
steel grade S235 is determined. A survey of the results is given in Table A-1 and Table A-2
respectively.
Table A-1: Resistance of HEA-sections subject to transverse compression
Section type Flange resistance [kN] Web resistance [kN]
HE200A 1.39E+05 2.67E+05
HE220A 1.66E+05 3.11E+05
HE240A 2.00E+05 3.59E+05
HE260A 2.18E+05 3.81E+05
HE280A 2.33E+05 4.21E+05
HE300A 2.72E+05 4.76E+05
HE320A 3.34E+05 5.37E+05
HE340A 3.79E+05 5.86E+05
HE360A 4.27E+05 6.36E+05
HE400A 5.05E+05 7.25E+05
HE450A 6.18E+05 8.12E+05
HE500A 7.43E+05 9.02E+05
HE550A 8.11E+05 9.61E+05
HE600A 8.81E+05 1.02E+06
Table A-2: Resistance of HEB-sections subject to transverse compression
Section type Flange resistance [kN] Web resistance [kN]
HE200B 3.18E+05 4.56E+05
HE220B 3.56E+05 5.13E+05
HE240B 4.05E+05 5.75E+05
HE260B 4.31E+05 6.05E+05
HE280B 4.51E+05 6.56E+05
HE300B 5.05E+05 7.25E+05
HE320B 5.89E+05 7.96E+05
HE340B 6.49E+05 8.52E+05
HE360B 7.12E+05 9.09E+05
HE400B 8.13E+05 1.01E+06
HE450B 9.56E+05 1.11E+06
HE500B 1.11E+06 1.21E+06
HE550B 1.19E+06 1.27E+06
HE600B 1.28E+06 1.34E+06
The tables show that the resistance of the flanges to transverse loading is lower than that
of the webs, assuming no dispersions of the load over the width of the flange which is a
conservative assumption. Consequently, web failure can be excluded as being a possible
failure mode for HEA and HEB-sections subject to transverse compression applied
indirectly via the flanges.

159 | P a g e
APPENDIX B
B.1 Test specimens
Steel frame
Figure B-1: Steel frame with beam-to-column connection

B I A p p e n d i x
160 | P a g e
Panel type 1
Figure B-2: Reinforcement configuration of panel type 1

B I A p p e n d i x
161 | P a g e
Panel type 2
Figure B-3: Reinforcement configuration of panel type 2
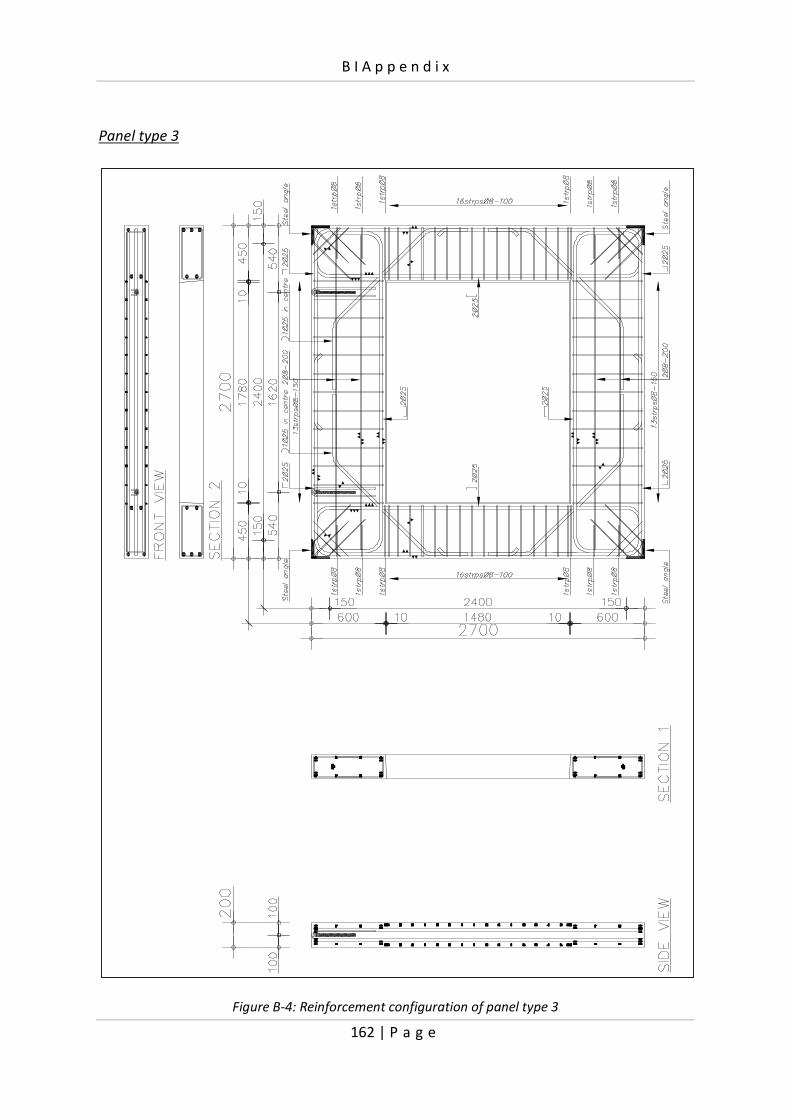
B I A p p e n d i x
162 | P a g e
Panel type 3
Figure B-4: Reinforcement configuration of panel type 3

B I A p p e n d i x
163 | P a g e
Panel type 4
Figure B-5: Reinforcement configuration of panel type 4

B I A p p e n d i x
164 | P a g e
Panel type 5
Figure B-6: Reinforcement configuration of panel type 5
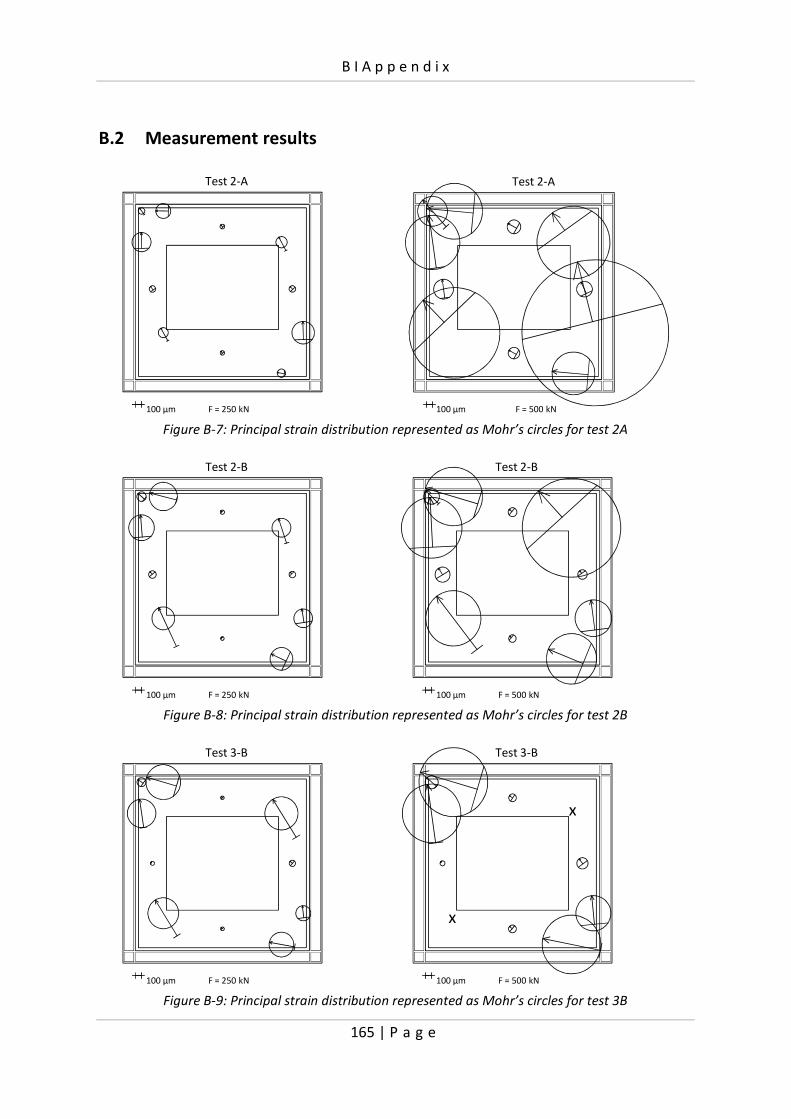
B I A p p e n d i x
165 | P a g e
B.2 Measurement results
Figure B-7: Principal strain distribution represented as Mohr’s circles for test 2A
Figure B-8: Principal strain distribution represented as Mohr’s circles for test 2B
Figure B-9: Principal strain distribution represented as Mohr’s circles for test 3B
100 μm F = 250 kN
Test 2-A
100 μm F = 500 kN
Test 2-A
100 μm F = 250 kN
Test 2-B
100 μm F = 500 kN
Test 2-B
100 μm F = 250 kN
Test 3-B
100 μm F = 500 kN
Test 3-B
x
x
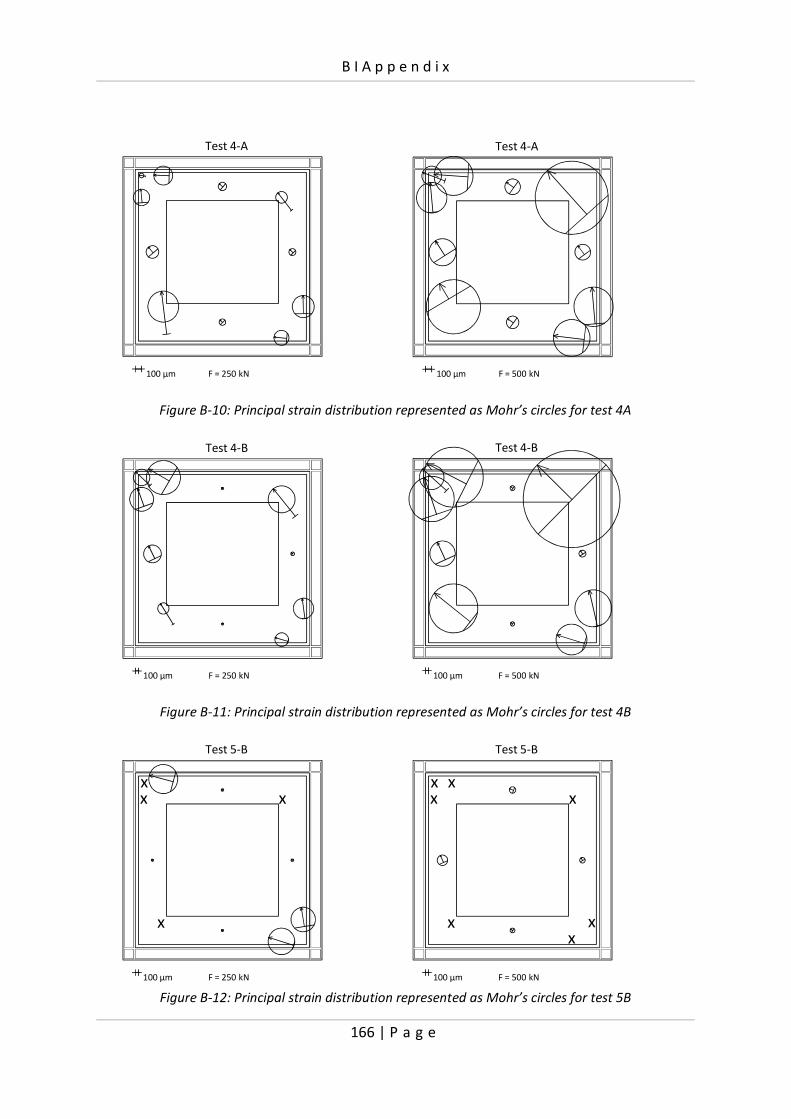
B I A p p e n d i x
166 | P a g e
Figure B-10: Principal strain distribution represented as Mohr’s circles for test 4A
Figure B-11: Principal strain distribution represented as Mohr’s circles for test 4B
Figure B-12: Principal strain distribution represented as Mohr’s circles for test 5B
100 μm F = 250 kN
Test 4-A
100 μm F = 500 kN
Test 4-A
100 μm F = 250 kN
Test 4-B
100 μm F = 500 kN
Test 4-B
100 μm F = 250 kN
Test 5-B
x
x
xx
100 μm F = 500 kN
Test 5-B
x
x
xx
xx
x
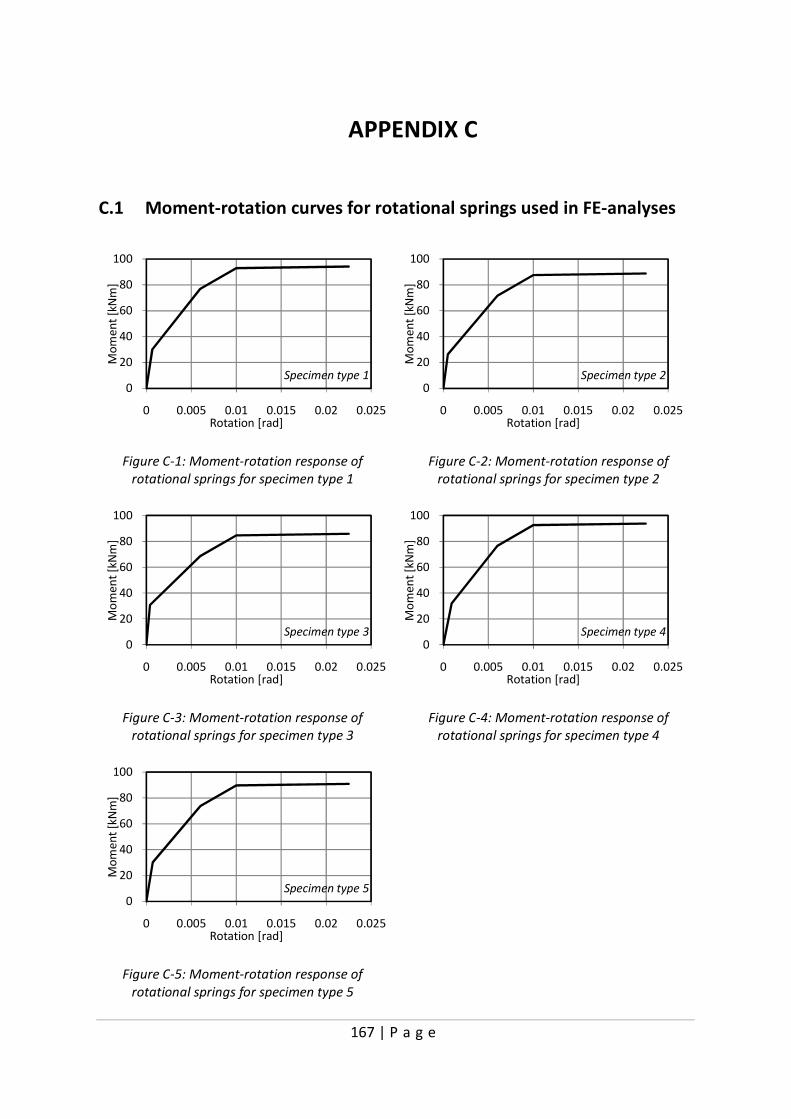
167 | P a g e
APPENDIX C
C.1 Moment-rotation curves for rotational springs used in FE-analyses
Figure C-1: Moment-rotation response of
rotational springs for specimen type 1
Figure C-2: Moment-rotation response of
rotational springs for specimen type 2
Figure C-3: Moment-rotation response of
rotational springs for specimen type 3
Figure C-4: Moment-rotation response of
rotational springs for specimen type 4
Figure C-5: Moment-rotation response of
rotational springs for specimen type 5
0
20
40
60
80
100
0 0.005 0.01 0.015 0.02 0.025
Mo
me
nt
[kN
m]
Rotation [rad]
Specimen type 10
20
40
60
80
100
0 0.005 0.01 0.015 0.02 0.025M
om
en
t [k
Nm
]Rotation [rad]
Specimen type 2
0
20
40
60
80
100
0 0.005 0.01 0.015 0.02 0.025
Mo
me
nt
[kN
m]
Rotation [rad]
Specimen type 30
20
40
60
80
100
0 0.005 0.01 0.015 0.02 0.025
Mo
me
nt
[kN
m]
Rotation [rad]
Specimen type 4
0
20
40
60
80
100
0 0.005 0.01 0.015 0.02 0.025
Mo
me
nt
[kN
m]
Rotation [rad]
Specimen type 5

C I A p p e n d i x
168 | P a g e
C.2 Comparison of FE- and experimental results
C.2.1 Measured and simulated strains
Figure C-6: Measured and simulated strains for specimen type 1
Figure C-7: Measured and simulated strains for specimen type 2
0
100
200
300
400
500
600
700
800
0 0.0005 0.001 0.0015 0.002 0.0025
Late
ral l
oa
d [
kN]
Average strain [mm/mm]
Specimen type 1
δc Test δc FEM
δd Test δd FEM
δe Test δe FEM
0
100
200
300
400
500
600
700
800
0 0.0005 0.001 0.0015 0.002 0.0025 0.003 0.0035
Late
ral l
oa
d [
kN]
Average strain [mm/mm]
Specimen type 2
δc Test δc FEM
δd Test δd FEM
δe Test δe FEM
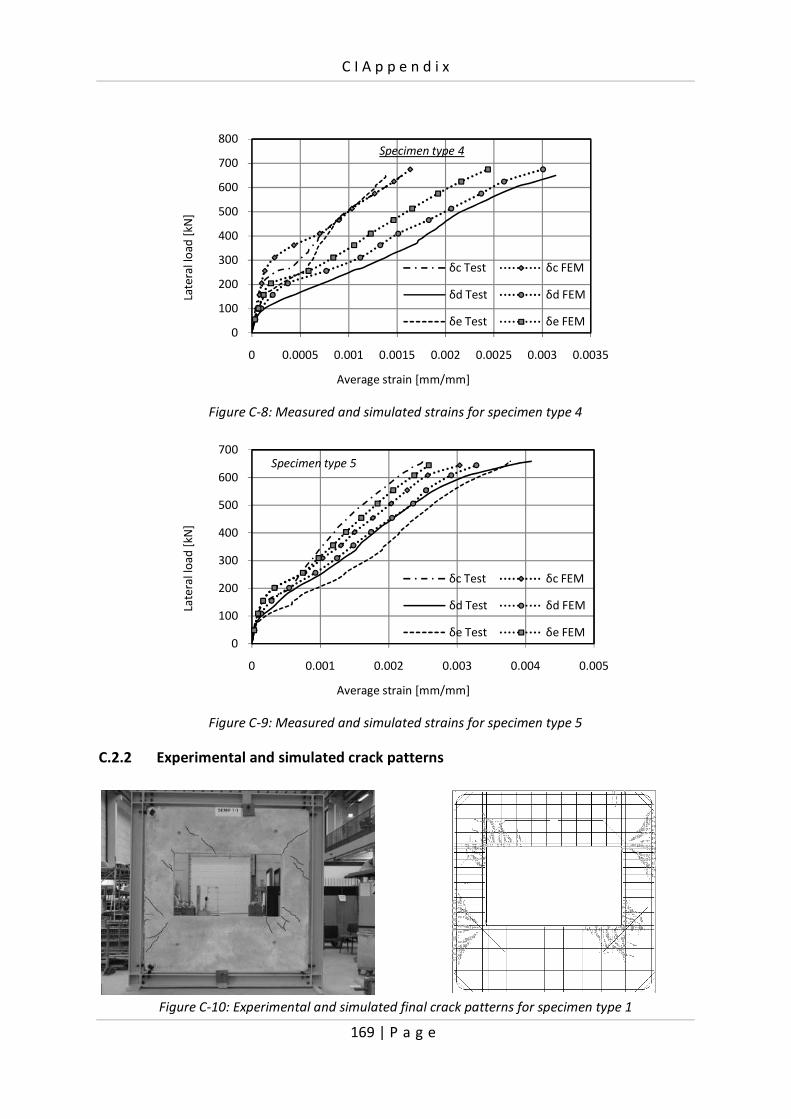
C I A p p e n d i x
169 | P a g e
Figure C-8: Measured and simulated strains for specimen type 4
Figure C-9: Measured and simulated strains for specimen type 5
C.2.2 Experimental and simulated crack patterns
Figure C-10: Experimental and simulated final crack patterns for specimen type 1
0
100
200
300
400
500
600
700
800
0 0.0005 0.001 0.0015 0.002 0.0025 0.003 0.0035
Late
ral l
oa
d [
kN]
Average strain [mm/mm]
Specimen type 4
δc Test δc FEM
δd Test δd FEM
δe Test δe FEM
0
100
200
300
400
500
600
700
0 0.001 0.002 0.003 0.004 0.005
Late
ral l
oa
d [
kN]
Average strain [mm/mm]
Specimen type 5
δc Test δc FEM
δd Test δd FEM
δe Test δe FEM

C I A p p e n d i x
170 | P a g e
Figure C-11: Experimental and simulated final crack patterns for specimen type 2
Figure C-12: Experimental and simulated final crack patterns for specimen type 4
Figure C-13: Experimental and simulated final crack patterns for specimen type 5

171 | P a g e
APPENDIX D
D.1 Results parameter study on component
Figure D-1: Load-deformation curves for
HE200A section in S355
Figure D-2: Load-deformation curves for
HE220A section in S355
Figure D-3: Load-deformation curves for
HE240A section in S355
Figure D-4: Load-deformation curves for
HE260A section in S355
Figure D-5: Load-deformation curves for
HE280A section in S355
Figure D-6: Load-deformation curves for
HE300A section in S355
0
100
200
300
400
0 1 2 3 4
Loa
d [
kN]
Deformation [mm]
HE200A
¼
⅜
½
⅝0
100
200
300
400
0 1 2 3 4
Loa
d [
kN]
Deformation [mm]
HE220A
¼
⅜
½
⅝
0
100
200
300
400
0 1 2 3 4
Loa
d [
kN]
Deformation [mm]
HE240A
¼
⅜
½
⅝0
100
200
300
400
0 1 2 3 4
Loa
d [
kN]
Deformation [mm]
HE260A
¼
⅜
½
⅝
0
100
200
300
400
0 1 2 3 4
Loa
d [
kN]
Deformation [mm]
HE280A
¼
⅜
½
⅝0
100
200
300
400
500
0 1 2 3 4
Loa
d [
kN]
Deformation [mm]
HE300A
¼
⅜
½
⅝

D I A p p e n d i x
172 | P a g e
Figure D-7: Load-deformation curves for
HE320A section in S355
Figure D-8: Load-deformation curves for
HE340A section in S355
Figure D-9: Load-deformation curves for
HE360A section in S355
Figure D-10: Load-deformation curves for
HE400A section in S355
Figure D-11: Load-deformation curves for
HE200B section in S355
Figure D-12: Load-deformation curves for
HE220B section in S355
Figure D-13: Load-deformation curves for
HE240B section in S355
Figure D-14: Load-deformation curves for
HE2600B section in S355
0
100
200
300
400
500
600
0 1 2 3 4
Loa
d [
kN]
Deformation [mm]
HE320A
¼
⅜
½
⅝0
200
400
600
800
0 1 2 3 4
Loa
d [
kN]
Deformation [mm]
HE340A
¼
⅜
½
⅝
0
200
400
600
800
0 1 2 3 4
Loa
d [
kN]
Deformation [mm]
HE360A
¼
⅜
½
⅝0
200
400
600
800
0 1 2 3 4
Loa
d [
kN]
Deformation [mm]
HE400A
¼
⅜
½
⅝
0
200
400
600
800
0 1 2 3 4
Loa
d [
kN]
Deformation [mm]
HE200B
¼
⅜
½
⅝0
200
400
600
800
0 1 2 3 4
Loa
d [
kN]
Deformation [mm]
HE220B
¼
⅜
½
⅝
0
200
400
600
800
0 1 2 3 4
Loa
d [
kN]
Deformation [mm]
HE240B
¼
⅜
½
⅝0
200
400
600
800
0 1 2 3 4
Loa
d [
kN]
Deformation [mm]
HE260B
¼
⅜
½
⅝

D I A p p e n d i x
173 | P a g e
Figure D-15: Load-deformation curves for
HE280B section in S355
Figure D-16: Load-deformation curves for
HE300B section in S355
Figure D-17: Load-deformation curves for
HE320B section in S355
Figure D-18: Load-deformation curves for
HE340B section in S355
Figure D-19: Load-deformation curves for
HE360B section in S355
Figure D-20: Load-deformation curves for
HE400B section in S355
Figure D-21: Load-deformation curve for
HE200A section in S235
Figure D-22: Load-deformation curve for
HE400B section in S235
0
200
400
600
800
0 1 2 3 4
Loa
d [
kN]
Deformation [mm]
HE280B
¼
⅜
½
⅝0
200
400
600
800
1000
0 1 2 3 4
Loa
d [
kN]
Deformation [mm]
HE300B
¼
⅜
½
⅝
0
200
400
600
800
1000
0 1 2 3 4
Loa
d [
kN]
Deformation [mm]
HE320B
¼
⅜
½
⅝0
300
600
900
1200
0 1 2 3 4
Loa
d [
kN]
Deformation [mm]
HE340B
¼
⅜
½
⅝
0
300
600
900
1200
0 1 2 3 4
Loa
d [
kN]
Deformation [mm]
HE360B
¼
⅜
½
⅝0
500
1000
1500
0 1 2 3 4
Loa
d [
kN]
Deformation [mm]
HE400B
¼
⅜
½
⅝
0
50
100
150
200
250
0 1 2 3 4
Loa
d [
kN]
Deformation [mm]
HE200A; ζ = ½
S235
S3550
300
600
900
1200
0 1 2 3 4
Loa
d [
kN]
Deformation [mm]
HE400B; ζ = ½
S235
S355

D I A p p e n d i x
174 | P a g e
D.2 Reinforcement configuration for panels used in parameter study
Panel type 1
Figure D-23: Reinforcement configurations for panels of type 1 for G = ½, ⅔, 1 and 1½
α=
½
α=
1
α=
1½
α =
⅔

D I A p p e n d i x
175 | P a g e
Panel type 2
Figure D-24: Reinforcement configurations for panels of type 2 for G = ½, ⅔, 1 and 1½
α =
⅔α=
½
α=
1
α=
1½

D I A p p e n d i x
176 | P a g e
Panel type 3
Figure D-25: Reinforcement configurations for panels of type 3 for G = ½, ⅔, 1 and 1½
α=
½
α=
1
α=
1½
α =
⅔

D I A p p e n d i x
177 | P a g e
Panel type 4
Figure D-26: Reinforcement configurations for panels of type 4 for G = ½, ⅔, 1 and 1½
α =
⅔α=
½
α=
1
α=
1½
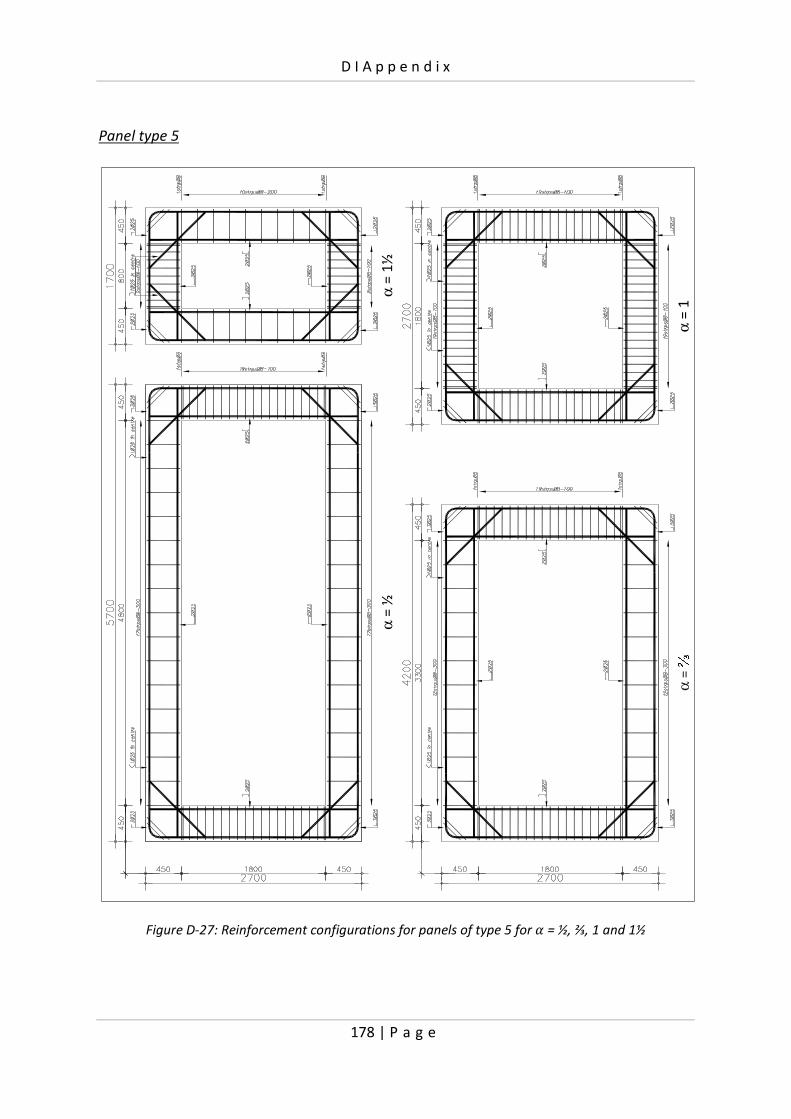
D I A p p e n d i x
178 | P a g e
Panel type 5
Figure D-27: Reinforcement configurations for panels of type 5 for G = ½, ⅔, 1 and 1½
α =
⅔α=
½
α=
1
α=
1½

D I A p p e n d i x
179 | P a g e
D.3 Results parameter study on infilled frame
Figure D-28: Simulated load-deflection response of all infilled frames considered in parameter study
0
200
400
600
800
1000
0 20 40 60
Late
ral l
oa
d [
kN]
Lateral deflection [mm]
Strong frame; α = ½
12
3 45
bare frame
= flexible
= pinned51
0
200
400
600
800
0 20 40 60
Late
ral l
oa
d [
kN]
Lateral deflection [mm]
Weak frame; α = ½
bare frame
= flexible
= pinned
1 2 3 4 5
1 5
0
200
400
600
800
1000
0 20 40 60
Late
ral l
oa
d [
kN]
Lateral deflection [mm]
Strong frame; α = ⅔
bare frame
= flexible
= pinned1
2 3 4
5
1
5
0
200
400
600
800
0 20 40 60
Late
ral l
oa
d [
kN]
Lateral deflection [mm]
Weak frame; α = ⅔
bare frame
= flexible
= pinned
1 2 3 4
5
1 5
0
200
400
600
800
1000
0 20 40 60
Late
ral l
oa
d [
kN]
Lateral deflection [mm]
Strong frame; α = 1
bare frame
= flexible
= pinned
12 3 4 5
15
0
200
400
600
800
0 20 40 60
Late
ral l
oa
d [
kN]
Lateral deflection [mm]
Weak frame; α = 1
bare frame
= flexible
= pinned
15
1 2 3 45
0
200
400
600
800
0 10 20 30
Late
ral l
oa
d [
kN]
Lateral deflection [mm]
Strong frame; α = 1½
bare frame
= flexible
= pinned
51 2 3 4
51
0
100
200
300
400
500
600
0 10 20 30
Late
ral l
oa
d [
kN]
Lateral deflection [mm]
Weak frame; α = 1½
bare frame
= flexible
= pinned
51
2 3 4 51
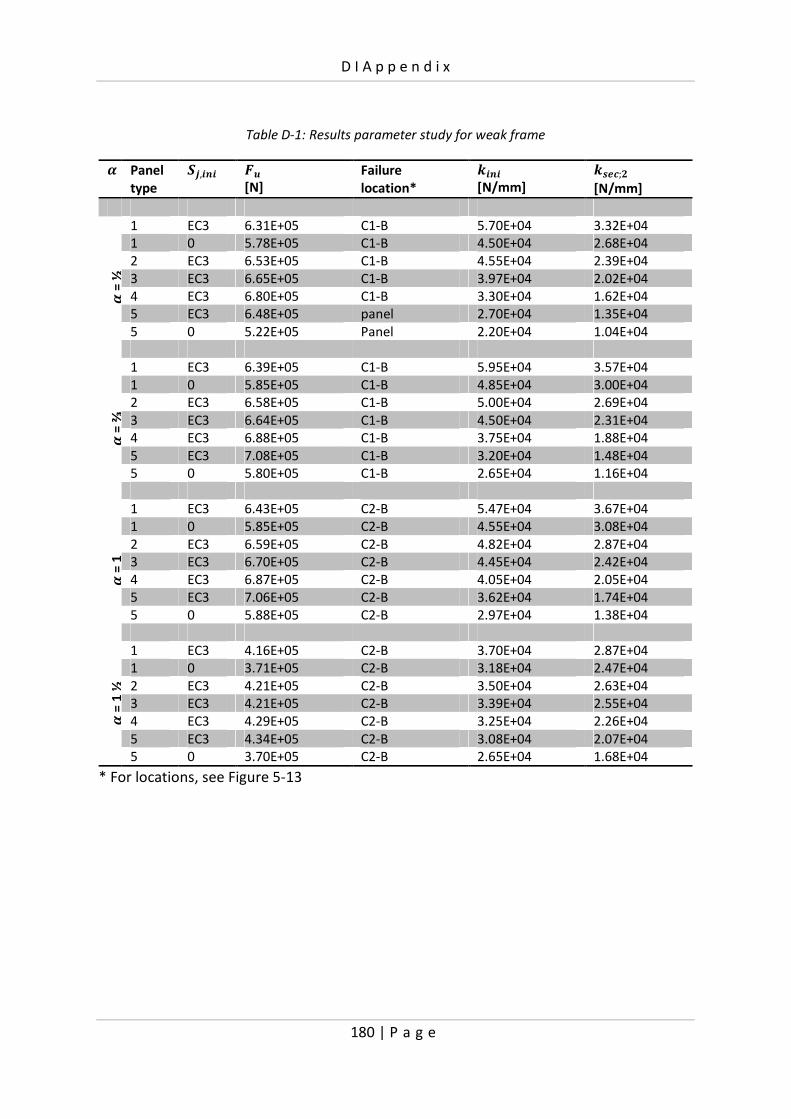
D I A p p e n d i x
180 | P a g e
Table D-1: Results parameter study for weak frame
Æ Panel
type
}»,��� {z
[N]
Failure
location*
���� [N/mm]
����;�
[N/mm]
Æ = ½
1 EC3 6.31E+05 C1-B 5.70E+04 3.32E+04
1 0 5.78E+05 C1-B 4.50E+04 2.68E+04
2 EC3 6.53E+05 C1-B 4.55E+04 2.39E+04
3 EC3 6.65E+05 C1-B 3.97E+04 2.02E+04
4 EC3 6.80E+05 C1-B 3.30E+04 1.62E+04
5 EC3 6.48E+05 panel 2.70E+04 1.35E+04
5 0 5.22E+05 Panel 2.20E+04 1.04E+04
Æ = ⅔
1 EC3 6.39E+05 C1-B 5.95E+04 3.57E+04
1 0 5.85E+05 C1-B 4.85E+04 3.00E+04
2 EC3 6.58E+05 C1-B 5.00E+04 2.69E+04
3 EC3 6.64E+05 C1-B 4.50E+04 2.31E+04
4 EC3 6.88E+05 C1-B 3.75E+04 1.88E+04
5 EC3 7.08E+05 C1-B 3.20E+04 1.48E+04
5 0 5.80E+05 C1-B 2.65E+04 1.16E+04
Æ = 1
1 EC3 6.43E+05 C2-B 5.47E+04 3.67E+04
1 0 5.85E+05 C2-B 4.55E+04 3.08E+04
2 EC3 6.59E+05 C2-B 4.82E+04 2.87E+04
3 EC3 6.70E+05 C2-B 4.45E+04 2.42E+04
4 EC3 6.87E+05 C2-B 4.05E+04 2.05E+04
5 EC3 7.06E+05 C2-B 3.62E+04 1.74E+04
5 0 5.88E+05 C2-B 2.97E+04 1.38E+04
Æ = 1 ½
1 EC3 4.16E+05 C2-B 3.70E+04 2.87E+04
1 0 3.71E+05 C2-B 3.18E+04 2.47E+04
2 EC3 4.21E+05 C2-B 3.50E+04 2.63E+04
3 EC3 4.21E+05 C2-B 3.39E+04 2.55E+04
4 EC3 4.29E+05 C2-B 3.25E+04 2.26E+04
5 EC3 4.34E+05 C2-B 3.08E+04 2.07E+04
5 0 3.70E+05 C2-B 2.65E+04 1.68E+04
* For locations, see Figure 5-13

D I A p p e n d i x
181 | P a g e
Table D-2: Results parameter study for strong frame
Æ Panel
type
}»,��� {z
[N]
Failure
location*
���� [N/mm]
����;�
[N/mm]
Æ = ½
1 EC3 6.92E+05 C1-B 6.75E+04 3.74E+04
1 0 5.78E+05 C1-B 5.85E+04 3.02E+04
2 EC3 7.44E+05 C1-B 5.35E+04 2.78E+04
3 EC3 7.77E+05 C1-B 4.65E+04 2.39E+04
4 EC3 8.46E+05 C1-B 3.85E+04 1.92E+04
5 EC3 8.41E+05 panel 3.16E+04 1.68E+04
5 0 5.37E+05 Panel 2.47E+04 1.07E+04
Æ = ⅔
1 EC3 7.02E+05 C1-B 6.70E+04 4.08E+04
1 0 5.85E+05 C1-B 5.80E+04 3.29E+04
2 EC3 7.44E+05 C1-B 5.60E+04 3.13E+04
3 EC3 7.75E+05 C1-B 5.05E+04 2.72E+04
4 EC3 8.21E+05 C1-B 4.44E+04 2.31E+04
5 EC3 8.99E+05 C1-B 3.70E+04 1.83E+04
5 0 5.81E+05 C1-B 2.90E+04 1.16E+04
Æ = 1
1 EC3 7.15E+05 C2-B 5.50E+04 3.97E+04
1 0 5.84E+05 C2-B 4.65E+04 3.16E+04
2 EC3 7.55E+05 C2-B 4.95E+04 3.21E+04
3 EC3 7.88E+05 C2-B 4.65E+04 2.81E+04
4 EC3 8.34E+05 C2-B 4.25E+04 2.41E+04
5 EC3 8.83E+05 C2-B 3.86E+04 2.13E+04
5 0 5.88E+05 C2-B 3.08E+04 1.38E+04
Æ = 1 ½
1 EC3 5.01E+05 C2-B 3.54E+04 2.95E+04
1 0 3.70E+05 C2-B 2.75E+04 2.14E+04
2 EC3 5.13E+05 C2-B 3.40E+04 2.77E+04
3 EC3 5.20E+05 C2-B 3.30E+04 2.67E+04
4 EC3 5.33E+05 C2-B 3.20E+04 2.51E+04
5 EC3 5.53E+05 C2-B 3.10E+04 2.33E+04
5 0 3.72E+05 C2-B 2.30E+04 1.55E+04
* For locations, see Figure 5-13


183 | P a g e
APPENDIX E
E.1 Derivation of equations [7-21] to [7-24]
The mechanical model for the semi-integral infilled frame presented in Figure E-1 is
considered. The frame joints are represented by rigid offsets to take the depth of the
columns and beams into account. The beams are connected pinned to the columns, thus 31 = 0.
Figure E-1: Mechanical model for semi-integral infilled frame
Considering the equilibrium in horizontal direction (Σ&), gives the horizontal reaction at
support B (d� ):
Σ& H 0 ú d� H
Taking the moment about A gives the vertical reaction at support B (d��):
Σ0��+�� û H 0ú & R d��� H 0
d�� H &� H tan <#
Finally, the sum of the vertical forces Σv gives the horizontal reaction at support A (dû�):
Σv H 0 ú dû� H tan <#
ϕp
Sj=0Fh
RAv RBv
H
L
hcx
hb
xRBh
A B
CD
ϕf
D’ C’
A’ B’
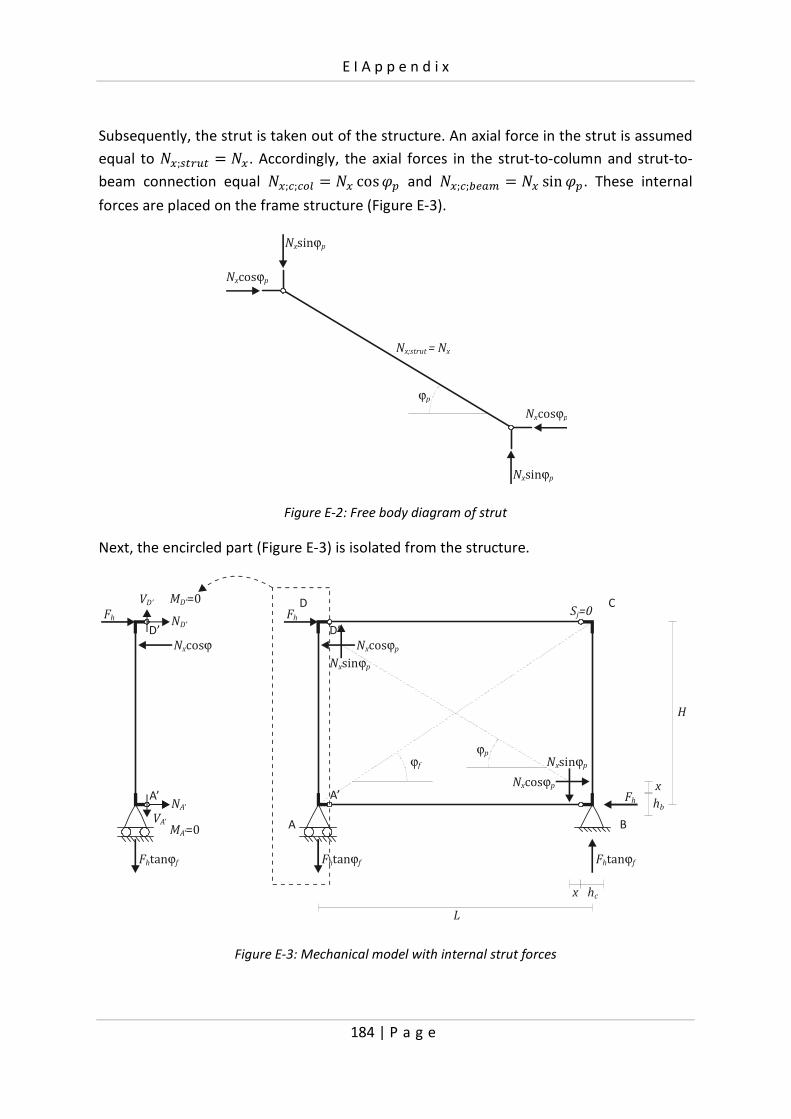
E I A p p e n d i x
184 | P a g e
Subsequently, the strut is taken out of the structure. An axial force in the strut is assumed
equal to B�;��.�� H B�. Accordingly, the axial forces in the strut-to-column and strut-to-
beam connection equal B�;�;�+, H B� cos<! and B�;�;�*�? H B� sin <!. These internal
forces are placed on the frame structure (Figure E-3).
Figure E-2: Free body diagram of strut
Next, the encircled part (Figure E-3) is isolated from the structure.
Figure E-3: Mechanical model with internal strut forces
ϕp
Nxcosϕp
Nxsinϕp
Nxcosϕp
Nxsinϕp
Nx;strut = Nx
Nxcosϕp
ϕp
Sj=0Fh
Nxsinϕp
Nxcosϕp
Nxsinϕp
Nxcosϕ
Fh
D’
Fhtanϕf Fhtanϕf
ND’
VD’
NA’
Fhtanϕf
MD’=0
MA’=0
H
L
hcx
hb
x
ϕf
FhA’
VA’
D C
A B
D’
A’

E I A p p e n d i x
185 | P a g e
Accordingly, the equilibrium of moments is considered for the isolated part of the
structure with respect to point D’:
Σ0��+�� üý H 0
Σ0��+�� üý H B� cos<! l'�2 Z 6m R tan <# l'�2 m R Bûý& H 0
Considering the equilibrium in horizontal direction (Σ&) gives:
Σ& H 0 ú B� cos<! R R Bûý RBüý Büý Z Bûý H B� cos<! R
From symmetry conditions it follows that:
Büý H Bûý Accordingly:
Büý H Bûý H B� cos<! R 2
Substituting Bûý gives:
B� cos<! l'�2 Z 6m R tan <# l'�2 m R & lB� cos<! R 2 m H 0
Accordingly:
B� H Otan <# '� R &Pcos<! D'� Z 26 R &F H cos<! tan <# '� R &'� Z 26 R &
Substituting:
& H tan<# �
Gives:
B� H cos<! Ítan<# '� R tan <# �'� Z 26 R & Î H cos<! Ítan<#D'� R �F'� Z 26 R & Î
Substituting:

E I A p p e n d i x
186 | P a g e
tan <# H &�
Gives:
B� H cos<! Í &D'� R �FD'� Z 26 R &F�Î
Using equation 7-2:
7# H �� R '� [7-2]
Accordingly:
'� R �� H 1R7#
Substitution gives:
B� H &D& R '� R 26F7# cos<! [7-23]
Accordingly, the axial force in the panel-to-column connection (B�;�;�+,) equals:
B�;�;�+, H B� cos<! H &D& R '� R 26F7# [7-21]
The axial force in the panel-to-beam connection (B�;�;�*�?):
B�;�;�*�? H B� sin <! H & tan<!D& R '� R 26F7# [7-22]
The top beam is isolated from the structure. The axial force in the loaded column (B�;�+,;�)
is equal to the shear force vüý (Figure E-4).

E I A p p e n d i x
187 | P a g e
Figure E-4: Free body diagram of top beam
Taking the moment about C’ gives shear force (vüÃ), and thus the axial force in the column:
Σ0��+�� þà H 0 ú B�;�;�*�?D� R '� R 6F R vüÃD� R '�F H 0
düÃ� H B�;�;�*�?D� R '� R 6FD� R '�F
Substitution of equation 7-22 for B�;�;�*�? gives the following equation for the axial force
in the loaded column (B�;�+,;�)
B�;�+,;� H D� R '� R 6F & tan<!D� R '�FD& R '� R 26F7# [7-24]
EIAD’ C’
L-hc
x
Nx;c;beam
VD’
NC’
VC’ MC’=0
ND’
VD’MD’=0
VC’

E I A p p e n d i x
188 | P a g e
E.2 Derivation of equations [7-27] to [7-31]
The bottom frame beam is considered. Assuming it to be connected pinned to the
columns, it can be considered as a simply supported beam as shown in figure E-5. The
length of the beam equals D� R '�F. The beam is loaded by a point load at a distance 6
from support B:
Figure E-5: Bottom frame beam isolated from the structure
Considering the equilibrium of moments about point A’ gives the vertical reaction at
support B’ (d�ý�):
Σ0��+�� ûý H 0 ú d�ý� H D� R '� R 6F� R '�
Subsequently, the sum of the vertical forces Σv gives the vertical reaction at support A
(dûý�):
Σv H 0 ú dûý� H 6� R '�
The vertical deformation at the point load due to shear (9É) can be expressed by the
following equation:
9É H 86
Where:
8 H d�ý�$��;�
Consequently, the stiffness resulting from shear deformation is given by:
�É H 9É H $��;�d�ý�6 H $��;�l D� R '� R 6F� R '� m 6 H
$��;�D� R '�FD� R '� R 6F6 [7-27]
EIAA’ B’
L-hc
x
F
RA’v RB’v
γ
RB’v
RA’v
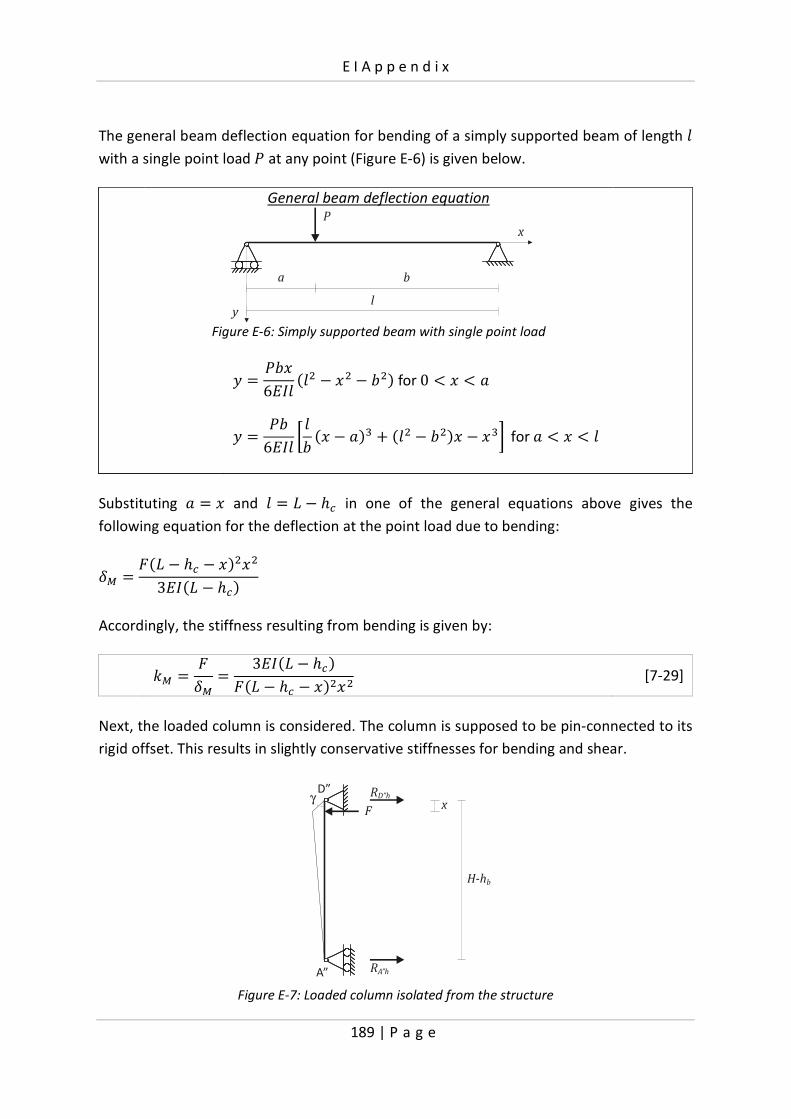
E I A p p e n d i x
189 | P a g e
The general beam deflection equation for bending of a simply supported beam of length / with a single point load  at any point (Figure E-6) is given below.
General beam deflection equation
Figure E-6: Simply supported beam with single point load
� H �66�)/ D/� R 6� R ��F for 0 f 6 f �
� H �6�)/ Y /� D6 R �F Z D/� R ��F6 R 6\ for � f 6 f /
Substituting � H 6 and / H � R '� in one of the general equations above gives the
following equation for the deflection at the point load due to bending:
9Å H D� R '� R 6F�6�3�)D� R '�F
Accordingly, the stiffness resulting from bending is given by:
�ŠH 9ŠH 3�)D� R '�F D� R '� R 6F�6� [7-29]
Next, the loaded column is considered. The column is supposed to be pin-connected to its
rigid offset. This results in slightly conservative stiffnesses for bending and shear.
Figure E-7: Loaded column isolated from the structure
P
a b
l
x
y
F
RA”h
RD”h
H-hb
x
D”
A”
γ

E I A p p e n d i x
190 | P a g e
Considering the equilibrium of moments about point A” gives the horizontal reaction at
support D” (düýý ):
Σ0��+�� ûà H 0ú düýý H D& R '� R 6F& R '�
Subsequently, the sum of the horizontal forces (Σ&) gives the horizontal reaction at
support A” (dûýý ):
Σ& H 0 ú dûýý H 6& R '�
The vertical deformation at the point load due to shear (9É) can be expressed by the
following equation:
9É H 86
Where:
8 H düýý $��;�
Accordingly, the stiffness resulting from shear deformation is given by:
�É H 9É H $��;�düýý 6 H $��;�l D& R '� R 6F& R '� m6 H
$��;�D& R '�FD& R '� R 6F6 [7-28]
The vertical deformation at the point load due to bending is given by the following
equation (specific beam loading case):
9Å H D& R '� R 6F�6�3�)D& R '�F
Consequently, the stiffness resulting from bending is given by:
�ŠH 9ŠH 3�)D& R '�FD& R '� R 6F�6� [7-29]

E I A p p e n d i x
191 | P a g e
E.3 �----â----�-diagrams used for equivalent frame members
The following stress-strain relationships were used for concrete and reinforcement steel
to create the 0-B-C-diagrams (Figure E-8)
Figure E-8: Stress-strain curves for concrete (left) and reinforcement steel (left)
The concrete cover (¢) on the longitudinal reinforcement (Ø25) equals 23 mm.
Figure E-9: 0-B-C-diagram for cross-section 200 x 450 mm
0
5
10
15
20
25
30
35
0 1 2 3 4
σc
[N/m
m2]
εc [Q10-3 mm/mm]
3.5Q10-3
0
100
200
300
400
500
600
0 5 10 15 20
σs
[N/m
m2]
εs [Q10-3 mm/mm]
2.5Q10-3
0
50
100
150
200
250
300
350
0 0.01 0.02 0.03 0.04 0.05 0.06
Mo
me
nt
[kN
m]
Curvature [m-1]
N = 100 kN
N = 300 kN
N = 500 kN
N = 700 kN
200
45
0
As = 982 mm2
A's = 982 mm2

E I A p p e n d i x
192 | P a g e
Figure E-10: 0-B-C-diagram for cross-section 200 x 600 mm
Figure E-11: 0-B-C-diagram for cross-section 200 x 750 mm
0
100
200
300
400
500
0 0.01 0.02 0.03 0.04 0.05 0.06
Mo
me
nt
[kN
m]
Curvature [m-1]
N = 100 kN
N = 300 kN
N = 500 kN
N = 700 kN
200
60
0
As = 982 mm2
A's = 982 mm2
0
100
200
300
400
500
600
0 0.01 0.02 0.03 0.04 0.05 0.06
Mo
me
nt
[kN
m]
Curvature [m-1]
N = 100 kN
N = 300 kN
N = 500 kN
N = 700 kN
200
75
0
As = 982 mm2
A's = 982 mm2
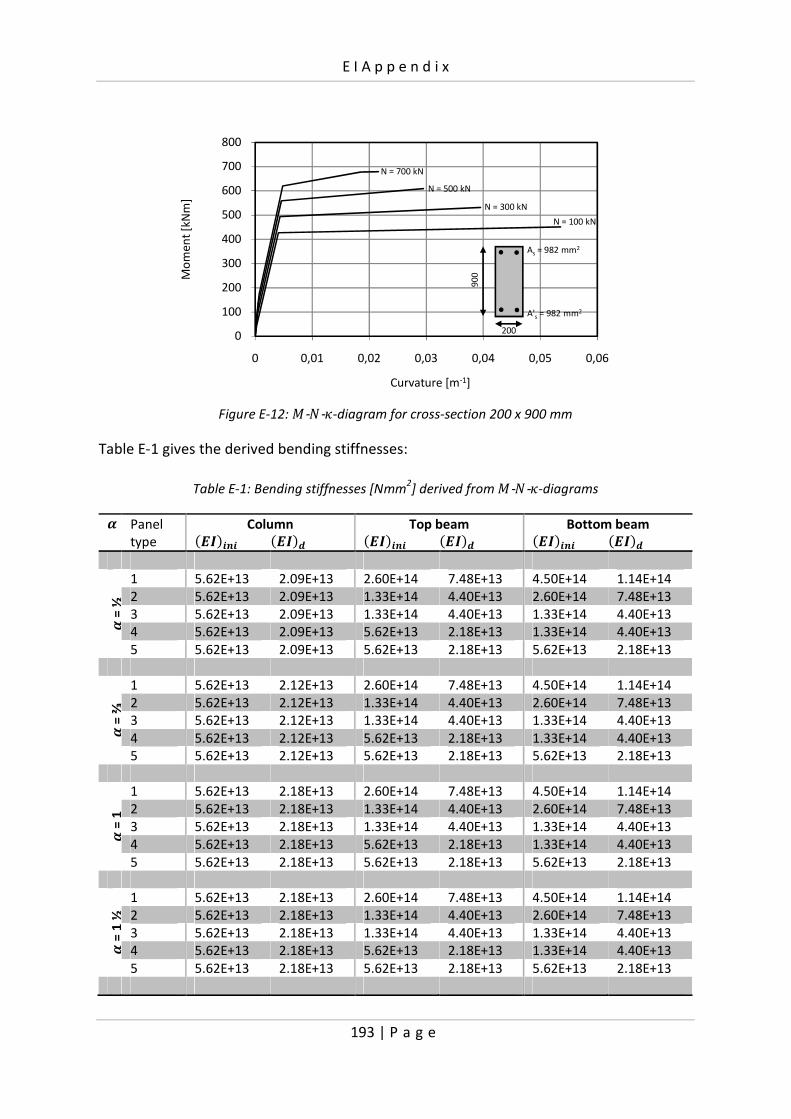
E I A p p e n d i x
193 | P a g e
Figure E-12: �-�-�-diagram for cross-section 200 x 900 mm
Table E-1 gives the derived bending stiffnesses:
Table E-1: Bending stiffnesses [Nmm2] derived from �-�-�-diagrams
� Panel
type
Column
���� ����
Top beam
���� ����
Bottom beam
���� ����
� =
½
1 5.62E+13 2.09E+13 2.60E+14 7.48E+13 4.50E+14 1.14E+14
2 5.62E+13 2.09E+13 1.33E+14 4.40E+13 2.60E+14 7.48E+13
3 5.62E+13 2.09E+13 1.33E+14 4.40E+13 1.33E+14 4.40E+13
4 5.62E+13 2.09E+13 5.62E+13 2.18E+13 1.33E+14 4.40E+13
5 5.62E+13 2.09E+13 5.62E+13 2.18E+13 5.62E+13 2.18E+13
� =
⅔
1 5.62E+13 2.12E+13 2.60E+14 7.48E+13 4.50E+14 1.14E+14
2 5.62E+13 2.12E+13 1.33E+14 4.40E+13 2.60E+14 7.48E+13
3 5.62E+13 2.12E+13 1.33E+14 4.40E+13 1.33E+14 4.40E+13
4 5.62E+13 2.12E+13 5.62E+13 2.18E+13 1.33E+14 4.40E+13
5 5.62E+13 2.12E+13 5.62E+13 2.18E+13 5.62E+13 2.18E+13
� =
1
1 5.62E+13 2.18E+13 2.60E+14 7.48E+13 4.50E+14 1.14E+14
2 5.62E+13 2.18E+13 1.33E+14 4.40E+13 2.60E+14 7.48E+13
3 5.62E+13 2.18E+13 1.33E+14 4.40E+13 1.33E+14 4.40E+13
4 5.62E+13 2.18E+13 5.62E+13 2.18E+13 1.33E+14 4.40E+13
5 5.62E+13 2.18E+13 5.62E+13 2.18E+13 5.62E+13 2.18E+13
� =
1 ½
1 5.62E+13 2.18E+13 2.60E+14 7.48E+13 4.50E+14 1.14E+14
2 5.62E+13 2.18E+13 1.33E+14 4.40E+13 2.60E+14 7.48E+13
3 5.62E+13 2.18E+13 1.33E+14 4.40E+13 1.33E+14 4.40E+13
4 5.62E+13 2.18E+13 5.62E+13 2.18E+13 1.33E+14 4.40E+13
5 5.62E+13 2.18E+13 5.62E+13 2.18E+13 5.62E+13 2.18E+13
0
100
200
300
400
500
600
700
800
0 0,01 0,02 0,03 0,04 0,05 0,06
Mo
me
nt
[kN
m]
Curvature [m-1]
N = 100 kN
N = 300 kN
N = 500 kN
N = 700 kN
200
90
0
As = 982 mm2
A's = 982 mm2


195 | P a g e
CURRICULUM VITAE
Personal data
Name: Paul Teeuwen
Date of birth: November 10th
, 1980
Place of birth: Geldrop, The Netherlands
Current address: Pieter Pauluslaan 23
5652 VD Eindhoven
The Netherlands
E-mail: [email protected]
Education
1999 - 2005 Eindhoven University of Technology
Faculty of Architecture, Building and Planning
Department of Structural Design
Master thesis “The effect of window openings in precast reinforced
concrete infills on the structural behavior of semi-integral infilled
frames”
1993 - 1999 Varendonck College Asten
Atheneum
PhD research
2005 - 2009 Eindhoven University of Technology
Faculty of Architecture, Building and Planning
Department of Structural Design