![Latent Fingerprint Matching: Fusion of Rolled … low performance of latent fingerprint matching [7,8], there is a strong need for the improvement in the fusion of plain and rolled](https://static.fdocuments.us/doc/165x107/5b4e6b147f8b9a6a128b6223/latent-fingerprint-matching-fusion-of-rolled-low-performance-of-latent-ngerprint.jpg)
Latent heat of fusion of ice - NIST Page · ·...
46
LATENT HEAT OF FUSION OF ICE By H. C. Dickinson, D. R. Harper 3d, and N. S. Osborne CONTENTS Page I. Review of previous work 235 1. Determinations previous to 1870 235 2. Determinations subsequent to 1870 236 II. Description of calorimetric methods and apparatus 238 1. Calorimetric methods 238 2. Calorimeter 239 3. Electrical method 242 4. Method of mixtures 245 III. Materials 245 IV. Manipulation of ice 246 1. Manufacture of specimens 246 2. Precooling the specimens 247 3. Temperature of cryostats 247 4. Handling the specimens 248 5. Weighing the specimens 250 6. Handling and weighing the mechanically dried specimens 250 V. Calculation of experimental results 251 1. Electrical method 251 2. Method of mixtures 258 VI. Results 262 VII. Summary 265 I. REVIEW OF PREVIOUS WORK 1. DETERMINATIONS PREVIOUS TO 1870 The determinations of the heat of fusion of ice up to the year 1870 have been reviewed by A. W. Smith, 1 who prepared Table 1 giving a summary of the results: There is great variation among the results of these earlier determinations, many of them are based on but few experiments, and there is little doubt that the experiments were carried out under conditions much less favorable than for those made more recently. 1 Phys. Rev. 17, p. 193; 1903. 235
Transcript of Latent heat of fusion of ice - NIST Page · ·...

LATENT HEAT OF FUSION OF ICE
By H. C. Dickinson, D. R. Harper 3d, and N. S. Osborne
CONTENTSPage
I. Review of previous work 235
1. Determinations previous to 1870 235
2. Determinations subsequent to 1870 236
II. Description of calorimetric methods and apparatus 238
1. Calorimetric methods 238
2. Calorimeter 239
3. Electrical method 242
4. Method of mixtures 245
III. Materials 245
IV. Manipulation of ice 246
1. Manufacture of specimens 246
2. Precooling the specimens 247
3. Temperature of cryostats 247
4. Handling the specimens 248
5. Weighing the specimens 250
6. Handling and weighing the mechanically dried specimens 250
V. Calculation of experimental results 251
1. Electrical method 251
2. Method of mixtures 258
VI. Results 262
VII. Summary 265
I. REVIEW OF PREVIOUS WORK1. DETERMINATIONS PREVIOUS TO 1870
The determinations of the heat of fusion of ice up to the year
1870 have been reviewed by A. W. Smith,1 who prepared Table 1
giving a summary of the results:
There is great variation among the results of these earlier
determinations, many of them are based on but few experiments,
and there is little doubt that the experiments were carried out
under conditions much less favorable than for those made morerecently.
1 Phys. Rev. 17, p. 193; 1903.
235
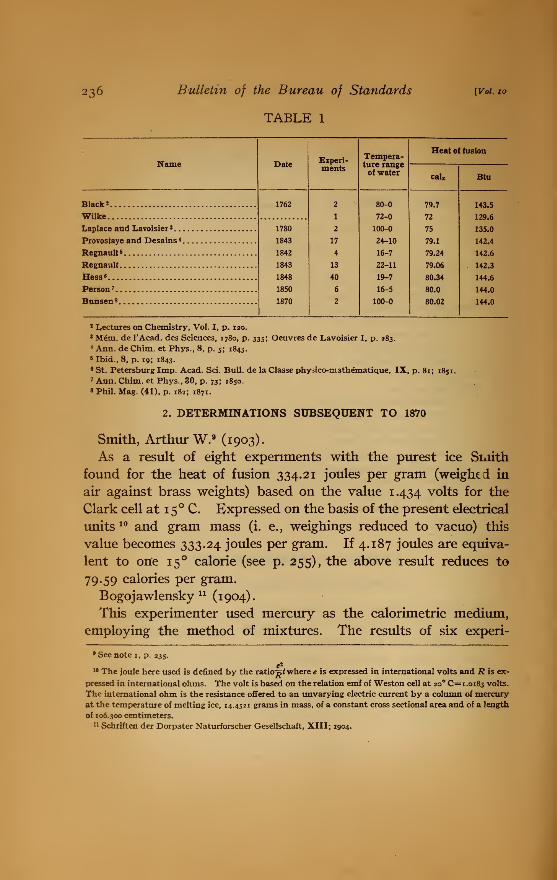
236 Bulletin of the Bureau of Standards
TABLE 1
[Vol. 10
Name Date Experi-ments
Tempera-ture rangeof water
Heat of fusion
calx Btu
Black*
Wilke
Laplace and Lavoisier 3. .
.
Provostaye and Desains *
.
Regnault 5
Regnault
Hess«
Person 7
Bunsen 8
1762
1780
1843
1842
1843
1848
1850
1870
80-0
72-0
100-0
24-10
16-7
22-11
19-7
16-5
100-0
79.7
72
75
79.1
79.24
79.06
80.34
80.0
80.02
143.5
129.6
135.0
142.4
142.6
142.3
144.6
144.0
144.0
2 Lectures on Chemistry, Vol. I, p. 120.
* Mem. de l'Acad. des Sciences, 1780, p. 335; Oeuvres de Lavoisier I, p. 283.
* Ann. de Chim. et Phys., 8, p. 5; 1843.
6 Ibid., 8, p. 19; 1843.
8 St. Petersburg Imp. Acad. Sci. Bull, de la Classe phy>ico-mathematique, IX, p. 81; 1851.
7 Ann. Chim. et Phys., 30, p. 73; 1850.
8 Phil. Mag. (41), p. 182; 1871.
2. DETERMINATIONS SUBSEQUENT TO 1870
Smith, Arthur W. 9(1903).
As a result of eight experiments with the purest ice Smith
found for the heat of fusion 334.21 joules per gram (weighed in
air against brass weights) based on the value 1.434 volts for the
Clark cell at 1
5
C. Expressed on the basis of the present electrical
units 10 and gram mass (i. e., weighings reduced to vacuo) this
value becomes 333.24 joules per gram. If 4.187 joules are equiva-
lent to one 1
5
calorie (see p. 255), the above result reduces to
79.59 calories per gram.
Bogojawlensky n(1904).
This experimenter used mercury as the calorimetric medium,
employing the method of mixtures. The results of six experi-
9 See note i, p. 235.
10 The joule here used is defined by the ratio^ where e is expressed in international volts and R is ex-
pressed in international ohms. The volt is based on the relation emf of Weston cell at 20° C=i.oi83 volts.
The international ohm is the resistance offered to an unvarying electric current by a column of mercury
at the temperature of melting ice, 14.4521 grams in mass, of a constant cross sectional area and of a length
of 106.300 centimeters.11 Schriften der Dorpater Naturforscher Gesellschaft, XIII; 1904.
o$ZZon,Harper
'] Latent Heat of Fusion of Ice 237
ments on the heat of fusion of ice range from 79.41 to 79.91 with
a mean value of 79.61 calories.
He also determined the specific heat of ice over the temperature
range from — 85 C to — 5°.5C. For reduction of the heat of
fusion determinations in which the range of temperature of the
ice was from — io° to o°, he used 0.52 for the specific heat of ice.
Roth, W. A.12(1908).
Roth has assembled the results of a number of determinations
of the density of ice and deduced a value to use in calculating the
heat of fusion of ice from the data of Behn 13 and of Dieterici, 14
both of whom used the Bunsen ice calorimeter.
The density determinations reviewed are as follows
:
Bunsen (Ges. Abh., 3, p. 475), corrected value a 9168
Zakrzevski (Ann. der Phys. (3), 47, p. 155; 1892) 91658
Leduc (Compt. rend., 142, p. 149; 1906) 9176
(•9l6o3
to
• 91795Barnes (Phys. Rev., 13, p. 55; 1901) 91649
Vincent (Phys. Rev., 15, p. 129; 1902). 9160
^He states the mean, excluding Nichol's values, to be 0.9167,
but uses Bunsen's corrected value 0.9168 on the assumption that
the conditions of producing the ice used in that density determi-
nation were nearly the same as those under which the ice calori-
meter is generally used.
Applying this value to Behn's data Roth obtains for heat of
fusion of ice 79.69 cal15o similarly for Dieterici's data 79.60 cal15°.
A summary of the foregoing values giving the results of the most
important determinations subsequent to 1870 is given in Table 2.
» Zs. fur Phys. Chem., 63, p. 441; 1908.
13 Ann, der Phys. (4), 16, p. 653; 1905.
14 Ibid., p. 593; 1905.
2 7647°—14 6

238 Bulletin of the Bureau of Standards
TABLE 2
[Vol. 10.
DateExperi-ments
Heat of fusion
Namecali5° Btu per
per gramJ
pound
Smith 1903
1904
1905
1905
8
6
is 79. 59
79.61
79.69
79.60
143.3
Bogojawlenskv 143.3
Behn (calculated by Roth) 143.4
Dieterici (calculated by Roth) 143 3
Mean 79.62 143.3
15 The determinations of Smith have been recalculated to the basis of the 15° calorie and the gram mass.
The remaining values are taken from the publications cited.
II. DESCRIPTION OF CALORIMETRIC METHODSAND APPARATUS
1. CALORIMETRIC METHODS
Two methods of calorimetry were employed in this work. In
both methods the precision calorimeter described later was used,
with calorimetric platinum resistance thermometers, water being
the calorimetric medium. One was the well-known method of
mixtures. The other was an electrical method somewhat resem-
bling that of A. W. Smith, but differing from it in the use of water
instead of oil as the calorimetric medium, in the form and size
of ice specimens, and in the type of calorimeter and thermometers.
The ice sample was put directly into the water and the approxi-
mate amount of energy required to melt the ice supplied electri-
cally and measured, the small excess or deficiency being determined
from the small rise or fall of temperature of the calorimeter.
The temperature of the calorimeter water thus remained very
constant, although a large amount of ice was used, and the cor-
rections for heat interchange between calorimeter and surround-
ings were rendered small.
Although the electrical method as here carried out is the more
precise because of the avoidance of large cooling corrections,
nevertheless the ultimate accuracy with which the results can be
expressed in terms of the calorie is limited by the accuracy with
which the ratio of the joule to the calorie is known (at present

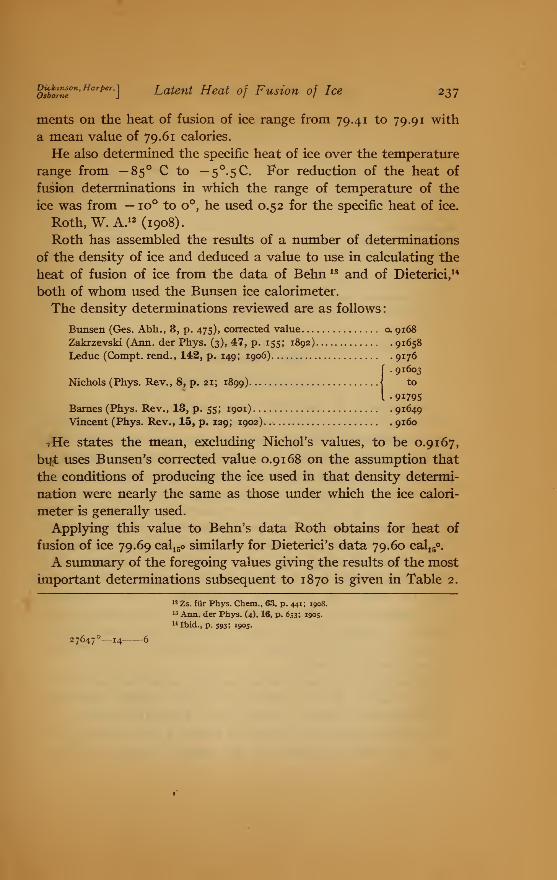
Fig. 1.
—
The calorimeter, assembled as used
Fig. 2.— The calorimeter, detail ofparts
osbkoin
S
e°n ' Harper
'] Latent Heat of Fusion of Ice 239
probably about 1 part in 2000) ; and for this reason the less pre-
cise method of mixtures was used as a direct and independent
check.
The methods of manipulation are described more in detail
later (pp. 242-245).
2. CALORIMETER
A calorimetric outfit originally developed for use with combus-
tion bombs, but which has proved very well adapted to various
calorimetric problems, was used without modifications for the
present investigation. This calorimeter is described briefly below.
A more detailed description of it will be communicated in the
paper cited in footnote 23, p. 260.
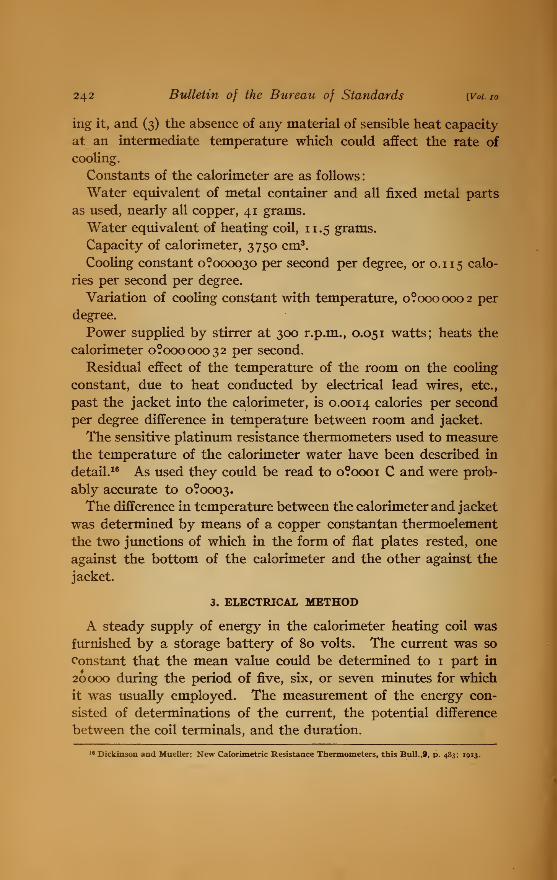
Fig. 1 shows the jacket and the induction motor as they appear
in use.
The stirrer mounted in the cover . automatically keeps water
from the jacket circulating through the cover. The parabolic
speed indicator mounted on top of this stirring shaft indicates
the speed of stirring.
The current and potential leads to the electric heating coil are
brought in across the top of the jacket inside of a closely fitting
copper sheath (Q), from which they are insulated by thin mica.
The sheath is in close contact with the top of the jacket and is
covered with a felt pad, so that the leads will be very nearly at
the same temperature as the jacket.
Terminals to the heating coil in the jacket, and the upper part
of the thermostat used when necessary to maintain a constant
temperature in the jacket, are also shown, marked (H) and (T).
Fig. 2 shows the jacket with its cover turned aside to admit
the calorimeter, illustrating how the cover is conveniently opened
and closed without interfering with the stirring in the jacket.
The calorimeter proper (C) , with its cover and detachable handle
(L) , and the heating coil (M) are shown at the right. The figure
also includes a displacement buoy (D) and a combustion bomb(B) not used in these experiments. A heating coil (H) for the
jacket and the thermostat (T) appear at the left.

240 Bulletin of the Bureau of Standards [Vol. 10
Fig. 3.
—
Section through calorimeter

Dickinson, Harper,Osborne Latent Heat of Fusion of Ice 241
Fig. 3 shows the details of construction, representing a section
through the three stirring shafts. The direction of circulation of
the water is indicated by arrows. The main jacket stirrer draws
water from the bottom of the jacket, sending part of it through
the cover, which is at a higher level than that of the water in
the jacket, and allowing the remainder to overflow into the upper
part of the jacket. The method of connecting the calorimeter
Fig. 4.
—
Plan of calorimeter
stirrer to its shaft is also shown. The energy supplied by the
stirrer is due to fluid friction only, since there is no bearing within
the calorimeter.
Fig. 4 is a plan of the instrument with the cover open.
There are thus realized (1) a well-stirred water calorimeter, (2)
a very nearly uniform temperature jacket completely surround-
242 Bulletin of the Bureau of Standards [Voi.io
ing it, and (3) the absence of any material of sensible heat capacity
at an intermediate temperature which could affect the rate of
cooling.
Constants of the calorimeter are as follows
:
Water equivalent of metal container and all fixed metal parts
as used, nearly all copper, 41 grams.
Water equivalent of heating coil, 11.5 grams.
Capacity of calorimeter, 3750 cm3.
Cooling constant o?oooo3o per second per degree, or o. 1 1 5 calo-
ries per second per degree.
Variation of cooling constant with temperature, o?000 000 2 per
degree.
Power supplied by stirrer at 300 r.p.m., 0.051 watts; heats the
calorimeter o?oooooo32 per second.
Residual effect of the temperature of the room on the cooling
constant, due to heat conducted by electrical lead wires, etc.,
past the jacket into the calorimeter, is 0.0014 calories per second
per degree difference in temperature between room and jacket.
The sensitive platinum resistance thermometers used to measure
the temperature of the calorimeter water have been described in
detail. 16 As used they could be read to o?oooi C and were prob-
ably accurate to o?ckx>3.
The difference in temperature between the calorimeter and jacket
was determined by means of a copper constantan thermoelement
the two junctions of which in the form of flat plates rested, one
against the bottom of the calorimeter and the other against the
jacket.
3. ELECTRICAL METHOD
A steady supply of energy in the calorimeter heating coil was
furnished by a storage battery of 80 volts. The current was so
constant that the mean value could be determined to 1 part in
20000 during the period of five, six, or seven minutes for which
it was usually employed. The measurement of the energy con-
sisted of determinations of the current, the potential difference
between the coil terminals, and the duration.
19 Dickinson and Mueller: New Calorimetric Resistance Thermometers, this Bull. ,9, p. 483; 1913.
Dickinson, Harper.lOsborne J
Latent Heat of Fusion of Ice 243
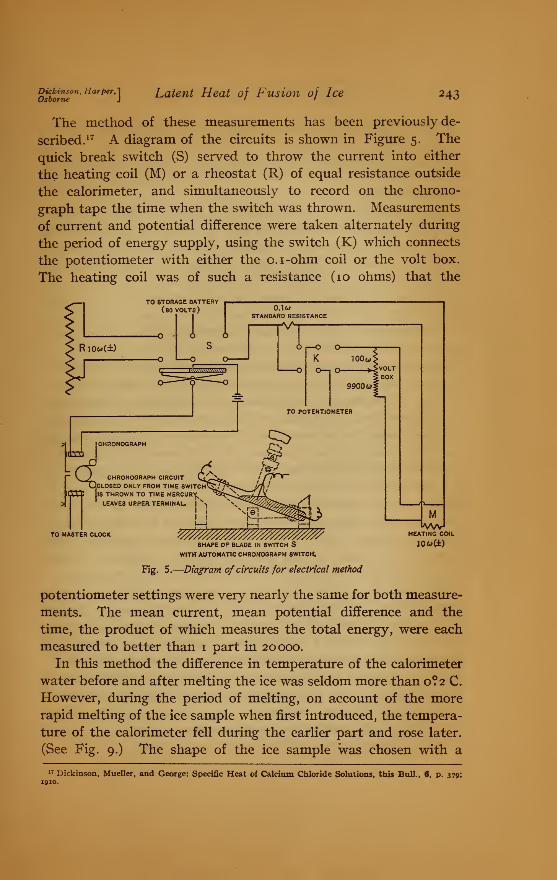
The method of these measurements has been previously de-
scribed. 17 A diagram of the circuits is shown in Figure 5. The
quick break switch (S) served to throw the current into either
the heating coil (M) or a rheostat (R) of equal resistance outside
the calorimeter, and simultaneously to record on the chrono-
graph tape the time when the switch was thrown. Measurements
of current and potential difference were taken alternately during
the period of energy supply, using the switch (K) which connects
the potentiometer with either the 0.1-ohm coil or the volt box.
The heating coil was of such a resistance (10 ohms) that the
TO STORAGE BATTERY(80 VOLTS
TO MASTER CLOCKbwvJ
HEATING COIL
J06>Ct)SHAPE OF BLADE IN SWITCH SWITH AUTOMATIC CHRONOGRAPH SWITCH.
Pig. 5.
—
Diagram of circuits for electrical method
potentiometer settings were very nearly the same for both measure-
ments. The mean current, mean potential difference and the
time, the product of which measures the total energy, were each
measured to better than 1 part in 20000.
In this method the difference in temperature of the calorimeter
water before and after melting the ice was seldom more than o?2 C.
However, during the period of melting, on account of the morerapid melting of the ice sample when first introduced, the tempera-
ture of the calorimeter fell during the earlier part and rose later.
(See Fig. 9.) The shape of the ice sample was chosen with a
17 Dickinson, Mueller, and George: Specific Heat of Calcium Chloride Solutions, this Bull., 6, p. 379;1910.
244 Bulletin of the Bureau of Standards [Vol. 10
view to making the rate of melting as uniform as possible.
(See p. 246.)
The mean temperature difference between calorimeter and jacket
was obtained by observations on the thermoelement at half-
minute intervals.
The procedure for a determination was as follows: The ice
specimen of suitable shape and size was weighed approximately
to determine the amount of water necessary to accommodate it
in the calorimeter. This amount of water was weighed into the
calorimeter, the calorimeter was put in place in the jacket, and
the heating coil placed in the calorimeter. The jacket cover was
then closed, the thermometer inserted, the stirrer started, and
the temperature of the calorimeter adjusted ,to that of the jacket
by use of the thermocouple. Meanwhile the ice specimen was
accurately weighed and the heating current adjusted to supply the
required amount of energy when flowing for a suitable integral
number of minutes, so determined by preliminary experiments
as to cause least variation in temperature of the calorimeter.
To avoid error due to the contact device on the standard clock, the
current was always thrown on and off at the same break second.
After several observations of the temperature of the calorimeter,
the operations of opening and closing the jacket cover were per-
formed in the same manner as when introducing an ice speci-
men and the temperature was again observed in order to deter-
mine the thermal effect of opening. This was found to be from
o?ooi to o?oo4 and to vary with surrounding conditions, so that
as a precaution it was observed for nearly every determination.
With all in readiness the cover was opened, the specimen
introduced as described later (p. 248) , the heating current thrown
on, the cover closed, stirrer started, and thermometer reinserted,
all these manipulations taking place according to a prearranged
program. One observer immediately began to take the poten-
tiometer readings and the other took frequent readings on the
thermocouple for the temperature difference between calorimeter
and jacket until the temperature again became steady. Thenanother accurate temperature determination was made by meansof several observations with the resistance thermometer.

o%kJrZ
(m,Harper'} Latent Heat of Fusion of Ice 245
The small change in temperature of the calorimeter, the heat
loss or gain to the jacket, and the effect of opening the calo-
rimeter are treated as corrections to the total measured energy
supplied electrically.
The cooling constant, effect of stirring and lead conduction,
and thermocouple sensibility were frequently determined, although
the corrections due to these factors proved so small as to render
this precaution almost unnecessary.
4. METHOD OF MIXTURES
In the determinations by the method of mixtures the heating
coil and the apparatus for measurement of electric energy were
not required. In other respects the apparatus and experimental
procedure were similar to those of the electrical method except
that, owing to the desirability of keeping the cooling correction
within suitable limits, smaller specimens of ice (100 to 200 grams)
were found better suited to the method of mixtures.
The initial temperature of the calorimeter was made slightly
lower than that of the jacket and the final temperature was
from 3 to 6° lower, depending upon the amount of ice melted.
The temperature difference between jacket and calorimeter dur-
ing the experiment was in some cases determined by the thermo-
couple and in others by the resistance thermometer. The cooling
corrections in this method were usually of the order of 2 per
cent of the total heat in question.
III. MATERIALS
The ice used for most of the determinations was commercial
artificial can or plate ice frozen from city filtered water which wasdistilled and boiled before freezing. The samples were especially
selected for clearness and freedom from bubbles. The can ice
was the same as that used regularly at the Bureau of Standards
for determining ice points of thermometers. Frequent conduc-
tivity tests showed it to be very pure.
For purposes of comparison, determinations were made on ice
from several other sources. Natural ice, about one foot thick,
246 Bulletin of the Bureau of Standards [Voi.io
from Maine was used in preparing the specimens for five of the
experiments. This ice was not very clear in appearance, contain-
ing many air bubbles, but conductivity tests showed that it was
nearly as pure as double-distilled water.
A number of specimens were prepared from double-distilled
water frozen in a tin-lined cylindrical copper vessel constructed
to give samples of the required shape and size. The water was
either first boiled to remove dissolved air and then frozen as quickly
as possible or else the vessel was evacuated and the water frozen
while the air was excluded. These processes were not entirely
successful in producing perfectly clear ice, although ice of a very
good degree of clearness was obtained.
One sample was frozen from water purposely contaminated
with a mixture of ammonia, sodium chloride and calcium chlo-
ride, to the extent of about 1 part in 1000.
IV. MANIPULATION OF ICE
1. MANUFACTURE OF SPECIMENS
In order to secure greater uniformity in the rate of melting
than would obtain with solid blocks, specimens were made in the
shape of hollow circular cylinders of about 9.5 cm outside diam-
eter and from 2 to 4 cm inside diameter. The lengths varied
from about 3 cm to 9.5 cm. Fig. 6 shows a photograph of two of
the specimens in the copper holders.
In making the specimens from commercial ice a rectangular
piece was first sawed from the selected solid block. By planing
with an ordinary ice shaver this was worked down to a cylinder
of the required diameter, which was then sawed into the lengths
desired. A hole was drilled through the principal axis of each
specimen and enlarged to proper size by running tap water. Afew of the specimens, which were dried mechanically at the melt-
ing point, were left solid. The ice which was frozen in the cylin-
drical copper can was obtained in the form of a hollow cylinder
and required only to be sawed into the desired lengths.
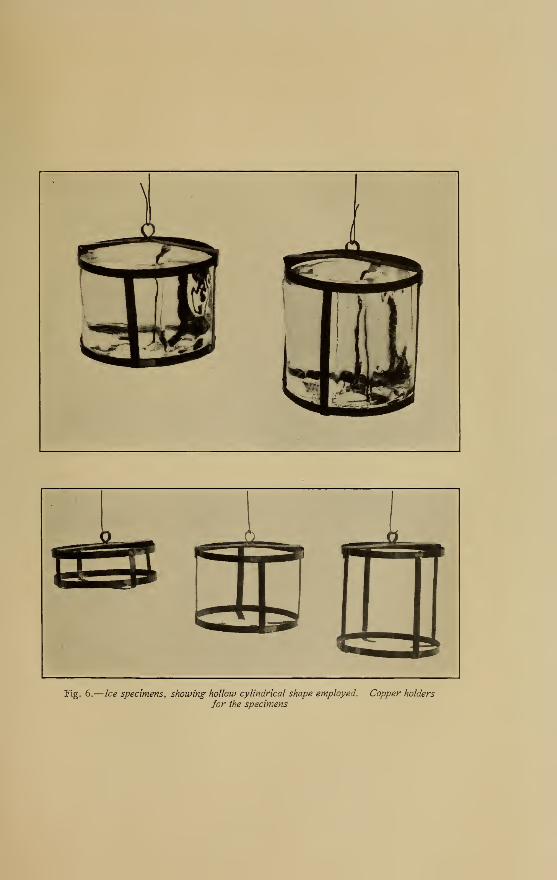
Fig. 6.
—
Ice specimens, showing hollow cylindrical shape employed. Copper holders
for the specimens


ofbkJZ°
n,Harper'] Latent Heat of Fusion of Ice 247
2. PRECOOLING THE SPECIMENS
DESCRIPTION OF CRYOSTATS
In order to insure the dryness of the ice, except for the few
specimens which were mechanically dried, and to bring the speci-
mens to a definite temperature before the determination, two
cryostats were used. One of these cryostats is shown in section
in Fig. 7. The cylindrical copper vessel (A) is supported within
a larger cylindrical vessel externally insulated by cork chips (C)
within a wooden box. The space (B) between the two vessels is
packed solidly with a cryohydric mixture of finely shaved ice, a
suitable salt, and saturated aqueous solution of the salt. The top
of the vessel (A) is covered with a removable vessel (E), also
filled with the cryohydric mixture. A tube extends through this
cover to admit the suspension hook (G) used in weighing the
specimens. The insulating covers (D) and (F) are removable.
The other cryostat was similar in construction, but had some-
what thicker insulation and lacked the central tube in the remov-
able cover. The one is called the weighing cryostat and the other
the storage cryostat. Three specimens could be accommodatedin the storage cryostat and two in the weighing one, as shown.
For a day's series of determinations, the specimens were placed
in the cryostats the previous afternoon, allowing at least 16 hours
for the specimens to come to a constant temperature before the
determinations were made. The salts employed were boric acid
and magnesium sulphate, U.S.P. purity.
3. TEMPERATURE OF CRYOSTATS
For determining the temperature attained in the cryostats,
surveys by means of copper-constantan thermoelements were
made. Single junctions at various points on the interior wall of
the cryostat were each connected to a reference junction kept in
ice. The thermo electromotive force was measured by a potentio-
meter, and although the sensibility was a fraction of a microvolt,
the accuracy of the temperatures may not have been better thano?05 C, on account of the fact that the thermoelements were not
rigidly inclosed and possibly not always immersed to the samedepth.

248 Bulletin of the Bureau of Standards [Voi.io
The temperature uniformity of the interior walls was found to
be better in the storage cryostat than in the weighing one, both
as to vertical distribution and constancy with time.
Further test as to the temperature assumed by an ice specimen
in the cryostats was made by inserting four junctions directly
into holes drilled in the ice. The holes were then filled with water,
plugged up, the water frozen and the specimen placed in the
cryostat as when preparing for a determination. It was found
that a specimen thus prepared and put in the cryostat at 4 p. m.attained by 9 a. m. next day an equilibrium temperature condi-
tion within the accuracy of the tests referred to above.
Transfer of the specimen from the storage cryostat to the
weighing one produced a small rise of temperature which per-
sisted while the specimen was kept in the weighing cryostat.
The change is therefore doubtless due to the slightly higher aver-
age temperature of this cryostat, owing partly to the smaller
cover vessel and partly to the central tube through the cover.
As a result of these surveys the temperature of the specimens
either cooled in the storage cryostat with the boric acid mixture
and then transferred to the weighing cryostat, or else cooled in
the later was found to be — o?72 C. With the magnesium sulphate
mixture the observations showed that the temperature of the
specimen should be taken as — 3^78 C.
4. HANDLING THE SPECIMENS
For handling the specimens, when packing them in the cryo-
stats, weighing, and transferring to the calorimeter, they were
inclosed in holders made of sheet copper, as shown in Fig. 6. Thebar across the top which carries the supporting ring is detachable
for inserting the specimen. Each was provided with a loop of
linen thread passed through the ring, by means of which the
specimen could be transferred to the weighing cryostat and then
lifted until the suspension hook was engaged in the ring. Thethread was then cut and removed, leaving the specimen hanging,
as shown in Fig. 7. After weighing, the specimen was trans-
ferred to the calorimeter by lifting the cover vessel, suspension
hook, and specimen together from the cryostat, carefully lower-

Dickinson, Harper,!Osborne J
Latent Heat of Fusion of Ice 249
%^3x
fill
»<1
H1°
6-5:6^5pep "$2.0
til
?„&
§§£%
^M^Sfc^
Fig. 7.
—
Section through oyostat, by use of which ice specimens were brought to a fixed,
known temperature

250 Bulletin of the Bureau of Standards [Voi.io
ing the specimen into the open calorimeter, and then detaching
the hook, leaving the specimen immersed in the water. This
transfer required only two to three seconds.
5. WEIGHING THE SPECIMENS
The precooled specimens were weighed while suspended in the
cryostat (Fig. 7) placed beneath the balance. A suspension wire
from a hook under the left balance pan led down through the bal-
ance support to the hook extending into the cryostat. Themethod of substitution was used in weighing. A fixed counter-
poise was kept upon the right pan throughout the weighing.
With the specimen suspended the weights necessary upon the
left pan were determined. After the specimen was removed for
the determination, the suspension alone was balanced, the dif-
ference between this and the previous balance reading giving the
weight of specimen and holder. The weights of the holders were
determined separately. Correction for air buoyancy was made,
thus the results are expressed in mass units.
The balance used in weighing ice specimens was constructed
by A. Collot, of Paris. It was air damped and read directly to
1 mg by means of a microscope sighted on a scale attached to
the pointer. The results for mass are given only to the nearest
centigram.
6. HANDLING AND WEIGHING THE MECHANICALLY DRIED SPECIMENS
These specimens, cut in the form of solid circular cylinders,
were wrapped loosely in linen cloths to absorb the water pro-
duced by melting. The wrapped specimen was placed in a
beaker and weighed. By means of a copper harness previously
fastened about the specimen, it was removed from the beaker
and after removing the wrappings the ice was placed in the open
calorimeter as with the precooled specimens. ' The wrappings
were returned to the beaker and weighed to give the tare.
OsfaZ°n
'Harper
'] Latent Heat of Fusion of Ice 251
V. CALCULATION OF EXPERIMENTAL RESULTS
1. ELECTRICAL METHOD
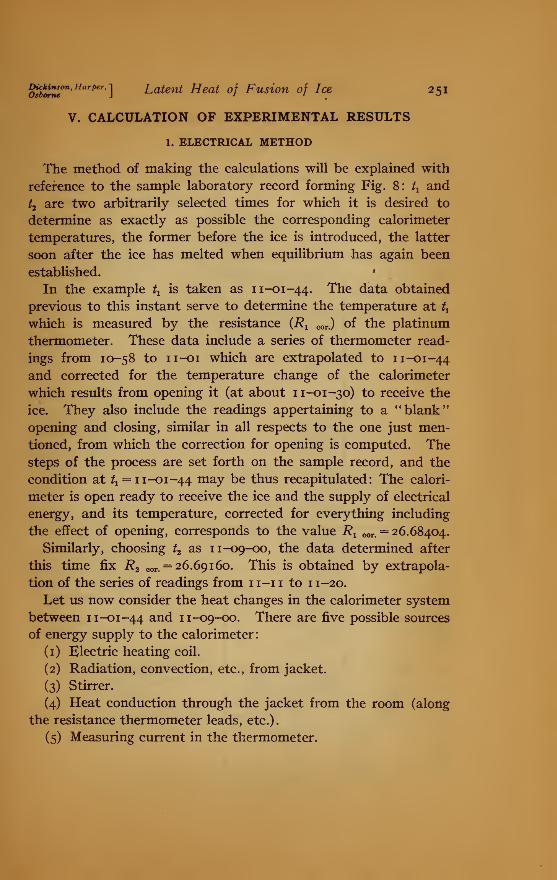
The method of making the calculations will be explained with
reference to the sample laboratory record forming Fig. 8: tt and
t2 are two arbitrarily selected times for which it is desired to
determine as exactly as possible the corresponding calorimeter
temperatures, the former before the ice is introduced, the latter
soon after the ice has melted when equilibrium has again been
established.
In the example tt is taken as 11-01-44. The data obtained
previous to this instant serve to determine the temperature at tt
which is measured by the resistance (i?x cor.) of the platinum
thermometer. These data include a series of thermometer read-
ings from 10-58 to 1 1-01 which are extrapolated to 11-01-44and corrected for the temperature change of the calorimeter
which results from opening it (at about 11-01 -30) to receive the
ice. They also include the readings appertaining to a "blank"
opening and closing, similar in all respects to the one just men-
tioned, from which the correction for opening is computed. Thesteps of the process are set forth on the sample record, and the
condition at ^ = 11-01-44 may be thus recapitulated: The calori-
meter is open ready to receive the ice and the supply of electrical
energy, and its temperature, corrected for everything including
the effect of opening, corresponds to the value Rx cor<= 26.68404.
Similarly, choosing t2 as 11-09-00, the data determined after
this time fix R2 cor.= 26.69160. This is obtained by extrapola-
tion of the series of readings from 11-11 to 11-20.
Let us now consider the heat changes in the calorimeter system
between 11-01-44 and 11-09-00. There are five possible sources
of energy supply to the calorimeter
:
(1) Electric heating coil.
(2) Radiation, convection, etc., from jacket.
(3) Stirrer.
(4) Heat conduction through the jacket from the room (along
the resistance thermometer leads, etc.).
(5) Measuring current in the thermometer.
2>2 Bulletin of the Bureau of Standards Vol. 10
BUREAU OF STANDARDS•Haaljtttgtim
Observers HOD DRH NSOComputed by DRH CALORIMETER RECORD
Dale Feb. 13, WISExpt. No. 1
TIME DIF. RESISTANCE NOTES
tn 11-01-00 (Effect of opening) 10-54 2 26. 68431 Br. BS7481 at 30°C
ti 01-44 10-56 26. 68436 55 3 8433 Calib. of 1-27-13
dt 44 sec. 2 min. rise= 4 56 8436 Ratio 100 R.
ri 0. 00002 per min. . 68440 open ed ca lorimeter Therm. B. S. 4727
ndt + 2 10-58 . 68418 58 26. 68418 4.5 mil'amps.
Ri 26. 68424 Cooled by opening . 00022 59 8421
— 22 (opening) (O 090022) 11-00 8422
Rioor. 26.63404 01 8424
Pot. No. L & N 3314 Cell No. 343 (1.01824 volts)
Volt Box No. Wolff 4898 Std. Res. No. L & N 7354 01-49 Ice in
Temp. 16°4 Temp. 1698 (Thermocouple)
11-02-30 . 67539 11-03 . 67578 11-02 15.2 x-15.0
04 37 04-30 76 -30 17.2
05-30 34 06 75 03 20.5
07 31 22.8
04 22.8
Mean . 67535 Mean . 67576 22.8
Pot. Cor. - 3 Pot. Cor. - 3 05 21.2
Vltb. fctr. + 3 Res. Std. - 51 21.2
Vlt. bx. cur. - 67 06 20.2
18.6
Volts 67. 535 Amperes 6. 7455 07 16.5
Resistance Power 455. 56 16.1
08 14.7
on 11-01-44.45 Time 359. 92 Energy 163964. (joules) 15.0
off 07-44. 37 = 39160. s (calir,) 09 14.9
tR 11-11-00 Calorimeter No. 7602 09-15 14. 90 and steady
09-00 Gross weight 3700.
dt 2 min Cor. to wts. - 0.
2
11-11 26. 69161 18. 65= average
r» 0. 000007 per min Tare - 409.
5
12 9162 15. 00 (zero setting)
rjdt - 1 Buoyancy cor. + 3.
5
13 9162 3. 65cm=av. defl.
R 8 26. 69161 Mass water 3293. 8 14 9163 during 7 min.
Ricor. 26.69160(015912) Heat cap. (15°) 3294.
Rioor. 26.68404 Calorimeter, etc. 38. 20 9167 (1 cmO 09145)
dlff .00756 Heater 12. 3. 65 cmO 0953
Bdg ± Total Heat cap. 3344
Calo rimet er gains 0.1 15 caL per sec
dR . 00756 Ice-Sample No. 66 in holder F whenl cool er than jack et 0953
Kk.r&7 4 ROOM TEMP. JACKET below ( onave rage) for 420 sec.
6d
Equiv. (M190760 THERM.(C0R.) THERM. 4190 Receive s 25.4 calories
) 3344 Time Temp. Time Temp.
Mn. Tmp. 15908 13.9° 10.56 159196 Stirre r sup plies 0.75cal. per min. for 7 min.
3344X0. 0760= (-) 254.1 11.09 .188 5.3 c al.
Cooling cnrr. 25. 4 13.5 11.20 .181
Stirrer 5.
3
Electric heater 39160. 2
38937. calls to melt sample 66, heating it and holder F to 15912
Fig. 8.
—
Laboratory record of an experiment by the electrical method
ofborZ°n ' Harper
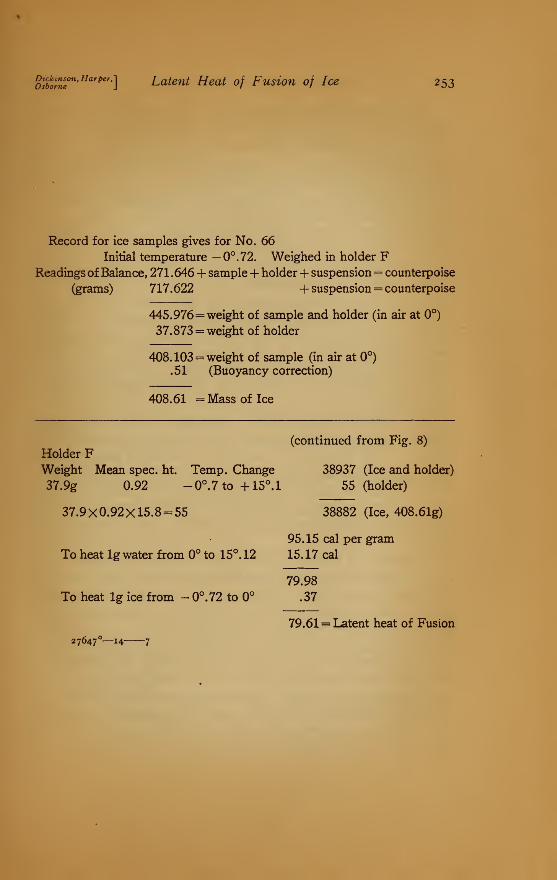
'] Latent Heat of Fusion of Ice 253
Record for ice samples gives for No. 66
Initial temperature — 0°.72. Weighed in holder FReadings of Balance, 271.646 + sample + holder -f suspension= counterpoise
(grams) 717.622 + suspension = counterpoise
445.976= weight of sample and holder (in air at 0°)
37.873 = weight of holder
408.103 = weight of sample (in air at 0°)
.51 (Buoyancy correction)
408.61 = Mass of Ice
(continued from Fig. 8)
Holder FWeight Mean spec. ht. Temp. Change 38937 (Ice and holder)
37.9g 0.92 -0°.7to +15°.l 55 (holder)
37.9X0.92X15.8= 55 38882 (Ice, 408.61g)
95.15 cal per gram
To heat lg water from 0° to 15°. 12 15. 17 cal
79.98
To heat lg ice from - 0°.72 to 0° .37
79.61 = Latent heat of Fusion
27647 —14 7

254 Bulletin of the Bureau of Standards [Voi.io
Some of these sources may be sinks, which can readily be taken
into account by the use of the negative sign when necessary.
The energy so supplied may go to
—
(6) Heating the ice to o°, melting it and heating the resulting
water to the final calorimeter temperature.
(7) Heating the copper holder of the ice specimen.
(8) Raising the temperature of the calorimeter.
(9) Evaporating water from the calorimeter.
The last two may be negative, depending on the conditions.
No ambiguity arises, however, from the more or less arbitrary
division which has been made. It is assumed that these nine
processes alone take place, and that when they have all been
considered, all the energy changes will be accounted for. It maybe shown that (4), (5), and (9) were probably less than one ten-
thousandth part of (1) in all of the experiments. They were
therefore neglected in making the reductions. The remaining six
terms are computed in full on the records pertaining to each
experiment.
Lead Conduction (4).—The calorimeter and jacket were
usually a degree or two warmer than the room, but never morethan 4 . The heat which reaches the calorimeter due to imper-
fect jacketing being 0.0014 calories per second per degree differ-
ence of temperature, a maximum of 3 calories might be intro-
duced under the most unfavorable conditions, which is to be
compared with the 30000 to 40000 calories required to melt the
ice.
Thermometer Current (5).—The average current employed was
4.5 milliamperes and the thermometer resistance was about 27
ohms, so that the effect of this supply of energy on the tempera-
ture of the calorimeter would be absolutely inappreciable even
were the thermometer circuit closed all the time.
Evaporation (9).—The large value of the latent heat of vapori-
zation of water involves an appreciable quantity of energy in the
evaporation or condensation of but a few milligrams, and unless
the procedure be carefully planned serious error may result. Asomewhat extended investigation into the evaporation from and
condensation on calorimeter surfaces has been carried out in the
laboratories of the Bureau of Standards and will be published in

o%kJnT
n,Harper'] Latent Heat of Fusion of Ice 255
a separate communication. From the results, it is sufficient to
note here that although the top water surface of the calorimeter
remained uncovered, in order that the ice might be introduced
quickly and without spilling water, the procedure was such that
probably no error in excess of 1 part in 10000 was introduced.
Electrical Energy (1).—The data for this are collected in the left
central portion of the sample record. The process of securing the
readings is described on page 242. By reference to figure 5 it maybe seen that the potentiometer readings, corrected for instru-
mental error by certificate of calibration (Pot. cor. on record
sheet) give directly the potential drop across the 100-ohm section
of a 10000-ohm volt box, and that across the terminals of a
0.1-ohm resistance standard. Correction for the volt-box factor,
nominally 100, reduces the one set of readings to the actual
voltage across the terminals of the heating coil in the calorimeter.
Correction for the exact resistance of the 0.1-ohm standard
reduces the other set to the current in amperes through the stand-
ard. This is the sum of the currents in the heater (10 ohms) and
the volt box (10000 ohms) and the volt-box current, approximately
0.001 part of the whole, must be subtracted so as to get the current
in the heating coil.
The product of the average value of the current and the emfduring the period of heating is labeled "power." The quotient,
the resistance of the heater coil, furnishes a valuable check against
certain errors. The time factor, obtained from automatic chro-
nograph record explained on page 243, is multiplied by the powerand the product marked " energy." The unit is the joule. 18
At this point it is necessary to introduce the value of the mechan-ical equivalent of heat. After careful consideration of the pub-
lished values and of a considerable amount of work done in this
same calorimeter at the Bureau of Standards, but not yet pub-lished, the authors have used the value 4.187 international joules
equal to one 15 cal. 19
18 See footnote 10 on p. 236.
19 Some modification of the results announced in this paper will be necessary if conclusive evidence shall
later indicate a value of "J" different from 4.187, but it seems very improbable that such change will exceed
j part in 2000.
256 Bulletin of the Bureau of Standards [Vol, xo
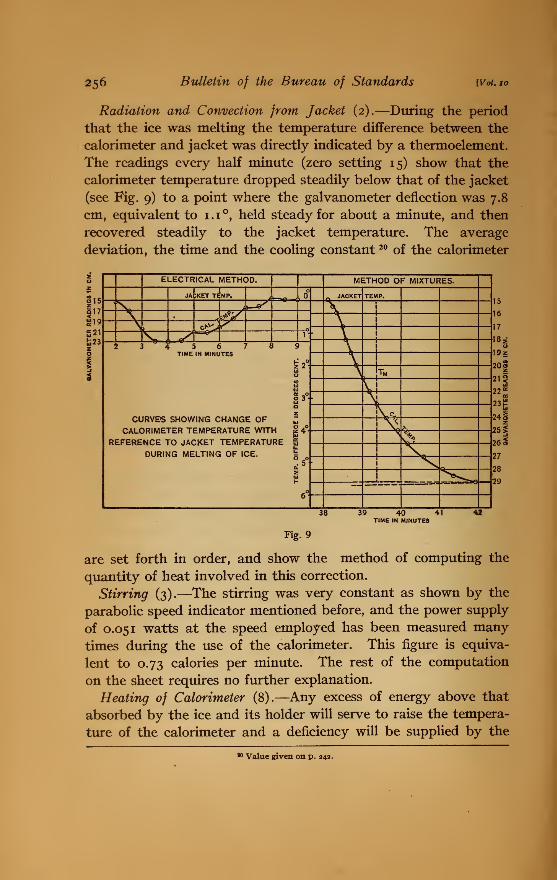
Radiation and Convection from Jacket (2).—During the period
that the ice was melting the temperature difference between the
calorimeter and jacket was directly indicated by a thermoelement.
The readings every half minute (zero setting 15) show that the
calorimeter temperature dropped steadily below that of the jacket
(see Fig. 9) to a point where the galvanometer deflection was 7.8
cm, equivalent to 1.1 , held steady for about a minute, and then
recovered steadily to the jacket temperature. The average
deviation, the time and the cooling constant 20 of the calorimeter
39 40 41TIME IN MINUTES
Fig. 9
are set forth in order, and show the method of computing the
quantity of heat involved in this correction.
Stirring (3).—The stirring was very constant as shown by the
parabolic speed indicator mentioned before, and the power supply
of 0.051 watts at the speed employed has been measured manytimes during the use of the calorimeter. This figure is equiva-
lent to 0.73 calories per minute. The rest of the computation
on the sheet requires no further explanation.
Heating of Calorimeter (8).—Any excess of energy above that
absorbed by the ice and its holder will serve to raise the tempera-
ture of the calorimeter and a deficiency will be supplied by the
*> Value given on p. 242.

o%kJtne°
n,Harper'] Latent Heat of Fusion of Ice 257
lowering of this temperature. The quantity of heat so involved
is obtained from the product of the heat capacity of the calori-
meter (without the ice) by the temperature change.
The heat capacity, including the water and the metal parts of
the calorimeter, was determined in other experiments to an accu-
racy of a few parts in 10 000, but an accuracy of one in a thousand
is more than ample for the largest value of this correction term,
and figures are therefore rounded off to convenient values.
The temperature change of the calorimeter is determined from
the readings R x cor. 5
R 2 cor. In the example, R 2 ^.-Rt COr. equals
0.00756 ohms. For thermometer 4727, 0.1 ohm is about a degree,
or more exactly, 1 ohm equals io?0459 at mean R of 26.687 ohms. 21
^2 cor.-^i cor. is, therefore, equivalent to o?o76o.
Result of an Experiment (6) .—The processes tabulated on pages
251 , 254 maybe collected in the following statement: The electrical
energy, plus that received from the jacket plus that supplied bystirring, less the amount necessary to raise the temperature of the
calorimeter, is the amount of energy which goes into the ice and
its holder. The weight of this holder, multiplied by its rise of
temperature and its mean specific heat, gives the heat absorbed
by the holder (7) . The remainder of the heat, divided by the mass
of ice, gives a value for the total heat of 1 gram from the initial
temperature of the ice to the final calorimeter temperature (R 2 cor.).
The total heat of 1 gram of water from o° to the temperature
R2 cor> (in terms of the 15 calorie) is computed from the results
of Professor Callendar's 22 recent work.
Should the values given by Callendar be in error to the extent
of 1 part in 1000, it would affect the results of this paper by about
1 part in 4000.
The heat required to change 1 gram of ice at an initial tempera-
ture below o° to water at o° can not be reduced to give a value
for the latent heat of fusion of ice without a knowledge of the
specific heat of ice. The discrepancies found in existing data on
this constant are so great as to render it very desirable that an
early redetermination be made with suitable apparatus and
methods, and the Bureau is now engaged in doing this.
21 Reduction by method described in paper cited in footnote 17, p. 242.
M Phil. Trans. Royal Society, I^ondon, 212A, p. 1; 1912.

258 Bulletin of the Bureau of Standards [Vol. 10
For the determinations at — o?72 an approximate value of the
specific heat of ice will suffice. The figure 0.52 is here used. Anerror of 4 per cent in this constant affects the result by about 1
part in 4000. For the determinations at — 3^78, an error of 4 per
cent in the assumed value of o?52 will affect the result to the
extent of 1 part in 1000.
2. METHOD OF MIXTURES
In this method most of the heat required to melt the ice and
raise the temperature of the resulting water to the final calori-
meter temperature comes from the cooling of the water originally
in the calorimeter. Therefore the amount of cooling and the
heat capacity of the system require exact determination, while all
the other terms entering the computation are relatively small
and permit of more or less approximation. The cooling correc-
tion is very much larger than in the electrical method, being 1 to
2 per cent of the total heat measured.
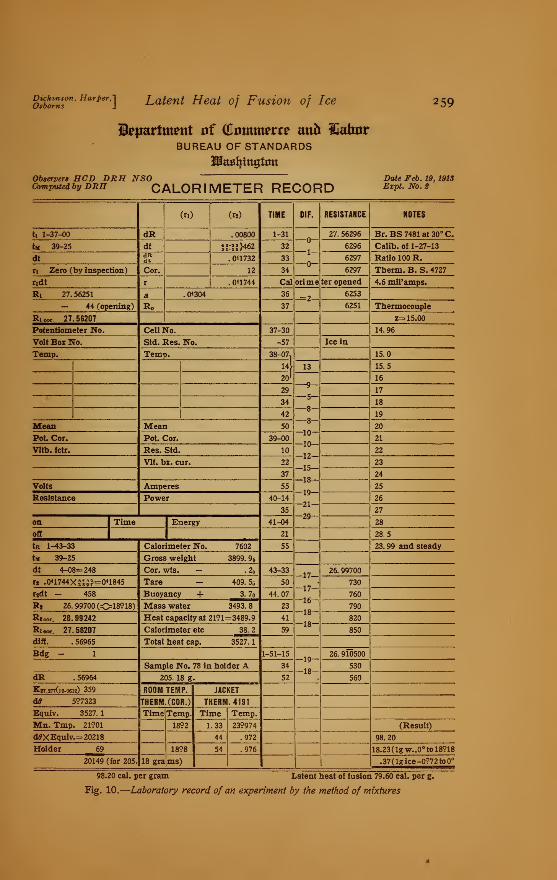
A sample laboratory record of an experiment by this methodforms Fig. 10. It is similar to Fig. 8, the notation employed is
the same, and the general method of making reductions differs
only in so far as different magnitudes for the terms make this
necessary. The selections of times t± and t2 and the fixing of the
corresponding temperatures as measured by resistances Rtand
R2 , follow exactly the description of p. 251 which need not be
repeated here.
Between the times tt and t2 the same nine processes which are
tabulated on pp. 251-254 occur, except that (1) is missing, and (8)
is always a cooling of the calorimeter, the major term of the com-
putation referred to above; (2) and (3) will be discussed together,
below. Terms (4) and (5) were negligible, and also (9), the
remarks on p. 254 concerning their magnitude applying also to
the experiments by the method of mixtures. The calculations
involved in paragraphs numbered (6) and (7) are identical in the
two methods, so that for the purpose of illustrating the reduc-
tion of a method of mixtures experiment it is unnecessary to
retain in Fig. 10 the complete detail that is shown in Fig. 8,
beyond the computation of the total heat absorbed by the ice.
Dickinson , Harper,!Osbornz J
Latent Heat of Fusion of Ice 259
BUREAU OF STANDARDSMaaljitujtim
Observers HCD DRH NSO Date Feb. 19, 1913Computed by DRH CALORIMETER RECORD Expt. No. 2
(n) (r«) TIME DIF. RESISTANCE NOTES
ti 1-37-00 dR . 00800 1-31 27. 56296 Br. BS 7481 at 30° C.
tM 39-25 dt iV-ll^z 32 6296 Calib. of 1-27-13
dt d3dt . 0*1732 33 6297 Ratio 100 R.
rt Zero (by inspection) Cor. 12 34 6297 Therm. B. S. 4727
rtdt r .0*1744 Cal orime ter opened 4.6 mil'amps.
Rt 27. 56251 a .0*304 36 6253
— 44 (opening) Ro 37 6251 Thermocouple
Rioor. 27.56207 z= 15.00
Potentiometer No. Cell No. 37-30 14.96
Volt Box No. Std. Res. No. -57 Ice in
Temp. Temp. 38-07^ 15.0
j
14 13 15.5
1
20i 16
29 17
345
18
42 19
Mean Mean 508
20
Pot. Cor. Pot. Cor. 39-0010
21
Vltb. fctr. Res. Std. 10 —12—-15-
22
Vlt. bx. cur. 22 23
37 24
Volts Amperes 55 -19——21-
25
Resistance Power 40-14 26
35 27
on Time 1 Energy 41-04 28
off 1 21 28.5
ta 1-43-33 Calorimeter No. 7602 55 28. 99 and steady
tM 39-25 Gross weight 3899. 9&
dt 4-08=248 Cor. wts. — . 25 43-33 —17——17—
28. 99700
r» .0U744X!S£f=0H845 Tare 409.
5
5 50 730
rgdt - 458 Buoyancy 4- 3. 7o 44.07 760
Rt 26. 99700 (018918) Mass water 3493.
8
23 790
Rtcor. 26.99242 Heat capacity at 2191=3489.9 41 820
Rieo,. 27.56207 Calorimeter etc 38. 2 59 850
diff. . 56965 Total heat cap. 3527.
1
Bdg - 1 1-51-15 —19——18—
26. 910500
Sample No. 78 in holder A 34 530
dR . 56964 205. 18 g. 52 560
K27.277(l 0-0632) 359 ROOM TEMP. JACKET
63 597323 THERM. (COR.) THERM. 4191
Equiv. 3527.
1
Time Temp. Time Temp.
Mn. Tmp. 21901 1892 1.33 239974 (Result)
d0XEquiv.= 20218 44 .972 98.20
Holder 69 1898 54 .976 18.23(lgw.,0° to 18918
20149 (for 205. 18 gra ms) .37(lgice-0972to0°
98.20 cal. per gram Latent heat of fusion 79.60 cal. per g.
Fig. 10.
—
Laboratory record of an experiment by the method of mixtures
260 Bulletin of the Bureau of Standards [Voi.io
The fundamental equation of the method of mixtures as applied
to these experiments may be stated in the following terms: Theheat absorbed by the ice and holder is equal to that given up bythe calorimeter in cooling plus that received from the jacket byradiation, convection, etc., plus that supplied by the stirrer.
The heat exchange between the jacket and the calorimeter maybe computed as a quantity of heat, as was done in reducing the
observations by the electrical method, or it may be expressed in
terms of the temperature change in the calorimeter which this
quantity of heat would cause. When the data upon which the
computation is based are obtained by observing rates of rise or
fall of the calorimeter temperature, it is usually more convenient
to adopt the latter method. A number of methods of makingthe computation have been devised and might have been followed
in this reduction; the one actually employed is described in detail
elsewhere. 23 The computation proceeds with the aid of a meantime, (TjJ, the value of which is dependent on the readings of
the temperature difference between calorimeter and jacket dur-
ing the period tx to t2 . The details are very easily carried out,
but the explanation is somewhat tedious and the reader inter-
ested is referred to the paper cited. The result is comprised in
the sum of the terms rtdt and r2dt of Fig. 10, 458 parts in 57000
for this particular example. (This result may be checked byemploying the observation data of the sheet with any method of
computing a cooling correction.)
The large change in the heat capacity of the calorimeter during
the course of the experiment, by reason of the introduction of
the ice, complicates the process somewhat.
The method of computation automatically corrects for the heat
supplied to the calorimeter by the stirrer, provided this supply
takes place at a constant rate.
23 H. C. Dickinson: Combustion Calorimetry and the Heats of Combustion of Sugar, Benzoic Acid,
and Naphthalene, to be published In this Bulletin.
o%oiZ<"t,Harper
'] Latent Heat of Fusion of Ice 261
The temperature change 24 of the calorimeter was computed as
follows: The difference of the resistance readings R2 and Rt was
first corrected, by certificate of calibration, for error in the Wheat-
stone bridge used to measure the resistances. The corrected
resistance difference, dR, was then reduced to centigrade tempera-
ture difference, 6.6, by employing a factor 25, K, appertaining to
the thermometer used. This factor, 10.0632 in the example, was
convenient for slide rule computation, the term 0.56964 being
increased by 632 parts per 100 000 of itself.
The heat capacity of the calorimeter was determined from the
mass of water employed and the heat capacity of the metal parts.
Fig. 10 shows the mass determination in detail. This mass wasmultiplied by the ratio of the heat capacity of water at the meantemperature of the experiment to the heat capacity at 15 . Thefigure employed for the ratio was that given by Callendar.26 Theheat capacity of the metal parts was computed from the weights
recorded when the calorimeter was built and the specific heats.
For copper 0.92 was employed for this constant. An error of 1
per cent in this factor affects the total heat capacity of the calo-
rimeter to the extent of 1 part in 10000.
M The scale of temperature (*) to which these measurements are referred is related to the so-called plati-
num temperature
R100—R0by the equation
l-Pt=x.48 (=Ui) JLx IOO / IOO
The thermometric scale thus defined is in agreement with the International Hydrogen Scale, from which
the constants were indirectly determined as explained in this Bulletin, 3., p. 441; 1907, to the accuracy
with which this scale has been reproduced at the Bureau of Standards (Bulletin 3., p. 663). However,
the scale here used is more accurately reproducible than is the International Hydrogen Scale, by the use
of the above formulas, applied to thermometers of equally pure platinum.
Thermometers made with this platinum have the following characteristics: Coefficient190~—? =0.391Ro
to 0.392 and the constant (1.48 in the foregoing equations) equals about 1.49 when determined from observa-
tions in ice, steam and sulphur vapor (444-5 °C).26 See footnote 21 on p. 257.
26 See footnote 22 on p. 257.

262 Bulletin of the Bureau of Standards ivoi.io
VI. RESULTS
All together the heat of fusion of 92 individual ice samples has
been determined by one of the two methods. Of these, the first
50 determinations were made on samples cooled in cryostats
antedating those described in this paper, in which the temperatures
and the distribution of temperature were not so well known.
These observations, which include commercial plate, can, and
natural ice as well as ice frozen in the laboratory from double-
distilled water both free from air and containing air, showed no
differences greater than one part in a thousand in the heat of fusion
for these various samples. However, on account of the uncer-
tainty in the initial temperature of the ice, these earlier determi-
nations are entitled to little or no weight in fixing the absolute
value of the latent heat of fusion of ice. The results are there-
fore omitted from this paper.
Four observations on samples of ice artificially contaminated
with a mixture of equal parts of ammonia, sodium chloride, and
calcium chloride, to the extent of about one part in a thousand,
gave results about 1 .4 per cent lower than for pure ice.
Of the remaining observations, summarized in Tables 3, 4, and
5, 14 were made with specimens cooled to — 3°.78, thus bringing
in a considerable uncertainty because of the lack of accurate infor-
mation as to the specific heat of ice. A comparison of these
results with those on samples cooled to — o°.72 serves to give an
approximate value for this constant, and the results can hardly
be considered as of value other than for such comparison until
more accurate determinations of the specific heat of ice are avail-
able for their reduction.
The mean of 1 2 observations by the electrical method on speci-
mens initially at — 3°-78 is 81.61, for the total heat from — 3°-78
to water at o°. Similarly, the mean of 15 observations bythe same method on samples initially at — o°.72 is 80.02. A com-
parison of these figures gives for the specific heat of ice 0.520, a
value which is in good agreement with the number previously
selected as representing the most probable value of this constant.
This value is taken for reducing the results of the 2 1 observations
upon which is based the final value of the heat of fusion.
ofbSHT'Harper
'] Latent Heat of Fusion of Ice 263
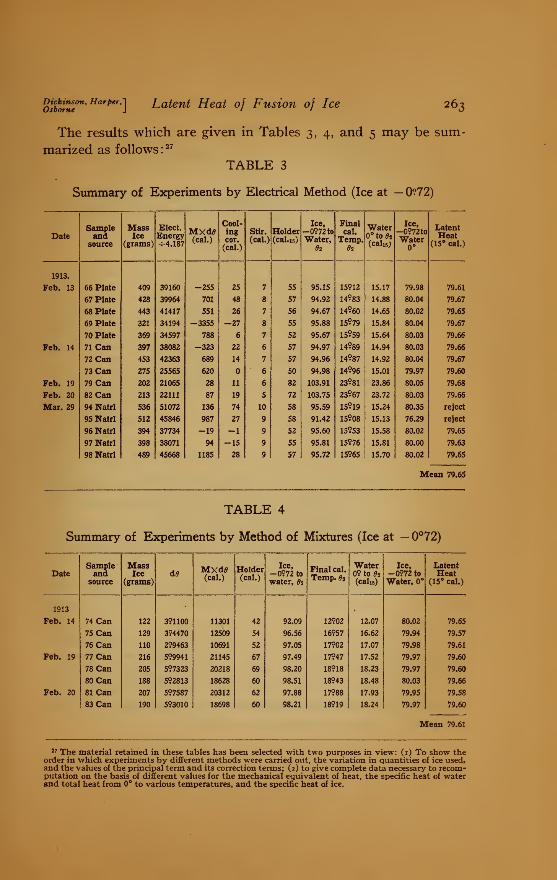
The results which are given in Tables 3, 4, and 5 may be sum-
marized as follows: 27
TABLE 3
Summary of Experiments by Electrical Method (Ice at — 0?72)
DateSampleand
source
MassIce
(grams)
Elect.Energy-M.187
MXd0(cal.)
Cool-ingcor.
(cal.)
Stir.
(cal.)
Holder(cal.15)
Ice,
-0972 to
Water,02
Finalcal.
Temp.02
Water0° tO 02(cal l5j
Ice,-0972 to
Water0°
LatentHeat
(15° cal.)
1913.
Feb. 13 66 Plate 409 39160 -255 25 7 55 95.15 15912 15.17 79.98 79.61
67 Plate 428 39964 701 48 8 57 94.92 14983 14.88 80.04 79.67
68 Plate 443 41417 551 26 7 56 94.67 14?60 14.65 80.02 79.65
69 Plate 321 34194 -3355 -27 8 55 95.88 15979 15.84 80.04 79.67
70 Plate 369 34597 788 6 7 52 95.67 15959 15.64 80.03 79.66
Feb. 14 71 Can 397 38082 -323 22 6 57 94.97 14989 14.94 80.03 79.66
72 Can 453 42363 689 14 7 57 94.96 14987 14.92 80.04 79.67
73 Can 275 25565 620 6 50 94.98 14996 15.01 79.97 79.60
Feb. 19 79 Can 202 21065 28 11 6 82 103.91 23981 23.86 80.05 79.68
Feb. 20 82 Can 213 22111 87 19 5 72 103.75 23967 23.72 80.03 79.66
Mar. 29 94 Natrl 536 51072 136 74 10 58 95.59 15919 15.24 80.35 reject
95 Natrl 512 45846 987 27 9 58 91.42 15908 15.13 76.29 reject
96 Natrl 394 37734 -19 -1 9 52 95.60 15953 15.58 80.02 79.65
97 Natrl 398 38071 94 -15 9 55 95.81 15976 15.81 80.00 79.63
98 Natrl 489 45668 1185 28 9 57 95.72 15965 15.70 80.02 79.65
Mean 79.65
TABLE 4
Summary of Experiments by Method of Mixtures (Ice at — 0°72)
DateSampleand
source
MassIce
(grams)d0 MXd0
(cal.)
Holder(cal.)
Ice,-0972 to
water, 02
Final cal.
Temp. 02
Water09 to 02
(cah5)
Ice,-0972 to
Water, 0°
LatentHeat
(15° cal.)
1913
Feb. 14 74 Can 122 391100 11301 42 92.09 12902 12.07 80.02 79.65
75 Can 129 394470 12509 54 96.56 16957 16.62 79.94 79.57
76 Can 110 299463 10691 52 97.05 17902 17.07 79.98 79.61
Feb. 19 77 Can 216 599941 21145 67 97.49 17947 17.52 79.97 79.60
78 Can 205 597323 20218 69 98.20 18918 18.23 79.97 79.60
80 Can 188 592813 18628 60 98.51 18943 18.48 80.03 79.66
Feb. 20 81 Can 207 597587 20312 62 97.88 17988 17.93 79.95 79.58
83 Can 190 593010 18698 60 98.21 18919 18.24 79.97 79.60
Mean 79.61
27 The material retained in these tables has been selected with two purposes in view: (i) To show theorder in which experiments by different methods were carried out, the variation in quantities of ice used,and the values of the principal term and its correction terms; (2) to give complete data necessary to recom-putation on the basis of different values for the mechanical equivalent of heat, the specific heat of waterand total heat from 0° to various temperatures, and the specific heat of ice.
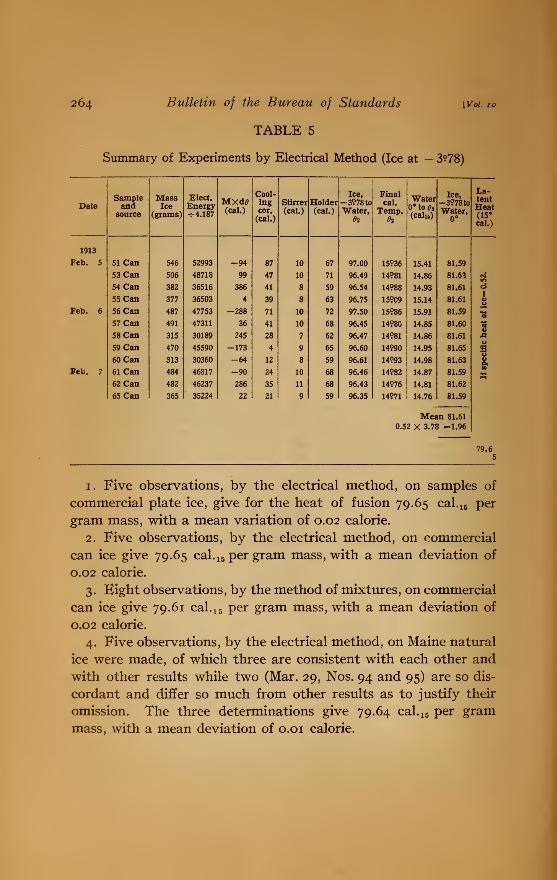
264 Bulletin of the Bureau of Standards [Vol. 10
TABLE 5
Summary of Experiments by Electrical Method (Ice at — 3?78)
DateSampleand
source
MassIce
(grams)
Elect.
Energyh-4.187
Mxd0(cal.)
Cool-ingcor.
(cal.)
Stirrer
(cal.)
Holder(cal.)
Ice,
-3978 to
Water,62
Finalcal.
Temp.03
Water0° to a
(cahs)
Ice,-3978 to
Water,0°
La-tentHeat(15°
cal.)
1913
Feb. 5 51 Can 546 52993 -94 87 10 67 97.00 15936 15.41 81.59
53 Can 506 48718 99 47 10 71 96.49 14981 14.86 81.63S?
54 Can 382 36516 386 41 8 59 96.54 14988 14.93 81.61 ©55 Can 377 36503 4 39 8 63 96.75 15909 15.14 81.61 oS
Feb. 6 56 Can 487 47753 -288 71 10 72 97.50 15986 15.91 81.59 e57 Can 491 47311 36 41 10 68 96.45 14980 14.85 81.60 158 Can 315 30189 245 28 7 62 96.47 14981 14.86 81.61 A59 Can 470 45590 -173 4 9 65 96.60 14990 14.95 81.65
160 Can 313 30360 -64 12 8 59 96.61 14993 14.98 81.63 &
Feb. 7 61 Can 484 46817 -90 24 10 68 96.46 14982 14.87 81.5900
62 Can 482 46237 286 35 11 68 96.43 14976 14.81 81.62
65 Can 365 35224 22 21 9 59 96.35 14971 14.76 81.59
Mean 81.61
0.52 X 3.7!l =1.96
79.65
i. Five observations, by the electrical method, on samples of
commercial plate ice, give for the heat of fusion 79.65 cal. 15 per
gram mass, with a mean variation of 0.02 calorie.
2. Five observations, by the electrical method, on commercial
can ice give 79.65 cal. 15 per gram mass, with a mean deviation of
0.02 calorie.
3. Eight observations, by the method of mixtures, on commercial
can ice give 79.61 cal. 15 per gram mass, with a mean deviation of
0.02 calorie.
4. Five observations, by the electrical method, on Maine natural
ice were made, of which three are consistent with each other and
with other results while two (Mar. 29, Nos. 94 and 95) are so dis-
cordant and differ so much from other results as to justify their
omission. The three determinations give 79.64 cal. 15 per grammass, with a mean deviation of 0.01 calorie.
otboint071
'Harper
'] Latent Heat of Fusion of Ice 265
The mean of results by the electrical method is
79.65 cal 15
if the ratio of the caloriels to the joule be taken as 4.187.
The mean of results by the method of mixtures is
79.61 cal 15
independently of the ratio of the joule to the calorie.
The mean of the 21 observations gives for the heat of fusion of
ice
79.63 cal 15 per gram mass
or
143.33 Btu 28 per pound mass
or
approximately 143.5 Btu per pound weighed in air against brass
or iron weights.
VII. SUMMARY
The work of previous investigations is briefly reviewed and the
results tabulated.
The apparatus and procedure of the present investigation are
fully described.
Samples of ice prepared in the form of hollow cylinders contain-
ing from 100 to 500 grams were cooled to a uniform temperature
of either — o°.72 or — 3°.78, weighed while at these temperatures,
and introduced into the water of the calorimeter.
Observations were made by two independent methods, one of
which, an electrical method, serves to reduce the usual calorimetric
corrections to an almost negligible quantity and gives the results
primarily in terms of the joule as defined by the electrical units.
The second was the method of mixtures which gives the heat of
fusion in calories.
The details of computation for observations taken by each
method are given in full.
Results.—The heat of fusion of 92 samples of ice from various
sources was determined by the two methods.
28The British thermal unit (Btu) is here taken as the quantity of heat required to raise the temperature
of a pound mass of water i° F at 59° F (15° C).

266 Bulletin of the Bureau of Standards [Voi.io
The results of these determinations indicate that for commercial
can ice, commercial plate ice, natural ice, ice frozen in the labora-
tory from air-free double-distilled water and from double-distilled
water containing air, all of which were very pure as indicated byelectrical conductivity tests, the heat of fusion is the same to
within the limits of accuracy of the earlier determinations, i. e.,
about i part in iooo. Further experiments on the three com-
mercial forms of ice fail to show differences greater than about i
part in 5000.
Five observations on ice contaminated with a mixture of
ammonia, sodium chloride, and calcium chloride to the extent of
about 1 part in 1000 give results about 1.4 per cent lower than for
pure ice.
The mean of the final 21 determinations on samples of plate,
can, and natural ice gave for the heat of fusion:
79.63 cal 15 per gram mass,
or 143.33 Btu per pound mass,
or 143.5 Btu per pound weighed in air against brass or iron
weights.
Washington, August 20, 191 3.

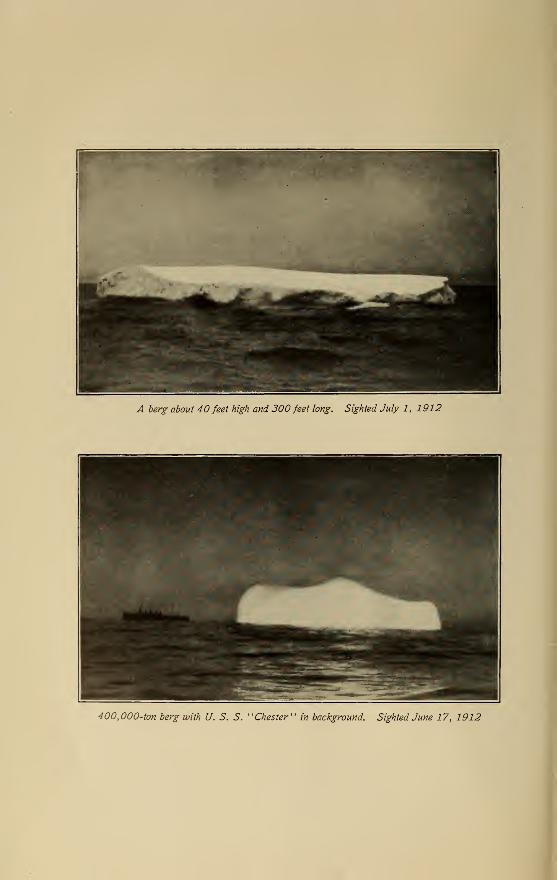
A berg about 40 feet high and 300 feet long. Sighted July 1, 1912
400,000-ton berg with U. S. S. "Chester" in background. Sighted June 17, 1912

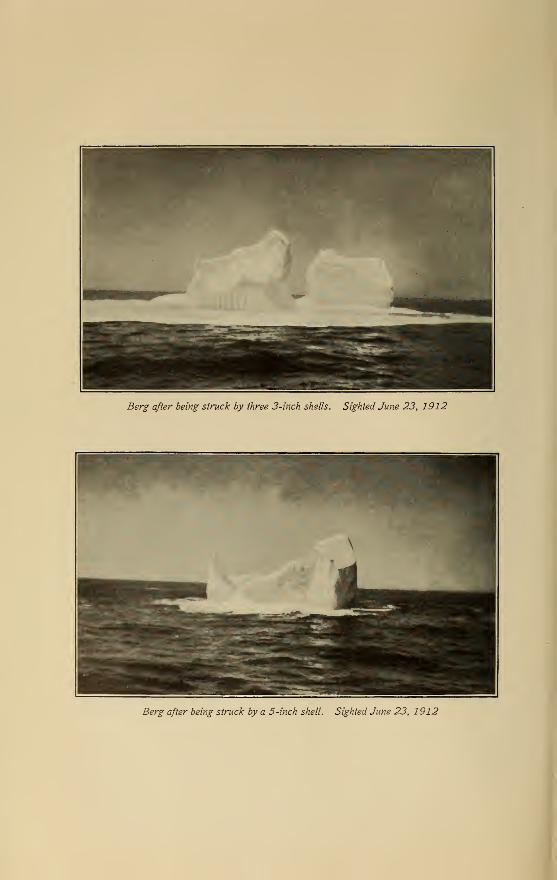
Berg after being struck by three 3-inch shells. Sighted June 23, 1912
after being struck by a 5-inch shell. Sighted June 23, 1912

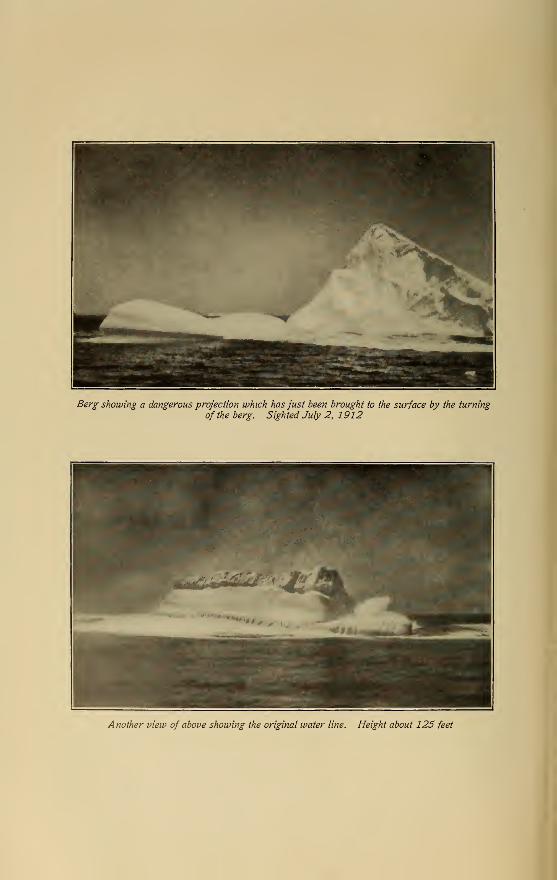
showing a dangerous projection which has just been brought to the surface by the turning
of the berg. Sighted July 2, 1912
Another view of above showing the original water line. Height about 125 feet


in
M il
Ml araniInIP
HHH1 1
HI

![Summary of NIST latent fingerprint testing … against latent fingerprints [19]; and 5. ... Whereas a typical latent fingerprint might have fifteen usable minutiae, a typical rolled](https://static.fdocuments.us/doc/165x107/5b4e6b157f8b9a6a128b6245/summary-of-nist-latent-fingerprint-testing-against-latent-fingerprints-19-and.jpg)


![NIST Forensic Science Activities: Latent Fingerprints · “promote the development o forensic science [as applied to latent fingerprints] ... – 1st large-scale automatic finggp](https://static.fdocuments.us/doc/165x107/5b508f767f8b9a2a6e8ea63e/nist-forensic-science-activities-latent-fingerprints-promote-the-development.jpg)