Latent Class Analysis of the Breadth, Severity and Stability of Child Health Inequalities Mensah FK,...
16
Latent Class Analysis of the Breadth, Severity and Stability of Child Health Inequalities Mensah FK, Nicholson JM, Headley L, Carlin JB, Berthelsen D, Wake M
-
Upload
jacob-young -
Category
Documents
-
view
222 -
download
0
Transcript of Latent Class Analysis of the Breadth, Severity and Stability of Child Health Inequalities Mensah FK,...
Latent Class Analysis of the Breadth, Severity and Stability of Child Health
Inequalities Mensah FK, Nicholson JM, Headley L, Carlin JB, Berthelsen D, Wake M

NHMRC Capacity Building Grant, MCRI, RCH and University of MelbourneProfessors Melissa Wake, John Carlin Professor Jan Nicholson, Parenting Research Centre, MelbourneLiz Headley, Victorian Public Health Training Scheme and Monash UniversityProfessor Donna Berthelsen, Queensland University of Technology
Gender Equality Network, Economic and Social Research Council UKDr Wendy Sigle-Rushton, London School of EconomicsProfessors John Hobcraft and Kathleen Kiernan, Department of Social Policy and Social Work and Institute of Effective Education, University of York
Acknowledgments

Multiple Outcomes of Health Inequality
Models have often focused on single outcomes– fail to consider breadth of impact and address “multifinality”
Alternative strategies– summary indices– multiple outcome models
Example to follow: Impact of socioeconomic position on children’s risks for multiple problems in physical, socio-emotional and cognitive functioning

Two national cohorts of ~5,000 children each
Infants (0-1 yrs) & Kindergarten children (4-5 yrs) in 2004
Followed up every two years
Conducted by Australian Govt. Department of Families, Housing, Community Services and Indigenous Affairs (FaHCSIA), Australian Institute of Family Studies (AIFS), and the Australian Bureau of Statistics (ABS) with advice from a national research consortium
www.aifs.gov.au/growingup/
The Longitudinal Study of Australian Children (LSAC)

Most advan-taged
qu. 2 qu. 3 qu. 4 Least advan-taged
0
25
50
75
33.1
64.3
9.2
32.6
at least one problem in 2 or more domains at least one problem in all 3 domains
%
Physical, Psychosocial and Cognitive Difficulties at 4-5 (Birth cohort)
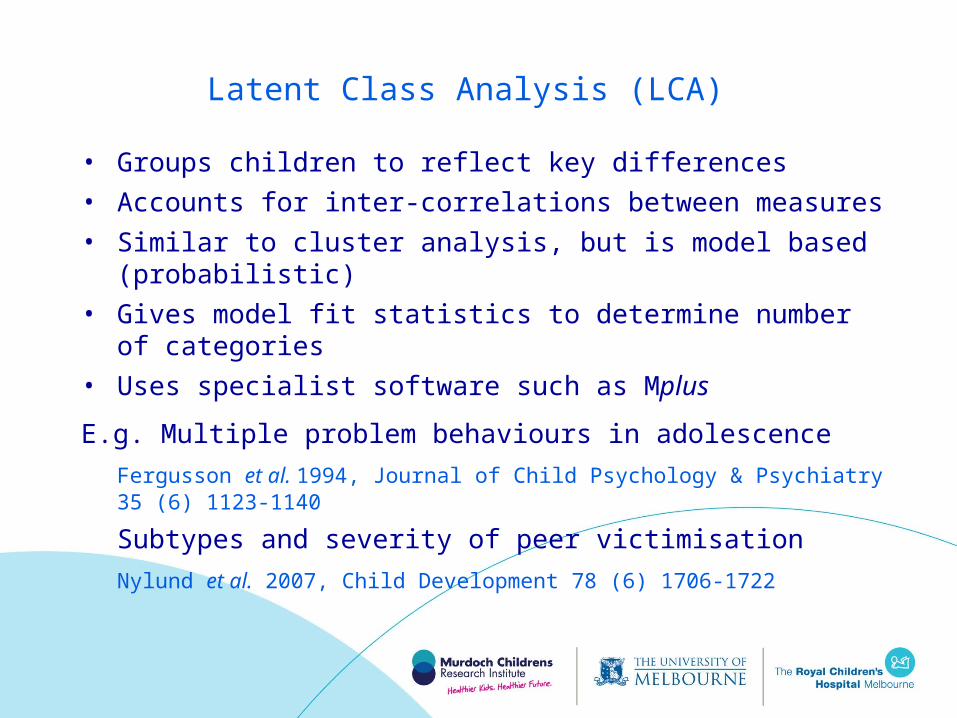
Latent Class Analysis (LCA)
• Groups children to reflect key differences
• Accounts for inter-correlations between measures
• Similar to cluster analysis, but is model based (probabilistic)
• Gives model fit statistics to determine number of categories
• Uses specialist software such as Mplus
E.g. Multiple problem behaviours in adolescence
Fergusson et al. 1994, Journal of Child Psychology & Psychiatry 35 (6) 1123-1140
Subtypes and severity of peer victimisation
Nylund et al. 2007, Child Development 78 (6) 1706-1722
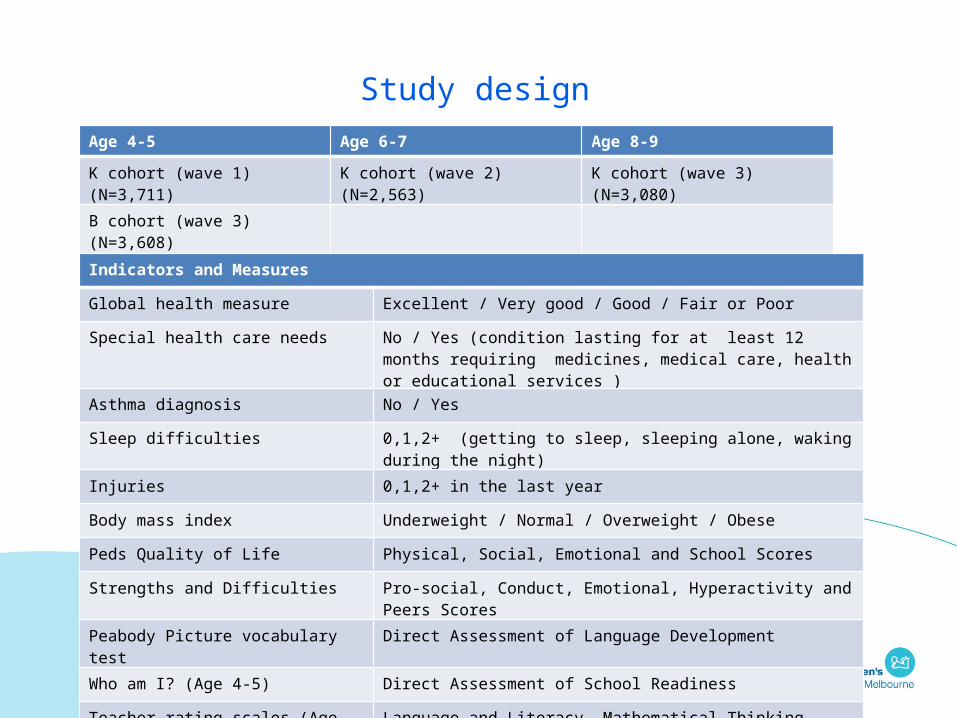
Study designAge 4-5 Age 6-7 Age 8-9
K cohort (wave 1) (N=3,711) K cohort (wave 2) (N=2,563) K cohort (wave 3) (N=3,080)
B cohort (wave 3) (N=3,608)(replication sample)
Indicators and Measures
Global health measure Excellent / Very good / Good / Fair or Poor
Special health care needs No / Yes (condition lasting for at least 12 months requiring medicines, medical care, health or educational services )
Asthma diagnosis No / Yes
Sleep difficulties 0,1,2+ (getting to sleep, sleeping alone, waking during the night)
Injuries 0,1,2+ in the last year
Body mass index Underweight / Normal / Overweight / Obese
Peds Quality of Life Physical, Social, Emotional and School Scores
Strengths and Difficulties Pro-social, Conduct, Emotional, Hyperactivity and Peers Scores
Peabody Picture vocabulary test Direct Assessment of Language Development
Who am I? (Age 4-5) Direct Assessment of School Readiness
Teacher rating scales (Age 6-7, 8-9) Language and Literacy, Mathematical Thinking
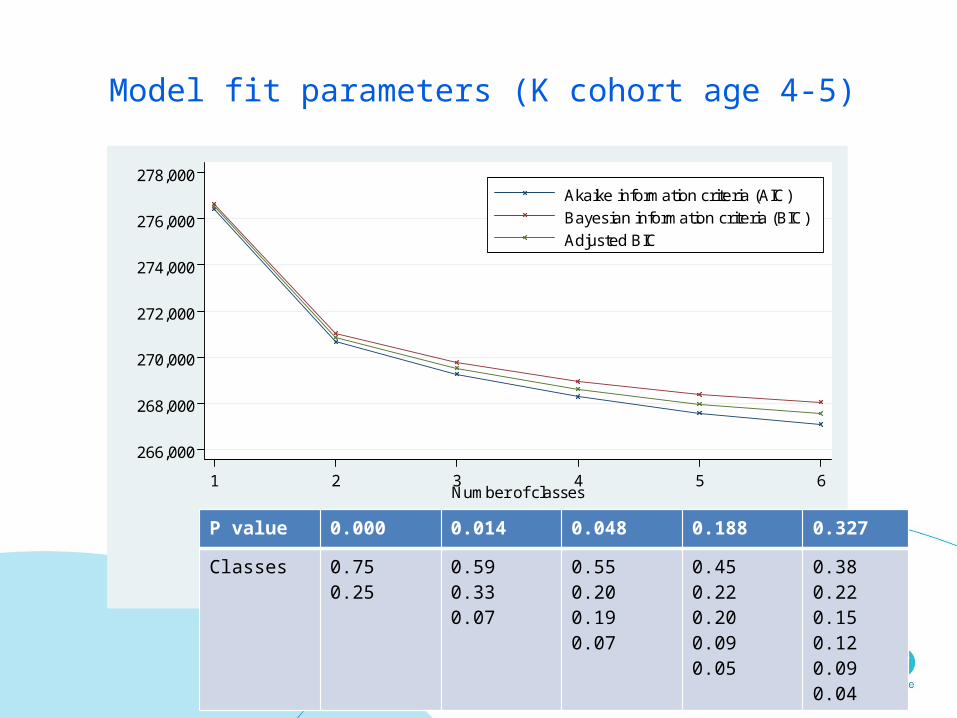
Model fit parameters (K cohort age 4-5)
266,000
268,000
270,000
272,000
274,000
276,000
278,000
1 2 3 4 5 6Number of classes
Akaike information criteria (AIC)
Bayesian information criteria (BIC)
Adjusted BIC
P value 0.000 0.014 0.048 0.188 0.327
Classes 0.750.25
0.590.330.07
0.550.200.190.07
0.450.220.200.090.05
0.380.220.150.120.090.04

Mean score for Healthiest(59.5%)
Moderate(33.4%)
Severe(7.2%)
Peds Quality of Life: Physical 87.1 79.8 63.0
Social 90.3 77.4 52.1
Emotional 78.5 64.4 56.8
School 93.3 83.8 58.2
Strengths and difficulties Pro-social 8.3 7.0 6.8
Conduct difficulties 1.7 3.7 3.6
Emotional difficulties 1.1 2.3 3.7
Hyperactivity 2.7 4.6 5.0
Difficulties With Peers 1.1 2.2 3.2
Language PPVT 65.0 63.6 59.7
School readiness Who am I 65.2 63.4 61.1
Profiles from 3 class model (K cohort age 4-5)

Percent of children with Healthiest(59.5%)
Moderate(33.4%)
Severe(7.2%)
Fair or poor health 1.0 3.1 9.3
Special health care need 7.2 17.2 38.6
Asthma diagnosis 16.9 26.5 34.0
2 or more sleep problems 7.1 21.3 23.3
2 or more injuries 2.8 6.3 6.9
Underweight 4.9 5.0 7.0
Overweight/obese 19.3 20.4 21.1
Profiles from 3 class model (K cohort age 4-5)
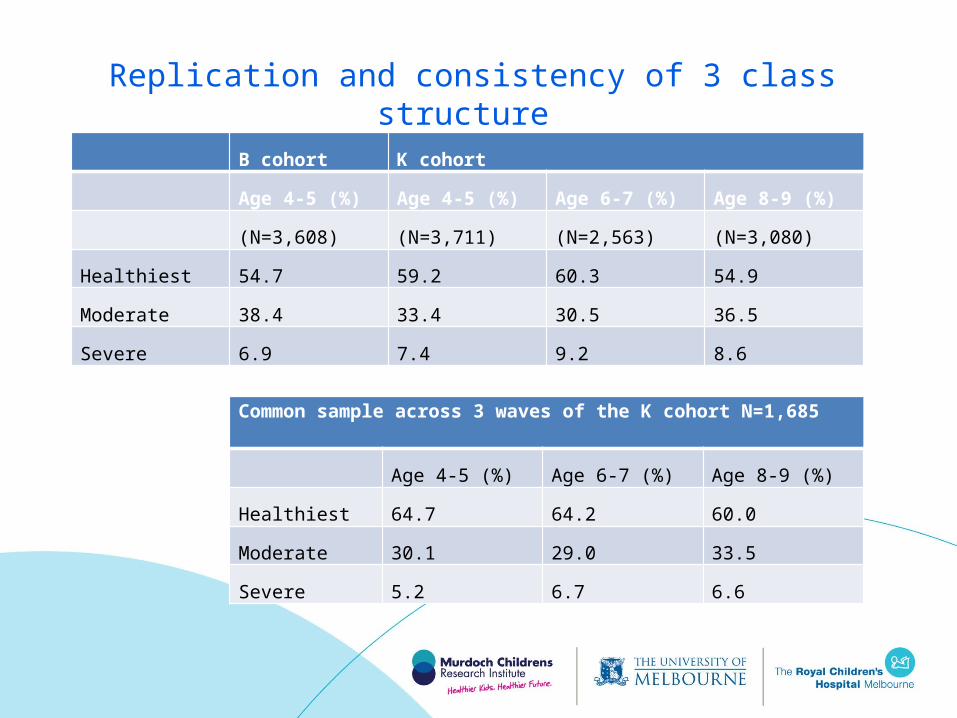
Replication and consistency of 3 class structure
B cohort K cohort
Age 4-5 (%) Age 4-5 (%) Age 6-7 (%) Age 8-9 (%)
(N=3,608) (N=3,711) (N=2,563) (N=3,080)
Healthiest 54.7 59.2 60.3 54.9
Moderate 38.4 33.4 30.5 36.5
Severe 6.9 7.4 9.2 8.6
Common sample across 3 waves of the K cohort N=1,685
Age 4-5 (%) Age 6-7 (%) Age 8-9 (%)
Healthiest 64.7 64.2 60.0
Moderate 30.1 29.0 33.5
Severe 5.2 6.7 6.6
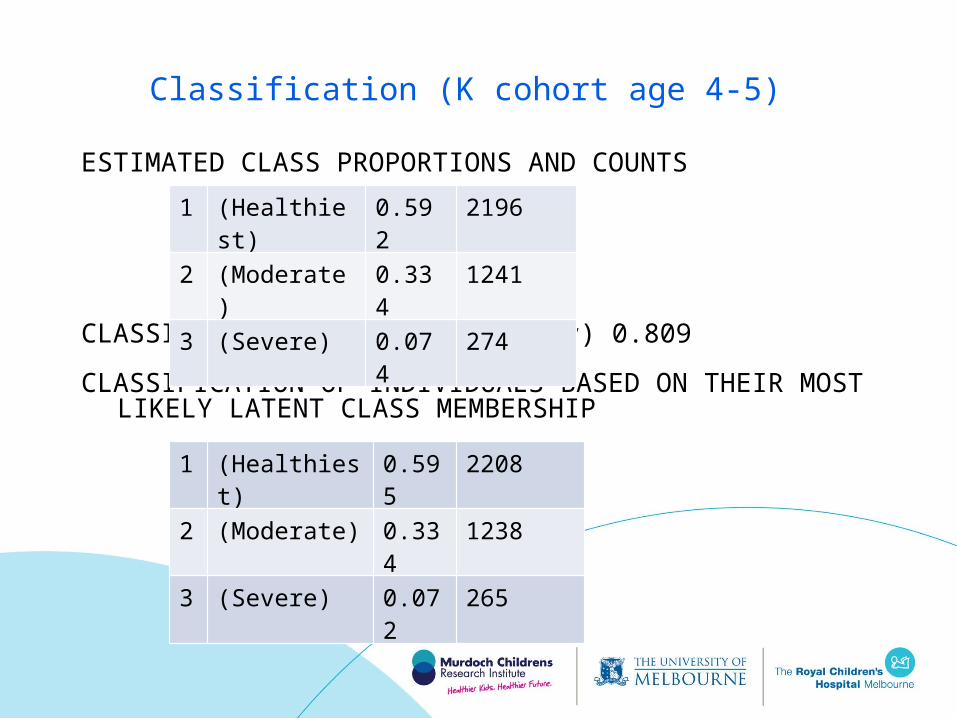
Classification (K cohort age 4-5)
ESTIMATED CLASS PROPORTIONS AND COUNTS
CLASSIFICATION QUALITY (Entropy) 0.809
CLASSIFICATION OF INDIVIDUALS BASED ON THEIR MOST LIKELY LATENT CLASS MEMBERSHIP
1 (Healthiest) 0.592 2196
2 (Moderate) 0.334 1241
3 (Severe) 0.074 274
1 (Healthiest) 0.595 2208
2 (Moderate) 0.334 1238
3 (Severe) 0.072 265
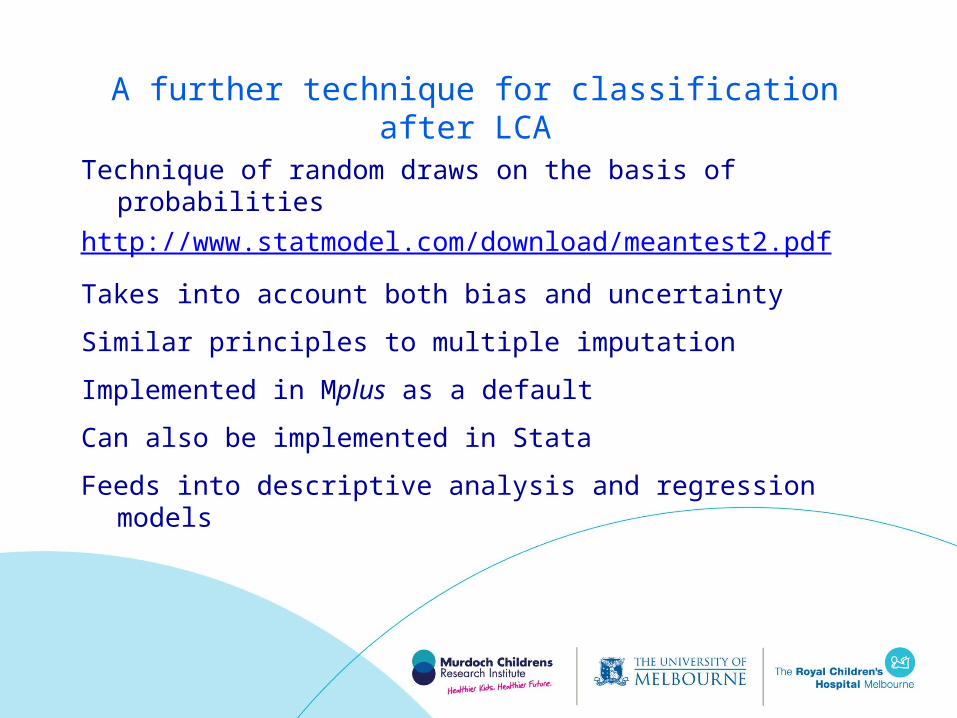
A further technique for classification after LCA
Technique of random draws on the basis of probabilities
http://www.statmodel.com/download/meantest2.pdf
Takes into account both bias and uncertainty
Similar principles to multiple imputation
Implemented in Mplus as a default
Can also be implemented in Stata
Feeds into descriptive analysis and regression models

Girls
Most advantaged
2nd Quintile
3rd Quintile
4th Quintile
Least advantaged
Boys
Most advantaged
2nd Quintile
3rd Quintile
4th Quintile
Least advantaged
0 0.1 0.2 0.3 0.4 0.5 0.6 0.7
Moderate
Severe
Proportion of children
Health Inequalities - K cohort age 4-5
Most healthy (%)
Moderate (%)
Severe (%)
69.5 27.7 2.8
69.2 27.7 3.1
69.3 24.4 6.3
56.6 36.2 7.2
47.5 37.9 14.6
61.2 33.0 5.9
63.0 31.3 5.6
56.7 36.6 6.7
54.0 39.2 6.9
39.4 43.4 17.2

Stability through childhood (K cohort)
Age 6-7 Age 8-9Healthiest (%)
Moderate (%)
Severe (%)
Healthiest (%)
Moderate (%)
Severe (%)
Age 4-5 Healthiest 78.8 18.5 2.8 73.0 25.5 1.5
Moderate 41.2 50.1 8.7 39.6 48.6 11.8
Severe 16.5 38.9 44.6 15.7 45.3 39.0
Age 6-7 Healthiest 77.7 22.0 0.3
Moderate 31.1 55.7 13.3
Severe 15.5 47.3 37.2
Conclusions, continuation and discussion
Clear and reproducible groups reflecting degree of difficulties
Powerful social grading
Strong continuity from early to mid-childhood
Potential to examine predictors, prognosis and associated costs
For discussion:
Criteria for evaluating validity
Utility of this type of indicator beyond academic research