Power analysis methods for tests in latent class and latent Markov ...

Working Paper Series, N.16, 2009
Latent Class Analysis for Marketing Scales Development
Francesca Bassi Department of Statistical Sciences University of Padua Italy
Abstract: Measurement scales are a crucial instrument for research in marketing in order to measure unobservable variables as attitudes, opinions, beliefs. In using, evaluating, or developing multi-item scales, a number of guidelines and procedures are recommended to ensure that the measure is psychometrically robust. These procedures have been outlined in the psychometric literature since the late seventies and are composed of steps which refer to construct definition, domain and scale validity, reliability, dimensionality, and generalizability. Various statistical instruments are used in the scale developing process, these almost always refer to metric variables (interval or ratio scales). Items forming scales are instead rarely measured on an metric level, frequently items are ordinal, in some rare cases, nominal. In this paper, it is shown how the implementation of latent class analysis may improve the process of measurement scale development since it explicitly considers that items generate ordinal or even nominal variables. Specifically, applying appropriate latent class models allows to assess scale validity and reliability more soundly than the methods traditionally used. Keywords: measurement scales, validity, reliability, latent class factor model, latent class regression model, ordinal variables
Final Version (2009-11-12)

Latent Class Models for Marketing: An Application to Pharmaceuticals
Contents
1. Introduction 12. Multi-item scales development 23. A scale to measure customer satisfaction with reference to experiential goods 44. Latent class models 65. Scale evaluation 9
5.1. Dimensionality 95.2. Criterion validity 105.3. Construct validity 10
6. Conclusions 11
Department of Statistical SciencesVia Cesare Battisti, 24135121 PaduaItaly
tel: +39 049 8274168fax: +39 049 8274170http://www.stat.unipd.it
Corresponding author:Firstname Lastnametel: +39 049 827 [email protected]://www.stat.unipd.it/~name

1 Section 1. Introduction
Latent Class Analysis for Marketing Scales Development
Francesca BassiDepartment of Statistical SciencesUniversity of PaduaItaly
Abstract: Measurement scales are a crucial instrument for research in marketing in order to measure unobservablevariables as attitudes, opinions, beliefs. In using, evaluating, or developing multi-item scales, a number of guidelinesand procedures are recommended to ensure that the measure is psychometrically robust. These procedures have beenoutlined in the psychometric literature since the late seventies and are composed of steps which refer to constructdefinition, domain and scale validity, reliability, dimensionality, and generalizability. Various statistical instruments areused in the scale developing process, these almost always refer to metric variables (interval or ratio scales). Itemsforming scales are instead rarely measured on an metric level, frequently items are ordinal, in some rare cases, nominal.In this paper, it is shown how the implementation of latent class analysis may improve the process of measurementscale development since it explicitly considers that items generate ordinal or even nominal variables. Specifically,applying appropriate latent class models allows to assess scale validity and reliability more soundly than the methodstraditionally used.
Keywords: measurement scales, validity, reliability, latent class factor model, latent class regression model, ordinalvariables
1. IntroductionMeasurement scales are a crucial instrument for research in marketing in order to measure
unobservable variables as attitudes, opinions, beliefs. Examples of unobservable variables related tomarketing are customer satisfaction, purchase involvement, brand loyalty, scepticism towardsadvertising and many others (for a review, see Bearden and Netemeyer 1998).
In using, evaluating, or developing multi-item scales, a number of guidelines and proceduresare recommended to help ensure that the measure is psychometrically as sound as possible. Theseprocedures are delineated in the psychometric literature since the late seventies. Traditionally, withsome exceptions, the literature followed the procedure outlined by Churchill (1979) who identifies anumber of steps to take in developing a measure. These steps refer to construct definition anddomain, and scale validity, reliability, dimensionality, and generalizability. Various statisticalinstruments are used in the scale developing steps, these almost always refer to variables measuredon a metric scale (examples are correlation coefficients, factorial analysis, regression models).Items forming scales are instead almost always measured on a level which is different from themetric one; often items are ordinal, in some rare cases, nominal. Likert, semantic differential, andStaple scales, for example, generate ordinal variables.
In this paper, I show how the implementation of latent class analysis (McCoutcheon 1987)may improve the process of measurement scale development since it explicitly considers that itemsgenerate ordinal or even nominal variables. Specifically, applying appropriate latent class modelsallows to assess scale validity and reliability more soundly than the methods traditionally used.
The data used in the paper refer to a scale designed in order to measure customer satisfactionwith reference to an experiential good, specifically a movie seen at the cinema (Bassi 2010). Theproposed procedure can be used to evaluate scales to measure any other construct relevant inmarketing.The paper is organized as follows. Section 2 reviews the literature on measurement scaledevelopment. Section 3 describes the scale under evaluation, a scale to measure customersatisfaction with reference to an experiential good, the data used in the paper and some preliminary
Francesca Bassi 2
analyses on it. Section 4 introduces the latent class approach and its extensions - latent class factormodels and latent class regression models – that are especially suited for measurement scaleevaluation. Section 5 evaluates a scale proposed using statistical method that take into account theunobservable nature of the construct and the fact that items generate ordinal variables. Section 6concludes.
2. Multi-item scales developmentMulti-item measurement scales are largely employed in marketing research for various
reasons (Churchill 1979). Single-item measures (Berkvist & Rossiter 207) have considerableuniqueness in that each item tends to have only a low correlation with the attribute being measured,secondly, single items tend to categorize people into a relatively small number of groups, third,individual items typically have considerable measurement error and, last but not least, manyphenomena related to marketing research are multidimensional and not directly observable.
Many questions in marketing research regard measuring attitudes, i.e., psychologicalconstructs, ways of conceptualizing intangible mental states used by individuals to structure the waythey perceive the environment and guide the way they respond to it. Examples of attitudes relevantin the field of marketing research are customer satisfaction, purchase involvement, marketorientation, consumer attitude toward marketing, service quality. It is unrealistic to measureattitudes towards complex objects with single-item scales. A large variety of multi-item scales hasbeen proposed in the marketing literature in order to measure a sample of beliefs about the attitudeobjects (such as agreement or disagreement with a number of statements) and combine the answersin some form of average score. The most frequently employed are the Likert and the semanticdifferential scale.
Likert scales require respondents to indicate a degree of agreement or disagreement with avariety of statements, or items, related to the attitude or object. Often five ordered response levelsare used, but there are Likert scales also with seven or nine ordered responses. The scores onindividual items are summed to produce a total score for the respondent; for this reason, animportant assumption of the Likert scale is that each of the items measures some aspect of a singlecommon factor.
In semantic differential scales (Snider & Osgood 1969), respondents are asked to rate eachattitude object on a number of five- or seven-point rating scales, bounded at each end by polaradjectives or phrases. Each of the seven scale categories is assigned a value form –3 to +3 or from 1to 7, and the scores across all adjectives pairs are summed for each respondent. Staple scales are asimplified versions of semantic-differential scales, which use only one pole rather tan two.
Developing a multi-item scale is a complex procedure and requires quite a lot of expertise.A large number of papers in the marketing literature is devoted to this topic. The first papersappeared in the seventies, in particular two seminal works were published to which almost all thefollowing relevant literature on the topic refers. Peter (1979) reviews traditional reliability theoryand measurement, discussing basic concepts and evaluating assessment procedures for use inmarketing research. Peter also introduces the generalizability theory, providing a unified conceptualand operational approach for addressing reliability issues. Finally, the author applies reliabilityassessment in the area of marketing, specifically on consumer behaviour. Churchill (1979) proposesa framework, a sort of protocol, by which measures of constructs of interest to marketers can bedeveloped having desirable reliability and validity properties. This framework is still followed inmany studies published in the relevant literature which propose new or refined instruments tomeasure marketing constructs and, for this reason, deserves our attention. The procedure proposedby Churchill is articulated in a sequence of steps.
The first step involves specifying the domain and the definition of the construct. Constructdescription implies to describe what is included in and what is excluded from the domain, and the a
3 Section 2. Multi-item scales development
priori dimensionality. A thorough review of the existing literature and experts opinion are usuallyhelpful.
The second step consists of generating items which capture the domain as specified; thefollowing steps aim at purifying the measure, which means obtaining a measure which is valid andreliable. Items should exhibit content validity, that is, they must be consistent with the theoreticaldomain of the construct. To this aim, items should be screened by judges with expertise in thereference literature and undergo several pilot tests on samples from the relevant population. Itemsare judged also on their readability, clearness and redundancy. On the bases of these criteria,unnecessary items are eliminated and unclear items are rewritten. In this phase, it is also possiblethat items, relevant to the measure but ignored in a preceding step, were included in the scale.
The procedure continues assessing reliability with new data. A measure is consideredreliable to the extent that independent but comparable measures of the same trait or construct of agiven object agree. Reliability is a necessary but not sufficient condition of validity. In order toevaluate reliability, items are inserted into a questionnaire and administered to a sample ofrespondents. With the collected data reliability indicators are calculated. High inter-itemcorrelations, for example, indicate that items are drawn from the domain of a single construct, lowinter-item correlations, on the contrary, indicate that some items are not drawn from the appropriatedomain and are producing error. High inter-item correlations together with high item-to-totalcorrelations show that the scale is internally consistent. Correlation between the same person’sscore on the same set of items at two points in time is a measure of test-retest reliability. Cronbach’salpha coefficient (Cronbach, 1951) is recommended as a measure of internal consistency, togetherwith other indexes like Guttman G and Spearman-Brown Y. In this phase scale dimensionality isalso evaluated. A construct’s domain may be uni- or multidimensional. In this context, variousinstruments are proposed. Factor analysis is suggested to determine the number of dimensionsunderlining the construct. Scale unidimensionality is considered a prerequisite to reliability andvalidity; if a scale is multidimensional, reliability, for example, has to be assessed for eachdimension.
Beyond content validity, dimensionality, and reliability, a number of other validity issuesmust be considered in scale development, including construct validity, which articulates inconvergent and discriminant validity.
Determining the extent to which the measure correlates with others designed to measure thesame object generates evidence of convergent validity; determining the extent to which the measurecorrelates with measures that are supposed not measuring the same concept generates evidence ofdiscriminant validity, in this context the instrument traditionally proposed is the multitrait-multimethod matrix (Campbell and Friske, 1959). Investigating if the measure behaves as expectedin relation to other constructs evaluates criterion validity. A final step consists in determiningnorms, i.e., assessing the position of the individual on the characteristics measured by comparingthe person’s score with the score achieved by others.
Relevant and more recent contributions to the topic of scale development are Gerbing andAnderson (1988), Rossiter (2002), Finn and Kayande (2005). Gerbing and Anderson, building onthe work of Churchill (1979) and Peter (1979), outline an updated paradigm for scale developmentthat incorporates confirmatory factor analysis for the assessment of unidimensionality. Rossiterproposes a new procedure for the development of scales to measure marketing constructs based oncontent validity established by experts agreement after pre-interviews with target raters. Theprocedure is labelled C-OAR-SE to reflect its concern with construct definition (C), objectclassification (O), attribute classification (A), rater identification (R), scale formation (S) andenumeration and reporting (E). Rossiter challenges the traditional procedure advocated by Churchill(1979), showing that it is a subset of the C-OAR-SE framework. Finn and Kayande suggest thatmultivariate generalizability theory integrates the two competing perspectives (by Churchill andRossiter) by requiring an emphasis on conceptual rigor and empirical evaluation of constructs.Other interesting contributions are that by Zaichkowsky (1985) who develops a protocol to measure

Francesca Bassi 4
purchase involvement and that by De Vellis (1991) who refines the procedure to obtain valid,reliable and generalizable measurement scales. Very recent ones are Coelho and Esteves (2007)who face the problem of the optimal number of response alternatives to an item and Treblanche andBoshoff (2008) who show how structural equation modelling improves construct validity.
The topic of marketing scale development occupies a relevant portion of space in theliterature: a compilation of multi-item, self-reported measures developed and used in consumerresearch and market behaviour is in the handbook by Bearden and Netemeyer (1998). Thehandbook refers to papers published in the most important journals in the areas of marketing andconsumer behaviour research. The majority of scales is developed following the lines outlinedabove, based on the seminal works of Peter (1979) and Churchill (1979).
3. A scale to measure customer satisfaction with reference toexperiential goods
The data used in this paper was collected with a scale proposed to measure customersatisfaction with reference to experiential goods (Bassi, 2010). The peculiar nature of these goodsmeans that both the classical theory of consumer behaviour and traditional marketing need revisionand extension. Experience may be defined as an event that involves a person in a memorable way(Pine and Gilmore, 1999). This means that experiential goods cannot be treated with traditionalcriteria (for example, utilitarian), since they involve a greater affective component, hedonisticcriteria, and customers’ personal characteristics (Babin et al., 1994).
The scale was designed within a research project which aims at measuring customer satisfactionby considering all aspects involved in a consumption experience (Bassi and Guido, 2006). The scalewas tested on a convenience sample and its reliability and validity were evaluated following theprotocol proposed by Zaichowsky (1985) which is nested in the procedure for scale developmentproposed by Churchill (1979). The product chosen was a film seen at the cinema.
The method used to build the scale started with an exploratory research in order to define theobject to be measured. Items were then generated by means of a literature review and anexploratory survey with two focus groups and interviews with an open-question questionnaire.Items were first evaluated and selected with reference to their representativeness and consistencywith the concept to be measured, and then on the bases of validity and reliability (Litwin, 1995).
The traditional disconfirmation paradigm defines customer satisfaction as the result of anevaluation which compares product performance, as perceived by customers, with theirexpectations and desires (Spreng et al., 1997). In our approach, the nature of the concept ismaintained as an evaluation deriving from a comparative process, but the terms with whichexpectations and desires are compared are extended: from product performance to consumptionexperience. Customer satisfaction is defined as an evaluation emerging from a comparison betweenexpectations and performance of aspects relevant to the entire consumption experience. Items weregenerated with reference to the various phases of a consumption experience, focusing onexperiential goods with relative aspects connected to purchase. Items were suggested by a literaturereview (covering customer behaviour, experiential goods, development of scales, and customersatisfaction), focus groups with consumers and a survey with an open-question questionnaire on aconvenience sample of customers.
Items were evaluated as regards content validity on the basis of two criteria: (i) therepresentativeness of the concept to be measured, and (ii) comparison of aspects emerging from theliterature with those expressed in the focus groups and questionnaires.
Twenty selected items composed the final scale (see Appendix). Respondents were requested toexpress their judgement on each item with reference to their expectations and desires on a five-pointscale ranging from “much less than expected” to “much more than expected”. Items 1-3 refer to theneed recognition phase of the consumption experience, items 4-7 to information search, items 8-10

5 Section 3. A scale to measure customer satisfaction with reference to experiential goods
to evaluation of alternatives, items 11-14 to purchase decision, and items 15-20 to consumption andpost-purchase evaluation.
In a preceding work (Bassi, 2010) scale properties were evaluated using data collected on aconvenience sample of 100 respondents. Item to total correlation coefficients were higher than 0.5,except for items 1, 2, 3, 4, 6, 7, 10, 13 and 20; in particular, item–7-to-total correlation coefficientwas not statistically different from 0 at a significance level of α=0.05. It was therefore concludedthat items 1 to 7, referring to the two first phases of the consumption experience, are not completelysuitable for measuring customer satisfaction with reference to a film seen at the cinema, and mustbe better formulated. Factor analysis confirmed this hypothesis: one dominating eigenvalue wasfound, with a factor correlated to all items except 1, 2, 5 and 7. There was one factor explaining24% of total variance – not a very high percentage, but significant in confirming the internalreliability of items.
Coefficients which measure internal scale reliability showed satisfactory levels of internalconsistency: Spearman-Brown (0.65), Guttman (0.64) and Cronbach’s alpha (0.81) coefficientswere calculated and showed a satisfactory level of internal consistency In order to evaluate scalereliability over similar conditions, the sample was randomly divided into two groups. A t-testshowed not only that the means in the two groups were not significantly different, but also that theinternal reliability coefficients had similar, and high, values in the two random subsamples.
Criterion validity is the degree of correspondence between a measure and a criterion variable,usually assessed by their correlation. To assess criterion validity, we need a variable that gives us astandard with which to compare our measure. In the final part of the questionnaire, one additionalitem (A1) was introduced, asking respondents to express their satisfaction with the entireconsumption experience – a film seen at the cinema - on a five-point scale. This item was ourcriterion variable. The correlation coefficient between the average scale value and the criterionvariable was 0.5 - not very high, but sufficient to ensure validity.
Univariate analysis of variance (ANOVA; for the method, see Malhotra, 1999 ), with the totalscore as dependent variable and the criterion variable as factor, showed that the average total scorewas significantly different among the five levels of the criterion variable.
Construct validity assesses whether a measure relates to other observed variables in a way thatis consistent with theoretically derived predictions. In order to evaluate construct validity, threemore additional items were introduced into the final part of the questionnaire, describing aspectsassumed to be positively correlated with the overall satisfaction level:
A2. I would like to see this film again.A3. I will speak well about this film and this cinema.A4. I do not have any complaint about the consumption experience.Respondents were asked to answer on a five-point scale. Correlation coefficients between average total score and scores on the three additional items
were 0.5, 0.5 and 0.4, respectively; all statistically different from 0.Our scale total score was classified into three categories: low (total score ≤ 63), medium (64-72)
and high (≥ 73), according to the quartiles of the distribution. Three ANOVAs, one per additionalitem, were conducted in order to evaluate differences among means per satisfaction level. Only forthe first two additional items were means statistically different. This result, together with the factthat the third item also showed the lowest correlation with the total score, casts some doubt on itsspecification. It is, in effect, difficult for a customer not to have one single complaint about such acomplex experience. Nevertheless, these complaints may not influence the overall satisfaction level.
Multivariate analysis of variance (MANOVA, for the method, see Malhotra, 1999) evaluated allthree items together with reference to satisfaction level. The means of the three additional itemswere significantly different across total score levels. This result means that respondents with a lowscale score assigned scores to the three additional items different from those assigned byrespondents having medium or high total scores which is another proof of scale construct validity.

Francesca Bassi 6
According to the recommendations developed in the literature, starting from Churchill’s (1979)framework, the analyses described above evaluate the scale to measure customer satisfaction withreference to an experiential good to be undimensional, valid and reliable.
In this paper I want to discuss this result starting from the consideration that in the scaledevelopment procedure outlined above, scale properties have been judged applying statisticaltechniques which assume that variables generated by the Likert items are measured on a metricscale. In the following, I show how latent class analysis, which explicitly considers the ordinalnature of observed variables may improve scale evaluation. Another advantage of LC analysis isthat it allows to consider the object that the scale aims at measuring, customer satisfaction, is notdirectly observable. Three aspects of the scale development procedure will deserve attention. In theassessment of scale dimensionality, factor analysis, traditionally employed and recommended (see,for example, the work by Gerbing and Anderson, 1988) is more appropriately replaced by anextension of latent class models denominated latent class factor model (Magidson and Vermunt,2001). For the assessment of criterion validity, I propose an approach that takes explicitly intoaccount the fact that the object under measurement is not directly observable. In the assessment ofconstruct validity, correlation coefficients are more appropriately replaced by latent class regressionmodels (Magidson and Vermunt, 2004). In order to estimate latent class models, the scale wasadministered to a new convenience sample of 800 respondents.
4. Latent class modelsThe basic notions of latent class (LC) analysis were developed by Lazarsfeld (1950) and his
associates (Lazarsfeld and Henry, 1968). Credit for feasible and flexible algorithms for testing thevalidity of a wide variety of latent class models (LCM) and estimating their parameters is dueespecially to Goodman (1974) and Haberman (1979). Introduction to more recent developments areprovided by Clogg (1982), Forman (1985) and Hagenaars (1990).
There are two kinds of variables in LCM: directly observed manifest variables, also calledindicators, and not directly observed latent variables. Both types of variables are treated as nominal-level, but there exist appropriate extensions of the latent class approach that treat variables asordinal-level. Categories of the latent variables are called latent classes.
In the latent class approach, respondents’ scores on indicators are a direct result of theirbelonging to one of the latent classes. However, the relation between the latent variable and itsindicators is not deterministic, but probabilistic. Furthermore, it is assumed that the scores on themanifest variables do not influence each other directly, all the manifest variables have in common istheir being indicators of the same latent variable. The manifest variables are correlated with eachother, but this correlation disappears when the latent variable is held constant. This is theassumption of local independence.
A latent class model for four nominal manifest variables A, B, C and D, and one latentvariable X, is defined as:
XDlt
XCkt
XBjt
XAit
Xt
ABCDXijklt
|||| ππππππ =
where ABCDXijkltπ is the proportion of units in the five-way contingency table,
Xtπ is the probability of being in latent class t=1,2,…,T of variable X;
XAit
|π is the probability of obtaining the ith, , i=1,2,…,I, response to item A, from members oflatent class t;
XBjt
|π , XCkt
|π , XDlt
|π , j=1,2,…,J, k=1,2,…,K, l=1,2,…,L, are the conditional probabilities of itemsB, C and D, respectively.
Observed responses to indicators A, B, C and D are mutually independent, given the latentvariable X, as the local independence assumption implies.

7 Section 4. Latent class models
Any LC model is equivalent to a loglinear model with latent variables (Haberman, 1979); inthe case of four indicators and one latent variable, in loglinear terms, we have:
DXlt
CXkt
BXjt
AXit
Dl
Ck
Bj
Ai
Xt
ABCDXijkltF λλλλλλλλλλ +++++++++=ln
where ABCDXijkltF is the absolute frequency in the generic cell of a five-way contingency table;
Xtλ , A
iλ , Bjλ , C
kλ and Dlλ denote first-order effects;
AXitλ , BX
jtλ , CXktλ and DX
ltλ denote second-order effects.The assumption of local independence is imposed by the omission of all interaction terms
pertaining to the associations between the indicators. For example, conditional probability XA
it|π may be written as:
∑=
+
+=
I
r
AXrt
Ar
AXit
AiXA
it
1
|
)exp(
)exp(
λλ
λλπ(1)
When the indicators are ordinal, the second-order effect in equation (1) becomes iXt
AXit λλ =
, where i is the score assigned to item A. This yields the adjacent-category ordinal logit model(Goodman, 1979).
One goal of traditional LC analysis is to determine the smallest number of latent classes Twhich is sufficient to explain the associations observed among the manifest variables. The final stepof LC analysis is to use the results of the model to classify units into the appropriate latent class.For any given response pattern (i, j, k, l), estimates for the posterior membership probabilities maybe obtained through the Bayes theorem. Cases are then assigned to the class for which the posteriorprobability is highest. Magidson and Vermunt (2001) refer to this as an LC cluster model becausethe goal of classification into T homogeneous groups is identical to that of cluster analysis. Cases inthe same latent class are similar because their responses are generated by the same probabilitydistribution.
Rejection of a T-class LCM due to lack of fit means that the local independence assumptiondoes not hold. The traditional model-fitting strategy is to fit a T+1-class model to the data, butalternative strategies may be considered, to see if they lead to more parsimonious models, as well asmodels more congruent with initial hypotheses. Magidson and Vermunt (2001) show that, byincreasing dimensionality by adding latent variables rather than latent classes, the resulting LCfactor model often fits data better than the LC cluster model with the same number of parameters. Inaddition, LC factor models are identified in some situations when the traditional LCM is not.
Certain traditional LCMs containing four or more classes may be interpreted in terms of twoor more component latent variables (factors). For example, a latent variable X consisting of fourclasses can be represented in terms of two dichotomous latent variables V and W, using thefollowing correspondences: X=1 corresponds with V=1 and W=1; X=2 with V=1 and W=2; X=3with V=2 and W=1; X=4 with V=2 and W=2. Formally, for four nominal variables, the four-classLCM may be reparameterised as an unrestricted LC factor model with two dichotomous latentvariables, as follows:
VWDlrs
VWCkrs
VWBjrs
VWAirs
VWrs
VWABCDijklrs
VWrs
ABCDVWijklrs
||||| ππππππππ ==
and in loglinear terms:

Francesca Bassi 8
DVWlrs
CVWkrs
BVWjrs
AVWirs
DWls
CWks
BWjs
AWis
DVlr
CVkr
BVjr
AVir
Dl
Ck
Bj
Ai
VWrs
Ws
Vr
ABCDVWijklrsF
λλλλλλλλλ
λλλλλλλλλλλ
+++++++++
+++++++++++=ln(2)
The basic R-factor LCM contains R dichotomous latent variables which are mutuallyindependent of each other and which exclude higher-order interactions from the conditionalresponse probabilities. Specifically, the basic R-factor model is obtained by imposing appropriaterestrictions on the unrestricted LC factor model. In the case of R=2, from equation (2), we have:
DWls
CWks
BWjs
AWis
DVlr
CVkr
BVjr
AVir
Dl
Ck
Bj
Ai
Ws
Vr
ABCDVWijklrsF
λλλλ
λλλλλλλλλλλ
++++
+++++++++++=ln
where the two-variable terms become:
AWis
AVir
AXsri λλλ +=+− )1(2, , BW
jsBVjr
BXsrj λλλ +=+− )1(2,
For variable A, AVirλ represents the loading of A on factor V and AW
isλ the loading of A onfactor W. Fixing the three-variable terms equal to 0 implies that each of the factors may have aninfluence on each indicator, but there is no interaction. Mutual independence between latentvariables make the model similar to exploratory factor analysis.
Magidson and Vermunt (2001) show that the basic LC factor model with R independentfactors has the same number of distinct parameters as a traditional LC cluster model with R+1classes. This offers a great advantage in parsimony and results are often easier to interpret.
In a LC regression model, the latent variable is a predictor that interacts with observedpredictors. The LC regression model provides several useful functions. First, it can be used toweaken standard regression assumptions about the nature of the effects and the error term. It makesit possible to identify and correct for sources of unobserved heterogeneity. It can be used to detectoutliers. An important application area for LC regression modelling is clustering or segmentation(Popper et al., 2004; Wedel and Kamakura, 2000).
The most general probability structure for a LC regression model takes on the followingform:
∑ ∏= =
=K
x
T
t
predititi
prediii
i
zXyfzXPzzyf1 1
covcov ),|()|(),|(
where ity is the value of the dependent variable observed on unit i at occasion t;
iT is a the number of replications for unit i;coviz is a vector of covariates;prediz is a vector of predictors;
X is single nominal latent variable with K categories, or classes.
5. Scale evaluationThe protocol for scale valuation, described in Section 3, was applied to the data collected on
the new convenience sample of 800 respondents. Obtained results are substantially the same asthose illustrated in Section 3. In the following, I refer on the analyses conducted with the new

9 Section 5. Scale evaluation
approach to evaluate the scale with special reference to dimensionality, criterion validity andconstruct validity.
5.1.DimensionalityFactor analysis is largely employed in measurement scale evaluation, especially in order to
verify the dimensionality of the construct described by a set of items. Even if it is largely knownthat factor analysis is a statistical instrument appropriate to metric variables, it is nevertheless usedalso when items generate ordinal variables. In this case, estimation results may be biased and alsoindexes of model fit may give misleading results.
Table 1. Factor loadingsItem Factor 1 Factor 2 Factor 3I1 -0,4054 0,2832 -0,2373I2 -0,5464 0,3657 -0,2836I3 -0,2186 0,2153 0,2471I4 -0,4278 0,3742 -0,0682I5 -0,5434 0,4343 -0,0205I6 -0,3978 0,4353 0,0255I7 -0,2273 0,4320 -0,0426I8 -0,4458 0,0587 0,4792I9 -0,1907 0,4076 0,2644I10 -0,2139 0,1780 0,1142I11 -0,0472 0,4098 0,1462I12 -0,0809 0,4290 0,0782I13 -0,1949 0,3922 -0,0253I14 -0,2125 0,5333 0,1006I15 -0,5037 0,3386 0,2755I16 -0,2768 0,0253 0,4977I17 -0,1142 0,1479 0,4290I18 -0,3831 0,0703 0,4044I19 -0,3514 0,0268 0,5142I20 -0,1434 0,1128 0,3087
The LC factor model, instead, is appropriate to treat nominal and ordinal variables in thecase of dimensionality evaluation.
For what concerns our scale to measure customer satisfaction with reference to a movie seenat the cinema, factor analysis on the new sample of 800 respondents confirmed the existence of 1latent factor, explaining 20.5% of total variance and with factor loadings higher then 0.30 with allitems. This result leads to conclude that the measurement scale is unidimensional.
Estimating on the same data a LC factor model which considers observed variables asordinal revealed 3 latent factors. The LC factor model which showed the best fit to the data (lookingat the BIC index1) is the one with 3 binary latent factors. Estimated factor loadings (Table 1)describe the three factors. The first factor is linked to items 1, 2, 3, 4, 5, 10 and 15 referring toinformation search; the second factor loads on items 6, 7, 9, 11, 12, 13 and 14 that regard thecinema and its characteristics; the third factor is linked to remaining items that describe the movie.The measurement scale results tri-dimensional, made up of three components that determinecustomer satisfaction: one referring to information, advertising included, collected before the movie
1 The Bayesian Information Criterion (BIC) index is an instrument used to select among alternative non-nested models.It is a function of the likelihood-ratio goodness-of-fit value and the number of degrees of freedom to take into accountthe parsimony of the model. The model with the lowest BIC index has the best fit to the data.
Francesca Bassi 10
is seen; a second one that comprises the cinema and all its features: environment, personnel, cost;and a third one regarding the product “movie” itself and especially its ability to involve the viewer.
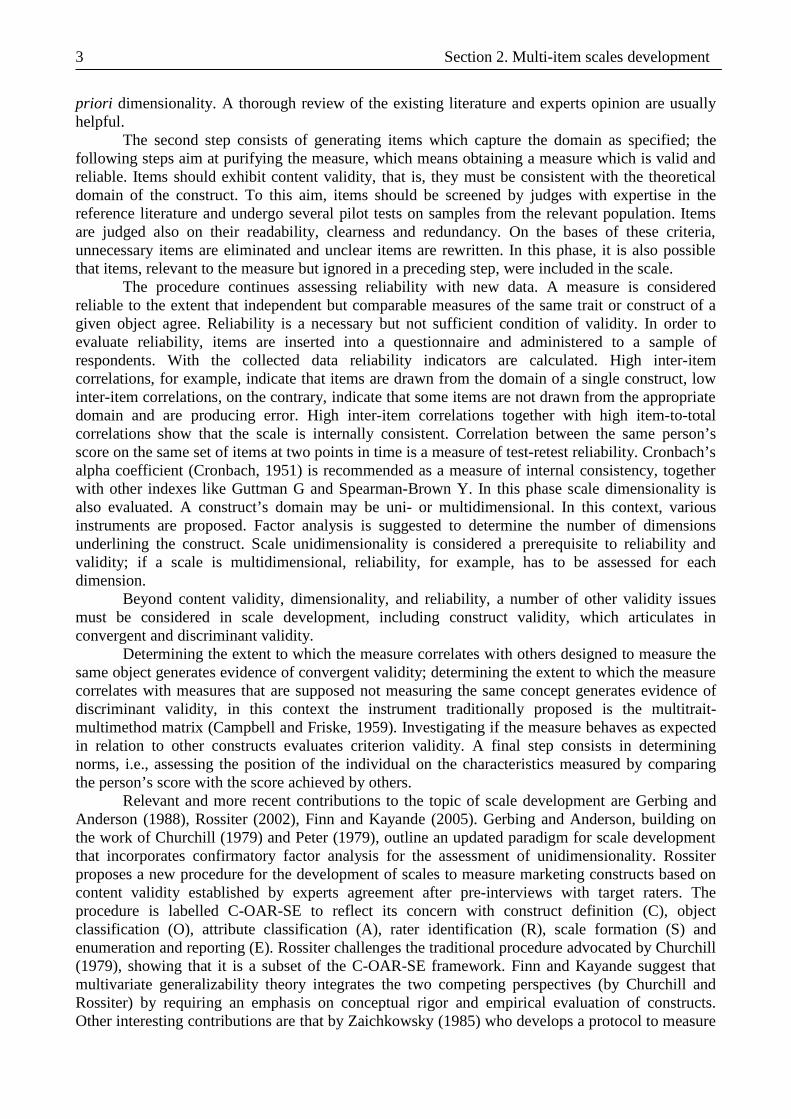
5.2.Criterion validityIn this paper an alternative approach to evaluate criterion validity of a measurement scale isproposed. This approach considers both the fact that the object to be measured is not directlyobservable and that the items generate variables with an ordinal nature.
With reference to our example, estimating a LC cluster model with 1, 2 and 3 latent classesrevealed that the scale identifies 3 latent segments of customers with different levels of satisfactiontowards the product chosen – the movie seen at the cinema. The LC cluster model with 3 latentclasses showed the best fit to the data according to the BIC index2. Another interesting result frommodel estimation is that all items (except for item 3 in segment 1) are statistically significant inidentifying latent groups. The first segment (group 1) is composed of 14% of the sample andidentifies respondents with highest levels of satisfaction on all items (the average satisfaction levelis 3,80). The second segment (group 2) contains 78% of the sample and refers to customers with amedium level of satisfaction (3,27). In the third segment (8%) we find customers least satisfied(average level on the scale is 2,66).
The proposed procedure to evaluate criterion validity compares the latent variable with thecriterion variable (additional item A1), reorganized in three classes. Some indices of agreementbetween the two measures (latent variable and additional item) were calculated: the percentage ofunits consistently classified is equal to 84%, Cohen’s Kappa coefficient is equal to 0.285, Somers Dto 0.298. All these values cast some doubts on the property of criterion validity for our scale.
5.3.Construct validityAlso to evaluate construct validity, in this paper a new approach is proposed. Usually, to this aim,correlation coefficients are calculated, this instrument is better suited for metric variable. Theproposed procedure considers ordinal observed variables and, again, the fact that the object undermeasurement is not directly observable.
Table 2. Regression coefficients and z statistics for LC regression models with 3latent classes and A2, A3, and A4 as dependent variables.
Class 1 Class 2 Class 3 2R
S2coefficient 25,79 7,24 -0,74 0,57Z 5,06 2,15 -1,36S3coefficient 11,75 -0,34 17,64 0,52z 0,01 -0,44 2,31S4coefficient -10.12 13,51 4,98 0,82z -2,41 3,31 4,27
LC regression models, as anticipated in section 4, estimate a casual relationship among oneor more predictive variables and one dependent variable, taking into account that this relation maydiffer across latent classes. The difference with the traditional regression model, where allpredictors all observed, is in the fact that, in the LC regression model, one or more latent variablesinteract with the observed independent variables.
2 The BIC index for the LC cluster model with 3 latent classes is lower than that of the LC cluster model with 2 latentclasses but slightly higher than that with 4 latent classes. The percentage of classification errors, i.e., the proportion ofcases erroneously classified assigning each unit to the class with higher posterior probability, is the lowest for the LCcluster model with 3 latent classes.

11 Section 5. Scale evaluation
On our data, three LC regression models were estimated having all as predictor the overall level ofsatisfaction measured with the scale and as dependent variables the answers to the 3 additionalitems A2 (I will see the film again), A3 (I will speak well about the film and the cinema) and A4 (Ido not have any complaints about the consumption experience). In all three models the best fit(looking at the BIC index) was obtained with 3 latent classes, as was expected from the resultsobtained verifying the property of criterion validity.
LC regression models estimation results are listed in Table 2. They are a bit surprisingespecially considering that, using the traditional approach and calculating correlation coefficientsbetween the observed level of satisfaction and the three additional items, the measurement scalewas judged to have the property of construct validity.
The relationship between the average score obtained with the scale and the intention to seethe movie again is estimated significantly different in the three latent classes. In two groups (class2: medium level of satisfaction and class 1: high level of satisfaction) this relation is positive, in thethird group (low level of satisfaction) the relations is estimated not significantly different from 0.
For what concerns the relationship between the observed level of satisfaction and the fact tobe willing to speak positively about the consumption experience, the estimated regressioncoefficient has been estimated statistically significant and positive only in the first latent class,where customers are the least satisfied.
Finally, the observed level of satisfaction is a statistically significant predictor of the fact notto have complaints about the consumption experience in all three groups. In the latent classes withlow and medium satisfaction level the relation is positive, in the third class, the relation is negative.
The above results cast some doubt on criterion validity for our measurement scale.
6. ConclusionsIn this paper it has been shown how LC analysis allows to improve the traditional approach todevelpo and validate measurement scales.
The LC approach, specifically, takes into account the facts that data collected with items areoften ordinal and that the objects that the scale aims at measuring are not directly observable.
The data used in this work was obtained administering a scale to measure customersatisfaction with reference to an experiential good: a movie seen at the cinema to a sample ofrespondents. The scale was develpoed in order to take into account all phases of the consumptionexperience.
Traditional (cluster) LC models were used to evaluate criterion validity. LC class factormodels were estimated in order to evaluate scale dimensionality and LC regression models wereapplied to assess construct validity. All models take into account the facts that customer satisfactionis not directly observable and has to be represented by a latent variable and that observed variableshave an ordinal nature.
Model estimation results do not always confirm the evidences obtained evaluating the scalewith traditional methods of analysis and show the potentialities of these instruments inside theprotocols to develop measurement scales. These results encourage application of the method in thisfiled and suggest further research work.

Francesca Bassi 12
ReferencesBabin, B.J., Darden, W.R. & Griffin, M. (1994) Work and/or fun: measuring hedonic and utilitarianshopping value. Journal of Consumer Research, 20, 4, pp. 644-656.Bassi, F. (2010). Experiential goods and customer satisfaction: an application to movies. QualityTechnology & Quantitative Management, 7, 1.Bassi, F., & Guido, G. (2006). Measuring customer satisfaction: from product performance toconsumption experience, Journal of Consumer Satisfaction, Dissatisfaction and ComplainingBehavior, 19, 76-85.Bearden W.O & Netemeyer R.G. (1998). Handbook of Marketing Scales. Thousand Oaks, CA:Sage.Bergkvist, L. and Rossiter, J.R. (2007). The predictive validity of multiple-item versus single-itemmeasures of the same construct. Journal of Marketing research, 44, May, 175-184.Campbell, D.R. & Friske, D.W. (1959). Convergent and discriminant validation by the multitrait-multimethod matrix. Psychological Bulletin, 56, pp. 81-105.Churchill, G.A. (1979). A paradigm for developing better measures of marketing constructs.Journal of Marketing Research, 16, 1, pp. 64-73.Coelho, P.S. & Esteves, S.P. (2007). The choice between a five-point and a ten-point scale in theframework of customer satisfaction measurement. International Journal of Marketing Research, 49,3, 313-339.Clogg, C.C. (1981). Latent structure models for mobility. American Journal of Sociology, 86, 836-868.Cronbach, L.J. (1951). Coefficient Alpha and the internal structure of tests. Psychometrika, 16, pp.297-334.Finn, A. & Kayande, U. (2005). How fine is C-OAR-SE? A generalizability theory perspective onRossiter’s procedure. International Journal of Research in Marketing, 22, pp. 11-21.Gerbing, D.W. & Anderson, J.C. (1988) An updated paradigm for scale development incorporatingundimensionality and its assessment. Journal of Marketing Research, 25, 2, pp. 186-192.Goodman, L.A. (1974). The analysis of systems of qualitative variables when some of the variablesare unobservable: part I. A modified latent structure approach. American Journal of Sociology, 79,1179-1259.Goodman L.A. (1979). Simple models for the analysis of association in corss-classifications havingordered categories. Journal of the American Statistical Association, 74, 537-552.Haberman, S. J. (1979). Analysis of Qualitative Data, Vol.2. New York: Academic Press.Hagenaars, J.A. (1990). Categorical Longitudinal Data: Loglinear Panel, Trend and CohortAnalysis. Newbury Park: Sage.Lazarsfeld, P.F. (1950). The Interpretation and Logical Foundation of Latent Structure Analysis. InStoufer S., (eds.), Measurement and Prediction. NJ: Princeton University Press.Lazarsfeld, P.F. & Henry N.W. (1968). Latent Structure Analysis. Boston: Houghton Mufflin.Litwin, M.S. (1995). How to Measure Survey Reliability and Validity. New York: Sage.Magidson, J. & Vermunt, J.K. (2001). Latent class factor and cluster models, bi-plots and relatedgraphical displays. Sociological Methodology, 31, pp. 223-264.Magidson, J. & Vermunt, J.K. (2004). Latent class models. In Kaplan D. (ed.) The Sage Handbookof Quantitative Methodology for the Social Sciences, Chapter 10. Thousand Oaks: Sage, pp. 175-198.Malhotra, N.K. (1999). Marketing Research. London: Prentice Hall.McCoutcheon, A.L. (1987), Latent Class Analysis. Newbury Park: Sage.Peter, J.P. (1979). Reliability: a review of psychometric basics and recent marketing practices.Journal of Marketing Research, 16, 1, pp. 6-17.

13 Section References
Pine, B.J. & Gilmore, J.H. (1999). The Experience Economy: Work is Theatre and Every Business aStage. Harvard: Harvard Business School Publishing.Popper, R., Kroll, J., & Magidson, J. (2004). Application of latent class models to food productdevelopment: a case study. Sawthooth Conference Proceedings, pp. 89-112.Rossiter, J.R. (2002), The C-OAR-SE procedure for scale development in marketing. Journal ofResearch in Marketing, 19, pp. 305-335.Snider, J.G. & Osgood, C.E. (1969). Semantic Differential Techniques: A sourcebook. Chicago:Aldine.Spreng, R.A., Mackenzie, S.B. & Olshavsky, R.W. (1996). A re-examination of the determinants ofconsumer satisfaction. Journal of Marketing, 60, 3, pp. 15-32.Thurstone, L.L. (1928). Attitudes can be measured. American Journal of Sociology, 33, pp. 529-554.Treblanche, N.S., Boshoff, C. (2007). Improved scale development in marketing. InternationalJournal of Research in Marketing, 50, 1, 105-119.Wedel, M., & Kamakura, W. A. (2000). Market Segmentation: Concepts and MethodologicalFoundations. Boston: Kluwer Academic.Zaichkowsky, J.L. (1985). Measuring the involvement construct. Journal of Consumer Research.12, 3, pp. 341-352.
Francesca Bassi 14
Appendix
FINAL QUESTIONNAIRE
PERSONAL INFORMATION: SEX: F M F F AGE:____ CONDITION: F Student F Worker
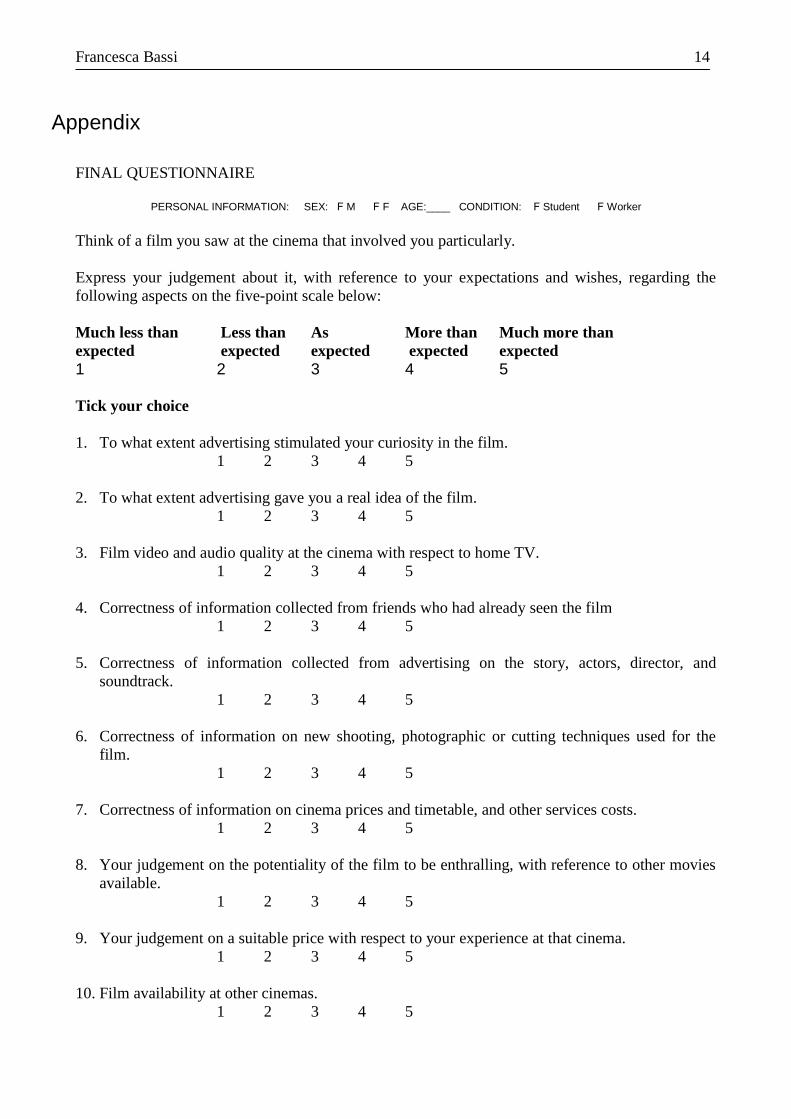
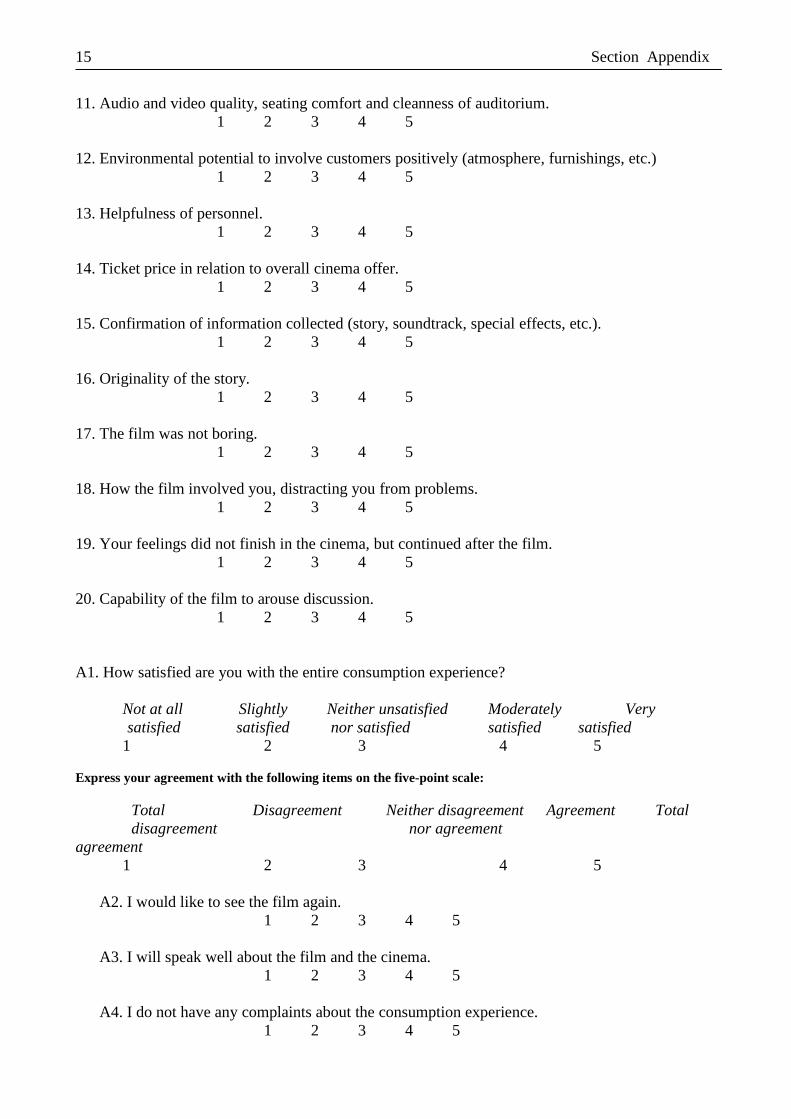
Think of a film you saw at the cinema that involved you particularly.
Express your judgement about it, with reference to your expectations and wishes, regarding thefollowing aspects on the five-point scale below:
Much less than Less than As More than Much more thanexpected expected expected expected expected1 2 3 4 5
Tick your choice
1. To what extent advertising stimulated your curiosity in the film.1 2 3 4 5
2. To what extent advertising gave you a real idea of the film.1 2 3 4 5
3. Film video and audio quality at the cinema with respect to home TV.1 2 3 4 5
4. Correctness of information collected from friends who had already seen the film1 2 3 4 5
5. Correctness of information collected from advertising on the story, actors, director, andsoundtrack.
1 2 3 4 5
6. Correctness of information on new shooting, photographic or cutting techniques used for thefilm.
1 2 3 4 5
7. Correctness of information on cinema prices and timetable, and other services costs.1 2 3 4 5
8. Your judgement on the potentiality of the film to be enthralling, with reference to other moviesavailable.
1 2 3 4 5
9. Your judgement on a suitable price with respect to your experience at that cinema.1 2 3 4 5
10. Film availability at other cinemas.1 2 3 4 5
15 Section Appendix
11. Audio and video quality, seating comfort and cleanness of auditorium.1 2 3 4 5
12. Environmental potential to involve customers positively (atmosphere, furnishings, etc.)1 2 3 4 5
13. Helpfulness of personnel.1 2 3 4 5
14. Ticket price in relation to overall cinema offer.1 2 3 4 5
15. Confirmation of information collected (story, soundtrack, special effects, etc.).1 2 3 4 5
16. Originality of the story.1 2 3 4 5
17. The film was not boring.1 2 3 4 5
18. How the film involved you, distracting you from problems.1 2 3 4 5
19. Your feelings did not finish in the cinema, but continued after the film.1 2 3 4 5
20. Capability of the film to arouse discussion.1 2 3 4 5
A1. How satisfied are you with the entire consumption experience?
Not at all Slightly Neither unsatisfied Moderately Very satisfied satisfied nor satisfied satisfied satisfied
1 2 3 4 5
Express your agreement with the following items on the five-point scale:
Total Disagreement Neither disagreement Agreement Total disagreement nor agreement agreement
1 2 3 4 5
A2. I would like to see the film again.1 2 3 4 5
A3. I will speak well about the film and the cinema.1 2 3 4 5
A4. I do not have any complaints about the consumption experience.1 2 3 4 5

Francesca Bassi 16
Working Paper SeriesDepartment of Statistical Sciences, University of Padua
You may order copies of the working papers from by emailing to [email protected] of the working papers can also be found at the following url: http://wp.stat.unipd.it

![[Topic 9-Latent Class Models] 1/66 9. Heterogeneity: Latent Class Models.](https://static.fdocuments.us/doc/165x107/5697bf8d1a28abf838c8c909/topic-9-latent-class-models-166-9-heterogeneity-latent-class-models.jpg)