Late Quaternary rates of uplift and shortening at Baatar...
20
Geophys. J. Int. (2009) 177, 259–278 doi: 10.1111/j.1365-246X.2008.04067.x GJI Tectonics and geodynamics Late Quaternary rates of uplift and shortening at Baatar Hyarhan (Mongolian Altai) with optically stimulated luminescence Edwin Nissen, 1 Richard Walker, 1 Erdenebat Molor, 2 Morteza Fattahi 3∗ and Amgalan Bayasgalan 2 1 COMET, Department of Earth Sciences, University of Oxford, Parks Road,Oxford OX1 3PR, UK. E-mail: [email protected] 2 Mongolian University of Science and Technology, Ulaan Baatar, Mongolia 3 Oxford University Centre for the Environment, South Parks Road, Oxford OX1 3QY, UK Accepted 2008 November 21. Received 2008 August 21; in original form 2008 March 14 SUMMARY We investigate mountain building in the Altai range of western Mongolia, focusing on Baatar Hyarhan, a NW-trending massif bounded by active thrust faults. Our primary aims are to describe how thrusting has evolved over time, to calculate late Quaternary slip rates by dating offset alluvial markers with optically stimulated luminescence (OSL) and to compare these late Quaternary rates with measurements of deformation on decadal and geological timescales. Patterns of topography and drainage suggest that Baatar Hyarhan has grown in length and has propagated laterally from the SE towards the NW over time. On the NE side of the massif, the range-bounding Zereg fault appears active only along younger parts of Baatar Hyarhan; next to the oldest, SE part of the massif faulting has migrated into the adjacent Zereg Basin, where it has uplifted low, linear ridges of folded sediment, known locally as forebergs. On the SW side of the massif, only the range-bounding Tsetseg fault appears active. Using OSL, we establish ages of ∼15, ∼20 and ∼85 kyr for alluvial deposits cut by these faults. These ages are close to those of alluvial markers in the separate Gobi Altai range, suggesting that periods of fan and terrace formation may correlate over wide tracts of Mongolia, presumably under the primary control of climate. Combining our OSL ages with offsets measured with differential GPS, we calculate Late Quaternary slip rates across forebergs in the Zereg Basin and across the range-bounding Zereg and Tsetseg faults. Uncertainties in fault dip (due to lack of clear fault exposures) and burial ages (due to incomplete resetting of the luminescence clock) mean that the exact slip rates are poorly constrained. Nevertheless, the vertical displacement rates we calculate across the Zereg and Tsetseg range-front faults—0.2–0.6 and 0.1–0.4 mm yr −1 , respectively— are at the lower end of long-term (∼5 Myr) estimates of 0.4–0.8 and 0.3–0.7 mm yr −1 , respectively. Vertical rates of deformation may, therefore, have remained constant over the past ∼5 Myr, but equally the late Quaternary rates might be lower than the geological ones. This possible discrepancy could be accounted for if some of the shortening has shifted away from the range-front faults onto other nearby structures. The forebergs in the eastern Zereg Basin are an obvious candidate, but they show at least 10 km cumulative shortening (which would take a few Ma to accumulate at late Quaternary rates) and cannot simply be regarded as the latest stage of outward mountain growth. The total Late Quaternary shortening rate across all three areas of faulting is 0.7–2.4 mm yr −1 , making up between one tenth and one third of the ∼7 mm yr −1 convergence across the whole Altai range. Key words: Geomorphology; Continental neotectonics; Fractures and faults; Kinematics of crustal and mantle deformation; Asia. 1 INTRODUCTION The Altai mountains of western Mongolia form the northernmost region of active continental shortening within the India–Eurasia col- ∗ Now at: Institute of Geophysics, Tehran University, Kargar Shomali, Tehran, Iran. lision zone, around 2500 km north of the Himalaya (inset, Fig. 1). In contrast to the Himalaya and Tien Shan ranges to the south, which involve thrust faulting perpendicular to the convergence direction, shortening across the Altai is thought to be achieved by the anti- clockwise vertical-axis rotations of N- to NW-trending right-lateral strike-slip faults (Baljinnyam et al. 1993; Bayasgalan et al. 2005). This paper comprises an early attempt to study the evolution of C 2009 The Authors 259 Journal compilation C 2009 RAS
Transcript of Late Quaternary rates of uplift and shortening at Baatar...

Geophys. J. Int. (2009)177, 259–278 doi: 10.1111/j.1365-246X.2008.04067.x
GJI
Tec
toni
csan
dge
ody
nam
ics
Late Quaternary rates of uplift and shortening at Baatar Hyarhan(Mongolian Altai) with optically stimulated luminescence
Edwin Nissen,1 Richard Walker,1 Erdenebat Molor,2 Morteza Fattahi3∗and Amgalan Bayasgalan2
1COMET, Department of Earth Sciences, University of Oxford, Parks Road, Oxford OX1 3PR,UK. E-mail: [email protected] University of Science and Technology, Ulaan Baatar, Mongolia3Oxford University Centre for the Environment, South Parks Road, Oxford OX1 3QY,UK
Accepted 2008 November 21. Received 2008 August 21; in original form 2008 March 14
S U M M A R YWe investigate mountain building in the Altai range of western Mongolia, focusing on BaatarHyarhan, a NW-trending massif bounded by active thrust faults. Our primary aims are todescribe how thrusting has evolved over time, to calculate late Quaternary slip rates by datingoffset alluvial markers with optically stimulated luminescence (OSL) and to compare theselate Quaternary rates with measurements of deformation on decadal and geological timescales.Patterns of topography and drainage suggest that Baatar Hyarhan has grown in length and haspropagated laterally from the SE towards the NW over time. On the NE side of the massif, therange-bounding Zereg fault appears active only along younger parts of Baatar Hyarhan; next tothe oldest, SE part of the massif faulting has migrated into the adjacent Zereg Basin, where ithas uplifted low, linear ridges of folded sediment, known locally as forebergs. On the SW side ofthe massif, only the range-bounding Tsetseg fault appears active. Using OSL, we establish agesof ∼15,∼20 and∼85 kyr for alluvial deposits cut by these faults. These ages are close to thoseof alluvial markers in the separate Gobi Altai range, suggesting that periods of fan and terraceformation may correlate over wide tracts of Mongolia, presumably under the primary controlof climate. Combining our OSL ages with offsets measured with differential GPS, we calculateLate Quaternary slip rates across forebergs in the Zereg Basin and across the range-boundingZereg and Tsetseg faults. Uncertainties in fault dip (due to lack of clear fault exposures)and burial ages (due to incomplete resetting of the luminescence clock) mean that the exactslip rates are poorly constrained. Nevertheless, the vertical displacement rates we calculateacross the Zereg and Tsetseg range-front faults—0.2–0.6 and 0.1–0.4 mm yr−1, respectively—are at the lower end of long-term (∼5 Myr) estimates of 0.4–0.8 and 0.3–0.7 mm yr−1,respectively. Vertical rates of deformation may, therefore, have remained constant over the past∼5 Myr, but equally the late Quaternary rates might be lower than the geological ones. Thispossible discrepancy could be accounted for if some of the shortening has shifted away fromthe range-front faults onto other nearby structures. The forebergs in the eastern Zereg Basinare an obvious candidate, but they show at least 10 km cumulative shortening (which wouldtake a few Ma to accumulate at late Quaternary rates) and cannot simply be regarded as thelatest stage of outward mountain growth. The total Late Quaternary shortening rate across allthree areas of faulting is 0.7–2.4 mm yr−1, making up between one tenth and one third of the∼7 mm yr−1 convergence across the whole Altai range.
Key words: Geomorphology; Continental neotectonics; Fractures and faults; Kinematics ofcrustal and mantle deformation; Asia.
1 I N T RO D U C T I O N
The Altai mountains of western Mongolia form the northernmostregion of active continental shortening within the India–Eurasia col-
∗Now at: Institute of Geophysics, Tehran University, Kargar Shomali,Tehran, Iran.
lision zone, around 2500 km north of the Himalaya (inset, Fig. 1). Incontrast to the Himalaya and Tien Shan ranges to the south, whichinvolve thrust faulting perpendicular to the convergence direction,shortening across the Altai is thought to be achieved by the anti-clockwise vertical-axis rotations of N- to NW-trending right-lateralstrike-slip faults (Baljinnyamet al. 1993; Bayasgalanet al. 2005).This paper comprises an early attempt to study the evolution of
C© 2009 The Authors 259Journal compilationC© 2009 RAS
260 E. Nissen et al.
Figure 1. Earthquake (M w ≥ 5) focal mechanisms, GPS vectors and major active faults in the Altai mountains, plotted on shuttle radar topography mission(SRTM) topography, artificially shaded from the NE, in a Mercator projection. Black mechanisms represent earthquakes modelled with seismic waveforms orfirst motions (see Bayasgalanet al. 2005; Nissenet al. 2007), grey mechanisms are from the Harvard CMT catalogue (1977–2007), though for simplicity weexclude sixM w 5.0–5.2 aftershocks of the 2003 Siberian Altai sequence. All earthquakes are plotted at the latitude and longitude given in the updated versionof the Engdahlet al. (1998) catalogue. Arrows represent GPS velocities (mm yr−1) relative to stable Eurasia with 95 per cent confidence ellipses (Calaiset al.2003), whereas the curly arrow shows the location of palaeomagnetic measurements of anticlockwise rotations in the NW Altai (Thomaset al. 2002). Manyhigh massifs are located along the large strike-slip faults, which commonly show a significant reverse component. However, a number of massifs in the easternAltai have instead been uplifted by thrusting; these include Altun Huhay Uul (AH), Baatar Hyarhan (BH), Kharkhiraa (Kh) and Turgen Uul (TU).
faulting in the range and place constraints upon the rates of defor-mation. A better understanding of these kinematics may highlightprocesses common to other areas of distributed, rotating strike-slipfaults, which include California (Schermeret al. 1996) and easternIran (Walker & Jackson 2004).
The specific focus of this study is active faulting around the mar-gins of Baatar Hyarhan, a major massif in the southeastern Altai(Fig. 1). Baatar Hyarhan is not associated with any of the majorstrike-slip faults in the Altai, and its uplift is instead accommodatedby a series of thrust faults exposed along its margins and in thesurrounding basins. Several of these thrusts break the surface, pro-ducing clear scarps through Late Quaternary alluvial deposits. Thiscontrasts with many other regions of continental thrusting, whereshortening in the uppermost sedimentary layers is often taken up byfolding, making it difficult to study the underlying ‘blind’ thrustsusing surface measurements (e.g. Yieldinget al. 1981).
Our first aim is to describe the contrasting styles of shorten-ing around the margins of Baatar Hyarhan, and interpret how thisfaulting has evolved over time. In particular, we make use of 2.5 m-pixel Satellite Pour l’Observation de la Terre (SPOT 5) data, whichprovides details that are difficult to uncover with lower-resolution
images or fieldwork. A second aim is to test the applicability of op-tically stimulated luminescence (OSL) for dating alluvial depositscut by the faults. Most slip-rate studies in Mongolia have relied onin situ produced cosmogenic10Be for dating fan deposits (e.g. Ritzet al. 2006), but this method contains inherent assumptions (aboutthe inherited level of10Be, its long-term production rate and the rateof erosion), and it is useful to test independent dating methods in asimilar environment.
With OSL we calculate Late Quaternary displacement rates onthese thrust faults at Baatar Hyarhan—the first to be publishedanywhere in the Altai—allowing us to put the faults into a regionalcontext. Another advantage of Baatar Hyarhan as a study area is thatits long-term cooling history has already been determined throughapatite fission-track and (U-Th)/He thermochronology (Vassallo2006). These results, summarized in Section 3.2, provide us withconstraints on the initiation of uplift-related exhumation and permitthe comparison between Late Quaternary and geological rates ofdeformation.
As well as providing ages for fault slip rate calculations, dat-ing Late Quaternary alluvial deposits yields important informationabout past climate. In the Qilian Shan mountains of northeastern
C© 2009 The Authors,GJI, 177, 259–278Journal compilationC© 2009 RAS

Late Quaternary rates of uplift and shortening at Baatar Hyarhan 261
Tibet, major periods of strath terrace formation occurred at thetransitions from cold and dry glacial periods to warmer and wetterinterglacials (Panet al. 2003). A similar climatic control on alluvialfan aggradation has also been proposed for the Gobi–Altai range,where pulses of fan building can be correlated over areas manytens of kilometers wide (Vassalloet al. 2005; Ritzet al. 2006). OurOSL dating will allow us to observe whether periods of alluvial fanand river terrace formation in the eastern Altai range correlate withthose in neighbouring regions of central Asia.
2 T E C T O N I C S E T T I N G
The Altai range trends NW across western Mongolia and neigh-bouring parts of China, Russia and Kazakhstan and is one of themajor mountain belts within the India–Eurasia collision zone (inset,Fig. 1). The range is surrounded by flat, low-lying and apparentlyundeforming regions—the vast Kazakh Platform to the north andwest, the Junggar Basin to the south and a collection of smallerbasins known as the Depression of Great Lakes to the east. The on-set of India-related deformation in the Altai is poorly constrained;coarsening sedimentation in basins in and around the range pointsto initial range uplift some time during the Late Oligocene or earlyMiocene (Devyatkin 1974, 1981; Howardet al. 2003), whereas ap-atite fission-track modelling places it some time during the Mioceneor Pliocene (De Grave & Van den haute 2002; Yuanet al. 2006).
There is little GPS data by which to constrain the present-daydeformation of the Altai, the three arrows plotted on Fig. 1 rep-resenting the only measurements taken within the range (Calaiset al. 2003). However, the difference between velocities (relative toEurasia) at Urumqi, in the southern Junggar Basin (∼10 mm yr−1)and at Ulaangom, in the Depression of Great Lakes (∼3 mm yr−1),suggests the Altai currently accommodates∼7 mm yr−1 of NNE-directed shortening (Calaiset al. 2003). The Altai thus makes a sig-nificant contribution toward the 35–40 mm yr−1 total India–Eurasiaconvergence, also constrained by GPS (e.g. Chenet al. 2000; Wanget al. 2001; Sellaet al. 2002).
Much of the active faulting in the Altai has been mapped us-ing satellite imagery, revealing an anastomosing pattern of NNWstriking right-lateral strike-slip faults (Tapponnier & Molnar 1979;Cunningham 2005). Earthquakes during instrumental period areconsistent with this style of deformation, whereas several spectac-ular ruptures, preserved for up to many hundreds of years, attestto similar movements in the historical past (e.g. Baljinnyamet al.1993; Walkeret al. 2006). The discrepancy between earthquake slipvectors and the overall convergence direction suggests that regionalshortening is achieved by anticlockwise, vertical-axes rotations ofthe right-lateral strike-slip faults and the slivers of crust betweenthem (Baljinnyamet al. 1993; Bayasgalanet al. 2005). The lim-ited palaeomagnetic data currently available, from a single studyin the Siberian Altai (Thomaset al. 2002, Fig. 1), support thiskinematic model. This style of shortening may be governed by the∼NW-trending structural fabric of the range, which is thought tobe inherited from the Palaeozoic accretion of continental fragmentsand arc terranes (Sengor et al. 1993; Cunningham 1998).
Many of the strike-slip faults show a significant reverse compo-nent and thus contribute to long-term uplift within the range. Thisreverse component may be a direct result of the vertical-axis crustalrotations, or it may be introduced by local deviations in the geome-try of the structural fabric. In addition, many of the high mountainsat the northern and southern ends of the range relate to thrust ter-minations of the strike-slip faults (Bayasgalanet al. 1999a; Walker
et al. 2006). Peaks are characterized by flat summit plateaus, up to∼4–4.5 km in elevation. These are also observed in northern, centraland southern Mongolia (as well as neighbouring parts of Russia andChina) and are thought to be remnants of a vast erosional surface.According to apatite fission-track studies, this peneplain formedduring the Jurassic or Cretaceous period (De Grave & Van denhaute 2002; Yuanet al. 2006; Vassalloet al. 2007a) and has sinceundergone more than 100 Myr of tectonic quiescence before theonset of Late Cenozoic deformation (Jolivetet al. 2007). For ourpurposes, the peneplain surface acts as a convenient marker of thecumulative vertical deformation within the region.
Several of the highest massifs in the Altai are not situated alongstrike-slip faults; in particular, there are a number of isolated rangesin the eastern Altai that show clear thrust scarps through Quaternarydeposits along their margins (some of these are labelled in Fig. 1).Baatar Hyarhan is the southernmost of these massifs.
3 OV E RV I E W O F B A ATA R H YA R H A NA N D S U R RO U N D I N G B A S I N S
Baatar Hyarhan (also referred to as Baataryn Nuruu or BaatarKhairkhanii) trends NW–SE, is around 100 km in length and upto 20 km wide and reaches a maximum elevation of 3984 m, morethan 2 km higher than the Zereg Basin (∼1100 m) to the northeastand the Tsetseg Basin (∼1700 m) to the south (Figs 2 and 3a). Inthis section, we provide an overview of the bedrock geology, uplifthistory and geomorphology of the range.
3.1 Bedrock geology
The bedrock of Baatar Hyarhan comprises Cambrian granite inthe core of the range, surrounded by Palaeozoic volcanics, meta-morphics and sediments (Zaitsevet al. 1989). Because these rockstrend NW–SE, there is little variation in bedrock lithology alongthe length of the range. The surface geology of the surroundingdepressions primarily consists of Quaternary alluvium shed fromBaatar Hyarhan and other nearby massifs. In addition, parts ofthe Zereg Basin contain low, NW-trending ridges, known locallyas ‘forebergs’, that expose older Mesozoic and Tertiary sediments(Howardet al. 2003). Forebergs exist in a number of other placesin Mongolia, especially along the Gobi–Altai range (in the south-ern part of the country), where they were first described (Florensov& Solonenko 1963). Resulting from thrusting and folding of theEarth’s surface in areas of thick alluvial cover, they form adjacent(and parallel) to range-bounding thrust or oblique-slip faults andare thought to represent the propagation of these faults into theirforelands (e.g. Owenet al. 1997, 1999; Bayasgalanet al. 1999b).There are two sets of forebergs in our study area: one near the Bum-bat Nuruu range, on the eastern side of the Zereg Basin (Fig. 3b),and one close to Baatar Hyarhan itself, on the southern side of thedepression (Fig. 3c).
3.2 History of uplift
The cooling history of Baatar Hyarhan has been quantifiedthrough apatite fission-track (AFT) and (U-Th)/He measurementsof bedrock samples from the Boorguinn Gol valley in the centralsection of the range (Vassallo 2006, Fig. 8). AFT central ages rangefrom 154 to 192 Myr, whereas those from analysis of (U-Th)/Herange from 77 to 127 Myr. Temperature–time paths obtained by
C© 2009 The Authors,GJI, 177, 259–278Journal compilationC© 2009 RAS

262 E. Nissen et al.
Figure 2. SRTM topography and faults of the Baatar Hyarhan range and surrounding basins, displayed in the local UTM zone (46) projection (as are subsequentmaps) and artificially sun-shaded from the NE. The location of the map is shown as a black rectangle on Fig. 1. The dashed blue line shows a former course ofthe Dund Tsenher Gol river, through what is now an air gap in the northwestern part of the range.
modelling this data confirm the Late Mesozoic age of the sum-mit plateau and place the latest, Late Cenozoic stage of uplift at∼5–1 Ma.
This is somewhat younger than an estimate of the onset of LateCenozoic uplift based on sedimentological grounds (Howardet al.2003). Strata exposed in the S Zereg Basin forebergs show coars-ening grain sizes, together with a switch to a southwesterly sourceduring the Miocene (23–5 Ma). This may represent the earliestgrowth of Baatar Hyarhan, although there are uncertainties in theexact age of the material, as well as its origin (which might lie inranges other than Baatar Hyarhan, such the mountains SW of theTsetseg Basin).
3.3 Range geomorphology: lateral propagation?
The topographic characteristics of Baatar Hyarhan change notablyalong its length (Fig. 2). The SE section (east of 92◦50′E) is the mostheavily eroded part of the massif, containing sharp peaks and ridgesof up to∼3500 m elevation, separated by deep, wide valleys. In con-trast, the central section of the range (between 92◦35′E and 92◦50′E)contains a wide summit plateau at∼3600 m elevation (Fig. 3a), partof the vast Late Mesozoic peneplain surface observed throughoutwestern and central Mongolia (Jolivetet al. 2007). In the finalsection of the massif (west of 92◦35′E), the elevated topography—including remnants of the peneplain—gradually tails off towardsthe NW, dying out completely near the town of Manhan. Given thatneither lithology nor climate varies significantly along the length ofBaatar Hyarhan, the deep incision observed in the SE part of therange suggests that this area has been subjected to erosion for longerthan the central and NW sections, where the peneplain is preserved.
Near Manhan, the Dund Tsenher Gol river flows round the north-western tip of the range on its way into the Zereg Basin (Fig. 2).Around 12 km to the south, a pronounced, linear depression (or
wind-gap) indicates a probable former course of the river throughwhat is now an uplifted part of the range. There are a number ofpossible reasons for the northwestward shift in the course of theDund Tsenher Gol river over time. It might either reflect the lateralgrowth of the Baatar Hyarhan from the SE toward the NW over time(Keller et al. 1998, 1999), or a lower uplift rate at the northwesternend of the massif or alternatively some past climatic change thatreduced the river incision rate. Taken together with the lateral varia-tion in the dissection of the summit peneplain, however, we supportthe view that the range has propagated from the SE towards the NWover time.
4 A C T I V E FAU LT I N G
We now investigate variations in the style of shortening along themargins of Baatar Hyarhan, focusing on four contrasting sectionsof faulting. If the range has grown northwestwards over time (Sec-tion 3.3), then these changes help constrain how faulting in theregion evolves over time. For three out of four sections, we are alsoable to establish rates of uplift and horizontal shortening, using al-luvial fans and river terraces as markers of fault slip and OSL todate these surfaces.
In Section 4.1, we study shortening across the forebergs in theeastern Zereg Basin; these trend parallel with the highest part ofthe massif but lie about 20 km away to the NE. In Section 4.2,we focus on the forebergs in the southern Zereg Basin, which lienext to the most eroded (SE) part of Baatar Hyarhan (in this case,no dateable material is found; so, we do not provide constraints onrates of deformation). In Section 4.3, we investigate thrusting alongthe range-bounding Zereg fault, focusing on thrust scarps adjacentto the highest part of the range. Finally, we switch attention to theSW side of the range, studying the range-bounding Tsetseg fault inSection 4.4.
C© 2009 The Authors,GJI, 177, 259–278Journal compilationC© 2009 RAS

Late Quaternary rates of uplift and shortening at Baatar Hyarhan 263
Figure 3. Field photographs of Baatar Hyarhan and nearby forebergs, taken from the locations plotted on Fig. 2. (a) View S from 47◦23′45′′N 92◦49′12′′E,looking across the Zereg Basin (elevation∼1100 m) toward the central Baatar Hyarhan massif with its flat summit peneplain and small glacier (at∼3600 m).(b) View N from 46◦57′06′′N 93◦02′53′′E toward part of the E Zereg Basin forebergs, with the Bumbat Nuruu mountains behind. (c) View S from 47◦08′06′′N93◦00′42′′E toward the western part of the S Zereg Basin forebergs, with SE Baatar Hyarhan behind. Note the sharper peaks and ridges of this part of theBaatar Hyarhan massif in comparison with the central part, shown in (a).
It should be noted that in all four study areas, we primarily con-sider the reverse component of motion. There are no obvious indica-tions in the geomorphology of a right-lateral strike-slip componentto any of the main active thrusts, although given the tectonic setting,we do not rule out there being one, in particular, on the SW side ofthe range (discussed in Section 4.4).
4.1 Eastern Zereg Basin forebergs
The eastern Zereg Basin contains a series of foreberg hills in whichMesozoic and Tertiary sediments have been uplifted next to theSW margin of the Bumbat Nuruu mountains (Figs 3b and 4). Atfirst glance, these hills resemble forebergs of Bumbat Nuruu, but acloser inspection reveals a series of fault and fold scarps that all facenortheastward; furthermore, the main folds also verge towards thenortheast. This provides strong evidence that the underlying thrustsdip southwest, towards Baatar Hyarhan (e.g. Howardet al. 2003).
4.1.1 Stratigraphy
Several perennial streams sourced from Bumbat Nuruu are activelyincising into the forebergs, creating a badlands style terrain in whichthe stratigraphy of the Mesozoic and Tertiary sediments is well ex-posed (Figs 5 and 6a). This stratigraphy is described in detail by
Howardet al. (2003), although there may be considerable uncer-tainties in the precise ages of the sediments, which were estimatedusing, sometimes, sparse fossil remains. The oldest strata are LowerCretaceous and consist of fine-grained lacustrine and floodplain de-posits (divided into Yellow Sandstone and Red Bed units) sourcedboth from the NW and SE. This drainage was oriented axially tostructures observed in and around the basin today, leading Howardet al. (2003) to suggest that the same faults were active in theMesozoic, though with a normal sense of motion. For a short dis-tance (150 m) of their mapped section, the authors trace a 20◦
angular unconformity between the Lower Cretaceous Red Bed unitand overlying Oligocene sandstones, which are the oldest Tertiarysediments exposed in the area. They suggest that this may repre-sent the same erosion surface that is preserved as the flat summitplateaus of Baatar Hyarhan and other Altai massifs.
The Tertiary sediments coarsen upwards from the Oligocenesandstones into Miocene, Pliocene and Pleistocene conglomerates.Palaeocurrent data show a switch from sources to the NW andSE (axial to local faults) to a source to the NE in the Miocene.Together with the coarsening in sedimentation, this suggests thatBumbat Nuruu (lying NE of the forebergs) began uplifting at thistime. Quaternary fluvial and alluvial conglomerates were depositedunconformably over the Cretaceous and Tertiary strata and are pre-served today as abandoned river terraces and alluvial fans. Thereare three prominent levels of strath terrace in the central section of
C© 2009 The Authors,GJI, 177, 259–278Journal compilationC© 2009 RAS

264 E. Nissen et al.
Figure 4. (a) ASTER image (15 m resolution; RGB 321) of the eastern Zereg Basin forebergs. The location of the map is shown as a dashed box on Fig. 2.(b) The same view, with scarps plotted as thick solid lines (± indicates the sense of displacement) and fold axes as thin dashed lines.
the forebergs, the area which we now focus on. We call these ter-races EZ1, EZ2 and EZ3, in increasing order of age and elevation(Fig. 5b).
4.1.2 Structure
Next we describe the geological structure across this same sectionof forebergs, using data from Howardet al. (2003) supplementedby our own measurements (taken from a narrow canyon plotted onFig. 5b). The Cretaceous and Tertiary sediments are folded intoa NE-verging anticline and syncline pair (Fig. 7a). Crossing theanticline, we observe abrupt changes in the dip of these strata,starting with 0◦ in Quaternary alluvium at the SW edge of theforebergs and stepping progressively upwards to∼20◦SW (in thePleistocene–Miocene conglomerates),∼40◦SW (in the Oligocenesandstones and the Cretaceous Red Bed unit) and∼60◦–80◦SW(in the Cretaceous Yellow Sandstone unit), as we approach thecore of the fold (Fig. 6b). The NE limb of the anticline is initiallyoverturned, before strata shallow out NE-wards into the syncline.The steep-sided canyons that expose the bedrock so well in the SWpart of the geological cross-section do not extend as far NE as thesyncline; so, we extrapolate measurements taken by Howardet al.(2003)∼2 km along strike to the SE (near 47◦09′N 93◦05′E). Itis not clear whether the syncline contains abrupt changes in dip,similar to those observed in the anticline.
Three parallel, NE-facing scarps cross the Quaternary river ter-races in our study area, each delineating a sharp change in theamount of river incision (Fig. 5). We refer to these as scarps A (inthe southwest), B (in the centre) and C (in the northeast).
Scarp A is situated within a section of steep, 60◦–80◦ SW-dippingCretaceous Yellow Sandstone strata close to the core of the anticline.Although we find no direct exposures of the scarp in cross-section,the strong NE-ward fold vergence suggests that it represents the
surface expression of an active, SW-dipping thrust fault (Howardet al. 2003). We call this thrust ‘fault A’. Along-strike to the NWand SE, it becomes blind, but the tightly folded core of the anticlineremains the same Yellow Sandstone unit. We assume, following thework of Howardet al. (2003), that the thrust propagated towardsthe surface from a detachment at the base of this unit. In this model,the anticline formed as a fault-propagation fold above the tip ofthis thrust, which has since broken through to the surface (Suppe& Medwedeff 1990). We also consider the abrupt changes in thedip of sedimentary strata to reflect abrupt changes in the dip of theunderlying thrust, consistent with the fault-bend folding model ofSuppe (1983). This would suggest that the fault A soles into a flatdetachment under the Zereg Basin at depths of around 1.5–2 km(Fig. 7a).
Scarp B is situated about 1 km northeast of scarp A, probablywithin NE-dipping strata within the SW limb of the syncline. Thereis little bedrock exposure in this area, and the scarp is not describedby Howardet al. (2003). However, the same scarp can be followedon satellite imagery for a distance of∼10 km northwest of our studyarea and does not appear to outcrop within the same sedimentaryunit along its whole length. This suggests that it represents anotherSW-dipping thrust (‘fault B’)—perhaps a shallow splay off faultA—rather than localized bedding-plane slip.
Scarp C is situated a further∼2 km northeast of scarp B (inanother area of poor bedrock exposure) and can be followed overa total distance of∼15 km, finally ending in the far southeasternsection of forebergs. Although not exposed in cross-section withinour study area, Howardet al. (2003) interpret it as a SW-dippingthrust (‘fault C’), based on their observations 2 km along strike tothe NE, where it comes to the surface amongst Yellow Sandstonesdipping ∼45◦–65◦ SW. The repetition of the Yellow Sandstone ismost easily explained if fault C propogated to the surface along thebase of this unit, perhaps from the same detachment under the ZeregBasin as fault A (Fig.7a).
C© 2009 The Authors,GJI, 177, 259–278Journal compilationC© 2009 RAS

Late Quaternary rates of uplift and shortening at Baatar Hyarhan 265
Figure 5. (a) SPOT 5 image (2.5 m resolution) of the central section of forebergs in the eastern Zereg Basin. The location of the map is shown as a dashedbox on Fig. 4. (b) The same view, with Late Quaternary terrace levels and fault scarps superimposed. Cretaceous and Tertiary sediments are well exposed inthe systems of canyons that lie between the preserved terrace remnants. The geology exposed in the canyon marked with a thin blue line is projected ontotheline A–B and plotted in Fig. 7(a). The small red and blue squares are points measured in differential GPS profiles of the EZ2 and EZ3 surfaces, respectively;elevations, again projected onto A–B, are plotted in Fig. 7(b).
4.1.3 Terrace profiles
Using differential GPS we produced topographic profiles of thepreserved remnants of the EZ2 and EZ3 terraces. The position andelevation of a roving GPS receiver were measured relative to a sec-ond, stationary receiver. These relative heights are accurate to a fewcentimetres. Profile points are plotted on Fig. 5(b), and the profilesthemselves are shown in Fig. 7(b), with EZ2 data in red and EZ3in blue. The slope of the EZ2 terrace steepens from∼3.4◦ at theSW end of the profile to∼6.9◦ at the NE end. Fitting a quadraticline to data farthest from the faults (at the far SW and NE endsof the profile) provides an estimate of the original shape of thesurface before deformation. Subtracting this presumed undeformedprofile from the observed EZ2 and EZ3 surfaces gives a sense of theshape and magnitude of deformation that the terraces have under-gone since abandonment (Fig. 7c). There are changes in the slopeof both these profiles close to the places where the underlying stratasuddenly steepen (from 0◦ to 20◦ and from 20◦ to 40◦ SW), sup-porting the notion that the abrupt changes in the dip of the exposedsediments reflect changes in the dip of the underlying thrust.
In addition, the EZ2 surface shows clear vertical displacementsacross scarps A and B (Fig. 7d). The former consists of a sharp,∼20.5 m vertical offset (up to the SW). The latter consists of afurther offset of∼17.5 m, though of this only∼7.5 m is preserved
as a sharp offset at the scarp itself. The surface appears pristine; so,this difference is unlikely to reflect erosion of the scarp; instead, theremaining 10 m vertical displacement might be achieved by foldingof the hangingwall sediments.
In the highest part of the topographic profile, there appears noabrupt displacement in EZ2 across the trace of scarp C (Fig. 7c).However, close inspection of SPOT imagery (made available tous only after we visited the study area) reveals that sections ofthis scarp, including the part we profiled, have been incised bymore recent drainage systems and replaced with younger material(visible as darker areas in Fig. 5a and shaded in green in Fig. 5b).These younger deposits do not preserve the full deformation of theEZ2 surface; so, to estimate the displacement of EZ2, we insteadextrapolate slopes from a few hundred metres up- and downsectionfrom the eroded scarp. This yields a∼12.5 m vertical offset of theEZ2 surface across the fault, up to the SW (Fig. 7e).
4.1.4 Late Quaternary displacement rates
Following the procedures outlined in the Appendix (Section A1)we sampled the EZ2 terrace for OSL dating. Our sample (labelledZE) comes from a 10-cm-thick sand body exposed∼3 m belowthe surface of the terrace in the side of a gully, at 47◦08′09.7′′N93◦00′48.5′′E (Fig. 5b). This is part of a much thicker sequence of
C© 2009 The Authors,GJI, 177, 259–278Journal compilationC© 2009 RAS

266 E. Nissen et al.
Figure 6. Photographs of forebergs in the Zereg Basin. (a) View NE from 47◦08′06′′N 93◦00′42′′E (see Fig. 5b) of badlands-style terrain in the E ZeregBasin forebergs, with the Bumbat Nuruu mountains in the distance. (b) View E from 47◦08′37.1′′N 93◦02′14.7′′E (see Fig. 5b), with two people for scale.Beds exposed in the canyon walls steepen sharply from∼20◦ SW to∼40◦ SW between the right and left-hand sides of the photograph. (c) View SW from47◦09′16.1′′N 93◦02′46.4′′E (see Fig. 5b) of fault scarp A crossing the EZ2 terrace, with a person for scale. Note the relatively dense vegetation along thefoot of the scarp. (d) View NW from 46◦57′06′′N 93◦02′53′′E (see Fig. 9b) of forebergs on the southern side of the Zereg depression. The foreground is theabandoned BG4 river terrace, whereas several other levels are picked out in the evening light on the far side of the Baatar Hyarhan Gol river. The mountains inthe far distance (on the right-hand side of the photo) are the Bumbat Nuruu range.
sands and fine gravels (locally extensive over many tens of metres),buried beneath a single debris-flow deposit which forms the upper-most part of the terrace. Luminescence measurements were takenfollowing the laboratory procedures described in Section A2. Indi-vidual aliquots show a well-defined peak in their measured equiv-alent doses (Fig. A1a). However, there is some spread to the dataeither side of this peak, which could signify incomplete bleachingof the sample prior to burial. Because of this uncertainty, we usethe weighted mean equivalent dose to calculate the burial age; thisyields an age of 84.1± 1σ 9.4 kyr (Table A2).
Combining this age with the 20.5 m vertical scarp offset gives avertical displacement rate of 0.24+0.03
−0.02 mm yr−1 across fault A. Thefault dip lies between 60◦ and 80◦SW, giving a horizontal shorteningrate of 0.09+0.07
−0.05 mm yr−1 and a fault slip-rate of 0.26+0.06−0.04 mm yr−1.
The 17.5 m vertical offset across fault B yields a vertical dis-placement rate of 0.21+0.02
−0.02 mm yr−1. Using conservative boundsof 20◦–60◦SW on the fault dip, the horizontal shortening rate is0.25+0.39
−0.14 mm yr−1, and the slip rate is 0.32+0.36−0.10 mm yr−1. Finally,
a vertical scarp offset of 12.5 m and a dip of 45◦–65◦SW gives avertical displacement rate of 0.15+0.02
−0.02 mm yr−1, a horizontal short-ening rate of 0.10+0.07
−0.04 mm yr−1 and a slip rate of 0.18+0.06−0.04 mm yr−1
across fault C. These displacement rates are summarized in Table 1.In our model, faults A, B and C sole into a detachment at the base
of the Yellow Sandstone unit under the Zereg Basin. In this case, thetotal Late Quaternary rate of slip on this detachment (and thusthe total Late Quaternary shortening across the E Zereg Basin) isthe sum of the slip rates on each fault, which is 0.76+0.48
−0.17 mm yr−1.This is a minimum estimate because a proportion of the slip on thedetachment may not reach the surface on the thrusts, but could beaccommodated instead by folding of the uppermost sediments.
4.1.5 Onset of faulting
We now consider the onset of deformation in the eastern ZeregBasin, using our geological cross-section in Fig. 7(a) to estimate thecumulative shortening on the three faults and our Late Quaternaryslip rates to extrapolate back in time. Restoring the base of theCretaceous Yellow Sandstone unit (Fig. 7a), there is around∼3.5 kmshortening on fault A and∼6.5 km on fault C; these are minimumestimates, as they do not account for material removed at the surfaceby erosion. The structure of the middle part of the cross-section istoo poorly understood to constrain the total shortening on fault B.
At the calculated Late Quaternary rate of 0.76+0.48−0.17 mm yr−1, and
discounting folding, a minimum total shortening of∼10 km wouldbe achieved in 8–17 Myr. Because of uncertainties in our structuralmodel at depth, as well as the assumption that Late Quaternaryslip rates are representative over the longer-term, these should beconsidered only approximate ages. However, they do suggest thatfaulting in the eastern Zereg Basin is at least a few million years inage.
4.2 Southern Zereg Basin forebergs
There is a second line of forebergs on the southern side of theZereg Basin, adjacent to the southeastern section of Baatar Hyarhan(Figs 3c and 8). Rivers and streams incising into these hills reveal de-formed Mesozoic and Tertiary sediments, although there are fewercanyons and ravines than on the eastern side of the depression andthe bedrock exposure is limited in comparison. The stratigraphy,which is described by Howardet al. (2003), consists of Lower Cre-taceous red beds (fine-grained floodplain deposits sourced from the
C© 2009 The Authors,GJI, 177, 259–278Journal compilationC© 2009 RAS

Late Quaternary rates of uplift and shortening at Baatar Hyarhan 267
Figure 7. (a) Geological cross-section of the E Zereg Basin forebergs. Like Howardet al. (2003), we map the lower Cretaceous Red Bed unit and Oligocenesandstones together. Dip measurements are taken from a canyon (plotted as a thin blue line on Fig. 5b), except for the NE part where we extrapolate publisheddata from Howardet al. (2003), taken near 47◦09′N 93◦05′E . All data are then projected onto the line A–B (plotted on Fig. 5b). The red stars show the 3.5and 6.5 km distances required to restore the base of the Yellow Sandstone unit along faults A and C, respectively. (b) Topographic profiles of EZ2 (red) andEZ3 (blue) fan surfaces, measured with differential GPS and also projected onto the line A–B (see Fig. 5b). (c) EZ2 uplift profile, calculated by subtracting thepresumed undeformed profile from the observed heights. (d) and (e) Details of the topographic profiles across the scarps A, B and C.
SE) and Miocene, Pliocene and Pleistocene alluvial fan conglom-erates (sourced from the SW). As discussed in Section 3.2, theswitch in palaeocurrent direction and the coarsening in sedimenta-tion may reflect the initial uplift of Baatar Hyarhan, or perhaps othermountains SW of the Tsetseg Basin. Quaternary fluvial and alluvialconglomerates deposited unconformably over the Cretaceous andTertiary strata are preserved today as abandoned river terraces andalluvial fans.
The forebergs are bounded on the SW side by the Zereg fault,which in this section appears degraded and may no longer be active(Fig. 8). On the NE side of the forebergs, an abrupt change in the
amount of river incision marks the trace of an active, SW-dippingthrust, although west of the Baatar Hyarhan Gol river this faultis probably blind. Within the forebergs themselves, the Cretaceousand Tertiary sediments are folded into a large anticline; like Howardet al. (2003), we interpret this as a fault propagation fold, relatedto growth of the underlying thrust. In the central part of the fore-bergs (around the Baatar Hyarhan Gol river), dip measurementsfrom Howardet al. (2003) and our own fieldwork show that thisanticline verges northeastwards (Fig. 10a), although this sense ofasymmetry appears to be reversed along strike to the NW. Numer-ous NE- and SW-facing scarps within the forebergs (Fig. 8) may
C© 2009 The Authors,GJI, 177, 259–278Journal compilationC© 2009 RAS

268 E. Nissen et al.
Table 1. A summary of the rates of vertical and horizontal displacement and fault slip for the five thrusts studied in Section 4. Faults A,B and C are those studied in the eastern Zereg Basin (Section 4.1). ‘Offset’ is the vertical displacement of alluvial fans across the fault,and ‘age’ is the luminescence age of these surfaces (with 1σ errors). The total shortening rate across the eastern Zereg Basin forebergsis equal to the sum of the slip rates on fault A, B and C, as described in Section 4.1.4
Fault name Fault dip Offset (m) Age (kyr) Displ. rates (mm yr−1)
Vertical Horizontal Fault slip
Fault A 60◦–80◦ 20.5 84.1± 9.4 0.24+0.03−0.02 0.09+0.07
−0.05 0.26+0.06−0.04
Fault B 20◦–60◦ 17.5 84.1± 9.4 0.21+0.02−0.02 0.25+0.39
−0.14 0.32+0.36−0.10
Fault C 45◦–65◦ 12.5 84.1± 9.4 0.15+0.02−0.02 0.10+0.07
−0.04 0.18+0.06−0.04
Zereg Fault 50◦–70◦ 4.2–5.8 14.3± 5.3 0.35+0.29−0.14 0.20+0.34
−0.12 0.40+0.44−0.17
Tsetseg Fault 32◦–46◦ 2.5–3.3 20.0± 11.2 0.15+0.23−0.07 0.18+0.42
−0.10 0.23+0.48−0.12
Figure 8. (a) ASTER image (RGB 321) showing faulting along the northeastern margin of Baatar Hyarhan. The location of the map is shown as a dashed boxon Fig. 2. (b) The same view, with scarps plotted as thick solid lines (± indicates the sense of displacement) and fold axes as thin dashed lines. The easternpart of the Zereg fault, shown as a thick dashed line, looks degraded and may no longer be active.
represent bedding-plane slip and minor normal faulting associatedwith the growth of this anticline, although small thrusts and back-thrusts might also be present.
The Baatar Hyarhan Gol river, which drains much of the SE partof the range, cuts a prominent gorge through the forebergs (Figs 6dand 9). Above it, a prominent flight of abandoned river terracesare preserved (these are labelled BG1–BG8 on Fig. 9b). Usingdifferential GPS, we produced topographic profiles of the BG7 andBG4 terraces, as well as a prominent flood level preserved about ametre above the active stream bed (Fig. 10b). These three surfacesall show clear SW-facing scarps—with vertical displacements ofaround 20, 4.5 and 3.0 m, respectively—at a distance of∼3900 malong the profiles (and from the Zereg fault). This location coincideswith the boundary between the Cretaceous red beds and Mioceneconglomerates, and the scarp probably represents bedding-planeslip on this contact.
The BG4 terrace shows further evidence of folding (as wouldBG7, presumably, if it were more complete). We do not know the
gradient at which BG4 was originally deposited; it may have beensimilar to that of the current Baatar Hyarhan Gol river bed, orperhaps steeper, if headward erosion into the peneplain has pro-gressively lowered river gradients over time (Vassalloet al. 2007b).However, subtracting the slope of the current Baatar Hyarhan Golriver bed from the BG4 topographic profile provides at least anapproximate indication of the shape of deformation the terrace hasundergone since abandonment (Fig. 10c). Aside from the far SWend, where the BG4 surface is steep (and may actually be coveredby small fan deposits derived from the slopes of Baatar Hyarhan),the maximum uplift is at a distance of 1000–2000 m along the pro-file. This location is offset by 1–2 km from the mapped core of theanticline, although the geological cross-section is based on sparsebedrock exposure and so, there are significant uncertainties in itsexact shape.
We did not find any exposures where fine-grained sedimentsmight be sampled for OSL dating of the terraces. The differentialGPS profiles clearly show that folding (and, presumably, movement
C© 2009 The Authors,GJI, 177, 259–278Journal compilationC© 2009 RAS
Late Quaternary rates of uplift and shortening at Baatar Hyarhan 269
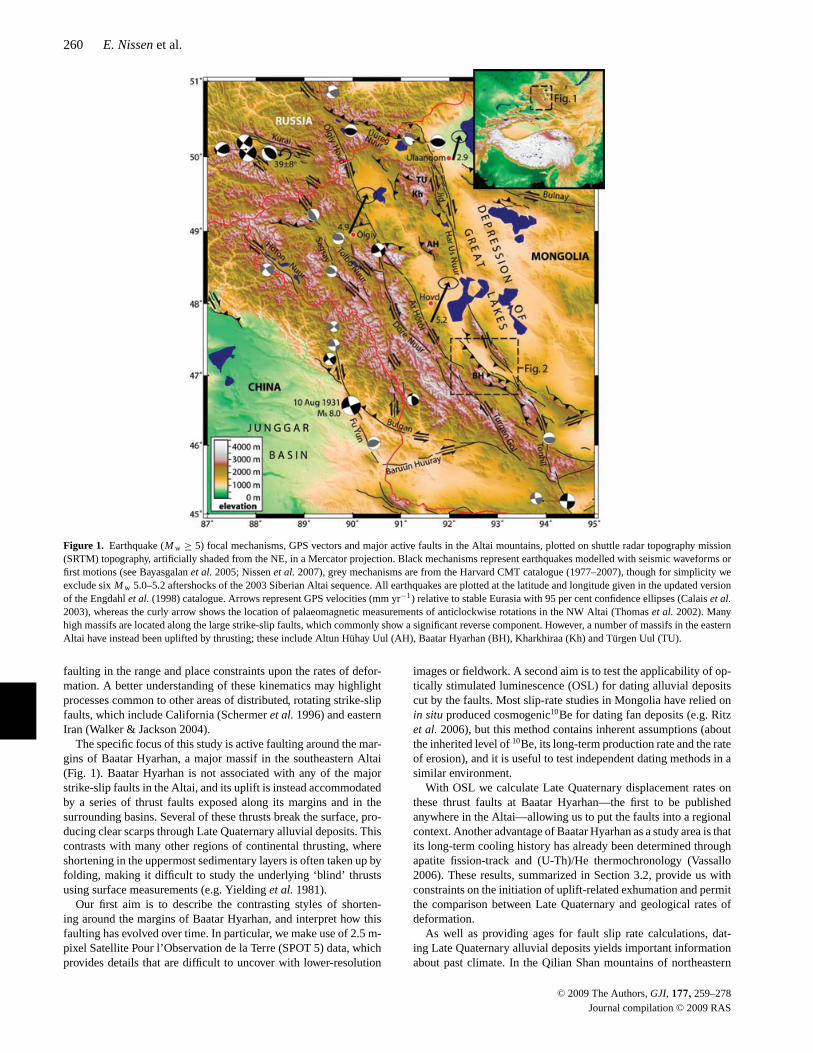
Figure 9. (a) SPOT 5 image of part of the forebergs in the southern Zereg Basin, where the Baatar Hyarhan Gol river exits the Baatar Hyarhan range. Thelocation of the map is shown as a dashed box on Fig. 8. (b) The same view, with Late Quaternary terrace levels and fault scarps superimposed. The small green,red and blue squares are points measured in differential GPS profiles of the BG7, BG4 and abandoned Baatar Hyarhan Gol river bed surfaces, respectively;elevations are projected onto the line C–D and plotted in Fig. 10b.
on the underlying thrust) occurred during the Late Quaternary, butwe are unable to quantify the rates of deformation.
4.3 Zereg fault
Our attention now shifts northwestwards along the Baatar Hyarhanrange-front to the central section of the Zereg fault, adjacent tothe highest part of the massif. Here, fresh NE-facing thrust scarpscut Quaternary alluvial fans deposited at the foot of the upliftingmountain range (Figs 8, 11 and 12). These fans are now abandoned,and streams flowing off Baatar Hyarhan actively incise into them.We found no fault exposures in river cuttings; however, because thescarps cross relatively steep fan deposits close to the range-frontand have a fairly linear trace in map view, we infer that the faultdips quite steeply, perhaps∼60◦SW.
One of the clearest sections of faulting here is at 47◦02′30′′N92◦47′30′′E (Figs 11a and 12b). At this locality, at least two levels ofabandoned terrace are observed. The youngest and best preserved(called SZ1) is shaded red in Fig. 11(b); several small streamshave incised into it, and recent debris-flows (consisting of scatteredsmall boulders and gravels) coat the terrace surface close to thesechannels. There are also three isolated patches of an older terrace(or terraces), shaded in blue in Fig. 11(b). We used differential GPSto produce six topographic profiles perpendicular to the trace of thefault—four across SZ1 and two across the older surfaces (Fig. 13).The SZ1 surface is displaced vertically by 4.2–5.8 m across the faultscarp (up to the SW). The older surfaces are not preserved NE ofthe fault trace; so, we can only estimate minimum displacements;these are at least 8.7 m for the western patch and 29.5 m for the
central one. The large difference between these values suggests thatthey are remnants of two separate surfaces.
Within this area, there are no natural cuttings into the terracedeposits in which sediment suitable for OSL dating might easily becollected. Instead, we dug a∼1 m deep pit into the SZ1 surface;its precise position (at 47◦02′27.5′′N 92◦47′35.4′′E) was chosento avoid any of the small stream channels or recent debris-flows,where there is a risk of dating material that postdates the terraceabandonment. The sediment exposed in the pit walls consists of1–5 cm, angular gravels and a few larger clasts set in a fine-grainedmatrix. These high-energy deposits (possibly debris-flows) are notideal for OSL sampling because of the reduced chance of exposureto sunlight during transport; however, with the scarps positionedso close to the range-front, lower-energy sediments may not beavailable at all. Using the second sampling method described in theAppendix (Section A1), we collected the finer matrix material froma depth of about 50 cm. This sample is labelled BH.
Luminescence measurements were taken using the laboratorymethods outlined in Section A2. The large spread in equivalent dosevalues means that it is not clear which (if any) of the aliquots were re-set before burial (Fig. A1b), and the burial age of 14.3± 1σ 5.3 kyr—again calculated using the weighted mean equivalent dose—shouldbe treated with caution (Table A2). However, the burial age is withinerror of that of a fan surface on the opposite margin of BaatarHyarhan (see Section 4.4) and is similar to exposure ages calcu-lated for a number of surfaces flanking the Gobi–Altai range insouthern Mongolia (Vassalloet al. 2005; Ritzet al. 2006). Becauseof this, and given that we might expect alluvial sedimentation in theregion to be pulsed (as it is in the Gobi–Altai), we are more confi-dent that the burial age for SZ1 is correct. Combining the age with
C© 2009 The Authors,GJI, 177, 259–278Journal compilationC© 2009 RAS

270 E. Nissen et al.
Figure 10. (a) Geological cross-section of the S Zereg Basin forebergs. Dip measurements are projected onto the line C–D (plotted on Fig. 9b). (b) Topographicprofiles of the BG7 terrace (green), the BG4 terrace (red) and a prominent flood level of the Baatar Hyarhan Gol river bed (blue), all projected onto the lineC–D (see Fig. 9b). (c) BG4 uplift profile, calculated by subtracting the presumed undeformed profile from the observed heights.
a vertical scarp offset of 5.0± 0.8 m gives a vertical displacementrate of 0.35+0.29
−0.14 mm yr−1 across the range-front fault. Using a rangeof dips from 50◦ to 70◦ SW yields a horizontal shortening rate of0.20+0.34
−0.12 mm yr−1 and a slip rate of 0.40+0.44−0.17 mm yr−1 (Table 1).
4.4 Tsetseg fault
Finally, we switch our attention to the southwestern margin of therange, where Baatar Hyarhan overthrusts the Tsetseg Basin alongthe Tsetseg fault. Here, fresh S- or SW-facing thrust scarps cutQuaternary alluvial fans, either right at the the foot of the range ora short distance (up to∼1 km) out into the depression (Fig. 14).Northwest of∼46◦52′N 92◦43′E, the active faulting passes throughhilly terrain between the Tsetseg and Manhan basins.
Perhaps the clearest scarps along the Tsetseg fault are at 46◦51′N92◦56′E (Figs 15a and 16a), where they cut abandoned and incisedalluvial fans∼500 m from the edge of the mountains. The samesurfaces are not displaced across the range-front itself, which there-fore appears to be inactive since fan abandonment. Again, there areno direct exposures of the fault in any river cuttings. However, stri-ations and a∼1-cm-thick layer of fault gouge are observed on theunderside of a granitic vein that outcrops in a series of small bedrockexposures very close to the trace of the active faulting (Fig. 16b).Striated surfaces dip 32◦–46◦ NNE, and the striations themselvesindicate a small but significant component of right-lateral shear onthe fault plane. In addition, schists, mylonites and volcanics (witha fabric dipping 40–70◦ N) exposed a few hundred metres northof the scarps are highly brecciated and foliated, indicating that theactive faulting may follow the grain of an older shear zone.
C© 2009 The Authors,GJI, 177, 259–278Journal compilationC© 2009 RAS

Late Quaternary rates of uplift and shortening at Baatar Hyarhan 271
Figure 11. (a) SPOT 5 image of thrust scarps along the Zereg fault. The location of the map is shown as a dashed box on Fig. 8. (b) The same view, withterrace levels, fault scarps, exposed bedrock and differential GPS profile points superimposed.
Focusing on an alluvial fan (called NT1) rich in granite and, thus,easily distinguished by its light colour in SPOT imagery (Fig. 15b),we produced three topographic profiles across the fault with differ-ential GPS (Fig. 17). The vertical displacement of NT1 across thescarp ranges from 2.5 to 3.3 m (up to the N). Following the proce-dures outlined in the Appendix (Section A1), we sampled the NT1fan for OSL dating. Our sample, labelled TS, was taken from a sandlens exposed in a stream cutting at 46◦50′50.9′′N 92◦45′45.5′′E,∼75 cm below the surface (Fig. 16c).
To measure the luminescence, we again employed the methodsdescribed in Section A2. Individual aliquot equivalent dose val-ues form a broad peak (Fig. A1c), although the spread to this datasuggests that bleaching was incomplete (as in Section 4.1). Us-ing the weighted mean equivalent dose we attain a burial age of20.0 ±1σ 11.2 kyr (Table A2). Combining this age with a verti-cal scarp offset of 2.9± 0.4 m gives a vertical displacement rate of0.15+0.23
−0.07 mm yr−1. Using a fault dip of 39◦ ± 7◦NNE, the horizontalshortening rate is 0.18+0.42
−0.10 mm yr−1 and the slip rate (neglecting thestrike-slip component present in the striations) is 0.23+0.48
−0.12 mm yr−1
(Table 1).
5 D I S C U S S I O N
5.1 OSL ages
One of the principle aims of this study was to investigate the applica-bility of OSL in dating alluvial sediments for slip-rate calculations.For all of our samples, the extent to which the luminescence sig-nal was reset prior to burial is unknown; because of this, we usethe weighted mean equivalent dose to calculate the OSL age, re-sulting in relatively large error bounds (particularly for the SZ1surface). This uncertainty partly reflects the difficulty of findingsuitable, fine-grained material so close to the active mountain-front.In addition, our measurements of the concentrations of radioac-tive K, U and Th within our samples—from which we estimate thedose-rate received during burial—may not be representative of thesediment as a whole. This adds a further uncertainty (one which isnot reflected within our error bounds), and our ages should there-fore be treated as preliminary only. However, OSL still providesvery useful bounds on the age of these alluvial deposits, especiallygiven the rarity of organic material for radiocarbon dating and the
C© 2009 The Authors,GJI, 177, 259–278Journal compilationC© 2009 RAS

272 E. Nissen et al.
Figure 12. Photographs of the Zereg fault, with arrows picking out the base of thrust scarps. (a) View NW along the Baatar Hyarhan range-front from47◦01′50.3′′N 92◦48′51.9′′E (see Fig. 8); NE-facing thrust scarps can be seen in the middle distance, just to the left-hand side of centre. (b) View SW fromnear the town of Zereg (see Fig. 8) of the fault scarps described in Section 4.3. (c) Close up of part of these same fault scarps, facing S from∼47◦02′30′′N92◦47′40′′E (see Fig. 11b). Two people at the top and bottom of the scarp provide scale.
Figure 13. Topographic profiles of SZ1 fan (red) and older surfaces (blue), measured with differential GPS. Profile points are plotted on Fig. 11(b).
uncertainties in erosion rates, long-term cosmogenic isotope pro-duction rates and inherited isotope concentrations that complicateexposure dating.
The OSL ages of the SZ1 and NT1 alluvial fans (14.3±1σ 5.3 kyrand 20.0±1σ 11.2 kyr, respectively) agree well with figures of 15–
20 kyr for fans in the Gobi Altai (a separate range in southernMongolia), calculated within situ-produced10Be (Vassalloet al.2005; Ritzet al. 2006). In addition, the OSL age of the EZ2 terrace(84.1 ±1σ 9.4 kyr) is close to a minimum age of 78± 11 kyrestablished for a strath terrace in the Gobi Altai, again using10Be
C© 2009 The Authors,GJI, 177, 259–278Journal compilationC© 2009 RAS

Late Quaternary rates of uplift and shortening at Baatar Hyarhan 273
Figure 14. (a) ASTER image (RGB 321) showing the Tsetseg fault along the southwestern margin of Baatar Hyarhan. The location of the map is shown as adashed box on Fig. 2. (b) The same view with active faults scarps plotted as thick solid lines; the dashed lines are older faults, probably now inactive.
Figure 15. (a) SPOT 5 image of thrust scarps along the Tsetseg fault. The location of the map is shown as a dashed box on Fig. 14. (b) The same view, withthe NT1 alluvial fan, fault scarps and differential GPS profile points superimposed.
C© 2009 The Authors,GJI, 177, 259–278Journal compilationC© 2009 RAS

274 E. Nissen et al.
Figure 16. Photographs taken along the southwestern margin of BaatarHyarhan (see Fig. 15 for locations). (a) View N from∼46◦51′00′′N92◦45′40′′E of the thrust scarp cutting the NT1 surface; three people stand-ing at the foot of scarp provide scale. (b) Striations and a 1 cm thicknessof fault gouge exposed on the underside of a NNE-dipping granite vein at46◦51′01.4′′N 92◦46′02.6′′E; the view is to the N with a pencil for scale. (c)Sampling the NT1 fan for OSL dating at 46◦50′50.9′′N 92◦45′45.5′′E; theview is to the NW.
(Vassalloet al. 2007b). Our results hint that major periods of allu-vial fan and river terrace formation in the Altai range in westernMongolia may correlate with those in the Gobi Altai, 400–500 kmto the southeast. However, the ages of many more surfaces mustbe determined if this idea is to be tested fully, especially given theuncertainties in both dating methods.
5.2 Late Quaternary versus Geological deformation rates
We now compare our Late Quaternary vertical displacement ratesacross the Zereg and Tsetseg faults with long-term rates of rangeuplift, constrained by thermochronology and sedimentology (Sec-tion 3.2).
Before making this comparison, we must first consider the possi-bility that we are neglecting other active thrusts in the range interior.The clearest candidate for such a fault is a NE-dipping thrust, justsouth of the summit plateau (plotted on Fig. 2). However SPOTimagery reveals no fresh fault scarps along this thrust, and its con-tribution to the most recent uplift is likely to be negligible (wesuspect that it results from an earlier stage of range uplift). Twomore faults—one south of the summit plateau and one in the SEpart of the range (Fig. 2)—show apparent right-lateral drainage dis-placements but are unlikely to contribute significantly to shorteningand may not be active at all. We are therefore confident that ourthe slip-rate estimates do indeed bracket the total Late Quaternaryvertical and horizontal displacement rates across the central part ofthe range.
According to the thermochronological work summarized in Sec-tion 3.2, the exhumation of bedrock exposed in Baatar Hyarhan (andpresumably the uplift of the range above the surrounding depres-sions) started between 5 and 1 Ma (Vassallo 2006). Coarse alluvialsedimentation at the foot of the range, also discussed in this section,points to an earlier initiation of uplift, some time in the Miocene(Howardet al. 2003). An age of 5 Myr minimizes the discrepancybetween these two estimates, and we use this value in our subsequentcalculations.
To determine the long-term vertical displacement rates across therange-bounding faults, we use the Late Mesozoic erosional surfaceas a marker. On Baatar Hyarhan itself, the summit peneplain isat 3600 m elevation; erosion rates are probably low (Jolivetet al.2007) and for the purposes of our calculation, can be ignored. In thecentral Zereg Basin (elevation∼1100 m), the peneplain is coveredby an estimated sediment thickness of∼1500 m (see Fig. 7a), givinga total∼4000 m vertical displacement. However, the marker maybe deeper here than at the range-front, due to crustal flexure causedby the uplift of Baatar Hyarhan and Bumbat Nuruu and subsidencecaused by the weight of Late Cenozoic sediments shed into thebasin; we therefore consider 4000 m a maximum estimate of thedisplacement across the Zereg fault itself. A minimum estimate of1900 m is calculated by subtracting the elevation of the Zereg faultscarps (1700 m) from that of the summit peneplain (3600 m). Thetotal offset across the Zereg fault is thus bracketed at 1900–4000 m.Using the same arguments (and assuming an equivalent sedimentthickness) in the Tsetseg Basin, we bracket the total offset acrossthe Tsetseg fault at 1400–3400 m.
Dividing these values by the age of 5 Myr gives long-term verti-cal displacement rates of∼0.4–0.8 and∼0.3–0.7 mm yr−1 acrossthe NE and SW margins of the range, respectively. In comparison,∼20 kyr displacement rates are 0.2–0.6 mm yr−1 across the Zeregfault and 0.1–0.4 mm yr−1 across the Tsetseg fault. Our Late Qua-ternary vertical displacement rates are therefore at the lower boundsof the geological rates.
Vertical rates of deformation may, therefore, have remained con-stant over the past∼5 Ma (at 0.4–0.6 mm yr−1 across the Zeregfault and 0.3–0.4 mm yr−1 across the Tsetseg fault), but equallythe Late Quaternary rates might be lower than the geological ones.This possible discrepancy could be explained by the migration ofsome shortening away from the range-bounding faults and onto newstructures in neighbouring low-lying areas, presumably in response
C© 2009 The Authors,GJI, 177, 259–278Journal compilationC© 2009 RAS

Late Quaternary rates of uplift and shortening at Baatar Hyarhan 275
Figure 17. Topographic profiles of NT1 fan surface, measured with differential GPS. Profile points are plotted on Fig. 15(b).
to stresses generated by the raised topography. There are numerousother∼4–4.5 km peaks across the Altai, but none that are higher;perhaps once these elevations are achieved, the migration of faultactivity away from the high areas is triggered. Certainly, there aremany examples of similar behaviour in other parts of deformingAsia (e.g. Avouacet al. 1993; Bayasgalanet al. 1999b).
Geomorphic evidence from the SE section of Baatar Hyarhansupports the idea that active faulting has shifted away from therange-front into the southern Zereg Basin forebergs. However, theapparent slowing of vertical displacement rates alongside centralBaatar Hyarhan cannot be explained by a switch in fault activity tothe eastern Zereg Basin; our structural model implies at least 10 kmoverall shortening here, which (at our estimated Late Quaternaryrates) would be achieved in 8–17 Myr. This age could be reduced(and Late Quaternary shortening rates increased) if some of theconvergence across the forebergs is accommodated by folding notaccounted for in our estimate, or if shortening was faster prior to∼85 ka (the age of the EZ2 terrace). But the onset of deformation inthe eastern Zereg Basin is still unlikely to be much younger than inthe Baatar Hyarhan range itself; indeed, from the available data, it ispossible that the eastern Zereg Basin forebergs are similar in age, or
even older, than Baatar Hyarhan. The forebergs cannot, therefore,be regarded simply as the latest phase of outward mountain growth.
There are other ways in which the possible discrepancy between∼20 kyr and∼5 Myr year rates of range uplift could be accountedfor. Feasible explanations include a shift in deformation to outsidethe area studied here or a reduction in the overall rate of shorteningacross the Altai. Another possibility is that the sediment thickness inthe Zereg Basin is lower than the figure suggested by our structuralmodel, reducing the total throw on the range-front faults and, in turn,the long-term rates of range uplift. Equally, if our preliminary OSLages are too old (due to the problem of incomplete bleaching) thenthe Late Quaternary rates should be higher. Clearly the uncertaintiesin our structural model and (in particular) our OSL ages make itdifficult to discriminate between these different interpretations.
5.3 Late Quaternary versus decadal deformation rates
The relatively sparse GPS coverage in the Altai (Fig. 1) providesno direct measurement of shortening across Baatar Hyarhan ondecadal timescales. Nevertheless, it is useful to compare our Late
C© 2009 The Authors,GJI, 177, 259–278Journal compilationC© 2009 RAS

276 E. Nissen et al.
Quaternary horizontal displacement rates with GPS estimates ofshortening across the whole Altai, to assess the contribution BaatarHyarhan makes to this total convergence.
All three areas for which we have Late Quaternary slip-rate es-timates are adjacent to, or opposite, the central and highest part ofBaatar Hyarhan. Adding up the horizontal displacement rates acrossthese areas gives a total shortening rate of 0.7–2.4 mm yr−1. Thecurrent rate of convergence across the whole Altai range, measuredwith GPS, is∼7 mm yr−1 (Calaiset al. 2003). Late Quaternaryshortening across Baatar Hyarhan and the Zereg Basin thus makesup between one tenth and one third of this total. The majority ofconvergence is likely to be accommodated by the anticlockwise ro-tation of the dextral strike-slip faults and the slivers of crust betweenthem.
6 C O N C LU S I O N S
We investigate a series of clear thrust scarps in Late Quaternaryalluvial deposits at the margins of Baatar Hyarhan, a major massifin the Mongolian Altai mountains. OSL provides useful bounds onthe age of these deposits, despite significant uncertainties in the ex-tent to which each sample was bleached prior to burial. We calculate∼20 kyr vertical displacement rates of 0.2–0.6 and 0.1–0.4 mm yr−1
across the NE and SW margins of Baatar Hyarhan, respectively. Ourresults are at the lower end of long-term (5 Myr) estimates of verti-cal displacement rates across the same margins, which are∼0.4–0.8and 0.3–0.7 mm yr−1, respectively . The possible disparity betweenLate Quaternary and geological rates could be explained if someshortening has migrated away from the range-bounding thrusts inresponse to stresses introduced by topography, although the largeuncertainties in slip rates prevent us from ruling out other possibil-ities. Today, the forebergs in the eastern Zereg Basin accommodatea large part of the shortening across the study area. However, theseare unlikely to be younger than Baatar Hyarhan itself and cannot beseen as simply the latest stage of outward mountain growth. Overall,thrust faulting around the Baatar Hyarhan massif and in the easternZereg Basin accommodates around 0.7–2.4 mm yr−1 of the overall∼7 mm yr−1 convergence across the Altai mountains.
A C K N OW L E D G M E N T S
This work was supported by NERC funding of COMET(http://comet.nerc.ac.uk) and a NERC studentship to Edwin Nis-sen, and SPOT imagery was made available through the OASISprogramme (http://medias.obs-mip.fr/oasis). Contributions in thefield from Dr Tien and Dr Zhang from the Chinese Earthquake Ad-ministration are gratefully acknowledged. We also thank our driver,Baatar, and student helpers, Baatar, Buyanaa, Deegii, Esukhei andJakii, for their hard work and good company in the field, Ganboldfor his kind hospitality in Hovd and Chimgee and Altan for theirhelp in Ulaan Baatar. Finally, the paper benefited from commentson an early draft by John Elliott and detailed reviews by Tim Byrneand Riccardo Vassallo.
R E F E R E N C E S
Aitken, M.J., 1985.Thermoluminescence Dating, Academic Press, London.Avouac, J.-P., Tapponnier, P., Bai, M., You, H. & Wang, G., 1993. Active
thrusting and folding along the northern Tien Shan and Late Cenozoicrotation of the Tarim relative to Dzungaria and Kazakhstan,J. geophys.Res., 98, 6755–6804.
Baljinnyam, I. et al., 1993. Ruptures of Major Earthquakes and ActiveDeformation in Mongolia and Its Surroundings, Memoir 181, Geol. Soc.Am., 62 pp.
Bayasgalan, A., Jackson, J., Ritz, J.-F. & Carretier, S., 1999a. Field ex-amples of strike-slip fault terminations in Mongolia and their tectonicsignificance,Tectonics, 18(3), 394–411.
Bayasgalan, A., Jackson, J., Ritz, J.-F. & Carretier, S., 1999b. ‘Forebergs’,flower structures, and the development of large intra-continental strike-slip faults: the Gurvan Bogd fault system in Mongolia,J. Struct. Geol.,21, 1285–1302.
Bayasgalan, A., Jackson, J. & McKenzie, D., 2005. Lithosphere rheologyand active tectonics in Mongolia: relations between earthquake sourceparameters, gravity and GPS measurements,Geophys. J. Int., 163, 1151–1179.
Bell, W.T., 1980. Alpha dose attenuation in quartz grains for thermolumi-nescence dating,Ancient TL, 12, 4–8.
Calais, E., Vergnolle, M., San’kov, V., Lukhnev, A., Miroshnitchenko,A., Amarjargal, S. & Deverchere, J., 2003. GPS measurements ofcrustal deformation in the Baikal–Mongolia area (1994–2002): impli-cations for current kinematics of Asia,J. geophys. Res., 108(B10), 2501,doi:10.1029/2002JB002373.
Chen, Z.et al., 2000. Global positioning system measurements from easternTibet and their implications for India/Eurasia intercontinental deforma-tion, J. geophys. Res., 105, 16 215–16 228.
Cunningham, W.D., 1998. Lithospheric controls on late Cenozoic construc-tion of the Mongolian Altai,Tectonics, 17, 891–902.
Cunningham, D., 2005. Active intracontinental transpressional mountainbuilding in the Mongolian Altai: defining a new class of orogen,Earthplanet. Sci. Lett., 240, 436–444.
De Grave, J. & Van den haute, P., 2002. Denudation and cooling of the LateTeleskoye Region in the Altai Mountains (South Siberia) as revealed byapatite fission-track thermochronology,Tectonophysics, 349, 145–159.
Devyatkin, E.V., 1974. Structures and formational complexes of the Ceno-zoic activated stage (in Russian), inTectonics of the Mongolian People’sRepublic, pp. 182–195, Nauka, Moscow.
Devyatkin, E.V., 1981.The Cenozoic of Inner Asia (in Russian), Nauka,Moscow.
Engdahl, E.R., van der Hilst, R.D. & Buland, R., 1998. Global teleseismicearthquake relocation from improved travel times and procedures fordepth determination,Bull. seism. Soc. Am., 88, 722–743.
Florensov, N.A. & Solonenko, V.P., 1963.The Gobi-Altay earthquake (inRussian), Academika Nauk USSR, Moscow (English translation, U.S.Department of Commerce, Washington, D.C., 1965).
Howard, J.P., Cunningham, W.D., Davies, S.J., Dijkstra, A.H. & Badarch, G.,2003. The stratigraphic and structural evolution of the dzereg basin, west-ern mongolia: clastic sedimentation, transpressional faulting and basindestruction in an intraplate, intracontinental setting,Basin. Res., 15(1),45–72.
Jolivet, M. et al., 2007. Mongolian summits: an uplifted, flat, old but stillpreserved erosion surface,Geology, 35(10), 871—874.
Keller, E.A., Zepeda, R.L., Rockwell, T.K., Ku, T.L. & Dinklage, W.S.,1998. Active tectonics at Wheeler Ridge, Southern San Joaquin Valley,California,Geol. Soc. Am. Bull., 110, 298–310.
Keller, E.A., Gurrola, L. & Tierney, T.E., 1999. Geomorphic criteria todetermine direction of lateral propagation of reverse faulting and folding,Geology, 27, 515–518.
Mejdahl, V., 1979. Thermoluminescence dating: beta-dose attenuation inquartz grains,Archaeometry, 21, 61–72.
Murray, A.S. & Wintle, A.G., 2000. Luminescence dating of quartz using animproved single-aliquot regenerative-dose protocol,Rad. Measure., 32,57–73.
Nissen, E., Emmerson, B., Funning, G.J., Mistrukov, A., Parsons, B.,Robinson, D.P., Rogozhin, E. & Wright, T.J., 2007. Combining InSAR andseismology to study the 2003 Siberian Altai earthquakes-dextral strike-slip and anticlockwise rotations in the northern India-Eurasia collisionzone,Geophys. J. Int., 169, 216–232.
Owen, L.A., Windley, B.F., Cunningham, W.D., Badamgarav, J. & Dorjnam-jaa, D., 1997. Quaternary alluvial fans in the Gobi of southern Mongolia:
C© 2009 The Authors,GJI, 177, 259–278Journal compilationC© 2009 RAS

Late Quaternary rates of uplift and shortening at Baatar Hyarhan 277
evidence for neotectonics and climate change,J. Quat. Sci., 12(3), 239–252.
Owen, L.A., Cunningham, D., Richards, B.W.M., Rhodes, E., Windley, B.F.,Dorjnamjaa, D. & Badamgarav, J., 1999. Timing of formation of forebergsin the northeastern Gobi Altai, Mongolia: implications for estimatingmountain uplift rates and earthquake recurrence intervals,J. geol. Soc.Lond., 156(3), 457–464.
Pan, B., Burbank, D., Wang, Y., Wu, G., Li, J. & Guan, Q., 2003. A 900 k.y.record of strath terrace formation during glacial-interglacial transitions innorthwest China,Geology, 31, 957–960.
Prescott, J.R. & Hutton, J.T., 1988. Cosmic ray and gamma ray dosimetryfor TL and ESR,Nucl. Tracks Rad. Meas., 14, 223–227.
Ritz, J.-F., Vassallo, R., Braucher, R., Brown, E.T., Carretier, S. & Bourles,D.L., 2006. Using in situ-produced10Be to quantify active tectonics inthe Gurvan Bogd mountain range (Gobi-Altay, Mongolia), inIn Situ-Produced Cosmogenic Nuclides and Quantification of Geological Pro-cesses, Special Papers No. 415, pp. 87–110, Geological Society ofAmerica.
Schermer, E.R., Luyendyk, B.P. & Cisowski, S., 1996. Late Cenozoic struc-ture and tectonics of the northern Mojave Desert,Tectonics, 15, 905–932.
Sella, G.F., Dixon, T.H. & Mao, A., 2002. REVEL: a model for Recentplate velocities from space geodesy,J. geophys. Res., 107(B4), 2081,doi:10.1029/2000JB000033.
Sengor, A.M.C., Natal’in, B.A. & Burtman, V.S., 1993. Evolution of theAltaid tectonic collage and Palaeozoic crustal growth in Eurasia,Nature,364, 299–307.
Suppe, J., 1983. Geometry and kinematics of fault-bend folding,Amer. J.Sci., 283, 684–721.
Suppe, J. & Medwedeff, D.A., 1990. Geometry and kinematics of fault-propogation folding,Eclogae Geol. Helvetiae, 83, 409–454.
Tapponnier, P. & Molnar, P., 1979. Active faulting and Cenozoic tectonicsof the Tien Shan, Mongolia, and Baykal regions,J. geophys. Res., 84,3425–3459.
Thomas, J.C., Lanza, R., Kazansky, A., Zykin, V., Semakov, N., Mitrokhin,D. & Delvaux, D., 2002. Paleomagnetic study of Cenozoic sediments fromthe Zaisan basin (SE Kazakhstan) and the Chuya depression (SiberianAltai): tectonic implications for central Asia,Tectonophysics, 351, 119–137.
Vassallo, R., 2006. Chronologie etevolution des reliefs dans la region deMongolie-Siberie: approche morphotectonique et geochronologique (inFrench),PhD thesis, Universite Montpellier 2, Montpellier.
Vassallo, R., Ritz, J.F., Braucher, R. & Carretier, S., 2005. Dating faultedalluvial fans with cosmogenic10Be in the Gurvan Bogd mountain range(Gobi-Altay, Mongolia): climatic and tectonic implications,Terra Nova,17, 278–285.
Vassallo, R., Jolivet, M., Ritz, J.-F., Braucher, R., Larroque, C., Sue, C.,Todbileg, M. & Javkhlanbold, D., 2007a. Uplift age and rates of theGurvan Bogd system (Gobi-Altay) by apatite fission track analysis,Earthplanet. Sci. Lett., 259, 333–346.
Vassallo, R.et al., 2007b. Transpressional tectonics and stream terraces ofthe Gobi-Altay, Mongolia,Tectonics, 26, C5013+.
Walker, R. & Jackson, J., 2004. Active tectonics and late Cenozoicstrain distribution in central and eastern Iran,Tectonics, 23, TC5010,doi:10.1029/2003TC001529.
Walker, R.T.et al., 2006. Geomorphology and structure of the Jid right-lateral strike-slip fault in the Mongolian Altay mountains,J. Struct. Geol.,28, 1607–1622.
Wang, Q. et al., 2001. Present-day crustal deformation in China constrainedby global positioning system measurements,Science, 294, 574–578.
Yielding, G., Jackson, J.A., King, G.C.P., Sinvhal, H., Vita-Finzi, C. &Wood, R.M., 1981. Relations between surface deformation, fault ge-ometry, seismicity, and rupture characteristics during the El Asnam(Algeria) earthquake of 10 October 1980,Earth planet. Sci. Lett., 56,287–304.
Yuan, W., Carter, A., Dong, J. & Bao, Z., 2006. Mesozoic-Tertiary ex-humation history of the Altai Mountains, northern Xinjiang, China: newconstraints from apatite fission track data,Tectonophysics, 412, 183–193.
Zaitsev, N.S., Kovalenko, V.I., Luvsandansan, B., Lutchiski, I.V. &Yarmolyuk, V.V., 1989. Geological map of the People’s Republic of Mon-golia, 1/500,000, Academy of Sciences, People’s Republic of Mongolia.
A P P E N D I X A : O P T I C A L LYS T I M U L AT E D LU M I N E S C E N C E ( O S L )DAT I N G
We use OSL dating to estimate the deposition age of the alluvialsediments used as markers of cumulative fault movement. Ionizingradiation—from the decay of238U, 232Th and40K in the surround-ing sediment and from cosmic rays—displaces lattice-bound elec-trons within quartz and feldspar grains. These electrons can becomestored in lattice defects in these minerals, although they are releasedupon exposure to light. Once the grains are buried, the trapped elec-trons can begin to accumulate, and the luminescence clock begins.Fine-grained fluvial or aeolian sediments are preferred for OSLdating, because they are likely to have undergone prolonged expo-sure to sunlight during transport, thus resetting the luminescenceclock prior to deposition. Stimulating samples of buried quartzand feldspar grains with visible light in the laboratory releases thetrapped electrons, along with photons of light (luminescence). Theage at which this sediment was last exposed to light is determined bydividing the amount of radiation required to reproduce the observedluminscence (known as the equivalent dose,De) by the dose ratereceived during burial (calculated using measurements of U, Th andK within the surrounding sediment and from estimates of cosmicradiation).
A1 Sampling
Our sampling was done at dusk, in order to reduce the risk ofaccidental exposure to full sunlight. For two of the samples (ZE andTS) we cut a fresh surface into the exposed sand layer, into which ametal tube was inserted (we used empty, steel food cans). The tubewas removed and the open end covered with duct-tape to ensureas little light as possible reached the uppermost sediment inside.We then packed the tube tightly with more duct-tape to prevent thematerial inside from shifting during transport, and wrapped the tubein several layers of opaque black plastic.
Table A1. Generalized single aliquot regeneration (SAR) sequence for OSLsamples, after Murray & Wintle (2000). We give four regeneration doses(L x , x = 1, 2, 3, 4). Sensitivity changes of the regenerated OSL data arecorrected by dividingL x by the subsequent OSL test dose response (T x ,T = 1, 2, 3, 4). We plot the corrected OSL (L x/T x ) against the regenerativedose and apply a linear fit to the data points. The equivalent dose (De)corresponding to the natural OSL response (L N /T N ) is then read from theregenerative dose axis.
Step Treatment Observed
1 Give dose –2 Preheat (260◦C for 10 s) –3 Stimulation (for 100 s at 125◦C) L x
4 Give test dose –5 Preheat (220◦C for 10 s) –6 Stimulation (for 100 s at 125◦C) T x
7 Return to Step 1 –
C© 2009 The Authors,GJI, 177, 259–278Journal compilationC© 2009 RAS

278 E. Nissen et al.
Figure A1. Equivalent dose distribution plots for OSL samples. Thex-axis represents the number of seconds of exposure to a known beta source(delivering∼5 Gyr min−1) required to reproduce the natural luminescencesignal. There are N aliquots in each sample, and Mean is the weightedmeanDe for all these aliquots. Individual aliquotDe values are displayedin rank order, with probability density functions superimposed. For (a) ZEand (c) TS,De values form a well-defined peak; however, there is still asignificant spread to the data, suggesting that bleaching of these samples wasincomplete. For (b) BH, there is no clear peak to the dose distribution plot;so, we cannot be certain that any of the aliquots were reset during transportprior to burial.
Table A2. Values used to calculate luminescence ages for the three fan surfaces. The errors are all 1σ . Sample ZE is taken from the eastern Zereg Basinforebergs (EZ2 surface), BH from the NE Baatar Hyarhan range-front (SZ1 surface) and TS from the SW Baatar Hyarhan range-front (NT1 surface).
Sample Equivalent dose K (per cent) U (ppm) Th (ppm) Cosmic dose rate Total dose rate Age (ktr)(Gyr) (Gyr kyr−1) (Gyr kyr−1)
ZE 188.29± 15.89 1.519± 0.028 1.4± 0.052 3.6± 0.168 0.181± 0.135 2.24± 0.15 84.1± 9.4BH 22.93± 8.27 1.046± 0.028 0.7± 0.052 2.0± 0.168 0.284± 0.135 1.60± 0.14 14.3± 5.3TS 64.46± 35.87 1.909± 0.028 2.1± 0.052 8.4± 0.168 0.288± 0.135 3.23± 0.16 20.0± 11.2
For the final sample (BH), the sediment exposed in the pit wallswas too coarse to insert a tube and not cohesive enough to extracta large block. Instead, the pit was covered with canvas and plasticto ensure that sampling was done in darkness. Inside the pit, wewidened one of the pit walls to remove any sediment that might havebeen exposed during digging. Using a sieve to remove larger clasts,we scraped loose, fine-grained matrix material from the widenedpit wall into light-protected bags.
A2 Laboratory work
In the laboratory, under subdued red light, we removed sedimentfrom the top and bottom of each tube (this may have undergonesome exposure to light during sampling). Later on, we used thistop and bottom material to estimate the dose rates received duringburial. We are confident that no light entered the central part of thetube, and it is only this material that we used to determineDe. Thesamples were wet-sieved, and the 90–250μm fraction immersedfor 2 d in 1 N HCl and 2 d in H2O2 to eliminate carbonates andorganics, respectively. Heavy minerals (>2.72 g cm−3) were thenremoved in a heavy liquid separation. The remaining quartz grainswere etched in 48 per cent HF for 6 min, rinsed in distilled waterand dry-sieved. The 90–250μm fraction was mounted as a mono-layer on 10 mm diameter aluminium discs, using a silicon sprayas an adhesive. Between 10 and 16 such discs are prepared fromeach sample. These were stimulated using a Risø (Model TL/OSL-DA-15) automated TL/OSL system with a90Sr/90 Y beta sourcedelivering∼5 Gyr min−1. An IR laser diode (λ = 830 nm) and bluediode array (λ = 470 nm,p = 24 mW cm−2) provided the sampleswith laser light of∼400 mW cm−2 intensity. OSL was detected withan Electron Tubes bialkaline PMT and the luminescence measuredthrough 7 mm Hoya U-340 filters. To determineDe, we followedthe single aliquot regeneration (SAR) protocol of Murray & Wintle(2000) and the steps detailed in Table A1.
Individual aliquotDe values are plotted with a probability densityfunction in Fig. A1. For all three samples, there is a significant spreadto this data; so, we cannot be certain that they were completelybleached prior to burial. We therefore use the weighted meanDe
(given in Table A2) to determine the burial age.Dose-rates received by each sample during burial were calculated
using radioisotope concentrations, present-day moisture content andburial depths. Concentrations of U, Th and K were measured inthe laboratory with ICP mass spectroscopy, and moisture contentsdetermined by drying at 40◦C. We use the conversion factors ofAitken (1985), Bell (1980) and Mejdahl (1979) to calculate theresulting alpha, beta and gamma dose rates. Dose rates receivedfrom cosmic rays are determined using the formula of Prescott &Hutton (1988).
C© 2009 The Authors,GJI, 177, 259–278Journal compilationC© 2009 RAS