![The chronostratigraphy of Late Pleistocene glacial and ...eprints.whiterose.ac.uk/2258/1/Bateman_and_murton_author_version[1].pdf · Bateman M.D. and Murton J.B (2006) as published](https://static.fdocuments.us/doc/165x107/5e1e33d7bd56cc007e713db3/the-chronostratigraphy-of-late-pleistocene-glacial-and-1pdf-bateman-md.jpg)
Late Pleistocene glacial history of Jameson Land, central ...
17
Late Pleistocene glacial history of Jameson Land, central East Greenland, derived from cosmogenic 10 Be and 26 Al exposure dating LENA HA ˚ KANSSON, HELENA ALEXANDERSON, CHRISTIAN HJORT, PER MO ¨ LLER, JASON P. BRINER, ALA ALDAHAN AND GO ¨ RAN POSSNERT BOREAS H ˚akansson, L., Alexanderson, H., Hjort, C., M ¨oller, P., Briner, J. P., Aldahan, A. & Possnert, G.: Late Pleistocene glacial history of Jameson Land, central East Greenland, derived from cosmogenic 10 Be and 26 Al exposure dating. Boreas, Vol. 38, pp. 244–260. 10.1111/j.1502-3885.2008.00064.x. ISSN 0300–9483. Previous work has presented contrasting views of the last glaciation on Jameson Land, central East Greenland, and still there is debate about whether the area was: (i) ice-free, (ii) covered with a local non-erosive ice cap(s), or (iii) overridden by the Greenland Ice Sheet during the Last Glacial Maximum (LGM). Here, we use cosmogenic exposure ages from erratics to reconcile these contrasting views. A total of 43 erratics resting on weathered sand- stone and on sediment-covered surfaces were sampled from four areas on interior Jameson Land; they give 10 Be ages between 10.9 and 269.1 kyr. Eight erratics on weathered sandstone and till-covered surfaces cluster around 70 kyr, whereas 10 Be ages from erratics on glaciofluvial landforms are substantially younger and range between 10.9 and 47.2 kyr. Deflation is thought to be an important process on the sediment-covered surfaces and the youngest exposure ages are suggested to result from exhumation. The older (470 kyr) samples have discordant 26 Al and 10 Be data and are interpreted to have been deposited by the Greenland Ice Sheet several glacial cycles ago. The younger exposure ages ( 70 kyr) are interpreted to represent deposition by the ice sheet during the Late Saalian and by an advance from the local Liverpool Land ice cap in the Early Weichselian. The exposure ages younger than Saalian are explained by periods of shielding by non-erosive ice during the Weichselian glaciation. Our work supports previous studies in that the Saalian Ice Sheet advance was the last to deposit thick sediment sequences and western erratics on interior Jameson Land. However, instead of Jameson Land being ice-free throughout the Weichselian, we document that local ice with limited erosion potential covered and shielded large areas for substantial periods of the last glacial cycle. Lena H ˚ akansson (e-mail: [email protected]), Christian Hjort (e-mail: [email protected]) and Per M¨ oller (e-mail: [email protected]), Department of Geology, Quaternary Sciences, GeoBiosphere Science Centre, S¨ olvegatan 12, SE-223 62 Lund, Sweden; Helena Alexanderson (e-mail: [email protected]), Norwegian University of Life Sciences, Department of Plant and Environmental Sciences, P.O. Box 5003, NO-1432 A ˚ s, Norway; Jason Briner (e-mail: [email protected]), Department of Geology, University at Buffalo, Buffalo, NY 14260, USA; Ala Aldahan (e-mail: [email protected]), Department of Earth Sciences, Villav ¨ agen 16, SE-752 36 Uppsala, Sweden; G ¨ oran Possnert (e-mail: [email protected]), Tandem Laboratory, Uppsala University, SE-751 21 Uppsala, Sweden; received 14th March 2008, accepted 28th July 2008. The Late Pleistocene glacial history of the Northeast Greenland continental margin has been reconstructed from decades of research (e.g. Washburn 1965; Lasca 1969; Funder 1972, 2004; Funder & Hjort 1973; Hjort 1979, 1981; Bj¨orck & Hjort 1984; Nam et al. 1995; Funder & Hansen 1996; Stein et al. 1996; Funder et al. 1998; Hansen et al. 1999). Much of the focus has been on the fjord area of Scoresby Sund and the Jameson Land Peninsula (Fig. 1), an area with an extensive Quaternary sediment record in a presently ice-free part of central East Greenland. Sugden (1974) described Ja- meson Land as an area with little or no sign of glacial erosion, mainly based on the highly weathered land- scapes in the interior of the peninsula, and he proposed that the area had been covered by non-erosive ice dur- ing the Last Glacial Maximum (LGM). Funder (1989) suggested that lack of evidence of glacial erosion might rather be a result of long periods with ice-free condi- tions. The view of a restricted Greenland Ice Sheet ad- vance during the LGM was supported by results of the Polar North Atlantic Margins (PONAM) project in the early 1990s. Then stratigraphic evidence was presented for deposition by the Greenland Ice Sheet on interior Jameson Land during the Late Saalian in marine iso- tope stage (MIS) 6 (Funder et al.1994, 1998; M ¨oller et al. 1994). There is still debate, however, about whether the Greenland Ice Sheet only reached the inner con- tinental shelf, leaving extensive coastal land areas free of ice (e.g. Funder 2004; Wilken & Mienert 2006), or whether it reached all the way onto the outer shelf or even to the shelf-break during the LGM (Evans et al. 2002; O ´ Cofaigh et al. 2004). In recent years, cosmogenic exposure dating methods have provided new techniques by which to interpret weathered landscapes differentially, and this has led to a new understanding of Pleistocene ice sheets elsewhere in the Arctic (Fabel et al. 2002; Stroeven et al. 2002; Briner et al. 2003, 2005, 2006; Landvik et al. 2003; Marquette et al. 2004; Davis et al. 2006; Harbour et al. 2006). In the present study, we use cosmogenic exposure dating from 43 erratics (43 10 Be ages and 5 26 Al ages) to test whether the interior of Jameson Land was: (i) ice- free, (ii) covered with a local non-erosive ice cap(s), or (iii) overridden by the Greenland Ice Sheet during the LGM. DOI 10.1111/j.1502-3885.2008.00064.x r 2008 The Authors, Journal compilation r 2008 The Boreas Collegium
Transcript of Late Pleistocene glacial history of Jameson Land, central ...

Late Pleistocene glacial history of Jameson Land, central East Greenland,derived from cosmogenic 10Be and 26Al exposure dating
LENA HAKANSSON, HELENA ALEXANDERSON, CHRISTIAN HJORT, PER MOLLER, JASON P. BRINER, ALA ALDAHANAND GORAN POSSNERT
BOREAS Hakansson, L., Alexanderson, H., Hjort, C., Moller, P., Briner, J. P., Aldahan, A. & Possnert, G.: Late Pleistoceneglacial history of Jameson Land, central East Greenland, derived from cosmogenic 10Be and 26Al exposure dating.Boreas, Vol. 38, pp. 244–260. 10.1111/j.1502-3885.2008.00064.x. ISSN 0300–9483.
Previous work has presented contrasting views of the last glaciation on Jameson Land, central East Greenland,and still there is debate about whether the area was: (i) ice-free, (ii) covered with a local non-erosive ice cap(s), or(iii) overridden by the Greenland Ice Sheet during the Last Glacial Maximum (LGM). Here, we use cosmogenicexposure ages from erratics to reconcile these contrasting views. A total of 43 erratics resting on weathered sand-stone and on sediment-covered surfaces were sampled from four areas on interior Jameson Land; they give 10Beages between 10.9 and 269.1 kyr. Eight erratics on weathered sandstone and till-covered surfaces cluster around�70 kyr, whereas 10Be ages from erratics on glaciofluvial landforms are substantially younger and range between10.9 and 47.2 kyr. Deflation is thought to be an important process on the sediment-covered surfaces and theyoungest exposure ages are suggested to result from exhumation. The older (470 kyr) samples have discordant26Al and 10Be data and are interpreted to have been deposited by the Greenland Ice Sheet several glacial cycles ago.The younger exposure ages (� 70 kyr) are interpreted to represent deposition by the ice sheet during the LateSaalian and by an advance from the local Liverpool Land ice cap in the Early Weichselian. The exposure agesyounger than Saalian are explained by periods of shielding by non-erosive ice during the Weichselian glaciation.Our work supports previous studies in that the Saalian Ice Sheet advance was the last to deposit thick sedimentsequences and western erratics on interior Jameson Land. However, instead of Jameson Land being ice-freethroughout the Weichselian, we document that local ice with limited erosion potential covered and shielded largeareas for substantial periods of the last glacial cycle.
Lena Hakansson (e-mail: [email protected]), Christian Hjort (e-mail: [email protected]) and PerMoller (e-mail: [email protected]), Department of Geology, Quaternary Sciences, GeoBiosphere Science Centre,Solvegatan 12, SE-223 62 Lund, Sweden; Helena Alexanderson (e-mail: [email protected]), NorwegianUniversity of Life Sciences, Department of Plant and Environmental Sciences, P.O. Box 5003, NO-1432 As, Norway;Jason Briner (e-mail: [email protected]), Department of Geology, University at Buffalo, Buffalo, NY 14260,USA; Ala Aldahan (e-mail: [email protected]), Department of Earth Sciences, Villavagen 16, SE-75236 Uppsala, Sweden; Goran Possnert (e-mail: [email protected]), Tandem Laboratory, UppsalaUniversity, SE-751 21 Uppsala, Sweden; received 14th March 2008, accepted 28th July 2008.
The Late Pleistocene glacial history of the NortheastGreenland continental margin has been reconstructedfrom decades of research (e.g. Washburn 1965; Lasca1969; Funder 1972, 2004; Funder & Hjort 1973; Hjort1979, 1981; Bjorck & Hjort 1984; Nam et al. 1995;Funder & Hansen 1996; Stein et al. 1996; Funder et al.1998; Hansen et al. 1999). Much of the focus has beenon the fjord area of Scoresby Sund and the JamesonLand Peninsula (Fig. 1), an area with an extensiveQuaternary sediment record in a presently ice-free partof central East Greenland. Sugden (1974) described Ja-meson Land as an area with little or no sign of glacialerosion, mainly based on the highly weathered land-scapes in the interior of the peninsula, and he proposedthat the area had been covered by non-erosive ice dur-ing the Last Glacial Maximum (LGM). Funder (1989)suggested that lack of evidence of glacial erosion mightrather be a result of long periods with ice-free condi-tions. The view of a restricted Greenland Ice Sheet ad-vance during the LGM was supported by results of thePolar North Atlantic Margins (PONAM) project in theearly 1990s. Then stratigraphic evidence was presentedfor deposition by the Greenland Ice Sheet on interior
Jameson Land during the Late Saalian in marine iso-tope stage (MIS) 6 (Funder et al. 1994, 1998; Moller etal. 1994). There is still debate, however, about whetherthe Greenland Ice Sheet only reached the inner con-tinental shelf, leaving extensive coastal land areas freeof ice (e.g. Funder 2004; Wilken & Mienert 2006), orwhether it reached all the way onto the outer shelf oreven to the shelf-break during the LGM (Evans et al.2002; O Cofaigh et al. 2004).
In recent years, cosmogenic exposure dating methodshave provided new techniques by which to interpretweathered landscapes differentially, and this has led toa new understanding of Pleistocene ice sheets elsewherein the Arctic (Fabel et al. 2002; Stroeven et al. 2002;Briner et al. 2003, 2005, 2006; Landvik et al. 2003;Marquette et al. 2004; Davis et al. 2006; Harbour et al.2006).
In the present study, we use cosmogenic exposuredating from 43 erratics (43 10Be ages and 5 26Al ages) totest whether the interior of Jameson Land was: (i) ice-free, (ii) covered with a local non-erosive ice cap(s), or(iii) overridden by the Greenland Ice Sheet during theLGM.
DOI 10.1111/j.1502-3885.2008.00064.x r 2008 The Authors, Journal compilation r 2008 The Boreas Collegium
Geological setting
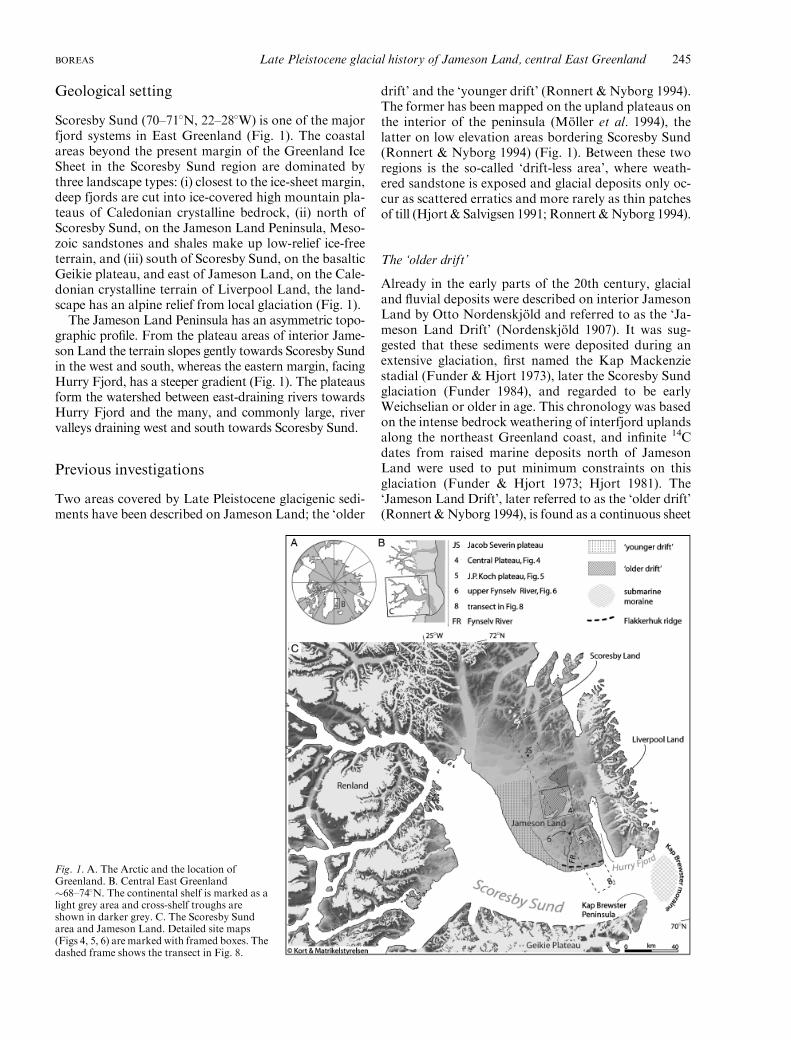
Scoresby Sund (70–711N, 22–281W) is one of the majorfjord systems in East Greenland (Fig. 1). The coastalareas beyond the present margin of the Greenland IceSheet in the Scoresby Sund region are dominated bythree landscape types: (i) closest to the ice-sheet margin,deep fjords are cut into ice-covered high mountain pla-teaus of Caledonian crystalline bedrock, (ii) north ofScoresby Sund, on the Jameson Land Peninsula, Meso-zoic sandstones and shales make up low-relief ice-freeterrain, and (iii) south of Scoresby Sund, on the basalticGeikie plateau, and east of Jameson Land, on the Cale-donian crystalline terrain of Liverpool Land, the land-scape has an alpine relief from local glaciation (Fig. 1).
The Jameson Land Peninsula has an asymmetric topo-graphic profile. From the plateau areas of interior Jame-son Land the terrain slopes gently towards Scoresby Sundin the west and south, whereas the eastern margin, facingHurry Fjord, has a steeper gradient (Fig. 1). The plateausform the watershed between east-draining rivers towardsHurry Fjord and the many, and commonly large, rivervalleys draining west and south towards Scoresby Sund.
Previous investigations
Two areas covered by Late Pleistocene glacigenic sedi-ments have been described on Jameson Land; the ‘older
drift’ and the ‘younger drift’ (Ronnert & Nyborg 1994).The former has been mapped on the upland plateaus onthe interior of the peninsula (Moller et al. 1994), thelatter on low elevation areas bordering Scoresby Sund(Ronnert & Nyborg 1994) (Fig. 1). Between these tworegions is the so-called ‘drift-less area’, where weath-ered sandstone is exposed and glacial deposits only oc-cur as scattered erratics and more rarely as thin patchesof till (Hjort & Salvigsen 1991; Ronnert &Nyborg 1994).
The ‘older drift’
Already in the early parts of the 20th century, glacialand fluvial deposits were described on interior JamesonLand by Otto Nordenskjold and referred to as the ‘Ja-meson Land Drift’ (Nordenskjold 1907). It was sug-gested that these sediments were deposited during anextensive glaciation, first named the Kap Mackenziestadial (Funder & Hjort 1973), later the Scoresby Sundglaciation (Funder 1984), and regarded to be earlyWeichselian or older in age. This chronology was basedon the intense bedrock weathering of interfjord uplandsalong the northeast Greenland coast, and infinite 14Cdates from raised marine deposits north of JamesonLand were used to put minimum constraints on thisglaciation (Funder & Hjort 1973; Hjort 1981). The‘Jameson Land Drift’, later referred to as the ‘older drift’(Ronnert & Nyborg 1994), is found as a continuous sheet
Fig. 1. A. The Arctic and the location ofGreenland. B. Central East Greenland�68–741N. The continental shelf is marked as alight grey area and cross-shelf troughs areshown in darker grey. C. The Scoresby Sundarea and Jameson Land. Detailed site maps(Figs 4, 5, 6) are marked with framed boxes. Thedashed frame shows the transect in Fig. 8.
BOREAS Late Pleistocene glacial history of Jameson Land, central East Greenland 245
on the Central Plateau at 450–500ma.s.l. and on the J. P.Koch plateau at altitudes4750ma.s.l. (Fig. 1). Erraticson weathered mountain plateaus on northern JamesonLand (e.g. Jacob Severin Bjerg) (Fig. 1) and dis-continuous patches of till in the ‘drift-less’ area (e.g. theFynselv area) have also been correlated with the ‘olderdrift’ (Moller et al. 1994).
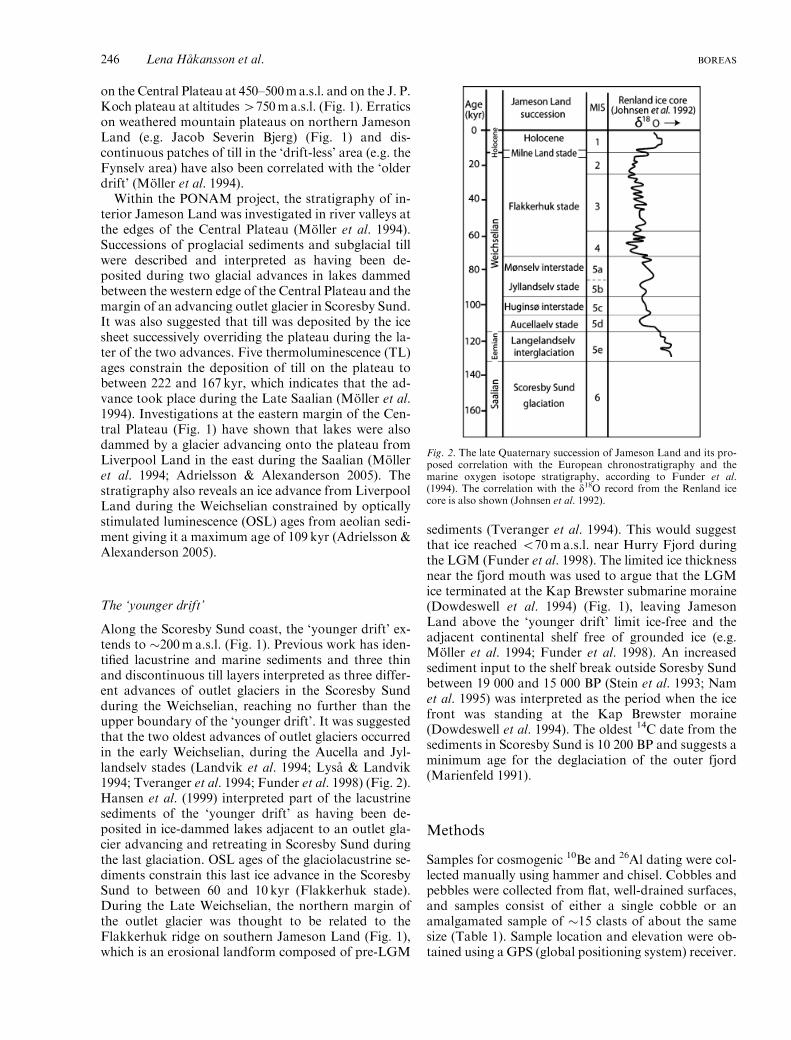
Within the PONAM project, the stratigraphy of in-terior Jameson Land was investigated in river valleys atthe edges of the Central Plateau (Moller et al. 1994).Successions of proglacial sediments and subglacial tillwere described and interpreted as having been de-posited during two glacial advances in lakes dammedbetween the western edge of the Central Plateau and themargin of an advancing outlet glacier in Scoresby Sund.It was also suggested that till was deposited by the icesheet successively overriding the plateau during the la-ter of the two advances. Five thermoluminescence (TL)ages constrain the deposition of till on the plateau tobetween 222 and 167 kyr, which indicates that the ad-vance took place during the Late Saalian (Moller et al.1994). Investigations at the eastern margin of the Cen-tral Plateau (Fig. 1) have shown that lakes were alsodammed by a glacier advancing onto the plateau fromLiverpool Land in the east during the Saalian (Molleret al. 1994; Adrielsson & Alexanderson 2005). Thestratigraphy also reveals an ice advance from LiverpoolLand during the Weichselian constrained by opticallystimulated luminescence (OSL) ages from aeolian sedi-ment giving it a maximum age of 109 kyr (Adrielsson &Alexanderson 2005).
The ‘younger drift’
Along the Scoresby Sund coast, the ‘younger drift’ ex-tends to �200ma.s.l. (Fig. 1). Previous work has iden-tified lacustrine and marine sediments and three thinand discontinuous till layers interpreted as three differ-ent advances of outlet glaciers in the Scoresby Sundduring the Weichselian, reaching no further than theupper boundary of the ‘younger drift’. It was suggestedthat the two oldest advances of outlet glaciers occurredin the early Weichselian, during the Aucella and Jyl-landselv stades (Landvik et al. 1994; Lysa & Landvik1994; Tveranger et al. 1994; Funder et al. 1998) (Fig. 2).Hansen et al. (1999) interpreted part of the lacustrinesediments of the ‘younger drift’ as having been de-posited in ice-dammed lakes adjacent to an outlet gla-cier advancing and retreating in Scoresby Sund duringthe last glaciation. OSL ages of the glaciolacustrine se-diments constrain this last ice advance in the ScoresbySund to between 60 and 10 kyr (Flakkerhuk stade).During the Late Weichselian, the northern margin ofthe outlet glacier was thought to be related to theFlakkerhuk ridge on southern Jameson Land (Fig. 1),which is an erosional landform composed of pre-LGM
sediments (Tveranger et al. 1994). This would suggestthat ice reached o70ma.s.l. near Hurry Fjord duringthe LGM (Funder et al. 1998). The limited ice thicknessnear the fjord mouth was used to argue that the LGMice terminated at the Kap Brewster submarine moraine(Dowdeswell et al. 1994) (Fig. 1), leaving JamesonLand above the ‘younger drift’ limit ice-free and theadjacent continental shelf free of grounded ice (e.g.Moller et al. 1994; Funder et al. 1998). An increasedsediment input to the shelf break outside Soresby Sundbetween 19 000 and 15 000 BP (Stein et al. 1993; Namet al. 1995) was interpreted as the period when the icefront was standing at the Kap Brewster moraine(Dowdeswell et al. 1994). The oldest 14C date from thesediments in Scoresby Sund is 10 200 BP and suggests aminimum age for the deglaciation of the outer fjord(Marienfeld 1991).
Methods
Samples for cosmogenic 10Be and 26Al dating were col-lected manually using hammer and chisel. Cobbles andpebbles were collected from flat, well-drained surfaces,and samples consist of either a single cobble or anamalgamated sample of �15 clasts of about the samesize (Table 1). Sample location and elevation were ob-tained using a GPS (global positioning system) receiver.
Fig. 2. The late Quaternary succession of Jameson Land and its pro-posed correlation with the European chronostratigraphy and themarine oxygen isotope stratigraphy, according to Funder et al.(1994). The correlation with the d18O record from the Renland icecore is also shown (Johnsen et al. 1992).
246 Lena Hakansson et al. BOREAS
Table
1.Detailsof10Beand
26Alanalyses.
Sample
Surface
typea
Sample
height
Lat.
Long.
Elevation
Thickness
correctionb
Becarrier
mass
Sample
mass
Al
10Be/
9Be
26Al/27Al
10Beage
26Alage
26Al/10Beratio
(m)
(N)
(W)
(ma.s.l.)
(mg)
(g)
(ppm)
(�1012)c
(�1012)d
(kyr)
(kyr)
JacobSeverin
Bjerg
Quartzite
boulders
CF-17
1a
0.4
71.123
23.290
444
0.983
0.359
40.051
126.7
0.945�0.049
1.183�0.078
70.2�9.2
67.2�9.7
6.4�0.9
CF-23
1a
0.6
71.123
23.285
445
0.983
0.359
40.161
113.6
0.894�0.055
1.178�0.085
66.0�9.0
59.7�8.8
6.1�0.9
CF-14
1a
0.4
71.123
23.285
446
0.983
0.356
24.967
n/a
0.59�0.032
n/a
69.5�9.2
n/a
n/a
Cobbles(quartzite)
CF-19
1b
n/a
71.123
23.285
445
0.944
0.321
40.273
n/a
1.057�0.065
n/a
72.7�7.6
n/a
n/a
CF-20
1b
n/a
71.122
23.285
445
0.921
0.359
40.302
n/a
0.726�0.093
n/a
54.5�9.7
n/a
n/a
TheCentralPlateau
Quartzite
boulders
UE-2
2a
0.3
70.542
23.154
446
0.983
0.349
39.846
n/a
2.465�0.088
n/a
183.8�23.8
n/a
n/a
UE-4
2a
0.5
70.544
23.215
410
0.983
0.347
40.298
n/a
1.791�0.055
n/a
134.3�17.0
n/a
n/a
Crystallineboulders
UE-19
2a
0.6
70.545
23.065
496
0.983
0.343
40.693
n/a
0.547�0.035
n/a
36.1�3.8
n/a
n/a
Amalgamatedclastsamples(crystalline)
06-U
E-3
2b
n/a
70.538
23.044
507
0.959
0.358
38.488
n/a
0.404�0.016
n/a
30.0�2.9
n/a
n/a
UE-6
2b
n/a
70.552
23.092
513
0.959
0.358
40.871
n/a
0.536�0.017
n/a
37.1�3.5
n/a
n/a
UE-7
2b
n/a
70.552
23.092
513
0.967
0.356
40.190
n/a
0.574�0.026
n/a
39.6�4.0
n/a
n/a
UE-10
2b
n/a
70.543
23.063
533
0.967
0.358
31.991
n/a
0.477�0.014
n/a
41.1�3.8
n/a
n/a
Cobbles(crystalline)
UE-9
2b
n/a
70.543
23.063
533
0.944
0.353
40.821
n/a
0.203�0.013
n/a
13.7�1.5
n/a
n/a
J.P.Koch
Fjeld
Quartzite
boulders
001
2a
0.4
70.39
22.46
782
0.983
0.348
40.048
n/a
0.633�0.054
n/a
33.2�4.9
n/a
n/a
004
2b
0.2
70.39
22.46
792
0.983
0.356
40.475
n/a
0.892�0.087
n/a
47.2�7.3
n/a
n/a
006
2b
0.3
70.39
22.46
782
0.983
0.357
40.037
n/a
0.3�0.05
n/a
16.1�3.3
n/a
n/a
008
2b
0.6
70.39
22.46
769
0.983
0.356
40.254
n/a
0.548�0.117
n/a
29.4�7.3
n/a
n/a
009
2b
0.4
70.39
22.46
770
0.983
0.357
46.613
n/a
0.235�0.08
n/a
10.9�3.9
n/a
n/a
Crystallineboulders
002
2a
0.1–0.3
70.39
22.46
775
0.983
0.356
27.344
n/a
0.583�0.059
n/a
46.3�7.3
n/a
n/a
011
2b
0.1–0.5
70.39
22.46
768
0.983
0.354
33.300
n/a
0.559�0.091
n/a
36.3�7.4
n/a
n/a
Fynselv
Quartzite
boulders
FE-12
1a
0.3
70.363
23.151
338
0.983
0.354
39.172
74.1
1.989�0.103
3.696�0.216
169.1�17.9
141.0�20.7
5.5�0.8
FE-13
1a
0.6
70.361
23.163
318
0.983
0.356
40.640
81.9
1.547�0.097
2.691�0.190
129.0�14.3
114.2�17.2
5.8�0.7
FE-3
1a
0.1
70.345
23.175
257
0.983
0.358
40.345
n/a
2.185�0.072
n/a
199.0�19.5
n/a
n/a
FE-5
1a
0.15
70.345
23.164
257
0.983
0.357
40.667
n/a
2.036�0.097
n/a
182.8�19.1
n/a
n/a
FE-10
1a
0.6
70.364
23.144
353
0.983
0.357
40.667
n/a
3.170�0.148
n/a
269.1�28.4
n/a
n/a
FE-16
1a
0.4
70.322
23.163
235
0.983
0.357
40.544
n/a
1.111�0.056
n/a
100.1�10.3
n/a
n/a
FE-14
1a
0.4
70.352
23.162
323
0.983
0.358
40.075
94.1
1.323�0.084
2.074�0.138
111.3�12.3
99.9�14.7
6.0�0.6
06-FE-28
1b
0.7
70.392
23.105
487
0.983
0.356
40.051
n/a
1.520�0.041
n/a
108.7�10.2
n/a
n/a
06-FE-63
1a
0.35
70.373
23.076
442
0.983
0.358
40.640
n/a
3.311�0.077
n/a
253.9�24.4
n/a
n/a
06-FE-64
1a
0.3
70.374
23.076
442
0.983
0.360
40.075
n/a
2.949�0.074
n/a
229.3�22.0
n/a
n/a
06-FE-2
1b
0.3
70.383
23.080
493
0.983
0.331
24.967
n/a
1.456�0.042
n/a
156.3�14.9
n/a
n/a
06-FE-4
1b
0.2
70.385
23.082
495
0.983
0.357
24.950
n/a
1.767�0.128
n/a
207.1�24.7
n/a
n/a
06-FE-12
1b
0.25
70.385
23.071
531
0.983
0.544
39.397
n/a
1.298�0.032
n/a
139.4�13.0
n/a
n/a
06-FE-45
1b
0.3
70.383
23.081
525
0.983
0.356
40.067
n/a
1.157�0.037
n/a
79.2�7.5
n/a
n/a
06-FE-30
2a
0.5
70.386
23.069
485
0.983
0.335
40.161
n/a
1.042�0.031
n/a
69.5�6.5
n/a
n/a
BOREAS Late Pleistocene glacial history of Jameson Land, central East Greenland 247

Shielding from surrounding objects was measured witha compass.
Samples were processed at the University at Buffalofor 10Be and 26Al analysis following procedures mod-ified after Kohl & Nishiizumi (1992) and Briner (2003).About 40 g of clean quartz from each sample was dis-solved in batches of 11 and one process blank (Table 1).Known amounts of SPEX brand Be (�0.35 g) and Alcarrier were added to all samples, including the blank.10Be/9Be ratios were measured at the Tandem Labora-tory at Uppsala University and normalized to the NISTSRM4325 standard (assuming an isotope ratio of3.03�10�11). 26Al/27Al ratios were measured at PRIMElab, Purdue University using the Al standard by Nish-iizumi (2004). 10Be and 26Al ages were calculated ac-cording to the scaling scheme for spallation by Lal(1991) and Stone (2000) using the CRONUS-Earth ex-posure age calculator version 2.2 available at http://hess.ess.washington.edu/math/(Balco et al. 2008). Thisversion does an internal conversion of the 10Be dataentered by the user to the revised 10Be standardization(isotopic ratio of the NIST SRM4325 standard is2.79�10�11) and 10Be half-life (1.36Myr) of Nishiizumiet al. (2007). 10Be and 26Al ages were calculatedwith reference production rates (2s, sea level, highlatitude and standard atmosphere) of 4.5�0.4 and30.2�2.6 atoms/g/yr, respectively. Correction wasmade for sample thickness using exponential decreasein nuclide production and a bulk density of 2.68 g cm�1.The diameter of each cobble is used as its samplethickness, whereas the average diameter is used foramalgamated clast samples. The topographic shieldingfor all samples was less than 51 and was thus considerednegligible. Snow shielding is also considered insignif-icant, since all samples were collected from exposed lo-cations assumed to have been windswept duringwinters. The 10Be and26Al data are presented in Table 1.
The calculation of single cosmogenic exposure agesrelies on several assumptions, including that a sampledsurface has been constantly exposed, lacks inherited iso-topes from previous exposures (requiring at least�2m ofglacial erosion) (Davis et al. 1999; Briner et al. 2006), andhas experienced only minimal postglacial surface ero-sion. This will likely be the case for most samples fromerratics and bedrock surfaces from settings where sub-stantial erosion took place. There are, however, at leasttwo scenarios where these assumptions will be violated.First, exhumation of clasts from unconsolidated sedi-ments will lead to anomalously young exposure ages(Putkonen & Swanson 2003). Second, non-erosive icehas the potential to preserve both old bedrock surfacesand erratics deposited during earlier glaciations, and thussamples from such surfaces might contain inherited iso-topes from previous exposure, resulting in exposure agesmuch older than the last deglaciation (Briner et al. 2005).
Where bedrock and erratics are shielded from cosmicradiation for long periods (�200 kyr or longer; e.g. viaTa
ble
1.co
ntinued
Sample
Surface
typea
Sample
height
Lat.
Long.
Elevation
Thickness
correctionb
Becarrier
mass
Sample
mass
Al
10Be/
9Be
26Al/27Al
10Beage
26Alage
26Al/10Beratio
(m)
(N)
(W)
(ma.s.l.)
(mg)
(g)
(ppm)
(�1012)c
(�1012)d
(kyr)
(kyr)
06-FE-40
2a
0.4
70.367
23.072
486
0.983
0.358
40.650
n/a
1.570�0.044
n/a
111.5�10.5
n/a
n/a
Crystallineboulders
06-FE-59
2a
1.5
70.389
23.068
506
0.983
0.357
25.689
n/a
0.651�0.022
n/a
71.0�6.5
n/a
n/a
06-FE-60
2a
1.9
70.389
23.068
506
0.983
0.356
32.278
n/a
1.041�0.025
n/a
90.4�8.3
n/a
n/a
06-FE-69
2a
0.8
70.388
23.068
506
0.983
0.354
37.150
n/a
0.315�0.029
n/a
23.2�2.9
n/a
n/a
06-FE-62
2a
0.5
70.382
23.097
467
0.983
0.351
38.280
n/a
0.450�0.04
n/a
33.3�4.1
n/a
n/a
Amalgamatedclastsampes
(quartzite
andcrystalline)
06FE-31
2a
n/a
70.3865
23.068
485
0.967
0.356
40.241
n/a
0.982�0.031
n/a
70.6�6.7
n/a
n/a
06FE-32
2a
n/a
70.387
23.068
485
0.967
0.358
40.046
n/a
0.875�0.026
n/a
63.4�5.9
n/a
n/a
06-FE-61
2a
n/a
70.394
23.063
528
0.967
0.357
39.172
n/a
0.978�0.027
n/a
69.5�6.4
n/a
n/a
aSurface
typethatthesampleisrestingon;(1a)regolith;(1b)weathered
bedrock
outcrops;(2a)flattillsurface;(2b)glaciofluviallandform
s.bThicknesscorrectioncalculatedforadensity
of2.68gcm�3.
c Blankcorrectionof0.03076�0.00246�10�12applied.Theratioisnorm
alizedto
NIST4325(assuminganisotoperatioof3.03�10�11).
dNoblankcorrectionapplied.Theratioisnorm
alizedto
thestandard
ofNishiizumi(2004).
n/a
notavailableornotapplicable.
248 Lena Hakansson et al. BOREAS

burial by non-erosive ice), the burial duration can beconstrained using the disequilibrium of 10Be and 26Alconcentrations (Lal 1991; Bierman et al. 1999; Gosse &Phillips 2001; Fabel et al. 2002; Briner et al. 2006; Har-bour et al. 2006). In a continuously exposed surface10Be and 26Al will be produced at a constant ratio of26Al/10Be=6.75�0.09 (when using the revised 10Behalf-life) (Nishiizumi et al. 2007). If a surface is shieldedfrom cosmic radiation by non-erosive ice, then the fas-ter decay of 26Al (half-life of 700 kyr) relative to 10Be(half-life of 1.36Myr) will lead to a decrease in the26Al/10Be ratio. Paired isotope data can thus constrainexposure and burial durations.
Results
Jakob Severin plateau – the ‘drift-less area’
The Jacob Severin plateau (711120N, 231290W; Fig. 3A)is a sandstone plateau at�450ma.s.l. situated less than30 km to the south from the mountainous ScoresbyLand with present cirque glaciation at �1000ma.s.l.(Fig. 1). This plateau is covered by thin regolith com-
posed of sand and flat, sandstone cobbles. Along theplateau edges, weathered sandstone is exposed in smalloutcrops. Quartzite erratics occur scattered across theplateau and are suggested to be part of the ‘older drift’(Moller et al. 1994).
Samples were taken from three wind-polished,0.4–0.6m high quartzite boulders resting on regolith(Fig. 3B) and two rounded quartzite cobbles perched onweathered bedrock outcrops (Table 1). 10Be ages fromboulders range between 66.0�9.0 and 70.2�9.2 kyr.Two of these samples (CF-17, 23) have 26Al/10Be ratios(within one sigma error) equivalent to the productionratio of 6.75�0.09. The two cobbles gave 10Be ages of54.5�9.7 and 72.7�7.6 kyr BP (Table 1). The 10Be ageof the youngest sample (CF-20) falls outside the twosigma range of the average age for the four oldest erra-tics. The average exposure age of the four oldest (�thestandard deviation of the mean) is 68.8�3.1 kyr.
The Central Plateau – the ‘older drift’
The Central Plateau (�701N, 221W; Figs 1, 3C, 4) is si-tuated �40 km southeast of Jacob Severin Bjerg and
Fig. 3. A. The Jacob Severin plateau at�450ma.s.l. with Scoresby Sund in thebackground. B. Wind-polished quartzite erraticboulder on the Jacob Severin plateau (sampleCF-17). C. The Central Plateau with themountains of Liverpool Land in the background.The picture is taken from the plateau north of theUgleelv valley. D. Section in glaciofluvial ridgeon the eastern Central Plateau, south of theUgleelv valley. The ridge is dominated bysandy sediments and on the surface there is aconcentration of pebbles and cobbles. E. Eskeron the J. P. Koch plateau, site JPK 1. Samples008 and 009 are taken from the flat-toppedmound seen in the background. F. Quartziteerratic boulder on the J. P. Koch plateau (sample006) at site JPK 2. G. Sandstone tors in theFynselv area. H. Crystalline erratic boulder on tillin the Fynselv area (sample 06-FE-60).
BOREAS Late Pleistocene glacial history of Jameson Land, central East Greenland 249
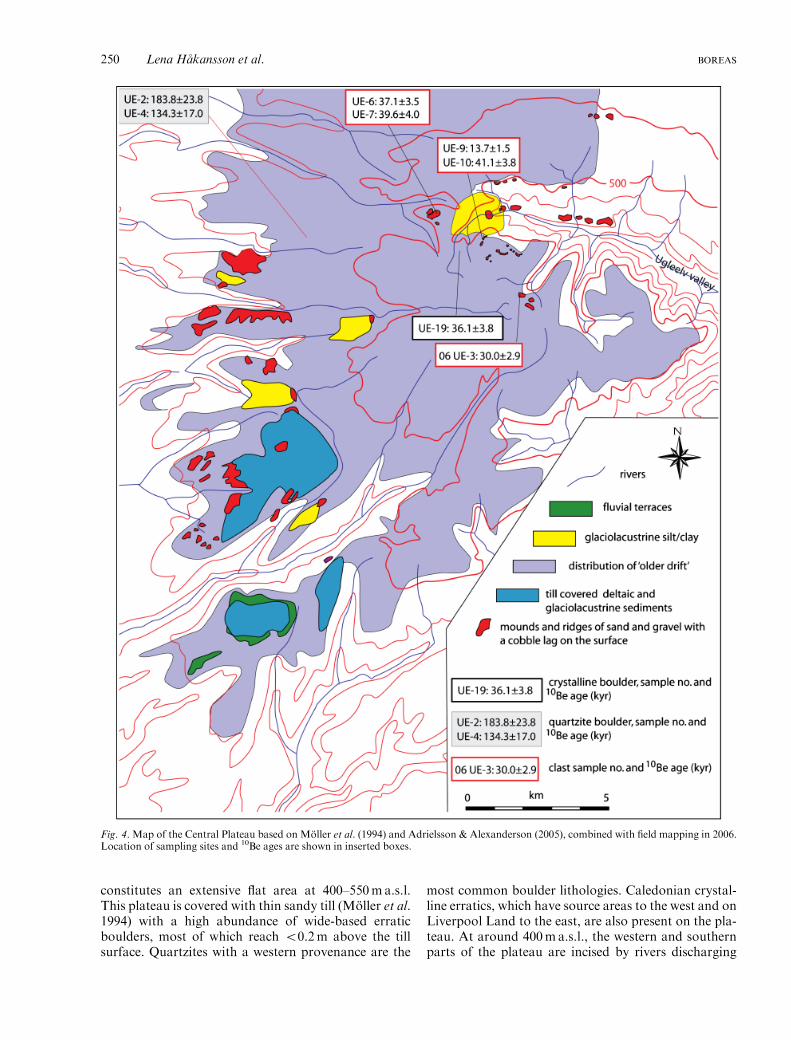
constitutes an extensive flat area at 400–550ma.s.l.This plateau is covered with thin sandy till (Moller et al.1994) with a high abundance of wide-based erraticboulders, most of which reach o0.2m above the tillsurface. Quartzites with a western provenance are the
most common boulder lithologies. Caledonian crystal-line erratics, which have source areas to the west and onLiverpool Land to the east, are also present on the pla-teau. At around 400ma.s.l., the western and southernparts of the plateau are incised by rivers discharging
Fig. 4. Map of the Central Plateau based on Moller et al. (1994) and Adrielsson & Alexanderson (2005), combined with field mapping in 2006.Location of sampling sites and 10Be ages are shown in inserted boxes.
250 Lena Hakansson et al. BOREAS

into Scoresby Sund. Below this elevation the ‘olderdrift’ sediments become discontinuous with increasedrelief of the landscape (Fig. 4).
Along the margin of the Central Plateau there areseveral mounds and plateaus (up to 50m high) andridges (up to 10m high) composed of unconsolidatedsediments (Fig. 4). Large mounds and plateaus arefound mostly along the western plateau margin and areinterpreted as erosional remnants of the glaciolacus-trine sediments deposited during the Saalian glaciation(Moller et al. 1994). Most of the considerably lowerridges are concentrated to the eastern plateau aroundthe Ugleelv valley (Fig. 4). These landforms are com-posed of sand and gravel with some cobble-sized clastsand have been interpreted as glaciofluvial ridges de-posited by an early Weichselian advance from the Li-verpool Land ice cap into the valley (Adrielsson &Alexanderson 2005). On the surfaces of these landformsthere is a concentration of cobble-sized crystalline er-ratic material (Fig. 3D).
A total of eight samples were collected from boulderson the till plain and from clasts on the surfaces of gla-ciofluvial ridges around the Ugleelv valley (Fig. 4;Table 1). Two samples (UE-2, 4) were taken from0.3–0.5m high quartzite boulders on the western part ofthe plateau and these give 10Be ages of 134.3�17.0 and183.8�23.8 kyr (Table 1). One sample, collected from a0.6m high crystalline boulder on the eastern plateaumargin adjacent to the Ugleelv valley (UE-19), has a10Be age of 36.1�3.8 kyr. One cobble and four amalga-mated clast samples were collected from the surfaces of
three ridges along the Ugleelv valley (Fig. 4). The cob-ble sample gives a 10Be age of 13.7�1.5 kyr and clastsamples range between 30.0�2.9 and 41.1�3.8 kyr.
The J. P. Koch plateau – the ‘older drift’
J. P. Koch Fjeld is a basalt-capped mountain, reaching909ma.s.l. South and east of the mountain, Jurassicsandstone forms a flat plateau at 750–850ma.s.l. (Fig.5), covered by a thin till sheet and with weatheredsandstone outcrops exposed along the plateau edges.Ridges and mounds are found near the plateau marginat sites JPK1, 2 and 3 (Fig. 3E) and terrace systems oc-cur along the edges and on the upper slopes of theHarelv valley at site JPK4 (Fig. 5). The landforms arecomposed of sand and coarse-grained sediments with amaximum particle size of �0.4m and clasts are pre-dominantly quartzite and crystalline erratics (Molleret al. 1994). There is a concentration of cobbles on thesurface of these landforms and more rarely erraticboulders o0.6m. Boulder-sized erratics are commonon the thin drift sheet covering the plateau. Theselandforms were interpreted as eskers and kames(Moller et al. 1994). Three TL ages from sites JPK1–3range between 167 and 380 kyr (Fig. 5) and, based onthese ages and the content of western quartzite bould-ers, it has been suggested that they were deposited bythe Greenland Ice Sheet during the Saalian glaciation(Moller et al. 1994).
A total of seven samples were collected from bould-ers resting on drift on the J. P. Koch plateau (Table 1,
Fig. 5. Map of the J. P. Koch plateau afterMoller et al. (1994) showing drift distributionand location of glaciofluvial landforms. Our10Be results are shown together with TL agesfrom Moller et al. (1994).
BOREAS Late Pleistocene glacial history of Jameson Land, central East Greenland 251

Fig. 5). Two samples are from quartzite boulders on thesurface of the glaciofluvial mound at site JPK1 (Fig.3E), one of them from a 0.4m high boulder resting onthe flat crest far away from the slopes (sample 009), theother a 0.6m high boulder resting on a gently slopingsurface slightly below the crest (sample 008). Two sam-ples were taken from 0.2 and 0.3m high quartziteboulders (samples 004 and 006, respectively), resting ona gently sloping surface just below the crest of the gla-ciofluvial ridge at site JPK2. One crystalline boulderwas sampled from the crest of the glaciofluvial ridge atsite JPK3 (sample 011). Samples were also collectedfrom the till-covered plateau south of the summit of J.P. Koch Fjeld, from one quartzite (sample 001) and onecrystalline boulder (sample 002).
The ages form two groups, one slightly younger thanthe other, but both groups are substantially youngerthan TL ages from sediment samples in this area (Fig.5) (Moller et al. 1994). Samples 006 and 009 give 10Beages of 16.1�3.3 and 10.9�3.9 kyr, whereas the re-maining five samples range between 29.4�7.3 and47.2�7.3 kyr (Table 1).
The Fynselv area – the ‘drift-less area’
The Fynselv River has its source northwest of the J. P.Koch plateau and discharges to the south into Scoresby
Sund (Fig. 1). The upper and middle reaches of thisriver flow through the ‘drift-less’ area, and it hasformed deep canyons surrounded by extensive inter-fluves of exposed weathered sandstone between �550and 250ma.s.l. The centre of interfluves is covered byregolith. Along the edges of the canyon, tors-rich areasare common (Fig. 3F), and in some areas systems ofmeltwater channels follow fracture systems in thesandstone (Schunke 1986; Hjort & Salvigsen 1991;Hakansson 2008) (Fig. 6).
In the Fynselv area, drift cover is rare and occursonly as patches of sandy till and single erratics, usuallyon regolith-covered centres of interfluves but also onweathered sandstone outcrops within tors areas. Thedrift cover is dominated by rounded quartzite cobblesand wind-polished quartzite boulders o0.6m high.Large (up to 2m high) and angular crystalline erraticsoccur scattered on till-covered surfaces (Fig. 3G).
Twenty-three samples were collected from bouldersand clasts resting on both till and weathered bedrock(Table 1). Most samples (sample ID starting with 06–)were taken from one area at the upper reaches of theriver (�701380N, 231070W) (Figs 1, 6). The remainingsamples were collected from areas further to the south,downstream along the Fynselv River, and all are fromregolith-covered surfaces on the centre of interfluves.
In total, 14 samples from wind-polished quartzite er-ratics, 0.1–0.6m high, were collected from weathered
Fig. 6. The tors area at the upper reaches of the Fynselv River (where samples with the prefix 06- were collected). The distribution of drift-coverand tors-rich areas is shown. The locations of samples are marked with stars and 10Be ages (Table 1) are shown in framed boxes.
252 Lena Hakansson et al. BOREAS

bedrock surfaces or surfaces covered by regolith. Ac-quired 10Be ages for these boulders are scattered be-tween 79.2�7.5 and 269.1�28.4 kyr. 26Al has beenmeasured on three samples (FE-12, 13, 14), all with26Al/10Be ratios discordant to the production ratio of6.75�0.09 (Table 1). Samples were also collected fromerratics on the thin patches of till along the upperreaches of the river (Fig. 6); three clast samples (06FE-31, 32, 61) give 10Be ages between 63.4�5.9 and70.6�6.7 kyr, four samples from crystalline boulders0.4–1.9m high range between 23.2�2.9 and90.4�8.3 kyr and two quartzite boulders (06FE-30, 40)0.4 and 0.5m give 10Be ages of 69.5�6.5 and111.5�10.5 kyr.
The larger part of the data set from the Fynselv areashows a scattered distribution of 10Be ages that rangefrom 23.2�2.9 to 269.1�28.4 kyr, but five samples(06FE-30, 31, 32, 59, 61) form a cluster with an averageage of 68.8�3.1 kyr.
Summary of exposure ages
10Be exposure ages of erratics from interior JamesonLand have been divided into two groups based onwhether sampled erratics were resting on weatheredsandstone (Fig. 7A) or on sediment (Fig. 7B). Erraticson weathered sandstone surfaces in the Fynselv areahave ‘old’ exposure ages, with a scattered distributionbetween�80 and 270 kyr. However, there are also a few‘old’ samples from sediment-covered surfaces (Fig. 7B);two are from the Fynselv area (samples 06FE-40, 60)and two from the till plain on the western Central Pla-teau (samples UE-2, 4). The younger part of the data
set, with 10Be exposure ages between �11 and 71 kyr, isdistributed over both weathered sandstone and sedi-ment-covered surfaces. The youngest erratics onweathered sandstone surfaces are from the Jacob Se-verin plateau and cluster around �70 kyr, which is si-milar to ages of erratics from till in the Fynselv area.The exposure ages from both the J. P. Koch plateauand the eastern Central Plateau are younger comparedto the rest of the data set (Fig. 7), but also considerablyyounger than the age proposed by earlier work for gla-ciofluvial landforms on these plateaus (Moller et al.1994; Adrielsson & Alexanderson 2005) (Fig. 5). Onsediment-covered surfaces (till plains and glaciofluviallandforms), samples cluster around the oldest ages, andin this population a few young outliers are found (Fig.7). In the present study, three samples give 10Be ex-posure ages compatible with a LGM deglaciation. Allof these are from glaciofluvial landforms; one (sampleUE-9) is taken from a ridge on the Central Plateau de-posited by an advance of the Liverpool Land ice cap(Adrielsson & Alexanderson 2005) and two (samples006 and 009) are from ridges on the J. P. Koch plateauinterpreted by earlier work to have been deposited bythe Greenland Ice Sheet (Moller et al. 1994).
Discussion
The majority of the ‘old’ erratics in the Fynselv area aresituated on sandstone surfaces adjacent to or on well-developed tors. Discordant paired isotope data fromthree of these erratics (samples FE-12, 13, 14) indicate acomplex exposure/burial history longer than �200 kyr,probably due to periods of shielding by ice with limited
Fig. 7. All 10Be ages on erratics from interior Jameson Land presented within two sigma error (Table 1). A, B. The distribution of 10Be agesfrom erratics resting on weathered sandstone (A) and sediment-covered surfaces (B). Shading indicates the timing of the Saalian advance of theGreenland Ice Sheet (Funder et al. 1994). The dashed line marks the clustering of exposure ages around 70kyr.
BOREAS Late Pleistocene glacial history of Jameson Land, central East Greenland 253
erosion potential. This suggests that both erratics andtors may have been preserved beneath ice with limitederosion potential. The total exposure and burial dura-tion of a sample can be estimated based on measured26Al and 10Be concentrations, assuming that the sam-pled surface only experienced one single burial event(Bierman et al. 1999). Consequently, paired isotopedata can only provide a minimum estimate of the ex-posure/burial history. 26Al and 10Be concentrationspresented here (from samples FE-12, 13, 14) indicatethat at least some ‘old’ erratics in the Fynselv area wereeroded from their source areas west of Jameson Land�250–400 kyr ago (corresponding to MIS 8–12). Eitherthese erratics were originally deposited on JamesonLand or they were entrained by a later advance of theice sheet and successively brought to their presentlocations.
The younger part of the data set (10Be exposure agesbetween �11 and 71 kyr) can be interpreted in at leastthree ways, representing alternative scenarios for thetiming of the last ice-sheet advance onto interior Jame-son Land. The three different scenarios suggest that thelast time Jameson Land was covered by the GreenlandIce Sheet was during: (i) the Saalian glaciation, (ii) theearly Flakkerhuk stade (MIS 4), or (iii) the LGM.
(i) Previous work based on the stratigraphic recordon Jameson Land suggests that the last time materialwas transported by the Greenland Ice Sheet onto theinterior of the peninsula was during the Saalian glacia-tion (Moller et al. 1994). The exposure ages presented inthis study, however, are much younger than the Saaliandeglaciation (the transition between MIS 6 and 5e�130 kyr BP).
(ii) In the stratigraphy of the ‘younger drift’ there isevidence of an advance of an outlet glacier in ScoresbySund starting around �70 kyr ago (Hansen et al. 1999),which corresponds with the clustering of our exposureages around the same time.
(iii) Results from previous work based on exposuredating have indeed indicated the presence of non-ero-sive ice on interior Jameson Land during the LGM, butit has not been possible to conclude whether or not thisice was dynamically connected to the Greenland IceSheet (Hakansson et al. 2007; Hakansson 2008). In thepresent study, three samples give 10Be exposure agescompatible with a LGM deglaciation.
The young samples mentioned in scenario (iii) are alltaken from the surfaces of glaciofluvial ridges. The agesof the sampled landforms on the J. P. Koch and Centralplateaus have been independently constrained with TLand OSL ages indicating deposition during the Saalianand the Early Weichselian, respectively (Moller et al.1994; Adrielsson & Alexanderson 2005). Recent in-vestigations have suggested that, when using cosmo-genic exposure dating on old (pre-LGM) landforms, itis important to consider surface lowering processescausing exhumation (Putkonen & O’Neil 2006; Briner
2007; Kaplan et al. 2007). Cobbles and boulders on oursampled glaciofluvial landforms have similar maximumparticle size and clast lithologies as the sediment foundwithin these features. The clast concentrations on thesurfaces of these landforms might thus be interpreted asa result of exhumation rather than deposition by an icesheet during the LGM. This interpretation is furthersupported by the contrast between young exposure agesand much older TL and OSL ages of the landforms. Inline with this reasoning, we find that a LGM advance ofthe Greenland Ice Sheet onto interior Jameson Land isunlikely.
Marine cores from the shelf break outside ScoresbySund show lower sedimentation rates during MIS 4compared to all other periods during the last glacialcycle (Nam et al. 1995). Additionally, there are no in-dications in the terrestrial stratigraphic record that theadvance described in scenario (ii) was extensive enoughto reach onto interior Jameson Land. These argumentsare used against a large-scale advance of the GreenlandIce Sheet during MIS 4. Instead, we suggest that theerratics were deposited during the Saalian glaciationdescribed in scenario (i). The exposure ages youngerthan the Saalian deglaciation are interpreted as a resultof periods of shielding by non-erosive local ice cap(s)during the Weichselian. It is possible to calculate thethickness of ice required to inhibit production of 10Beand 26Al in a rock surface. For 10Be concentrations toremain at or below the AMS detection limit (�20 000atoms), ice would need to be at least 30m thick at500m a.s.l. and at least 40m at 800ma.s.l. (calculatedusing an ice density of 0.92 g cm�3 and the productionproportions of 10Be and 26Al described in the methodschapter). These thicknesses will inhibit spallogenicproduction, but will allow some muogenic productionto take place in the glacial substrate. However, muo-genic production rates are low (accounting foro5% ofthe production of 10Be and 26Al) (Helsinger et al. 2002),and to allow accumulation of significant 10Be and 26Alconcentrations, ice would have to remain at thesethicknesses for long intervals (throughout several gla-cial cycles). Thus, muon production can be considerednegligible for the younger part of our data set (10Be ex-posure ages between �11 and 71 kyr) and therefore icemust have been at least 40m thick on the J. P. Kochplateau and at least 30m thick at 500ma.s.l. in theFynselv area, on the Jacob Severin and Central pla-teaus, to inhibit production of 10Be and 26Al in the un-derlying rock. In the glaciation model described below,we use these ice thicknesses to calculate the duration ofperiods of exposure and shielding by non-erosive localice cap(s) on interior Jameson Land during the last�130 kyr BP, that is since the Saalian deglaciation.However, when ice thins below these thicknesses, pro-duction will increase rapidly. Thus, the proposed ex-posure durations presented below are only minimumestimates.
254 Lena Hakansson et al. BOREAS
A glaciation model of the Late Pleistocene onJameson Land
Exposure and burial history of interior Jameson Landduring the past �130 kyr
Based on the younger part of our data set (10Be ex-posure ages between �11 and 71 kyr), we suggest thatthe Jacob Severin plateau and the Fynselv area wereexposed for a total of �70 kyr and completely shieldedby ice for �60 kyr. The J. P. Koch plateau, situated onelevations �300m higher compared to the other areas,would have been exposed for �50 kyr according to theoldest exposure ages at this site and therefore coveredfor �80 kyr. These periods of shielding are too short tobe resolved by paired 10Be and 26Al data and accord-ingly samples from the Jacob Severin plateau (CF-17,23) give 26Al/10Be ratios indicating ‘constant exposure’.On the eastern Central Plateau the oldest samples sug-gest a minimum exposure period of �40 kyr. The dura-tion of shielding, however, will depend on the timing ofthe early Weichselian advance from the Liverpool Landice cap, which deposited the sampled landforms. Thisadvance is constrained by three OSL dates of aeoliansediment (a maximum of 109 kyr and two minimumages of 27 and 10 kyr) and is thought to have takenplace during the Early Weichselian, either in MIS 5d orMIS 5b (Adrielsson & Alexanderson 2005).
Glaciological conditions
The Renland ice core indicates that during the MIS 5ethe snow accumulation rate in the Renland ice cap was20% higher than at present (Johnsen et al. 1992) (Figs1, 2). Such high accumulation during the transitionfrom interglacial to glacial climate would favourgrowth of local ice caps on high-elevation regions suchas the two presently glaciated areas to the north andeast of Jameson Land (Fig. 1), the Scoresby Landmountains (�1000ma.s.l.) and Liverpool Land (high-est peak is �1400ma.s.l.), but also on the J. P. Kochplateau (�800ma.s.l.). The Scoresby Land and Liver-pool Land mountains were most likely glaciatedthroughout the last glacial cycle. Out of the three accu-mulation centres mentioned above, Liverpool Land ismost heavily glaciated at present and due to its coastallocation it would probably have received more pre-cipitation all through the last glacial cycle compared tothe other areas. The J. P. Koch plateau is situated onlower elevations compared to the other two areas and inaddition its location further away from the coast willalso result in less precipitation than on Liverpool Land.
Sequential model
Based on the 10Be and 26Al exposure age data set incombination with the stratigraphical record (e.g.
Funder et al. 1994, 1998; Moller et al. 1994) and theclimate record from the Renland ice core (Fig. 2)(Johnsen et al. 1992), a sequential model of Late Pleis-tocene events in the Jameson Land area is proposed in11 steps (Fig. 8A–K). The four investigated areas areshown along an approximated transect from the Scor-esby Land mountains in the NW to the Scoresby Sundtrough in the SE (Figs 1, 8).
A. Erratics with ‘old’ exposure ages, as seen in theFynselv area and from the western Central Plateau,were originally deposited on Jameson Land or adjacentareas between �250 and 400 kyr ago by the GreenlandIce Sheet (Fig. 8A).
B. During the Saalian glaciation an advance of theGreenland Ice Sheet deposited erratics on the JacobSeverin plateau and in the Fynselv area. Also, somepre-Saalian quartzite boulders (samples UE-2, 4; seeTable 1) were redeposited in the Saalian till on theCentral Plateau. This till was at least partly depositedby active warm-based ice (Moller et al. 1994), whereastors in the Fynselv were preserved beneath ice withlimited erosional properties (Hakansson 2008) (Fig.8B). The ice-sheet margin probably reached the con-tinental shelf break at this time. During deglaciation,glaciofluvial ridges were formed along the edges of theJ. P. Koch plateau (Moller et al. 1994). Meltwater in-cised the Central Plateau and formed the Ugleelv valley(Adrielsson & Alexanderson 2005).
C. The marine limit following the Saalian deglacia-tion was �70ma.s.l. at the middle reaches of the fjord(Landvik et al. 1994). Summer temperatures on Jame-son Land were�51Cwarmer than at present during theLangelandselv interglacial (MIS 5e, the Eemian) (Ben-nike & Bocher 1994) and with �20% more precipita-tion (Johnsen et al. 1992). Possible exposure time forsurficial boulders during this ice-free interval was�15 kyr (Fig. 8C).
D. Either during the last part of the Langelandselvinterglacial or in the initial phase of the Weichselianglacial cycle, in the Aucella stade (MIS 5d), high pre-cipitation and cooling temperatures led to growth oflocal ice caps on major accumulation centres such asthe Scoresby Land mountains, Liverpool Land and theJ. P. Koch plateau (Fig. 8D). Temperatures were5–101C colder than present (Funder et al. 1998). Awestward advance from the Liverpool Land ice capmight have reached into the Ugleelv valley. At aroundthe same time, an outlet glacier from the Greenland IceSheet expanded in the Scoresby Sund trough and de-posited a till as part of the ‘younger drift’ along the Ja-meson Land coast (Funder et al. 1998) (Fig. 1). TheJacob Severin plateau and the Fynselv area remainedice-free throughout this period lasting for �10 kyr.
E. During the Hugins� interstade (MIS 5c), the pre-cipitation was�30% of the present (Johnsen et al. 1992)and maximum summer temperatures nearly reached pre-sent values (Funder et al. 1998). Hence the local ice cap
BOREAS Late Pleistocene glacial history of Jameson Land, central East Greenland 255

on the J. P. Koch plateaumelted away and ice centred onthe Scoresby Land mountains and on Liverpool Landretreated, resulting in ice-free conditions on interior Ja-meson Land. The exposure periods on the Jacob Severinplateau and in Fynselv probably lasted �15kyr andslightly less on the J. P. Koch plateau (Fig. 8E).
F. Temperatures dropped during the Jyllandselvstade (MIS 5b) to 5–101C colder than present, but pre-
cipitation was still �30% of the present. Again, localice started to build up over the J. P. Koch plateau, butthis time it also covered the Fynselv area (Fig. 8F). Iceon the accumulation centre in the Scoresby Landmountains expanded to the Jacob Severin plateau. Atall three sites, ice must have been non-erosive to allowthe preservation of delicate landforms (glaciofluvialridges, tors and weathering mantles). At around the
Fig. 8. Simplified model showing one pos-sible scenario for the Late Pleistocene gla-cial geological development of interiorJameson Land. The accumulation rate inthe Renland ice cap is shown in the rightmargin and is presented as percentage ofpresent values.
256 Lena Hakansson et al. BOREAS

same time there was an active westward advance of aglacier from Liverpool Land, this time depositing till inthe Ugleelv valley and glaciofluvial landforms on theedge of the Central Plateau adjacent to this valley(Adrielsson & Alexanderson 2005). An outlet glacieradvanced in the Scoresby Sund trough and depositedtill within the ‘younger drift’ zone (Funder et al.1998).
G. Once again, maximum summer temperaturesnearly reached present values during the M�nselv in-terstade (MIS 5a), but the precipitations stayed un-changed. This period lasted slightly longer than MIS 5c(Fig. 2; Johnsen et al. 1992). Local ice on interiorJameson Land melted away, resulting in an ice-freeperiod of around 15 kyr in all areas except theJ. P. Koch plateau, where ice lingered slightly longer,
Fig. 8. Continued.
BOREAS Late Pleistocene glacial history of Jameson Land, central East Greenland 257

resulting in �10 kyr of exposure (Fig. 8G). Also duringthis period, strong winds might have eroded drift sur-faces.
H. During the early Flakkerhuk stade (MIS 4) theclimate got 10–201C colder than present (Funder et al.1998) and drier with only 22% of the present precipita-tion (Johnsen et al. 1992). This prolonged cold periodled to slow accumulation of local ice over all plateaus,eventually coalescing into a thin, probably non-erosive,ice capping interior Jameson Land. Again, an outletglacier advanced in the Scoresby Sund trough. Deltaicsediments were deposited in glacial lakes in marginalpositions to the Scoresby Sund-based outlet glacier,and palaeoflow directions were from Scoresby Sund butalso from interior Jameson Land (Hansen et al. 1999),probably caused by surface melt of the local ice capduring summers (Fig. 8H).
I. During the mid-Flakkerhuk stade (MIS 3), tem-peratures got slightly warmer compared to MIS 4, butthe precipitation was unchanged (Johnsen et al. 1992).This resulted in ice starvation and melting/evaporationon the Central Plateau. An ice-free period lastingfor �10 kyr followed, when strong winds from thesouth formed deflation surfaces on the drift and accu-mulated sand dunes in the upper Ugleelv valley(Adrielsson & Alexanderson 2005) (Fig. 8I). In con-trast, ice could linger on the J. P. Koch plateau and inthe Fynselv area, where some precipitation was broughtby the southerly winds. The ice cover on the Jacob Se-verin plateau also persisted through this period becauseof its proximity to the Scoresby Land mountains. Priorto the LGM, ice probably accumulated again on theCentral Plateau.
J. During the LGM, the local ice cap(s) coalescedwith active ice in the Scoresby Sund trough (Fig. 8J).The probably non-erosive ice capping interior JamesonLand buttressed active ice in the fjord trough, allowingit to reach at least 250m above the present sea level atthe mouth of the Scoresby Sund fjord (Hakansson et al.2007). At this time the ice margin probably reached aconsiderable distance onto the continental shelf. Ice onthe tors area along the Fynselv River started to melt atthe earliest around �17 kyr ago (Hakansson 2008). Theupper part of the Kap Brewster peninsula was degla-ciated between 15 and 17 kyr BP (Hakansson et al.2007), and the ice had totally left the outer fjord areabefore 10.2 kyr BP (Marienfeld 1991).
K. Following the deglaciation of interior JamesonLand the youngest erratics were gradually exhumedand exposed on the drift-covered plateaus. The totalpostglacial exposure time of interior Jameson Landuntil the present is suggested to have been about 15 kyr.When adding the duration of all ice-free periods in thepresented model, the total exposure of the Jacob Se-verin plateau and Fynselv is �70 kyr, on the J. P. Kochplateau �50 kyr and on the Central Plateau �40 kyr(Fig. 7K).
Conclusions
Our 10Be and 26Al exposure ages of erratics from fourareas on interior Jameson Land can be divided intothree groups: (i) ‘old’ erratics with total exposure andburial histories of �250–400 kyr, estimated from dis-cordant 10Be and 26Al data, (ii) 10Be ages of erratics onweathered bedrock and till-covered surfaces clusteringaround �70 kyr, and (iii) exposure ages from erraticson glaciofluvial ridges and till-covered plateaus rangingbetween 10.9 and 47.2 kyr. The ‘old’ exposure ages areinterpreted to represent erratics deposited by theGreenland Ice Sheet several glacial cycles ago. Erraticswith exposure ages � 70 kyr are suggested to originatefrom an ice-sheet advance during the Saalian glaciationand an advance by the local Liverpool Land ice capduring the Early Weichselian. The fact that the appar-ent exposure ages are younger than both the Saalianand the Early Weichselian is explained by the erratics,following deposition, being shielded from cosmic ra-diation during periods when substantial areas on Ja-meson Land were covered by non-erosive ice. TheLGM/Lateglacial exposure ages from the top surfacesof glaciofluvial ridges are interpreted as results of ex-humation; we suggest that the Greenland Ice Sheet didnot cover Jameson Land during the LGM. Instead, webelieve that, during this time and also during sub-stantial periods of the last (Weichselian) glacial cycle,the area was covered by local ice cap(s) with limitederosion potential.
Acknowledgements. – This research was funded by the Helge Ax:sonJohnson Foundation, the Swedish Association for Anthropology andGeography (SSAG) and Kungliga Fysiografiska Sallskapet in Lund.The Danish Polar Centre provided logistic support. Elizabeth Tho-mas is acknowledged for enthusiastic help and great company in thefield and Nicolas Young is thanked for assistance in the laboratory.Nicolaj Krog Larsen and Lena Adrielsson are acknowledged for va-luable discussions on this manuscript. Particular thanks to JonLandvik and Vincent Rinterknecht for constructive and helpful re-views of our paper.
References
Adrielsson, L. & Alexanderson, H. 2005: Interactions between theGreenland Ice Sheet and the Liverpool Land coastal ice cap duringthe last two glacial cycles. Journal of Quaternary Science 20,269–283.
Balco, G., Stone, J. O., Lifton, N. A. & Dunai, T. J. 2008: A completeand easily accessible means of calculating surface exposure ages orerosion rates from 10Be and 26Al measurements. Quaternary Geo-chronology 3, 174–195.
Bennike, O. & Bocher, J. 1994: Land biotas of the last interglacial/glacial cycle on Jameson Land, East Greenland. Boreas 23,479–487.
Bierman, P. R., Marsella, K. A., Patterson, C., Davis, P. T. & Caffee,M. 1999: Mid-Pleistocene cosmogenic minimum-age limits for pre-Wisconsin glacial surfaces in southwesternMinnesota and southernBaffin Island: A multiple nuclide approach. Geomorphology 27,25–39.
258 Lena Hakansson et al. BOREAS
Bjorck, S. & Hjort, C. 1984: A re-evaluated glacial chronology fornorthern East Greenland. Geologiska Foreningens i StockholmForhandlingar 105, 235–243.
Briner, J. P. 2003: The Last Glaciation of the Clyde Region, North-eastern Baffin Island, Arctic Canada: Cosmogenic Isotopes Con-straints on Laurentide Ice Sheet Dynamics and Chronology. Ph.D.dissertation, University of Colorado, Boulder, 300 pp.
Briner, J. P. 2007: Moraine pebbles and boulders yield indistinguish-able 10Be ages: A case study from Colorado, USA. Eos Transac-tions AGU, p. 88, Fall Meeting. Abstract PP33B-1272.
Briner, J. P., Miller, G., Davies, P. T., Bierman, P. R. & Caffee, M.2003: Last Glacial Maximum ice sheet dynamics in the CanadianArctic inferred from young erratics perched on ancient tors. Qua-ternary Science Reviews 22, 437–444.
Briner, J. P., Miller, G. H., Davis, T. R. & Finkel, R. 2005: Cosmo-genic exposure dating in arctic glacial landscapes: Implications forthe glacial history of northeastern Baffin Island, Arctic Canada.Canadian Journal of Earth Sciences 42, 67–84.
Briner, J. P., Miller, G., Davies, P. T. & Finkel, R. 2006: Cosmogenicradionuclides from fiord landscapes support differential erosion byoverriding ice sheets. Geological Society of America Bulletin 118,406–430.
Davis, P. T., Bierman, P. R., Marsella, K. A., Caffee, M. W. &Southon, J. R. 1999: Cosmogenic analysis of glacial terrains in theeastern Canadian Arctic: A test for inherited nuclides and the ef-fectiveness of glacial erosion. Annals of Glaciology 28, 181–188.
Davis, P. T., Briner, J. P., Coulthard, R. P., Finkel, R. W. & Miller,G. H. 2006: Preservation of Arctic landscapes overridden by cold-based ice sheets. Quaternary Research 65, 156–163.
Dowdeswell, J. A., Uenzelmann-Neben, G., Whittington, R. J. &Marienfeld, P. 1994: The Late Quaternary sedimentary record inScoresby Sund, East Greenland. Boreas 23, 294–310.
Evans, J., Dowdeswell, J. A., Grobe, H., Niessen, F., Stein, R., Hub-berten, H. W. & Whittington, R. J. 2002: Late Quaternary sedi-mentation in Kejsar Franz Joseph Fjord and the continentalmargin of East Greenland. In Dowdeswell, J. A. & O Cofaigh, C.(eds.): Glacier Influenced Sedimentation on High Latitude Con-tinental Margins, 149–179. Geological Society of London SpecialPublications 203.
Fabel, D., Stroeven, A. P., Harbour, J., Kleman, J., Elmore, D. &Fink, D. 2002: Landscape preservation under Fennoscandian icesheets determined from in situ produced 10Be and 26Al. Earth andPlanetary Science Letters 201, 397–406.
Funder, S. 1972: Remarks on the Quaternary geology of JamesonLand and adjacent areas, Scoresby Sund, East Greenland.Gr�nlands Geologiske Unders�gelse Report 48, 93–98.
Funder, S. 1984: Chronology of the last interglacial/glacial cycle inGreenland: First approximation. In Mahaney, W. C. (ed.): Corre-lation of Quaternary Chronologies, 261–279. GeoBooks, Norwich.
Funder, S. 1989: Quaternary geology of the ice-free areas and ad-jacent shelfs of Greenland; Chapter 13. In Fulton, R. J. (ed.): Qua-ternary Geology of Canada and Greenland, 742–792. GeologicalSurvey of Canada.
Funder, S. 2004: Middle and late Quaternary glacial limits in Green-land. In Ehlers, J. & Gibbard, P. L. (eds.):Quaternary Glaciations –Extent and Chronology, Part II, 425–430. Elsevier, Amsterdam.
Funder, S. & Hansen, L. 1996: The Greenland Ice Sheet – a model forits culmination and decay during and after the last glacial max-imum. Bulletin of the Geological Society of Denmark 42, 137–152.
Funder, S. & Hjort, C. 1973: Aspects of the Weichselian chronologyin central East Greenland. Boreas 2, 69–84.
Funder, S., Hjort, C. & Landvik, J. Y. 1994: The last glacial cycle inEast Greenland, an overview. Boreas 23, 283–293.
Funder, S., Hjort, C., Landvik, J. Y., Nam, S.-I., Reeh, N. & Stein, R.1998: History of a stable ice margin – East Greenland during themiddle and upper Pleistocene. Quaternary Science Reviews 17,77–123.
Gosse, J. C. & Phillips, F. M. 2001: Terrestrial in-situ cosmogenicnuclides: Theory and application. Quaternary Science Reviews 20,1275–1560.
Hakansson, L. 2008: The Late Quaternary Glacial History of North-east Greenland; cosmogenic isotope constraints on chronology andice dynamics. LUNQUA thesis 61. 70 pp.
Hakansson, L., Briner, J. P., Alexanderson, H., Aldahan, A. & Pos-snert, G. 2007: 10Be ages from coastal northeast Greenland con-strain the extent of the Greenland Ice Sheet during the Last GlacialMaximum. Quaternary Science Reviews 26, 2316–2321.
Hansen, L., Funder, S., Murray, A. S. & Mejdal, S. 1999: Luminis-cence dating of the last Weichselian Glacier advance in EastGreenland. Quaternary Geochronology 18, 179–190.
Harbour, J., Stroeven, A. P., Fabel, D., Clarhall, A., Kleman, J., Li,Y., Elmore, D. & Fink, D. 2006: Cosmogenic nuclide evidence forminimal erosion across two subglacial sliding boundaries of the lateglacial Fennoscandian ice sheet. Geomorphology 75, 90–99.
Helsinger, B., Lal, D., Jull, A. J. T., Kubik, P., Ivy-Ochs, S., Knie, K.& Nolte, E. 2002: Production of selected cosmogenic radionuclidesby muons: 2. Capture by negative muons. Earth and Planetary Re-search Letters 200, 357–369.
Hjort, C. 1979: Glaciation in northern East Greenland during theLate Weichselian and Early Flandrian. Boreas 8, 281–296.
Hjort, C. 1981: A glacial chronology for northern East Greenland.Boreas 10, 259–274.
Hjort, C. & Salvigsen, O. 1991: The channel and tor landscape insoutheastern Jameson Land, East Greenland. LUNDQUA Report33, 23–26.
Johnsen, S. J., Clausen, H. B., Dansgaard, W., Gundestrup, N. S.,Hansson, M., Jonsson, P., Steffensen, J. P. & Sveinbj�rnsdottir, A.E. 1992: A ‘deep’ ice core from East Greenland. Meddelelser omGr�nland, Geoscience 29, 22 pp.
Kaplan, M. R., Coranto, A., Hulton, N. R. J., Rabassa, J. O., Kubik,P. W. & Freeman, S. P. H. T. 2007: Cosmogenic nuclide measure-ments in southernmost South America and implications for land-scape change. Geomorphology 87, 284–301.
Kohl, C. P. & Nishiizumi, K. 1992: Chemical isolation of quartz formeasurement of in-situ produced cosmogenic nuclides. Geochimicaet Cosmochimica Acta 56, 3583–3587.
Lal, D. 1991: Cosmic ray labeling of erosion surfaces: In-situ nuclideproduction rates and erosion models. Earth and Planetary ScienceLetters 104, 424–439.
Landvik, J. Y., Brook, E. J., Gualtieri, L., Raisbeck, G., Salvigsen, O.& Yiou, F. 2003: Northwest Svalbard during the last glaciation:Ice-free areas existed. Geology 31, 905–908.
Landvik, J. Y., Lysa, A., Funder, S. & Kelly, M. 1994: The Eemianand Weichselian stratigraphy of the Langelandselv area, JamesonLand East Greenland. Boreas 23, 412–423.
Lasca, N. P. 1969: The surficial geology of Skeldal,Mesters Vig, northeast Greenland.Meddelelser om Gr�nland 176, 56 pp.
Lysa, A. & Landvik, J. Y. 1994: The lower Jyllandselv succession:Evidence for three Weichselian glacier advances over coastal Ja-meson Land, East Greenland. Boreas 23, 434–446.
Marienfeld, P. 1991: Holozane sedimentationsentwicklung im Scor-esby Sund, Ost-Gronland. Berichte zur Polarforschung 96, 162 pp.
Marquette, G. C., Gray, J. T., Gosse, J. C., Courchesne, F., Stockli,L., Macpherson, G. & Finkel, R. 2004: Felsenmeer persistence un-der non-erosive ice in the Torngat Mountains and KaumajetMountains, Quebec and Labrador, as determined by soil weath-ering and cosmogenic nuclide exposure dating. Canadian Journal ofEarth Sciences 41, 19–38.
Moller, P., Hjort, C., Adrielsson, L. & Salvigsen, O. 1994: Glacial historyof interior Jameson Land, East Greenland. Boreas 23, 320–348.
Nam, S.-I., Stein, R., Grobe, H. & Hubberten, H. 1995: Late Qua-ternary glacial/interglacial changes in sediment composition at theEast Greenland continental margin and their paleoceanographicimplications. Marine Geology 122, 243–262.
Nishiizumi, K. 2004: Preparation of 26Al AMS standards. NuclearInstruments and Methods in Physics Research B 223–224, 388–392.
Nishiizumi, K., Imamura, M., Caffee, M. W., Southon, J. R., Finkel,R. C. & McAninch, J. 2007: Absolute calibration of 10Be AMSstandards. Nuclear Instruments and Methods in Physics Research B258, 403–413.
Nordenskjold, O. 1907: On the Geology and Physical Geography ofEast Greenland.Meddelelser om Gr�nland 28, 151–284.
O Cofaigh, C., Dowdeswell, J. A., Evans, J., Kenyon, N. H., Taylor,J., Mienert, J. & Wilken, M. 2004: Timing and significance of gla-cially influenced mass-wasting in the submarine channels of theGreenland Basin.Marine Geology 207, 39–54.
BOREAS Late Pleistocene glacial history of Jameson Land, central East Greenland 259

Putkonen, J. & O’Neil, M. A. 2006: Quaternary degradation of un-consolidated landforms in the western North America. Geomor-phology 75, 408–419.
Putkonen, J. & Swanson, T. 2003: Accuracy of cosmogenic ages formoraines. Quaternary Research 59, 255–261.
Ronnert, L. & Nyborg, M. R. 1994: The distribution of different gla-cial landscapes on southern Jameson Land, East Greenland ac-cording to Landsat Thematic Mapper data. Boreas 23, 294–311.
Schunke, E. 1986: Periglazialformen und Morphodynamik imsudlichen Jameson Land, Øst-Gr�nland. Abhandlungen der Akade-mie der Wissenschaften in Gottingen, 142 pp.
Stein, R., Grobe, H., Hubberten, H., Marienfeld, P. & Nam, S. 1993:Latest Pleistocene to Holocene changes in glaciomarine sedi-mentatioin in Scoresby Sund and along the adjacent East Green-land continental margin: Preliminary results. Geo-Marine Letters13, 9–16.
Stein, R., Nam, S.-I., Grobe, H. & Huberten, H. 1996: Late Qua-ternary glacial history and short-term ice rafted debris fluctuationsalong the east Greenland continental margin. In Andrews (ed.):
Late Quaternary Paleoceanography of the North Atlantic Margins,Geological Society Special Publication 111, 135–151.
Stone, J. O. 2000: Air pressure and cosmogenic isotope production.Journal of Geophysical Research 105, 23753–23759.
Stroeven, A. P., Fabel, D., Hattestrand, C. & Harbour, J. 2002: Arelict landscape in the centre of the Fennoscandian glaciation:Cosmogenic radionuclide evidence of tors preserved through mul-tiple glacial cycles. Geomorphology 44, 145–154.
Sugden, D. E. 1974: Landscapes of glacial erosion in Greenland andtheir relationship to ice, topographic and bedrock conditions. In-stitute of British Geographers, Special Publication 7, 177–195.
Tveranger, T., Houmark-Nielsen, M., L�vberg, K. & Mangerud, J.1994: Eemian – Weichselian stratigraphy of the Flakkerhuk ridge,southern Jameson land, East Greenland. Boreas 23, 359–384.
Washburn, A. L. 1965: Geomorphic and vegetational studies in theMesters Vig district.Meddelelser om Gr�nland 166, 60 pp.
Wilken, M. & Mienert, W. 2006: Submarine glacigenic debris-flows,deep-sea channel and past ice stream behaviour of the east Green-land continental margin. Quaternary Science Reviews 25, 784–810.
260 Lena Hakansson et al. BOREAS