
latam.sgamericas.comlatam.sgamericas.com/sgfpmexico/files/425.pdf · (Market Funds - Liquid Assets)...
68
Transcript of latam.sgamericas.comlatam.sgamericas.com/sgfpmexico/files/425.pdf · (Market Funds - Liquid Assets)...

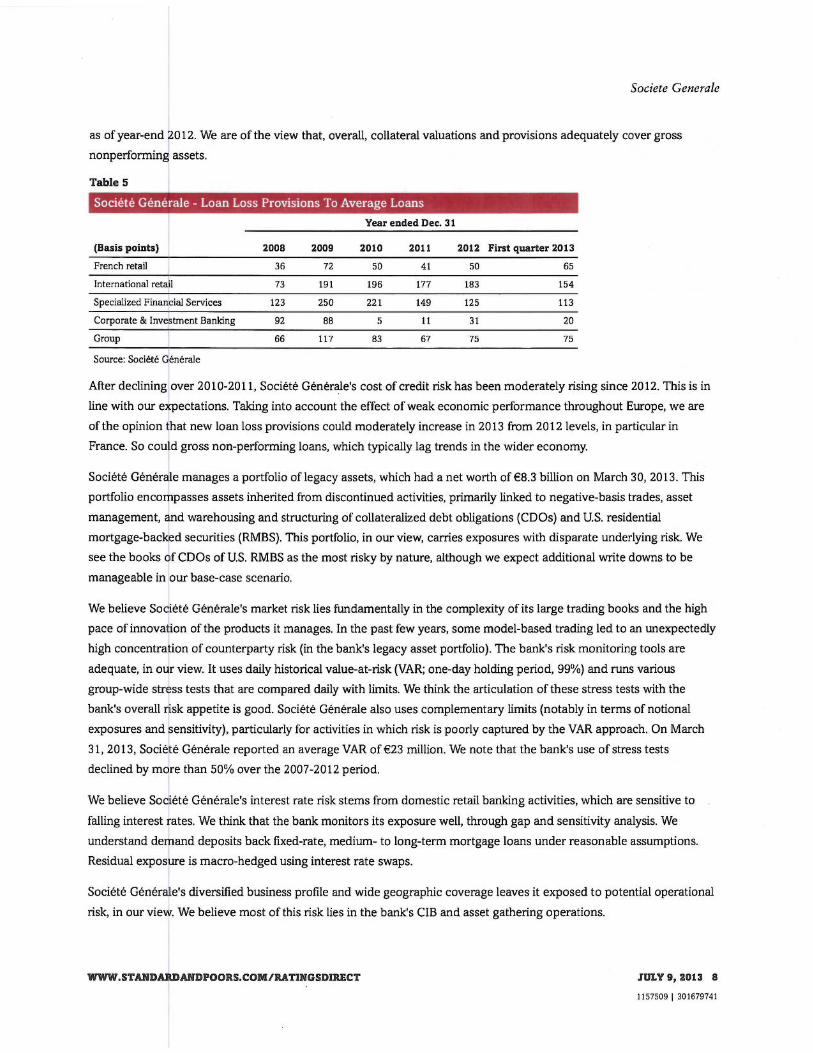

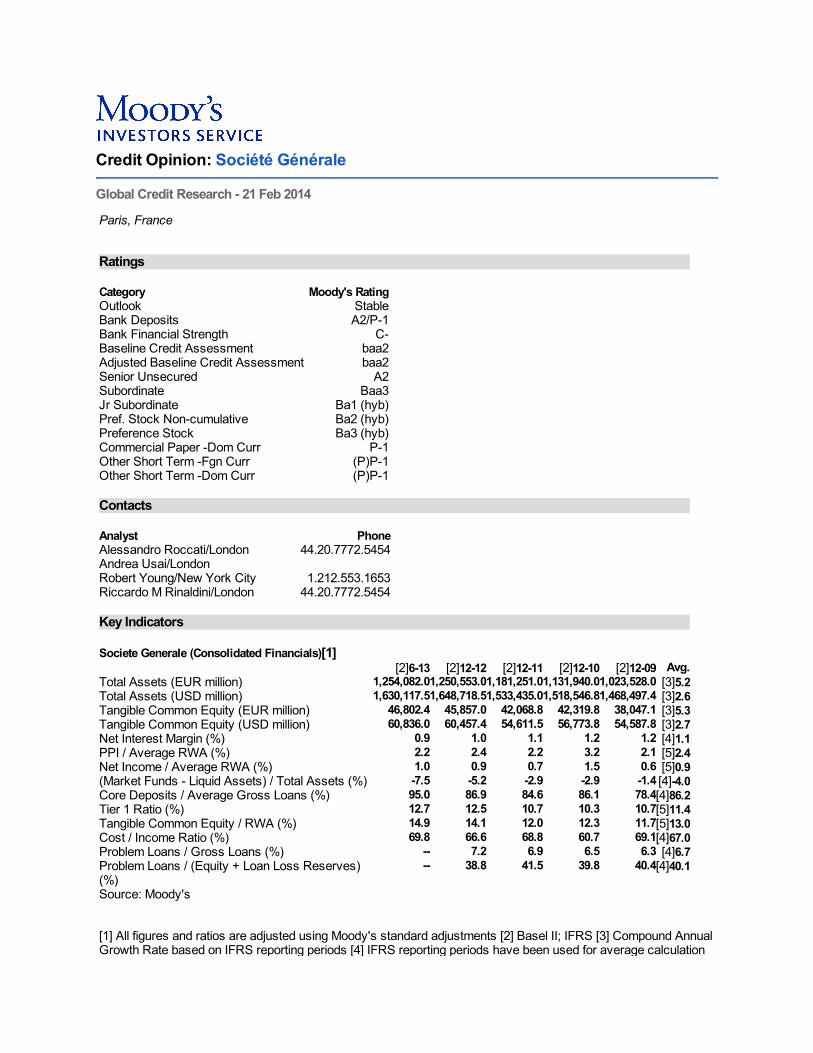
Credit Opinion: Société Générale
Global Credit Research - 21 Feb 2014
Paris, France
Ratings
Category Moody's RatingOutlook StableBank Deposits A2/P-1Bank Financial Strength C-Baseline Credit Assessment baa2Adjusted Baseline Credit Assessment baa2Senior Unsecured A2Subordinate Baa3Jr Subordinate Ba1 (hyb)Pref. Stock Non-cumulative Ba2 (hyb)Preference Stock Ba3 (hyb)Commercial Paper -Dom Curr P-1Other Short Term -Fgn Curr (P)P-1Other Short Term -Dom Curr (P)P-1
Contacts
Analyst PhoneAlessandro Roccati/London 44.20.7772.5454Andrea Usai/LondonRobert Young/New York City 1.212.553.1653Riccardo M Rinaldini/London 44.20.7772.5454
Key Indicators
Societe Generale (Consolidated Financials)[1][2]6-13 [2]12-12 [2]12-11 [2]12-10 [2]12-09 Avg.
Total Assets (EUR million) 1,254,082.01,250,553.01,181,251.01,131,940.01,023,528.0 [3]5.2Total Assets (USD million) 1,630,117.51,648,718.51,533,435.01,518,546.81,468,497.4 [3]2.6Tangible Common Equity (EUR million) 46,802.4 45,857.0 42,068.8 42,319.8 38,047.1 [3]5.3Tangible Common Equity (USD million) 60,836.0 60,457.4 54,611.5 56,773.8 54,587.8 [3]2.7Net Interest Margin (%) 0.9 1.0 1.1 1.2 1.2 [4]1.1PPI / Average RWA (%) 2.2 2.4 2.2 3.2 2.1 [5]2.4Net Income / Average RWA (%) 1.0 0.9 0.7 1.5 0.6 [5]0.9(Market Funds - Liquid Assets) / Total Assets (%) -7.5 -5.2 -2.9 -2.9 -1.4 [4]-4.0Core Deposits / Average Gross Loans (%) 95.0 86.9 84.6 86.1 78.4[4]86.2Tier 1 Ratio (%) 12.7 12.5 10.7 10.3 10.7[5]11.4Tangible Common Equity / RWA (%) 14.9 14.1 12.0 12.3 11.7[5]13.0Cost / Income Ratio (%) 69.8 66.6 68.8 60.7 69.1[4]67.0Problem Loans / Gross Loans (%) -- 7.2 6.9 6.5 6.3 [4]6.7Problem Loans / (Equity + Loan Loss Reserves)(%)
-- 38.8 41.5 39.8 40.4[4]40.1
Source: Moody's
[1] All figures and ratios are adjusted using Moody's standard adjustments [2] Basel II; IFRS [3] Compound AnnualGrowth Rate based on IFRS reporting periods [4] IFRS reporting periods have been used for average calculation
[5] Basel II & IFRS reporting periods have been used for average calculation
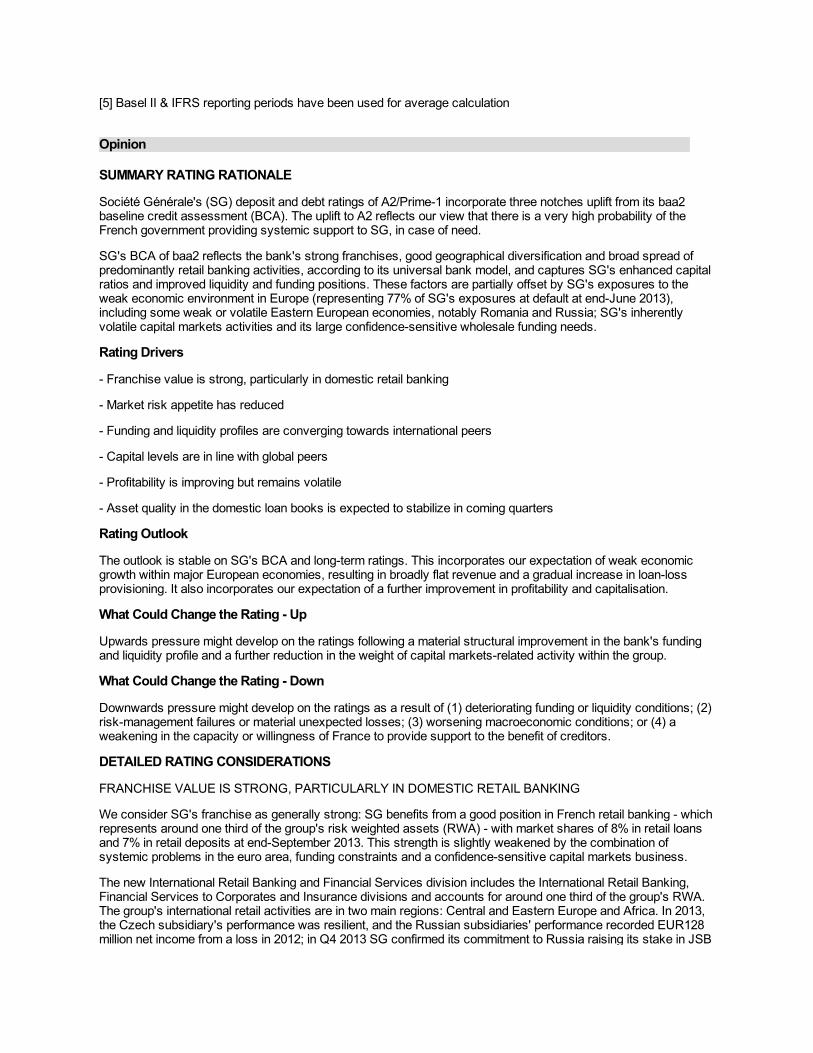
Opinion
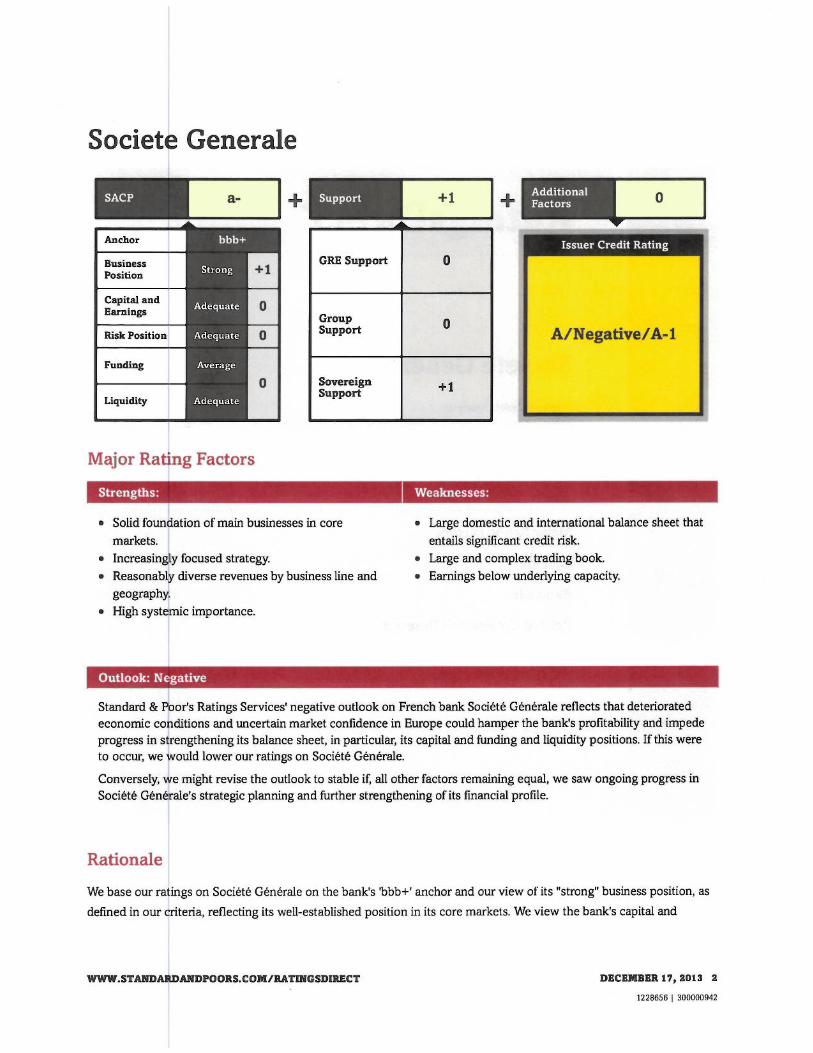
SUMMARY RATING RATIONALE
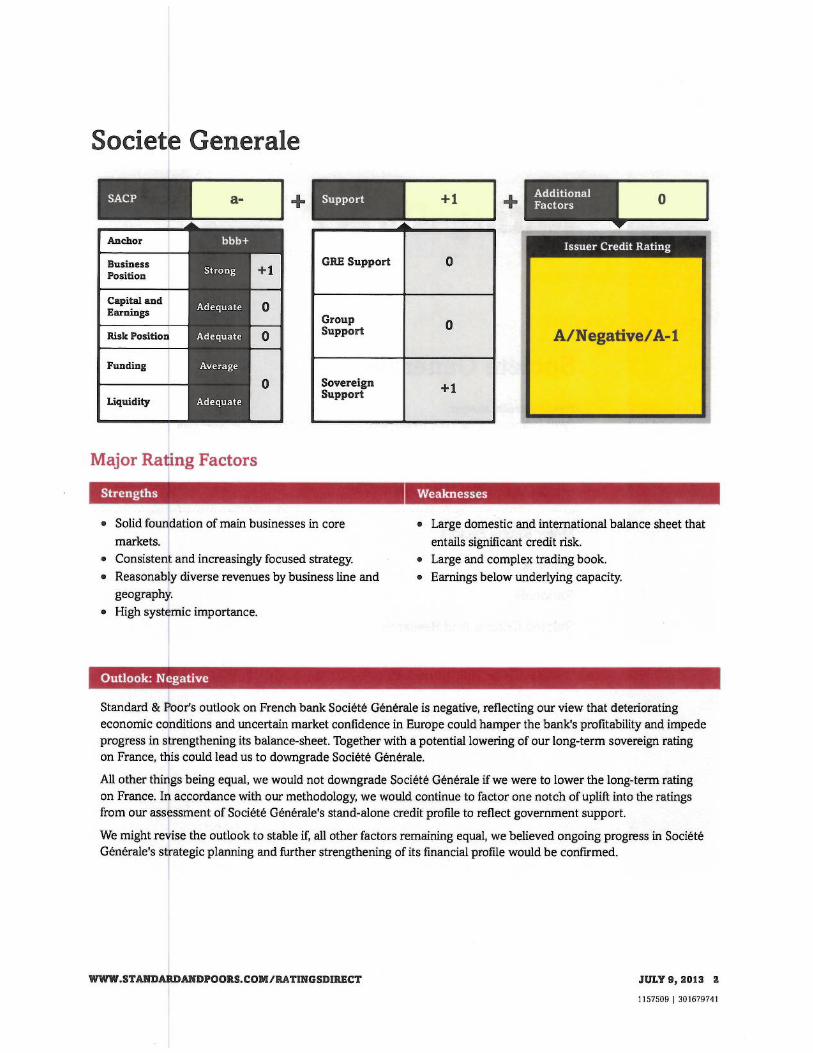
Société Générale's (SG) deposit and debt ratings of A2/Prime-1 incorporate three notches uplift from its baa2baseline credit assessment (BCA). The uplift to A2 reflects our view that there is a very high probability of theFrench government providing systemic support to SG, in case of need.
SG's BCA of baa2 reflects the bank's strong franchises, good geographical diversification and broad spread ofpredominantly retail banking activities, according to its universal bank model, and captures SG's enhanced capitalratios and improved liquidity and funding positions. These factors are partially offset by SG's exposures to theweak economic environment in Europe (representing 77% of SG's exposures at default at end-June 2013),including some weak or volatile Eastern European economies, notably Romania and Russia; SG's inherentlyvolatile capital markets activities and its large confidence-sensitive wholesale funding needs.
Rating Drivers
- Franchise value is strong, particularly in domestic retail banking
- Market risk appetite has reduced
- Funding and liquidity profiles are converging towards international peers
- Capital levels are in line with global peers
- Profitability is improving but remains volatile
- Asset quality in the domestic loan books is expected to stabilize in coming quarters
Rating Outlook
The outlook is stable on SG's BCA and long-term ratings. This incorporates our expectation of weak economicgrowth within major European economies, resulting in broadly flat revenue and a gradual increase in loan-lossprovisioning. It also incorporates our expectation of a further improvement in profitability and capitalisation.
What Could Change the Rating - Up
Upwards pressure might develop on the ratings following a material structural improvement in the bank's fundingand liquidity profile and a further reduction in the weight of capital markets-related activity within the group.
What Could Change the Rating - Down
Downwards pressure might develop on the ratings as a result of (1) deteriorating funding or liquidity conditions; (2)risk-management failures or material unexpected losses; (3) worsening macroeconomic conditions; or (4) aweakening in the capacity or willingness of France to provide support to the benefit of creditors.
DETAILED RATING CONSIDERATIONS
FRANCHISE VALUE IS STRONG, PARTICULARLY IN DOMESTIC RETAIL BANKING
We consider SG's franchise as generally strong: SG benefits from a good position in French retail banking - whichrepresents around one third of the group's risk weighted assets (RWA) - with market shares of 8% in retail loansand 7% in retail deposits at end-September 2013. This strength is slightly weakened by the combination ofsystemic problems in the euro area, funding constraints and a confidence-sensitive capital markets business.
The new International Retail Banking and Financial Services division includes the International Retail Banking,Financial Services to Corporates and Insurance divisions and accounts for around one third of the group's RWA.The group's international retail activities are in two main regions: Central and Eastern Europe and Africa. In 2013,the Czech subsidiary's performance was resilient, and the Russian subsidiaries' performance recorded EUR128million net income from a loss in 2012; in Q4 2013 SG confirmed its commitment to Russia raising its stake in JSB
Rosbank (Baa3 stable, D/ba2 stable) by 10% to 92.4%. SG's Romanian subsidiaries recorded a loss due to apersistently high cost of risk.
Both Financial Services to Corporates and Insurance performance were solid in 2013; SG's bancassurancebusiness sells a range of products to its client base, including in-house life insurance and mutual funds, whichform an important part of the savings base in France. Some areas of Specialised Financial Services represent arisk, notably consumer credit in Italy; however, this exposure is contained in the context of the group loan book.
The new Global Banking and Investor Solutions (GBIS) division includes Global Markets, Financing & Advisory,Asset & Wealth Management and Securities Services & Brokerage sub-divisions and accounts for around onethird of the group's RWA. SG has strong expertise in structured products (with a global leadership in equityderivatives), exchange traded funds (under the Lyxor brand), commodities, research and market making and hasrecently announced a plan to expand its bond origination and trading business with existing European clients.However, we consider SG as a tier-two global investment bank. Capital markets activities bring elements ofvolatility, confidence sensitivity and complexity that reduce the value we attribute to these franchises.
During Q4 2013, SG announced the restructuring of some GBIS businesses; we view the moves as creditpositive. SG signed an agreement to acquire from Credit Agricole CIB (CACIB, A2 stable, ba2 stable) theremaining 50% stake in Newedge, for EUR 275m and to sell Credit Agricole SA (CASA, A2 stable, baa2 stable) a5% stake in Amundi for EUR 338m, taking SG's stake in Amundi from 25% to 20%.
MARKET RISK APPETITE HAS REDUCED
We believe that the firm's risk appetite has reduced, and its risk systems have been thoroughly overhauled inrecent years in response to the rogue trader fraud in 2007 and following the broader financial crisis.
We view SG's recent deleveraging as credit positive because SG has exited non-core businesses and madedisposals with a positive impact on capital ratios: in 2012, SG completed the deleveraging of its CIB division andclosed the sale of its Greek subsidiary Geniki. In Q1 2013, SG closed the sale of its US asset managementbusiness TCW and of its Egyptian subsidiary NSGB.
SG market risk significantly decreased over the last two years: the bank's risk appetite as measured by theaverage VaR, decreased to EUR25 million in 2013 from an average of EUR38 million in 2011. At end- 2013,market risk absorbed EUR26 billion RWA (from EUR29 billion a year earlier), or around 8% of group RWAs andoperational risk absorbed EUR41 billion RWA, or 13% of group RWAs, a moderate level, when compared to theglobal firms with capital markets activities.
Securities and client trading assets decreased to EUR144 billion at end- 2013 from EUR 199 billion at end-2010 asa result of the deleverage plan, partially offset by the increase due to Basel 3 liquidity requirements. SG's tradingassets as a percentage of its cash balance sheet are higher than some of its peers due to the large and liquidequity securities portfolio, which represent around half of the trading assets. SG's largest risk is credit risk,through its loan book of EUR354 billion at end- 2013. Over time, impairment charges have been volatile, due toexposures to Central Eastern Europe, Russia and Africa (16% of the group exposure at default at end- 2013) andto investment bank legacy assets (1.2% of the group exposure at default at end-June 2013). SG's risk positioningis also affected by a few relatively large corporate exposures in its financing activities and by notable industryconcentrations to the financial services sector in its capital market activities.
SG is one of the banks which is being reviewed by the ECB as part of its comprehensive assessment thatconsists of a supervisory judgment on key risks, an asset quality review alongside a stress test, the result ofwhich are to be published in November 2014.
FUNDING AND LIQUIDITY PROFILES ARE CONVERGING TOWARDS INTERNATIONAL PEERS
SG's funding position significantly improved in recent quarters; however, we continue to view SG's funding profilesas weaker than those of some large international peers due to SG's higher dependence on confidence-sensitivewholesale funding. This is driven by large trading and investment portfolios due to investment banking activitiesand holdings of long-dated government bonds. A customer funding gap (customer deposits less customer loans)of EUR14 billion at end-2013 (decreased from EUR50 billion at end-2012) add to wholesale funding needs. SG'sliquidity reserves are currently at a level in line with its peers: at end- 2013, the EUR138 billion liquidity pool -EUR60 billion central bank deposits and EUR78 billion high quality liquid assets (HQLA)- covered EUR124 billionshort-term funding; additional EUR35 billion assets are central bank eligible as opposed to cash and marketablesecurities. SG announced an LCR>100% at end- 2013 without providing the exact figure.
CAPITAL LEVELS ARE IN LINE WITH GLOBAL PEERS
Following material improvements in recent quarters, SG's capital position is now in line with its global peers,providing a good degree of resilience under our stress scenarios. The reported fully-loaded Basel 3 CET1 ratiowas 10.0% at end- 2013, above SG's target of >9.5% by the same period.
SG reported a CRR leverage ratio of 3.5% at end-2013 -which includes grandfathered Tier 1 hybrids and newlyissued Additional Tier 1 (AT1) instruments -, above the regulatory requirement of 3% from 2018 and in line with theestimated leverage ratios disclosed by many of the bank's peers. While those estimates may not be fullycomparable, we believe they are useful benchmarks. Even though the leverage ratio does not capture the riskcontent of assets, we believe it complements ratios based on risk-weighted assets (RWA). The differencebetween simple leverage and RWA-based ratios can be considered a measure of the risk to bondholders ifexisting risk-weights do not fully capture the riskiness of individual assets.
PROFITABILITY IS IMPROVING BUT REMAINS VOLATILE
Recent results have shown an improvement in profitability: in 2013 SG recorded a net income of EUR2.2 billion -which equates a post-tax ROE of 4.4% - due to resilient revenues, stable operating expenses and the absence ofmaterial goodwill impairments and capital losses booked in 2012.
SG announced in 2012 a restructuring plan aiming at achieving EUR900 million operating costs reduction by 2015,with associated one-off charges of EUR600 million; the firm's goal is to maintain its cost base unchanged atEUR16.4 billion (2012 level), accounting for inflation. At end-2013 SG reported unchanged operating expenses atEUR16.4 billion and EUR350 million achieved savings against EUR220 million one-off costs.
SG's capacity to absorb credit losses within the income statement improved during 2013 but remained morelimited when compared with its large domestic peers: the cost of risk consumed 41% of pre-provision income(excluding the impact of legacy assets, non-recurring and non-economic items) in 2013. Future profitability couldcome under renewed pressure due to weaker revenues, as a reflection of volatile markets affecting client activityin the corporate and investment bank and a weak macroeconomic environment, including in Eastern Europe.
Litigation and regulatory fines could also result in an erosion of profitability. In December, the EuropeanCommission (EC) announced that it had reached an agreement with SG to settle investigations into the trading ofyen LIBOR and Euribor for a total of EUR 446 million, which the firm charged in Q4 2013. SG reported EUR 700million of collective provisions for legal disputes at end-2013.
ASSET QUALITY IN THE DOMESTIC LOAN BOOKS IS EXPECTED TO STABILIZE IN COMING QUARTERS
We expect that the credit quality of the domestic retail loan book - which accounts for around half of the group'sloan book - will stabilize in the coming quarters; however, we expect the credit quality of the Eastern European andRussian loan books will mildly deteriorate due to weak macroeconomic trends.
High levels of doubtful loans characterise SG's asset quality, albeit partly due to protracted workout practices, incommon with other French banks, and partly mitigated by collateral and provisions. At end- 2013, impaired loanswere EUR24.9 billion, equal to 7.2% of gross customer loans (net of leasing) an increase versus 6.5% at end-2012; the coverage ratio was at 83%, including collateral and portfolio-based provisions.
SG's banking and trading book net sovereign bond exposures to peripheral European countries were negligible atend-2013: the sovereign exposures to Italy were broadly stable at EUR2.3 billion, while the exposure to Spainincreased in the quarter by EUR1.4 billion to EUR1.9 billion.
NOTE ON DATA
Unless noted otherwise, data in this report is sourced from company reports and our Banking Financial Metrics. Allfigures are based on our own chart of account, and are adjusted for analytical purposes. Please refer to thedocuments entitled "Moody's Approach to Global Standard Adjustments in the Analysis of the FinancialStatements of Banks, Securities Firms and Finance Companies" and "Frequently Asked Questions: Moody'sApproach to Global Standard Adjustments in the Analysis of the Financial Statements of Banks, Securities Firmsand Finance Companies", both published on 19 July 2012.
Global Local Currency Deposit Rating (Joint Default Analysis)
France is regarded as a high support country, and SG has a major role as a French intermediary, which is integral
to the banking system.
Under our joint-default analysis (JDA) methodology, we believe that there is a very high probability of the Frenchgovernment providing systemic support to SG, in case of need. This results in a three-notch uplift from the baa2BCA, thus bringing the deposit and debt ratings to A2/Prime-1.
Notching Considerations
SG's dated subordinated debt instruments are rated Baa3 and its junior subordinated debt ratings are Ba1. Datedsubordinated instruments are now rated one notch below the BCA whilst junior subordinated instruments are ratedtwo or three notches below the BCA, depending on their features. In our view, government support in manyEuropean countries, including France, is no longer sufficiently predictable or reliable to warrant incorporatinggovernment support-driven uplift into the subordinated debt ratings. For more details, please refer to the ratingmethodology document "Global Banks" published on 31 May 2013.
SG's Tier 1 securities are rated Ba2 (hyb). SG's undated deeply subordinated Additional Tier 1 (AT1) securitiesare rated Ba3 (hyb). The ratings reflect the features of the instruments, which lead to a rating three notches belowSG's BCA.
Foreign Currency Deposit Rating
The foreign-currency deposit ratings of SG are A2 stable/Prime-1 with a stable outlook.
Foreign Currency Debt Rating
The foreign-currency debt ratings of SG are A2 stable/Prime-1 with a stable outlook.
ABOUT MOODY'S BANK RATINGS
Bank Financial Strenght Ratings
Moody's Bank Financial Strength Ratings (BFSRs) represent Moody's opinion of a bank's intrinsic safety andsoundness and, as such, exclude certain external credit risks and credit support elements that are addressed byMoody's Bank Deposit Ratings. Bank Financial Strength Ratings do not take into account the probability that thebank will receive such external support, nor do they address risks arising from sovereign actions that mayinterfere with a bank's ability to honor its domestic or foreign currency obligations. Factors considered in theassignment of Bank Financial Strength Ratings include bank-specific elements such as financial fundamentals,franchise value, and business and asset diversification. Although Bank Financial Strength Ratings exclude theexternal factors specified above, they do take into account other risk factors in the bank's operating environment,including the strength and prospective performance of the economy, as well as the structure and relative fragility ofthe financial system, and the quality of banking regulation and supervision.
Global Local Currency Deposit Rating
A deposit rating, as an opinion of relative credit risk, incorporates the Bank Financial Strength Rating as well asMoody's opinion of any external support. Specifically, Moody's Bank Deposit Ratings are opinions of a bank'sability to repay punctually its deposit obligations. As such, Moody's Bank Deposit Ratings are intended toincorporate those aspects of credit risk relevant to the prospective payment performance of rated banks withrespect to deposit obligations, and includes: intrinsic financial strength, sovereign transfer risk (in the case offoreign currency deposit ratings), and both implicit and explicit external support elements. Moody's Bank DepositRatings do not take into account the benefit of deposit insurance schemes which make payments to depositors,but they do recognize the potential support from schemes that may provide assistance to banks directly.According to Moody's joint default analysis (JDA) methodology, the global local currency deposit rating of a bankis determined by the incorporation of external elements of support into the bank's Baseline Risk Assessment. Incalculating the GLC rating for a bank, the JDA methodology also factors in the rating of the support provider, in theform of the local currency deposit ceiling for a country, Moody's assessment of the probability of governmentsupport for the bank in case a stress situation occurs and the degree of dependence between the issuer ratingand the LCDC.
National scale ratings
National scale ratings are intended primarily for use by domestic investors and are not comparable to Moody'sglobally applicable ratings; rather they address relative credit risk within a given country. An Aaa rating on Moody's
National Scale indicates an issuer or issue with the strongest creditworthiness and the lowest likelihood of creditloss relative to other domestic issuers. National Scale Ratings, therefore, rank domestic issuers relative to eachother and not relative to absolute default risks. National ratings isolate systemic risks; they do not address lossexpectation associated with systemic events that could affect all issuers, even those that receive the highestratings on the National Scale.
Foreign Currency Deposit Rating
Moody's ratings on foreign currency bank obligations derive from the bank's local currency rating for the sameclass of obligation. The implementation of JDA for banks can lead to a high local currency ratings for certainbanks, which could also produce high foreign currency ratings. Nevertheless, it should be reminded that foreigncurrency deposit ratings are in all cases constrained by the country ceiling for foreign currency bank deposits.This may result in the assignment of a different, and typically lower, rating for the foreign currency deposits relativeto the bank's rating for local currency obligations.
Foreign Currency Debt Rating
Foreign currency debt ratings are derived from the bank's local currency debt rating. In a similar way to foreigncurrency deposit ratings, foreign currency debt obligations may also be constrained by the country ceiling forforeign currency bonds and notes, however, in some cases the ratings on foreign currency debt obligations maybe allowed to pierce the foreign currency ceiling. A particular mix of rating factors are taken into consideration inorder to assess whether a foreign currency bond rating pierces the country ceiling. They include the issuer'sglobal local currency rating, the foreign currency government bond rating, the country ceiling for bonds and thedebt's eligibility to pierce that ceiling.
Rating Factors
Societe Generale
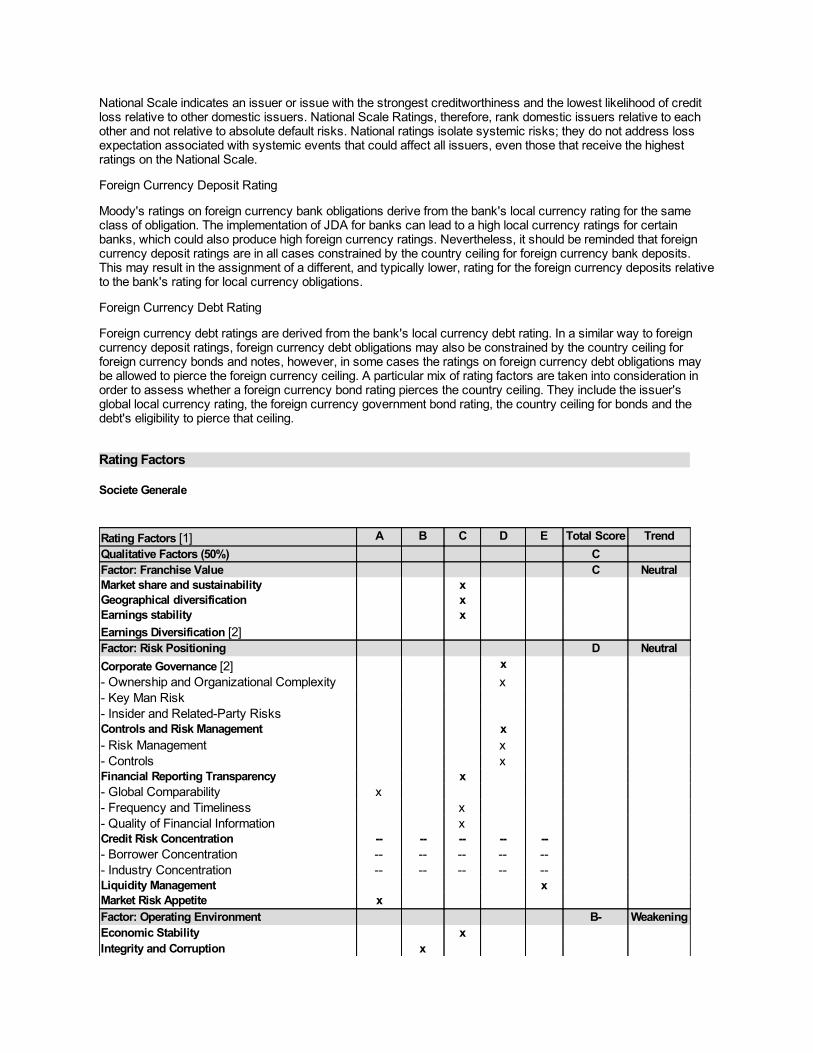
Rating Factors [1] A B C D E Total Score TrendQualitative Factors (50%) C Factor: Franchise Value C NeutralMarket share and sustainability x Geographical diversification x Earnings stability x Earnings Diversification [2] Factor: Risk Positioning D NeutralCorporate Governance [2] x - Ownership and Organizational Complexity x - Key Man Risk - Insider and Related-Party Risks Controls and Risk Management x - Risk Management x - Controls x Financial Reporting Transparency x - Global Comparability x - Frequency and Timeliness x - Quality of Financial Information x Credit Risk Concentration -- -- -- -- -- - Borrower Concentration -- -- -- -- -- - Industry Concentration -- -- -- -- -- Liquidity Management x Market Risk Appetite x Factor: Operating Environment B- WeakeningEconomic Stability x Integrity and Corruption x
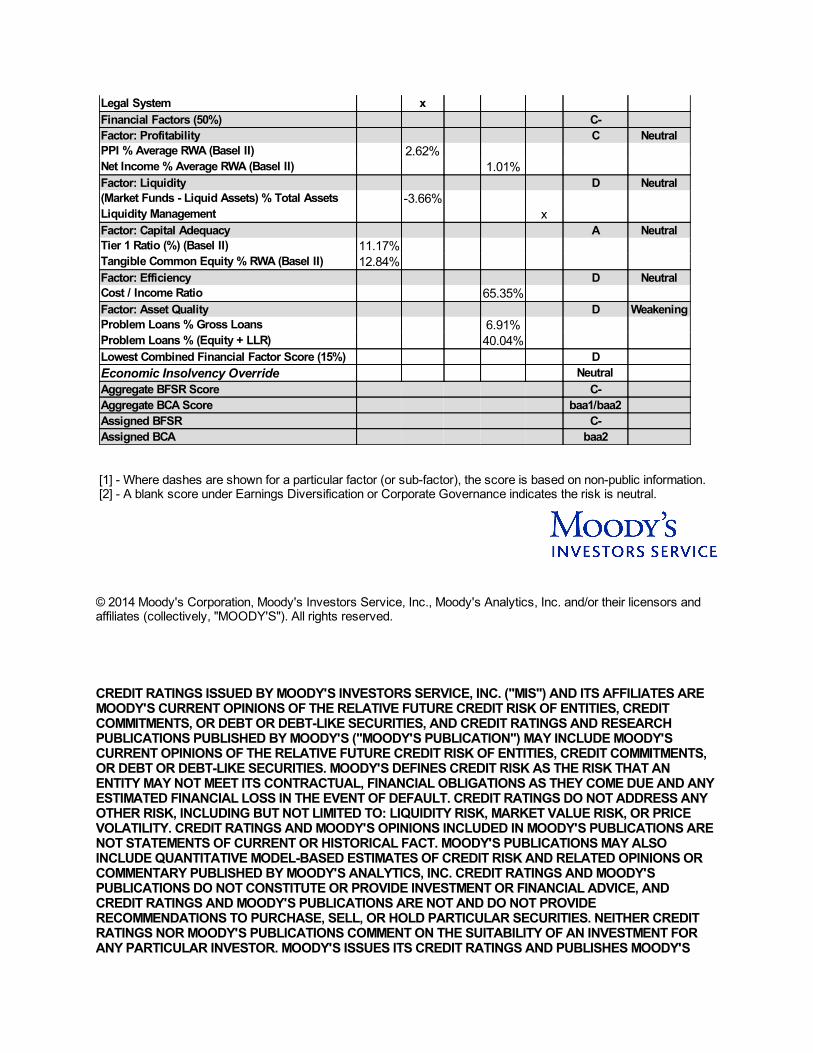
Legal System x Financial Factors (50%) C- Factor: Profitability C NeutralPPI % Average RWA (Basel II) 2.62% Net Income % Average RWA (Basel II) 1.01% Factor: Liquidity D Neutral(Market Funds - Liquid Assets) % Total Assets -3.66% Liquidity Management x Factor: Capital Adequacy A NeutralTier 1 Ratio (%) (Basel II) 11.17% Tangible Common Equity % RWA (Basel II) 12.84% Factor: Efficiency D NeutralCost / Income Ratio 65.35% Factor: Asset Quality D WeakeningProblem Loans % Gross Loans 6.91% Problem Loans % (Equity + LLR) 40.04% Lowest Combined Financial Factor Score (15%) D Economic Insolvency Override Neutral Aggregate BFSR Score C- Aggregate BCA Score baa1/baa2 Assigned BFSR C- Assigned BCA baa2
[1] - Where dashes are shown for a particular factor (or sub-factor), the score is based on non-public information.[2] - A blank score under Earnings Diversification or Corporate Governance indicates the risk is neutral.
© 2014 Moody's Corporation, Moody's Investors Service, Inc., Moody's Analytics, Inc. and/or their licensors andaffiliates (collectively, "MOODY'S"). All rights reserved.
CREDIT RATINGS ISSUED BY MOODY'S INVESTORS SERVICE, INC. ("MIS") AND ITS AFFILIATES AREMOODY'S CURRENT OPINIONS OF THE RELATIVE FUTURE CREDIT RISK OF ENTITIES, CREDITCOMMITMENTS, OR DEBT OR DEBT-LIKE SECURITIES, AND CREDIT RATINGS AND RESEARCHPUBLICATIONS PUBLISHED BY MOODY'S ("MOODY'S PUBLICATION") MAY INCLUDE MOODY'SCURRENT OPINIONS OF THE RELATIVE FUTURE CREDIT RISK OF ENTITIES, CREDIT COMMITMENTS,OR DEBT OR DEBT-LIKE SECURITIES. MOODY'S DEFINES CREDIT RISK AS THE RISK THAT ANENTITY MAY NOT MEET ITS CONTRACTUAL, FINANCIAL OBLIGATIONS AS THEY COME DUE AND ANYESTIMATED FINANCIAL LOSS IN THE EVENT OF DEFAULT. CREDIT RATINGS DO NOT ADDRESS ANYOTHER RISK, INCLUDING BUT NOT LIMITED TO: LIQUIDITY RISK, MARKET VALUE RISK, OR PRICEVOLATILITY. CREDIT RATINGS AND MOODY'S OPINIONS INCLUDED IN MOODY'S PUBLICATIONS ARENOT STATEMENTS OF CURRENT OR HISTORICAL FACT. MOODY'S PUBLICATIONS MAY ALSOINCLUDE QUANTITATIVE MODEL-BASED ESTIMATES OF CREDIT RISK AND RELATED OPINIONS ORCOMMENTARY PUBLISHED BY MOODY'S ANALYTICS, INC. CREDIT RATINGS AND MOODY'SPUBLICATIONS DO NOT CONSTITUTE OR PROVIDE INVESTMENT OR FINANCIAL ADVICE, ANDCREDIT RATINGS AND MOODY'S PUBLICATIONS ARE NOT AND DO NOT PROVIDERECOMMENDATIONS TO PURCHASE, SELL, OR HOLD PARTICULAR SECURITIES. NEITHER CREDITRATINGS NOR MOODY'S PUBLICATIONS COMMENT ON THE SUITABILITY OF AN INVESTMENT FORANY PARTICULAR INVESTOR. MOODY'S ISSUES ITS CREDIT RATINGS AND PUBLISHES MOODY'S
PUBLICATIONS WITH THE EXPECTATION AND UNDERSTANDING THAT EACH INVESTOR WILL, WITHDUE CARE, MAKE ITS OWN STUDY AND EVALUATION OF EACH SECURITY THAT IS UNDERCONSIDERATION FOR PURCHASE, HOLDING, OR SALE.
MOODY'S CREDIT RATINGS AND MOODY'S PUBLICATIONS ARE NOT INTENDED FOR USE BY RETAILINVESTORS AND IT WOULD BE RECKLESS FOR RETAIL INVESTORS TO CONSIDER MOODY'S CREDITRATINGS OR MOODY'S PUBLICATIONS IN MAKING ANY INVESTMENT DECISION. IF IN DOUBT YOUSHOULD CONTACT YOUR FINANCIAL OR OTHER PROFESSIONAL ADVISER.
ALL INFORMATION CONTAINED HEREIN IS PROTECTED BY LAW, INCLUDING BUT NOT LIMITED TO,COPYRIGHT LAW, AND NONE OF SUCH INFORMATION MAY BE COPIED OR OTHERWISEREPRODUCED, REPACKAGED, FURTHER TRANSMITTED, TRANSFERRED, DISSEMINATED,REDISTRIBUTED OR RESOLD, OR STORED FOR SUBSEQUENT USE FOR ANY SUCH PURPOSE, INWHOLE OR IN PART, IN ANY FORM OR MANNER OR BY ANY MEANS WHATSOEVER, BY ANY PERSONWITHOUT MOODY'S PRIOR WRITTEN CONSENT.
All information contained herein is obtained by MOODY'S from sources believed by it to be accurate and reliable.Because of the possibility of human or mechanical error as well as other factors, however, all information containedherein is provided "AS IS" without warranty of any kind. MOODY'S adopts all necessary measures so that theinformation it uses in assigning a credit rating is of sufficient quality and from sources MOODY'S considers to bereliable including, when appropriate, independent third-party sources. However, MOODY'S is not an auditor andcannot in every instance independently verify or validate information received in the rating process or in preparingthe Moody’s Publications.
To the extent permitted by law, MOODY'S and its directors, officers, employees, agents, representatives, licensorsand suppliers disclaim liability to any person or entity for any indirect, special, consequential, or incidental losses ordamages whatsoever arising from or in connection with the information contained herein or the use of or inability touse any such information, even if MOODY'S or any of its directors, officers, employees, agents, representatives,licensors or suppliers is advised in advance of the possibility of such losses or damages, including but not limitedto: (a) any loss of present or prospective profits or (b) any loss or damage arising where the relevant financialinstrument is not the subject of a particular credit rating assigned by MOODY’S.
To the extent permitted by law, MOODY'S and its directors, officers, employees, agents, representatives, licensorsand suppliers disclaim liability for any direct or compensatory losses or damages caused to any person or entity,including but not limited to by any negligence (but excluding fraud, willful misconduct or any other type of liabilitythat, for the avoidance of doubt, by law cannot be excluded) on the part of, or any contingency within or beyond thecontrol of, MOODY'S or any of its directors, officers, employees, agents, representatives, licensors or suppliers,arising from or in connection with the information contained herein or the use of or inability to use any suchinformation.
NO WARRANTY, EXPRESS OR IMPLIED, AS TO THE ACCURACY, TIMELINESS, COMPLETENESS,MERCHANTABILITY OR FITNESS FOR ANY PARTICULAR PURPOSE OF ANY SUCH RATING OR OTHEROPINION OR INFORMATION IS GIVEN OR MADE BY MOODY'S IN ANY FORM OR MANNERWHATSOEVER.
MIS, a wholly-owned credit rating agency subsidiary of Moody’s Corporation ("MCO"), hereby discloses that mostissuers of debt securities (including corporate and municipal bonds, debentures, notes and commercial paper) andpreferred stock rated by MIS have, prior to assignment of any rating, agreed to pay to MIS for appraisal and ratingservices rendered by it fees ranging from $1,500 to approximately $2,500,000. MCO and MIS also maintain policiesand procedures to address the independence of MIS's ratings and rating processes. Information regarding certainaffiliations that may exist between directors of MCO and rated entities, and between entities who hold ratings fromMIS and have also publicly reported to the SEC an ownership interest in MCO of more than 5%, is posted annuallyat www.moodys.com under the heading "Shareholder Relations — Corporate Governance — Director andShareholder Affiliation Policy."
For Australia only: Any publication into Australia of this document is pursuant to the Australian Financial ServicesLicense of MOODY'S affiliate, Moody's Investors Service Pty Limited ABN 61 003 399 657AFSL 336969 and/orMoody's Analytics Australia Pty Ltd ABN 94 105 136 972 AFSL 383569 (as applicable). This document is intendedto be provided only to "wholesale clients" within the meaning of section 761G of the Corporations Act 2001. Bycontinuing to access this document from within Australia, you represent to MOODY'S that you are, or areaccessing the document as a representative of, a "wholesale client" and that neither you nor the entity yourepresent will directly or indirectly disseminate this document or its contents to "retail clients" within the meaning ofsection 761G of the Corporations Act 2001. MOODY'S credit rating is an opinion as to the creditworthiness of adebt obligation of the issuer, not on the equity securities of the issuer or any form of security that is available toretail clients. It would be dangerous for "retail clients" to make any investment decision based on MOODY'S creditrating. If in doubt you should contact your financial or other professional adviser.
Banks
www.fitchratings.com 18 June 2013
France
Société Générale (SG) Full Rating Report
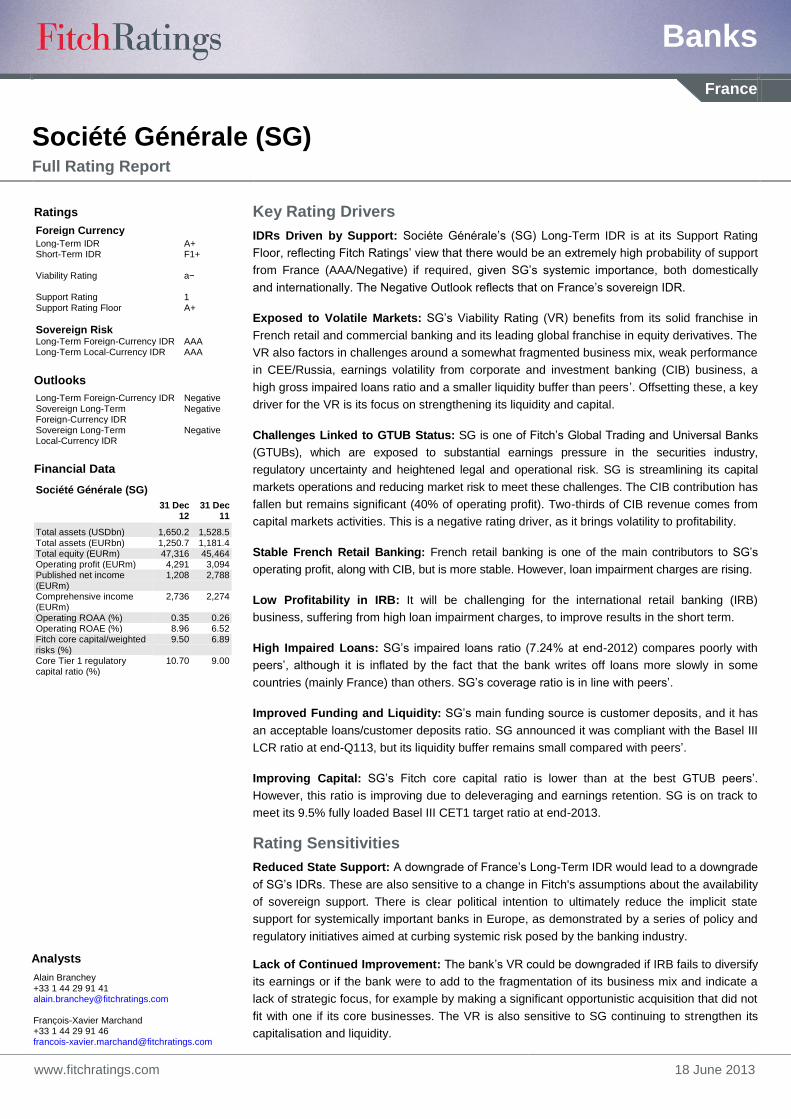
Key Rating Drivers
IDRs Driven by Support: Sociéte Générale‟s (SG) Long-Term IDR is at its Support Rating
Floor, reflecting Fitch Ratings‟ view that there would be an extremely high probability of support
from France (AAA/Negative) if required, given SG‟s systemic importance, both domestically
and internationally. The Negative Outlook reflects that on France‟s sovereign IDR.
Exposed to Volatile Markets: SG‟s Viability Rating (VR) benefits from its solid franchise in
French retail and commercial banking and its leading global franchise in equity derivatives. The
VR also factors in challenges around a somewhat fragmented business mix, weak performance
in CEE/Russia, earnings volatility from corporate and investment banking (CIB) business, a
high gross impaired loans ratio and a smaller liquidity buffer than peers‟. Offsetting these, a key
driver for the VR is its focus on strengthening its liquidity and capital.
Challenges Linked to GTUB Status: SG is one of Fitch‟s Global Trading and Universal Banks
(GTUBs), which are exposed to substantial earnings pressure in the securities industry,
regulatory uncertainty and heightened legal and operational risk. SG is streamlining its capital
markets operations and reducing market risk to meet these challenges. The CIB contribution has
fallen but remains significant (40% of operating profit). Two-thirds of CIB revenue comes from
capital markets activities. This is a negative rating driver, as it brings volatility to profitability.
Stable French Retail Banking: French retail banking is one of the main contributors to SG‟s
operating profit, along with CIB, but is more stable. However, loan impairment charges are rising.
Low Profitability in IRB: It will be challenging for the international retail banking (IRB)
business, suffering from high loan impairment charges, to improve results in the short term.
High Impaired Loans: SG‟s impaired loans ratio (7.24% at end-2012) compares poorly with
peers‟, although it is inflated by the fact that the bank writes off loans more slowly in some
countries (mainly France) than others. SG‟s coverage ratio is in line with peers‟.
Improved Funding and Liquidity: SG‟s main funding source is customer deposits, and it has
an acceptable loans/customer deposits ratio. SG announced it was compliant with the Basel III
LCR ratio at end-Q113, but its liquidity buffer remains small compared with peers‟.
Improving Capital: SG‟s Fitch core capital ratio is lower than at the best GTUB peers‟.
However, this ratio is improving due to deleveraging and earnings retention. SG is on track to
meet its 9.5% fully loaded Basel III CET1 target ratio at end-2013.
Rating Sensitivities
Reduced State Support: A downgrade of France‟s Long-Term IDR would lead to a downgrade
of SG‟s IDRs. These are also sensitive to a change in Fitch's assumptions about the availability
of sovereign support. There is clear political intention to ultimately reduce the implicit state
support for systemically important banks in Europe, as demonstrated by a series of policy and
regulatory initiatives aimed at curbing systemic risk posed by the banking industry.
Lack of Continued Improvement: The bank‟s VR could be downgraded if IRB fails to diversify
its earnings or if the bank were to add to the fragmentation of its business mix and indicate a
lack of strategic focus, for example by making a significant opportunistic acquisition that did not
fit with one if its core businesses. The VR is also sensitive to SG continuing to strengthen its
capitalisation and liquidity.
Ratings
Foreign Currency
Long-Term IDR A+ Short-Term IDR F1+ Viability Rating a− Support Rating 1 Support Rating Floor A+
Sovereign Risk Long-Term Foreign-Currency IDR AAA Long-Term Local-Currency IDR AAA
Outlooks
Long-Term Foreign-Currency IDR Negative Sovereign Long-Term Foreign-Currency IDR
Negative
Sovereign Long-Term Local-Currency IDR
Negative
Financial Data
Société Générale (SG)
31 Dec 12
31 Dec 11
Total assets (USDbn) 1,650.2 1,528.5 Total assets (EURbn) 1,250.7 1,181.4 Total equity (EURm) 47,316 45,464 Operating profit (EURm) 4,291 3,094 Published net income (EURm)
1,208 2,788
Comprehensive income (EURm)
2,736 2,274
Operating ROAA (%) 0.35 0.26 Operating ROAE (%) 8.96 6.52 Fitch core capital/weighted risks (%)
9.50 6.89
Core Tier 1 regulatory capital ratio (%)
10.70 9.00
Analysts
Alain Branchey +33 1 44 29 91 41 [email protected] François-Xavier Marchand +33 1 44 29 91 46 [email protected]
Banks
Société Générale (SG)
June 2013 2
Profile
SG is the 11th-largest bank in the eurozone (fourth-largest in France) by equity. Its business
model mainly revolves around its well-positioned French retail franchise, CIB and international
retail banking (largely in CEE/Russia). SG‟s CIB focus is in Europe, whereas it is more
selective in other locations. SG also maintains specialised financial services (SFS) and wealth
management services.
Strategy
SG‟s focus on liquidity and capital since H211 is paying off, and substantial progress has been
made in strengthening liquidity and capital ratios. SG has completed its deleveraging plan (sale
of EUR19bn of legacy assets and EUR16bn of CIB assets), reduced dollar funding needs (by
USD50bn) and sold certain subsidiaries (Geniki Bank in Greece, National Société Générale
Bank in Egypt and US asset management subsidiary TCW). Nonetheless, SG still needs to
work on achieving its fully loaded Basel III common equity Tier 1 target ratio of close to 9.5% by
end-2013 (8.7% at end-Q113). The bank is on track to achieve this target, but some GTUB
peers already have higher ratios in line with the incoming capital rule. A new strategic plan is
expected to be disclosed in Q114.
SG will continue to focus on its five business lines (see below), and expects organic growth to
flow from synergies between business lines (particularly SFS and retail banking). As there is
pressure on revenues and loan impairment charges (LICs) in several of its core markets, cost
optimisation is also one of the bank‟s priorities. SG has reduced staff in CIB (by 13%) and in
international retail banking (mainly Russia and Romania). Cost rationalisation programmes are
under way in French retail banking, and certain divisions are due to be merged (see below).
The bank targets a cost/income ratio of around 60% (67% in 2012, including costs associated
with its 2011/2012 restructuring plan).
Fitch views SG‟s strategy as markedly more aggressive than that of its direct French peers,
with more focus on higher-risk/higher-return businesses (ie, CIB) and geographical areas (ie,
CEE and Russia).
French Retail Banking
With a 7% market share of deposits, SG is a second-tier bank in France, well behind the
cooperative banks that dominate the domestic market (Crédit Agricole with a 25% share and
Groupe BPCE with 20%). SG provides retail banking services to about 11 million individual
customers and more than 615,000 businesses and professionals through its own network
(national franchise with 3,176 branches) and those of its fully owned subsidiary Crédit du Nord
(A+/bbb+; regional franchise with 918 branches) and its 57%-owned subsidiary Boursorama
(online bank).
Corporate and Investment Banking
The global markets division consists of equity, fixed-income, credit, forex and commodities
products (either simple or structured transactions). The division generates roughly two-thirds of
CIB revenue. SG focuses on areas in which it has competitive strengths, but does not try to
catch up where it has small franchises (ie, in the US and Asia, except for some fixed-income
platforms required to serve its clients).
SG continues to be the world leader in equity derivatives. Equity derivatives trading does not
require the substantial additional capital and liquidity under Basel III that are needed for fixed
income and cash equities. SG ranked number-one for equity and related issues in France
(number-10 in EMEA) in 2012, according to Bloomberg. The bank remains a smaller player in
the fixed-income market, ranking number-five in eurobonds (compared with French rival BNP
Paribas‟s number-one ranking). However, SG is number-two in corporate eurobonds, which is
important for the bank as it provides synergies with corporate clients. Fitch expects fixed
income to continue to be an area of focus for the bank.
Related Criteria
Global Financial Institutions Rating Criteria (August 2012)
Evaluating Corporate Governance (December 2012)
Assessing and Rating Bank Subordinated and Hybrid Securities (December 2012)
World leader in equity derivatives.
Behind GTUB peers in fixed-income
markets, but specialises in areas of
strength.
A second-tier but well-positioned
retail bank in France focused on
profitable and mass affluent
customers.
One of the main western European
banks in CEE/Russia.
Banks
Société Générale (SG)
June 2013 3
The financing and advisory division consists of structured financing and lending to large
corporates, advisory/solutions in mergers and acquisitions, debt and capital restructuring,
asset-liability management, fund raising and hedging. This division generates roughly one-third
of CIB revenue. SG was the fifth-largest EMEA global loans bookrunner and World project
finance bookrunner in 2012.
International Retail Banking
SG has chosen to invest in higher-risk developing markets with the hope of generating higher
returns. However, these have yet to be realised in most countries, and whether the bank can
achieve good profitability from this business in the short term remains to be seen. Moreover,
SG manages each country separately rather than the business as a whole, and certain
countries were loss-making in 2012 (notably Romania and Russia).
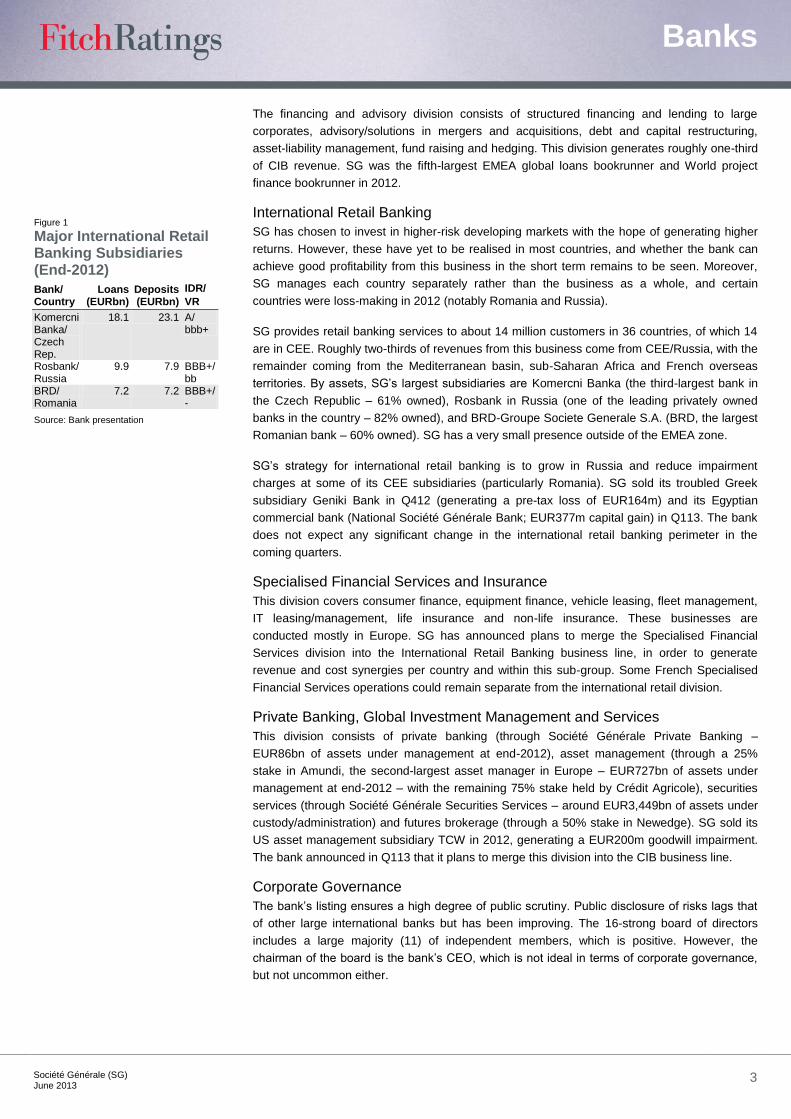
SG provides retail banking services to about 14 million customers in 36 countries, of which 14
are in CEE. Roughly two-thirds of revenues from this business come from CEE/Russia, with the
remainder coming from the Mediterranean basin, sub-Saharan Africa and French overseas
territories. By assets, SG‟s largest subsidiaries are Komercni Banka (the third-largest bank in
the Czech Republic – 61% owned), Rosbank in Russia (one of the leading privately owned
banks in the country – 82% owned), and BRD-Groupe Societe Generale S.A. (BRD, the largest
Romanian bank – 60% owned). SG has a very small presence outside of the EMEA zone.
SG‟s strategy for international retail banking is to grow in Russia and reduce impairment
charges at some of its CEE subsidiaries (particularly Romania). SG sold its troubled Greek
subsidiary Geniki Bank in Q412 (generating a pre-tax loss of EUR164m) and its Egyptian
commercial bank (National Société Générale Bank; EUR377m capital gain) in Q113. The bank
does not expect any significant change in the international retail banking perimeter in the
coming quarters.
Specialised Financial Services and Insurance
This division covers consumer finance, equipment finance, vehicle leasing, fleet management,
IT leasing/management, life insurance and non-life insurance. These businesses are
conducted mostly in Europe. SG has announced plans to merge the Specialised Financial
Services division into the International Retail Banking business line, in order to generate
revenue and cost synergies per country and within this sub-group. Some French Specialised
Financial Services operations could remain separate from the international retail division.
Private Banking, Global Investment Management and Services
This division consists of private banking (through Société Générale Private Banking –
EUR86bn of assets under management at end-2012), asset management (through a 25%
stake in Amundi, the second-largest asset manager in Europe – EUR727bn of assets under
management at end-2012 – with the remaining 75% stake held by Crédit Agricole), securities
services (through Société Générale Securities Services – around EUR3,449bn of assets under
custody/administration) and futures brokerage (through a 50% stake in Newedge). SG sold its
US asset management subsidiary TCW in 2012, generating a EUR200m goodwill impairment.
The bank announced in Q113 that it plans to merge this division into the CIB business line.
Corporate Governance
The bank‟s listing ensures a high degree of public scrutiny. Public disclosure of risks lags that
of other large international banks but has been improving. The 16-strong board of directors
includes a large majority (11) of independent members, which is positive. However, the
chairman of the board is the bank‟s CEO, which is not ideal in terms of corporate governance,
but not uncommon either.
Figure 1
Major International Retail Banking Subsidiaries (End-2012)
Bank/ Country
Loans (EURbn)
Deposits (EURbn)
IDR/
VR
Komercni Banka/ Czech Rep.
18.1 23.1 A/ bbb+
Rosbank/ Russia
9.9 7.9 BBB+/ bb
BRD/ Romania
7.2 7.2 BBB+/-
Source: Bank presentation
Banks
Société Générale (SG)
June 2013 4
The current CEO was appointed in 2009 and has worked at the bank since 1995 (in CIB
between 1995 and 2001; as chief financial officer between 2003 and 2008). He is supported by
three deputy CEOs; one was appointed in 2008 and two in 2010. A new CFO was appointed in
March 2013; he joined SG in 2007 as a senior advisor, then headed up group strategy (2009)
and became deputy CFO in March 2012. Fitch notes that the bank has been exposed in recent
years to turnover in some strategic positions, such as the CFO.
Performance
Global Picture
SG has always aimed to be a highly profitable bank. This has resulted in a volatile performance,
and Fitch expects the bank‟s performance to remain somewhat unpredictable. The main
contributors to volatility in SG‟s performance have been demand for CIB products and credit
impairment charges in international retail banking.
SG‟s medium-term ROE target is 10% in a stabilised economic environment. The bank, like
many of its peers, will have to focus on cost optimisation to compensate for weak prospects in
most of its core markets, the likely persistence of low interest rates and the growing degree of
regulation, which constrains business opportunities. SG‟s performance will also depend on the
time required to build a profitable international retail business, which generated 20% of the
bank‟s revenue in 2012 but a far lower 9% of operating profit (total operating profit excluding
the corporate centre and the contribution from legacy assets). The impact of legacy assets
should no longer be a concern, with lower operating losses estimated in 2013 (EUR50m per
quarter according to management).
Breakdown by Business Line
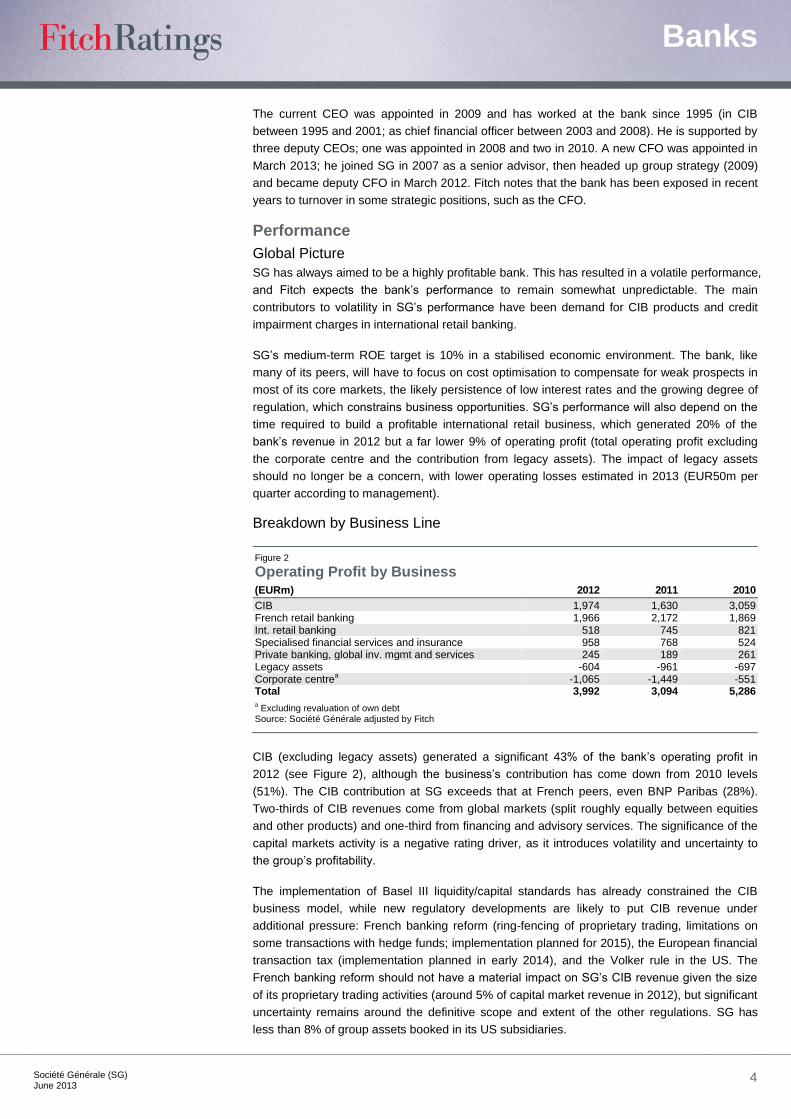
Figure 2 Operating Profit by Business (EURm) 2012 2011 2010
CIB 1,974 1,630 3,059 French retail banking 1,966 2,172 1,869 Int. retail banking 518 745 821 Specialised financial services and insurance 958 768 524 Private banking, global inv. mgmt and services 245 189 261 Legacy assets -604 -961 -697 Corporate centre
a -1,065 -1,449 -551
Total 3,992 3,094 5,286 a Excluding revaluation of own debt
Source: Société Générale adjusted by Fitch
CIB (excluding legacy assets) generated a significant 43% of the bank‟s operating profit in
2012 (see Figure 2), although the business‟s contribution has come down from 2010 levels
(51%). The CIB contribution at SG exceeds that at French peers, even BNP Paribas (28%).
Two-thirds of CIB revenues come from global markets (split roughly equally between equities
and other products) and one-third from financing and advisory services. The significance of the
capital markets activity is a negative rating driver, as it introduces volatility and uncertainty to
the group‟s profitability.
The implementation of Basel III liquidity/capital standards has already constrained the CIB
business model, while new regulatory developments are likely to put CIB revenue under
additional pressure: French banking reform (ring-fencing of proprietary trading, limitations on
some transactions with hedge funds; implementation planned for 2015), the European financial
transaction tax (implementation planned in early 2014), and the Volker rule in the US. The
French banking reform should not have a material impact on SG‟s CIB revenue given the size
of its proprietary trading activities (around 5% of capital market revenue in 2012), but significant
uncertainty remains around the definitive scope and extent of the other regulations. SG has
less than 8% of group assets booked in its US subsidiaries.
Banks
Société Générale (SG)
June 2013 5
French retail banking contributed 43% of SG‟s 2012 operating profit, and the contribution from
this business has proven extremely stable in absolute terms. The bank focuses on higher-end
customers, resulting in more diversified earnings (half of the revenue is in the form of
commissions) than at some domestic peers and higher profitability per customer. SG‟s higher
contribution from corporates compared with other major French banks partly explains the better
resilience of revenue in 2012, despite lower demand for loans and other products from
individuals. Nonetheless, the focus on corporates exposes the bank to higher LICs, particularly
for SMEs. LICs for French retail banking have begun to increase, especially in Q412 (65bp of
gross loans on an annual basis; stable in Q113), but should remain manageable.
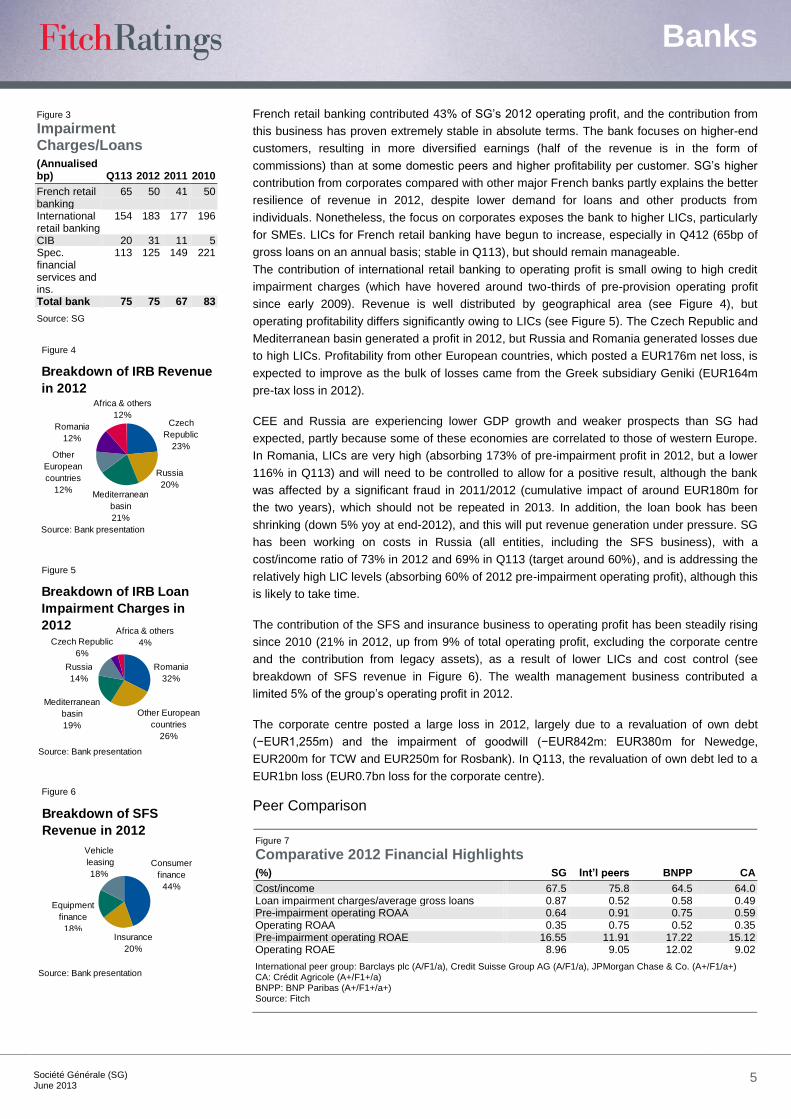
The contribution of international retail banking to operating profit is small owing to high credit
impairment charges (which have hovered around two-thirds of pre-provision operating profit
since early 2009). Revenue is well distributed by geographical area (see Figure 4), but
operating profitability differs significantly owing to LICs (see Figure 5). The Czech Republic and
Mediterranean basin generated a profit in 2012, but Russia and Romania generated losses due
to high LICs. Profitability from other European countries, which posted a EUR176m net loss, is
expected to improve as the bulk of losses came from the Greek subsidiary Geniki (EUR164m
pre-tax loss in 2012).
CEE and Russia are experiencing lower GDP growth and weaker prospects than SG had
expected, partly because some of these economies are correlated to those of western Europe.
In Romania, LICs are very high (absorbing 173% of pre-impairment profit in 2012, but a lower
116% in Q113) and will need to be controlled to allow for a positive result, although the bank
was affected by a significant fraud in 2011/2012 (cumulative impact of around EUR180m for
the two years), which should not be repeated in 2013. In addition, the loan book has been
shrinking (down 5% yoy at end-2012), and this will put revenue generation under pressure. SG
has been working on costs in Russia (all entities, including the SFS business), with a
cost/income ratio of 73% in 2012 and 69% in Q113 (target around 60%), and is addressing the
relatively high LIC levels (absorbing 60% of 2012 pre-impairment operating profit), although this
is likely to take time.
The contribution of the SFS and insurance business to operating profit has been steadily rising
since 2010 (21% in 2012, up from 9% of total operating profit, excluding the corporate centre
and the contribution from legacy assets), as a result of lower LICs and cost control (see
breakdown of SFS revenue in Figure 6). The wealth management business contributed a
limited 5% of the group‟s operating profit in 2012.
The corporate centre posted a large loss in 2012, largely due to a revaluation of own debt
(−EUR1,255m) and the impairment of goodwill (−EUR842m: EUR380m for Newedge,
EUR200m for TCW and EUR250m for Rosbank). In Q113, the revaluation of own debt led to a
EUR1bn loss (EUR0.7bn loss for the corporate centre).
Peer Comparison
Figure 7 Comparative 2012 Financial Highlights (%) SG Int’l peers BNPP CA
Cost/income 67.5 75.8 64.5 64.0 Loan impairment charges/average gross loans 0.87 0.52 0.58 0.49 Pre-impairment operating ROAA 0.64 0.91 0.75 0.59 Operating ROAA 0.35 0.75 0.52 0.35 Pre-impairment operating ROAE 16.55 11.91 17.22 15.12 Operating ROAE 8.96 9.05 12.02 9.02
International peer group: Barclays plc (A/F1/a), Credit Suisse Group AG (A/F1/a), JPMorgan Chase & Co. (A+/F1/a+) CA: Crédit Agricole (A+/F1+/a) BNPP: BNP Paribas (A+/F1+/a+) Source: Fitch
Figure 3 Impairment Charges/Loans (Annualised bp) Q113 2012 2011 2010
French retail banking
65 50 41 50
International retail banking
154 183 177 196
CIB 20 31 11 5 Spec. financial services and ins.
113 125 149 221
Total bank 75 75 67 83
Source: SG
Figure 4
Russia
20%
Breakdown of IRB Revenue
in 2012
Source: Bank presentation
Czech
Republic
23%
Africa & others
12%
Other
European
countries
12%
Romania
12%
Mediterranean
basin
21%
Figure 5
Czech
Republi
c
5%
Breakdown of IRB Loan
Impairment Charges in
2012
Source: Bank presentation
Czech Republic
6%
Africa & others
4%
Other European
countries
26%
Romania
32%
Mediterranean
basin
19%
Russia
14%
Figure 6
Breakdown of SFS
Revenue in 2012
Source: Bank presentation
Equipment
finance
18%
Vehicle
leasing
18%
Insurance
20%
Consumer
finance
44%
Banks
Société Générale (SG)
June 2013 6
Figure 7 compares SG‟s performance ratios with those of a peer group composed of
international banks active in CIB (“Int‟l peers”) and two specific French peers (of which only
BNP Paribas is a large CIB player). SG‟s operating returns are somewhat weaker than those of
its French and international peers. Pre-impairment operating returns are more in line with those
of peers, but LICs are higher. SG‟s cost/income ratio compares favourably with those of
international peers.
Risk Management
Group risk management is overseen by the board of directors, which establishes major limits,
and by the executive management team, which validates and reviews the global risk framework
(including exposures and concentrations) through the risk committee, which meets at least
once a month and is chaired by the CEO. The risk division is responsible for credit, market and
operational risks. The finance division is responsible for finance, including controls (structural
interest rate, exchange rate and liquidity). Both divisions report directly to the deputy CEO.
SG‟s risk systems apply to the whole group and segregate risk management divisions from
business units.
Credit Risk
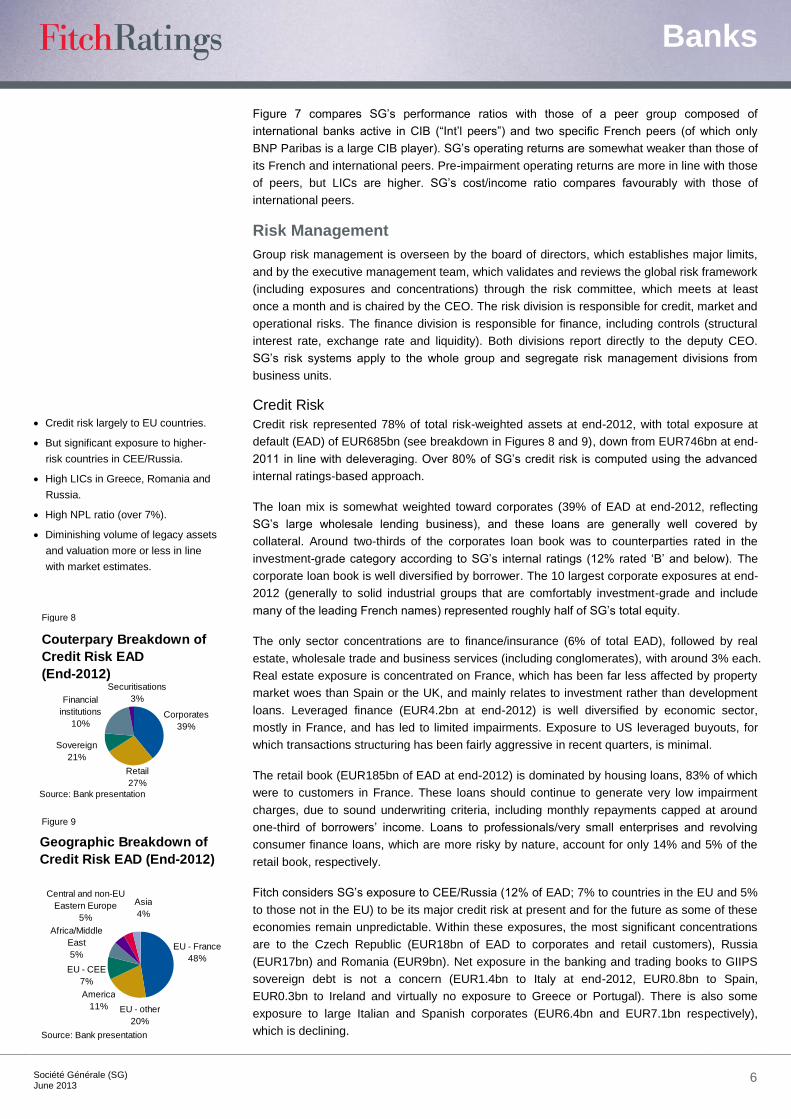
Credit risk represented 78% of total risk-weighted assets at end-2012, with total exposure at
default (EAD) of EUR685bn (see breakdown in Figures 8 and 9), down from EUR746bn at end-
2011 in line with deleveraging. Over 80% of SG‟s credit risk is computed using the advanced
internal ratings-based approach.
The loan mix is somewhat weighted toward corporates (39% of EAD at end-2012, reflecting
SG‟s large wholesale lending business), and these loans are generally well covered by
collateral. Around two-thirds of the corporates loan book was to counterparties rated in the
investment-grade category according to SG‟s internal ratings (12% rated „B‟ and below). The
corporate loan book is well diversified by borrower. The 10 largest corporate exposures at end-
2012 (generally to solid industrial groups that are comfortably investment-grade and include
many of the leading French names) represented roughly half of SG‟s total equity.
The only sector concentrations are to finance/insurance (6% of total EAD), followed by real
estate, wholesale trade and business services (including conglomerates), with around 3% each.
Real estate exposure is concentrated on France, which has been far less affected by property
market woes than Spain or the UK, and mainly relates to investment rather than development
loans. Leveraged finance (EUR4.2bn at end-2012) is well diversified by economic sector,
mostly in France, and has led to limited impairments. Exposure to US leveraged buyouts, for
which transactions structuring has been fairly aggressive in recent quarters, is minimal.
The retail book (EUR185bn of EAD at end-2012) is dominated by housing loans, 83% of which
were to customers in France. These loans should continue to generate very low impairment
charges, due to sound underwriting criteria, including monthly repayments capped at around
one-third of borrowers‟ income. Loans to professionals/very small enterprises and revolving
consumer finance loans, which are more risky by nature, account for only 14% and 5% of the
retail book, respectively.
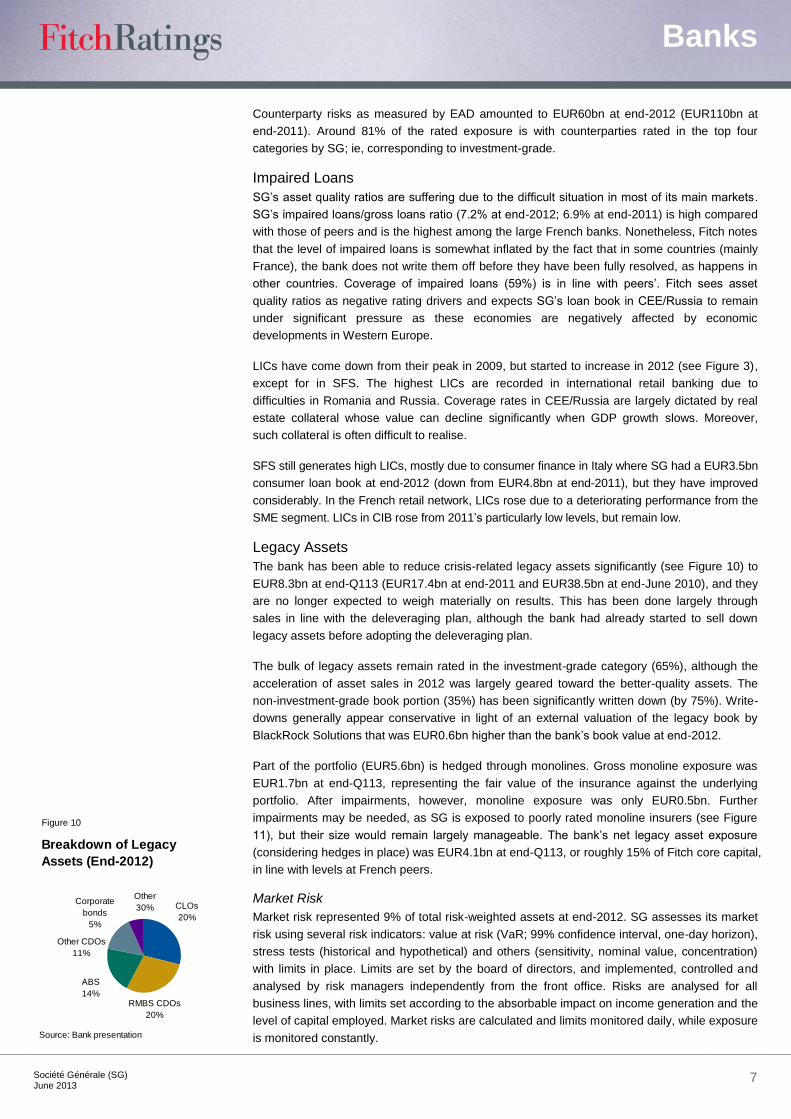
Fitch considers SG‟s exposure to CEE/Russia (12% of EAD; 7% to countries in the EU and 5%
to those not in the EU) to be its major credit risk at present and for the future as some of these
economies remain unpredictable. Within these exposures, the most significant concentrations
are to the Czech Republic (EUR18bn of EAD to corporates and retail customers), Russia
(EUR17bn) and Romania (EUR9bn). Net exposure in the banking and trading books to GIIPS
sovereign debt is not a concern (EUR1.4bn to Italy at end-2012, EUR0.8bn to Spain,
EUR0.3bn to Ireland and virtually no exposure to Greece or Portugal). There is also some
exposure to large Italian and Spanish corporates (EUR6.4bn and EUR7.1bn respectively),
which is declining.
Figure 8
Retail
27%
Couterpary Breakdown of
Credit Risk EAD
(End-2012)
Source: Bank presentation
Corporates
39%
Financial
institutions
10%
Sovereign
21%
Securitisations
3%
Retail
27%
Figure 9
Central
and non-
EU
Eastern
Europe
5%
EU -
France
48%
Geographic Breakdown of
Credit Risk EAD (End-2012)
Source: Bank presentation
EU - other
20%
America
11%
EU - CEE
7%
Africa/Middle
East
5%
Central and non-EU
Eastern Europe
5%
EU - France
48%
Asia
4%
Credit risk largely to EU countries.
But significant exposure to higher-
risk countries in CEE/Russia.
High LICs in Greece, Romania and
Russia.
High NPL ratio (over 7%).
Diminishing volume of legacy assets
and valuation more or less in line
with market estimates.
Banks
Société Générale (SG)
June 2013 7
Counterparty risks as measured by EAD amounted to EUR60bn at end-2012 (EUR110bn at
end-2011). Around 81% of the rated exposure is with counterparties rated in the top four
categories by SG; ie, corresponding to investment-grade.
Impaired Loans
SG‟s asset quality ratios are suffering due to the difficult situation in most of its main markets.
SG‟s impaired loans/gross loans ratio (7.2% at end-2012; 6.9% at end-2011) is high compared
with those of peers and is the highest among the large French banks. Nonetheless, Fitch notes
that the level of impaired loans is somewhat inflated by the fact that in some countries (mainly
France), the bank does not write them off before they have been fully resolved, as happens in
other countries. Coverage of impaired loans (59%) is in line with peers‟. Fitch sees asset
quality ratios as negative rating drivers and expects SG‟s loan book in CEE/Russia to remain
under significant pressure as these economies are negatively affected by economic
developments in Western Europe.
LICs have come down from their peak in 2009, but started to increase in 2012 (see Figure 3),
except for in SFS. The highest LICs are recorded in international retail banking due to
difficulties in Romania and Russia. Coverage rates in CEE/Russia are largely dictated by real
estate collateral whose value can decline significantly when GDP growth slows. Moreover,
such collateral is often difficult to realise.
SFS still generates high LICs, mostly due to consumer finance in Italy where SG had a EUR3.5bn
consumer loan book at end-2012 (down from EUR4.8bn at end-2011), but they have improved
considerably. In the French retail network, LICs rose due to a deteriorating performance from the
SME segment. LICs in CIB rose from 2011‟s particularly low levels, but remain low.
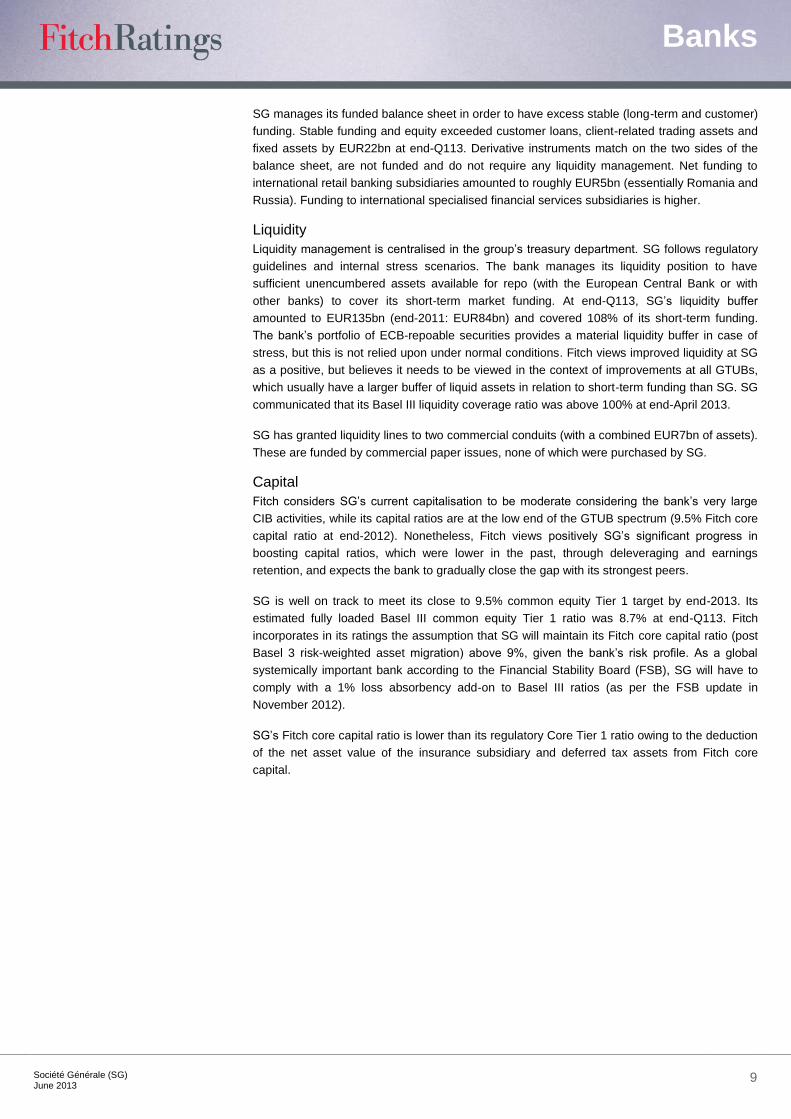
Legacy Assets
The bank has been able to reduce crisis-related legacy assets significantly (see Figure 10) to
EUR8.3bn at end-Q113 (EUR17.4bn at end-2011 and EUR38.5bn at end-June 2010), and they
are no longer expected to weigh materially on results. This has been done largely through
sales in line with the deleveraging plan, although the bank had already started to sell down
legacy assets before adopting the deleveraging plan.
The bulk of legacy assets remain rated in the investment-grade category (65%), although the
acceleration of asset sales in 2012 was largely geared toward the better-quality assets. The
non-investment-grade book portion (35%) has been significantly written down (by 75%). Write-
downs generally appear conservative in light of an external valuation of the legacy book by
BlackRock Solutions that was EUR0.6bn higher than the bank‟s book value at end-2012.
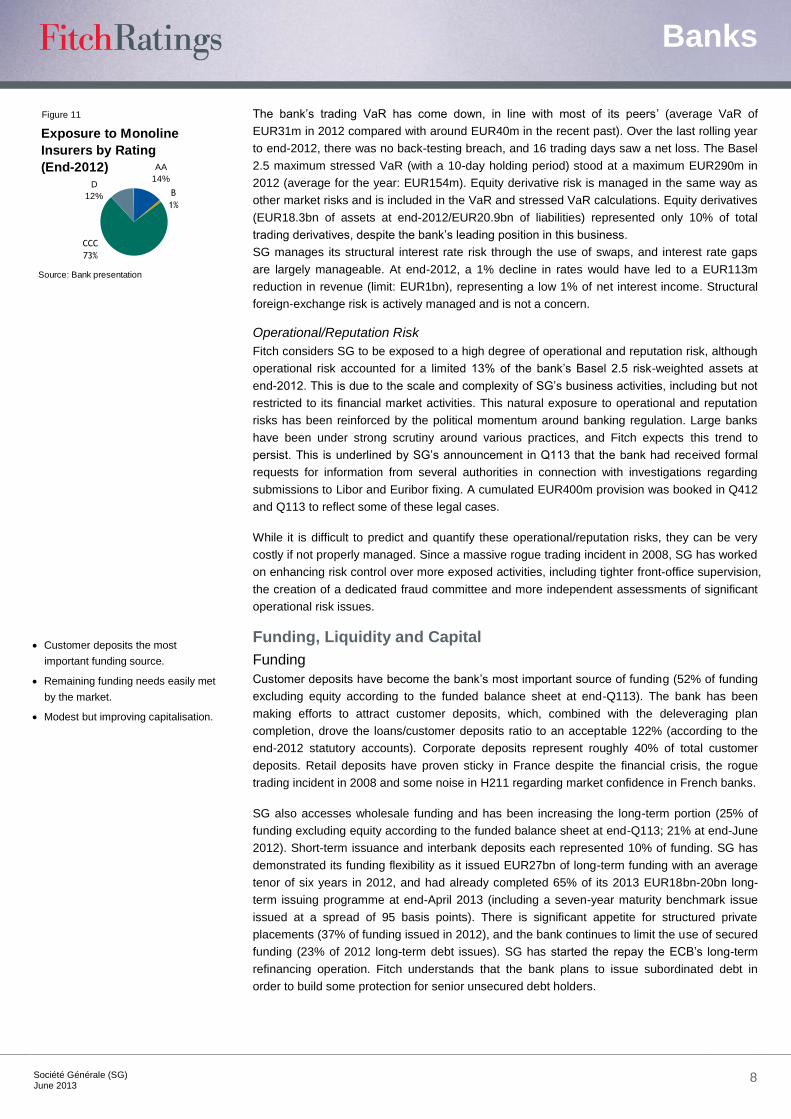
Part of the portfolio (EUR5.6bn) is hedged through monolines. Gross monoline exposure was
EUR1.7bn at end-Q113, representing the fair value of the insurance against the underlying
portfolio. After impairments, however, monoline exposure was only EUR0.5bn. Further
impairments may be needed, as SG is exposed to poorly rated monoline insurers (see Figure
11), but their size would remain largely manageable. The bank‟s net legacy asset exposure
(considering hedges in place) was EUR4.1bn at end-Q113, or roughly 15% of Fitch core capital,
in line with levels at French peers.
Market Risk
Market risk represented 9% of total risk-weighted assets at end-2012. SG assesses its market
risk using several risk indicators: value at risk (VaR; 99% confidence interval, one-day horizon),
stress tests (historical and hypothetical) and others (sensitivity, nominal value, concentration)
with limits in place. Limits are set by the board of directors, and implemented, controlled and
analysed by risk managers independently from the front office. Risks are analysed for all
business lines, with limits set according to the absorbable impact on income generation and the
level of capital employed. Market risks are calculated and limits monitored daily, while exposure
is monitored constantly.
Figure 10
CLOs
20%
Breakdown of Legacy
Assets (End-2012)
Source: Bank presentation
Other CDOs
11%
Other
30%
RMBS CDOs
20%
Corporate
bonds
5%
ABS
14%
Banks
Société Générale (SG)
June 2013 8
The bank‟s trading VaR has come down, in line with most of its peers‟ (average VaR of
EUR31m in 2012 compared with around EUR40m in the recent past). Over the last rolling year
to end-2012, there was no back-testing breach, and 16 trading days saw a net loss. The Basel
2.5 maximum stressed VaR (with a 10-day holding period) stood at a maximum EUR290m in
2012 (average for the year: EUR154m). Equity derivative risk is managed in the same way as
other market risks and is included in the VaR and stressed VaR calculations. Equity derivatives
(EUR18.3bn of assets at end-2012/EUR20.9bn of liabilities) represented only 10% of total
trading derivatives, despite the bank‟s leading position in this business.
SG manages its structural interest rate risk through the use of swaps, and interest rate gaps
are largely manageable. At end-2012, a 1% decline in rates would have led to a EUR113m
reduction in revenue (limit: EUR1bn), representing a low 1% of net interest income. Structural
foreign-exchange risk is actively managed and is not a concern.
Operational/Reputation Risk
Fitch considers SG to be exposed to a high degree of operational and reputation risk, although
operational risk accounted for a limited 13% of the bank‟s Basel 2.5 risk-weighted assets at
end-2012. This is due to the scale and complexity of SG‟s business activities, including but not
restricted to its financial market activities. This natural exposure to operational and reputation
risks has been reinforced by the political momentum around banking regulation. Large banks
have been under strong scrutiny around various practices, and Fitch expects this trend to
persist. This is underlined by SG‟s announcement in Q113 that the bank had received formal
requests for information from several authorities in connection with investigations regarding
submissions to Libor and Euribor fixing. A cumulated EUR400m provision was booked in Q412
and Q113 to reflect some of these legal cases.
While it is difficult to predict and quantify these operational/reputation risks, they can be very
costly if not properly managed. Since a massive rogue trading incident in 2008, SG has worked
on enhancing risk control over more exposed activities, including tighter front-office supervision,
the creation of a dedicated fraud committee and more independent assessments of significant
operational risk issues.
Funding, Liquidity and Capital
Funding
Customer deposits have become the bank‟s most important source of funding (52% of funding
excluding equity according to the funded balance sheet at end-Q113). The bank has been
making efforts to attract customer deposits, which, combined with the deleveraging plan
completion, drove the loans/customer deposits ratio to an acceptable 122% (according to the
end-2012 statutory accounts). Corporate deposits represent roughly 40% of total customer
deposits. Retail deposits have proven sticky in France despite the financial crisis, the rogue
trading incident in 2008 and some noise in H211 regarding market confidence in French banks.
SG also accesses wholesale funding and has been increasing the long-term portion (25% of
funding excluding equity according to the funded balance sheet at end-Q113; 21% at end-June
2012). Short-term issuance and interbank deposits each represented 10% of funding. SG has
demonstrated its funding flexibility as it issued EUR27bn of long-term funding with an average
tenor of six years in 2012, and had already completed 65% of its 2013 EUR18bn-20bn long-
term issuing programme at end-April 2013 (including a seven-year maturity benchmark issue
issued at a spread of 95 basis points). There is significant appetite for structured private
placements (37% of funding issued in 2012), and the bank continues to limit the use of secured
funding (23% of 2012 long-term debt issues). SG has started the repay the ECB‟s long-term
refinancing operation. Fitch understands that the bank plans to issue subordinated debt in
order to build some protection for senior unsecured debt holders.
Figure 11
CCC
73%
B
1%
Exposure to Monoline
Insurers by Rating
(End-2012)
Source: Bank presentation
AA
14%D
12%
Customer deposits the most
important funding source.
Remaining funding needs easily met
by the market.
Modest but improving capitalisation.
Banks
Société Générale (SG)
June 2013 9
SG manages its funded balance sheet in order to have excess stable (long-term and customer)
funding. Stable funding and equity exceeded customer loans, client-related trading assets and
fixed assets by EUR22bn at end-Q113. Derivative instruments match on the two sides of the
balance sheet, are not funded and do not require any liquidity management. Net funding to
international retail banking subsidiaries amounted to roughly EUR5bn (essentially Romania and
Russia). Funding to international specialised financial services subsidiaries is higher.
Liquidity
Liquidity management is centralised in the group‟s treasury department. SG follows regulatory
guidelines and internal stress scenarios. The bank manages its liquidity position to have
sufficient unencumbered assets available for repo (with the European Central Bank or with
other banks) to cover its short-term market funding. At end-Q113, SG‟s liquidity buffer
amounted to EUR135bn (end-2011: EUR84bn) and covered 108% of its short-term funding.
The bank‟s portfolio of ECB-repoable securities provides a material liquidity buffer in case of
stress, but this is not relied upon under normal conditions. Fitch views improved liquidity at SG
as a positive, but believes it needs to be viewed in the context of improvements at all GTUBs,
which usually have a larger buffer of liquid assets in relation to short-term funding than SG. SG
communicated that its Basel III liquidity coverage ratio was above 100% at end-April 2013.
SG has granted liquidity lines to two commercial conduits (with a combined EUR7bn of assets).
These are funded by commercial paper issues, none of which were purchased by SG.
Capital
Fitch considers SG‟s current capitalisation to be moderate considering the bank‟s very large
CIB activities, while its capital ratios are at the low end of the GTUB spectrum (9.5% Fitch core
capital ratio at end-2012). Nonetheless, Fitch views positively SG‟s significant progress in
boosting capital ratios, which were lower in the past, through deleveraging and earnings
retention, and expects the bank to gradually close the gap with its strongest peers.
SG is well on track to meet its close to 9.5% common equity Tier 1 target by end-2013. Its
estimated fully loaded Basel III common equity Tier 1 ratio was 8.7% at end-Q113. Fitch
incorporates in its ratings the assumption that SG will maintain its Fitch core capital ratio (post
Basel 3 risk-weighted asset migration) above 9%, given the bank‟s risk profile. As a global
systemically important bank according to the Financial Stability Board (FSB), SG will have to
comply with a 1% loss absorbency add-on to Basel III ratios (as per the FSB update in
November 2012).
SG‟s Fitch core capital ratio is lower than its regulatory Core Tier 1 ratio owing to the deduction
of the net asset value of the insurance subsidiary and deferred tax assets from Fitch core
capital.
Banks
Société Générale (SG)
June 2013 10
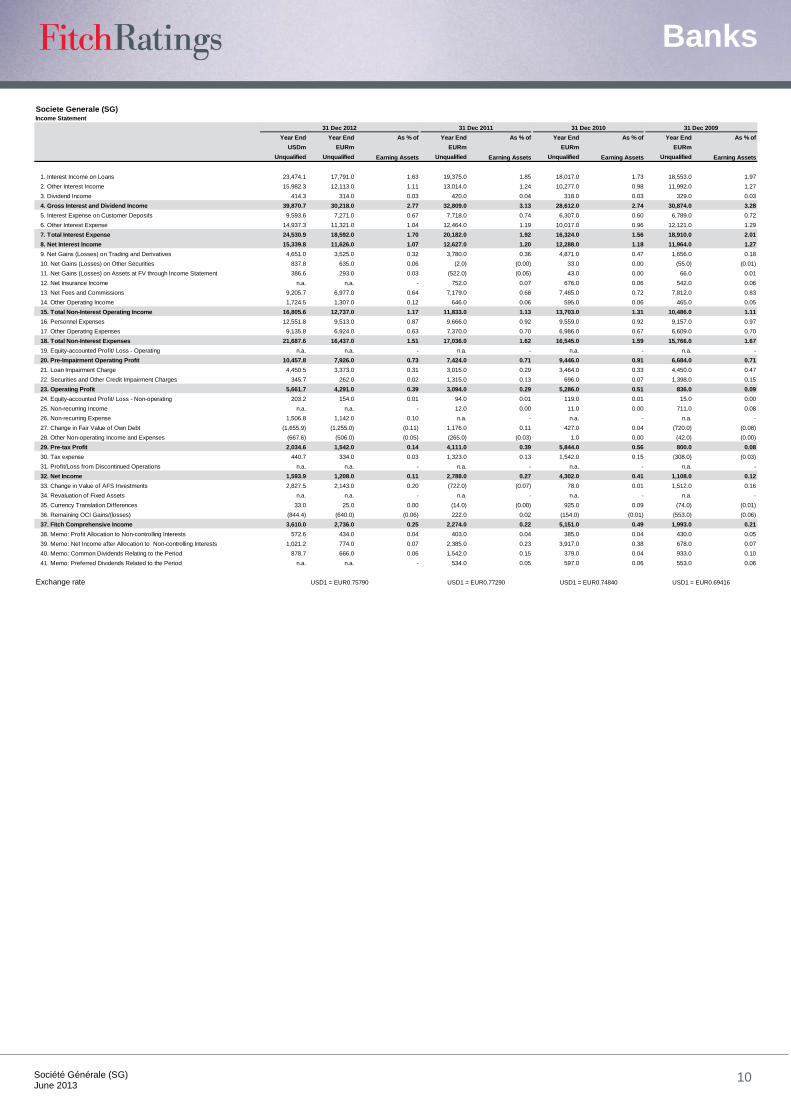
Societe Generale (SG)Income Statement
31 Dec 2012 31 Dec 2011 31 Dec 2010 31 Dec 2009
Year End Year End As % of Year End As % of Year End As % of Year End As % of
USDm EURm EURm EURm EURm
Unqualified Unqualified Unqualified Unqualified Unqualified
1. Interest Income on Loans 23,474.1 17,791.0 1.63 19,375.0 1.85 18,017.0 1.73 18,553.0 1.97
2. Other Interest Income 15,982.3 12,113.0 1.11 13,014.0 1.24 10,277.0 0.98 11,992.0 1.27
3. Dividend Income 414.3 314.0 0.03 420.0 0.04 318.0 0.03 329.0 0.03
4. Gross Interest and Dividend Income 39,870.7 30,218.0 2.77 32,809.0 3.13 28,612.0 2.74 30,874.0 3.28
5. Interest Expense on Customer Deposits 9,593.6 7,271.0 0.67 7,718.0 0.74 6,307.0 0.60 6,789.0 0.72
6. Other Interest Expense 14,937.3 11,321.0 1.04 12,464.0 1.19 10,017.0 0.96 12,121.0 1.29
7. Total Interest Expense 24,530.9 18,592.0 1.70 20,182.0 1.92 16,324.0 1.56 18,910.0 2.01
8. Net Interest Income 15,339.8 11,626.0 1.07 12,627.0 1.20 12,288.0 1.18 11,964.0 1.27
9. Net Gains (Losses) on Trading and Derivatives 4,651.0 3,525.0 0.32 3,780.0 0.36 4,871.0 0.47 1,656.0 0.18
10. Net Gains (Losses) on Other Securities 837.8 635.0 0.06 (2.0) (0.00) 33.0 0.00 (55.0) (0.01)
11. Net Gains (Losses) on Assets at FV through Income Statement 386.6 293.0 0.03 (522.0) (0.05) 43.0 0.00 66.0 0.01
12. Net Insurance Income n.a. n.a. - 752.0 0.07 676.0 0.06 542.0 0.06
13. Net Fees and Commissions 9,205.7 6,977.0 0.64 7,179.0 0.68 7,485.0 0.72 7,812.0 0.83
14. Other Operating Income 1,724.5 1,307.0 0.12 646.0 0.06 595.0 0.06 465.0 0.05
15. Total Non-Interest Operating Income 16,805.6 12,737.0 1.17 11,833.0 1.13 13,703.0 1.31 10,486.0 1.11
16. Personnel Expenses 12,551.8 9,513.0 0.87 9,666.0 0.92 9,559.0 0.92 9,157.0 0.97
17. Other Operating Expenses 9,135.8 6,924.0 0.63 7,370.0 0.70 6,986.0 0.67 6,609.0 0.70
18. Total Non-Interest Expenses 21,687.6 16,437.0 1.51 17,036.0 1.62 16,545.0 1.59 15,766.0 1.67
19. Equity-accounted Profit/ Loss - Operating n.a. n.a. - n.a. - n.a. - n.a. -
20. Pre-Impairment Operating Profit 10,457.8 7,926.0 0.73 7,424.0 0.71 9,446.0 0.91 6,684.0 0.71
21. Loan Impairment Charge 4,450.5 3,373.0 0.31 3,015.0 0.29 3,464.0 0.33 4,450.0 0.47
22. Securities and Other Credit Impairment Charges 345.7 262.0 0.02 1,315.0 0.13 696.0 0.07 1,398.0 0.15
23. Operating Profit 5,661.7 4,291.0 0.39 3,094.0 0.29 5,286.0 0.51 836.0 0.09
24. Equity-accounted Profit/ Loss - Non-operating 203.2 154.0 0.01 94.0 0.01 119.0 0.01 15.0 0.00
25. Non-recurring Income n.a. n.a. - 12.0 0.00 11.0 0.00 711.0 0.08
26. Non-recurring Expense 1,506.8 1,142.0 0.10 n.a. - n.a. - n.a. -
27. Change in Fair Value of Own Debt (1,655.9) (1,255.0) (0.11) 1,176.0 0.11 427.0 0.04 (720.0) (0.08)
28. Other Non-operating Income and Expenses (667.6) (506.0) (0.05) (265.0) (0.03) 1.0 0.00 (42.0) (0.00)
29. Pre-tax Profit 2,034.6 1,542.0 0.14 4,111.0 0.39 5,844.0 0.56 800.0 0.08
30. Tax expense 440.7 334.0 0.03 1,323.0 0.13 1,542.0 0.15 (308.0) (0.03)
31. Profit/Loss from Discontinued Operations n.a. n.a. - n.a. - n.a. - n.a. -
32. Net Income 1,593.9 1,208.0 0.11 2,788.0 0.27 4,302.0 0.41 1,108.0 0.12
33. Change in Value of AFS Investments 2,827.5 2,143.0 0.20 (722.0) (0.07) 78.0 0.01 1,512.0 0.16
34. Revaluation of Fixed Assets n.a. n.a. - n.a. - n.a. - n.a. -
35. Currency Translation Differences 33.0 25.0 0.00 (14.0) (0.00) 925.0 0.09 (74.0) (0.01)
36. Remaining OCI Gains/(losses) (844.4) (640.0) (0.06) 222.0 0.02 (154.0) (0.01) (553.0) (0.06)
37. Fitch Comprehensive Income 3,610.0 2,736.0 0.25 2,274.0 0.22 5,151.0 0.49 1,993.0 0.21
38. Memo: Profit Allocation to Non-controlling Interests 572.6 434.0 0.04 403.0 0.04 385.0 0.04 430.0 0.05
39. Memo: Net Income after Allocation to Non-controlling Interests 1,021.2 774.0 0.07 2,385.0 0.23 3,917.0 0.38 678.0 0.07
40. Memo: Common Dividends Relating to the Period 878.7 666.0 0.06 1,542.0 0.15 379.0 0.04 933.0 0.10
41. Memo: Preferred Dividends Related to the Period n.a. n.a. - 534.0 0.05 597.0 0.06 553.0 0.06
Exchange rate USD1 = EUR0.75790 USD1 = EUR0.77290 USD1 = EUR0.74840 USD1 = EUR0.69416
Earning Assets Earning Assets Earning Assets Earning Assets
Banks
Société Générale (SG)
June 2013 11
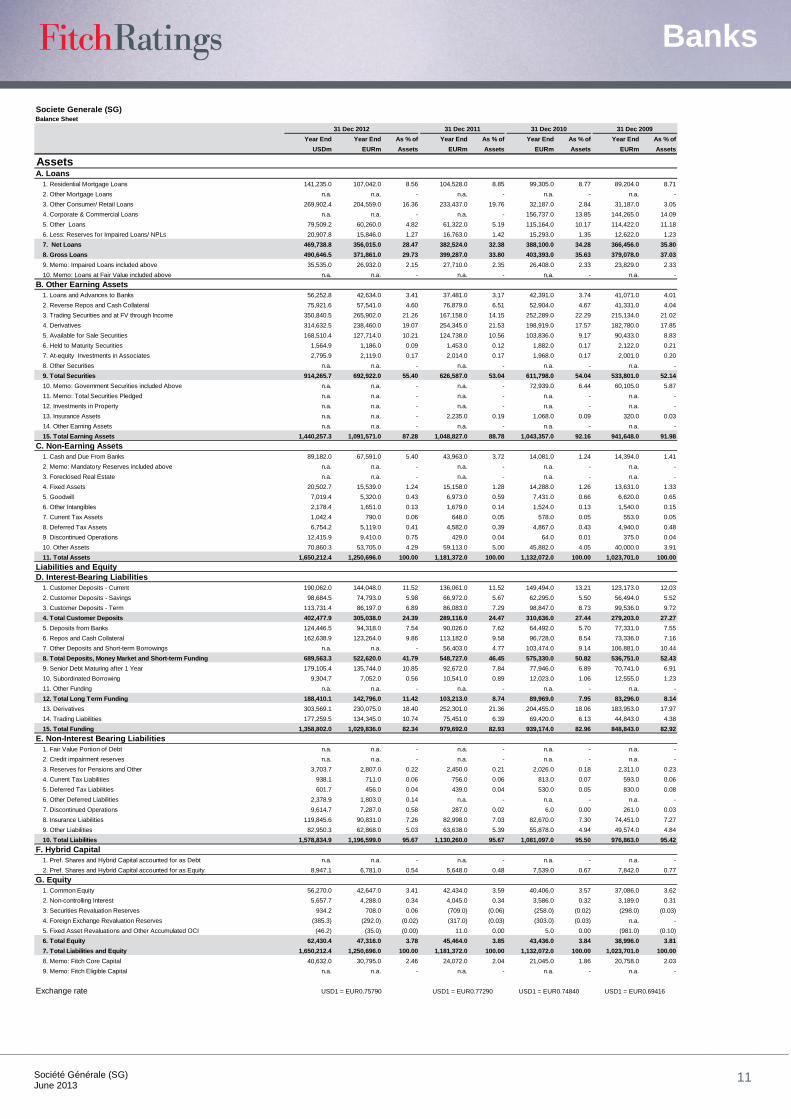
Societe Generale (SG)Balance Sheet
31 Dec 2012 31 Dec 2011 31 Dec 2010 31 Dec 2009
Year End Year End As % of Year End As % of Year End As % of Year End As % of
USDm EURm Assets EURm Assets EURm Assets EURm Assets
AssetsA. Loans
1. Residential Mortgage Loans 141,235.0 107,042.0 8.56 104,528.0 8.85 99,305.0 8.77 89,204.0 8.71
2. Other Mortgage Loans n.a. n.a. - n.a. - n.a. - n.a. -
3. Other Consumer/ Retail Loans 269,902.4 204,559.0 16.36 233,437.0 19.76 32,187.0 2.84 31,187.0 3.05
4. Corporate & Commercial Loans n.a. n.a. - n.a. - 156,737.0 13.85 144,265.0 14.09
5. Other Loans 79,509.2 60,260.0 4.82 61,322.0 5.19 115,164.0 10.17 114,422.0 11.18
6. Less: Reserves for Impaired Loans/ NPLs 20,907.8 15,846.0 1.27 16,763.0 1.42 15,293.0 1.35 12,622.0 1.23
7. Net Loans 469,738.8 356,015.0 28.47 382,524.0 32.38 388,100.0 34.28 366,456.0 35.80
8. Gross Loans 490,646.5 371,861.0 29.73 399,287.0 33.80 403,393.0 35.63 379,078.0 37.03
9. Memo: Impaired Loans included above 35,535.0 26,932.0 2.15 27,710.0 2.35 26,408.0 2.33 23,829.0 2.33
10. Memo: Loans at Fair Value included above n.a. n.a. - n.a. - n.a. - n.a. -
B. Other Earning Assets
1. Loans and Advances to Banks 56,252.8 42,634.0 3.41 37,481.0 3.17 42,391.0 3.74 41,071.0 4.01
2. Reverse Repos and Cash Collateral 75,921.6 57,541.0 4.60 76,879.0 6.51 52,904.0 4.67 41,331.0 4.04
3. Trading Securities and at FV through Income 350,840.5 265,902.0 21.26 167,158.0 14.15 252,289.0 22.29 215,134.0 21.02
4. Derivatives 314,632.5 238,460.0 19.07 254,345.0 21.53 198,919.0 17.57 182,780.0 17.85
5. Available for Sale Securities 168,510.4 127,714.0 10.21 124,738.0 10.56 103,836.0 9.17 90,433.0 8.83
6. Held to Maturity Securities 1,564.9 1,186.0 0.09 1,453.0 0.12 1,882.0 0.17 2,122.0 0.21
7. At-equity Investments in Associates 2,795.9 2,119.0 0.17 2,014.0 0.17 1,968.0 0.17 2,001.0 0.20
8. Other Securities n.a. n.a. - n.a. - n.a. - n.a. -
9. Total Securities 914,265.7 692,922.0 55.40 626,587.0 53.04 611,798.0 54.04 533,801.0 52.14
10. Memo: Government Securities included Above n.a. n.a. - n.a. - 72,939.0 6.44 60,105.0 5.87
11. Memo: Total Securities Pledged n.a. n.a. - n.a. - n.a. - n.a. -
12. Investments in Property n.a. n.a. - n.a. - n.a. - n.a. -
13. Insurance Assets n.a. n.a. - 2,235.0 0.19 1,068.0 0.09 320.0 0.03
14. Other Earning Assets n.a. n.a. - n.a. - n.a. - n.a. -
15. Total Earning Assets 1,440,257.3 1,091,571.0 87.28 1,048,827.0 88.78 1,043,357.0 92.16 941,648.0 91.98
C. Non-Earning Assets
1. Cash and Due From Banks 89,182.0 67,591.0 5.40 43,963.0 3.72 14,081.0 1.24 14,394.0 1.41
2. Memo: Mandatory Reserves included above n.a. n.a. - n.a. - n.a. - n.a. -
3. Foreclosed Real Estate n.a. n.a. - n.a. - n.a. - n.a. -
4. Fixed Assets 20,502.7 15,539.0 1.24 15,158.0 1.28 14,288.0 1.26 13,631.0 1.33
5. Goodwill 7,019.4 5,320.0 0.43 6,973.0 0.59 7,431.0 0.66 6,620.0 0.65
6. Other Intangibles 2,178.4 1,651.0 0.13 1,679.0 0.14 1,524.0 0.13 1,540.0 0.15
7. Current Tax Assets 1,042.4 790.0 0.06 648.0 0.05 578.0 0.05 553.0 0.05
8. Deferred Tax Assets 6,754.2 5,119.0 0.41 4,582.0 0.39 4,867.0 0.43 4,940.0 0.48
9. Discontinued Operations 12,415.9 9,410.0 0.75 429.0 0.04 64.0 0.01 375.0 0.04
10. Other Assets 70,860.3 53,705.0 4.29 59,113.0 5.00 45,882.0 4.05 40,000.0 3.91
11. Total Assets 1,650,212.4 1,250,696.0 100.00 1,181,372.0 100.00 1,132,072.0 100.00 1,023,701.0 100.00
Liabilities and Equity
D. Interest-Bearing Liabilities
1. Customer Deposits - Current 190,062.0 144,048.0 11.52 136,061.0 11.52 149,494.0 13.21 123,173.0 12.03
2. Customer Deposits - Savings 98,684.5 74,793.0 5.98 66,972.0 5.67 62,295.0 5.50 56,494.0 5.52
3. Customer Deposits - Term 113,731.4 86,197.0 6.89 86,083.0 7.29 98,847.0 8.73 99,536.0 9.72
4. Total Customer Deposits 402,477.9 305,038.0 24.39 289,116.0 24.47 310,636.0 27.44 279,203.0 27.27
5. Deposits from Banks 124,446.5 94,318.0 7.54 90,026.0 7.62 64,492.0 5.70 77,331.0 7.55
6. Repos and Cash Collateral 162,638.9 123,264.0 9.86 113,182.0 9.58 96,728.0 8.54 73,336.0 7.16
7. Other Deposits and Short-term Borrowings n.a. n.a. - 56,403.0 4.77 103,474.0 9.14 106,881.0 10.44
8. Total Deposits, Money Market and Short-term Funding 689,563.3 522,620.0 41.79 548,727.0 46.45 575,330.0 50.82 536,751.0 52.43
9. Senior Debt Maturing after 1 Year 179,105.4 135,744.0 10.85 92,672.0 7.84 77,946.0 6.89 70,741.0 6.91
10. Subordinated Borrowing 9,304.7 7,052.0 0.56 10,541.0 0.89 12,023.0 1.06 12,555.0 1.23
11. Other Funding n.a. n.a. - n.a. - n.a. - n.a. -
12. Total Long Term Funding 188,410.1 142,796.0 11.42 103,213.0 8.74 89,969.0 7.95 83,296.0 8.14
13. Derivatives 303,569.1 230,075.0 18.40 252,301.0 21.36 204,455.0 18.06 183,953.0 17.97
14. Trading Liabilities 177,259.5 134,345.0 10.74 75,451.0 6.39 69,420.0 6.13 44,843.0 4.38
15. Total Funding 1,358,802.0 1,029,836.0 82.34 979,692.0 82.93 939,174.0 82.96 848,843.0 82.92
E. Non-Interest Bearing Liabilities
1. Fair Value Portion of Debt n.a. n.a. - n.a. - n.a. - n.a. -
2. Credit impairment reserves n.a. n.a. - n.a. - n.a. - n.a. -
3. Reserves for Pensions and Other 3,703.7 2,807.0 0.22 2,450.0 0.21 2,026.0 0.18 2,311.0 0.23
4. Current Tax Liabilities 938.1 711.0 0.06 756.0 0.06 813.0 0.07 593.0 0.06
5. Deferred Tax Liabilities 601.7 456.0 0.04 439.0 0.04 530.0 0.05 830.0 0.08
6. Other Deferred Liabilities 2,378.9 1,803.0 0.14 n.a. - n.a. - n.a. -
7. Discontinued Operations 9,614.7 7,287.0 0.58 287.0 0.02 6.0 0.00 261.0 0.03
8. Insurance Liabilities 119,845.6 90,831.0 7.26 82,998.0 7.03 82,670.0 7.30 74,451.0 7.27
9. Other Liabilities 82,950.3 62,868.0 5.03 63,638.0 5.39 55,878.0 4.94 49,574.0 4.84
10. Total Liabilities 1,578,834.9 1,196,599.0 95.67 1,130,260.0 95.67 1,081,097.0 95.50 976,863.0 95.42
F. Hybrid Capital
1. Pref. Shares and Hybrid Capital accounted for as Debt n.a. n.a. - n.a. - n.a. - n.a. -
2. Pref. Shares and Hybrid Capital accounted for as Equity 8,947.1 6,781.0 0.54 5,648.0 0.48 7,539.0 0.67 7,842.0 0.77
G. Equity
1. Common Equity 56,270.0 42,647.0 3.41 42,434.0 3.59 40,406.0 3.57 37,086.0 3.62
2. Non-controlling Interest 5,657.7 4,288.0 0.34 4,045.0 0.34 3,586.0 0.32 3,189.0 0.31
3. Securities Revaluation Reserves 934.2 708.0 0.06 (709.0) (0.06) (258.0) (0.02) (298.0) (0.03)
4. Foreign Exchange Revaluation Reserves (385.3) (292.0) (0.02) (317.0) (0.03) (303.0) (0.03) n.a. -
5. Fixed Asset Revaluations and Other Accumulated OCI (46.2) (35.0) (0.00) 11.0 0.00 5.0 0.00 (981.0) (0.10)
6. Total Equity 62,430.4 47,316.0 3.78 45,464.0 3.85 43,436.0 3.84 38,996.0 3.81
7. Total Liabilities and Equity 1,650,212.4 1,250,696.0 100.00 1,181,372.0 100.00 1,132,072.0 100.00 1,023,701.0 100.00
8. Memo: Fitch Core Capital 40,632.0 30,795.0 2.46 24,072.0 2.04 21,045.0 1.86 20,758.0 2.03
9. Memo: Fitch Eligible Capital n.a. n.a. - n.a. - n.a. - n.a. -
Exchange rate USD1 = EUR0.75790 USD1 = EUR0.77290 USD1 = EUR0.74840 USD1 = EUR0.69416
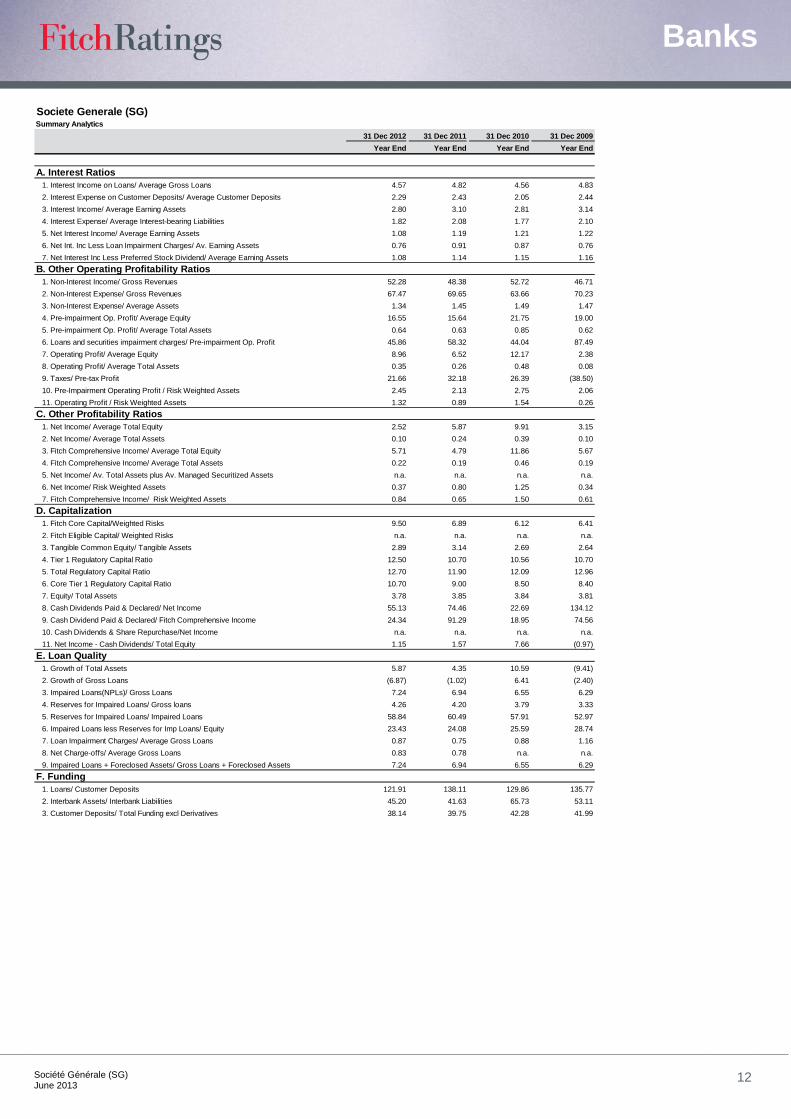
Banks
Société Générale (SG)
June 2013 12
Societe Generale (SG)Summary Analytics
31 Dec 2012 31 Dec 2011 31 Dec 2010 31 Dec 2009
Year End Year End Year End Year End
A. Interest Ratios
1. Interest Income on Loans/ Average Gross Loans 4.57 4.82 4.56 4.83
2. Interest Expense on Customer Deposits/ Average Customer Deposits 2.29 2.43 2.05 2.44
3. Interest Income/ Average Earning Assets 2.80 3.10 2.81 3.14
4. Interest Expense/ Average Interest-bearing Liabilities 1.82 2.08 1.77 2.10
5. Net Interest Income/ Average Earning Assets 1.08 1.19 1.21 1.22
6. Net Int. Inc Less Loan Impairment Charges/ Av. Earning Assets 0.76 0.91 0.87 0.76
7. Net Interest Inc Less Preferred Stock Dividend/ Average Earning Assets 1.08 1.14 1.15 1.16
B. Other Operating Profitability Ratios
1. Non-Interest Income/ Gross Revenues 52.28 48.38 52.72 46.71
2. Non-Interest Expense/ Gross Revenues 67.47 69.65 63.66 70.23
3. Non-Interest Expense/ Average Assets 1.34 1.45 1.49 1.47
4. Pre-impairment Op. Profit/ Average Equity 16.55 15.64 21.75 19.00
5. Pre-impairment Op. Profit/ Average Total Assets 0.64 0.63 0.85 0.62
6. Loans and securities impairment charges/ Pre-impairment Op. Profit 45.86 58.32 44.04 87.49
7. Operating Profit/ Average Equity 8.96 6.52 12.17 2.38
8. Operating Profit/ Average Total Assets 0.35 0.26 0.48 0.08
9. Taxes/ Pre-tax Profit 21.66 32.18 26.39 (38.50)
10. Pre-Impairment Operating Profit / Risk Weighted Assets 2.45 2.13 2.75 2.06
11. Operating Profit / Risk Weighted Assets 1.32 0.89 1.54 0.26
C. Other Profitability Ratios
1. Net Income/ Average Total Equity 2.52 5.87 9.91 3.15
2. Net Income/ Average Total Assets 0.10 0.24 0.39 0.10
3. Fitch Comprehensive Income/ Average Total Equity 5.71 4.79 11.86 5.67
4. Fitch Comprehensive Income/ Average Total Assets 0.22 0.19 0.46 0.19
5. Net Income/ Av. Total Assets plus Av. Managed Securitized Assets n.a. n.a. n.a. n.a.
6. Net Income/ Risk Weighted Assets 0.37 0.80 1.25 0.34
7. Fitch Comprehensive Income/ Risk Weighted Assets 0.84 0.65 1.50 0.61
D. Capitalization
1. Fitch Core Capital/Weighted Risks 9.50 6.89 6.12 6.41
2. Fitch Eligible Capital/ Weighted Risks n.a. n.a. n.a. n.a.
3. Tangible Common Equity/ Tangible Assets 2.89 3.14 2.69 2.64
4. Tier 1 Regulatory Capital Ratio 12.50 10.70 10.56 10.70
5. Total Regulatory Capital Ratio 12.70 11.90 12.09 12.96
6. Core Tier 1 Regulatory Capital Ratio 10.70 9.00 8.50 8.40
7. Equity/ Total Assets 3.78 3.85 3.84 3.81
8. Cash Dividends Paid & Declared/ Net Income 55.13 74.46 22.69 134.12
9. Cash Dividend Paid & Declared/ Fitch Comprehensive Income 24.34 91.29 18.95 74.56
10. Cash Dividends & Share Repurchase/Net Income n.a. n.a. n.a. n.a.
11. Net Income - Cash Dividends/ Total Equity 1.15 1.57 7.66 (0.97)
E. Loan Quality
1. Growth of Total Assets 5.87 4.35 10.59 (9.41)
2. Growth of Gross Loans (6.87) (1.02) 6.41 (2.40)
3. Impaired Loans(NPLs)/ Gross Loans 7.24 6.94 6.55 6.29
4. Reserves for Impaired Loans/ Gross loans 4.26 4.20 3.79 3.33
5. Reserves for Impaired Loans/ Impaired Loans 58.84 60.49 57.91 52.97
6. Impaired Loans less Reserves for Imp Loans/ Equity 23.43 24.08 25.59 28.74
7. Loan Impairment Charges/ Average Gross Loans 0.87 0.75 0.88 1.16
8. Net Charge-offs/ Average Gross Loans 0.83 0.78 n.a. n.a.
9. Impaired Loans + Foreclosed Assets/ Gross Loans + Foreclosed Assets 7.24 6.94 6.55 6.29
F. Funding
1. Loans/ Customer Deposits 121.91 138.11 129.86 135.77
2. Interbank Assets/ Interbank Liabilities 45.20 41.63 65.73 53.11
3. Customer Deposits/ Total Funding excl Derivatives 38.14 39.75 42.28 41.99
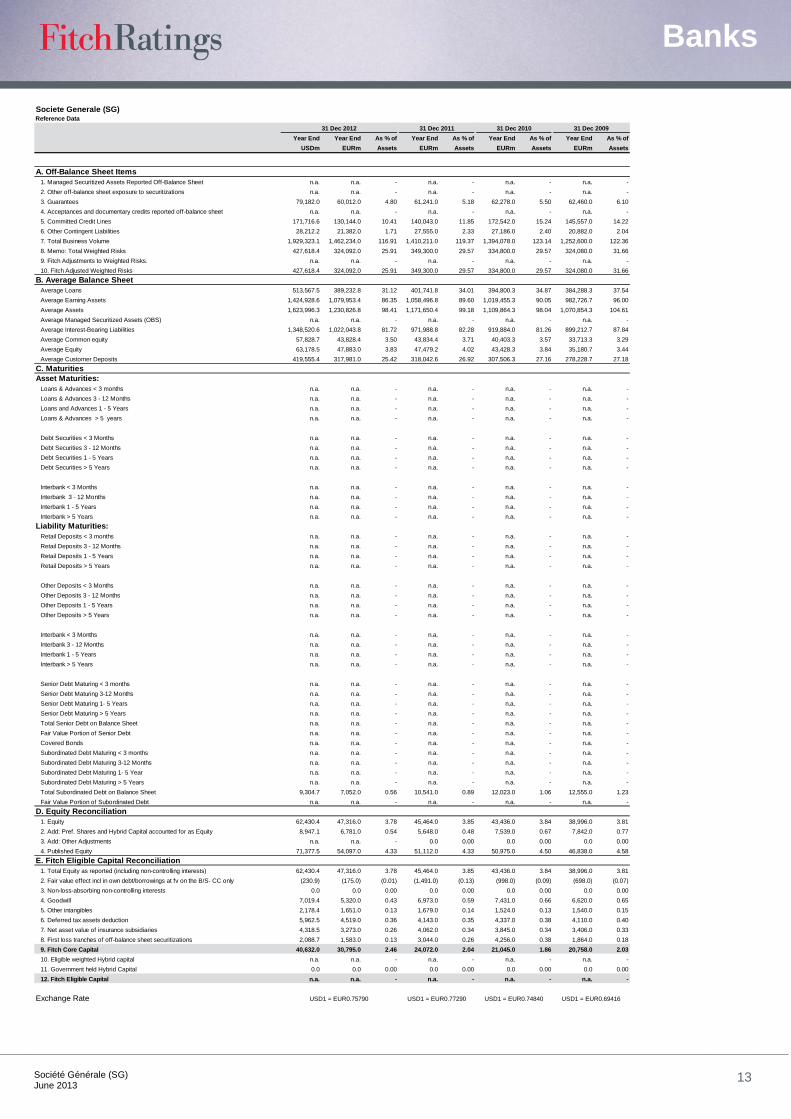
Banks
Société Générale (SG)
June 2013 13
Societe Generale (SG)Reference Data
31 Dec 2012 31 Dec 2011 31 Dec 2010 31 Dec 2009
Year End Year End As % of Year End As % of Year End As % of Year End As % of
USDm EURm Assets EURm Assets EURm Assets EURm Assets
A. Off-Balance Sheet Items
1. Managed Securitized Assets Reported Off-Balance Sheet n.a. n.a. - n.a. - n.a. - n.a. -
2. Other off-balance sheet exposure to securitizations n.a. n.a. - n.a. - n.a. - n.a. -
3. Guarantees 79,182.0 60,012.0 4.80 61,241.0 5.18 62,278.0 5.50 62,460.0 6.10
4. Acceptances and documentary credits reported off-balance sheet n.a. n.a. - n.a. - n.a. - n.a. -
5. Committed Credit Lines 171,716.6 130,144.0 10.41 140,043.0 11.85 172,542.0 15.24 145,557.0 14.22
6. Other Contingent Liabilities 28,212.2 21,382.0 1.71 27,555.0 2.33 27,186.0 2.40 20,882.0 2.04
7. Total Business Volume 1,929,323.1 1,462,234.0 116.91 1,410,211.0 119.37 1,394,078.0 123.14 1,252,600.0 122.36
8. Memo: Total Weighted Risks 427,618.4 324,092.0 25.91 349,300.0 29.57 334,800.0 29.57 324,080.0 31.66
9. Fitch Adjustments to Weighted Risks. n.a. n.a. - n.a. - n.a. - n.a. -
10. Fitch Adjusted Weighted Risks 427,618.4 324,092.0 25.91 349,300.0 29.57 334,800.0 29.57 324,080.0 31.66
B. Average Balance Sheet
Average Loans 513,567.5 389,232.8 31.12 401,741.8 34.01 394,800.3 34.87 384,288.3 37.54
Average Earning Assets 1,424,928.6 1,079,953.4 86.35 1,058,496.8 89.60 1,019,455.3 90.05 982,726.7 96.00
Average Assets 1,623,996.3 1,230,826.8 98.41 1,171,650.4 99.18 1,109,864.3 98.04 1,070,854.3 104.61
Average Managed Securitized Assets (OBS) n.a. n.a. - n.a. - n.a. - n.a. -
Average Interest-Bearing Liabilities 1,348,520.6 1,022,043.8 81.72 971,988.8 82.28 919,884.0 81.26 899,212.7 87.84
Average Common equity 57,828.7 43,828.4 3.50 43,834.4 3.71 40,403.3 3.57 33,713.3 3.29
Average Equity 63,178.5 47,883.0 3.83 47,479.2 4.02 43,428.3 3.84 35,180.7 3.44
Average Customer Deposits 419,555.4 317,981.0 25.42 318,042.6 26.92 307,506.3 27.16 278,228.7 27.18
C. Maturities
Asset Maturities:
Loans & Advances < 3 months n.a. n.a. - n.a. - n.a. - n.a. -
Loans & Advances 3 - 12 Months n.a. n.a. - n.a. - n.a. - n.a. -
Loans and Advances 1 - 5 Years n.a. n.a. - n.a. - n.a. - n.a. -
Loans & Advances > 5 years n.a. n.a. - n.a. - n.a. - n.a. -
Debt Securities < 3 Months n.a. n.a. - n.a. - n.a. - n.a. -
Debt Securities 3 - 12 Months n.a. n.a. - n.a. - n.a. - n.a. -
Debt Securities 1 - 5 Years n.a. n.a. - n.a. - n.a. - n.a. -
Debt Securities > 5 Years n.a. n.a. - n.a. - n.a. - n.a. -
Interbank < 3 Months n.a. n.a. - n.a. - n.a. - n.a. -
Interbank 3 - 12 Months n.a. n.a. - n.a. - n.a. - n.a. -
Interbank 1 - 5 Years n.a. n.a. - n.a. - n.a. - n.a. -
Interbank > 5 Years n.a. n.a. - n.a. - n.a. - n.a. -
Liability Maturities:
Retail Deposits < 3 months n.a. n.a. - n.a. - n.a. - n.a. -
Retail Deposits 3 - 12 Months n.a. n.a. - n.a. - n.a. - n.a. -
Retail Deposits 1 - 5 Years n.a. n.a. - n.a. - n.a. - n.a. -
Retail Deposits > 5 Years n.a. n.a. - n.a. - n.a. - n.a. -
Other Deposits < 3 Months n.a. n.a. - n.a. - n.a. - n.a. -
Other Deposits 3 - 12 Months n.a. n.a. - n.a. - n.a. - n.a. -
Other Deposits 1 - 5 Years n.a. n.a. - n.a. - n.a. - n.a. -
Other Deposits > 5 Years n.a. n.a. - n.a. - n.a. - n.a. -
Interbank < 3 Months n.a. n.a. - n.a. - n.a. - n.a. -
Interbank 3 - 12 Months n.a. n.a. - n.a. - n.a. - n.a. -
Interbank 1 - 5 Years n.a. n.a. - n.a. - n.a. - n.a. -
Interbank > 5 Years n.a. n.a. - n.a. - n.a. - n.a. -
Senior Debt Maturing < 3 months n.a. n.a. - n.a. - n.a. - n.a. -
Senior Debt Maturing 3-12 Months n.a. n.a. - n.a. - n.a. - n.a. -
Senior Debt Maturing 1- 5 Years n.a. n.a. - n.a. - n.a. - n.a. -
Senior Debt Maturing > 5 Years n.a. n.a. - n.a. - n.a. - n.a. -
Total Senior Debt on Balance Sheet n.a. n.a. - n.a. - n.a. - n.a. -
Fair Value Portion of Senior Debt n.a. n.a. - n.a. - n.a. - n.a. -
Covered Bonds n.a. n.a. - n.a. - n.a. - n.a. -
Subordinated Debt Maturing < 3 months n.a. n.a. - n.a. - n.a. - n.a. -
Subordinated Debt Maturing 3-12 Months n.a. n.a. - n.a. - n.a. - n.a. -
Subordinated Debt Maturing 1- 5 Year n.a. n.a. - n.a. - n.a. - n.a. -
Subordinated Debt Maturing > 5 Years n.a. n.a. - n.a. - n.a. - n.a. -
Total Subordinated Debt on Balance Sheet 9,304.7 7,052.0 0.56 10,541.0 0.89 12,023.0 1.06 12,555.0 1.23
Fair Value Portion of Subordinated Debt n.a. n.a. - n.a. - n.a. - n.a. -
D. Equity Reconciliation
1. Equity 62,430.4 47,316.0 3.78 45,464.0 3.85 43,436.0 3.84 38,996.0 3.81
2. Add: Pref. Shares and Hybrid Capital accounted for as Equity 8,947.1 6,781.0 0.54 5,648.0 0.48 7,539.0 0.67 7,842.0 0.77
3. Add: Other Adjustments n.a. n.a. - 0.0 0.00 0.0 0.00 0.0 0.00
4. Published Equity 71,377.5 54,097.0 4.33 51,112.0 4.33 50,975.0 4.50 46,838.0 4.58
E. Fitch Eligible Capital Reconciliation
1. Total Equity as reported (including non-controlling interests) 62,430.4 47,316.0 3.78 45,464.0 3.85 43,436.0 3.84 38,996.0 3.81
2. Fair value effect incl in own debt/borrowings at fv on the B/S- CC only (230.9) (175.0) (0.01) (1,491.0) (0.13) (998.0) (0.09) (698.0) (0.07)
3. Non-loss-absorbing non-controlling interests 0.0 0.0 0.00 0.0 0.00 0.0 0.00 0.0 0.00
4. Goodwill 7,019.4 5,320.0 0.43 6,973.0 0.59 7,431.0 0.66 6,620.0 0.65
5. Other intangibles 2,178.4 1,651.0 0.13 1,679.0 0.14 1,524.0 0.13 1,540.0 0.15
6. Deferred tax assets deduction 5,962.5 4,519.0 0.36 4,143.0 0.35 4,337.0 0.38 4,110.0 0.40
7. Net asset value of insurance subsidiaries 4,318.5 3,273.0 0.26 4,062.0 0.34 3,845.0 0.34 3,406.0 0.33
8. First loss tranches of off-balance sheet securitizations 2,088.7 1,583.0 0.13 3,044.0 0.26 4,256.0 0.38 1,864.0 0.18
9. Fitch Core Capital 40,632.0 30,795.0 2.46 24,072.0 2.04 21,045.0 1.86 20,758.0 2.03
10. Eligible weighted Hybrid capital n.a. n.a. - n.a. - n.a. - n.a. -
11. Government held Hybrid Capital 0.0 0.0 0.00 0.0 0.00 0.0 0.00 0.0 0.00
12. Fitch Eligible Capital n.a. n.a. - n.a. - n.a. - n.a. -
Exchange Rate USD1 = EUR0.75790 USD1 = EUR0.77290 USD1 = EUR0.74840 USD1 = EUR0.69416
Banks
Société Générale (SG)
June 2013 14
ALL FITCH CREDIT RATINGS ARE SUBJECT TO CERTAIN LIMITATIONS AND DISCLAIMERS. PLEASE READ THESE LIMITATIONS AND DISCLAIMERS BY FOLLOWING THIS LINK: HTTP://FITCHRATINGS.COM/UNDERSTANDINGCREDITRATINGS. IN ADDITION, RATING DEFINITIONS AND THE TERMS OF USE OF SUCH RATINGS ARE AVAILABLE ON THE AGENCY'S PUBLIC WEB SITE AT WWW.FITCHRATINGS.COM. PUBLISHED RATINGS, CRITERIA, AND METHODOLOGIES ARE AVAILABLE FROM THIS SITE AT ALL TIMES. FITCH'S CODE OF CONDUCT, CONFIDENTIALITY, CONFLICTS OF INTEREST, AFFILIATE FIREWALL, COMPLIANCE, AND OTHER RELEVANT POLICIES AND PROCEDURES ARE ALSO AVAILABLE FROM THE CODE OF CONDUCT SECTION OF THIS SITE. FITCH MAY HAVE PROVIDED ANOTHER PERMISSIBLE SERVICE TO THE RATED ENTITY OR ITS RELATED THIRD PARTIES. DETAILS OF THIS SERVICE FOR RATINGS FOR WHICH THE LEAD ANALYST IS BASED IN AN EU-REGISTERED ENTITY CAN BE FOUND ON THE ENTITY SUMMARY PAGE FOR THIS ISSUER ON THE FITCH WEBSITE.
Copyright © 2013 by Fitch, Inc., Fitch Ratings Ltd. and its subsidiaries. One State Street Plaza, NY, NY 10004.Telephone: 1-800-753-4824, (212) 908-0500. Fax: (212) 480-4435. Reproduction or retransmission in whole or in part is prohibited except by permission. All rights reserved. In issuing and maintaining its ratings, Fitch relies on factual information it receives from issuers and underwriters and from other sources Fitch believes to be credible. Fitch conducts a reasonable investigation of the factual information relied upon by it in accordance with its ratings methodology, and obtains reasonable verification of that information from independent sources, to the extent such sources are available for a given security or in a given jurisdiction. The manner of Fitch‟s factual investigation and the scope of the third-party verification it obtains will vary depending on the nature of the rated security and its issuer, the requirements and practices in the jurisdiction in which the rated security is offered and sold and/or the issuer is located, the availability and nature of relevant public information, access to the management of the issuer and its advisers, the availability of pre-existing third-party verifications such as audit reports, agreed-upon procedures letters, appraisals, actuarial reports, engineering reports, legal opinions and other reports provided by third parties, the availability of independent and competent third-party verification sources with respect to the particular security or in the particular jurisdiction of the issuer, and a variety of other factors. Users of Fitch‟s ratings should understand that neither an enhanced factual investigation nor any third-party verification can ensure that all of the information Fitch relies on in connection with a rating will be accurate and complete. Ultimately, the issuer and its advisers are responsible for the accuracy of the information they provide to Fitch and to the market in offering documents and other reports. In issuing its ratings Fitch must rely on the work of experts, including independent auditors with respect to financial statements and attorneys with respect to legal and tax matters. Further, ratings are inherently forward-looking and embody assumptions and predictions about future events that by their nature cannot be verified as facts. As a result, despite any verification of current facts, ratings can be affected by future events or conditions that were not anticipated at the time a rating was issued or affirmed.
The information in this report is provided “as is” without any representation or warranty of any kind. A F itch rating is an opinion as to the creditworthiness of a security. This opinion is based on established criteria and methodologies that Fitch is continuously evaluating and updating. Therefore, ratings are the collective work product of Fitch and no individual, or group of individuals, is solely responsible for a rating. The rating does not address the risk of loss due to risks other than credit risk, unless such risk is specifically mentioned. Fitch is not engaged in the offer or sale of any security. All Fitch reports have shared authorship. Individuals identified in a Fitch report were involved in, but are not solely responsible for, the opinions stated therein. The individuals are named for contact purposes only. A report providing a Fitch rating is neither a prospectus nor a substitute for the information assembled, verified and presented to investors by the issuer and its agents in connection with the sale of the securities. Ratings may be changed or withdrawn at anytime for any reason in the sole discretion of Fitch. Fitch does not provide investment advice of any sort. Ratings are not a recommendation to buy, sell, or hold any security. Ratings do not comment on the adequacy of market price, the suitability of any security for a particular investor, or the tax-exempt nature or taxability of payments made in respect to any security. Fitch receives fees from issuers, insurers, guarantors, other obligors, and underwriters for rating securities. Such fees generally vary from US$1,000 to US$750,000 (or the applicable currency equivalent) per issue. In certain cases, Fitch will rate all or a number of issues issued by a particular issuer, or insured or guaranteed by a particular insurer or guarantor, for a single annual fee. Such fees are expected to vary from US$10,000 to US$1,500,000 (or the applicable currency equivalent). The assignment, publication, or dissemination of a rating by Fitch shall not constitute a consent by Fitch to use its name as an expert in connection with any registration statement filed under the United States securities laws, the Financial Services and Markets Act 2000 of the United Kingdom, or the securities laws of any particular jurisdiction. Due to the relative efficiency of electronic publishing and distribution, Fi tch research may be available to electronic subscribers up to three days earlier than to print subscribers.
The ratings above were solicited by, or on behalf of, the issuer, and therefore,
Fitch has been compensated for the provision of the ratings.
Rating Report
Report Date:
26 July 2013
Previous Report:
19 March 2012
1 Financial Institutions: Banks & Trusts
Analysts
Roger Lister
+44 20 7855 6631
Vitaline Vincent
+44 20 7855 6623
Media Contact
Stephen Bernard
+1 212 806 3240
The Company
With EUR 1.25 trillion of
assets at the end of
December 2012, Société
Générale employed over
154,000 staff in 76
countries. The bank enjoys
broadly diversified
activities in retail banking,
in France and throughout
Europe, including Eastern
Europe, in corporate
banking and investment
banking, asset
management, securities
services, specialised
financing and insurance.
Recent Actions
30 May 2013
DBRS Initiates Ratings for
Société Générale, S.A. – Sr
Long-Term Debt at AA
(low); Negative Trend
15 December, 2011
DBRS Confirms Société
Générale (Canada) &
(Canada Branch) S-T
Ratings at R-1 (middle),
Trend Stable
Société Générale S.A.
Ratings
Issuer Debt Rated Rating Trend
Société Générale S.A. Senior Unsecured Debt & Deposits AA (low) Negative
Société Générale S.A. Short-term Debt & Deposits R-1 (middle) Stable
Société Générale (Canada) Senior Unsecured Debt and Deposits AA (low) Negative
Société Générale (Canada) Short-Term Instruments R-1 (middle) Stable
Société Générale (Canada Branch) Senior Unsecured Debt and Deposits AA (low) Negative
Société Générale (Canada Branch) Short-Term Instruments R-1 (middle) Stable
For a complete list of ratings, see page 20
Rating Rationale
On May 30, 2013, DBRS, Inc. (DBRS) initiated ratings for Société Générale, S.A. (SocGen, SG or the
Group). DBRS assigned to SocGen a Senior Unsecured Debt & Deposit rating of AA (low) with a Negative
Trend and a Short-Term Debt & Deposit rating of R-1 (middle) with a Stable Trend. At the same time, DBRS
confirmed the Group’s intrinsic assessment (IA) of A (high). For Société Générale (Canada) and Société
Générale (Canada Branch), DBRS confirmed the Short-Term Instruments rating of R-1 (middle) with a
Stable trend and assigned a Senior Unsecured Debt & Deposit rating of AA (low) with a Negative Trend.
Société Générale owns 100% of the shares of SocGen Canada and guarantees the rated debt instruments of
these Canadian entities.
(Continued on page 2)
Rating Considerations
Strengths
(1) Well-positioned with consumers and businesses in
domestic retail banking in France
(2) Enhanced diversity via international expansion in
retail banking and financial services
(3) Substantial corporate and investment bank based on
key capabilities and Group strengths
(4) Financial strength underpinned by franchise
strengths and earnings diversity
Challenges
(5) Achieving cost reductions and delivering
improved operating efficiency
(6) Generating more earnings from international
businesses in difficult environment
(7) Further enhancing financial strength given
market and regulatory uncertainties
(8) Making more progress with strengthening its
capital and streamlining its risk profile
Financial Information
Source: SNL Financial, Company Reports, DBRS
EUR Millions 31/12/2012 31/12/2011 31/12/2010 31/12/2009 31/12/2008
Total Assets 1,250,696 1,181,372 1,132,072 1,023,701 1,130,003
Equity 54,097 51,112 50,975 46,838 40,887
Pre-provision operating income (IBPT) 7,024 8,992 10,213 7,875 7,087
Net Income 774 2,385 3,917 678 2,010
Net Interest Income / Risk Weighted Assets (%) 3.49% 3.49% 3.58% 3.59% 2.30%
Risk-Weighted Earning Capacity (%) 2.06% 2.68% 3.10% 2.36% 2.11%
Post-provision Risk-Weighted Earning Capacity (%) 0.85% 1.56% 1.77% 0.07% 1.10%
Efficiency Ratio (%) 70.06% 65.47% 61.83% 66.56% 68.63%
Impaired Loans % Gross Loans 6.82% 6.70% 6.34% 6.16% 3.74%
Core Tier 1 (As-reported) 10.70% 9.00% 8.50% 8.40% 6.70%
2 Financial Institutions: Banks & Trusts
Société
Générale S.A.
Report Date:
26 July 2013
Rating Rationale (Continued from page 1)
DBRS notes that these ratings take into account SG’s systemic importance in France and DBRS’s expectation
of some form of timely systemic support for SG in the event of a stress scenario, resulting in the Group’s
designation as a systemically important bank (SIB) with an SA2 support assessment. This designation results
in a one-notch uplift from the IA of A (high) to the final rating of AA (low).
The Negative Trend reflects the downside risks inherent in the economic slowdown and still stressed
financial markets, combined with the challenges the Group faces in improving its operating efficiency and
increasing its earnings, making more effective use of its balance sheet, and increasing the rewards from its
international operations relative to its risks, while also coping with regulatory and legislative uncertainty.
In assigning an IA of A (high), DBRS considers SocGen’s strengths that have enabled it to cope with the
sustained crisis. The Group benefits from its strong position in retail banking in France, its focused strengths
in corporate and investment banking, the scope of its international retail banking operations, and its diverse
financial services businesses. In adjusting to the difficult market conditions and more demanding regulatory
requirements, the Group has proved its ability to cope with a challenging environment. After reduced access
to unsecured wholesale funding in 2011, the Group improved its funding structure and reinforced its capital
cushion through accelerated balance sheet adjustment in 2012. Continued progress with expense control,
balance sheet management and franchise development are important to enhance the Group’s resiliency in this
uncertain environment.
Demonstrating the strength of the Group’s franchise and its underlying revenue generation capabilities, which
are key factors for SG’s intrinsic strength, the Group has sustained its earnings, with some volatility, during
this prolonged crisis, even as it absorbed the drag of its legacy assets (2009-2012), the costs of its sovereign
exposures (2011-2012), the sale of its struggling Greek subsidiary (2012), goodwill impairments (2012) and
the deleveraging in its CIB (2012). Indicative of this strength, Group net income, excluding the revaluation of
the Group’s own financial liabilities, was EUR 1.6 billion in 2012, largely unchanged from 2011. While
underlying earnings continue to show resiliency, DBRS sees SG as still exposed to a weakening in the
recovery in Europe and the ongoing fragile capital markets.
DBRS considers the Group’s strong position in retail banking in France as an important underpinning of its
intrinsic strength. Delivering relatively stable earnings with a low cost of risk, the French Networks (FN),
which operate primarily under the well-positioned brands of Société Générale and Crédit du Nord, typically
generate about a third of earnings. To improve earnings, SG is engaged in a cost reduction program, which
DBRS views as essential to sustain earnings in the current environment. Generally the second largest
contributor to SG’s earnings, albeit with more volatility, is the Corporate and Investment Bank (CIB). CIB is
another core component of SG’s universal banking franchise that has an extensive international presence in
more than 34 countries. To economise on balance sheet usage and improve the CIB’s risk profile, the Group
is emphasizing flow business. In DRBS’s view, SG has worked to refocus the CIB on its core strengths across
its customer franchise and product capabilities to enhance returns and reduce earnings volatility.
DBRS views the SG’s International Retail Bank (IRB) as providing an important avenue for growth, although
IRB’s current contribution to Group net income is modest and it has contributed to earnings volatility. The
IRB’s diversified presence across various regions enhances earnings resiliency and leverages SG’s
international capabilities in operating in countries that are at various stages of economic development and
financial market sophistication including Central and Eastern Europe, Russia and North Africa. While
manageable individually, these businesses can incur material losses, if a country suffers significant
deterioration as occurred in Greece. DBRS sees SG’s two other business segments, Specialised Financial
Services & Insurance (SFSI) and Private Banking, Global Investment Management & Services (PB, GIMS),
as enhancing the Group’s ability to meet certain product needs across the franchise and extend its geographic
reach beyond its IRB operations. SFSI has particular strength in Vehicle Leasing and Fleet Finance,
Equipment Finance, Consumer Finance and Insurance. The PB, GIMS segment makes a smaller contribution
3 Financial Institutions: Banks & Trusts
Société
Générale S.A.
Report Date:
26 July 2013
to net income, but also provides important adjuncts to SG’s core business segments. Across its operations, SG
is seeking to enhance contribution of its businesses through more effective collaboration between business
segments.
SG’s funding profile combines a sizeable, stable deposit base underpinned by its domestic retail banking
franchises with significant usage of wholesale funding that is typical of universal banks with significant
corporate and investment banking activities. The Group’s franchise strength and adaptability have enabled it
to adjust to the stress on its funding, particularly the stress on short-term U.S. dollar funding faced by French
banks in 2011. DBRS views positively that SG has improved its liquidity position with a sizeable excess of
stable funding and a maximum for short-term funding of 20% of its balance sheet. The Group is complying
with impending short-term regulatory requirements with an LCR ratio above 100% at 1Q13. Appropriately,
SG has put more emphasis on aligning its funding profile with the assets being funded and utilising incentives
to drive more efficient use of the Group’s balance sheet and liquidity by its business units.
Also factored into the IA is SG’s risk profile, which combines the low risk portfolios in its domestic
businesses with smaller but higher risk portfolios, principally in the IRB. The low risk portfolios, which
comprise the majority of the credit exposures, are generally matched by low yields that provide limited
cushions to absorb any spike in credit costs, though this is not currently anticipated in France. While higher
yields are expected to compensate for the higher risk in the IRB businesses, DRBS also factors in the
potential for rapid deterioration and unforeseen events, such as what happened in Greece (sold in 4Q12),
which can cause credit deterioration to significantly exceed such earnings. Given the economic weakness and
political uncertainty across its IRB operations, DBRS sees SG as focused on strengthening its risk position.
While the cost of risk is highest in the IRB, the Group’s overall doubtful loan ratio was relatively modest at
4.2% at 1Q13 with a coverage ratio of 71%. Exposures to legacy assets and EU peripheral bonds have been
much reduced. Market risk contributes only about 9% of regulatory risk weighted assets (RWA), as SG has
scaled back its activities that incur market risk with its focus on flow business and less retention of risk. With
experience gained from the market turmoil, DBRS views SG’s control of these risks across the Group as
having been reinforced.
Given SG’s continued progress with strengthening its capital and streamlining its risk profile, DBRS views
the Group’s capitalization levels as satisfactory. Under Basel 2.5, SG’s Core Tier 1 ratio was 10.6% at 1Q13,
up from 9.0% at end-2011. The Group anticipates it will reach a Core Tier 1 ratio of close to 9.5% by year-
end under Basel III fully loaded. At 1Q13, core Tier 1 Ratio under Basel III fully loaded was 8.7%.
Support Assessment (SA)
As one of France’s leading banks, SG is viewed as systemically important by DBRS. Therefore, the ratings
incorporate DBRS’s expectation of some form of timely systemic support for the Group in the event of a
highly stressed scenario. DBRS’s expectation of timely systemic support in case of need underpins an SA2
Support Assessment. The ratings of SG benefits by one notch from support implied this SA-2 relative to its
IA of A (high).
Rating Considerations Details
Strengths
(1) Well-positioned with consumers and businesses in domestic retail banking in France
Generating resilient earnings with a low risk profile, the Group’s domestic retail bank is a key strength.
Among the leading institutions providing banking and other financial services to consumers and businesses
in France, SG’s French Networks operate through three complementary distribution brands, with about
3,176 branches serving about 11 million individual customers. With a relatively solid market share of 6.7% in
domestic deposits nationwide, SG is well-positioned with its distribution focused on the wealthier and more
dynamic regions in the country. The strength of this franchise and its well-recognised brands (Société
Générale, Crédit du Nord and Boursorama) has been tested recently, as the Group demonstrated its ability to
cope with difficult situations.
(2) Enhanced diversity via international expansion in retail banking and growth of financial services The IRB’s diversified presence across various regions enhances earnings resiliency and leverages SG’s
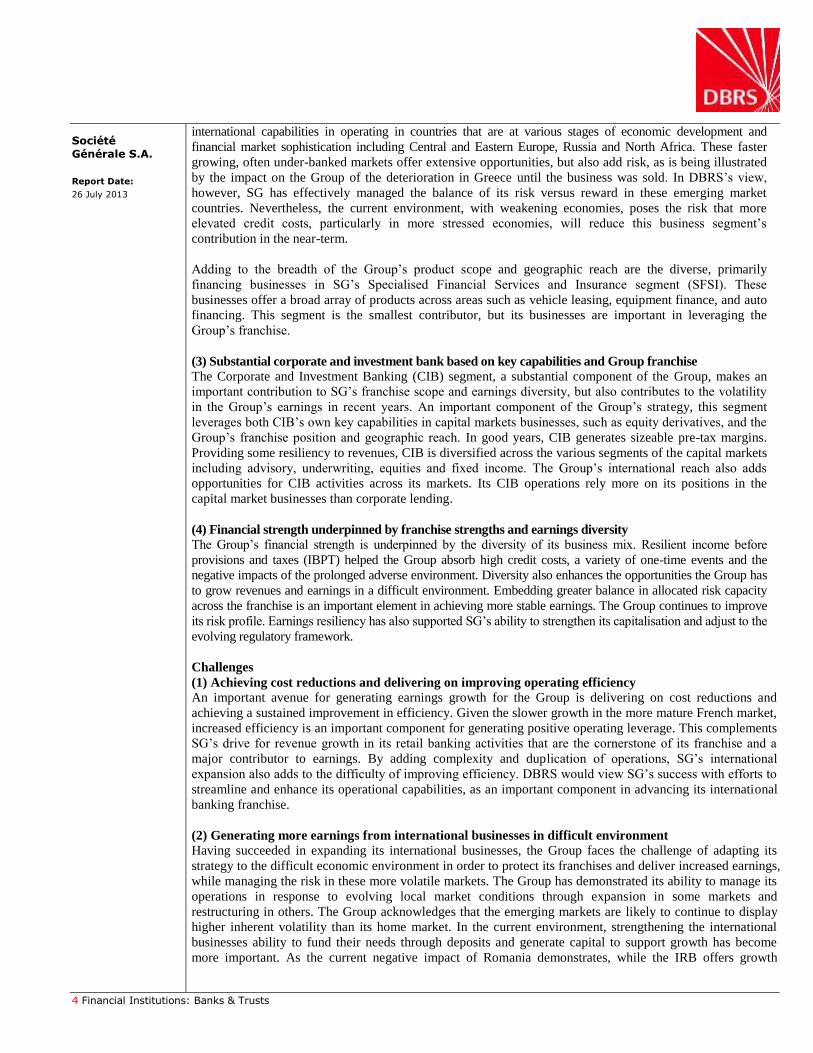
4 Financial Institutions: Banks & Trusts
Société
Générale S.A.
Report Date:
26 July 2013
international capabilities in operating in countries that are at various stages of economic development and
financial market sophistication including Central and Eastern Europe, Russia and North Africa. These faster
growing, often under-banked markets offer extensive opportunities, but also add risk, as is being illustrated
by the impact on the Group of the deterioration in Greece until the business was sold. In DBRS’s view,
however, SG has effectively managed the balance of its risk versus reward in these emerging market
countries. Nevertheless, the current environment, with weakening economies, poses the risk that more
elevated credit costs, particularly in more stressed economies, will reduce this business segment’s
contribution in the near-term.
Adding to the breadth of the Group’s product scope and geographic reach are the diverse, primarily
financing businesses in SG’s Specialised Financial Services and Insurance segment (SFSI). These
businesses offer a broad array of products across areas such as vehicle leasing, equipment finance, and auto
financing. This segment is the smallest contributor, but its businesses are important in leveraging the
Group’s franchise.
(3) Substantial corporate and investment bank based on key capabilities and Group franchise
The Corporate and Investment Banking (CIB) segment, a substantial component of the Group, makes an
important contribution to SG’s franchise scope and earnings diversity, but also contributes to the volatility
in the Group’s earnings in recent years. An important component of the Group’s strategy, this segment
leverages both CIB’s own key capabilities in capital markets businesses, such as equity derivatives, and the
Group’s franchise position and geographic reach. In good years, CIB generates sizeable pre-tax margins.
Providing some resiliency to revenues, CIB is diversified across the various segments of the capital markets
including advisory, underwriting, equities and fixed income. The Group’s international reach also adds
opportunities for CIB activities across its markets. Its CIB operations rely more on its positions in the
capital market businesses than corporate lending.
(4) Financial strength underpinned by franchise strengths and earnings diversity
The Group’s financial strength is underpinned by the diversity of its business mix. Resilient income before
provisions and taxes (IBPT) helped the Group absorb high credit costs, a variety of one-time events and the
negative impacts of the prolonged adverse environment. Diversity also enhances the opportunities the Group has
to grow revenues and earnings in a difficult environment. Embedding greater balance in allocated risk capacity
across the franchise is an important element in achieving more stable earnings. The Group continues to improve
its risk profile. Earnings resiliency has also supported SG’s ability to strengthen its capitalisation and adjust to the
evolving regulatory framework.
Challenges
(1) Achieving cost reductions and delivering on improving operating efficiency
An important avenue for generating earnings growth for the Group is delivering on cost reductions and
achieving a sustained improvement in efficiency. Given the slower growth in the more mature French market,
increased efficiency is an important component for generating positive operating leverage. This complements
SG’s drive for revenue growth in its retail banking activities that are the cornerstone of its franchise and a
major contributor to earnings. By adding complexity and duplication of operations, SG’s international
expansion also adds to the difficulty of improving efficiency. DBRS would view SG’s success with efforts to
streamline and enhance its operational capabilities, as an important component in advancing its international
banking franchise.
(2) Generating more earnings from international businesses in difficult environment
Having succeeded in expanding its international businesses, the Group faces the challenge of adapting its
strategy to the difficult economic environment in order to protect its franchises and deliver increased earnings,
while managing the risk in these more volatile markets. The Group has demonstrated its ability to manage its
operations in response to evolving local market conditions through expansion in some markets and
restructuring in others. The Group acknowledges that the emerging markets are likely to continue to display
higher inherent volatility than its home market. In the current environment, strengthening the international
businesses ability to fund their needs through deposits and generate capital to support growth has become
more important. As the current negative impact of Romania demonstrates, while the IRB offers growth
5 Financial Institutions: Banks & Trusts
Société
Générale S.A.
Report Date:
26 July 2013
opportunities for the Group, it also contributes to higher risk levels for SG, given the potential for significant
deterioration in these economies.
(3) Further enhancing financial strength given market and regulatory uncertainties
In adjusting to the difficult market conditions and more demanding regulatory requirements, the Group has
proved its ability to cope with a challenging environment. Continued progress with expense control, balance
sheet management and franchise development are important to enhance the Group’s resiliency in this
uncertain environment.
(4) Making more progress with strengthening its capital and streamlining its risk profile
After a 2012 year focus on strengthening the Group’s funding profile and liquidity position, the Group faces
the challenge of further building up its capital position. After reduced access to unsecured wholesale funding
in 2011-2012, the Group improved its funding structure and reinforced its capital cushion through accelerated
balance sheet adjustment in 2012. Also emphasising its drive to build equity, the Group did not distribute
dividends for 2011, and paid 25% in dividend in 2012 (65% in the form of script dividends).
Rating Drivers
Factors with Positive Rating Implications Factors with Negative Rating Implications
If SG continues to make progress in improving the
efficiency of its businesses and strengthening
underlying earnings, while further enhancing its
balance sheet profile, negative ratings pressure
could be reduced. A return to a Stable trend could
be foreseen, if this progress were accompanied by
less fragility in financial markets, economic
recovery and reduced regulatory uncertainty.
Ratings pressure could arise if SG were to have
significant difficulties in achieving its gains in
efficiency and strengthening its profitability. If
these difficulties were accompanied by
deterioration in SG’s franchise that reduce its
capacity to generate additional capital, this could
lead to negative ratings pressure, especially if
accompanied by renewed pressure on SG’s liquidity
and funding or material weaknesses in its
international operations that impact its
capitalisation.
Franchise Strength - Description of Operations
Société Générale is a well-established French based universal bank with a strong domestic position, a broad
business mix and an extensive international presence. Founded in 1864 by public subscription, the Group was
nationalised in 1945 and then re-privatised in July 1987. The Group’s shareholder structure is primarily free
float with employees owning 7.60% and major shareholders (over 1%) 7.42% as of 2012. Since the late
1990s, the Group has expanded considerably and developed its international presence through acquisitions
and organic investments in its different business lines.
The Group is organised around five business lines, although this is likely to be reduced to three business lines:
The French Networks (FN), International Retail Banking (IRB), Specialised Financing Services and
Insurance (SFSI), Private Banking, Global Investment Management and Services (PB, GIMS), and Corporate
and Investment Banking (CIB). DBRS views SG’s revenue generation as well diversified, as roughly no more
than a third of revenues are typically generated from any one of the five former main business lines (see
Exhibit 1). The Group’s strategy concentrates on its three core businesses, FN, IRB and CIB that are focused
on client-relationships within their customer franchises.
6 Financial Institutions: Banks & Trusts
Société
Générale S.A.
Report Date:
26 July 2013
Source: Company Reports
French Retail Banking – The French Networks (FN) The Group has a well-established position in the domestic banking market in France. The French Networks
consist of three complementary distribution networks: Société Générale with a nationwide presence, Crédit
du Nord, a regional bank, in which SG acquired a majority stake in 1997 and then took full control in 2009,
and Boursorama Banque, with its exclusively online offering.
Combined, SG’s distribution networks include 3,176 branches serving about 11.1 million individual
customers at the end of 2012. The FN are a key component of SG’s franchise with strong brand names,
generally stable revenue generation, and solid operational capabilities that can leveraged in its international
businesses and other business lines. Additionally, the FN provides SG with an important funding base that is
supported by its stable deposit base.
SG enjoys a strong domestic presence underpinned by large, dense branch networks for the SG brand that are
situated primarily in urban areas that account for a high proportion of the nation’s wealth. Crédit du Nord’s
network is a valuable complement with its focus on mass affluent customers in wealthy urban areas, where it
has a historically strong local presence. SG has the 4th largest branch network in France by number of
branches; and reportedly the third largest network in France by size of revenues, of which a third is under the
Crédit du Nord Group network and its 8 regional banks totaling 918 branches at end-2012. At year-end 2012,
the FN through its multi-channel development of the franchise had a national market share of 6.8% for
deposits and 7.7% for loans for individuals customers. In Paris Ile de France, market shares to individuals
would be much higher for wealthy clients. SG’s presence in the South East of France is also strong. While SG
scope is nationwide geared towards SMEs, Crédit du Nord is targeting professionals, individual entrepreneurs
and affluent clients.
International Retail Banking (IRB) IRB is one of the Group’s three core businesses along with French Networks and CIB. The Group’s
international retail banking operations add an important dimension to SG’s franchise by extending its reach
into new markets and leveraging the skills and technological capabilities of its domestic operations. It is the
second pillar of the Group’s universal banking strategy.
SG maintains four main zones of activity: Czech Republic, Russia, Balkanic Countries, and Africa. In
pursuing the growth opportunities that these international markets offer, SG acknowledges that they generally
have higher inherent volatility than its home market. SG incorporates this additional risk in calibrating the
capital allocated to these businesses and ensuring that returns are appropriate, so that the Group’s capital
structure remains aligned with its overall risk appetite. Importantly, within IRB, the loan portfolio is
French
networks,
8.2, 33%
International
Retail Banking
20%
CIB,
6.2, 25%
SFSI,
3.5, 14%
PB GIMS,
2.2, 8%
Exhibit 1: Net Banking Income by Segment
EUR Billions, FY2012
7 Financial Institutions: Banks & Trusts
Société
Générale S.A.
Report Date:
26 July 2013
predominantly funded by deposits, except for specialized financial entities in Russia, and smaller as well as
more recent subsidiaries (see Exhibit 2).
SG is well-positioned in most of these international markets. SG has established a leadership position in the
Czech Republic, being the third largest local bank by total assets at 4Q12. The Group is building up its
position in Russia, where it is the third largest private banking group by the number of branches and 5th
in its
retail loan segment at 4Q12. It also has the third largest branch network and is the 5th
largest privately-owned
banking group. Centralising its operations to improve efficiency, SG combined all its Russian entities, while
still utilising three brand companies: Rosbank (5th
largest private bank by assets, and 10th
by total assets),
DeltaCredit (1st specialized bank in mortgage financing in loan production), and Rusfinance (3
rd largest car
lender), which are specialized banking units. In Balkanic Countries, the Group ranks second in Romania with
around 22% market share, and is the #2 privately-owned retail bank there after BCR owned by Erste. SG also
has a presence in Croatia (Splitska Banka), Slovenia (SKB joined SG in 2001) and Bulgaria (Société
Générale Express Bank acquired in 1999), as well as operations in Poland, where it has been operating since
1976, now through Eurobank Polska, and Serbia. Recently, SG strengthened its operations in Serbia with the
acquisition of KBC Banka a.d. Beograd’s portfolio of individuals and SME customers in April 2013. In the
Mediterranean Basin, Sub-Saharan Africa and the French Territories, the Group also has significant presence,
reportedly ranking as the #4 largest bank by total asset in Morocco, the #1 local bank by total assets in Côte
d’Ivoire, and the #1 local bank in Cameroon by total loans. In 2013, the Group is looking to expand further
in this dynamic zone with high ROE (16%) through innovative solutions, while improving cost-income ratio
through centralization of back-offices. The sale of the Egyptian subsidiary was opportunistic and does not
change the strategy in the region.
Source: Company Reports
While its strategy is to expand these businesses, SG has also shown its ability to adapt to the difficult
operating environment by slowing its expansion with fewer branch openings or retrenching by cutting staff
and closing branches. This ability to adapt its franchise is more important in the current environment, when
deleveraging can be critical and resources for investment are more difficult to generate. In 2013, the focus
will be on developing synergies with the other entities of the Group while strengthening.
Greece, Exit in 2012
Greece is indicative of the negative impact that the severe weakening of country’s economy can have on a
local franchise. Geniki was a modest sized subsidiary in Greece, with EUR 4.3 billion assets, EUR 3.5 billion
loans, EUR 2.7 billion deposits and 117 branches at end-2010. Positively SG sold its Greek subsidiary,
Geniki, in December 2012. Nevertheless, this deterioration generated substantial provisioning. Pre-tax Group
net income was EUR 164 million in 2012. The Group had allocated EUR 890 million to provisions in 2011.
As the negative impact of Greece demonstrated, while the IRB offers growth opportunities for the Group, it
23.1
7.9 7.25.2
2.1 1.5 0.8 1.2 1.5 1.3
0
5
10
15
20
25
Exhibit 2: Loans and Deposits at Major Foreign Subsidiaries
EUR Billions, FY2012
Loans Deposits
8 Financial Institutions: Banks & Trusts
Société
Générale S.A.
Report Date:
26 July 2013
also contributes to higher risk levels for SG, given the potential for significant deterioration in these
economies. With the sale of Geniki, the Group’s retail exposure outside France in the Eurozone is limited to
specialized financing in a few countries (Germany, Italy, and Spain). In 2012, loss making foreign
subsidiaries sales also included the divestment of its Ukrainian unit.
Corporate and Investment Banking (CIB)
An important component of the Group’s franchise remains its Corporate & Investment Banking (CIB)
segment, which has a global reach with a significant presence in countries across Europe, the Americas and
Asia-Pacific. The segment makes an important, if uneven, contribution to revenues and Group net income.
The CIB focuses its wholesale banking activities on the client and product segments where SG can achieve
leadership and sustainable profitability. CIB is organized around two divisions: (1) Global market (Equities,
Fixed income, Currencies, Commodities) and (2) Financing and Advisory (Coverage, M&A, global finance).
CIB went through a significant headcount reduction in 2012 (-12%), but maintained leading positions in
Equity derivatives; #1 global player in warrants, 12.6% market share, #3 in European ETFs), Euro Debt
Capital Markets (#2 in corporate bond issuance in Euro in 2012), Euro rates and credit, Natural Resources
finance, and Structured Finance. In Fixed Income, Currencies and Commodities (FICC), SG’s objective is to
further develop CIB’s position.
In its ongoing evolving strategy, SG has been scaling back some of its activities involving USD denominated
activities in 2012. The objective was to focus on the client-driven approach, while improving efficiency and
reducing its risk profile. DBRS views positively that revenues are predominantly client-driven, demonstrating
the strength of the customer base and implying controlled risk-taking with the Group’s own capital. As a
regional player with about EUR 7 billion in annual revenues, profitability pressures in recent years are
driving the Group to control its CIB costs by increased use of partnerships and outsourcing, as well as
increased monitoring of credit and market risks.
Legacy Assets
Included in CIB are SG’s legacy assets. These assets include assets made illiquid in the credit crisis because
of their nature (CDOs of RMBS, RMBS, CMBS and other E.U., U.S. and Australian ABS) or their structure
(assets hedged by monolines, exotic credit derivatives, etc.), now stalled on the balance sheet since 2008.
These assets were a significant drag on earnings in 2009, but have been progressively less of a burden. The
net book value of these assets is estimated at EUR 8.8 billion at end-2012, down from EUR 17.4 billion as of
December 2011 and meeting the goal of going below EUR 10 billion by 2013. DBRS views progress on this
reduction as important, because it reduces the burden of these assets that absorbed resources, now reduced to
around EUR 50 million a quarter according to the current guidance, raise SG’s risk profile, and do not
contribute to its franchise.
Specialised Financial Services and Insurance (SFSI)
The SFSI businesses offer a range of corporate financial products and services including leasing of equipment,
fleet vehicles and IT assets, as well as insurance services and financing of capital goods. SFSI also provides
credit to consumers under various brand names. These businesses provide an important range of products
through which the Group is able to meet more of the needs of its customers across its franchise and extend its
geographic reach to markets beyond its core markets. These businesses operate primarily in France, but are
also active in Germany, Italy and other countries within its franchise scope.
The performance of these businesses has been sustained in 2012 and even improved in 1Q13, mostly helped
by improved market position in Insurance in France, but also by SFSI’s strengthening its positions notably in
Poland (2010) and more recently in Russia. SFSI’s performance is also improving as the Group is being
successful in refocusing its Consumer Finance business. As SFSI was part of the deleveraging plan, overall
growth will remain limited, but profitability can improve as illustrated in 1Q13, supported by lower operating
costs as well as lower cost of risk. SG ranks #3 worldwide and #1 in Europe in Equipment Finance, #2 in
Europe for ALD Automotive (Operational Vehicle Leasing and Fleet Management), and #4 in Insurance in
France.
9 Financial Institutions: Banks & Trusts
Société
Générale S.A.
Report Date:
26 July 2013
Global Investment Management and Services (GIMS)
GIMS includes the Group’s private banking, its asset management businesses, a range of securities services,
and other services, including derivatives brokerage and on-line banking. Private Banking (PB) is the main
contributor to this business segment that leverages the broad scope of SG’s franchise, particularly in its home
market. With a presence in 19 countries, PB has international reach that complements SG’s international
franchise. PB contributed more than half this division’s net income in 2011. Most of its asset management
operations were combined with those of Crédit Agricole S.A. (Crédit Agricole), in Amundi, with split
ownership (75% Crédit Agricole, 25% SG). Amundi ranks #1 in France with 25% market shares, #2 in
Europe with EUR 746.2 billion of AuM. TCW, which was not combined with Amundi, was sold in 2012.
Also in 2012, SG started restructuring Newedge, a 50/50 JV with Crédit Agricole, that is a participant in the
clearing and execution of listed derivatives. Securities Services provides a range of services that complement
SG’s banking, capital markets, and wealth management businesses. GIMS is going to be merged into the CIB
division.
Corporate Center (C/C) and Announced Reorganization:
The Corporate Center includes the Group’s real estate portfolio, industrial and bank equity portfolios, Group
treasury functions, and some costs of cross-business projects. Exceptional net revenues may be included in
the C/C that can distort the perspective on the contributions by business segment over time.
Early in 2013, the Group laid out its plan to refocus on its three core "pillars": “French Retail Banking”; an
“International Retail Banking and Financial Services division”; and another encompassing “Corporate and
Investment Banking, Private Banking, Global Investment Management and Services”. DBRS views
positively the Group’s efforts in making itself more efficient and flexible.
Earnings Power
The Group generates strong, resilient earnings power from its well-established franchise with its diversified
mix of businesses, albeit with unevenness in the CIB. The current environment has tested the resiliency of
this earnings power, as SG has had to cope with write-downs, elevated credit costs outside France and other
impacts of this extended stressed environment. In spite of a still difficult environment and a year focused on
deleveraging in 2012, Group net underlying income was relatively stable as compared to 2011, after adjusting
for the Group’s revaluation of its own debt. Challenged by headwinds in the global economy, higher funding
costs, higher liquidity needs and elevated costs of credit, the Group nonetheless achieved structural changes,
while maintaining a satisfactory level of earnings.
Source: Company Reports
Results for 2012 show the benefits of the business and geographic diversity of SG’s franchise, which DBRS
views as an important contributor to the Group’s positive earnings generation. The Group generated net
686 633 459 492 325 (51)
600 469 26
343 297 674
652 329
201 289
171
(293)
1,375
1,287
1,007
1,233 1,428 1,291
(2,221)(2,062)
663
1,730
635 1,053
(3,000)
(2,000)
(1,000)
-
1,000
2,000
3,000
4,000
5,000
2007 2008 2009 2010 2011 2012
Exhibit 3: SG Net Income by Business Line (Total includes C/C)
EUR Millions, 2007-2012
IRB SFSI GIMS FN CIB
947 2,3853,9176782,010 774
10 Financial Institutions: Banks & Trusts
Société
Générale S.A.
Report Date:
26 July 2013
income of EUR 0.8 billion in 2012, below EUR 2.4 billion in 2011 (See exhibit 3). However, these numbers
need to be adjusted for accounting volatility generated by the calculation of the Group’s own financial
liabilities. Adjusting for the revaluation of the Group own debt only, Group net income was EUR 1.6 billion
in 2012, largely unchanged from 2011 (See exhibit 4).
Source: Company Reports
The distribution of net revenues over time illustrates the contribution of the Group’s businesses that support
the resiliency of its earnings. Reflecting the challenges faced by the Group, a series of one-timers have
affected the bottom line of the Group in the past years. Excluding one-off items in each year, Group
underlying net income was EUR 3.4 billion in 2012, up from EUR 3.2 billion in 2011.
However, total negative impact from exceptional items was approximately EUR -2.8 billion in 2012 as
compared to EUR -1.7 billion in 2011. The exceptional items in 2012 included EUR 822 million negative
revaluation of the Group’s own financial liabilities, EUR 338 million exceptional costs resulting from the
deleveraging in core CIB, EUR 416 million for CIB legacy assets, EUR 560 million losses from impairment
and capital losses in SFSI, GIMS and C/C, EUR 300 million provisions for disputes booked in the Corporate
Center. The buy-back of Tier 2 debt made a positive contribution to net income of EUR 195 million for 2012.
In contrast, across the difficult environment of recent years, the FN have made a steady and growing
contribution to overall Group net income, rising from EUR 1.0 billion in 2009 to EUR 1.3 billion in 2012.
Within IRB, while Greece is not a drag anymore, other regions have weakened. Romania was loss making in
2012, after having posted profits during the past 10 years. Czech Republic, Sub-Sahara Africa, French
territories and others have been more resilient. Russia started benefiting from rationalization efforts, and
posted profits in 4Q12. However, with high inflation, low spreads and an uncertain political environment,
operating in the region is likely to remain challenging.SG recently sold its Egyptian subsidiary on an
opportunistic basis. In DBRS views, the emerging markets remain an important component of SG’s strategy
and DBRS views its well-diversified presence across various regions as enhancing earnings resiliency over
time.
Specific to 2012 is SG’s CIB deleveraging. CIB delivered improved results in 1Q13, indicating a recovery
from the reduced level of revenues in 4Q11, when the Group suffered from the turbulence in the markets and
started to adjust its CIB’s profile to deliver more stable performance. CIB’s total revenues in 2012 were EUR
6.2 billion, up 3.5% from EUR 6 billion in 2011. The Group anticipates minimum losses coming from legacy
assets in 2013, with a guidance of EUR 50 million a quarter for 2013.
The Private Banking, Global Investment Management & Services (PB, GIMS) segment makes a smaller
contribution to net income. While its net revenues totaled EUR 2.2 billion in 2012, relatively stable from
2,385
774
(772)
822
1,613 1,596
(1,000)
(500)
-
500
1,000
1,500
2,000
2,500
3,000
2011 2012
Exhibit 4: SG Adjusted Net Income Group Share
EUR Millions, 2011-2012
Group Net Income Debt Revaluation Adjusted Group Net Income
11 Financial Institutions: Banks & Trusts
Société
Générale S.A.
Report Date:
26 July 2013
2011, PB, GIMS generated a net loss of EUR -293 million Group share of net income in 2012, driven by
EUR 580 million impairment of goodwill for the year 2012. Excluding this impairment, Group net income
was EUR 287 million, up from EUR 171 million in 2011 and EUR 289 million in 2010 thanks to good
performance in Asset Management (AM). AM’s Group net income was EUR 142 million in 2012 before
EUR 200 million of goodwill impairments, which compares to EUR 99 million in 2011. SFSI overall
generated 14% and PB, GIMS generated 9% of the Group’s net revenues in 2012 (total excludes C/C). These
segment contributions were stable from 2011.
C/C registered negative revenues of EUR 1,832 million in 2012 reflecting in part the negative revaluation of
the Group’s own financial liabilities of EUR 1,255 million for the year at revenues level, but also costs of
systemic bank levies, as well as losses related to Geniki and TCW sales.
Expenses & Efficiency
In DBRS’s view, the Group’s current focus on strategic cost reduction is a key driver for improving SG’s
profitability. Given the importance of improved efficiency for strengthening earnings at a time of slower
revenue growth, DBRS looks positively upon the Group’s announced plan to lower its efficiency ratio,
particularly in its retail banking networks.
After EUR 500 million cost reductions in 2012 (mostly in the CIB), SG is targeting a further EUR 900
million in cost reductions by 2015, most of which are to be achieved in the French Network. This will
ultimately represent about 9% of the SG’s current cost base. The Group continues to make progress with its
transformation projects, including the consolidation of technology systems in France and abroad, and
improvements in risk management processes. SG is also in the process of implementing the reorganization of
its back-offices as well as engaging in the creation of JVs to share costs. To achieve annual costs reduction of
EUR 900 million, SG expects to incur one-off cost of about EUR 600 million.
SG is targeting a 60% level in the French Networks in the coming years, which would be a significant
improvement from its current level. This ratio varies considerably across business segments, which reflects
their mix of activities. With a higher proportion of revenues from lending, SFSI has the lowest cost income
ratio at 52.9% , which GIMS has the highest ratio at 88.2% reflecting its more expense intensive, but lower
risk, activities. Nevertheless, SG is seeking to reduce costs across its business segments. Overall, indicating
progress made, the Group’s cost to income ratio was reduced down to 67.5% in 2012 from 69.6% in 2011,
excluding the positive revaluation of own financial liabilities. This improvement was primarily driven by the
CIB segment (see Exhibit 5), reflecting efforts in reducing costs implemented throughout the year and
improving revenues. Excluding the net discount on loans sold CIB core activities cost-to-income ratio stood
at 59.2% in 2012.
Source: Company Reports, Note: C/I ratio is excluding revaluation of Group's own debt
Capacity to Absorb Credit Costs
DBRS views SG as having the earnings power to absorb sizeable credit costs, as indicated by its ability to
cope with elevated credit costs in recent years and the degree of resiliency in its underlying earnings. SG
generated gross operating income, or income before provisions and taxes (IBPT), of EUR 6.7 billion in 2012,
as compared to EUR 8.6 billion in 2011. Excluding the Group’s revaluation of own debt, IBPT was EUR 7.9
billion in 2012 (excluding the negative EUR 1.3 billion in gains on the revaluation of the Group’s own debt),
versus EUR 7.4 billion in 2011 (excluding the EUR 1.2 billion in gains on the revaluation of the Group’s own
debt). This level left SG with a satisfactory cushion, as impairments of EUR 3.9 billion absorbed 50% of
IBPT-ex debt revaluation gains in 2012 and impairments of EUR 4.3 billion absorbing 58% of -ex debt
Exhibit 5: Cost-to-Income Ratio by division 2012 2011 2010 2009
French Network 64.5% 64.3% 64.9% 65.8%
IRB 62.2% 59.6% 56.2% 56.5%
CIB incl legacy assets 67.7% 79.4% 60.1% 56.6%
CIB excl legacy assets 63.7% 72.3% 59.7% 40.0%
GIMS 88.2% 90.7% 88.2% 87.9%
SFSI 52.9% 53.6% 52.0% 56.1%
Group 67.5% 69.6% 63.7% 72.6%
12 Financial Institutions: Banks & Trusts
Société
Générale S.A.
Report Date:
26 July 2013
revaluation gains in 2011 (See Exhibit 6). This indicates that SG has the capacity to cope with an increase in
credit costs.
Exhibit 6: Earnings Capacity to Absorb Cost of Risk (Data Adjusted for the Group’s Own Debt Revaluation)
Source: Company Reports
French Network (FN) – Robust Level of Activity In Spite of Weakening in SMEs
DBRS views the FN as providing an important underpinning for SG’s earnings that would benefit from SG’s
drive to improve its efficiency. The FN has been the main contributor to profits in the past two years.
Indicative of FN’s franchise health, activity levels continued to be robust and strength in retail banking is
evident with growth in loans and in deposits in particular in 2012. Against a backdrop of a slowing economy,
activity levels were resilient, with strength shown by the growth in loans and deposits: loans were up 3.2%
year-over-year (YoY) to EUR 176 billion and deposits up 5.4% YoY to EUR 142 billion. At the same time,
SG further reduced its loan-to-deposit ratio in the FN to 117% at 1Q13, down from 124% at end-2012 and
141% at end-2009.
The FN continued to generate robust revenues, above EUR 2 billion a quarter in 2012. SG’s retail operations
in France have a relatively high NIM, although now more pressurized, at 2.34% in 2012 down from 2.42% in
2011. NIM had been relatively stable in 2011. At the same time, the relatively low level of the cost of risk
enables this division to retain a higher portion of revenues in net profits. FN’s cost of risk relative to IBPT
was generally below 30% in 2012 as in 2011. However, the last quarter of 2012 indicated signs of
deterioration, primarily coming from SMEs. In 4Q12, the trend was up, with this ratio at 44% as compared to
34% in 4Q11 (See Exhibit 6).
Corporate and Investment Banking (CIB) – Deleveraging Is Behind
DBRS views better alignment of expenses with revenues and more efficient operations as being an important
driver for improved performance, as capital markets businesses face slower revenue growth. SG has recently
focused on improving CIB’s profile and delivering more stable performance, which DBRS views positively.
Reflective of some success, CIB’s gross operating income was up 62.3% to EUR 2.0 billion in 2012 in spite
of the deleveraging, supported by strengths in fixed income, currencies and commodities. Driven by higher
revenues, the bottom line was up 65.8% to EUR 1.1 billion in 2012 from EUR 0.6 billion in 2011. At the
same time, the Group reduced its cost base, which compensated for somewhat higher provisioning in 2012.
Funding and Liquidity
SG’s funding profile combines a sizeable, diversified deposit base with significant usage of wholesale
funding that is typical of universal banks that combine retail banking with significant corporate and
investment banking businesses. SG, like other universal banks, has taken measures to reduce its usage of
wholesale funding, particularly USD funding when this source came under pressure in 2011, and improve the
alignment between its wholesale funding and the characteristics of its funding needs. The Group’s franchise
strength and adaptability have enabled it to cope with the stress on its funding, helped by access to central
bank funding. Overall, SG successfully addressed the abnormally difficult funding markets by building up its
liquidity and regaining investors’ confidence.
EUR Millions 2012 2011 2010
Group Net Banking Income 23,110 25,636 26,418
Group IBPT 6,672 8,600 9,873
Croup Cost of Risk (3,935) (4,330) (4,160)
Adjusted Group Net Banking Income 24,365 24,459 25,991
Adjusted Group IBPT 7,927 7,423 9,446
Cost of Risk / IBP 59.0% 50% 42%
Cost of Risk / Adjusted IBP 50.0% 58% 44%
13 Financial Institutions: Banks & Trusts
Société
Générale S.A.
Report Date:
26 July 2013
Deposit Funding
SG’s strong banking franchise provides an important source of stable funding through its customer deposits,
which provide about 47%% of its funded balance sheet of EUR 652 billion, excluding equity, at year-end
2012. After accounting reclassifications, customer deposits were EUR 311 billion, up from EUR 295 billion
pro-forma 2011.
Indicative of SG’s strength in its home market, the FN grew deposits by 5.4% YoY to EUR 142 billion, while
reducing the FN’s loan-to-deposit ratio to 117% at 1Q13 from 124% at year-end 2012 and 141% at year-end
2009. This compares well to its European peers.
Wholesale Funding
DBRS views positively that SG has improved its liquidity position with a sizeable excess of stable funding
and a maximum for short-term funding of 20% of its balance sheet. The Group is complying with impending
short-term regulatory requirements with an LCR ratio above 100% at 1Q13. Appropriately, SG has put more
emphasis on aligning its funding profile with the assets being funded and utilising incentives to drive more
efficient use of the Group’s balance sheet and liquidity by its business units.
The gap between customer loans and deposits has been managed down through deposit growth and loan
reductions, as well as shrinking the balance-sheet to reduce its funding needs, particularly USD needs. Even
though the Group's funding is increasingly diversified in terms of instruments, currencies, type and geography
of investors, SG’s ability to access wholesale funding remains subject to investor appetite. As of 10 June
2013, EUR 17.1 billion out of EUR 18 billion to EUR 20 billion SG’s LT funding programme is completed,
this is excluding securitisation. The Group’s strategy is to diversify even at a small cost. 2013 issuances
included private placements for EUR 8.9 billion, but also EUR 1.3 billion secured funding (SG SFH, French
covered bonds program). EUR 1.2 billion was raised through securitization (GEFA in Germany).
The Group has been working to reduce its reliance on short-term (ST) wholesale funding. At the end of 2012,
the Group had EUR 66 billion of ST unsecured funding and EUR 65 billion of interbank deposits, which
were covering 101% of short-term (ST) needs - a level much improved since the 73% coverage of ST needs
at end-2011. The Group also uses secured funding sources, such as repos and securities lending/borrowing,
which are typically ST in tenor, to fund relatively liquid assets, such as in its trading businesses. At the end of
2012, the Group had EUR 200 billion of repo funding and funding from securities lending/borrowing as
compared to EUR 173 billion a year ago.
In addition to its greater focus on deposit growth, SG’s reduction in its funding wholesale needs was achieved
by a combination of asset disposals and the down-sizing of certain financing businesses. Within its capital
markets businesses, the Group’s substantial reliance on short-term funding is generally aligned with its
largely liquid asset mix. With the Group more focused on flow trading going forward, which moves assets on
and off the balance sheet, these businesses face less risk of having to fund assets that get stalled on the
balance sheet for an extended period of time, reducing the potential for liquidity stress on the balance sheet.
One stress on SG’s balance sheet that has been significantly reduced is the financing for the legacy assets.
This declined to EUR 8.8 billion at end-2012 from EUR 17.4 billion at the end of 2011, or just 0.70% of total
assets as of 31 December 2012.
Contingency liquidity
The Group has strengthened its liquidity profile over the past two years as a result of having experienced
considerable stress It now has an unencumbered liquid asset buffer of EUR 133 billion at year-end 2012, up
58% since end-2011 (or + EUR 49 billion). This includes EUR 68 billion of central bank eligible assets and
EUR 65 billion of net available central bank deposits. In addition, SG had EUR 25 billion of assets in the
trading book that could be sold in 15 to 30 days, though this liquidity is not immediately available. LTRO
was viewed as a safety net; the Group has started reimbursing it as liquidity pressure has receded.
While these resources are sizeable, SG has sizeable funding that matures in 2013. At year-end 2012, the
Group had ST unsecured funding of EUR 66 billion and interbank deposits of EUR 65 billion plus long-term
funding maturities in 2013 of about EUR 23 billion. Together, these funding needs of EUR 154 billion
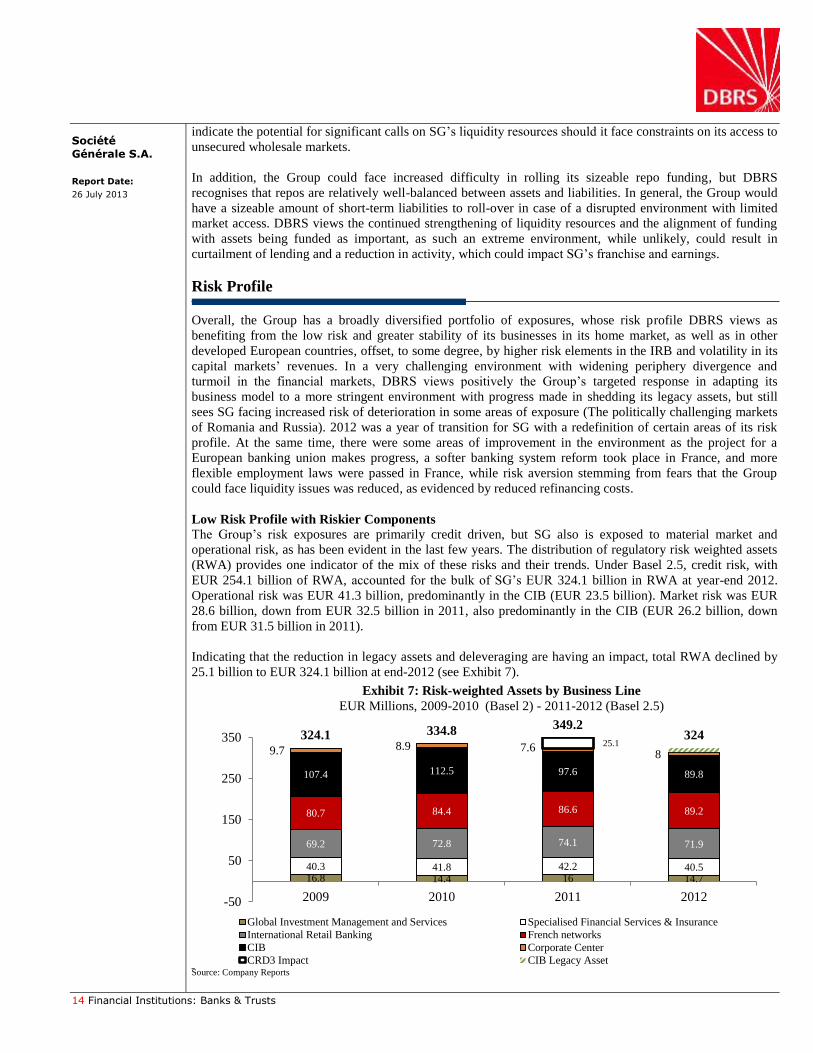
14 Financial Institutions: Banks & Trusts
Société
Générale S.A.
Report Date:
26 July 2013
indicate the potential for significant calls on SG’s liquidity resources should it face constraints on its access to
unsecured wholesale markets.
In addition, the Group could face increased difficulty in rolling its sizeable repo funding, but DBRS
recognises that repos are relatively well-balanced between assets and liabilities. In general, the Group would
have a sizeable amount of short-term liabilities to roll-over in case of a disrupted environment with limited
market access. DBRS views the continued strengthening of liquidity resources and the alignment of funding
with assets being funded as important, as such an extreme environment, while unlikely, could result in
curtailment of lending and a reduction in activity, which could impact SG’s franchise and earnings.
Risk Profile
Overall, the Group has a broadly diversified portfolio of exposures, whose risk profile DBRS views as
benefiting from the low risk and greater stability of its businesses in its home market, as well as in other
developed European countries, offset, to some degree, by higher risk elements in the IRB and volatility in its
capital markets’ revenues. In a very challenging environment with widening periphery divergence and
turmoil in the financial markets, DBRS views positively the Group’s targeted response in adapting its
business model to a more stringent environment with progress made in shedding its legacy assets, but still
sees SG facing increased risk of deterioration in some areas of exposure (The politically challenging markets
of Romania and Russia). 2012 was a year of transition for SG with a redefinition of certain areas of its risk
profile. At the same time, there were some areas of improvement in the environment as the project for a
European banking union makes progress, a softer banking system reform took place in France, and more
flexible employment laws were passed in France, while risk aversion stemming from fears that the Group
could face liquidity issues was reduced, as evidenced by reduced refinancing costs.
Low Risk Profile with Riskier Components
The Group’s risk exposures are primarily credit driven, but SG also is exposed to material market and
operational risk, as has been evident in the last few years. The distribution of regulatory risk weighted assets
(RWA) provides one indicator of the mix of these risks and their trends. Under Basel 2.5, credit risk, with
EUR 254.1 billion of RWA, accounted for the bulk of SG’s EUR 324.1 billion in RWA at year-end 2012.
Operational risk was EUR 41.3 billion, predominantly in the CIB (EUR 23.5 billion). Market risk was EUR
28.6 billion, down from EUR 32.5 billion in 2011, also predominantly in the CIB (EUR 26.2 billion, down
from EUR 31.5 billion in 2011).
Indicating that the reduction in legacy assets and deleveraging are having an impact, total RWA declined by
25.1 billion to EUR 324.1 billion at end-2012 (see Exhibit 7).
Source: Company Reports
16.8 14.4 16 14.7
40.3 41.8 42.2 40.5
69.2 72.8 74.1 71.9
80.7 84.4 86.6 89.2
107.4 112.5 97.6 89.8
9.7 8.9 7.68
25.1324.1 334.8 349.2
324
-50
50
150
250
350
2009 2010 2011 2012
Exhibit 7: Risk-weighted Assets by Business Line
EUR Millions, 2009-2010 (Basel 2) - 2011-2012 (Basel 2.5)
Global Investment Management and Services Specialised Financial Services & Insurance
International Retail Banking French networks
CIB Corporate Center
CRD3 Impact CIB Legacy Asset
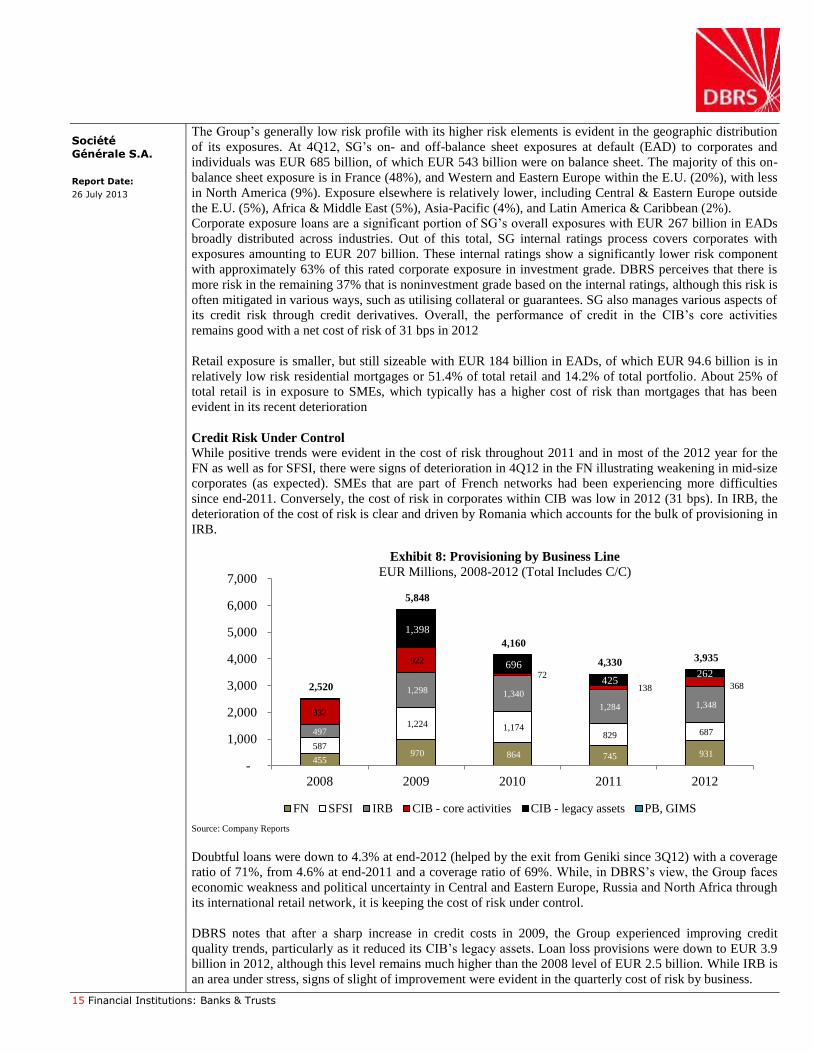
15 Financial Institutions: Banks & Trusts
Société
Générale S.A.
Report Date:
26 July 2013
The Group’s generally low risk profile with its higher risk elements is evident in the geographic distribution
of its exposures. At 4Q12, SG’s on- and off-balance sheet exposures at default (EAD) to corporates and
individuals was EUR 685 billion, of which EUR 543 billion were on balance sheet. The majority of this on-
balance sheet exposure is in France (48%), and Western and Eastern Europe within the E.U. (20%), with less
in North America (9%). Exposure elsewhere is relatively lower, including Central & Eastern Europe outside
the E.U. (5%), Africa & Middle East (5%), Asia-Pacific (4%), and Latin America & Caribbean (2%).
Corporate exposure loans are a significant portion of SG’s overall exposures with EUR 267 billion in EADs
broadly distributed across industries. Out of this total, SG internal ratings process covers corporates with
exposures amounting to EUR 207 billion. These internal ratings show a significantly lower risk component
with approximately 63% of this rated corporate exposure in investment grade. DBRS perceives that there is
more risk in the remaining 37% that is noninvestment grade based on the internal ratings, although this risk is
often mitigated in various ways, such as utilising collateral or guarantees. SG also manages various aspects of
its credit risk through credit derivatives. Overall, the performance of credit in the CIB’s core activities
remains good with a net cost of risk of 31 bps in 2012
Retail exposure is smaller, but still sizeable with EUR 184 billion in EADs, of which EUR 94.6 billion is in
relatively low risk residential mortgages or 51.4% of total retail and 14.2% of total portfolio. About 25% of
total retail is in exposure to SMEs, which typically has a higher cost of risk than mortgages that has been
evident in its recent deterioration
Credit Risk Under Control
While positive trends were evident in the cost of risk throughout 2011 and in most of the 2012 year for the
FN as well as for SFSI, there were signs of deterioration in 4Q12 in the FN illustrating weakening in mid-size
corporates (as expected). SMEs that are part of French networks had been experiencing more difficulties
since end-2011. Conversely, the cost of risk in corporates within CIB was low in 2012 (31 bps). In IRB, the
deterioration of the cost of risk is clear and driven by Romania which accounts for the bulk of provisioning in
IRB.
Source: Company Reports
Doubtful loans were down to 4.3% at end-2012 (helped by the exit from Geniki since 3Q12) with a coverage
ratio of 71%, from 4.6% at end-2011 and a coverage ratio of 69%. While, in DBRS’s view, the Group faces
economic weakness and political uncertainty in Central and Eastern Europe, Russia and North Africa through
its international retail network, it is keeping the cost of risk under control.
DBRS notes that after a sharp increase in credit costs in 2009, the Group experienced improving credit
quality trends, particularly as it reduced its CIB’s legacy assets. Loan loss provisions were down to EUR 3.9
billion in 2012, although this level remains much higher than the 2008 level of EUR 2.5 billion. While IRB is
an area under stress, signs of slight of improvement were evident in the quarterly cost of risk by business.
455970 864 745 931
587
1,224 1,174 829 687 497
1,298 1,340
1,284 1,348 932
922
72
138 368
1,398
696
425 262
2,520
5,848
4,160
4,330 3,935
-
1,000
2,000
3,000
4,000
5,000
6,000
7,000
2008 2009 2010 2011 2012
Exhibit 8: Provisioning by Business Line
EUR Millions, 2008-2012 (Total Includes C/C)
FN SFSI IRB CIB - core activities CIB - legacy assets PB, GIMS
16 Financial Institutions: Banks & Trusts
Société
Générale S.A.
Report Date:
26 July 2013
Legacy Assets In reducing its risk, the legacy assets portfolio was one of the main items. In the past two years, the CIB has
accelerated the reduction of its legacy assets exposure, the legacy portfolio became much less sizeable. The
drag on CIB from legacy assets is less consequential with a net loss of EUR 416 million in 2012. These assets
are down to EUR 8.8 billion from a high level of EUR 32.8 billion at year-end 2010 (about EUR 40 billion in
2008). Now comprising about 0.7% of SG’s assets, 61.4% are USD denominated as of December 2012. Of
the EUR 8.8 billion portfolio, SG has identified EUR 5.7 billion as money good assets, while EUR 3.1 billion
assets are non-investment grade assets. The latter include U.S. RMBS and CDOS of U.S. RMBS (down
41.4% to EUR 1.7 billion at end-2012).
Risk Exposures to Peripheral E.U. Countries
Adjusting to the deteriorating environment, the Group significantly reduced its sovereign exposures to
stressed European economies. Its GIIPS sovereign exposure in the banking book is down to EUR 1.8 billion
in 1Q13, from EUR 2.3 billion at 4Q12 and EUR 6.6 billion at end-2010, with EUR 1.2 billion exposure left
in Italy and EUR 0.6 billion in Spain. The Group exposure to peripheral E.U. countries non sovereign risk is
mostly to Italy with EUR 6.4 billion to Corporates and EUR 4.8 billion to Retail, and Spain with EUR 6.9
billion to Corporates and very limited exposure to Retail.
Risk Management With experience gained from the market turmoil and the unauthorised, concealed market activities in 2008,
SG’s management has appropriately revamped the Group’s risk management organization, as well as its
overall risk philosophy and appetite. Group risk control has been enhanced, particularly operational risk
control. SG is focused on risk-adjusted profitability and ensuring the Group’s sustainability as key objectives
in its risk management processes. When taking risk, management analyses risk vs. reward, earnings
sensitivity to economic cycles, sovereign and macro-economic risks (particularly in emerging markets), and
diversification of earnings streams. DBRS anticipates that the revamped risk management processes and the
CIB deleveraging are likely to reduce volatility in results. DBRS views SG’s delivery of such improved
performance as being an important demonstration of its success with this revamping that would enhance its
risk profile and provide added support for SG’s intrinsic strength.
Reporting directly to executive management, the Risk Division oversees credit, market and operational risk.
SG has made structural changes to improve communications across its risk organization, while strengthening
the independence of risk management as a separate function from the businesses.
Market Risk
SG has reduced its risk appetite in terms of market risk. In controlling market risk, one key tool is a one-day,
99% value-at-risk (VaR) model using a one year look-back period, which has been vetted by French
regulators for calculating market risk capital requirements. In 4Q12, trading VaR was EUR 30 million, stable
from 4Q11 and down 29% from EUR 42 million in 4Q10. The Group also utilises a “decennial approach” to
stress testing as it looks at potential loss based on the largest market fluctuations over a ten-year period, it
maintains limits around sensitivities, nominal exposures, and holding periods to control risks only partially
detected by VaR models or stress tests.
Capitalisation: Structure and Adequacy
The Group appropriately continues to bolster its capital position. Relative to its large European universal
bank peers, SG is not a leader, but is making progress as illustrated by the 20bps increase made each quarter
in Core Tier (Basel 2.5) over the last two years. The Group was able to raise equity in 2009, but recent
enhancements to capitalisation have come primarily from earnings retention, disposals and deleveraging. The
Group reduced risk weighted assets in 2012 vs. 2011 under the Basel 2.5 method, bringing them back at the
2009 level that was calculated under Basel 2. Given the difficulty of raising equity capital, DBRS views that
the Group's successful resizing and restructuring without limited impact on earnings power has become more
critical.
17 Financial Institutions: Banks & Trusts
Société
Générale S.A.
Report Date:
26 July 2013
SG increased its shareholders' equity, including minority interests, to EUR 54 billion at the end of 2012, up
from a lower base of EUR 31 billion at end-2007. Besides retained earnings, contributions came from a
capital increase of EUR 4.8 billion in October 2009 and the buy-back of its subordinated debt in November
2011. In 2012, the Group increased its Basel 2.5 Core tier 1 ratio by 170 bps through generation of earnings
(77bps), deleveraging (77bps), and to a lesser extent subsidiaries disposal (3bps) and other operations (18
bps). Emphasising its drive to build equity, the Group did not distribute dividends for 2011, and paid 25% of
net income in dividends (65% in script dividend) for 2012 as announced (excl. revaluation of own financial
liabilities). In 2012, the Bank's tangible equity/ tangible assets was just 3.79%, although well above 2.32% in
2007. Nonetheless, DBRS expects that further progress will be made in strengthening its capitalisation,
including its tangible equity/tangible assets ratio.
SG is steadily enhancing its regulatory capital ratios, increasing its Core Tier 1 ratio to 10.7% at end-2012,
based on Basel 2.5 from 9% at end-2011. SG has also increased its Tier 1 capital ratio to 12.5% at end-2012,
also continuing an upward trend.
To achieve a Core Tier 1 ratio close 9.5% by 2013 under the more demanding Basel III rules, SG's goal is to
benefit from the generation of earnings, and to lesser extent further reduction in its RWA, notably on the
legacy asset portfolio. By end-2013, SG estimates that the disposal of its Egyptian subsidiary and of TCW
(sales respectively closed in December 2012 and February 2013) will contribute a total of 45 bps under Basel
III.
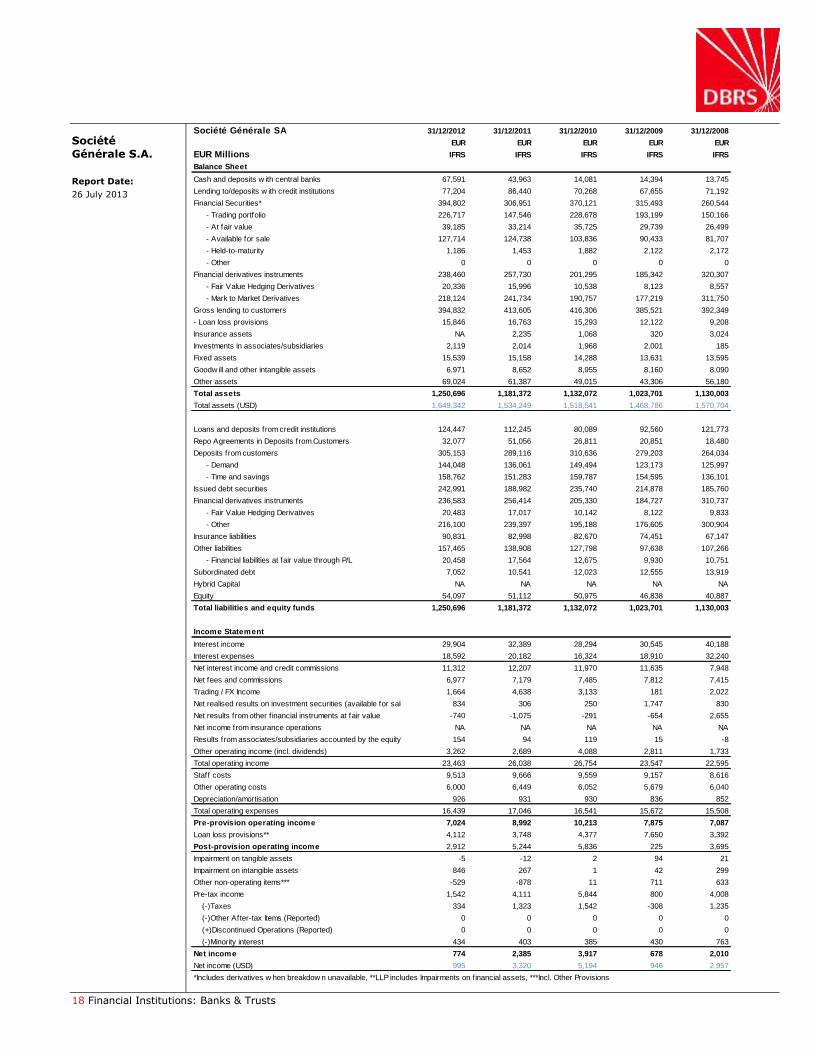
18 Financial Institutions: Banks & Trusts
Société
Générale S.A.
Report Date:
26 July 2013
Société Générale SA 31/12/2012 31/12/2011 31/12/2010 31/12/2009 31/12/2008
EUR EUR EUR EUR EUR
EUR Millions IFRS IFRS IFRS IFRS IFRS
Balance Sheet
Cash and deposits w ith central banks 67,591 43,963 14,081 14,394 13,745
Lending to/deposits w ith credit institutions 77,204 86,440 70,268 67,655 71,192
Financial Securities* 394,802 306,951 370,121 315,493 260,544
- Trading portfolio 226,717 147,546 228,678 193,199 150,166
- At fair value 39,185 33,214 35,725 29,739 26,499
- Available for sale 127,714 124,738 103,836 90,433 81,707
- Held-to-maturity 1,186 1,453 1,882 2,122 2,172
- Other 0 0 0 0 0
Financial derivatives instruments 238,460 257,730 201,295 185,342 320,307
- Fair Value Hedging Derivatives 20,336 15,996 10,538 8,123 8,557
- Mark to Market Derivatives 218,124 241,734 190,757 177,219 311,750
Gross lending to customers 394,832 413,605 416,306 385,521 392,349
- Loan loss provisions 15,846 16,763 15,293 12,122 9,208
Insurance assets NA 2,235 1,068 320 3,024
Investments in associates/subsidiaries 2,119 2,014 1,968 2,001 185
Fixed assets 15,539 15,158 14,288 13,631 13,595
Goodw ill and other intangible assets 6,971 8,652 8,955 8,160 8,090
Other assets 69,024 61,387 49,015 43,306 56,180
Total assets 1,250,696 1,181,372 1,132,072 1,023,701 1,130,003
Total assets (USD) 1,649,342 1,534,249 1,518,541 1,468,786 1,570,704
Loans and deposits from credit institutions 124,447 112,245 80,089 92,560 121,773
Repo Agreements in Deposits from Customers 32,077 51,056 26,811 20,851 18,480
Deposits from customers 305,153 289,116 310,636 279,203 264,034
- Demand 144,048 136,061 149,494 123,173 125,997
- Time and savings 158,762 151,283 159,787 154,595 136,101
Issued debt securities 242,991 188,982 235,740 214,878 185,760
Financial derivatives instruments 236,583 256,414 205,330 184,727 310,737
- Fair Value Hedging Derivatives 20,483 17,017 10,142 8,122 9,833
- Other 216,100 239,397 195,188 176,605 300,904
Insurance liabilities 90,831 82,998 82,670 74,451 67,147
Other liabilities 157,465 138,908 127,798 97,638 107,266
- Financial liabilities at fair value through P/L 20,458 17,564 12,675 9,930 10,751
Subordinated debt 7,052 10,541 12,023 12,555 13,919
Hybrid Capital NA NA NA NA NA
Equity 54,097 51,112 50,975 46,838 40,887
Total liabilities and equity funds 1,250,696 1,181,372 1,132,072 1,023,701 1,130,003
Income Statement
Interest income 29,904 32,389 28,294 30,545 40,188
Interest expenses 18,592 20,182 16,324 18,910 32,240
Net interest income and credit commissions 11,312 12,207 11,970 11,635 7,948
Net fees and commissions 6,977 7,179 7,485 7,812 7,415
Trading / FX Income 1,664 4,638 3,133 181 2,022
Net realised results on investment securities (available for sale) 834 306 250 1,747 830
Net results from other f inancial instruments at fair value -740 -1,075 -291 -654 2,655
Net income from insurance operations NA NA NA NA NA
Results from associates/subsidiaries accounted by the equity method 154 94 119 15 -8
Other operating income (incl. dividends) 3,262 2,689 4,088 2,811 1,733
Total operating income 23,463 26,038 26,754 23,547 22,595
Staff costs 9,513 9,666 9,559 9,157 8,616
Other operating costs 6,000 6,449 6,052 5,679 6,040
Depreciation/amortisation 926 931 930 836 852
Total operating expenses 16,439 17,046 16,541 15,672 15,508
Pre-provision operating income 7,024 8,992 10,213 7,875 7,087
Loan loss provisions** 4,112 3,748 4,377 7,650 3,392
Post-provision operating income 2,912 5,244 5,836 225 3,695
Impairment on tangible assets -5 -12 2 94 21
Impairment on intangible assets 846 267 1 42 299
Other non-operating items*** -529 -878 11 711 633
Pre-tax income 1,542 4,111 5,844 800 4,008
(-)Taxes 334 1,323 1,542 -308 1,235
(-)Other After-tax Items (Reported) 0 0 0 0 0
(+)Discontinued Operations (Reported) 0 0 0 0 0
(-)Minority interest 434 403 385 430 763
Net income 774 2,385 3,917 678 2,010
Net income (USD) 995 3,320 5,194 946 2,957
*Includes derivatives w hen breakdow n unavailable, **LLP includes Impairments on f inancial assets, ***Incl. Other Provisions
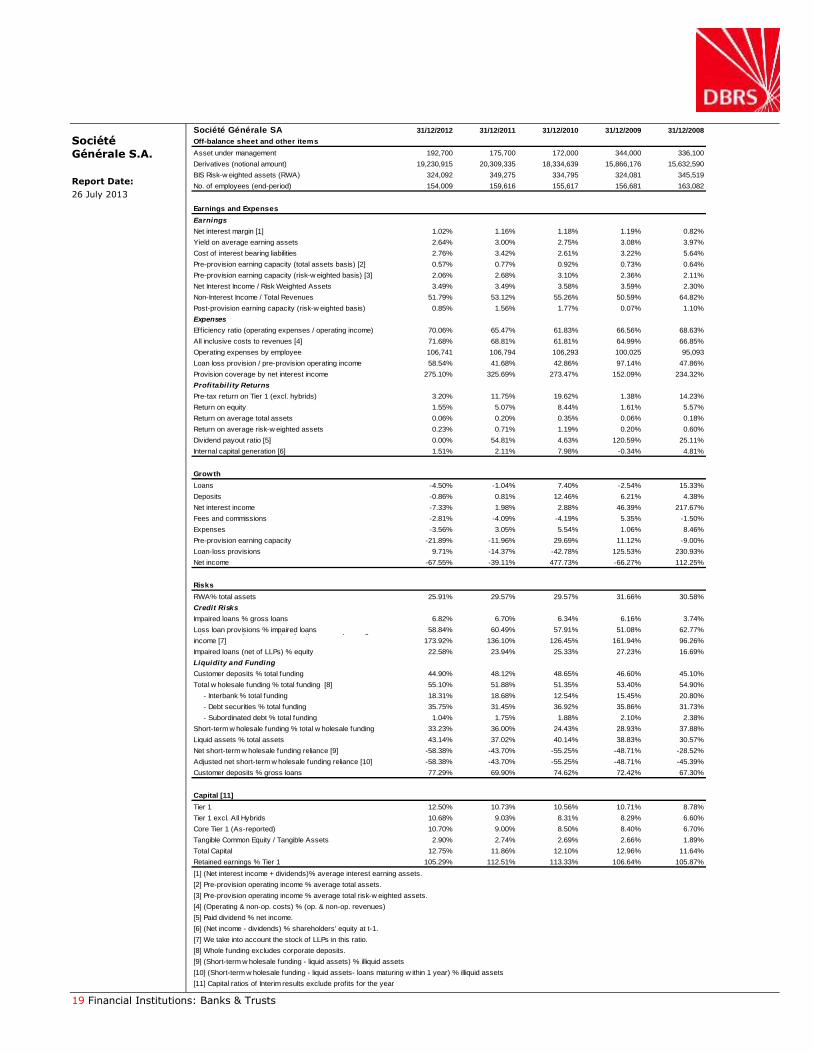
19 Financial Institutions: Banks & Trusts
Société
Générale S.A.
Report Date:
26 July 2013
Société Générale SA 31/12/2012 31/12/2011 31/12/2010 31/12/2009 31/12/2008
Off-balance sheet and other items
Asset under management 192,700 175,700 172,000 344,000 336,100
Derivatives (notional amount) 19,230,915 20,309,335 18,334,639 15,866,176 15,632,590
BIS Risk-w eighted assets (RWA) 324,092 349,275 334,795 324,081 345,519
No. of employees (end-period) 154,009 159,616 155,617 156,681 163,082
Earnings and Expenses
Earnings
Net interest margin [1] 1.02% 1.16% 1.18% 1.19% 0.82%
Yield on average earning assets 2.64% 3.00% 2.75% 3.08% 3.97%
Cost of interest bearing liabilities 2.76% 3.42% 2.61% 3.22% 5.64%
Pre-provision earning capacity (total assets basis) [2] 0.57% 0.77% 0.92% 0.73% 0.64%
Pre-provision earning capacity (risk-w eighted basis) [3] 2.06% 2.68% 3.10% 2.36% 2.11%
Net Interest Income / Risk Weighted Assets 3.49% 3.49% 3.58% 3.59% 2.30%
Non-Interest Income / Total Revenues 51.79% 53.12% 55.26% 50.59% 64.82%
Post-provision earning capacity (risk-w eighted basis) 0.85% 1.56% 1.77% 0.07% 1.10%
Expenses
Efficiency ratio (operating expenses / operating income) 70.06% 65.47% 61.83% 66.56% 68.63%
All inclusive costs to revenues [4] 71.68% 68.81% 61.81% 64.99% 66.85%
Operating expenses by employee 106,741 106,794 106,293 100,025 95,093
Loan loss provision / pre-provision operating income 58.54% 41.68% 42.86% 97.14% 47.86%
Provision coverage by net interest income 275.10% 325.69% 273.47% 152.09% 234.32%
Profitability Returns
Pre-tax return on Tier 1 (excl. hybrids) 3.20% 11.75% 19.62% 1.38% 14.23%
Return on equity 1.55% 5.07% 8.44% 1.61% 5.57%
Return on average total assets 0.06% 0.20% 0.35% 0.06% 0.18%
Return on average risk-w eighted assets 0.23% 0.71% 1.19% 0.20% 0.60%
Dividend payout ratio [5] 0.00% 54.81% 4.63% 120.59% 25.11%
Internal capital generation [6] 1.51% 2.11% 7.98% -0.34% 4.81%
Growth
Loans -4.50% -1.04% 7.40% -2.54% 15.33%
Deposits -0.86% 0.81% 12.46% 6.21% 4.38%
Net interest income -7.33% 1.98% 2.88% 46.39% 217.67%
Fees and commissions -2.81% -4.09% -4.19% 5.35% -1.50%
Expenses -3.56% 3.05% 5.54% 1.06% 8.46%
Pre-provision earning capacity -21.89% -11.96% 29.69% 11.12% -9.00%
Loan-loss provisions 9.71% -14.37% -42.78% 125.53% 230.93%
Net income -67.55% -39.11% 477.73% -66.27% 112.25%
Risks
RWA% total assets 25.91% 29.57% 29.57% 31.66% 30.58%
Credit Risks
Impaired loans % gross loans 6.82% 6.70% 6.34% 6.16% 3.74%
Loss loan provisions % impaired loans 58.84% 60.49% 57.91% 51.08% 62.77%Impaired loans (net of LLPs) % pre-provision operating
income [7] 173.92% 136.10% 126.45% 161.94% 96.26%
Impaired loans (net of LLPs) % equity 22.58% 23.94% 25.33% 27.23% 16.69%
Liquidity and Funding
Customer deposits % total funding 44.90% 48.12% 48.65% 46.60% 45.10%
Total w holesale funding % total funding [8] 55.10% 51.88% 51.35% 53.40% 54.90%
- Interbank % total funding 18.31% 18.68% 12.54% 15.45% 20.80%
- Debt securities % total funding 35.75% 31.45% 36.92% 35.86% 31.73%
- Subordinated debt % total funding 1.04% 1.75% 1.88% 2.10% 2.38%
Short-term w holesale funding % total w holesale funding 33.23% 36.00% 24.43% 28.93% 37.88%
Liquid assets % total assets 43.14% 37.02% 40.14% 38.83% 30.57%
Net short-term w holesale funding reliance [9] -58.38% -43.70% -55.25% -48.71% -28.52%
Adjusted net short-term w holesale funding reliance [10] -58.38% -43.70% -55.25% -48.71% -45.39%
Customer deposits % gross loans 77.29% 69.90% 74.62% 72.42% 67.30%
Capital [11]
Tier 1 12.50% 10.73% 10.56% 10.71% 8.78%
Tier 1 excl. All Hybrids 10.68% 9.03% 8.31% 8.29% 6.60%
Core Tier 1 (As-reported) 10.70% 9.00% 8.50% 8.40% 6.70%
Tangible Common Equity / Tangible Assets 2.90% 2.74% 2.69% 2.66% 1.89%
Total Capital 12.75% 11.86% 12.10% 12.96% 11.64%
Retained earnings % Tier 1 105.29% 112.51% 113.33% 106.64% 105.87%
[1] (Net interest income + dividends)% average interest earning assets.
[2] Pre-provision operating income % average total assets.
[3] Pre-provision operating income % average total risk-w eighted assets.
[4] (Operating & non-op. costs) % (op. & non-op. revenues)
[5] Paid dividend % net income.
[6] (Net income - dividends) % shareholders' equity at t-1.
[7] We take into account the stock of LLPs in this ratio.
[8] Whole funding excludes corporate deposits.
[9] (Short-term w holesale funding - liquid assets) % illiquid assets
[10] (Short-term w holesale funding - liquid assets- loans maturing w ithin 1 year) % illiquid assets
[11] Capital ratios of Interim results exclude profits for the year
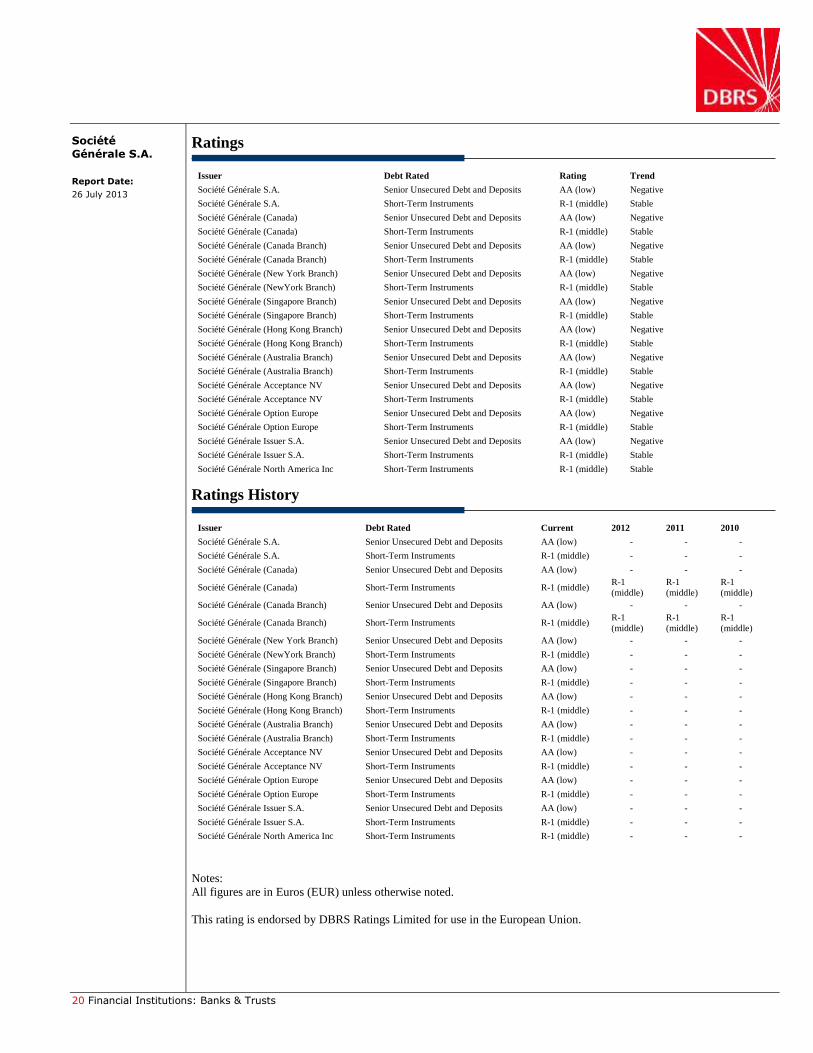
20 Financial Institutions: Banks & Trusts
Société
Générale S.A.
Report Date:
26 July 2013
Ratings
Issuer Debt Rated Rating Trend
Société Générale S.A. Senior Unsecured Debt and Deposits AA (low) Negative
Société Générale S.A. Short-Term Instruments R-1 (middle) Stable
Société Générale (Canada) Senior Unsecured Debt and Deposits AA (low) Negative
Société Générale (Canada) Short-Term Instruments R-1 (middle) Stable
Société Générale (Canada Branch) Senior Unsecured Debt and Deposits AA (low) Negative
Société Générale (Canada Branch) Short-Term Instruments R-1 (middle) Stable
Société Générale (New York Branch) Senior Unsecured Debt and Deposits AA (low) Negative
Société Générale (NewYork Branch) Short-Term Instruments R-1 (middle) Stable
Société Générale (Singapore Branch) Senior Unsecured Debt and Deposits AA (low) Negative
Société Générale (Singapore Branch) Short-Term Instruments R-1 (middle) Stable
Société Générale (Hong Kong Branch) Senior Unsecured Debt and Deposits AA (low) Negative
Société Générale (Hong Kong Branch) Short-Term Instruments R-1 (middle) Stable
Société Générale (Australia Branch) Senior Unsecured Debt and Deposits AA (low) Negative
Société Générale (Australia Branch) Short-Term Instruments R-1 (middle) Stable
Société Générale Acceptance NV Senior Unsecured Debt and Deposits AA (low) Negative
Société Générale Acceptance NV Short-Term Instruments R-1 (middle) Stable
Société Générale Option Europe Senior Unsecured Debt and Deposits AA (low) Negative
Société Générale Option Europe Short-Term Instruments R-1 (middle) Stable
Société Générale Issuer S.A. Senior Unsecured Debt and Deposits AA (low) Negative
Société Générale Issuer S.A. Short-Term Instruments R-1 (middle) Stable
Société Générale North America Inc Short-Term Instruments R-1 (middle) Stable
Ratings History
Issuer Debt Rated Current 2012 2011 2010
Société Générale S.A. Senior Unsecured Debt and Deposits AA (low) - - -
Société Générale S.A. Short-Term Instruments R-1 (middle) - - -
Société Générale (Canada) Senior Unsecured Debt and Deposits AA (low) - - -
Société Générale (Canada) Short-Term Instruments R-1 (middle) R-1
(middle)
R-1
(middle)
R-1
(middle)
Société Générale (Canada Branch) Senior Unsecured Debt and Deposits AA (low) - - -
Société Générale (Canada Branch) Short-Term Instruments R-1 (middle) R-1
(middle)
R-1
(middle)
R-1
(middle)
Société Générale (New York Branch) Senior Unsecured Debt and Deposits AA (low) - - -
Société Générale (NewYork Branch) Short-Term Instruments R-1 (middle) - - -
Société Générale (Singapore Branch) Senior Unsecured Debt and Deposits AA (low) - - -
Société Générale (Singapore Branch) Short-Term Instruments R-1 (middle) - - -
Société Générale (Hong Kong Branch) Senior Unsecured Debt and Deposits AA (low) - - -
Société Générale (Hong Kong Branch) Short-Term Instruments R-1 (middle) - - -
Société Générale (Australia Branch) Senior Unsecured Debt and Deposits AA (low) - - -
Société Générale (Australia Branch) Short-Term Instruments R-1 (middle) - - -
Société Générale Acceptance NV Senior Unsecured Debt and Deposits AA (low) - - -
Société Générale Acceptance NV Short-Term Instruments R-1 (middle) - - -
Société Générale Option Europe Senior Unsecured Debt and Deposits AA (low) - - -
Société Générale Option Europe Short-Term Instruments R-1 (middle) - - -
Société Générale Issuer S.A. Senior Unsecured Debt and Deposits AA (low) - - -
Société Générale Issuer S.A. Short-Term Instruments R-1 (middle) - - -
Société Générale North America Inc Short-Term Instruments R-1 (middle) - - -
Notes:
All figures are in Euros (EUR) unless otherwise noted.
This rating is endorsed by DBRS Ratings Limited for use in the European Union.
21 Financial Institutions: Banks & Trusts
Société
Générale S.A.
Report Date:
26 July 2013
Copyright © 2013, DBRS Limited, DBRS, Inc. and DBRS Ratings Limited (collectively, DBRS). All rights reserved. The information upon which DBRS ratings
and reports are based is obtained by DBRS from sources DBRS believes to be accurate and reliable. DBRS does not audit the information it receives in
connection with the rating process, and it does not and cannot independently verify that information in every instance. The extent of any factual investigation or
independent verification depends on facts and circumstances. DBRS ratings, reports and any other information provided by DBRS are provided “as is” and
without representation or warranty of any kind. DBRS hereby disclaims any representation or warranty, express or implied, as to the accuracy, timeliness,
completeness, merchantability, fitness for any particular purpose or non-infringement of any of such information. In no event shall DBRS or its directors, officers,
employees, independent contractors, agents and representatives (collectively, DBRS Representatives) be liable (1) for any inaccuracy, delay, loss of data,
interruption in service, error or omission or for any damages resulting therefrom, or (2) for any direct, indirect, incidental, special, compensatory or consequential
damages arising from any use of ratings and rating reports or arising from any error (negligent or otherwise) or other circumstance or contingency within or
outside the control of DBRS or any DBRS Representative, in connection with or related to obtaining, collecting, compiling, analyzing, interpreting,
communicating, publishing or delivering any such information. Ratings and other opinions issued by DBRS are, and must be construed solely as, statements of
opinion and not statements of fact as to credit worthiness or recommendations to purchase, sell or hold any securities. A report providing a DBRS rating is
neither a prospectus nor a substitute for the information assembled, verified and presented to investors by the issuer and its agents in connection with the sale of
the securities. DBRS receives compensation for its rating activities from issuers, insurers, guarantors and/or underwriters of debt securities for assigning ratings
and from subscribers to its website. DBRS is not responsible for the content or operation of third party websites accessed through hypertext or other computer
links and DBRS shall have no liability to any person or entity for the use of such third party websites. This publication may not be reproduced, retransmitted or
distributed in any form without the prior written consent of DBRS. ALL DBRS RATINGS ARE SUBJECT TO DISCLAIMERS AND CERTAIN
LIMITATIONS. PLEASE READ THESE DISCLAIMERS AND LIMITATIONS AT http://www.dbrs.com/about/disclaimer. ADDITIONAL
INFORMATION REGARDING DBRS RATINGS, INCLUDING DEFINITIONS, POLICIES AND METHODOLOGIES, ARE AVAILABLE ON
http://www.dbrs.com.