Lasting Promise: Long-Term Effects of a Transition-to ...
12
Lasting Promise: Long-Term Effects of a Transition-to-Kindergarten Program Chris N. King, M.A. & Jonathan Bennett, Ph.D. The University of Memphis 2 nd Biennial Population & Public Policy Conference February 8, 2019
Transcript of Lasting Promise: Long-Term Effects of a Transition-to ...

Lasting Promise: Long-Term Effects of a Transition-to-Kindergarten Program
Chris N. King, M.A. & Jonathan Bennett, Ph.D.
The University of Memphis
2nd Biennial Population & Public Policy Conference
February 8, 2019
1/11
Transition-to-KindergartenKindergarten was originally a “transition” period, mostly for socialization (Beatty 2000). If it’s a “grade” itself, where’s the
transition?
Children arrive with dramatically differing levels of preacademic abilities (Lee & Burkam 2002), social skills (Wildenger &
McIntyre 2011), social maturity (Logue 2007), and behavioral skills (McClelland, Acock, & Morrison 2006).
Achievement gaps have been observed in kindergarten by SES (Ensminger & Fothergill 2003; Gutman, Sameroff, & Cole
2003) and race, between Black and White children (Quinn 2015).
Transition-to-kindergarten: Holistic, time-bound projects that use academic instruction to remediate skills deficits and
socioemotional preparation to set classroom expectations and build trust between the new school, teacher, and child.
Studies of established projects: mostly pre-test posttest; a couple have followed up at the end of kindergarten.
Studies following individuals for longer periods: behavioral disorders or developmental delays; ECLS-K
Here, we present the literacy scores of participants in a transition-to-kindergarten program up to the beginning of 4th
grade, and compare them to entering kindergarteners who did not participate in the intervention.

Promise SchoolFour-week transition program developed as part of Indianola Promise Community DOE grant, fall 2013.
Components:
• Educational instruction (letters, numbers, phonics, shapes)
• Behavioral, social, and emotional preparation (standing in lines, tying shoes, independent bathroom trips)
• Time with teacher, in kindergarten classroom
• Resources upon completion (school uniform & backpack with school supplies)
Head Start teacher and kindergarten teacher in actual kindergarten classroom together, open to parents and family.
Ecological idea: ties between child and teacher, classroom, parents, and other children build trust and make children
more receptive to academic instruction (Pianta, Rimm-Kaufman, & Cox 1999).
2/11
Promise School Non-Participants Test/Significance Test
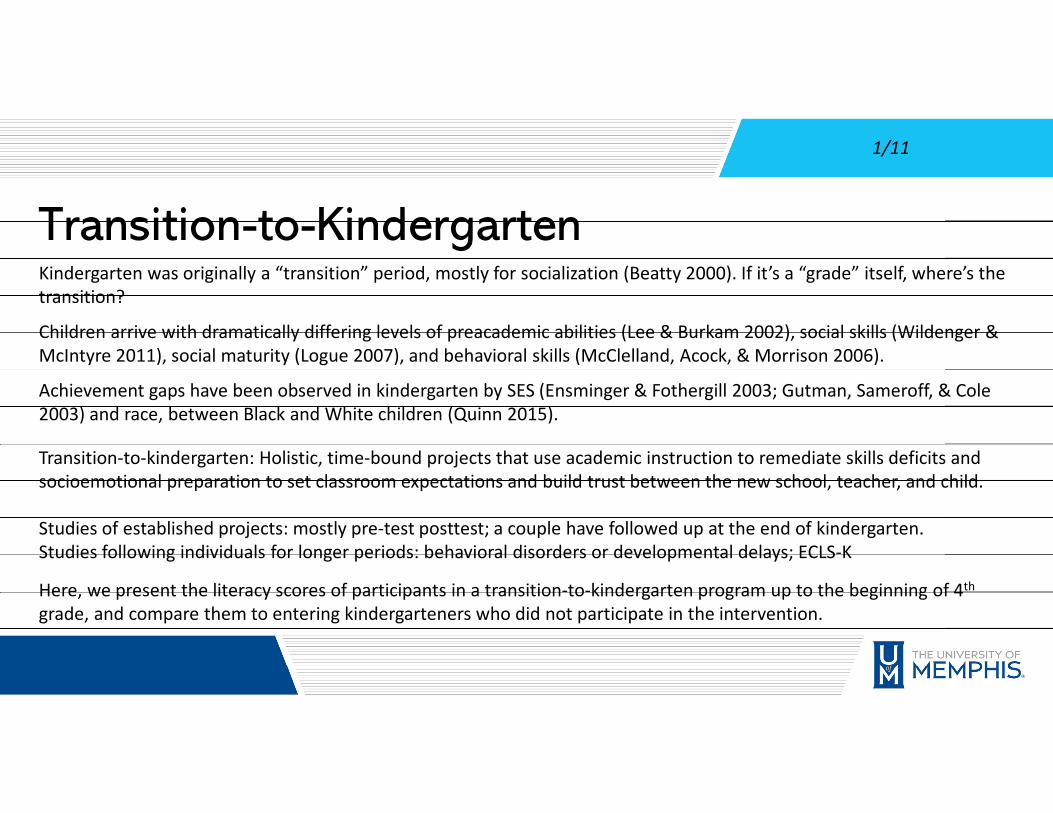
N 98 54 NA NA
Mean tests per subject 4.29 3.89 p < .05 T-test
Percent female 52.0% 51.9% --- Fisher exact test
Percent African American 99.0% 92.6% p < .1 Fisher exact test
Median date of birth Jan 28, 2008 Dec 28, 2007 ---T-test (linear
transformation)
Percent with enrollment forms on file 94.9% (93) 57.4% (31) p < .001 Fisher exact test
Median date enrollment form taken Jun 28, 2013 Sep 23, 2013 p < .01T-test (linear
transformation)
Percent with household income $10k+ 46.7% 36.7% --- Fisher exact test
Percent parent attended college 62.6% 44.8% --- Fisher exact test
Percent attended Head Start 84.1% 83.9% --- Fisher exact test
Percent who read a picture book 3+ times per week 53.3% 51.6% --- Fisher exact test
Descriptive Profile of the Sample
3/11
4/11
0
20
40
60
80
100
120
2013 2014 2015 2016 2017
Treatment 98 95 90 63 74
Control 54 51 43 31 31
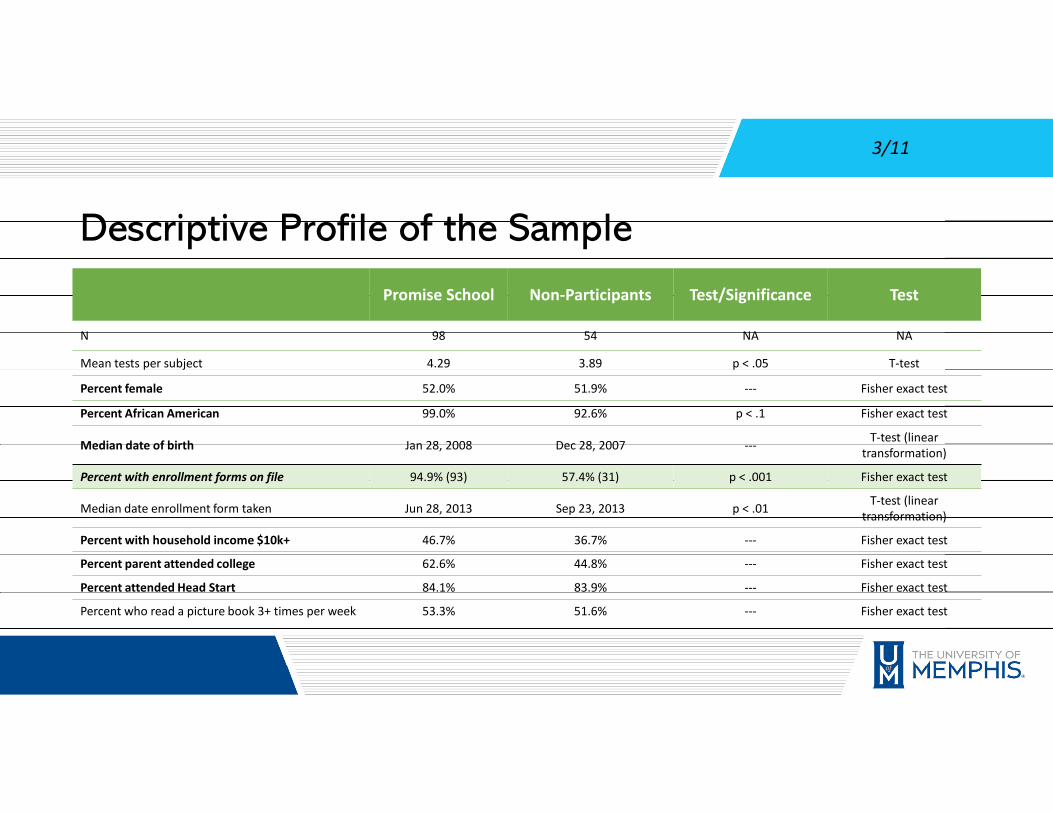
Figure A: Number of Participants Taking Assessment Each Year
Treatment Control
Three different computer-adaptive tests: MAP, STAR Early
Literacy, STAR Reading.
Use of NCE to account for different scoring scales.
Adjusted for held students.
ProcedureCase-control design to compare reading achievement of
Promise School enrollees to other students entering
kindergarten at the same school in fall 2013.
* = p<0.1; ** = p<0.05; *** = p<0.01
National Norm
20
30
40
50
60
70
2013* 2014 2015** 2016** 2017*
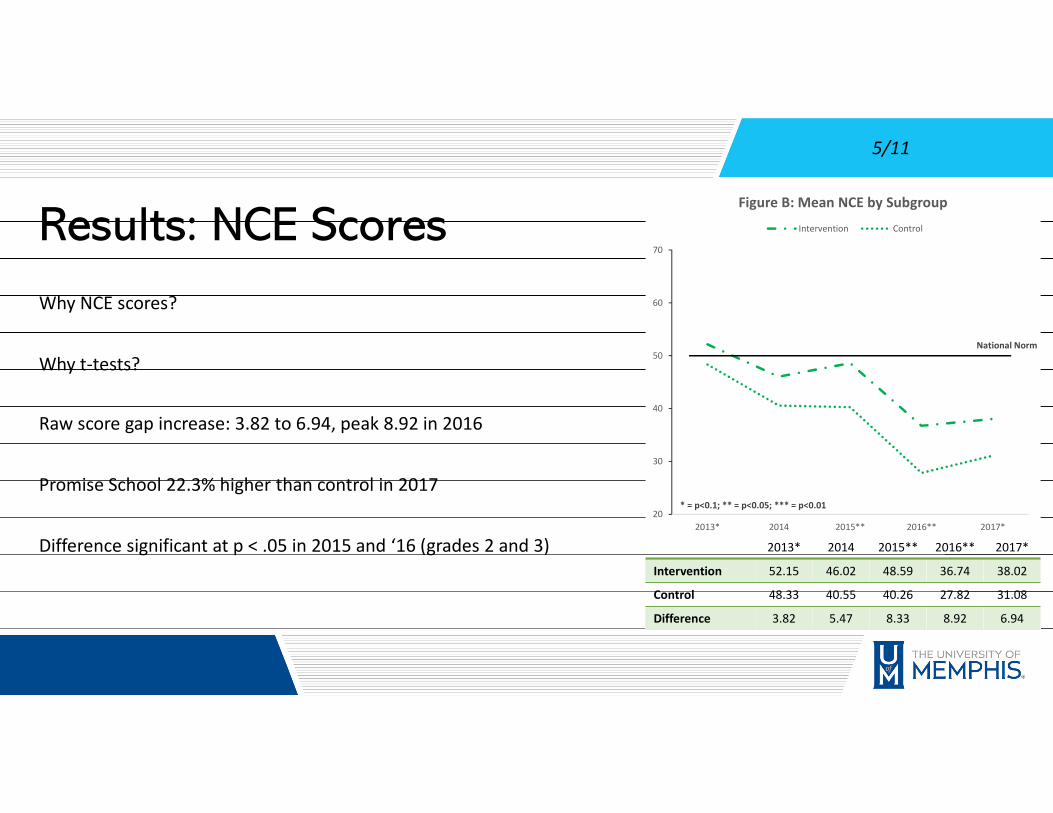
Figure B: Mean NCE by Subgroup
Intervention Control
2013* 2014 2015** 2016** 2017*
Intervention 52.15 46.02 48.59 36.74 38.02
Control 48.33 40.55 40.26 27.82 31.08
Difference 3.82 5.47 8.33 8.92 6.94
Why NCE scores?
Why t-tests?
Raw score gap increase: 3.82 to 6.94, peak 8.92 in 2016
Difference significant at p < .05 in 2015 and ‘16 (grades 2 and 3)
Promise School 22.3% higher than control in 2017
Results: NCE Scores
5/11
* = p<0.1; ** = p<0.05; *** = p<0.01
National Norm
0
20
40
60
80
100
2013 2014 2015 2016 2017
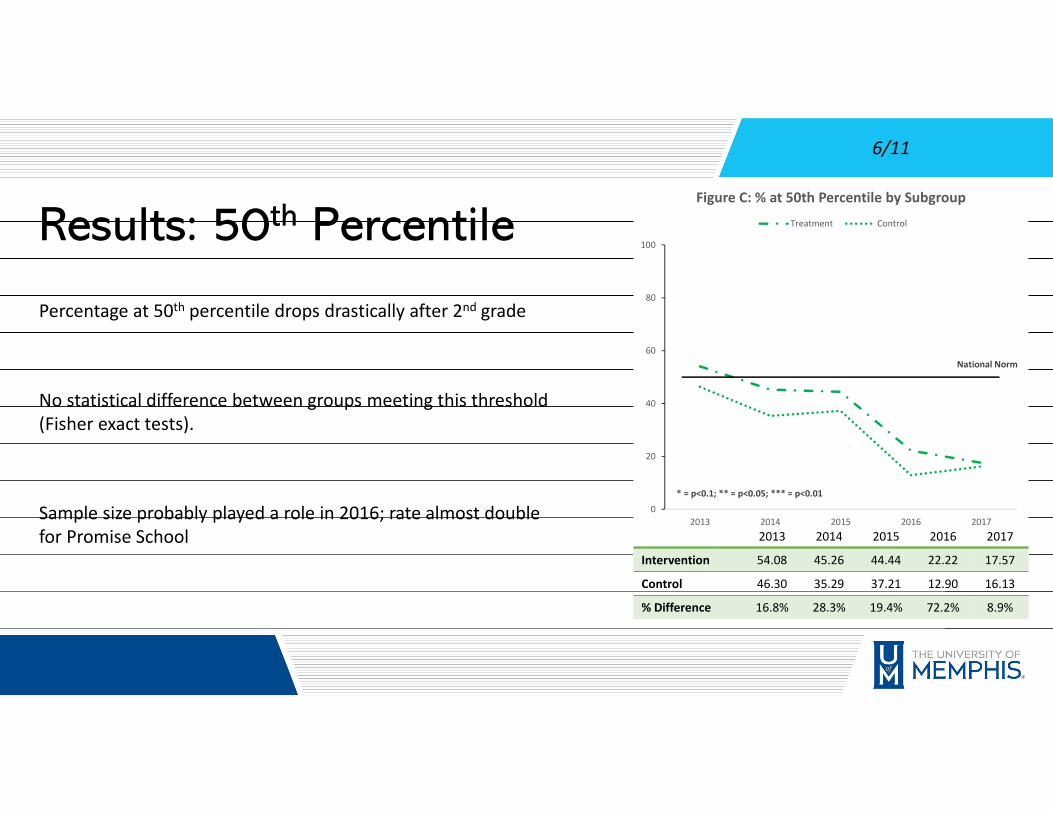
Figure C: % at 50th Percentile by Subgroup
Treatment Control
2013 2014 2015 2016 2017
Intervention 54.08 45.26 44.44 22.22 17.57
Control 46.30 35.29 37.21 12.90 16.13
% Difference 16.8% 28.3% 19.4% 72.2% 8.9%
Results: 50th Percentile
Percentage at 50th percentile drops drastically after 2nd grade
No statistical difference between groups meeting this threshold
(Fisher exact tests).
Sample size probably played a role in 2016; rate almost double
for Promise School
6/11
National Norm
* = p<0.1; ** = p<0.05; *** = p<0.01
0
20
40
60
80
100
2013 2014 2015 2016 2017
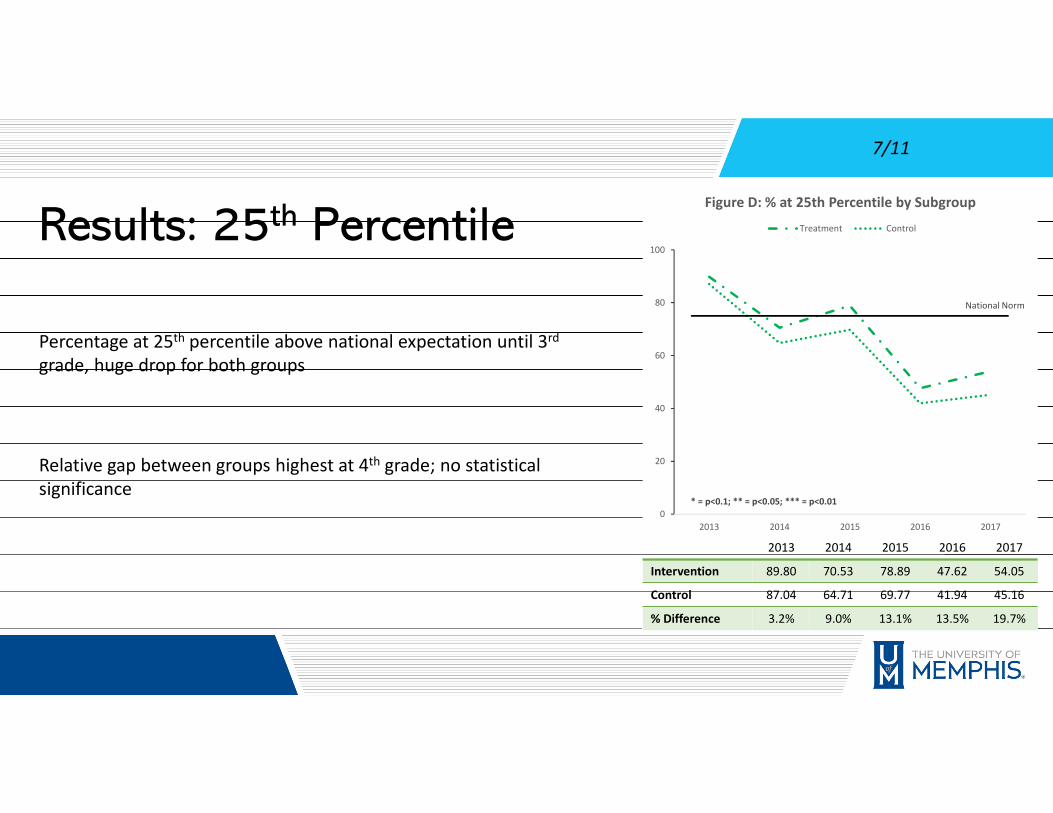
Figure D: % at 25th Percentile by Subgroup
Treatment Control
2013 2014 2015 2016 2017
Intervention 89.80 70.53 78.89 47.62 54.05
Control 87.04 64.71 69.77 41.94 45.16
% Difference 3.2% 9.0% 13.1% 13.5% 19.7%
Results: 25th Percentile
Percentage at 25th percentile above national expectation until 3rd
grade, huge drop for both groups
Relative gap between groups highest at 4th grade; no statistical
significance
7/11
National Norm
* = p<0.1; ** = p<0.05; *** = p<0.010
20
40
60
80
100
2013 2014** 2015*** 2016*** 2017
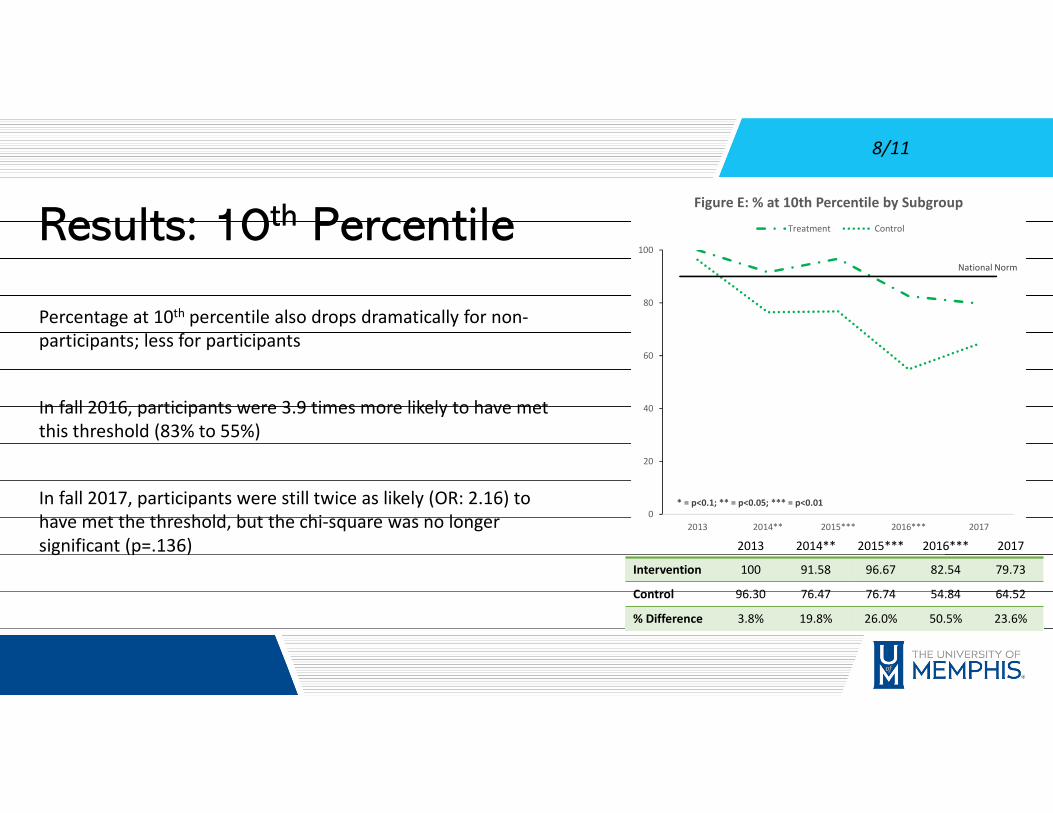
Figure E: % at 10th Percentile by Subgroup
Treatment Control
2013 2014** 2015*** 2016*** 2017
Intervention 100 91.58 96.67 82.54 79.73
Control 96.30 76.47 76.74 54.84 64.52
% Difference 3.8% 19.8% 26.0% 50.5% 23.6%
Results: 10th Percentile
Percentage at 10th percentile also drops dramatically for non-
participants; less for participants
In fall 2016, participants were 3.9 times more likely to have met
this threshold (83% to 55%)
In fall 2017, participants were still twice as likely (OR: 2.16) to
have met the threshold, but the chi-square was no longer
significant (p=.136)
8/11

Conclusions
There’s definitely evidence of distance between the groups years later, but sample size limits certainty.
Incomplete data is a limitation, both for control variables (income, education) and the attrition on the dependent
variable over time.
Lumping multiple cohorts together has resulted in extremely noisy models, but is an option.
Lack of distance between groups at baseline, followed by accelerated growth later, could reinforce theory behind
transition programs.
But, improved K-entry numbers (which may be a spillover effect of program, via curriculum alignment) limit the ability to
observe an effect from the program.
9/11
Works CitedBeatty, B. (2000). “The letter killeth”: Americanization and multicultural education in kindergartens in the United States, 1856-1920 (pp. 42-58). In Roberta Wollons (Ed.),
Kindergartens and cultures: The global diffusion of an idea. New Haven, CT: Yale University Press.
Ensminger, M.E., & Fothergill, K. (2003). A decade of measuring SES: What it tells us and where to go from here. In M. H. Bornstein & R. H. Bradley (Eds.), Monographs in parenting
series. Socioeconomic status, parenting, and child development (pp. 13-27). Mahwah, NJ: Lawrence Erlbaum Associates Publishers.
Gutman, L.M., Sameroff, A.J., & Cole, R. (2003). Academic growth curve trajectories from 1st grade to 12th grade: Effects of multiple social risk factors and preschool child factors.
Developmental Psychology, 39(4), 777-790.
La Paro, K.M., Kraft-Sayre, M., & Pianta, R.C. (2003). Preschool to kindergarten transition activities: Involvement and satisfaction of families and teachers. Journal of Research in
Childhood Education, 17(2), 147-158.
Lee, V.E., & Burkam, D.T. (2002). Inequality at the starting gate: Social background differences in achievement as children begin school. Washington, DC: Economic Policy Institute
Logue, M.E. (2007). Early childhood learning standards: Tools for promoting social and academic success in kindergarten. Children and Schools, 29(1), 35-43.
McClelland, M.M., Acock, A.C., & Morrison, F.J. (2006). The impact of kindergarten learning-related skills on academic trajectories at the end of elementary school. Early Childhood
Research Quarterly, 21, 471-490.
Pianta, R.C., Rimm-Kaufman, S.E., & Cox, M.J. (1999). An ecological approach to kindergarten transition. In R.C. Pianta & M. Cox (Eds), The transition to kindergarten (pp. 305-316).
Baltimore, MD: Paul H. Brookes.
Wildenger, L.K., & McIntyre, L.L. (2011). Family concerns and involvement during kindergarten transition. Journal of Child and Family Studies, 20(4), 387-396.
10/11
AcknowledgementsThe Indianola Promise Community program is funded by a US Department of Education Promise Neighborhood grant. The content of this presentation was developed through an
evaluation partnership with the University of Memphis and does not reflect the views of the Department of Education, Delta Health Alliance, the Indianola Promise Community, or
its affiliates.
Questions – Comments?
11/11