Last page The Commonwealth Association of Planners’ State of Commonwealth Cities: Scoping Study...
25
The Commonwealth Association of Planners’ State of Commonwealth Cities: Scoping Study Will French Royal Town Planning Institute COMMONWEALTH INCLUSIVE CITIES NETWORK, AHMEDABAD 10 - 12 JUNE 2010
-
Upload
herbert-potter -
Category
Documents
-
view
216 -
download
0
Transcript of Last page The Commonwealth Association of Planners’ State of Commonwealth Cities: Scoping Study...

last page
The Commonwealth Association of Planners’
State of Commonwealth Cities:
Scoping StudyWill French
Royal Town Planning Institute
COMMONWEALTH INCLUSIVE CITIES NETWORK,AHMEDABAD
10 - 12 JUNE 2010

ComHabitat: a partnership
with links beyond to Built Environment Professions in the Commonwealth (BEPIC)
– Commonwealth Association of Surveying and Land Economy (CASLE)
– Commonwealth Engineering Council (CEE)
– Commonwealth Association of Architects (CAA)

ComHabitat’s Agenda
• 1999 Commonwealth goal:−Demonstrated progress towards
adequate shelter for all with secure tenure and access to essential services in every community by 2015
• 2005 ‘Aberdeen Agenda’ flags key principles for local government:−Democratic, legal framework, accountable,
open to scrutiny, inclusive, equitable and resourced
• 2007 New Delhi Statement:−Call to promote ‘inclusive cities’ in policy-
making
• 2007 Commonwealth People’s Forum:−Request for a State of Commonwealth
Cities Report

A State of Commonwealth Cities Report
• Objectives are to:
– Measure progress towards the Commonwealth goal.
– Create a partnership of cities to develop policy responses to human settlement challenges.
– Encourage greater dialogue between governments and civil society on urban development.
– Build the basis for Commonwealth leadership through an action-research programme on Commonwealth cities.

CCGHS Goal: How are we doing?
‘ Demonstrated progress towards adequate shelter for all with secure tenure and access to essential services in every community by 2015 ’ .
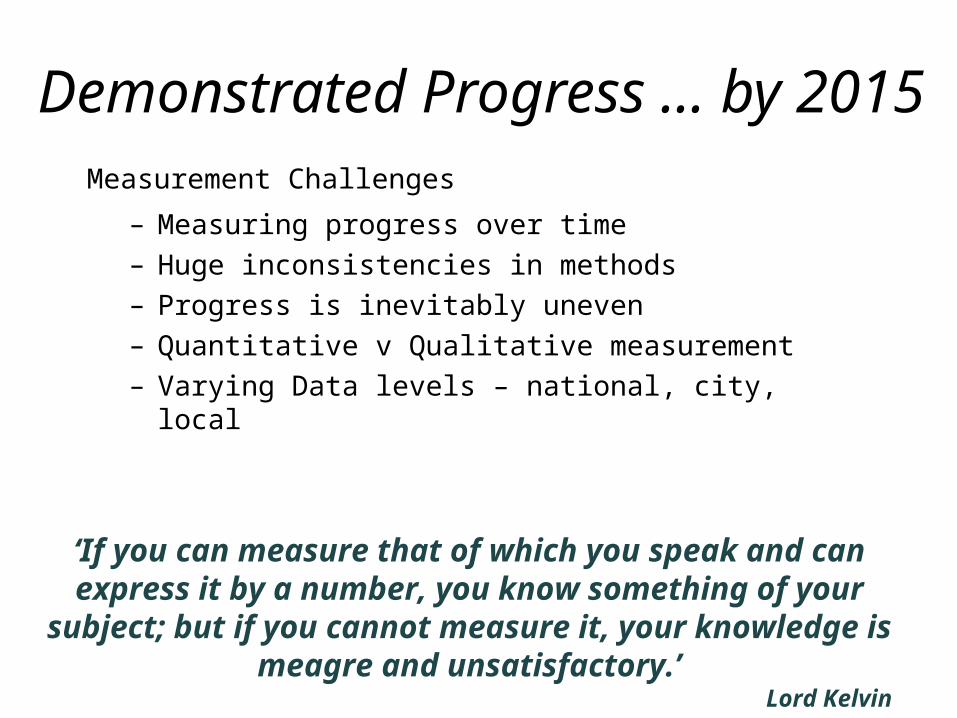
Demonstrated Progress … by 2015
Measurement Challenges
– Measuring progress over time– Huge inconsistencies in methods– Progress is inevitably uneven– Quantitative v Qualitative measurement– Varying Data levels – national, city, local
‘If you can measure that of which you speak and can express it by a number, you know
something of your subject; but if you cannot measure it, your knowledge is meagre and
unsatisfactory.’Lord Kelvin

… adequate shelter for all …
•% of population living in slums. – Increased globally since 1990. – Commonwealth has a higher % in
urban slums than the world as a whole. – Population growth & economic outlook
likely to fuel growth.
• <5 yrs mortality - indicator of life chances: – Rates in 14 Commonwealth countries are
above global levels
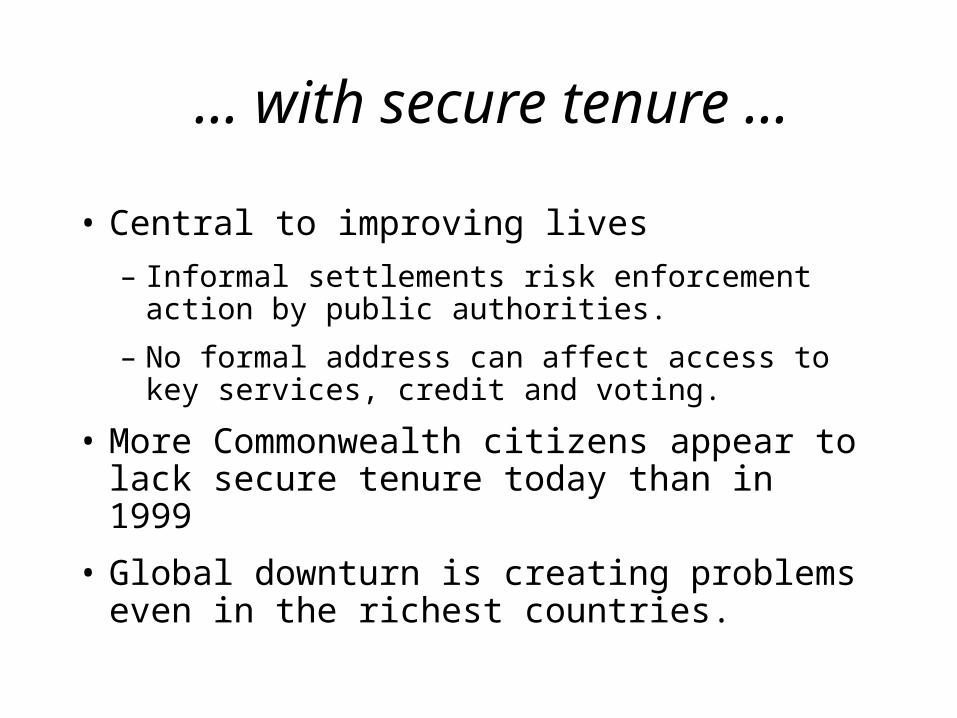
… with secure tenure …
• Central to improving lives
– Informal settlements risk enforcement action by public authorities.
– No formal address can affect access to key services, credit and voting.
• More Commonwealth citizens appear to lack secure tenure today than in 1999
• Global downturn is creating problems even in the richest countries.

… and access to essential services.
Water & sanitation, electricity, education and health care
Evidence suggests in the Commonwealth: – Basic services are lacking in most cities – In many countries
• 1 in 5 city dwellers lack clean water • 1 in 3 have no adequate sanitation
– Some reduction in proportion without access to schools. BUT …… the numbers of children have
increased.

The CHGS goal - How are we doing?
‘ Demonstrated progress towards adequate shelter for all with secure tenure and access to essential services in every community by 2015 ’ .
... WELL, NOT ALL THAT WELL!

Meanwhile, other challenges have come to the fore

Cities are growing at an accelerating rate
1970
RURAL63%
URBAN37%
2000
RURAL53%
RURAL40%
URBAN47%
URBAN60%
• Commonwealth cities were home to 261m people in 2000. There will be 451m in 2015 – a 73 % increase.
• Growth is 23.5m a year or ... • ... about 65,000 a day• Most urban growth in smaller
centres with little management capacity 2030

Inclusive Cities- basic data
Country
% Annual Growth 2005-2010 Urban Population (000s)
% pop in urban areas
% urban pop
living in slums(2001)Urban Rural 2007 2025 2050 2007 2050
Australia 1.2 -0.6 18,373 22,266 26,313 88.6 93.8 1.6Canada 1.0 0.4 26,394 31,445 37,583 80.3 87.9 5.8India 2.4 1.1 341,247 538,055 914,888 29.2 55.2 55.5Malaysia 3.0 -1.3 18,484 27,187 34,816 69.6 87.9 2Papua New Guinea 1.9 2 791 1,362 3,319 12.5 29.8 19Sierra Leone 2.9 1.5 2,194 3,949 8,444 37.4 62.4 —South Africa 1.4 -0.7 29,266 36,073 44,235 60.2 79.6 13.6Tanzania 4.2 1.9 10,128 21,029 45,946 25 54 92.1Trinidad and Tobago 2.9 0.0 171 291 507 12.9 38.3 32United Kingdom 0.5 -0.4 54,620 59,738 64,569 89.9 94 5.6Commonwealth 2.5 n/a 737,945 1,159,857 1,930,986 35.5 60.2 53.4Total World 2.0 0.4 3,293,944 4,584,233 6,398,291 49.4 69.6 31.6

Most Cities are mushrooming faster
Source: Angel, Sheppard and Civco

Transport, Infrastructure and Waste Management
• Car dependency tends to increase faster than the population as a whole
• Public transport is not keeping pace with population growth
• Infrastructure provided in the colonial era is coming to the end of its life and needs replacing which is costly
• In many settlements 30-60% solid waste remains uncollected
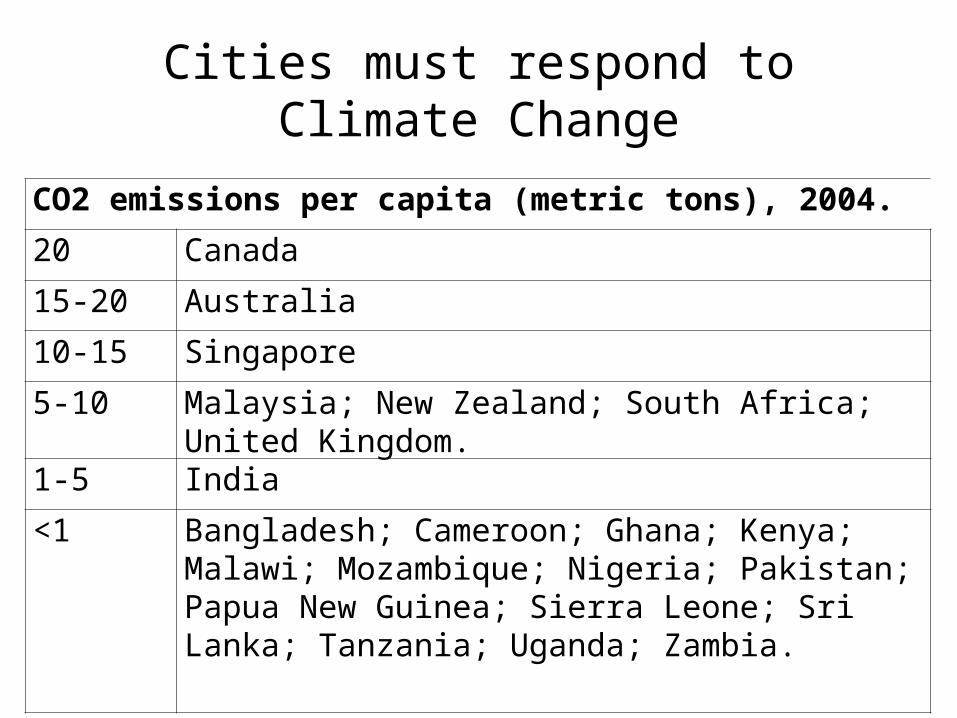
Cities must respond to Climate Change
CO2 emissions per capita (metric tons), 2004.
20 Canada
15-20 Australia
10-15 Singapore
5-10 Malaysia; New Zealand; South Africa; United Kingdom.
1-5 India
<1 Bangladesh; Cameroon; Ghana; Kenya; Malawi; Mozambique; Nigeria; Pakistan; Papua New Guinea; Sierra Leone; Sri Lanka; Tanzania; Uganda; Zambia.

Cities must respond to Climate Change
• Adaptation – 707 Commonwealth Cities are in the Low
Elevation Coastal Zone so liable to flood.– Hotter temperatures– Catastrophic events – hurricanes and
flooding
• Mitigation – cities produce 70% of greenhouse gases– Better building regs– Better recycling– Curb car use

… and in some cities inequality is rife
Gini Coefficient(0 represents absolute equality, 100 absolute
inequality).
Country Urban Areas
30 to 40(moderate levels of inequality;
political stability and civil society participation)
Pakistan, Canada, Bangladesh, Tanzania, Australia, UK, NZ, India, Trinidad and Tobago, Malawi
Urban Australia, Freetown, Urban India , Urban Pakistan, Dar es Salaam,
40 to 50(Inequality approaching high levels; could discourage investment and
lead to sporadic protests and riots)
Sri Lanka, Ghana, KenyaSingapore, Nigeria, Cameroon, Jamaica, Uganda, Mozambique, Malaysia
Urban Bangladesh, Colombo, Urban Cameroon, Urban Uganda
50 to 60(Relatively high levels of inequality reflecting institutional and structural
failures in income distribution)
Gambia, Swaziland, Zambia, PNG, South Africa
Accra, Maputo, Urban Botswana, Nairobi
Over 60(Extremely high levels of inequality not only among individuals but also among social groups. High risk of
social unrest or civil conflict)
Botswana, Sierra Leone, Lesotho, Namibia
Urban Namibia, Durban, Johannesburg

In summary: the crisis is urban
• Urban pop is rising - 73% from 2000-15 … and in an economic slowdown.
• Growth on this scale carries global threats:– Food insecurity from urban sprawl, – Contributions to climate change– Health and social cohesion
• The trajectory of cities must change … and it can:– Cities are places of economic opportunity– Locations for innovation and entrepreneurs– Land value increases are a powerful economic
stimulus

It is a Management Challenge
– Poverty & economic development
– Education & health– Environment, shelter, farms &
forests – Vulnerability to hazards.
• Profile of cities needs raising ... The significance of cities must
berecognised
… City managers need support.
• Well performing cities are the key to our future:
A role for the Commonwealth
• Commonwealth has a unique leadership opportunity
• A network with common goals• Opportunities for:
– inter-city cooperation– mutual learning– consider new approaches, – and share experiences
• Can help promote stronger and more sustainable urban settlements

Network of Inclusive Commonwealth Cities
• Ahmedabad• Birmingham• Brisbane• Ethekwini
(Durban)• Freetown• Hyderabad
• Kuala Lumpur• Dar es Salaam• Metro
Vancouver• Port of Spain• Johannesburg• Port Moresby
Pilot Cities

Pilot Cities
Low % slums
(<10%)Medium % slums
(10–50%)High % slums
(>50%)
High urban growth (>4%)
Dar es Salaam
Medium urban
growth (2-4%)
Kuala Lumpur Port of SpainAhmedabad, Hyderabad, Freetown
Low urban growth (<2%)
Brisbane, Birmingham,
Metro Vancouver
Durban/ eThekwini, Johannesburg, Port
Moresby

Proposals for Action research
• Systematic analysis of city-level information to provide an evidence base to improve lives and the sustainability of Commonwealth cities
• Four proposed themes:
1. Monitor the1999 Commonwealth goal;
2. The urban aspects of climate change;
3. Re-inventing planning and modernising land management;
4. Inclusive metropolitan governance and management.